Article

A Comparative Study of the Mechanical Properties of Selected Dental Composites with a Dual-Curing System with Light-Curing Composites

by
Monika Domarecka
1,
Agata Szczesio-Wlodarczyk
2,*,
Michał Krasowski
2,
Magdalena Fronczek
3,4,
Tomasz Gozdek
5,
Jerzy Sokolowski
1 and
Kinga Bociong
1
1
Department of General Dentistry, Medical University of Lodz, 92-213 Lodz, Poland
2
University Laboratory of Materials Research, Medical University of Lodz, 92-213 Lodz, Poland
3
“DynamoLab” Academic Laboratory of Movement and Human Physical Performance, Medical University of Lodz, 92-213 Lodz, Poland
4
Department of Health Sciences, Medical University of Mazovia, 02-091 Warszawa, Poland
5
Institute of Polymer & Dye Technology, Lodz University of Technology, 90-537 Lodz, Poland
*
Author to whom correspondence should be addressed.
Coatings 2021, 11(10), 1255; https://doi.org/10.3390/coatings11101255
Submission received: 7 September 2021 / Revised: 12 October 2021 / Accepted: 13 October 2021 / Published: 15 October 2021
(This article belongs to the Special Issue Surface Properties of Dental Materials and Instruments)

Abstract

:
Dual-curing composites have a wide spectrum of use in practice (rebuilding, reconstruction, and luting). The characterization of this type of material and comparative study of selected mechanical properties with light-cured materials were carried out for this paper. In this study, we used six materials with a dual-cure system—Bulk EZ, Fill-Up!, StarFill 2B, Rebilda DC, MultiCore Flow, Activa Bioactive-Restorative—and three light-cured materials—Filtek Bulk Fill Posterior, Charisma Classic, and G-aenial Universal Flo. The materials were conditioned for 24 h in water at 37 °C before testing. Selected material properties were determined: three-point bending flexural strength, diametral tensile strength, hardness, microhardness, and shrinkage stress. The highest three-point bending flexural strength (TPB) was 137.0 MPa (G-aenial Universal Flo), while the lowest amounted to 86.5 MPa (Activa Bioactive). The diametral tensile strength (DTS) values were in a range from 39.2 MPa (Rebilda DC) to 54.1 MPa (Charisma Classic). The lowest hardness (HV) value of 26 was obtained by the Activa Bioactive material, while the highest values were recorded for Filtek Bulk Fill Posterior and Charisma Classic-53. The shrinkage stress of the tested materials ranged from 6.3 MPa (Charisma Classic) to 13.2 MPa (G-aenial Universal Flo). Dual-curing composites were found to have similar properties to light-cured composites.

1. Introduction

Dual-curing composites have different applications. They are used as core buildup materials, luting or cementation materials for crowns, bridges, inlays, onlays, and endodontic posts. Dual-curing composites are also used to fill deep restorations. Although the most important factor influencing the clinical success of indirect restoration is the amount of remaining tooth structure, the concept of core buildup materials should be emphasized. Core buildup materials stabilize weakened tooth structure and can be used to repair damaged tissue before performing an indirect restoration [1]. There are several dental materials used as the core buildup of broken-down teeth: filling resins (microhybrids, nano-hybrids, and ormocers), glass–ionomer cements, resin-modified glass–ionomer cements, and amalgam [2]. These materials have not been specifically developed for this purpose, but they provide adequate properties, such as sufficient compressive and flexural strength, to enable them to resist multidirectional masticatory forces [3]. It was reported that amalgam and resin composite cores have the lowest failure rate while glass–ionomer cements have the highest clinical failure rate [4]. Additionally, the development of dentin bonding systems and changes in clinical procedures have influenced the increasing use of resin-based materials for core buildup [5].
The attractive aesthetic features and good mechanical behavior of resin-based composites has influenced the growing popularity of these materials in dentistry, even in posterior restorations [6]. Constantly improving materials are no longer a direct reason for the clinical failure of restoration. One of the main reasons is cavity preparation. This process is very complex and must be carried out using an incremental technique. This technique is recommended because dental composites have a limited curing depth. Additionally, this method can reduce the shrinkage stress that occurs at the interface due to the polymerization of resin materials [7,8]. It is recommended to use dental composites layers of up to 2 mm thick [9]. In the case of extensive or deep restoration, several layers must be applied, so this procedure is complicated and time-consuming. It also may involve certain risks such as clinician mistakes, air bubbles, and contamination between layers. In response to these problems, a new generation of dental composites has been introduced—the Bulk Fill composite. This term is used by manufacturers to refer to dental materials that can be applied in 4 or 5 mm thick increments using the monoblock or single-layer technique [10,11]. Materials with a dual-curing system are widely used in such applications, and they exhibit lower shrinkage stresses than light-cured materials [12].
To withstand such a wide spectrum of applications, materials with dual-curing system should be characterized by excellent mechanical properties. Dental materials should resist the stress that may be produced during a lifetime by providing stress relaxation via distributions of force and reductions of failure probability.
Our null hypotheses were as follows: (1) There are no differences among the three-point bending flexural strength (TPB), diametral tensile strength (DTS), and Vickers hardness (HV) of the studied materials; (2) there are no differences among the shrinkage stress of the materials.

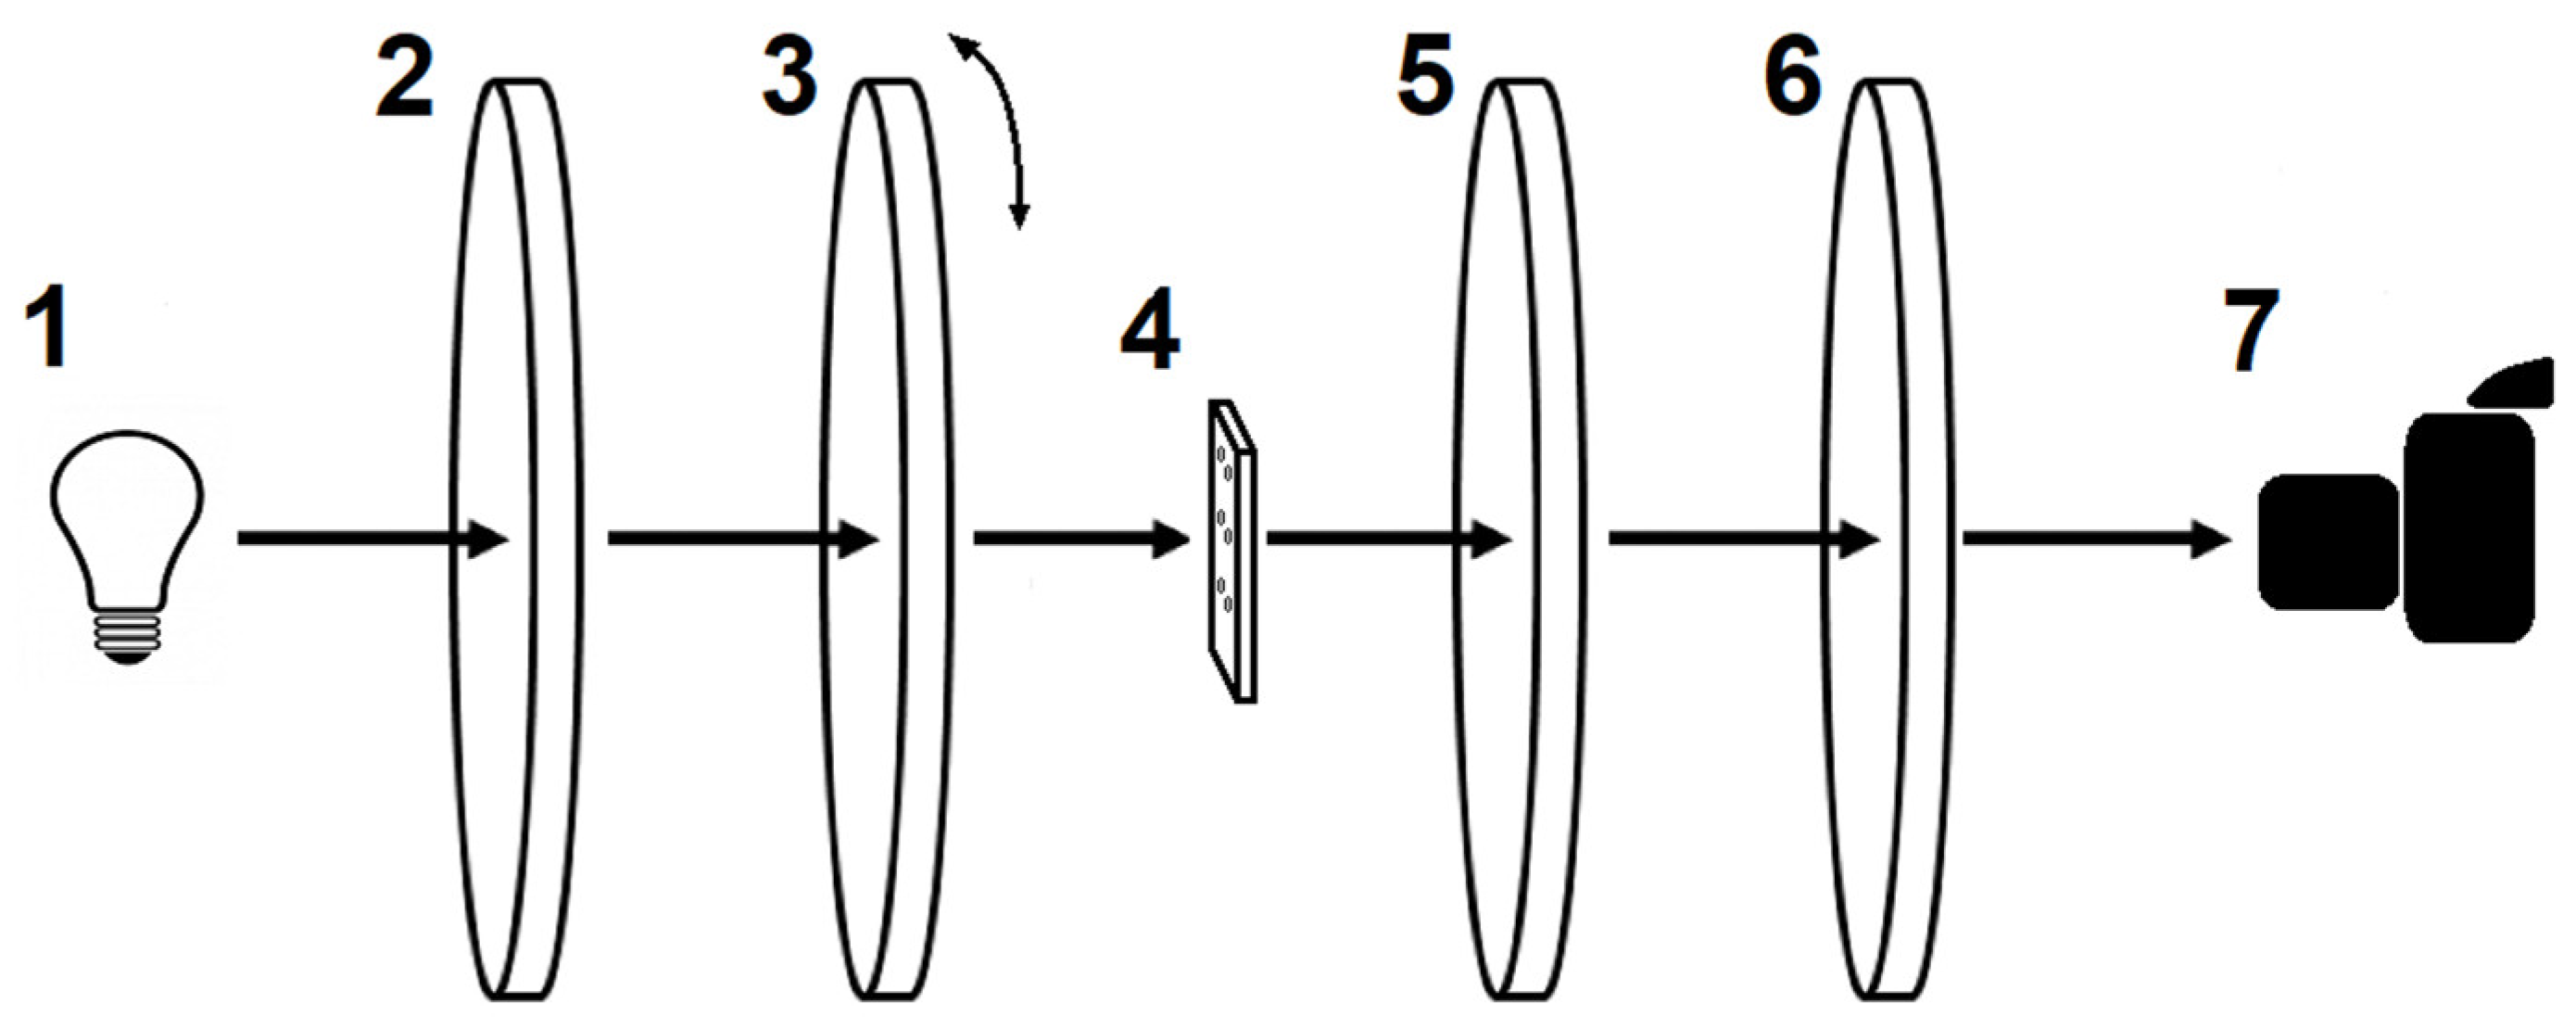
2. Materials and Methods

In this study, we used six materials with a dual-cure system—Bulk EZ, Fill-Up!, StarFill 2B, Rebilda DC, MultiCore Flow, Activa Bioactive-Restorative—and three light-cured materials—Filtek Bulk Fill Posterior, Charisma Classic, and G-aenial Universal Flo. Table 1 contains information of the tested materials.
The materials were cured according to manufacturers’ instructions (Table 1), and the samples were conditioned in distilled water for 24 h before testing. To ensure consistent irradiance values, the light-curing units (Mini L.E.D, Satelec, France) were calibrated with a radiometer system (Digital Light Meter 200, Rolence Enterprice Inc., Taoyuan, Taiwan). Increments of 2 mm in thickness were polymerized. For microhardness test samples (6 mm in diameter and 3 mm in depth) were only cured on one surface (top surface) to obtain a profile depending on cure depth.
To test the diametral tensile strength (DTS) and three-point bending flexural strength (TPB), a Zwick-Roell Z020 universal strength machine (Zwick-Roell, Ulm, Germany) was used. The traverse speeds were 2 and 1 mm/min. We measured the DTS of nine cylindrical samples (diameter of 6 mm and thickness of 3 mm) (Figure A1) from each material, and the TPB test was carried out for five rectangular samples (25 mm long, 2 mm wide, and 2 mm thick) (Figure A2). The TPB was based on the ISO 4049: 2019 standard [13].
The DTS values were calculated using Formula (1):
DTS = 2 F π dh   [ MPa ]
where:
  • F—force, which caused the destruction of the sample (N);
  • d—diameter of the sample (mm);
  • h—height of the sample (mm).
The three-point bending flexural strength was calculated using Formula (2):
TPB = 3 Fl 2 bh 2 [ MPa ]
  • F—force, which caused the destruction of the sample (N);
  • l—distance between supports, 20 mm;
  • b—sample width (mm);
  • h—sample height (mm).
The hardness of tested materials was measured using the Vickers method with the Zwick ZHV2-m hardness tester (Zwick-Roell, Ulm, Germany). The applied load was 1000 g, and the penetration time was 10 s. Nine measurements were performed on three out of nine DTS samples for each material.
Additionally, the microhardness of the composites was tested with the NanoTest 600 (Micromaterials Ltd., Wrexham, UK) using a Berkovich indenter. The maximum force was 10 mN, and the loading and unloading speed was dP/dt = 0.5 mN/s. The measurements were carried out in controlled conditions of temperature (T = 20 °C) and relative humidity (60 ± 5%). The composite microhardness and reduced modulus were calculated on the basis of the unloading curve using the procedure proposed by Olivier and Pharr. We tested the microhardness and reduced modulus of the external surfaces (0 µm—top sample’s surface; 3000 µm—bottom sample’s surface) and cross-section (675, 1250, and 1925 µm) of the sample, as displayed in Figure 1. Thus, microhardness profiles depending on the cure depth of were obtained.
The photoelastic analysis method enables researchers to analyze the shrinkage stress generated by different composite resins during polymerization. This test was extensively described in our earlier works [14,15,16]. The scheme of the photoelastic method is shown in Figure 2. Photoelastically sensitive plates of epoxy resin (Epidian 53, Organika-Sarzyna SA, Nowa Sarzyna, Poland) with characteristics similar to dentin were used in this study. Calibrated orifices of 3 mm in diameter and of 4 mm in depth were prepared in resin plates in order to mimic average tooth cavities. The generated strains in the plates were visualized in the circular transmission polariscope FL200 (Gunt, Gerätebau, Germany). Next, we conducted photoelastic strain calculations based on the Timoshenko equation [17]. Three samples were prepared for each material. Curing time was consistent with the manufacturers’ instructions (Table 1).
Data processing was performed with the use of Statistica 12 (Statsoft, Krakow, Poland). For statistical analysis, elements of summary statistics were used. The Shapiro–Wilk Test of normality was applied. After confirming that the distribution was non-consistent with normal distribution, the Kruskal–Wallis test was applied with multiple comparisons of mean ranks. The accepted level of significance was α = 0.05.

3. Results

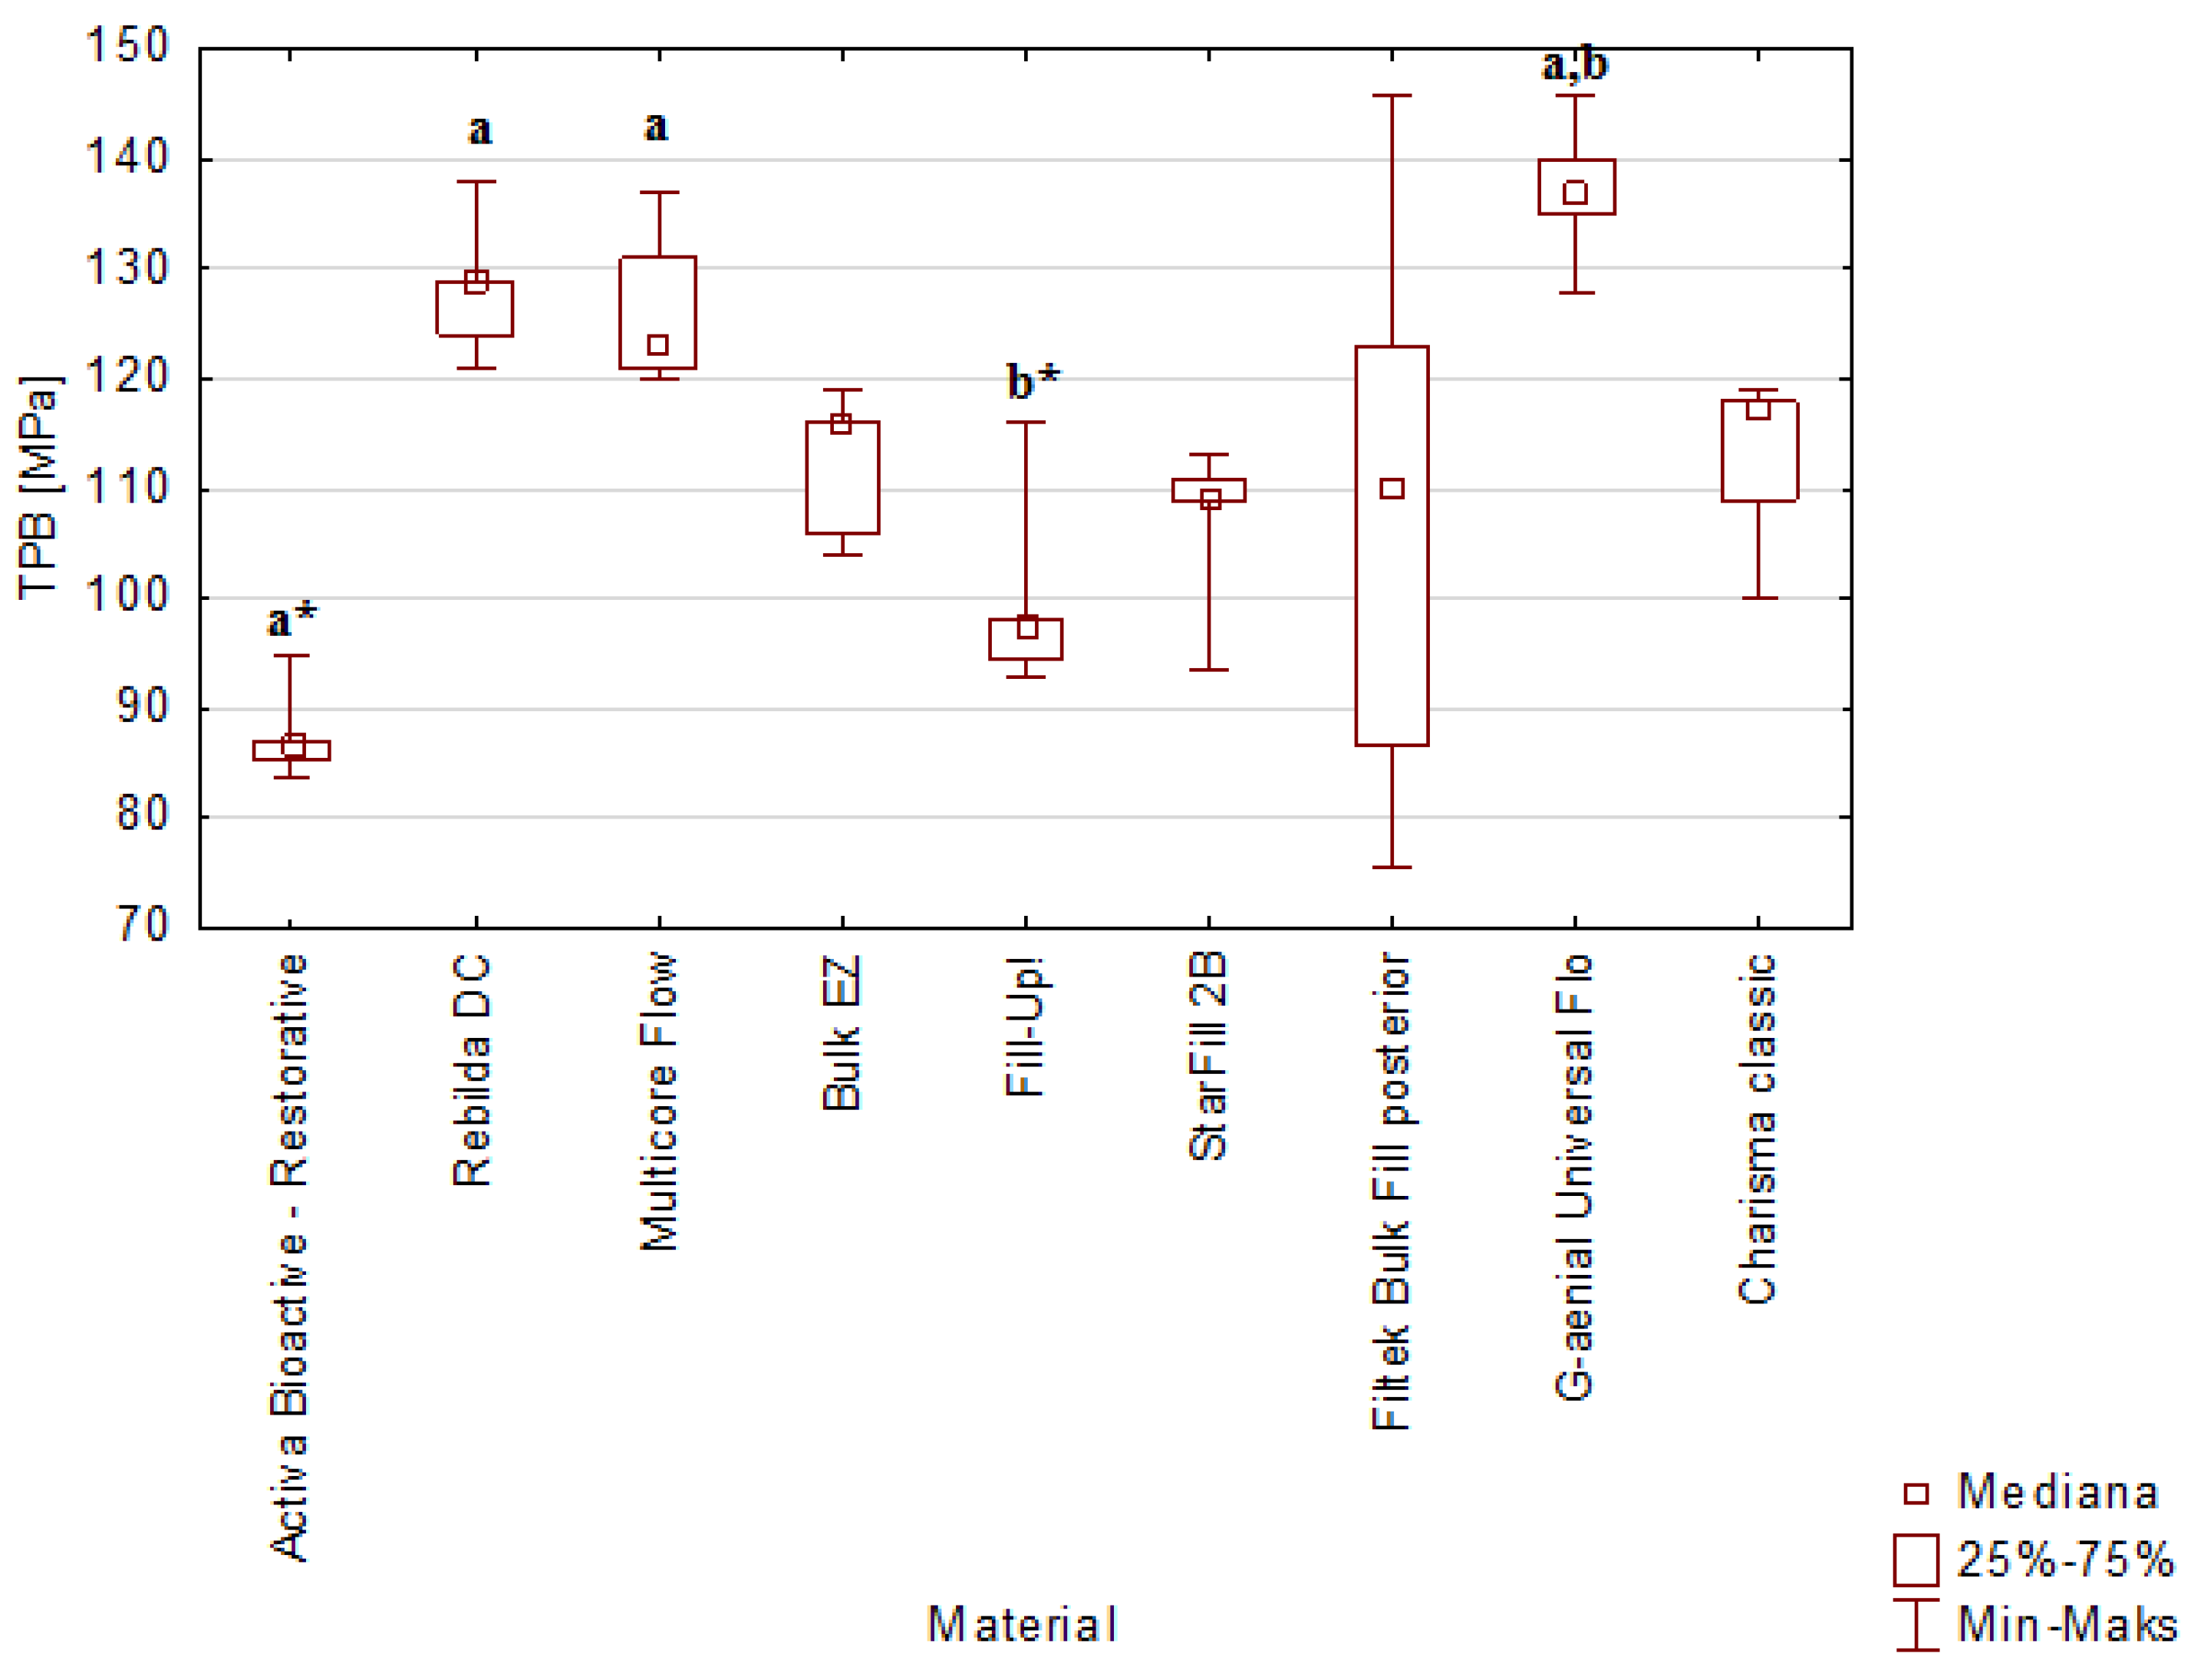
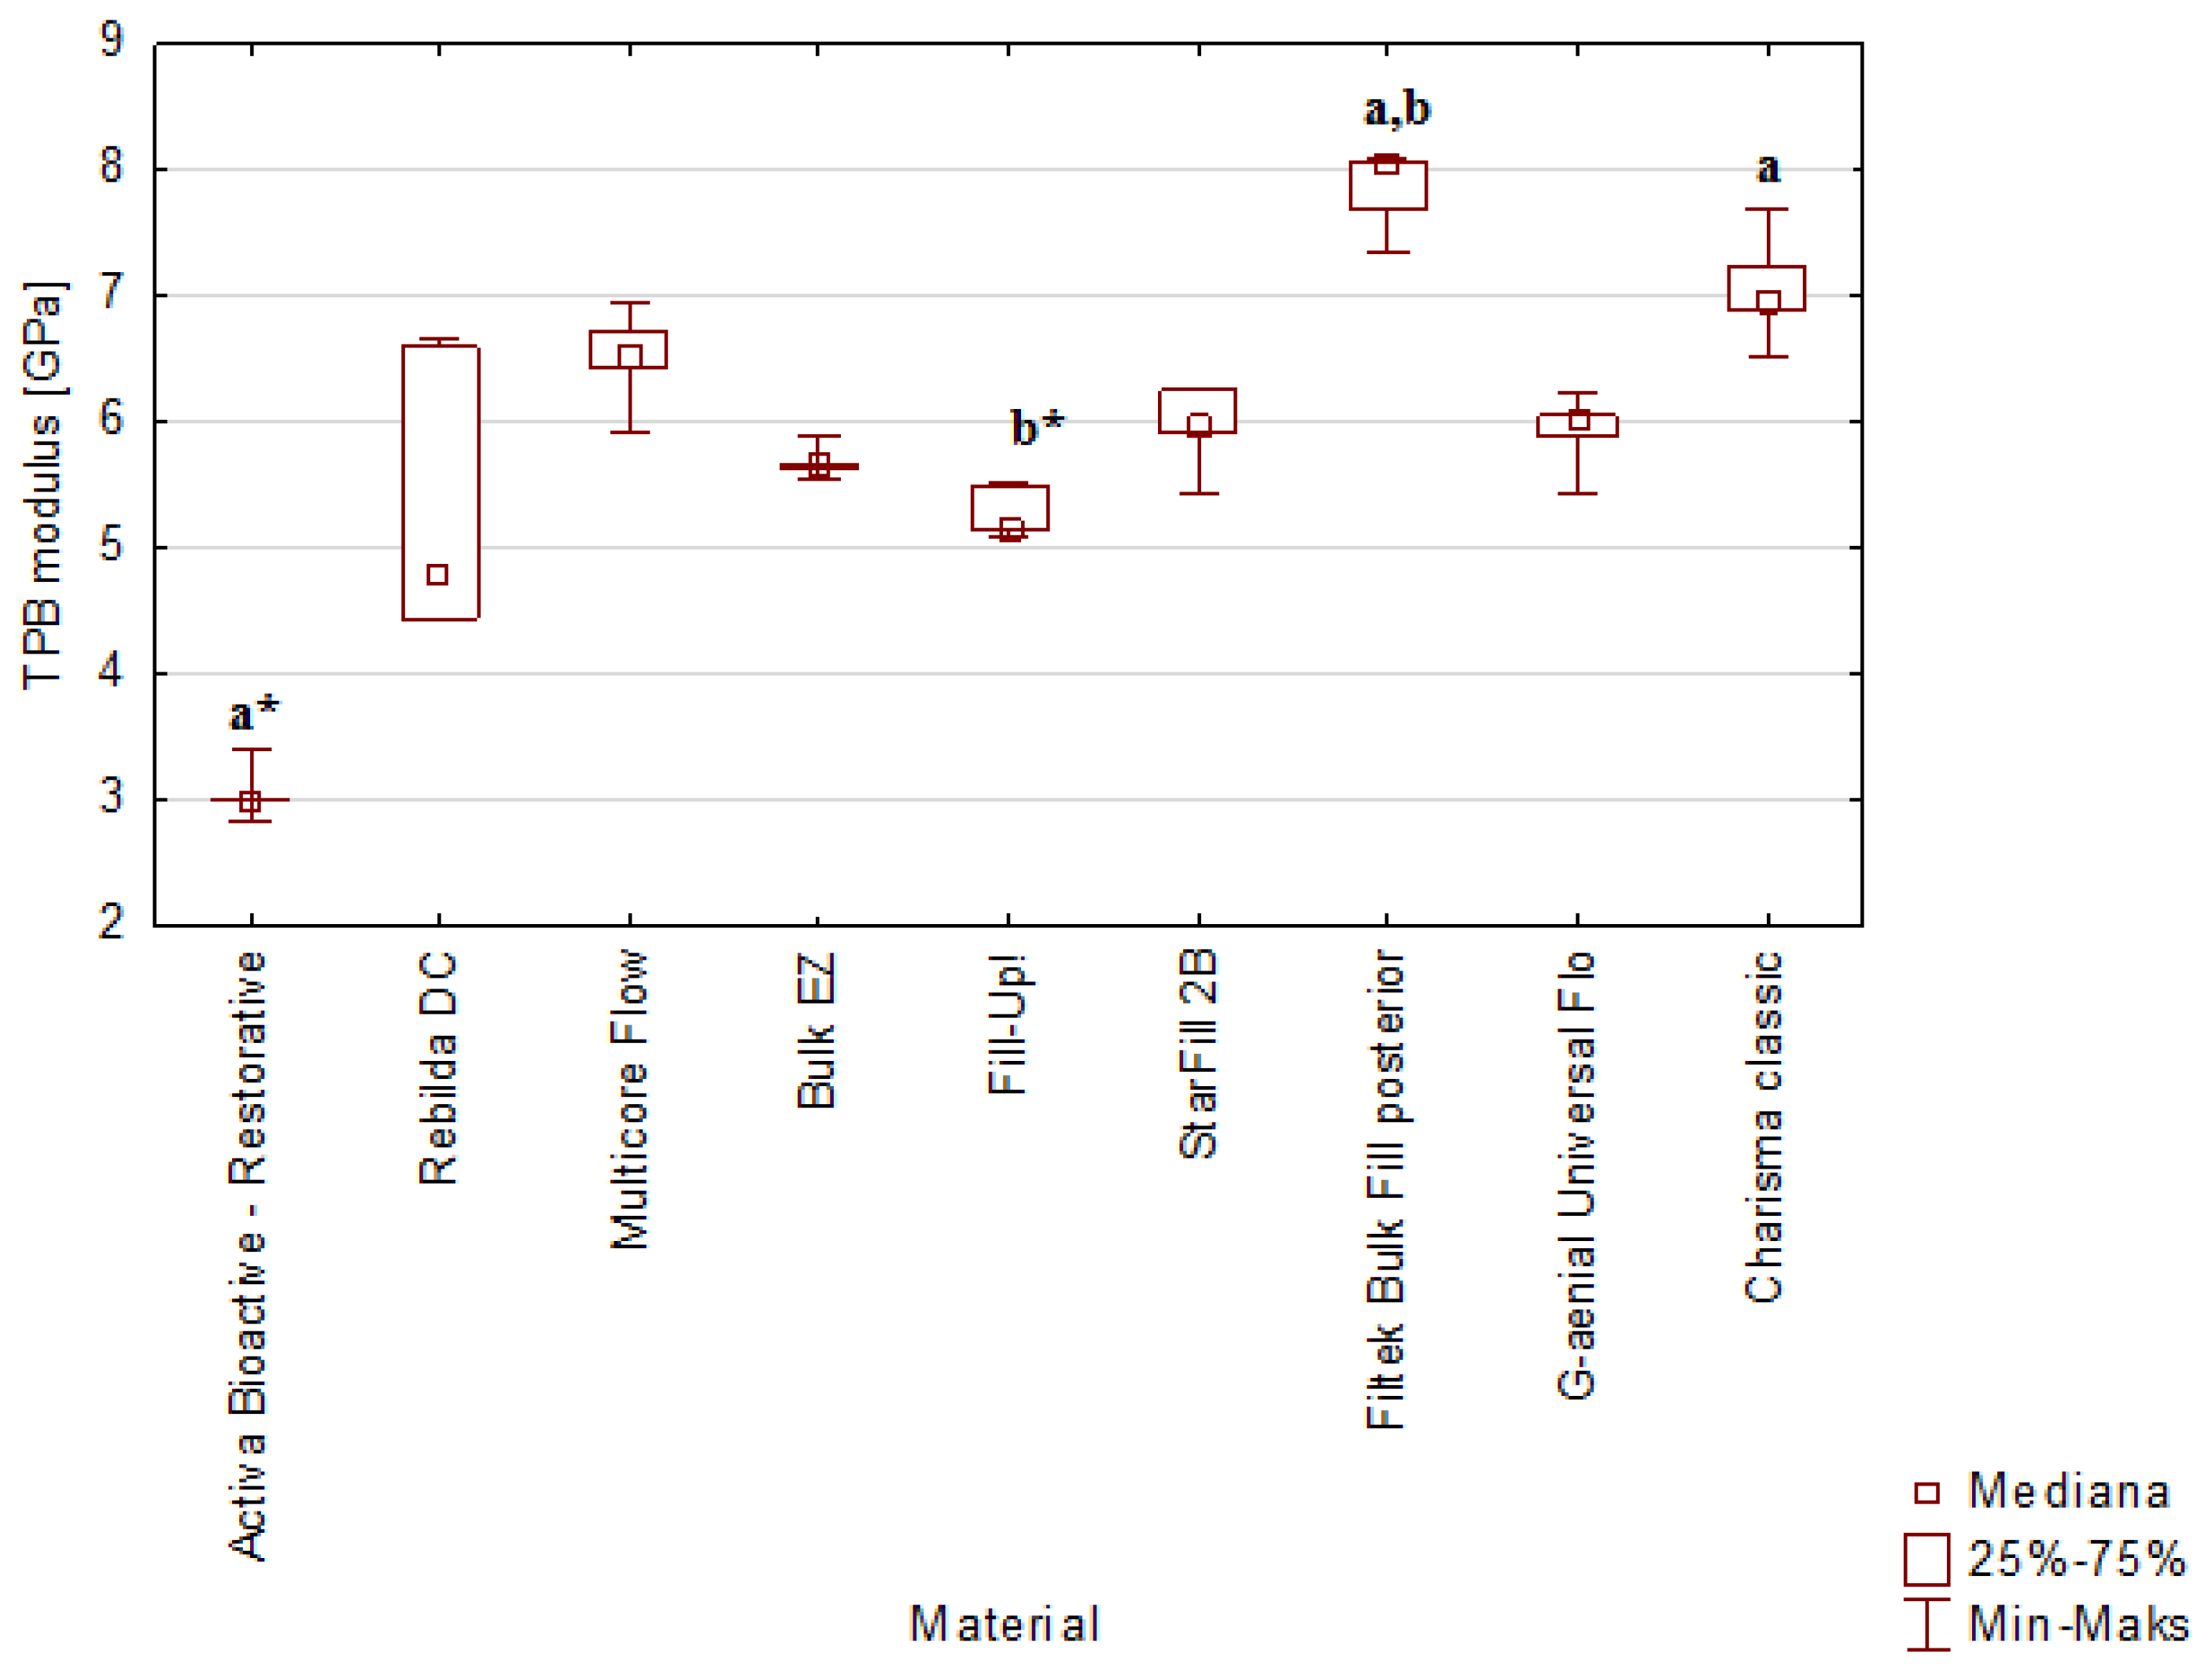
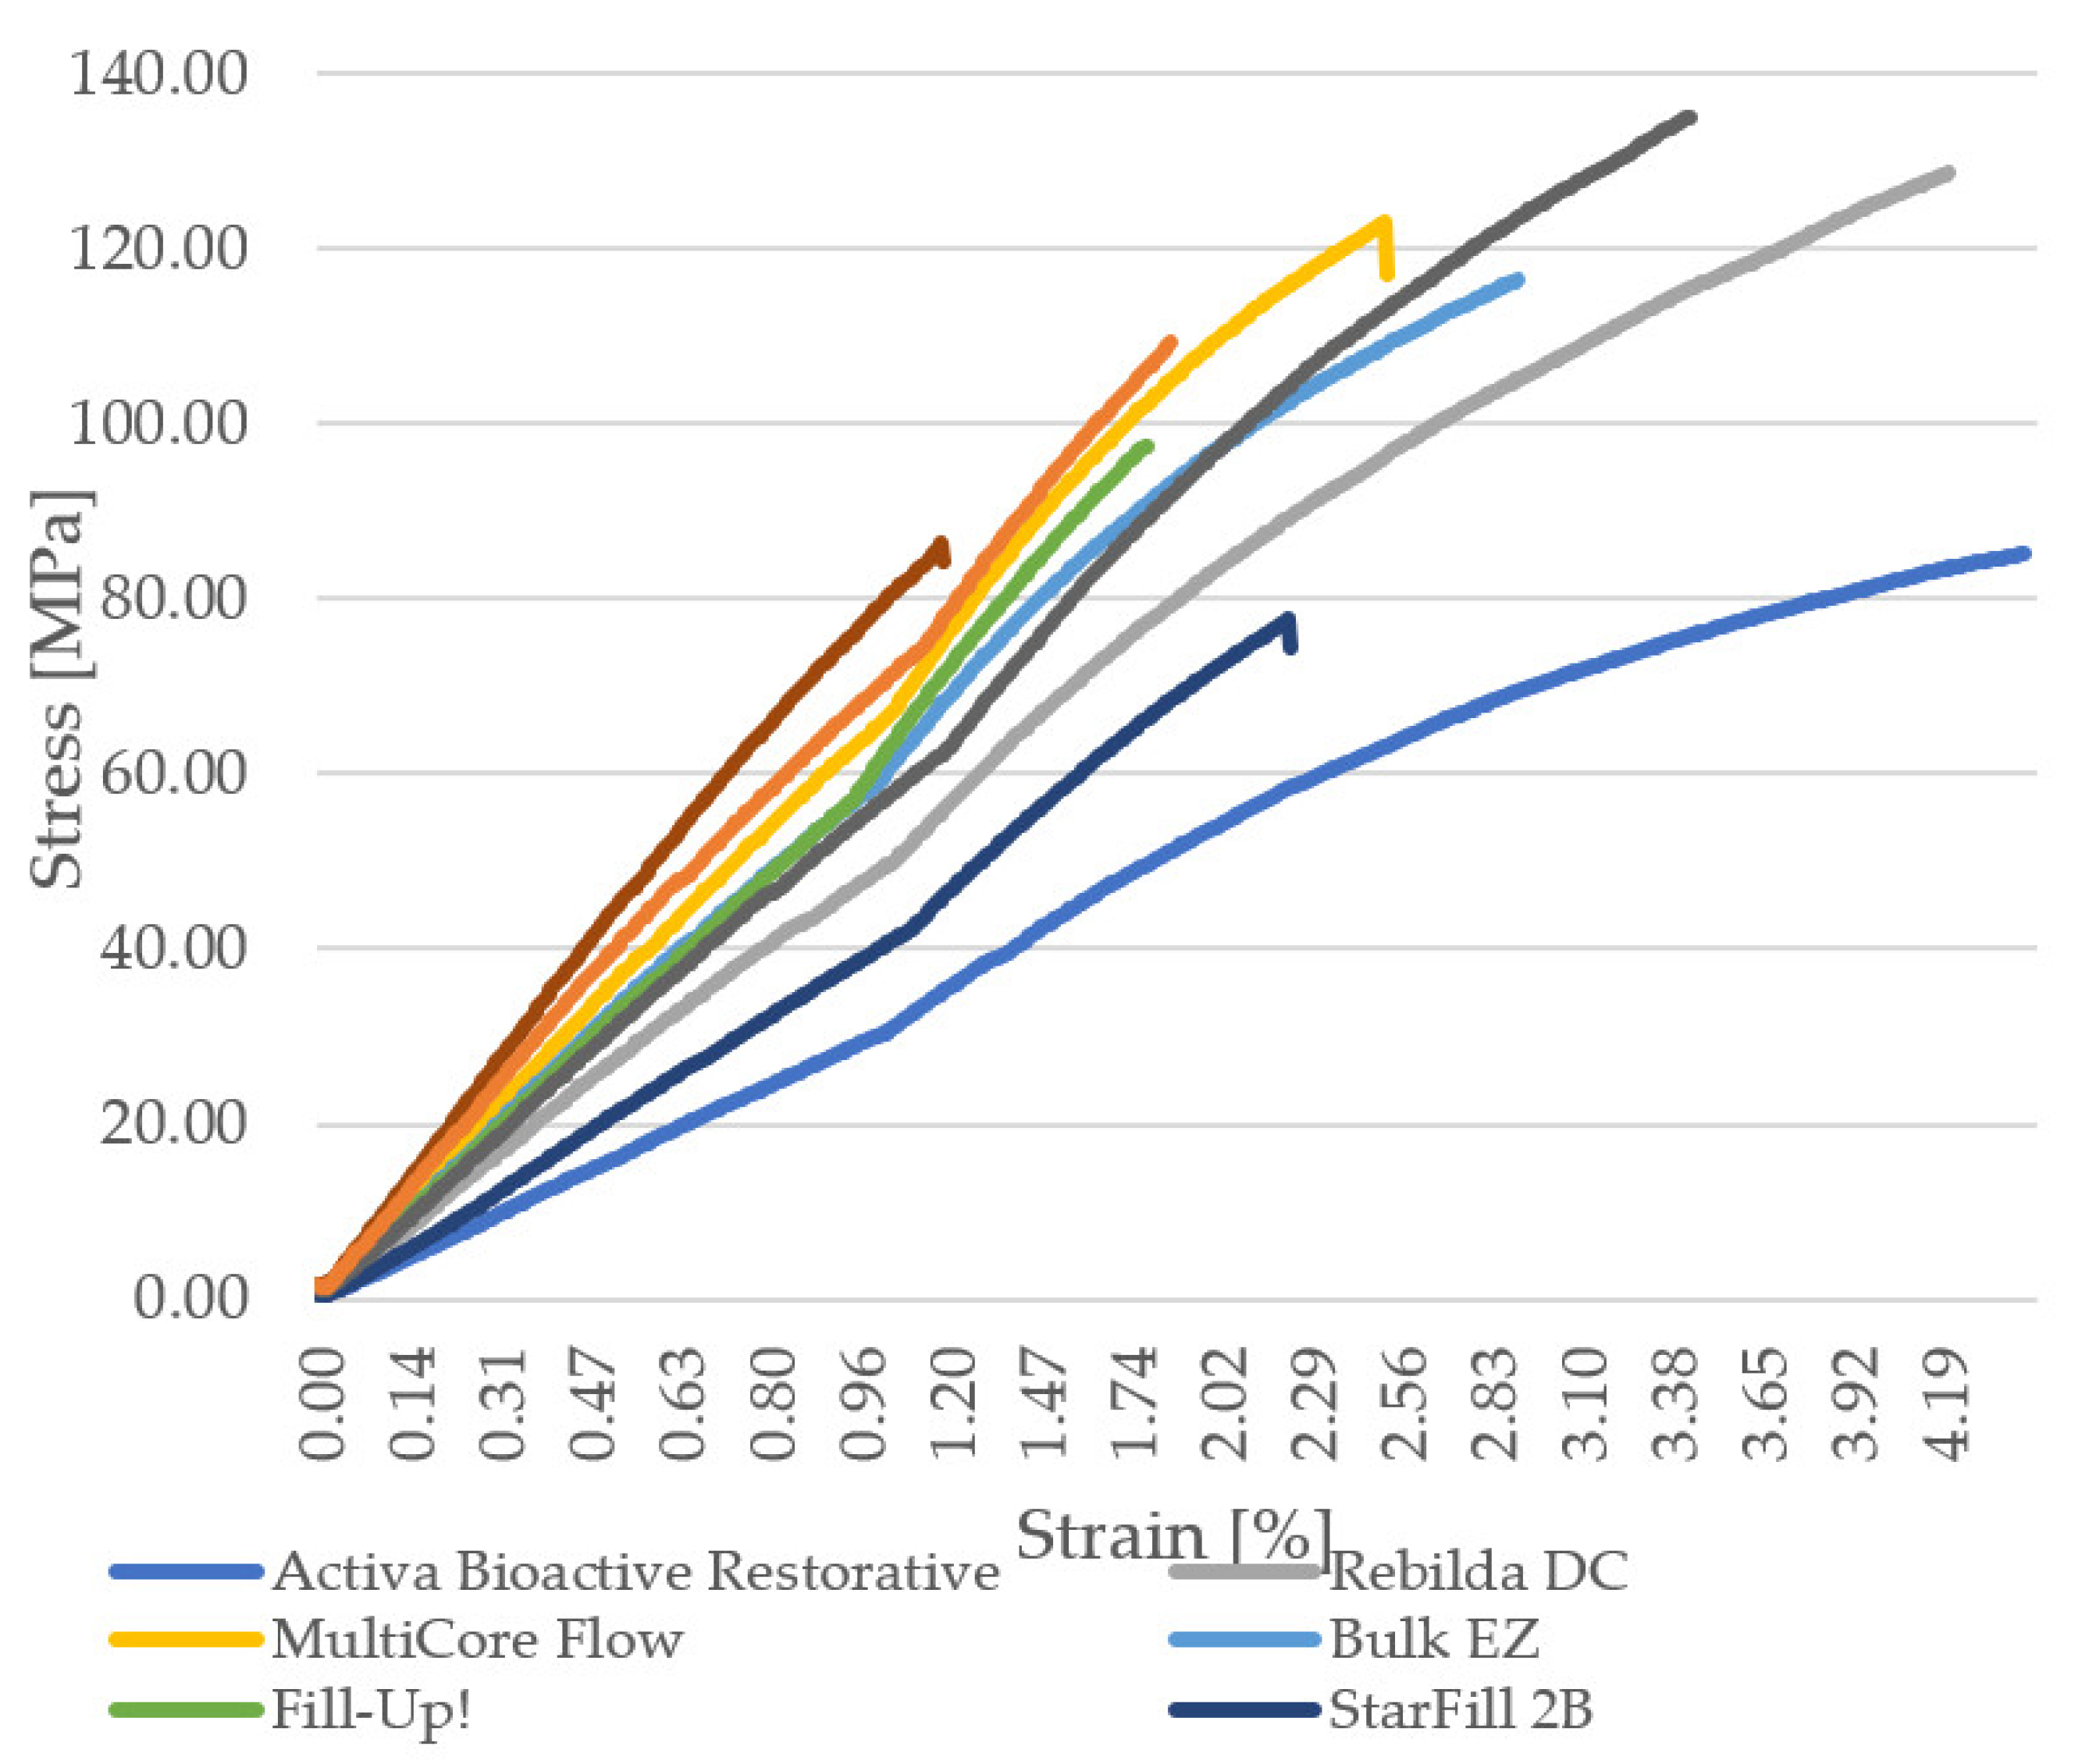
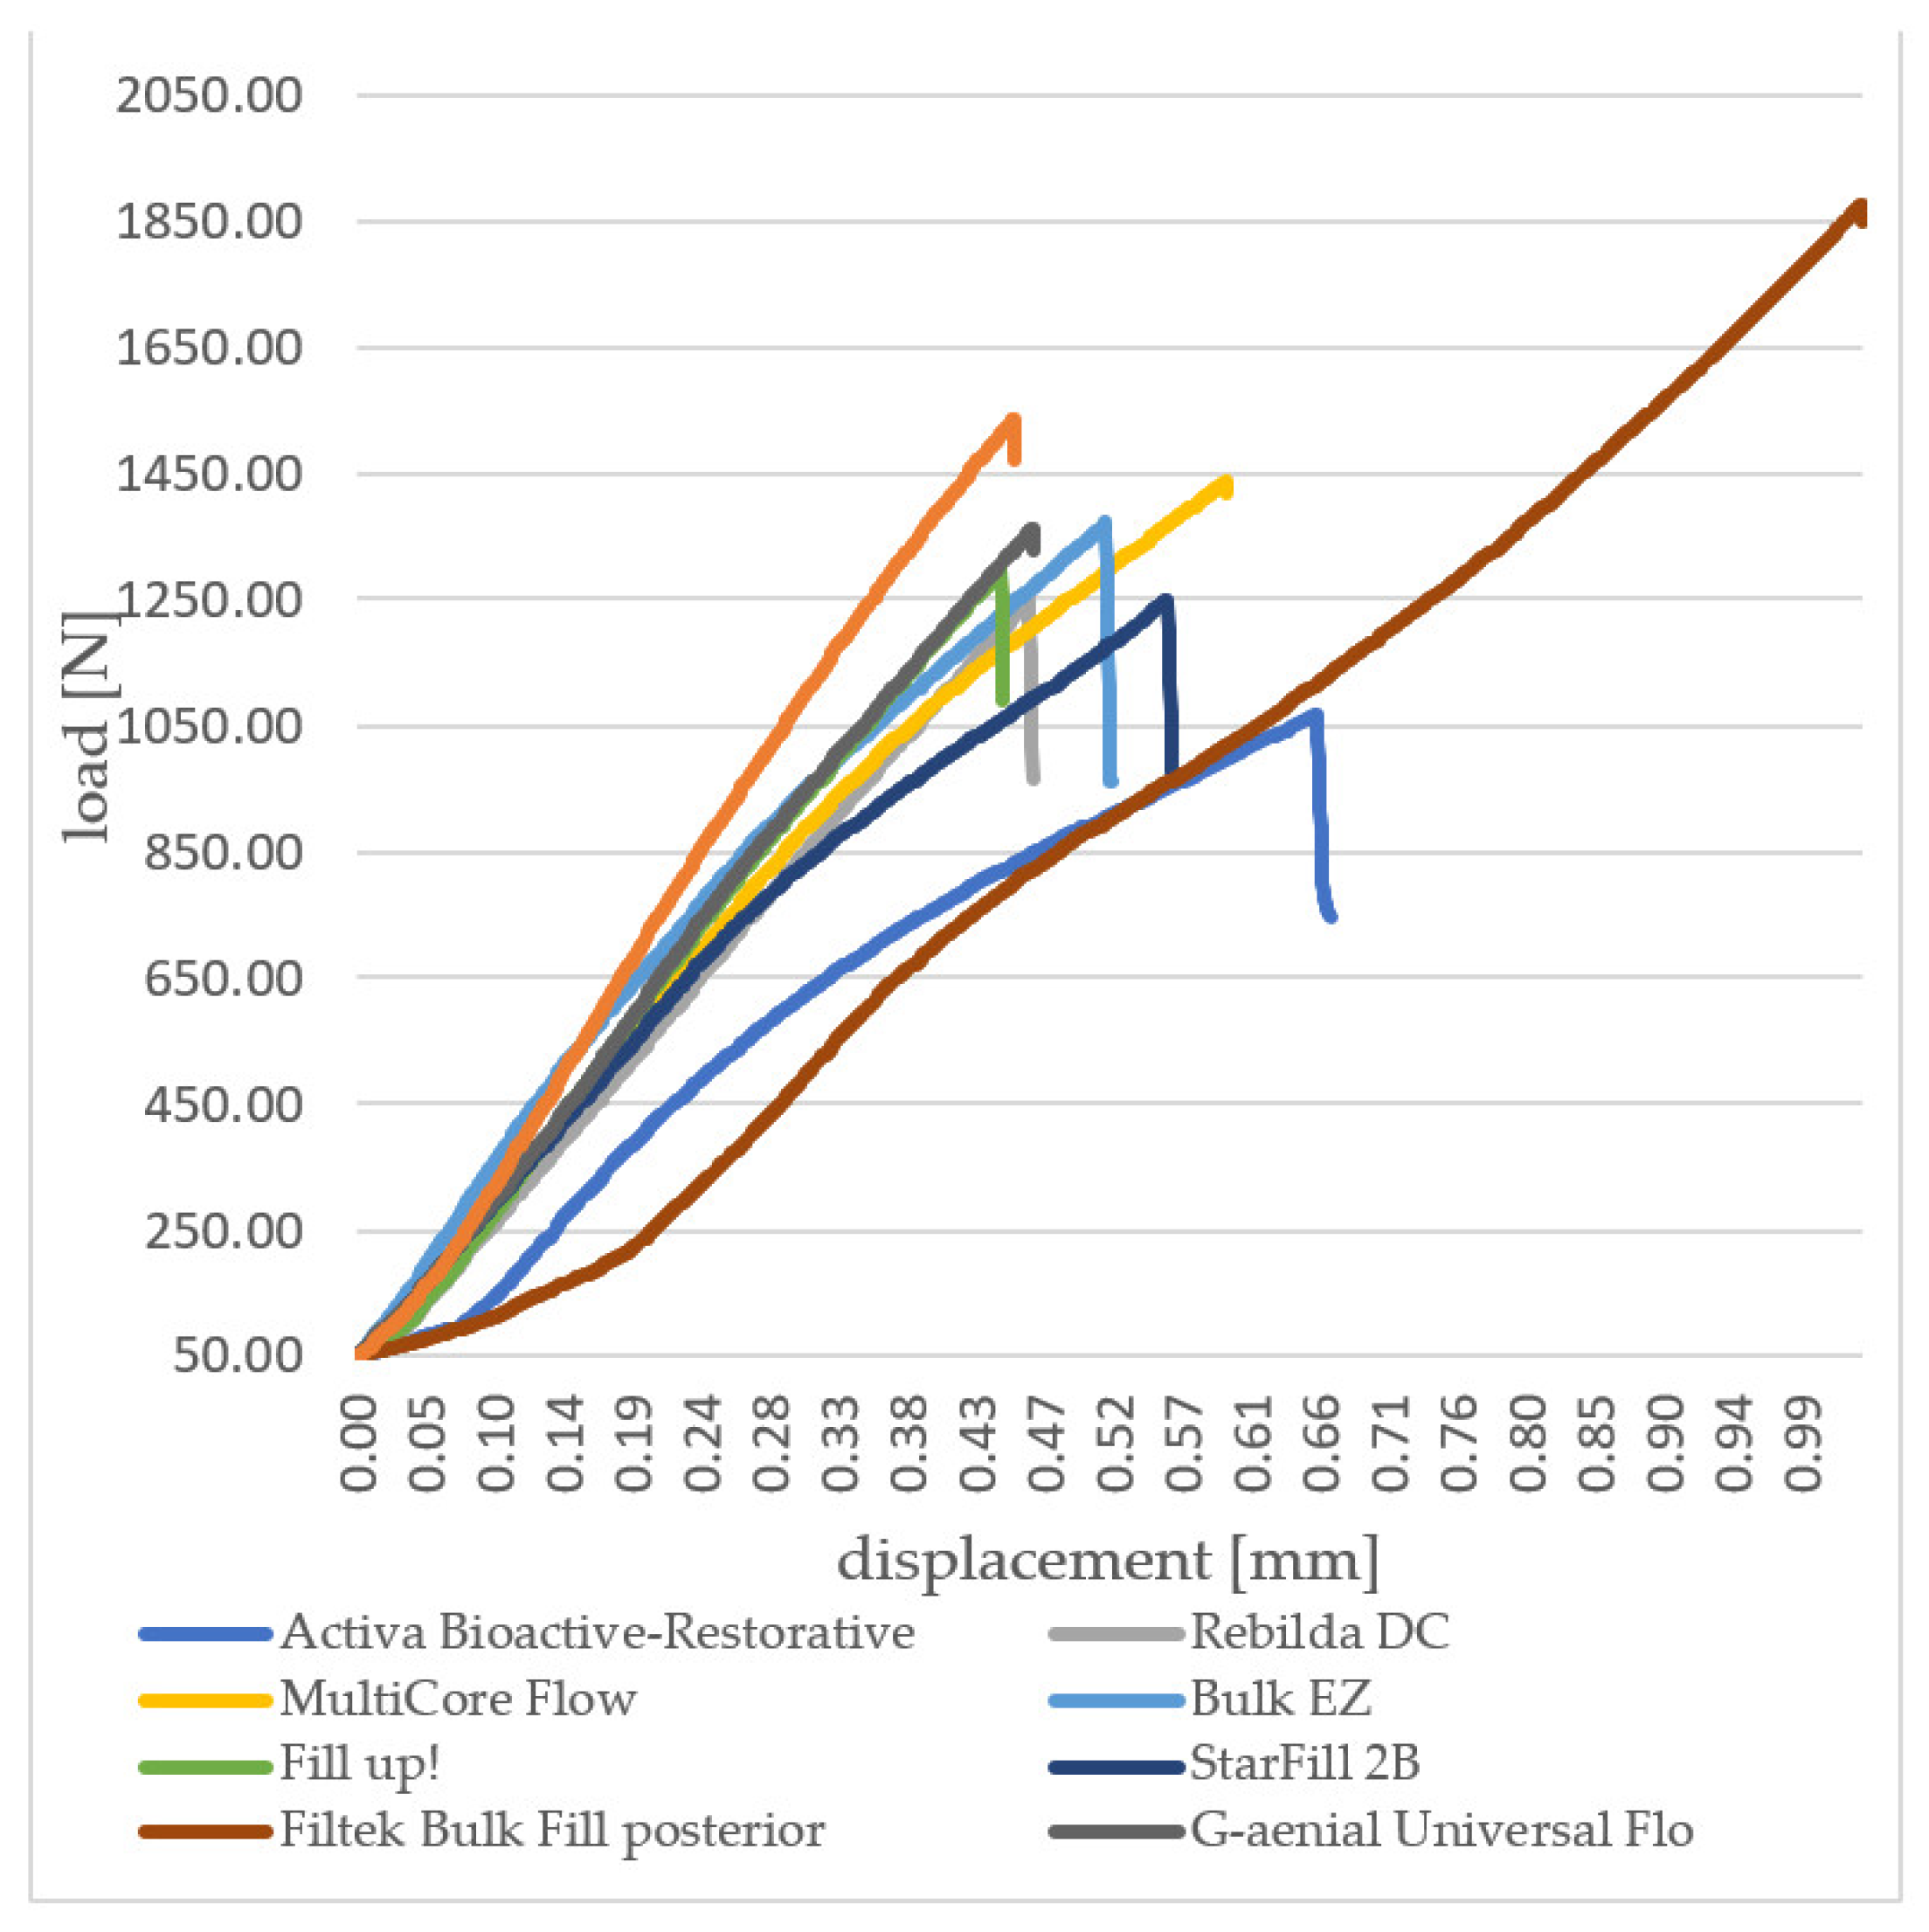
3.1. Three-Point Bending Flexural Strength (TPB)

The highest median value of three-point flexural strength was 137 MPa (G-aenial Universal Flo), and the lowest was 87 MPa (Activa Bioactive-Restorative) (Table A1). On the basis of the Kruskal–Wallis test, a statistically significant difference was found with a p-value = 0.0001. According to multiple comparisons of mean ranks for all groups, statistically significant differences were found between:
  • Activa Bioactive-Restorative and Rebilda DC (p-value = 0.0075);
  • Activa Bioactive-Restorative and Multicore Flow (p-value = 0.0173);
  • Activa Bioactive-Restorative and G-aenial Universal Flo (p-value = 0.0008);
  • Fill-Up! and G-aenial Universal Flo (p-value = 0.0270).
The TPB value of Activa Bioactive-Restorative was lower than that of Rebilda DC, Multicore Flow, and G-aenial Universal Flo. In Fill-Up!, the TPB was smaller than in G-aenial Universal Flo. The TPB test results of each material are presented in Figure 3.
The modulus of elasticity in bending (TPB modulus) was also determined for the tested materials. The median values of the TPB modulus were in the range from 2.99 GPa (Activa Bioactive-Restorative) to 8.06 GPa (Filtek Bulk Fill Posterior) (Table A1). On the basis of the Kruskal–Wallis test, a statistically significant difference was found with p-value < 0.00005. According to multiple comparisons of mean ranks for all groups, statistically significant differences were found between:
  • Activa Bioactive-Restorative and Multicore Flow (p-value = 0.0216);
  • Activa Bioactive-Restorative and Filtek Bulk Fill Posterior (p-value = 0.0001);
  • Activa Bioactive-Restorative and Charisma Classic (p-value = 0.0017);
  • Fill-Up! and Filtek Bulk Fill Posterior (p-value = 0.0068).
The TPB modulus value of Activa Bioactive-Restorative was lower than that of Multicore Flow, Filtek Bulk Fill Posterior, and Charisma Classic. In Fill-Up!, the TPB modulus value was lower than that in Filtek Bulk Fill Posterior. The TPB modulus analysis results of each material are presented in Figure 4.
All measurement curves (Figure 5) show an almost linear stress–stain dependence; there are some inflections that, with a well-chosen scale of values (x, y axis), are not that significant. The aforementioned inflexion may have resulted from the formation of plastic deformations and the occurrence of friction in the tested materials. Major differences in the stress–strain curves can be observed regarding stiffness (as can be seen in the slope curves of the modulus of elasticity in bending), stress, and strain at failure. From the obtained diagrams, it can be concluded that tested composites are brittle materials that can only undergo plastic deformation to a certain extent.

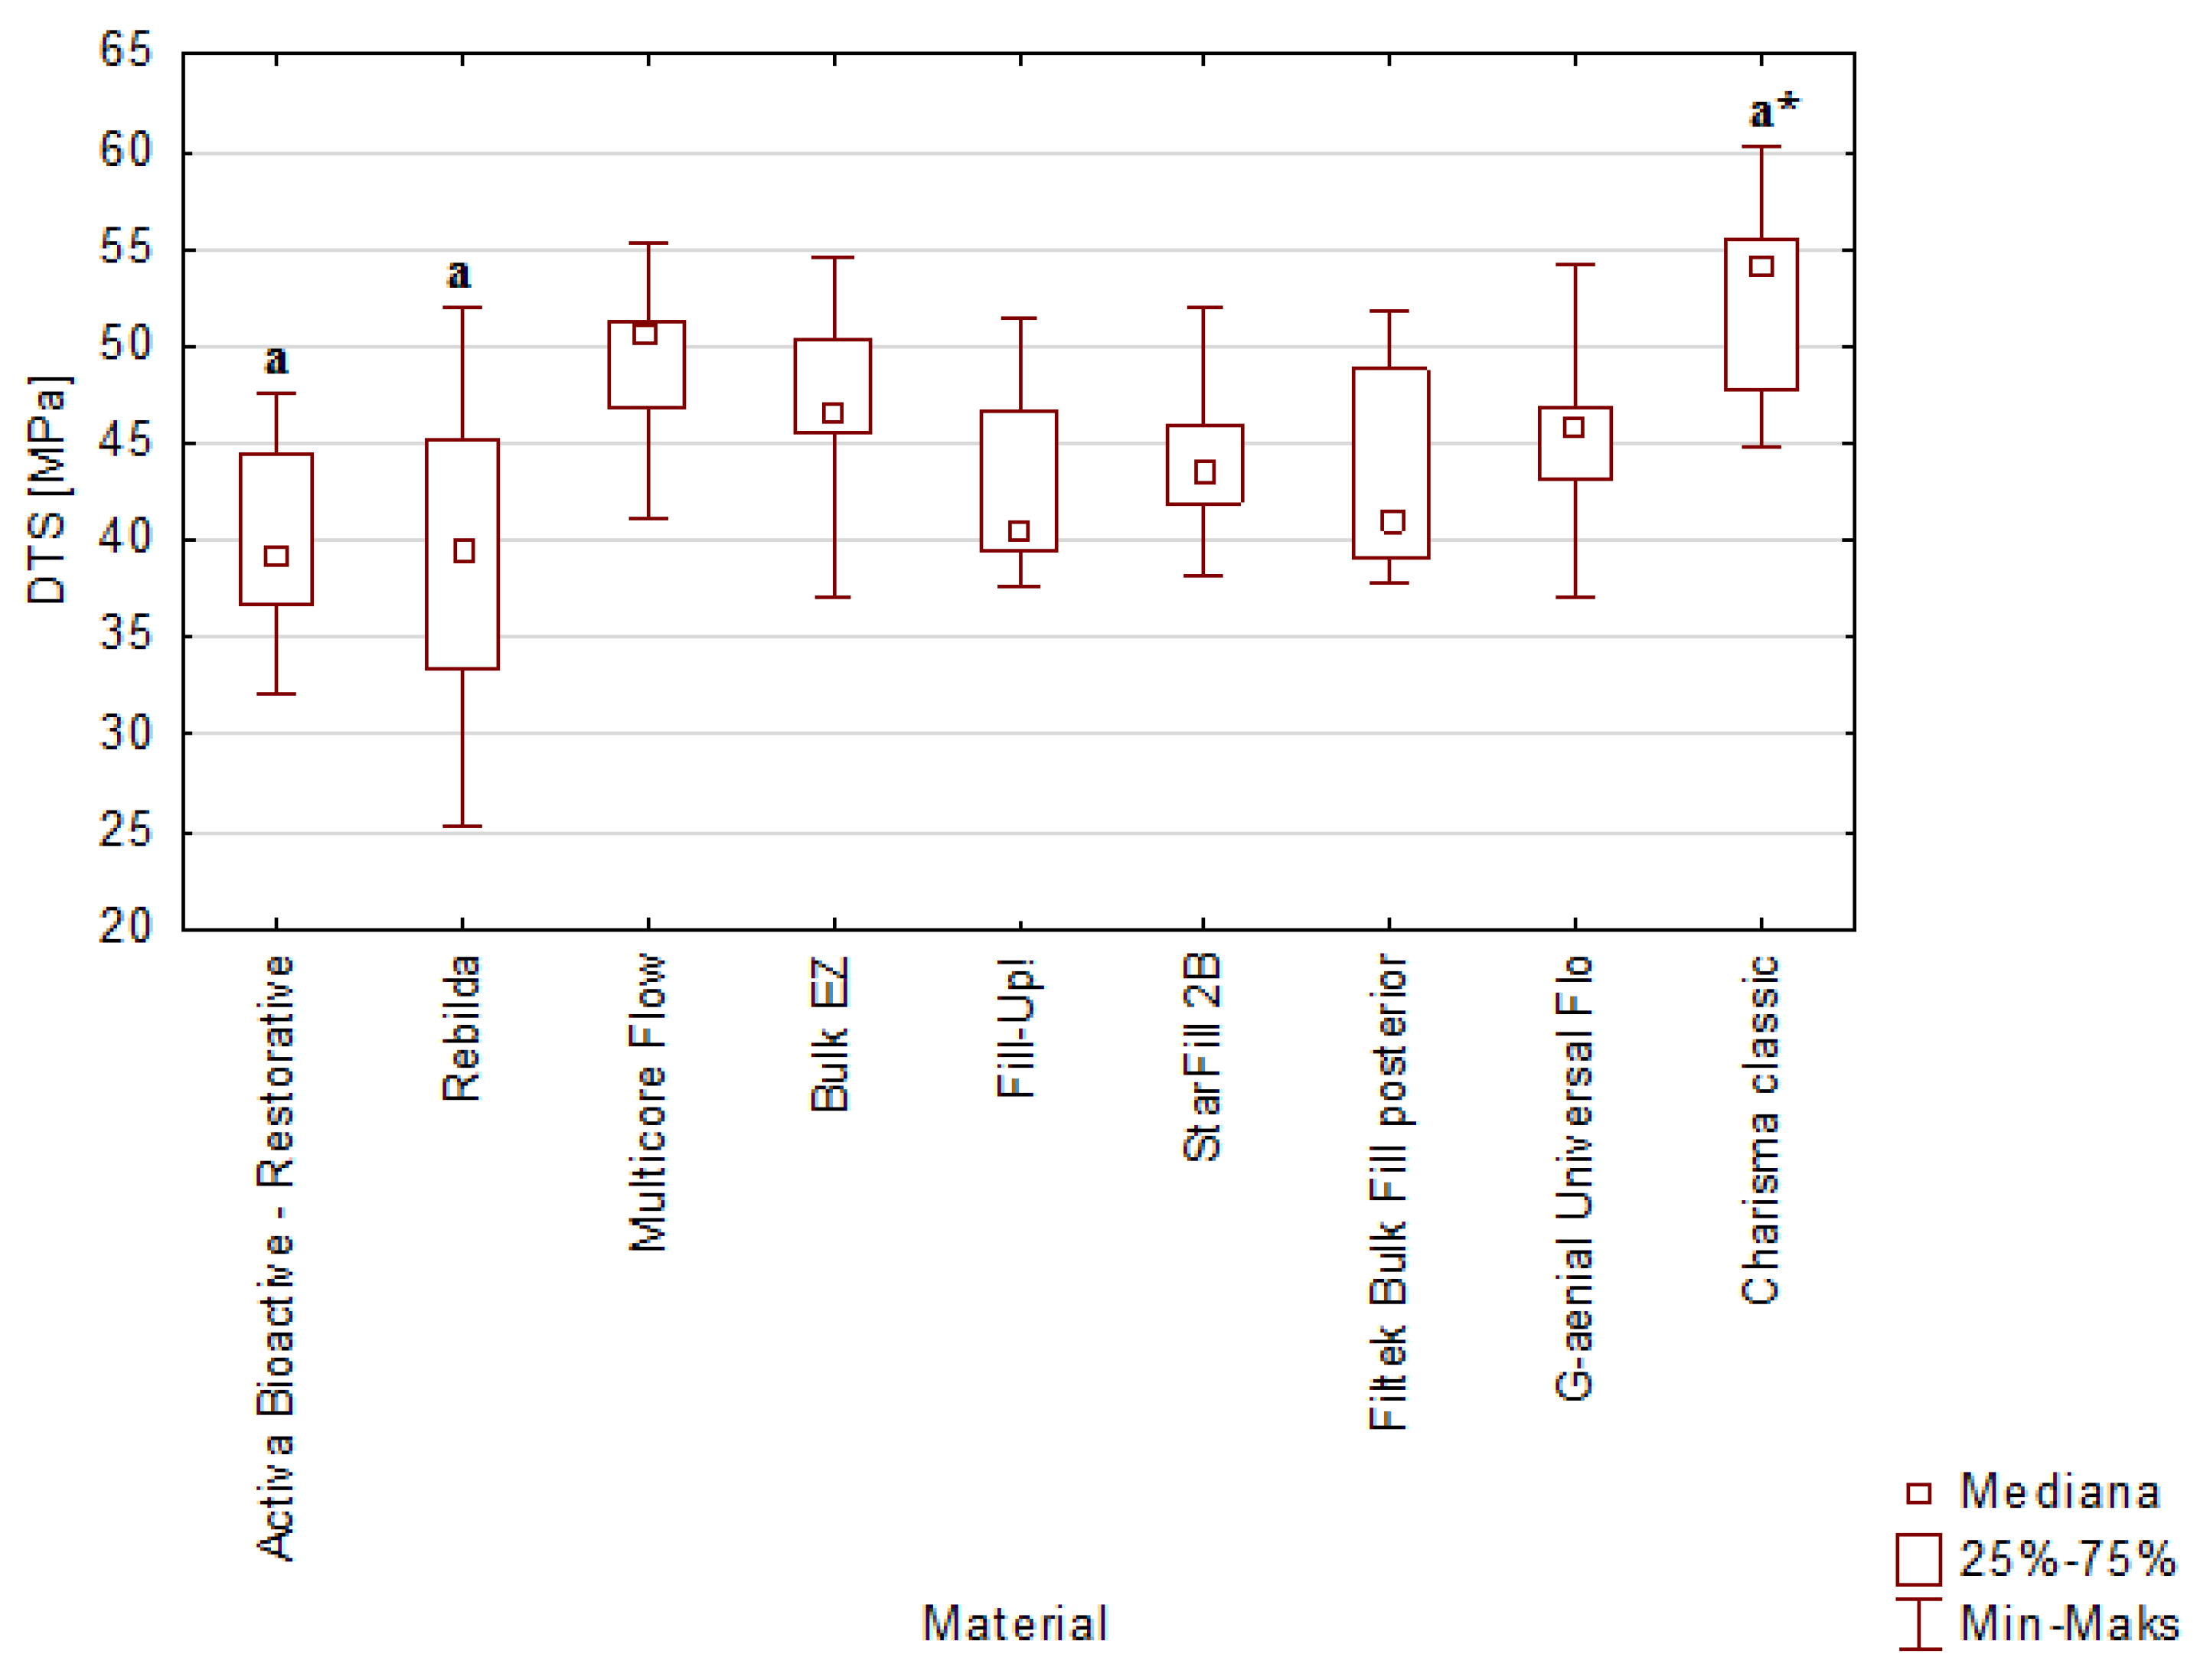
3.2. Diametral Tensile Strength (DTS)

The median DTS values were in the range from 39.2 MPa (Activa Bioactive-Restorative) to 54.1 MPa (Charisma Classic) (Table A1). On the basis of the Kruskal–Wallis test, a statistically significant difference was found with p-value = 0.0012. According to multiple comparisons of mean ranks for all groups, statistically significant differences were found between:
  • Activa Bioactive-Restorative and Charisma Classic (p-value = 0.0025);
  • Rebilda DC and Charisma Classic (p-value = 0.0274).
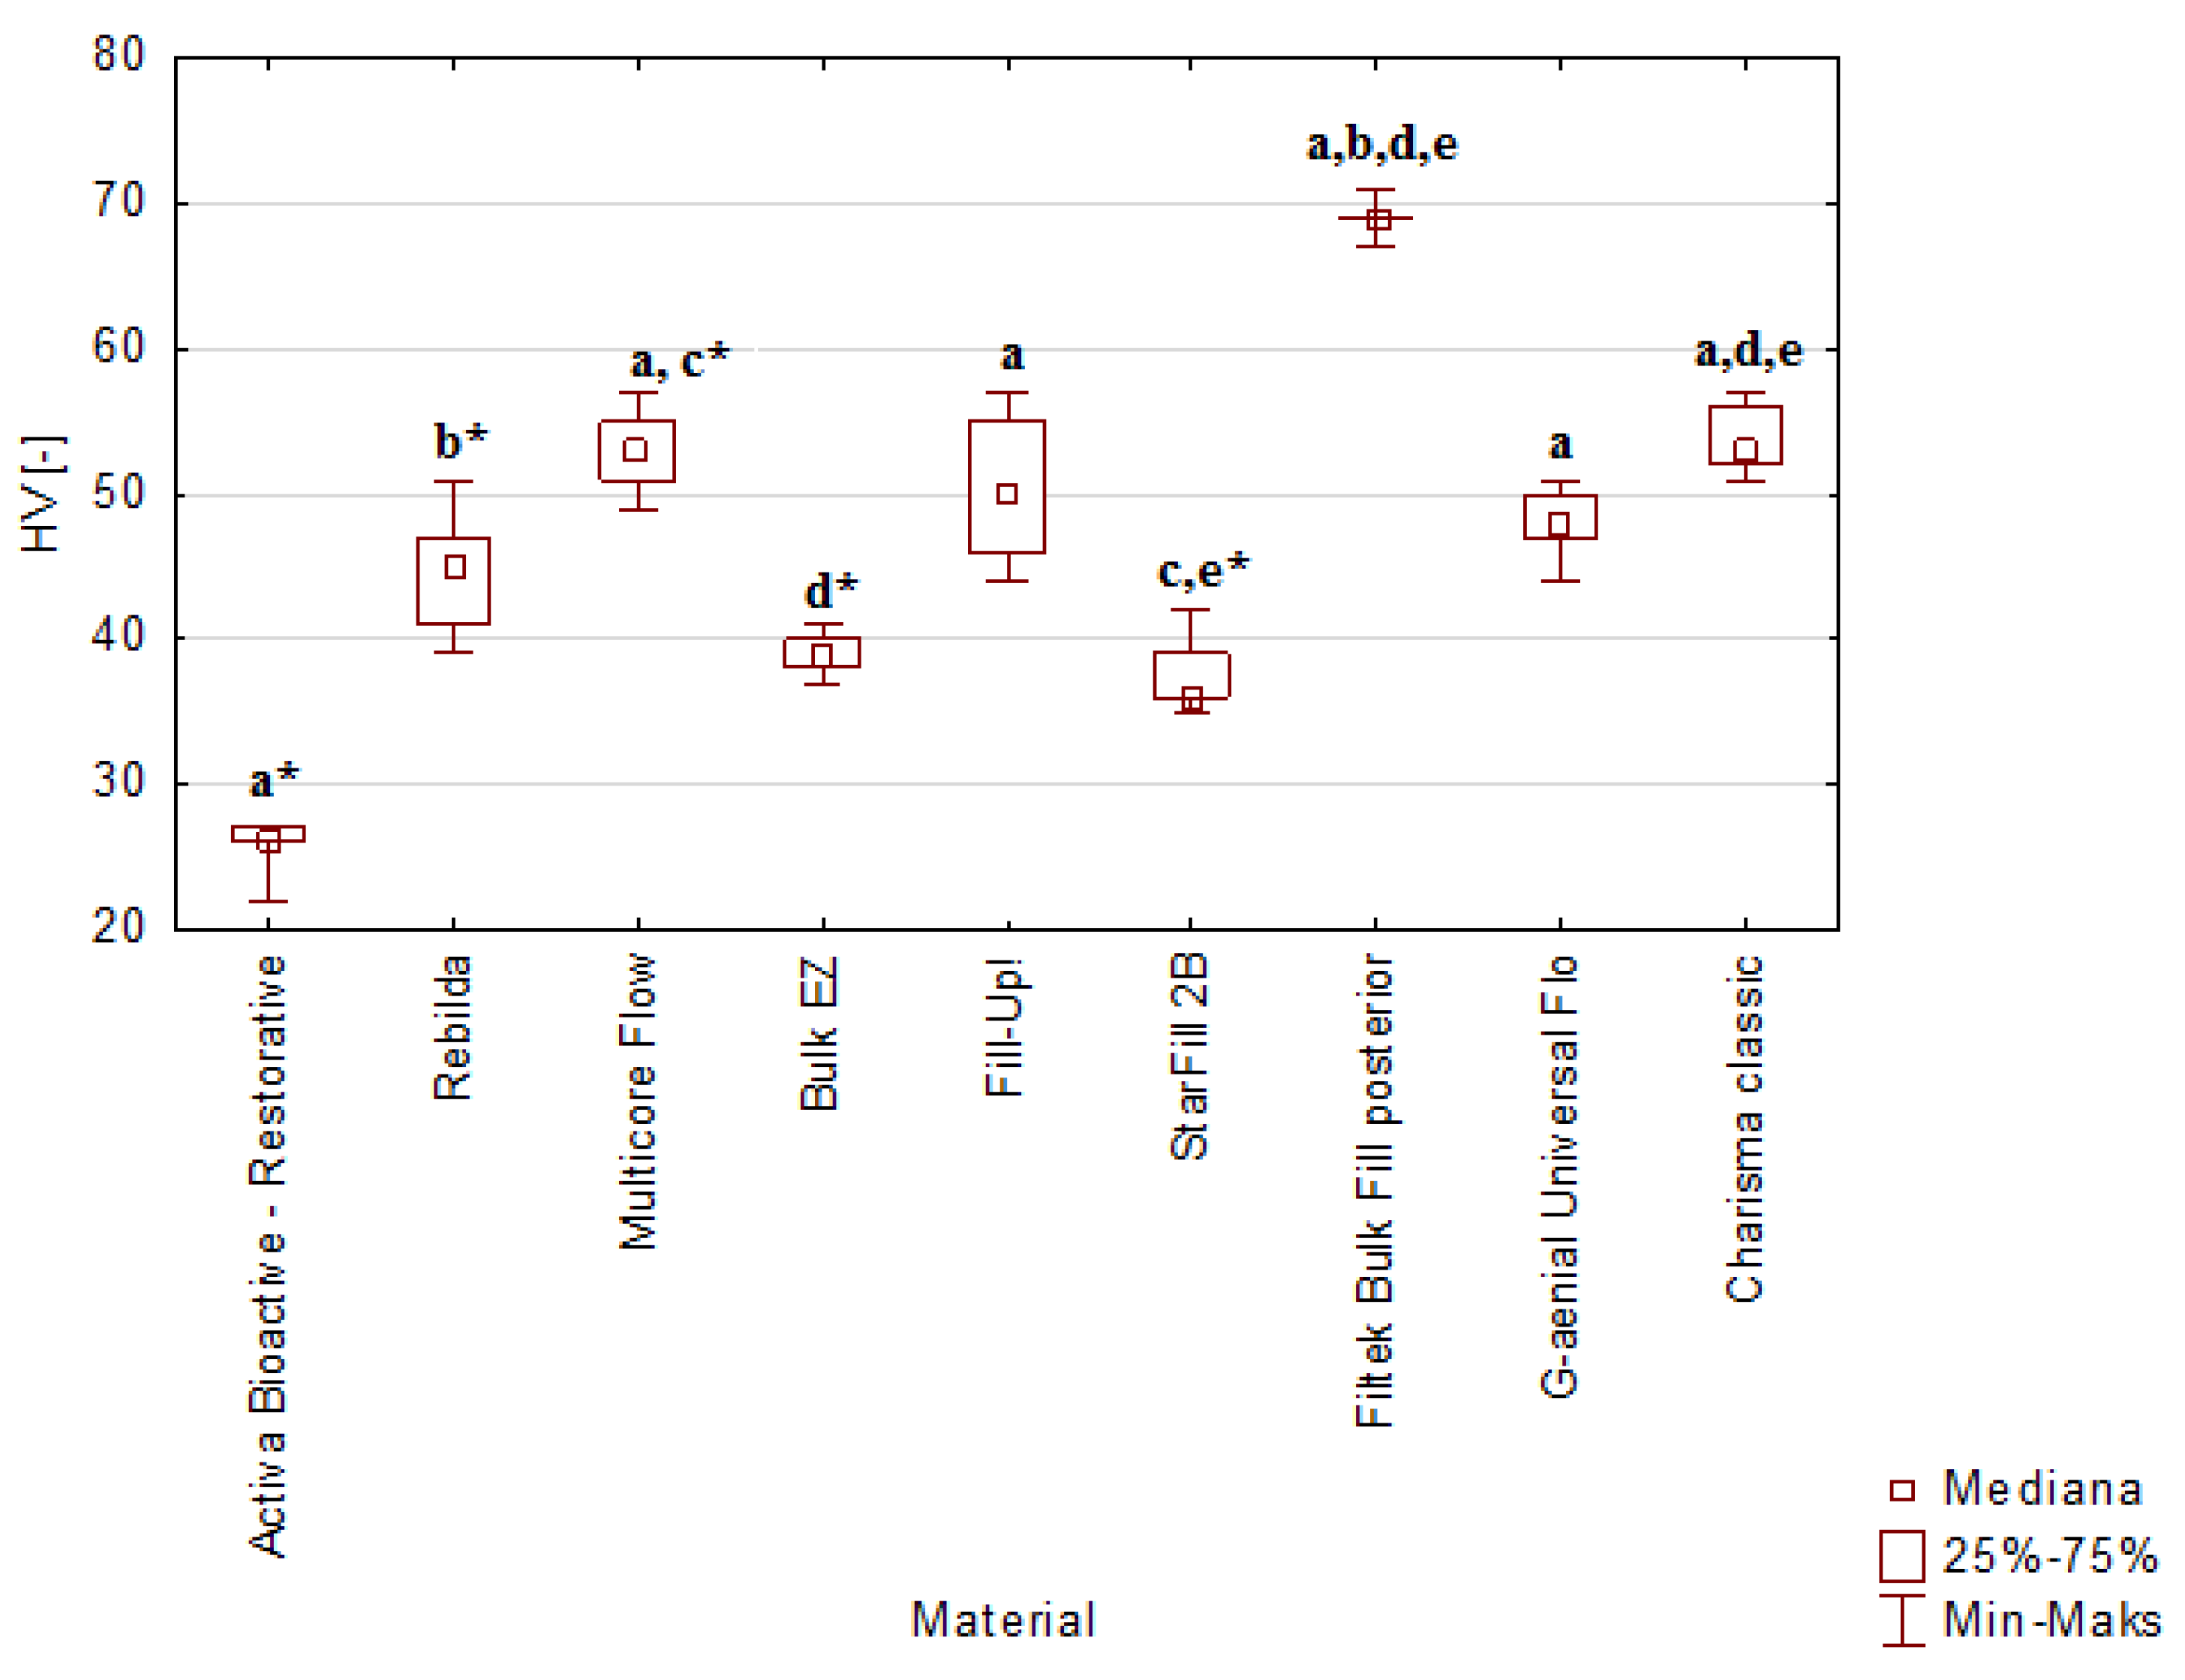
In both cases, Charisma Classic presented the higher DTS value. The DTS analysis results of each material are presented in Figure 6.
Almost all measurement curves (Figure 7) showed a linear load–displacement dependence, which is characteristic of brittle materials. Filtek Bulk Fill posterior, Activa Bioactive-Restorative, and StarFill 2B presented some variations.

3.3. Hardness

The highest median value of hardness was 69 (Filtek Bulk Fill Posterior), and the lowest hardness amounted to 26 (Activa Bioactive) (Table A1). On the basis of the Kruskal–Wallis test, a statistically significant difference was found with p-value < 0.00005. According to multiple comparisons of mean ranks for all groups, statistically significant differences were found between:
  • Activa Bioactive-Restorative and Multicore Flow (p-value < 0.00005);
  • Activa Bioactive-Restorative and Fill-Up! (p-value = 0.0013);
  • Activa Bioactive-Restorative and Filtek Bulk Fill posterior (p-value < 0.00005);
  • Activa Bioactive-Restorative and G-aenial Universal Flo (p-value = 0.0233);
  • Activa Bioactive-Restorative and Charisma Classic (p-value < 0.00005);
  • Rebilda DC and Filtek Bulk Fill Posterior (p-value = 0.0057);
  • Multicore Flow and Bulk EZ (p-value = 0.0284);
  • Multicore Flow and StarFill 2B (p-value = 0.0056);
  • Bulk EZ and Filtek Bulk Fill Posterior (p-value < 0.00005);
  • Bulk EZ and Charisma Classic (p-value = 0.0170);
  • StarFill 2B and Filtek Bulk Fill Posterior (p-value < 0.00005);
  • StarFill 2B and Charisma Classic (p-value = 0.0032).
The highest HV value was observed in Filtek Bulk Fill Posterior, and the lowest was observed in Activa Bioactive-Restorative. The HV in Multicore Flow was higher than in Bulk EZ and StarFill 2B. The HV values in Bulk EZ and StarFill 2B were lower than in Charisma Classic. The HV analysis results of each material are presented in Figure 8.

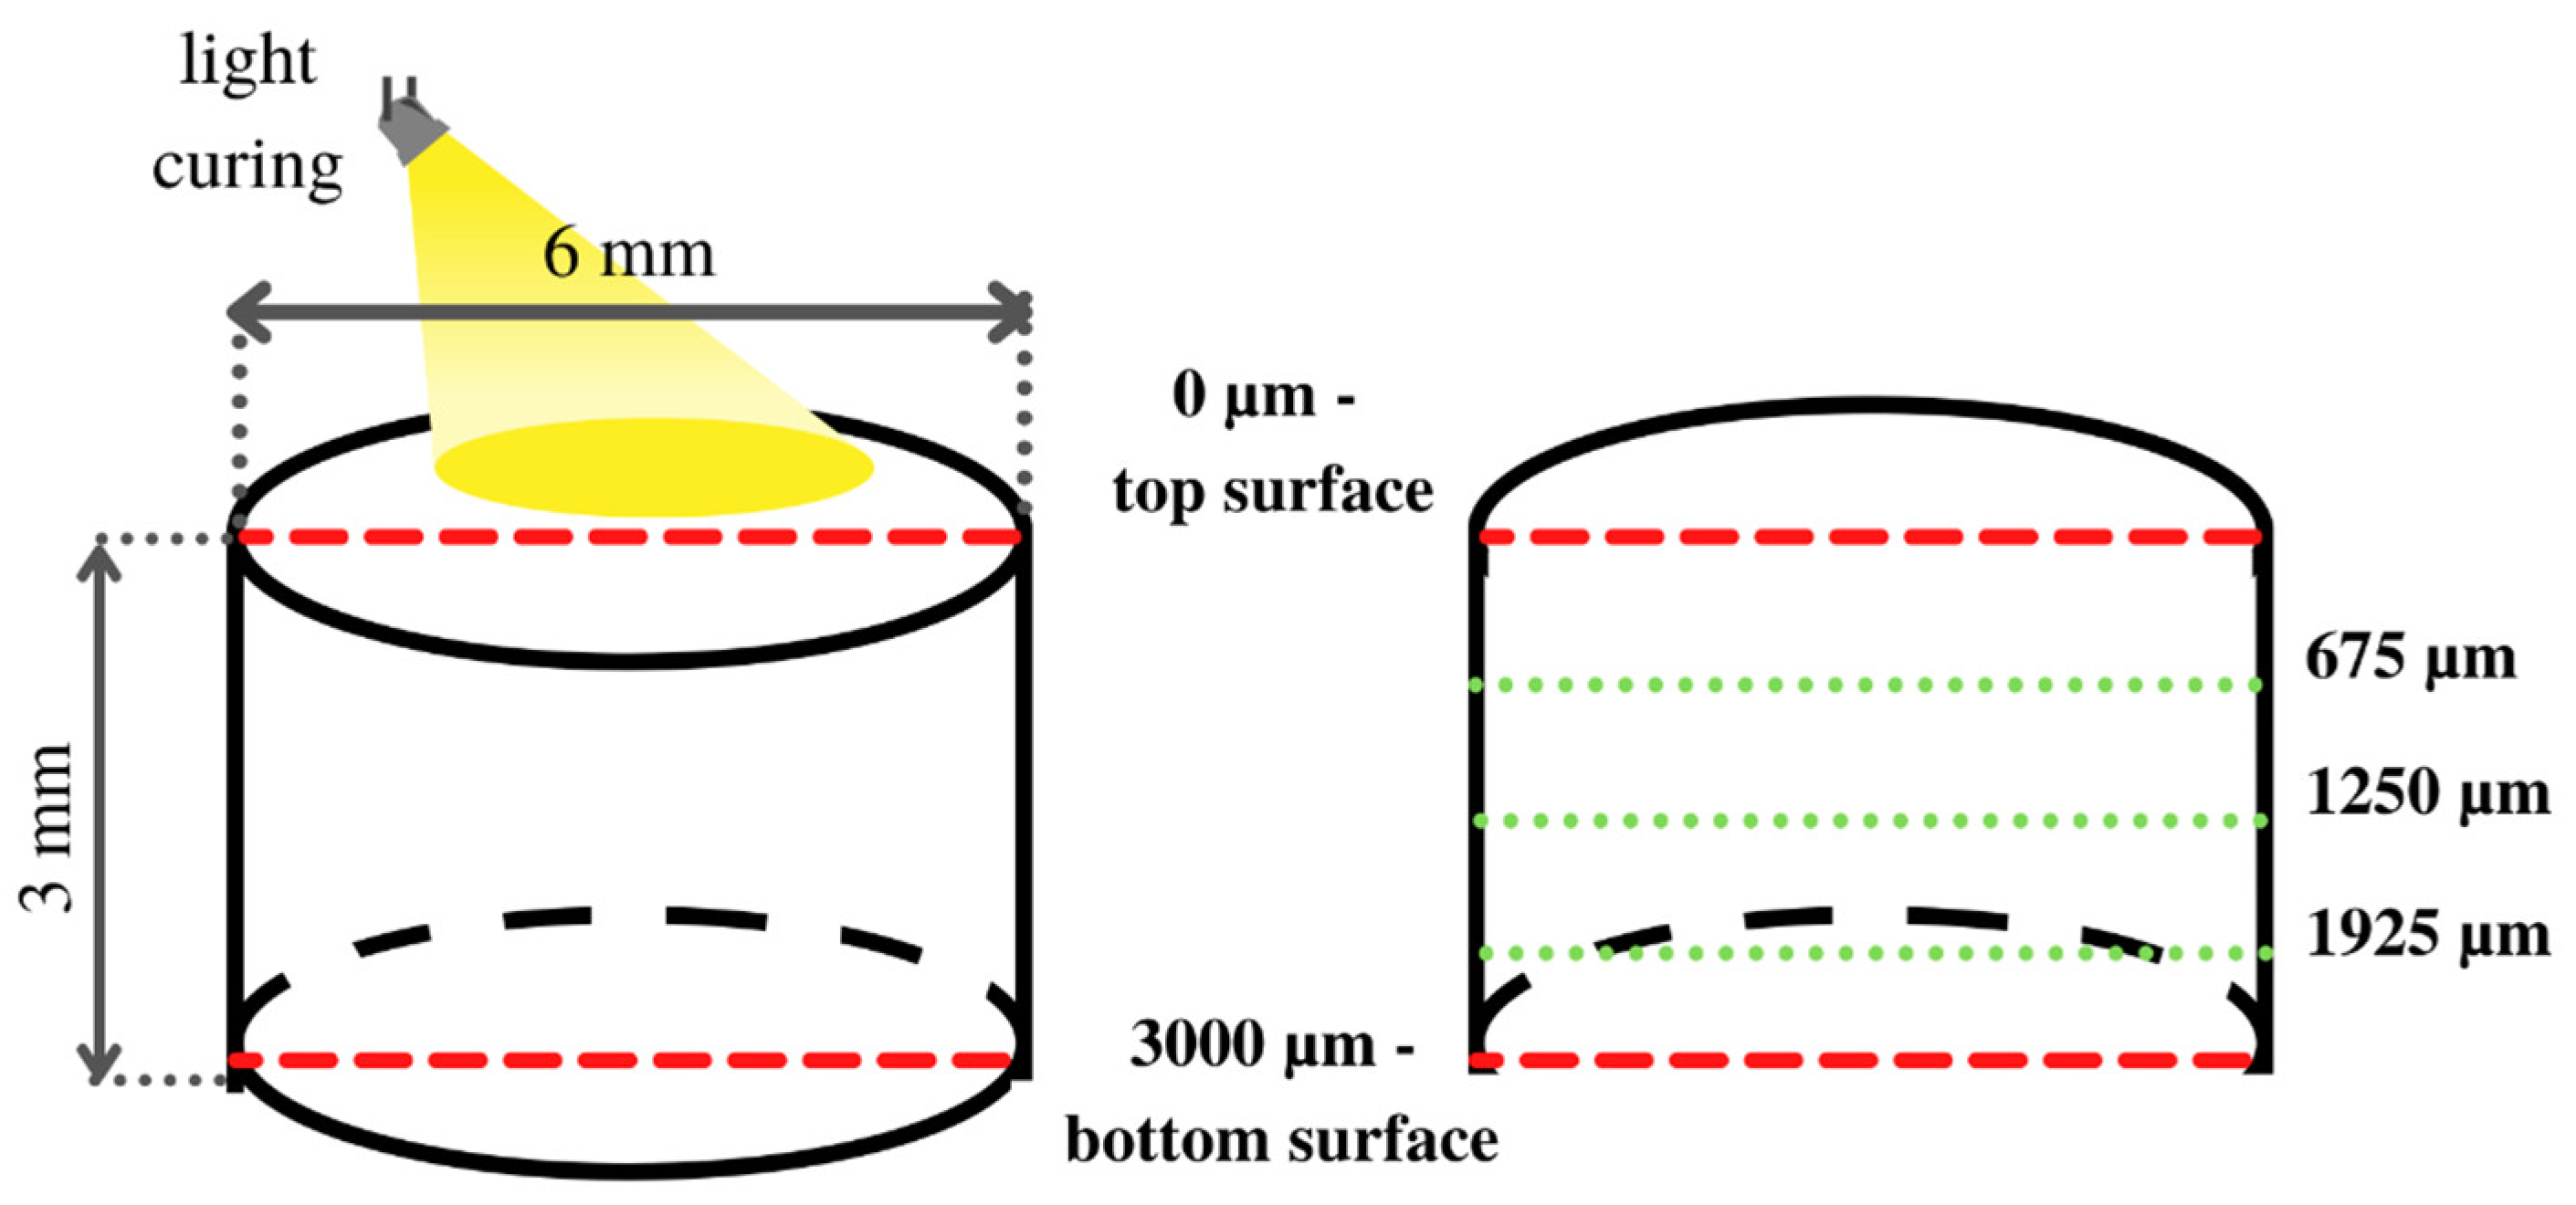
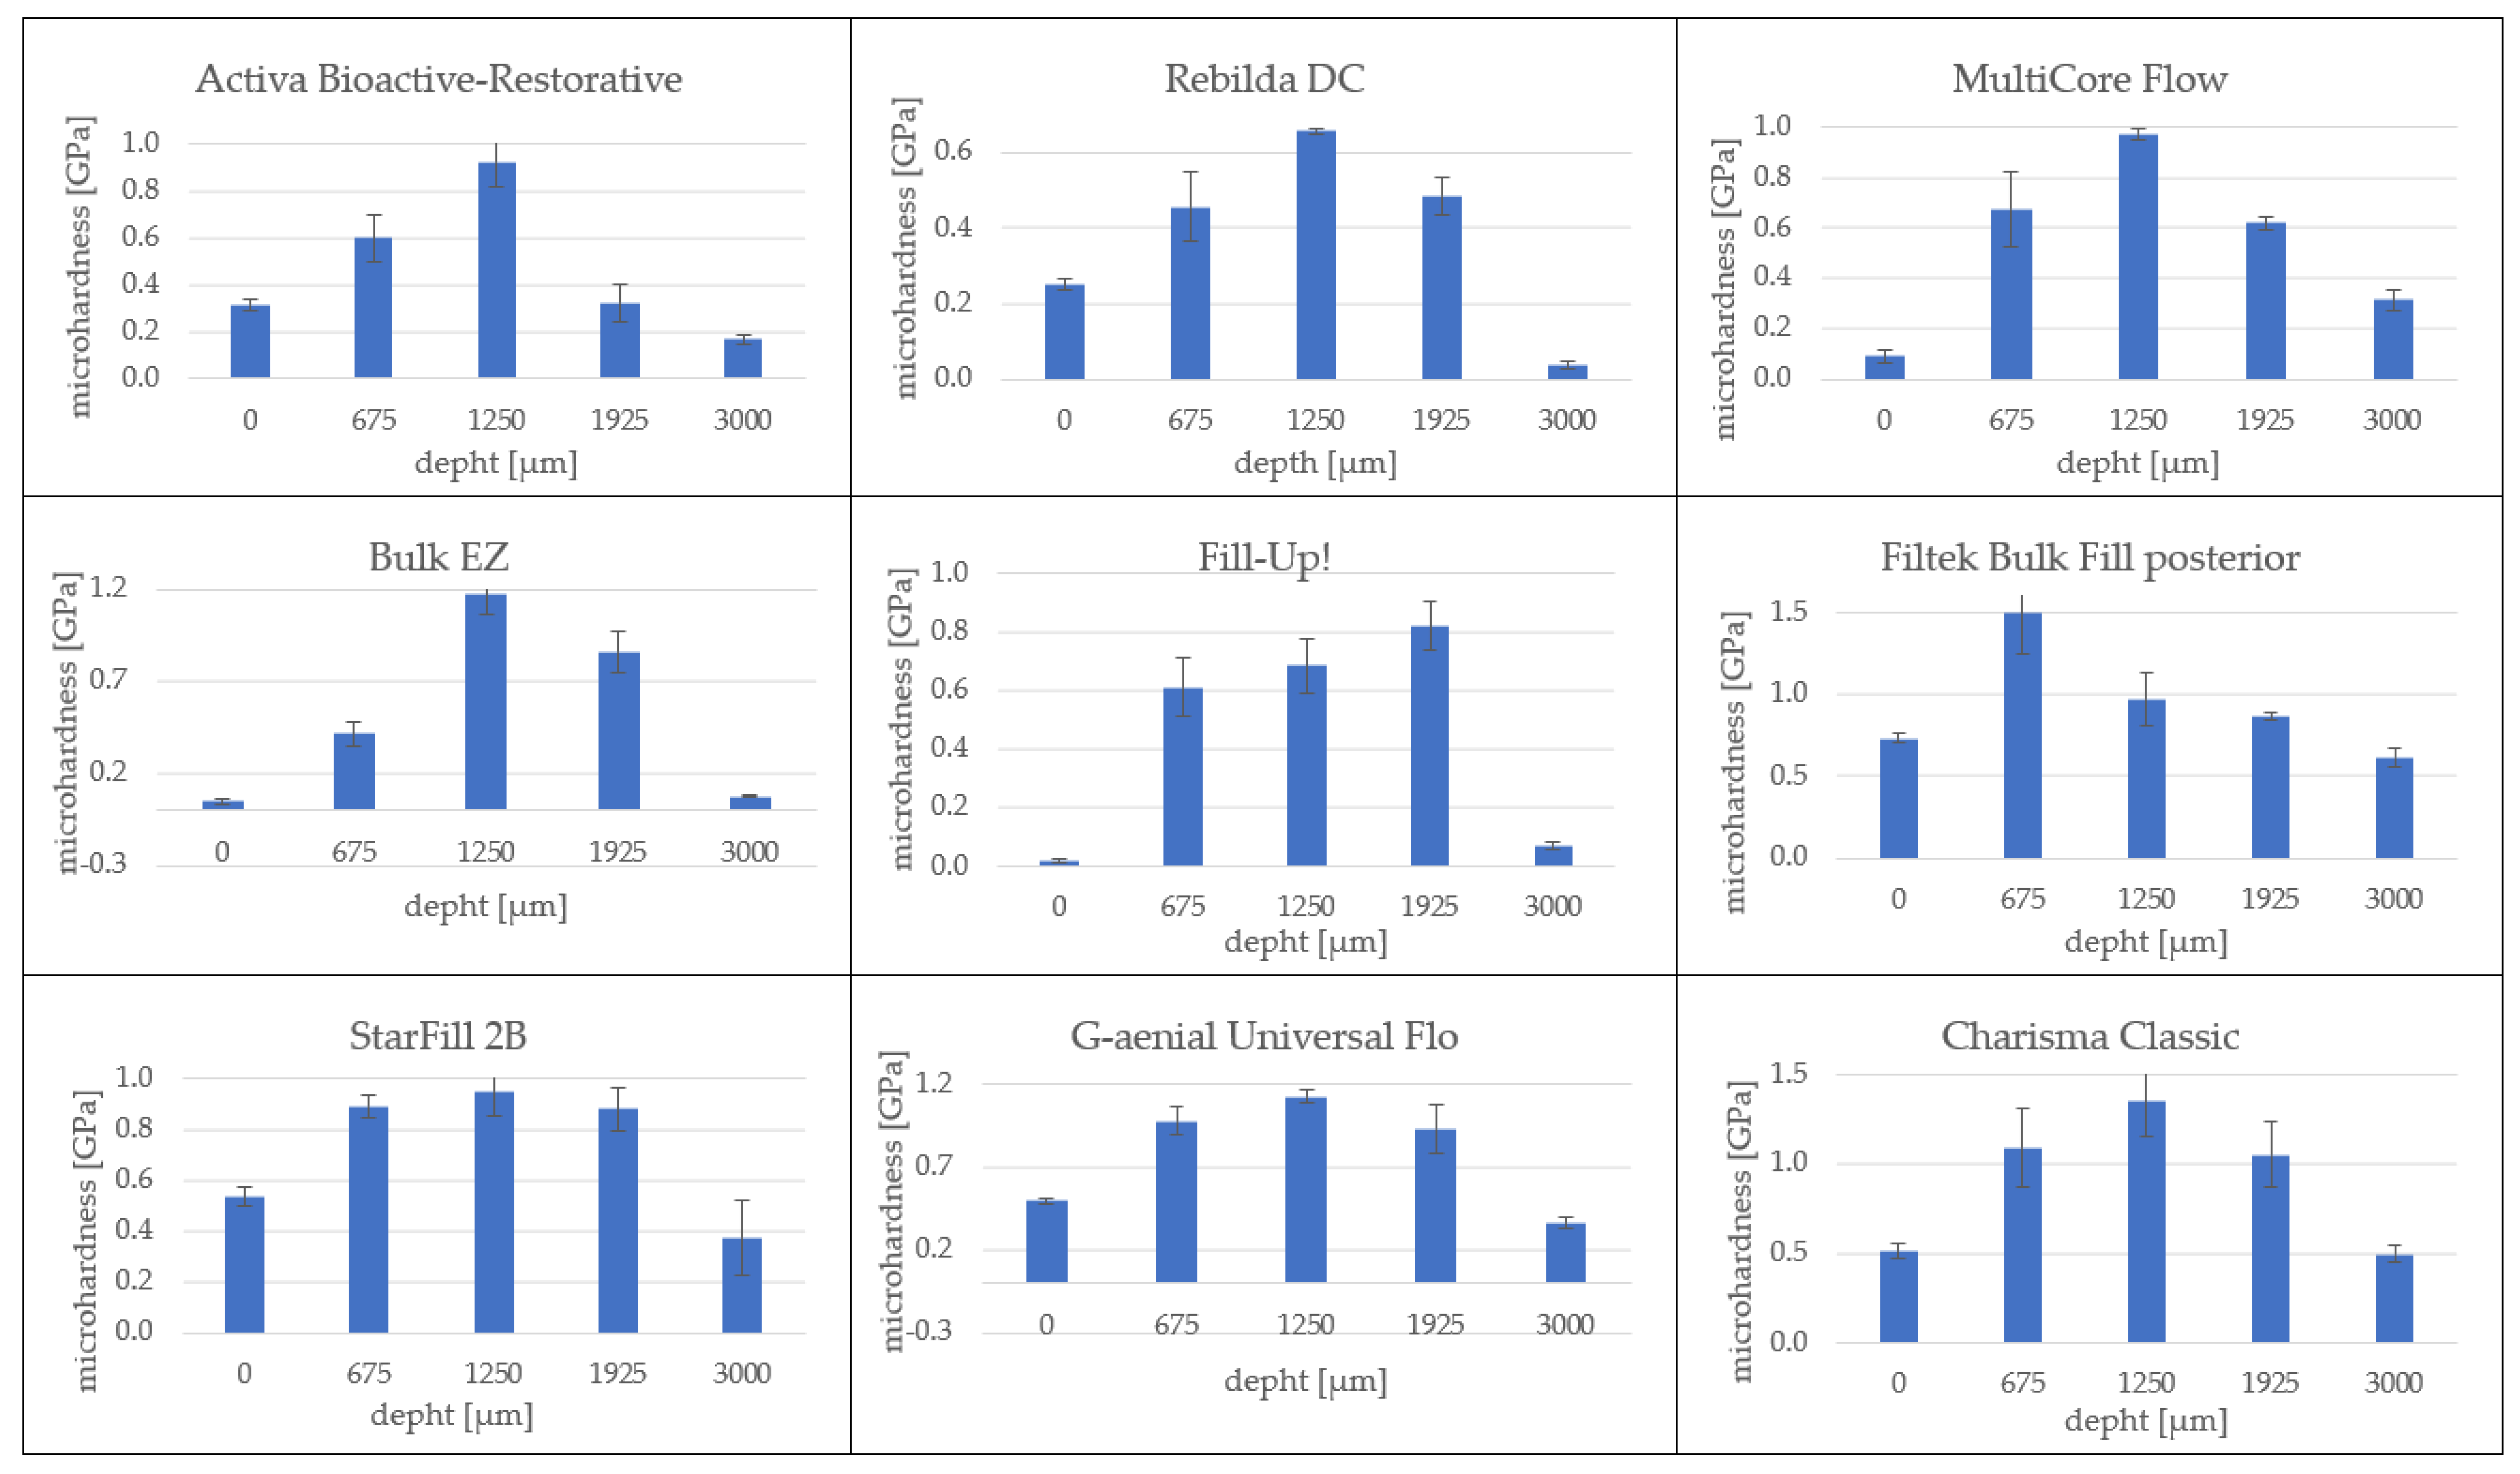
3.4. Microhardness Profile Depending on the Depth of Cure

Table 2 and Table 3 show the distribution of the average values (with standard deviations) of microhardness and reduced Young’s modulus, respectively, of the top, bottom, and cross-section of tested material samples, as determined by the nanoindentation method.
For most materials, the highest measured hardness values were in the center of the samples. The microhardness measured at the top and bottom of the samples reached the lowest values. The same observations can be seen for the values of reduced Young’s modulus (Table 3).

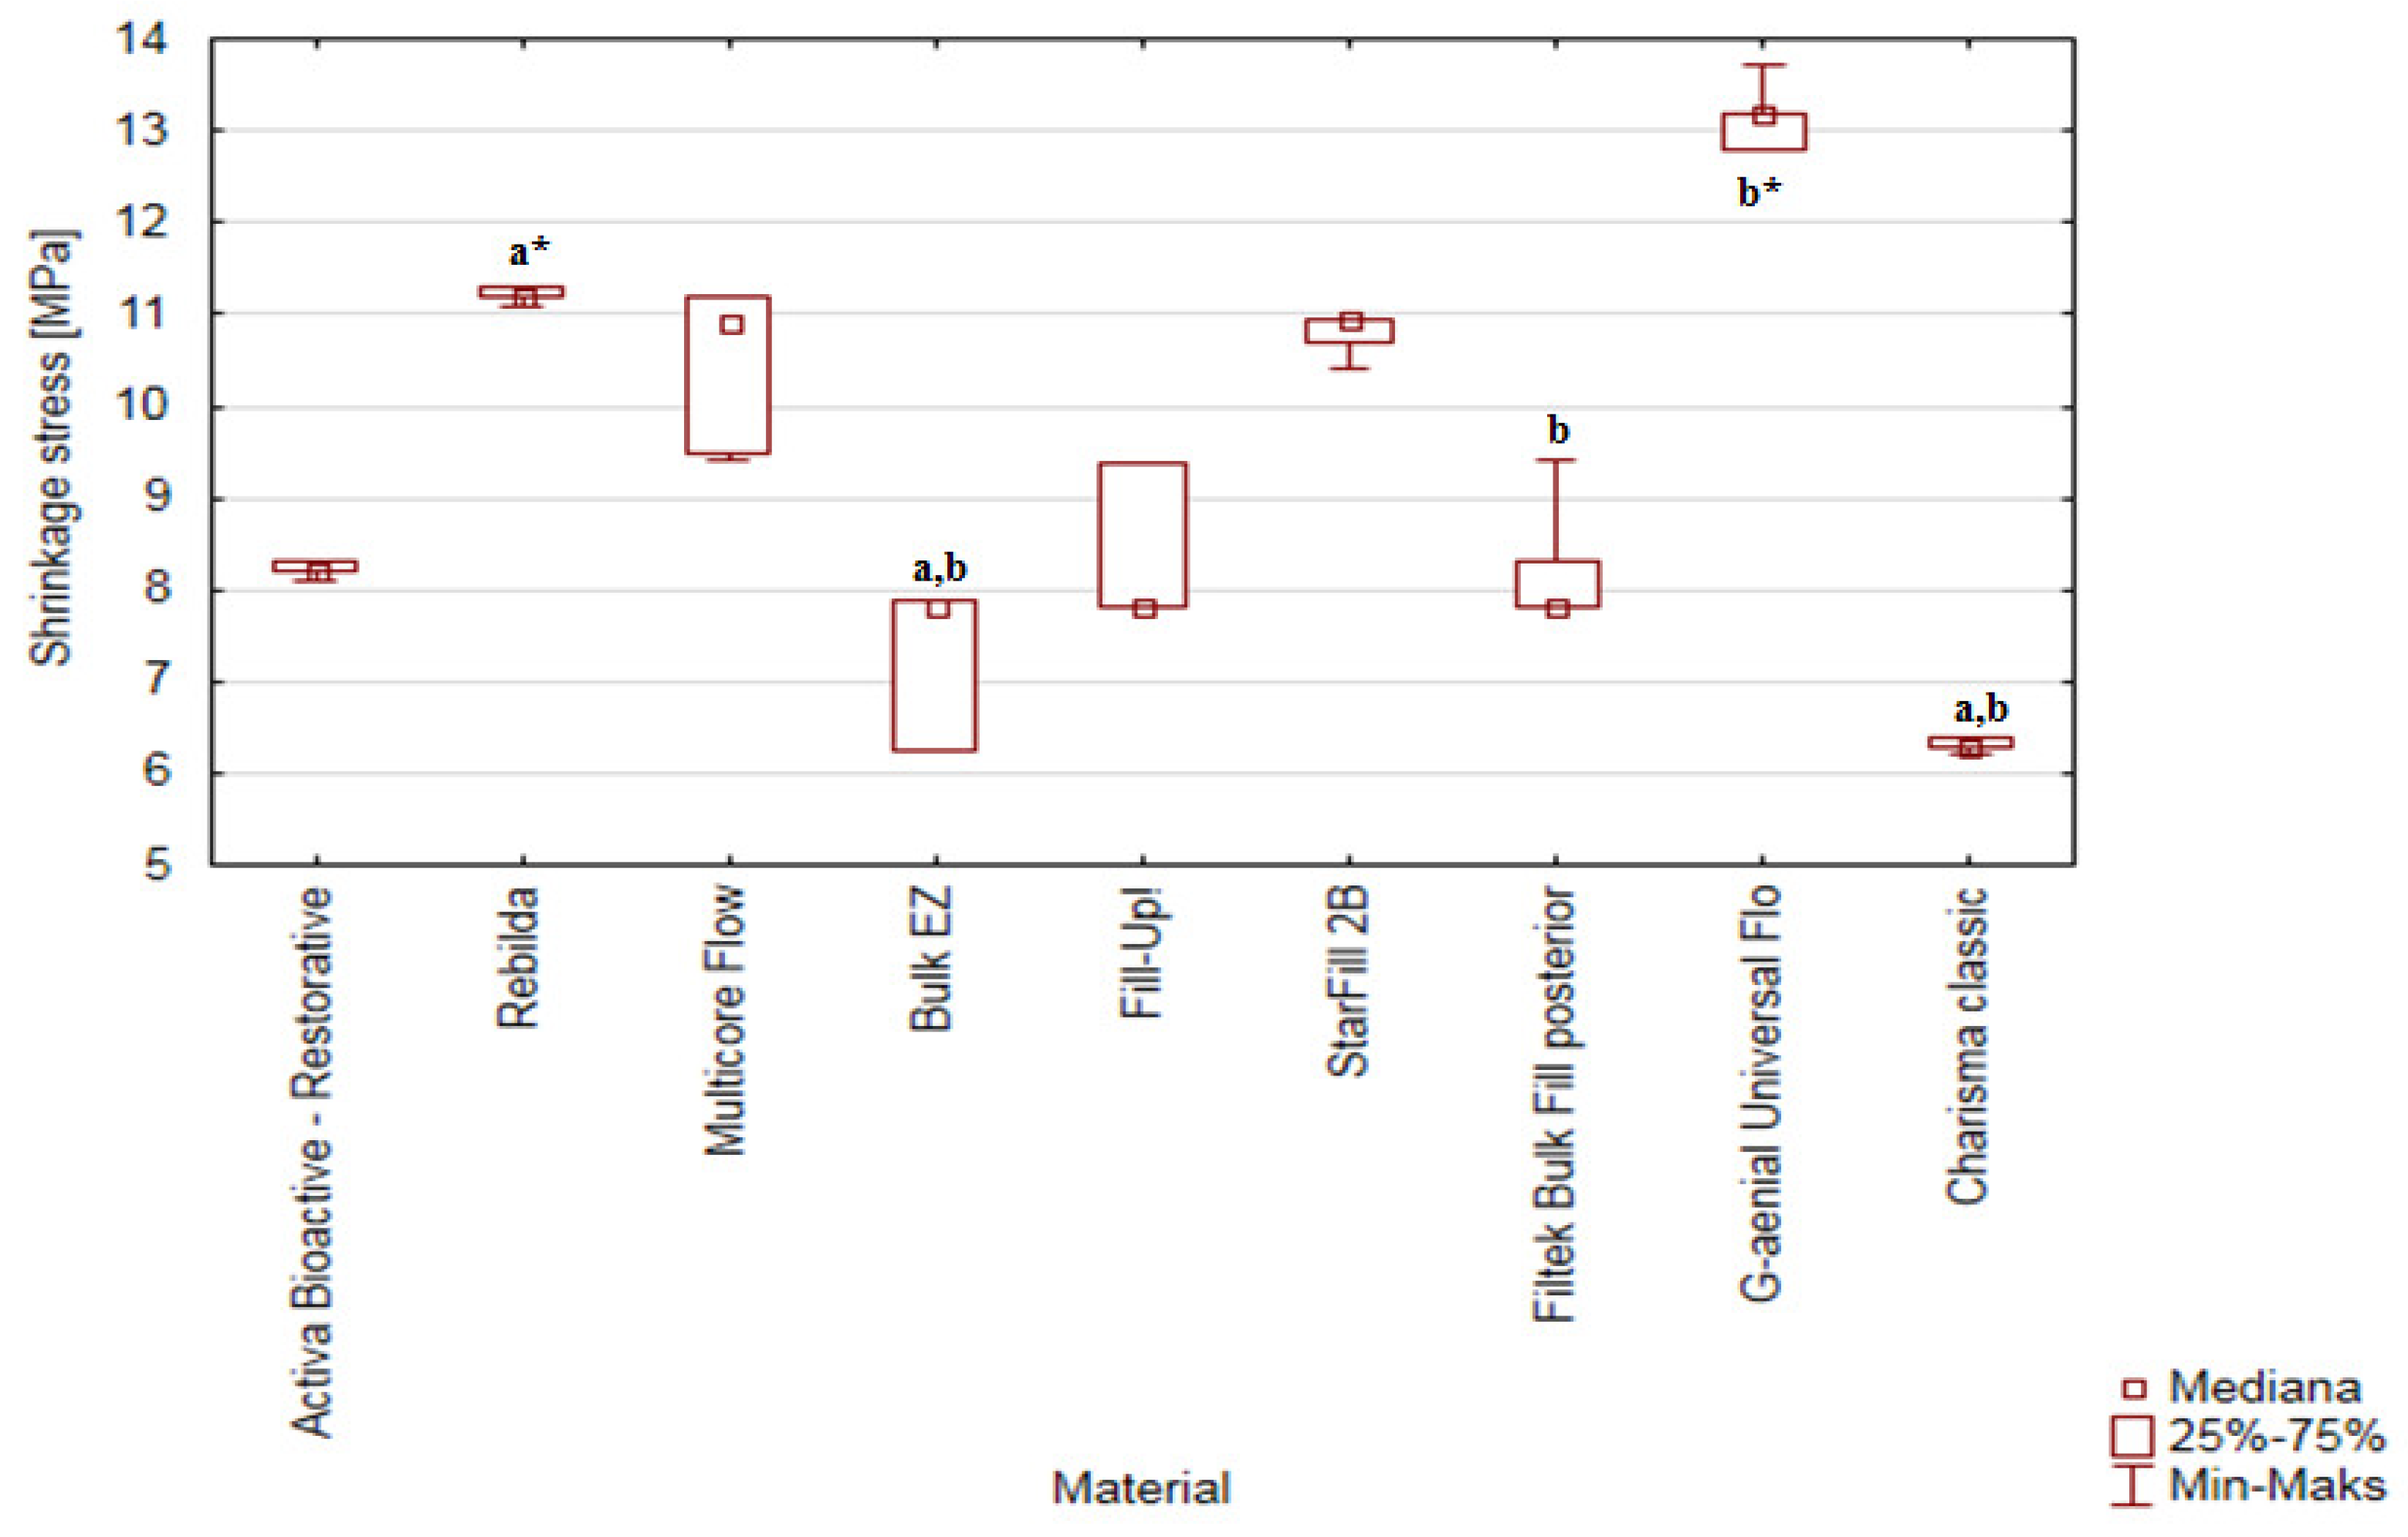
3.5. Shrinkage Stress

The shrinkage stress of the tested materials ranged from 6.3 MPa (Charisma Classic) to 13.2 MPa (G-aenial Universal Flo) (Table A1). On the basis of the Kruskal–Wallis test, a statistically significant difference was found with p-value < 0.00005. According to multiple comparisons of mean ranks for all groups, the statistically significant difference was found between:
  • Rebilda DC and Bulk EZ (p-value = 0.033513);
  • Rebilda DC and Charisma Classic (p-value = 0.003128);
  • G-aenial Universal Flo and Bulk EZ (p-value = 0.002197);
  • G-aenial Universal Flo and Filtek Bulk Fill Posterior (p-value = 0.023652);
  • G-aenial Universal and Charisma Classic (p-value = 0.000136);
Some highest values were observed for G-aenial Universal Flo and Rebilda DC, and the smallest values were observed for Charisma Classic and Bulk EZ (Figure 9).

4. Discussion

One of the major needs of dental restoration is the ability to transfer of external, multidirectional, and complex masticatory loads. A restored tooth tends to transfer stress differently than an intact tooth. In the restoration, any force causes the occurrence of compression, tensile, or shear stresses along the tooth–restoration interface [18]. Dental materials, especially those used for core reconstruction, need to oppose recurrent and complex loads with tensile, compress, twisting, and bending force [19]. To withstand such a wide spectrum of stresses, these materials should be characterized by excellent mechanical properties, including mechanical properties, which determine the strength and durability of the restoration. Most fractures of prostheses and restorations develop progressively (over many stress cycles) after the initiation of a crack from a critical flaw. Then, the crack subsequently propagates until a sudden, unexpected fracture. However, the PN-EN ISO 4049 standard (dentistry polymer materials for reconstruction) selected flexural strength as an only test of mechanical properties [13].
Flexural strength is a clinically relevant measurement of material durability with unique importance for materials used as fillings for Class I, II, and IV cavities, which endure strong masticatory forces [20]. Materials with higher flexural strength have a lower tendency to bulk fracture and crack at the margins [20,21]. Additionally, the characteristics of a material’s surface (especially the occurrence of, e.g., voids, roughness, and cracks) directly affect the results of flexural strength tests. This is especially visible for brittle materials when the aforementioned defects decrease fracture strength [20]. One can conclude that high values of flexural strength correlate with the limited tendency of material to crack and high resistance to surface flaws and erosion [22]. As such, materials with high flexural strength can be used to produce thin reconstructions (according to concept of minimal invasive dentistry) without fear of material failure. However, in laboratory conditions, the three-point bending test requires the preparation of relatively large samples (25 mm × 2 mm× 2 mm), which may result in cross-linking heterogeneity. This is a consequence of overlapping zones of radiation, and it may lead to different stress distribution in the material or even places where stresses are concentrated that may be reflected in varied flexural strength values of a tested material. However, some researchers have indicated no clinical significance. In dental practice dental restorations are several times smaller than in the laboratory [21,23,24]. The minimum flexural strength limits defined in the ISO standard for composite materials are 80 MPa (occlusal surface restoration) and 50 MPa (other restorations) [13]. All of tested materials met ISO 4049 standards for materials used in occlusal surface restorations (>80 MPa). Based on obtained diagrams (Figure 5), it can be concluded that tested composites are brittle materials that can only undergo plastic deformation to a certain extent.
One of the most frequently used tests for dental composites is that of diametral tensile strength (DTS). This test enables researchers to determine the ability of a brittle dental filling to resist the tensile stress occurring during chewing [25,26]. Such a situation has been observed when brittle materials are used in anterior restorations [27]. DTS limit values are not defined by international standards, but the Specification No.27-Resin-Based Filling Materials by the American Dental Association (ADA) specifies a minimum DTS value of 24 MPa [28]. All of our tested materials met the ADA specification (Table A1). However, on the basis of the obtained diagrams (Figure 7), we can conclude that there were some plastic deformations in the samples (Filtek Bulk Fill Posterior, Activa Bioactive-Restorative, and StarFill 2B) that could have affected the DTS values. Dental materials that are stiff but exhibit ductile properties can be characterized as strong and tough [25].
Hardness is another important parameter of restorative dental materials. Sufficient hardness ensures that the placed restorations are resistant to mastication forces and abrasion processes. Hardness correlates well with other mechanical properties such as elastic modulus. However, it should be emphasized that hardness strongly depends on the method and conditions of measurement [24]. The Vickers and Knoop methods are the most commonly used in dental research because materials with great ranges of hardness can be tested by simply varying the test load [25]. Composite materials for filling cavities in teeth should have a Vickers hardness (HV) value of around 40–50 [29]. This is extremely important because filling materials are intended to replace enamel and dentin tissues. The average hardness of tooth tissues is from 250 to 360 HV for enamel and from 50 to 70 KHN (Knoop hardness) for dentin [30]. Most composites available on the market have a surface hardness in the HV range of 70–110 [6,29,31,32]. The highest hardness values obtained in our tests were for Filtek Bulk Fill posterior at about 70 HV, while the Activa Bioactive-Restorative material had the lowest values (27 HV) (Table A1). The remaining materials showed sufficient values for use as filling materials. Their hardness values were in the range from 40 to 50.
Microhardness values can be obtained by using a load of less than 1000 g. These values also correlate with the degree of monomer conversion (DC) in composites. Hardness testing can be performed at various curing depths to form a profile, and this profile can be used to alternatively measure the depth of cure [33]. Therefore, the evaluation of such a profile for materials, especially those with a dual-hardening system, seems to be an interesting research supplement. Additionally, nanoindentation can be used for elastic moduli measurements. In our study, the microhardness at the top surface (0 µm) of all tested materials was found to have the smallest values. S. Flury at all. [33] also obtained similar results; the highest values of hardness were observed in measurements from 0.2 to 1.0 mm [33]. This phenomenon was also observed in another study [34,35,36]. Such results can be explained by a combination of few factors. The first is a layer of inhibition that may arise due to access to oxygen. Although the samples were made with the use of matrix strips, it was shown that only an atmosphere of 100% nitrogen can completely eliminate this factor [34]. In addition, during the photopolymerization of materials, there are certain thermal effects that may accelerate the oxidation processes. Additionally, the surface layer may show a slightly lower degree of conversion than the deeper layers due to the very rapid migration of radicals into the material. The first monomers that become free radicals actively diffuse through the low-viscosity composite medium in search of another electron-rich carbon double-bond with which to react (building the developing polymer network) [37]. Our microhardness test results showed the partially symmetrical distribution of microhardness in the depth profiles (Figure A3). Such a distribution was probably related to the characteristic of light passage through the material and the formation of free radicals that diffused into the bulk. The light irradiance acting on material surface heterogeneously decreases with the increasing depth of a restoration. Light scattering and absorption by filler, particle interfaces, photoinitiators, and pigments occur and have influence on a complex irradiance profile through depth [38]. An additional influencing element of most of the tested materials is the occurrence of chemical polymerization. It has been shown that composite materials usually have similar transmittance and absorbance values [39]. These values mainly depend on the material’s photoinitiators, amount of filler, and characteristics [40]. Of all studied materials, the Filtek Bulk Fill Posterior had the most homogeneous microhardness distribution. This material’s composition allows for deeper and more homogeneous light penetration, which enables efficient polymerization, even at a depth of 4 mm. The appropriate light translucency was achieved by the manufacturer by selecting the filler size (nanofiller), filler chemical modification, and appropriate refractive indices between the filler particles and the resin matrix [41]. Here, the microhardness of the cross-section found to be the most different from expectations and other materials was Bulk EZ. In a study by Wang R. et al. [42], Bulk EZ was shown to have the same degree of conversion values at 0.5 and 5 mm of depth in light-curing samples, as well as a similar degree of conversion in a self-curing sample. Hence, it was concluded that chemical-curing is the predominant one of two polymerization mechanism. Significant differences in the results in our hardness Bulk EZ tests were detected, especially in the top and bottom layers, may be due to the heterogeneity of the sample that have been caused by the inhomogeneous mixing of the material [38].
In mechanical tests, the Activa Bioactive-Restorative material presented the lowest determined values. This may have been related to its composition, defined by the manufacturer as a hybrid of a composite material and resin-modified glass–ionomer cement (RMGIC) [43]. The material was determined to have a low elastic modulus during the measurement of TPB (Figure 4). The patented rubberized resin allowed for the greater elastic deformation of the material during its loading, and the material exhibited less brittleness compared to the other tested materials (Figure 4). The Activa Bioactive-Restorative material also presented the lowest hardness values. The manufacturer does not specify the amount of filler, but due to the flow consistency and low modulus of flexural strength of the material, it is suspected that it is not condensed. Filler content is one of the most important factors that affects the hardness of dental materials [44,45]. Based on our research, the hardness of the Activa Bioactive-Restorative material is more similar to RMGIC [46,47] or experimental dental composites than to commercial composite materials (Figure 8). This could translate to the higher abrasion wear of the Activa Bioactive-Restorative material in occlusal/masticatory load areas. Other properties are comparable to resin based dental materials, however, conventional composites have higher mechanical strength [23,48] than Activa Bioactive-Restorative.
We found no statistically significant differences for other dual-curing system materials in comparison to light-cured materials. Our research hypothesis was not rejected. However, it should be emphasized that the observed variation among results was due to the composition of individual composites. The highest three-point bending strength values were observed in the following materials: G-aenial Universal Flo, Multicore Flow, and Rebilda DC. The presence of monomers such as UDMA and TEGDMA in resin increases TPB strength and modulus of elasticity due to the flexibility and lower density of these monomers, which are capable of achieving high degrees of conversion [49,50]. Here, the Filtek Bulk Fill Posterior material was found to have significantly higher hardness values than the other tested materials. The monomer system (UDMA, Procrylat) and the relatively high degree of filling (64.5%) with filler particles of 0.01–5 in micron size had large impacts on the improvement of the material hardness value. The obtained results suggest that the Filtek Bulk Fill Posterior material has a good balance between the degree of filling and matrix ingredient combinations. The mechanical properties of the Filtek Bulk Fill Posterior material, along with its relatively low shrinkage stress, make it suitable as a restorative material subjected to high loads. In addition to the monomer system, filler content influences the hardness values of dental materials. Fillers are employed to strengthen and reinforce composites. Stresses generated as a result of the action of occlusal forces are transmitted by the organic phase to reinforcement (fillers). Inorganic fillers are harder than resin matrixes. With a high filler content, additional strengthening effects may occur between the organic and inorganic phases. As the percentage of filler increases, the initial interparticle spacing decreases. This space further decreases with the increasing conversion of the organic matrix, which can cause interactions between the filler surface and the densifying matrix. This process may result in the additional reinforcement of the composite network [51]. We recorded the highest degree of filling in the tested materials for Charisma Classic, and this material also showed hardness values above 50, although its composition is mainly bis-GMA [52,53,54].
All currently available resin-based dental materials undergo polymerization shrinkage generated during polymerization due to the conversion of the monomer molecules into a polymer structure, which is accomplished by replacing the longer van der Waals interactions with shorter covalent bonds and consequently reducing the free volume of the material. The consequence of this process is the occurrence of shrinkage stresses at the interface of tooth tissue and composite material. This phenomenon can have a significant impact on the success of dental restorations [8,55,56]. The shrinkage stress values of composite materials range from 6 to 25 MPa [57,58], and the strength of a dentin bond with restoration reaches 20–30 MPa. However, the limit value of shrinkage stress that can damage a created adhesion is 17–20 MPa.
According to the obtained results, Charisma Classic material has the lowest values of shrinkage stress, while G-aenial Universal Flo has the highest value (Figure 9). Both of these materials are characterized by a high filler content (61 vol.% for Charisma Classic and 50 vol.% for G-aenial Universal Flo). In the case of the first material, a large volume fraction of the filler was found to influence the achievement of low shrinkage stress (at the level of about 6 MPa) by reducing the volume of the polymer in the composite structure [59,60]. In addition, the material consists of high-molecular bis-GMA resin [61] and a pre-polymerized filler [62,63], which were found to be factors that can reduce shrinkage in dental composites. In the case of G-aenial Universal Flo, silicon dioxide (with the size of filler particle above 16 nm) and strontium glass (filler particle size of above 200 nm) were used to achieve a semi-liquid consistency with a high amount of filler. This size of particles allows for the better dispersion, condensation, and homogenization of fillers in a polymer network [64]. However, monomers with lower molecular weight, e.g., UDMA, bis-MePP, and TEGDMA, have the largest impact on the level of contraction stress. The lower density and higher elasticity of monomer molecules result in the formation of more cross-links or the possibility of cyclization (in terms of TEGDMA) during polymerization, which contributes to higher shrinkage stress [65]. A material’s shrinkage stress may be directly connected to the occurrence of secondary caries and a shorter reconstruction exploitation time. Hence, materials with lower shrinkage stress are clinically favorable. In our studies, relatively low contraction stress values were observed for the Charisma Classic, Bulk EZ, Filtek Bulk Fill Posterior, Fill-Up!, and Activa Bioactive-Restorative materials.
Materials with dual-curing systems theoretically should exhibit lower shrinkage stresses than light-cured materials. The reduction in shrinkage stress in dual-cured materials is the result of a slower polymerization process activated by chemical compounds in comparison to quicker light-activated processes. The dual-curing system allows one to delay the use of light activation. In chemically activated polymerization, the process progresses slowly and some stress relief is possible [66]. However, all dual-cured materials tested in our study were found to have polymerization shrinkage values similar to light-cure composites (Figure 9). This may be explained by the fact that the delay time used in our study for the dual-cure materials was too short. It has been demonstrated that a delay time of 3 or 5 min prior to the light-activation of dual-cured cements can reduce shrinkage stress [67].

5. Conclusions

Due to the wide spectrum of materials available on the market, clinicians have some doubts about the use of particular materials. The search for clinical indications concerning individual types of dental materials should be an important element of a dentist’s work. Unfortunately, the technical datasheets provided by manufacturers very often do not contain the proper evaluation of materials. Additionally, researchers creating experimental materials generally need references for commercial materials. Therefore, an independent evaluation of selected materials is needed. We believe that our article will help researchers and dentists looking for differences between and the best choice of materials available on the market.
Given the limitations of this study and considering the materials selected for research, the following conclusions can be drawn:
  • Dual-curing composites have similar mechanical properties and shrinkage stress values compared to light-cured composites.
  • The properties of materials mainly depend on the composition of the polymer matrix and filler system.
  • From chosen light-cured composites, the Filtek Bulk Fill Posterior material showed the best balance between mechanical properties and shrinkage stress.
  • Due to its lower TPB and HV values, the Activa Bioactive-Restorative material should be used in places were loads are not high, in deeper parts of cavity.

Author Contributions

Conceptualization, M.D. and J.S.; formal analysis, M.F.; investigation, M.D., A.S.-W., M.K. and T.G.; methodology, M.K., T.G. and K.B.; project administration, K.B.; resources, J.S.; supervision, J.S.; writing—original draft, M.D, A.S.-W., M.F. and T.G.; writing—review and editing, M.D., A.S.-W. and K.B. All authors have read and agreed to the published version of the manuscript.

Funding

This research received no external funding.

Institutional Review Board Statement

Not applicable.

Informed Consent Statement

Not applicable.

Data Availability Statement

The data presented in this study are openly available in Zendo, doi: 10.5281/zenodo.5569184, at https://zenodo.org/record/5569184#.YWgV0egzZPY.

Conflicts of Interest

The authors declare no conflict of interest.

Appendix A

Figure A1. Cylindrical samples (diameter of 6 mm and thickness of 3 mm) for diametral tensile strength test (DTS).
Coatings 11 01255 g0a1
Figure A2. Rectangular samples (25 mm long, 2 mm wide, and 2 mm thick) for three-point bending flexural strength test (TPB).
Coatings 11 01255 g0a2
Table A1. Median values of three-point bending flexural strength (TPB), modulus of elasticity in bending (TPB modulus), diametral tensile strength (DTS), hardness (HV), and shrinkage stress for tested matrices.
MaterialTPB [MPa]TPB Modulus [GPa]DTS [MPa]HVShrinkage Stress [MPa]
Activa Bioactive-Restorative872.9939.2268.2
Rebilda DC1294.8139.44511.2
Multicore Flow1236.5450.65310.9
Bulk EZ1165.6746.7397.8
Fill-Up!985.1540.5507.8
StarFill 2B1095.9843.63610.9
Filtek Bulk Fill posterior1108.0641.1697.8
G-aenial Universal Flo1376.0245.84813.2
Charisma classic1176.9454.1536.3
Figure A3. Graphs showing the distribution of average values with standard deviations of microhardness determined by the nanoindentation method of the top (0 µm), bottom (3000 µm), and cross-section (675, 1250, and 1925 µm) of tested materials.
Coatings 11 01255 g0a3

References

  1. Passos, S.P.; Freitas, A.P.; Jumaily, S.; Santos, M.J.M.C.; Rizkalla, A.S.; Santos, G.C. Comparison of mechanical properties of five commercial dental core build-up materials. Compend. Contin. Educ. Dent. 2013, 34, 62–68. [Google Scholar]
  2. Schmage, P.; Nergiz, I.; Sito, F.; Platzer, U.; Rosentritt, M. Wear and hardness of different core build-up materials. J. Biomed. Mater. Res. Part B Appl. Biomater. 2009, 91, 71–79. [Google Scholar] [CrossRef] [PubMed]
  3. Rüttermann, S.; Alberts, I.; Raab, W.H.M.; Janda, R.R. Physical properties of self-, dual-, and light-cured direct core materials. Clin. Oral Investig. 2011, 15, 597–603. [Google Scholar] [CrossRef] [PubMed]
  4. Kovarik, R.E.; Breeding, L.C.; Caughman, W.F. Fatigue life of three core materials under simulated chewing conditions. J. Prosthet. Dent. 1992, 68, 584–590. [Google Scholar] [CrossRef]
  5. Kivanç, B.H.; Görgül, G. Fracture resistance of teeth restored with different post systems using new-generation adhesives. J. Contemp. Dent. Pract. 2008, 9, 33–40. [Google Scholar]
  6. Ferracane, J.L. Resin composite—State of the art. Dent. Mater. 2011, 27, 29–38. [Google Scholar] [CrossRef]
  7. Malhotra, N.; Kundabala, M.; Shashirashmi, A. Strategies to overcome polymerization shrinkage—Materials and techniques. A review. Dent. Update 2010, 37, 115–125. [Google Scholar] [CrossRef]
  8. Braga, R.R.; Ballester, R.Y.; Ferracane, J.L. Factors involved in the development of polymerization shrinkage stress in resin-composites: A systematic review. Dent. Mater. 2005, 21, 962–970. [Google Scholar] [CrossRef]
  9. Chandrasekhar, V.; Rudrapati, L.; Badami, V.; Tummala, M. Incremental techniques in direct composite restoration. J. Conserv. Dent. 2017, 20, 386–391. [Google Scholar]
  10. Corral Núñez, C.; Vildósola Grez, P.; Bersezio Miranda, C.; Alves Dos Campos, E.; Fernández Godoy, E. State of the art of Bulk-Fill resin-based composites: A review. Rev. Fac. Odontol. 2015, 27, 177–196. [Google Scholar] [CrossRef]
  11. Tiba, A.; Zeller, G.G.; Estrich, C.G.; Hong, A. A laboratory evaluation of bulk-fill versus traditional multi-increment-fill resin-based composites. J. Am. Dent. Assoc. 2013, 144, 1182–1183. [Google Scholar] [CrossRef] [Green Version]
  12. Gonçalves, F.; Campos, L.M.D.P.; Rodrigues-Júnior, E.C.; Costa, F.V.; Marques, P.A.; Francci, C.E.; Braga, R.R.; Boaro, L.C.C. A comparative study of bulk-fill composites: Degree of conversion, post-gel shrinkage and cytotoxicity. Braz. Oral Res. 2018, 32, e17. [Google Scholar] [CrossRef] [PubMed] [Green Version]
  13. ISO 4049. Dentistry—Polymer-based Restorative Materials; International Organization for Standardization: Geneva, Switzerland, 2019; pp. 1–29. [Google Scholar]
  14. Bociong, K. Naprężenia skurczowe generowane podczas fotoutwardzania eksperymentalnego kompozytu stomatologicznego. Cz. II. Przem. Chem. 2017, 1, 72–74. [Google Scholar] [CrossRef]
  15. Domarecka, M. Some properties of flowable low-shrinkage dental composites Wybrane właściwości materiałów kompozytowych typu flow o niskim skurczu polimeryzacyjnym. Przem. Chem. 2014, 93, 1000–1003. [Google Scholar]
  16. Domarecka, M.; Sokołowski, K.; Krasowski, M.; Szczesio, A.; Bociong, K.; Sokołowski, J.; Łukomska-Szymańska, M. Influence of water sorption on the shrinkage stresses of dental composites. J. Stoma. 2016, 64, 476–483. [Google Scholar]
  17. Timoshenko, S.; Goodier, J.N. Theory of Elasticity, 2nd ed.; McGraw-Hill: New York, NY, USA, 1951. [Google Scholar]
  18. Heymann, H.; Swift, E.J.; Ritter, A.V.; Sturdevant, C.M. Sturdevant’s Art and Science of Operative Dentistry; Elsevier/Mosby: Amsterdam, The Netherlands, 2013; ISBN 9780323170604. [Google Scholar]
  19. Wang, L.; D’Alpino, P.H.P.; Lopes, L.G.; Pereira, J.C. Mechanical properties of dental restorative materials: Relative contribution of laboratory tests. J. Appl. Oral Sci. 2003, 11, 162–167. [Google Scholar] [CrossRef] [Green Version]
  20. Ersoy, M.; Civelek, A.; L’Hotelier, E.; Say, E.C.; Soyman, M. Physical properties of different composites. Dent. Mater. J. 2004, 23, 278–283. [Google Scholar] [CrossRef] [PubMed] [Green Version]
  21. Yap, A.U.J.; Teoh, S.H. Comparison of flexural properties of composite restoratives using the iso and mini-flexural tests. J. Oral Rehabil. 2003, 30, 171–177. [Google Scholar] [CrossRef] [PubMed]
  22. Combe, E.C.; Shaglouf, A.M.S.; Watts, D.C.; Wilson, N.H.F. Mechanical properties of direct core build-up materials. Dent. Mater. 1999, 15, 158–165. [Google Scholar] [CrossRef]
  23. Chung, S.M.; Yap, A.U.J.; Chandra, S.P.; Lim, C.T. Flexural strength of dental composite restoratives: Comparison of biaxial and three-point bending test. J. Biomed. Mater. Res. Part B Appl. Biomater. 2004, 71, 278–283. [Google Scholar] [CrossRef] [PubMed]
  24. Kleczewska, J.; Bieliński, D.M.; Ranganathan, N.; Sokolowski, J. Characterization of Light-Cured Dental Composites; Ranganathan, N., Ed.; Pan Stanford Publishing Pte. Ltd.: Singapore, 2015; Volume 4, ISBN 9789814613064. [Google Scholar]
  25. Craig, R.G. Materiały Stomatologiczne, 12th ed.; Powers, J.M., Sakaguchi, R.L., Shaw, H., Shaw, J.G., Eds.; Edra Urban & Partner: Wrocław, Poland, 2008; ISBN 9780323081085. [Google Scholar]
  26. Okulus, Z. Otrzymywanie Oraz Charakterystyka Dentysycznych Materiałów Kompozytowych; Politechnika Poznańska: Poznań, Poland, 2016. [Google Scholar]
  27. Mota, E.G.; Oshima, H.M.S.; Burnett, L.H.; Pires, L.A.G.; Rosa, R.S. Evaluation of diametral tensile strength and Knoop microhardness of five nanofilled composites in dentin and enamel shades. Stomatol. Balt. Dent. Maxillofac. J. 2006, 8, 67–69. [Google Scholar]
  28. ANSI/ADA Specification No. 27: Resin-Based Filling Material; American National Standards Institute (ANSI): Washington, DC, USA, 1993.
  29. Poggio, C.; Lombardini, M.; Gaviati, S.; Chiesa, M. Evaluation of Vickers hardness and depth of cure of six composite resins photo-activated with different polymerization modes. J. Conserv. Dent. 2012, 15, 237–241. [Google Scholar] [CrossRef]
  30. Meredith, N.; Sherriff, M.; Setchell, D.J.; Swanson, S.A. Measurement of the microhardness and Young’s modulus of human enamel and dentine using an indentation technique. Arch. Oral Biol. 1996, 41, 539–545. [Google Scholar] [CrossRef]
  31. Esmaeili, B.; Safarcherati, H.; Vaezi, A. Hardness evaluation of composite resins cured with QTH and LED. J. Dent. Res. Dent. Clin. Dent. Prospects 2014, 8, 40–44. [Google Scholar] [CrossRef]
  32. Abuelenain, D.A.; Neel, E.A.A. Surface and mechanical properties of different dental composites. Austin J. Dent. 2015, 2, 1019. [Google Scholar]
  33. Asmussen, E.; Peutzfeldt, A.; Flury, S.; Hayoz, S.; Peutzfeldt, A.; Hüsler, J.; Lussi, A. Depth of cure of resin composites: Is the ISO 4049 method suitable for bulk fill materials? Eur. J. Oral Sci. 2012, 28, 521–528. [Google Scholar] [CrossRef]
  34. Onose, H.; Sano, H.; Kanto, H.; Ando, S.; Hasuike, T. Selected curing characteristics of light-activated composite resins. Dent. Mater. 1985, 1, 48–54. [Google Scholar] [CrossRef]
  35. Asmussen, E.; Peutzfeldt, A. Influence of specimen diameter on the relationship between subsurface depth and hardness of a light-cured resin composite. Eur. J. Oral Sci. 2003, 111, 543–546. [Google Scholar] [CrossRef] [PubMed]
  36. Li, J.; Li, H.; Fok, A.S.L.; Watts, D.C. Multiple correlations of material parameters of light-cured dental composites. Dent. Mater. 2009, 25, 829–836. [Google Scholar] [CrossRef]
  37. Rueggeberg, F.A.; Giannini, M.; Arriais, C.A.G.; Price, R.B.T. Light curing in dentistry and clinical implications: A literature review. Braz. Oral Res. 2017, 31, 64–91. [Google Scholar] [CrossRef] [PubMed] [Green Version]
  38. Palin, W.M.; Leprince, J.G.; Hadis, M.A. Shining a light on high volume photocurable materials. Dent. Mater. 2018, 34, 695–710. [Google Scholar] [CrossRef] [Green Version]
  39. Ilie, N.; Furtos, G. A comparative study of light transmission by various dental restorative materials and the tooth structure. Oper. Dent. 2020, 45, 442–452. [Google Scholar] [CrossRef] [PubMed]
  40. Sartori, N.; Knezevic, A.; Peruchi, L.D.; Phark, J.H.; Sillas Duarte, S.D. Effects of light attenuation through dental tissues on cure depth of composite resins. Acta Stomatol. Croat. 2019, 53, 95–105. [Google Scholar] [CrossRef] [PubMed]
  41. Ilie, N.; Bucuta, S.; Draenert, M. Bulk-fill resin-based composites: An in vitro assessment of their mechanical performance. Oper. Dent. 2013, 38, 618–625. [Google Scholar] [CrossRef] [PubMed]
  42. Wang, R.; Liu, H.; Wang, Y. Different depth-related polymerization kinetics of dual-cure, bulk-fill composites. Dent. Mater. 2019, 35, 1095–1103. [Google Scholar] [CrossRef] [PubMed]
  43. ActivaTM BioActive-RestorativeTM Archives—Pulpdent. Available online: https://www.pulpdent.com/shop/category/activa-bioactive-restorative/ (accessed on 10 December 2019).
  44. Randolph, L.D.; Palin, W.M.; Leloup, G.; Leprince, J.G. Filler characteristics of modern dental resin composites and their influence on physico-mechanical properties. Dent. Mater. 2016, 32, 1586–1599. [Google Scholar] [CrossRef] [PubMed]
  45. Kundie, F.; Azhari, C.H.; Muchtar, A.; Ahmad, Z.A. Effects of filler size on the mechanical properties of polymer-filled dental composites: A review of recent developments. J. Phys. Sci. 2018, 29, 141–165. [Google Scholar] [CrossRef] [Green Version]
  46. Szczesio, A.; Sokołowski, K.; Nowak, J.; Bociong, K.; Kopacz, K.; Sokołowski, J. Wpływ pokrycia powierzchni cementów szkło-jonomerowych powłoką nanokompozytową na ich wybrane właściwości. Dent. Forum 2017, 45, 21–29. [Google Scholar] [CrossRef]
  47. Pameijer, C.H.; Garcia-Godoy, F.; Morrow, B.R.; Jefferies, S.R. Flexural strength and flexural fatigue properties of resin-modified glass ionomers. J. Clin. Dent. 2015, 26, 23–27. [Google Scholar]
  48. Junior, S.A.R.; Ferracane, J.L.; Bona, Á. Della flexural strength and weibull analysis of a microhybrid and a nanofill composite evaluated by 3- and 4-point bending tests. Dent. Mater. 2008, 24, 426–431. [Google Scholar] [CrossRef]
  49. Tanimoto, Y.; Hayakawa, T.; Nemoto, K. Analysis of photopolymerization behavior of UDMA/TEGDMA resin mixture and its composite by differential scanning calorimetry. J. Biomed. Mater. Res. B Appl. Biomater. 2005, 72, 310–315. [Google Scholar] [CrossRef]
  50. Gajewski, V.E.S.; Pfeifer, C.S.; Fróes-Salgado, N.R.G.; Boaro, L.C.C.; Braga, R.R. Monomers used in resin composites: Degree of conversion, mechanical properties and water sorption/solubility. Braz. Dent. J. 2012, 23, 508–514. [Google Scholar] [CrossRef]
  51. Shah, P.K.; Stansbury, J.W.J.W. Role of filler and functional group conversion in the evolution of properties in polymeric dental restoratives. Dent. Mater. 2014, 30, 586–593. [Google Scholar] [CrossRef] [PubMed] [Green Version]
  52. Chung, K.-H.; Greener, E.H. Correlation between degree of conversion, filler concentration and mechanical properties of posterior composite resins. J. Oral Rehabil. 1990, 17, 487–494. [Google Scholar] [CrossRef] [PubMed]
  53. Leprince, J.; Palin, W.M.; Mullier, T.; Devaux, J.; Vreven, J.; Leloup, G. Investigating filler morphology and mechanical properties of new low-shrinkage resin composite types. J. Oral Rehabil. 2010, 37, 364–376. [Google Scholar] [CrossRef] [PubMed]
  54. Leprince, J.G.; Palin, W.M.; Vanacker, J.; Sabbagh, J.; Devaux, J.; Leloup, G. Physico-mechanical characteristics of commercially available bulk-fill composites. J. Dent. 2014, 42, 993–1000. [Google Scholar] [CrossRef] [PubMed]
  55. Ferracane, J.L.; Hilton, T.J. Polymerization stress—Is it clinically meaningful? Dent. Mater. 2016, 32, 1–10. [Google Scholar] [CrossRef]
  56. Van Dijken, J.W.V.; Lindberg, A. A 15-year randomized controlled study of a reduced shrinkage stress resin composite. Dent. Mater. 2015, 31, 1150–1158. [Google Scholar] [CrossRef]
  57. Kleverlaan, C.J.; Feilzer, A.J. Polymerization shrinkage and contraction stress of dental resin composites. Dent. Mater. 2005, 21, 1150–1157. [Google Scholar] [CrossRef]
  58. Bociong, K.; Szczesio, A.; Sokolowski, K.; Domarecka, M.; Sokolowski, J.; Krasowski, M.; Lukomska-Szymanska, M. The Influence of Water Sorption of Dental Light-Cured Composites on Shrinkage Stress. Materials 2017, 10, 1142. [Google Scholar] [CrossRef]
  59. Labella, R.; Lambrechts, P.; Van Meerbeek, B.; Vanherle, G. Polymerization shrinkage and elasticity of flowable composites and filled adhesives. Dent. Mater. 1999, 15, 128–137. [Google Scholar] [CrossRef]
  60. Domarecka, M.; Sokołowska, A.; Szynkowska, M.I.; Sokołowski, K.; Sokołowski, J.; Łukomska-Szymańska, M. Wybrane właściwości materiałów kompozytowych typu flow o niskim skurczu polimeryzacyjnym. Przem. Chem. 2014, 93, 775–778. [Google Scholar] [CrossRef]
  61. Gonalves, F.; Azevedo, C.L.N.; Ferracane, J.L.; Braga, R.R. BisGMA/TEGDMA ratio and filler content effects on shrinkage stress. Dent. Mater. 2011, 27, 520–526. [Google Scholar] [CrossRef]
  62. Mucci, V.L.; Arenas, G.F.; Pérez, C.J.; Vallo, C.I. Prepolymerized organic-inorganic hybrid nanoparticles as fillers for light-cured methacrylate monomers. J. Mater. Sci. 2012, 47, 2951–2959. [Google Scholar] [CrossRef]
  63. Kwon, T.Y.; Ha, J.Y.; Chun, J.N.; Son, J.S.; Kim, K.H. Effects of prepolymerized particle size and polymerization kinetics on volumetric shrinkage of dental modeling resins. Biomed Res. Int. 2014, 2014, 914739. [Google Scholar] [CrossRef]
  64. Satterthwaite, J.D.; Maisuria, A.; Vogel, K.; Watts, D.C. Effect of resin-composite filler particle size and shape on shrinkage-stress. Dent. Mater. 2012, 28, 609–614. [Google Scholar] [CrossRef] [PubMed]
  65. Pfeifer, C.S.; Shelton, Z.R.; Braga, R.R.; Windmoller, D.; MacHado, J.C.; Stansbury, J.W. Characterization of dimethacrylate polymeric networks: A study of the crosslinked structure formed by monomers used in dental composites. Eur. Polym. J. 2011, 47, 162–170. [Google Scholar] [CrossRef] [PubMed] [Green Version]
  66. Soares, C.J.; Faria-E-Silva, A.L.; de Paula Rodrigues, M.; Fernandes Vilela, A.B.; Pfeifer, C.S.; Tantbirojn, D.; Versluis, A. Polymerization shrinkage stress of composite resins and resin cements—What do we need to know? Braz. Oral Res. 2017, 31, 49–63. [Google Scholar] [CrossRef] [PubMed] [Green Version]
  67. Pereira, R.D.; Valdívia, A.D.C.M.; Bicalho, A.A.; Franco, S.D.; Tantbirojn, D.; Versluis, A.; Soares, C.J. Effect of photoactivation timing on the mechanical properties of resin cements and bond strength of fiberglass post to root dentin. Oper. Dent. 2015, 40, E206–E221. [Google Scholar] [CrossRef] [PubMed] [Green Version]
Figure 1. Schematic diagram of the cylindrical sample (diameter of 6 mm and thickness of 3 mm) used for the microhardness test. The top surface was cured according to the manufacturer’s instruction. The microhardness and reduced modulus of the external surfaces (0 µm—top sample’s surface; 3000 µm—bottom sample’s surface) and cross-section (675, 1250, and 1925 µm) of the sample were tested.
Coatings 11 01255 g001
Figure 2. Schematic diagram of the photoelastic test. 1—light source, 2—polarizer, 3—quarter-wave plate, 4—samples (photoelastically sensitive plates of epoxy resin filled with tested materials), 5—quarter-wave plate, 6—analyzer, and 7—digital camera.
Coatings 11 01255 g002
Figure 3. Box and whisker plot of three-point bending flexural strength (TPB). Statistically significant differences were detected between (a*) Activa Bioactive-Restorative vs. (a) Rebilda DC (p = 0.0075), (a) Multicore Flow (p = 0.0173), and (a) G-aenial Universal Flo (p-value = 0.0008); (b*) Fill-Up! vs. (b) G-aenial Universal Flo (p = 0.0270). The results with the same assigned letter show a statistical difference.
Coatings 11 01255 g003
Figure 4. The box and whisker plot of the modulus of elasticity in bending (TPB modulus). Statistically significant differences were detected between: (a*) Activa Bioactive--Restorative vs. (a) Multicore Flow (p = 0.0216), (a) Filtek Bulk Fill Posterior (p = 0.0001), and (a) Charisma Classic (p = 0.0017); (b*) Fill-Up! vs. (b) Filtek Bulk Fill Posterior (p = 0.0068). The results with the same assigned letter show a statistical difference.
Coatings 11 01255 g004
Figure 5. Example stress–strain diagrams for the tested materials obtained via the three-point bending test.
Coatings 11 01255 g005
Figure 6. The box and whisker plot of diametral tensile strength (DTS). Statistically significant differences were detected between (a*) Charisma Classic vs. (a) Activa Bioactive-Restorative (p = 0.0025) and (a) Rebilda DC (p = 0.0274). The results with the same assigned letter show a statistical difference.
Coatings 11 01255 g006
Figure 7. Example load–displacement diagrams for the tested materials obtained via the diametral tensile strength test.
Coatings 11 01255 g007
Figure 8. The box and whisker plot of the Vickers hardness of tested materials. Statistically significant differences were detected between: (a*) Activa Bioactive-Restorative vs. (a) Multicore Flow (p-value < 0.00005), (a) Fill-Up! (p = 0.0013), (a) Filtek Bulk Fill Posterior (p-value < 0.00005), (a) G-aenial, (a) Universal Flo (p = 0.0233), and (a) Charisma Classic (p-value = 0.0000); (b*) Rebilda DC vs. (b) Filtek Bulk Fill Posterior (p = 0.0057); (c*) Multicore Flow vs. (c) Bulk EZ (p = 0.0284) and (c) StarFill 2B (p = 0.0056); (d*) Bulk EZ vs. (d) Filtek Bulk Fill Posterior (p-value < 0.00005) and (d) Charisma Classic (p = 0.0170); (e*) StarFill 2B vs. (e) Filtek Bulk Fill Posterior (p-value < 0.00005) and (e) Charisma Classic (p = 0.0032). The results with the same assigned letter show a statistical difference.
Coatings 11 01255 g008
Figure 9. The box and whisker plot of the shrinkage stress of the tested materials. Statistically significant differences were detected between: (a*) Rebilda DC vs. (a) Bulk EZ (p-value = 0.033513) and (a) Charisma Classic (p-value = 0.003128); (b*) G-aenial Universal Flo vs. (b) Bulk EZ (p-value = 0.002197), (b) Filtek Bulk Fill Posterior (p-value = 0.023652), and (b) Charisma Classic (p-value = 0.000136). The results with the same assigned letter show a statistical difference.
Coatings 11 01255 g009
Table 1. The composition of tested materials.
MaterialManufacturerTypeCompositionCuring Time (s)
Activa Bioactive-RestorativePulpdent Corporation, Watertown, USADual-Curing flowable compositeBlend of diurethane and other methacrylates with modified polyacrylic acid (44.6%), amorphous silica, sodium fluoride,20
Rebilda DCVoco, Cuxhaven, GermanyDual-Curing flowable compositeDDDMA, bis-GMA, bis-GMA, UDMA, HEDMA, BHT, silica (77% filler), BPO and camphorquinone/amine initiator system20
MultiCore FlowIvoclar Vivadent, Schaan, LiechtensteinDual-Curing flowable compositeBis-GMA, UDMA, TEGDMA, barium glass fillers, Ba–Al–fluorosilicate glass, highly dispersed silicon dioxide, ytterbium trifluoride (55% filler)10
Bulk EZDenville Materials, San Ramon, CA, USADual-Curing Bulk Fill CompositeEthoxylated bisphenol dimethacrylate esters (6–33%), TEGDMA (2–10%), bis-GMA (1–8%), UDMA (0.1–6), barium glass (50–70%), YbF3 (1–20%)10
Fill-Up!Coltene, Altstätten, SwitzerlandDual-Curing Bulk Fill CompositeTEGDMA, TMPTMA, bis-GMA, zinc-oxide-coated dental glass, dibenzoyl peroxide, benzoyl peroxide, amorphous silicic acid10
StarFill 2BDenville Materials, Carlsbad, CA, USADual-Curing micro hybrid flowable compositeBis-GMA, barium glass (61% filler)20
Filtek Bulk Fill Posterior3M ESPE, St. Paul, MN, USABulk Fill CompositeBis-GMA, bis-EMA, UDMA, and Procrylat; zirconia/silica with a particle size range of 0.01–3.5 microns (average: 0.6 microns), and ytterbium trifluoride particles with a size range of 0.1–5 microns: 64 wt.%/42.5 vol.%20
G-aenial Universal FloGC Corporation, Toriimatsu-cho, JapanFollowable compositeUDMA, bis-MePP, TEGDMA silicon dioxide (16 nm), strontium glass (200 nm) 50 vol.%10
Charisma ClassicHeraeus, Hanau, GermanyUniversal hybrid compositeBis-GMA, barium aluminum fluoride glass, 0.005–10 μm, pre-polymerized filler 61 vol.%20
All concentrations are in percent by weight. TEGDMA—triethylene glycol dimethacrylate, bis-GMA—bisphenol A glycol dimethacrylate, UDMA—urethane dimethacrylate, TMPTMA—trimethylolpropane trimethacrylate, DDDMA—decanediol dimethacrylate, HEDMA—1,6-exanodiol dimethacrylate, Bis-EMA—bisphenol A ethoxylate dimethacrylate, bis-MePP—bisphenol A ethoxylate dimethacrylate.
Table 2. Distribution of average values with standard deviations of microhardness determined by the nanoindentation method of the top (0 µm), bottom (3000 µm), and cross-section (675, 1250, and 1925 µm) of tested material samples.
Depth of Cure [µm]Microhardness [GPa]
Activa Bioactive-RestorativeRebilda DCMultiCore FlowBulk EZFill Up!StarFill 2BFiltek Bulk Fill PosteriorG-aenial Universal FloCharisma Classic
00.32 ± 0.020.25 ± 0.010.09 ± 0.030.05 ± 0.020.02 ± 0.010.54 ± 0.040.73 ± 0.030.50 ± 0.020.52 ± 0.05
6750.60 ± 0.100.46 ± 0.090.68 ± 0.150.42 ± 0.070.61 ± 0.100.89 ± 0.041.5 ± 0.250.98 ± 0.081.10 ± 0.22
12500.93 ± 0.110.66 ± 0.010.98 ± 0.021.18 ± 0.110.69 ± 0.090.95 ± 0.100.97 ± 0.161.13 ± 0.041.35 ± 0.20
19250.33 ± 0.080.49 ± 0.050.62 ± 0.030.86 ± 0.110.82 ± 0.080.88 ± 0.090.87 ± 0.020.94 ± 0.151.05 ± 0.19
30000.17 ± 0.020.04 ± 0.010.31 ± 0.040.08 ± 0.010.07 ± 0.010.37 ± 0150.62 ± 0.060.37 ± 0.030.50 ± 0.05
Table 3. Distribution of average values with standard deviations of reduced Young’s modulus determined by the nanoindentation method of the top (0 µm), bottom (3000 µm), and cross-section (675, 1250, and 1925 µm) of tested material samples.
Depth of Cure [µm]Reduced Young’s Modulus [GPa]
Activa Bioactive-RestorativeRebilda DCMultiCore FlowBulk EZFill Up!StarFill 2BFiltek Bulk Fill PosteriorG-aenial Universal FloCharisma Classic
05.83 ± 1.413.64 ± 1.333.94 ± 0.951.33 ± 0.721.36 ± 0.178.29 ± 0.239.86 ± 0.358.14 ± 0.057.95 ± 0.19
6757.70 ± 1.397.40 ± 1.4410.73 ± 0.178.49 ± 1.338.47 ± 0.3611.22 ± 0.7213.43 ± 1.2413.85 ± 0.7615.21 ± 1.56
125014.09 ± 2.608.08 ± 1.2814.44 ± 1.2116.10 ± 1.039.34 ± 0.6712.30 ± 0.6311.22 ± 1.0313.51 ± 0.6718.88 ± 1.18
19255.72 ± 0.055.57 ± 0.7813.75 ± 1.7314.39 ± 2.1811.52 ± 0.8011.58 ± 0.6111.47 ± 0.0113.45 ± 0.7117.22 ± 1.32
30003.75 ± 0.230.72 ± 0.116.33 ± 1.092.56 ± 0.252.71 ± 0.227.47 ± 0.567.69 ± 0.195.98 ± 0.346.80 ± 0.64
Publisher’s Note: MDPI stays neutral with regard to jurisdictional claims in published maps and institutional affiliations.

