Article

Top Coating Anti-Erosion Performance Analysis in Wind Turbine Blades Depending on Relative Acoustic Impedance. Part 1: Modelling Approach

1
Research Institute of Design, Innovation and Technology, University CEU Cardenal Herrera, CEU Universities, Avda. Seminario S/N, Moncada, 46115 Valencia, Spain
2
AEROX Advanced Polymers, Pobla Vallbona, 46185 Valencia, Spain
*
Author to whom correspondence should be addressed.
Coatings 2020, 10(7), 685; https://doi.org/10.3390/coatings10070685
Submission received: 10 June 2020 / Revised: 7 July 2020 / Accepted: 9 July 2020 / Published: 16 July 2020
(This article belongs to the Special Issue Recent Trends in Coatings and Thin Film–Modeling and Application)

Abstract

:
Top coating are usually moulded, painted or sprayed onto the wind blade Leading-Edge surface to prevent rain erosion due to transverse repeated droplet impacts. Wear fatigue failure analysis based on Springer model has been widely referenced and validated to quantitatively predict damage initiation. The model requires liquid, coating and substrate speed of sound measurements as constant input parameters to define analytically the shockwave progression due to their relative vibro-acoustic properties. The modelling assumes a pure elastic material behavior during the impact event. Recent coating technologies applied to prevent erosion are based on viscoelastic materials and develop high-rate transient pressure build-up and a subsequent relaxation in a range of strain rates. In order to analyze the erosion performance by using Springer model, appropriate impedance characterization for such viscoelastic materials is then required and represents the main objective of this work to avoid lack of accuracy. In the first part of this research, it is proposed a modelling methodology that allows one to evaluate the frequency dependent strain-stress behavior of the multilayer coating system under single droplet impingement. The computational tool ponders the operational conditions (impact velocity, droplet size, layer thickness, etc.) with the appropriate variable working frequency range for the speed of sound measurements. The second part of this research defines in a complementary paper, the ultrasonic testing characterization of different viscoelastic coatings and the methodology validation. The modelling framework is then used to identify suitable coating and substrate combinations due to their acoustic matching optimization and to analyze the anti-erosion performance of the coating protection system.

1. Introduction

Rain erosion damage, caused by repeated droplet impact on wind turbine blades, is a major cause for concern, even more so at offshore locations with larger blades and higher tip speeds, see Figure 1. In most cases, since the surface protection plays a decisive role in the blade manufacture and overall performance, it has been identified as an area where a solution may be obtained. There are various protection solutions used by industry that can reduce the effect of erosion and increase the turbine expected lifetime. Four main surface protection technologies may be considered: In-mould coatings (Gel coating) applied during moulding on the entire blade surface but not specifically on the Leading Edge location where the protection is crucial; post-mould coatings specifically developed for Leading Edge Protection (LEP) and considering a multilayer system with optional configurations based on top-coatings, filler and primer materials, depending on blade manufacturing and operational settings; tapes based on post-mould applications circumventing the issues related with liquid-based materials; shells that as tapes are manufactured in controlled conditions and applied in pre-cast solid modules over the Leading Edge surface. In order to analyze and evaluate the relative positive facts and faults of a given protection system, we will consider the common issues related with rain erosion failure for any of these technologies.
Industrial processes state that LEP systems can be outlined as a multi-layered system with varying layer thickness and material configurations. A particular case, used here to sketch the problem, with a post-mould coating-based LEP system is shown where the blade manufacturer includes a putty layer between the composite laminate and the coating, see Figure 2. It also can be included a primer layer under the coating and over the filler to improve adhesion mainly to avoid layer debonding and circumvent application related defects.
In the top coating material system, two main different types of erosion failure are mainly observed (see Figure 3) in used Rain Erosion Testing coupons: pits and cracks that progress with mass loss caused by direct impact and stress on surface and delamination indirectly caused by the interface stresses [1,2].
The analysis of erosion caused by rain droplets is considered, as first approach, a single impact event as it is shown in Figure 4. The damage is in fact a 3D dynamic consequence resulting in the propagation of shock waves [3,4]. The droplet numerical modelling has been broadly studied by different authors [5,6,7,8]. As the water droplet impinges on the surface, a longitudinal compressional normal stress wave front in the top surface material further advances towards the coating-substrate interface, where a portion of the stress wave is reflected back into the coating with a different amplitude (depending on the relative material acoustic impedance) and yields a transverse shear wave. The remaining part is transmitted to the substrate. The impact gives rise to a third wave due to the water droplet deformation itself, called the Rayleigh wave, which is confined to the surface of the top coating. Depending on the relative acoustic properties through the liquid-coating-substrate, the propagation of the stresses and, consequently, the erosion lifetime can be optimized.
The analysis (or design) of Leading-Edge Protection systems depends on the material properties in the configuration and the operational load to which it is designed during its realistic life, that is, it must be able to withstand accelerated loads and also fatigue field regimes [6,9]. To make a selection or design of a specific coating protection system, appropriate modelling requires to be defined [10,11,12]. Numerical or analytical models can be constructed with their own capabilities and limitations, [13,14,15].
Springer analytical model [13] has been widely referenced and industry validated [15]. The model quantitatively predicts the erosion lifetime of coated materials under the previously untested conditions. The model is limited to erosion failures such as progressive failure mode or coating wear. To use the Springer model, material test data is needed to derive the erosion performance properties of a selected system. The formulation examines the impact of a liquid droplet treating the problem only as a pure elastic 1D tensile-compression event. This simplification is applicable since shear stresses and shear material characterization directly related with other important damage mechanisms as peeling, debonding, delamination or crack evolution are out of the wear fatigue analysis case involved.
Wear fatigue failure analysis based on Springer model requires coating and substrate speed of sound measurements as input material parameters. The model does not account for a very high-rate transient pressure build-up and the viscoelastic effects are frequency dependent for the materials involved [16,17,18]. The main objective of this research is to fully apply the Springer model but considering the effect of the viscoelastic stress-strain development during the impact event in the LEP multilayer system by means of the appropriate frequency range definition for the coating layer impedance characterization.
In this work, as the first part of the research, it is proposed a modelling methodology that allows one to evaluate the single droplet impingement taking into consideration the highly transient material behavior during waterdrop collisions. The computational tool ponders with different application cases the operational conditions (impact velocity, droplet size, layer thickness, etc.) with the variable working frequency range that the material develops. We will introduce in this work a complementary numerical modelling tool (developed in openmodellica [19]) including suitable material models that allow us to observe the viscoelastic behavior (with consideration for high transient strain rate deformation, and variable stiffness and damping with frequency) and not as a pure elastic event. The complete analysis is used then to define the frequency range for the corresponding impedance measurements with Ultrasonic testing. The paper is organized considering first a review of the aforementioned Springer erosion lifetime prediction modelling, then the state of the art is completed for taking into account the viscoelastic effects of the stress-strain development under single droplet impingement for elastomeric materials. In last sections, different modelling analysis cases are discussed to ponder the effect of the operational and material configurations on the frequency range definition for appropriate material properties testing.
The coating characterization is developed in a second part of the research in a complementary reference [20] for different viscoelastic coatings and the methodology validated for the input material data definition of the erosion lifetime modelling based on Springer.
In this research the model is used then to carry out studies as a computational framework that allows a parametric analysis to examine the impact of the selected coating impedance variation on the erosion performance. This provides also a guidance in the selection and modulation of coating properties and to identify suitable coating and substrate combinations due to their acoustic matching optimization. At this point, the proposed modelling methodology should reduce the scope of Rain Erosion Testing [21,22] to verify and evaluate the rain erosion resistance of coating systems.

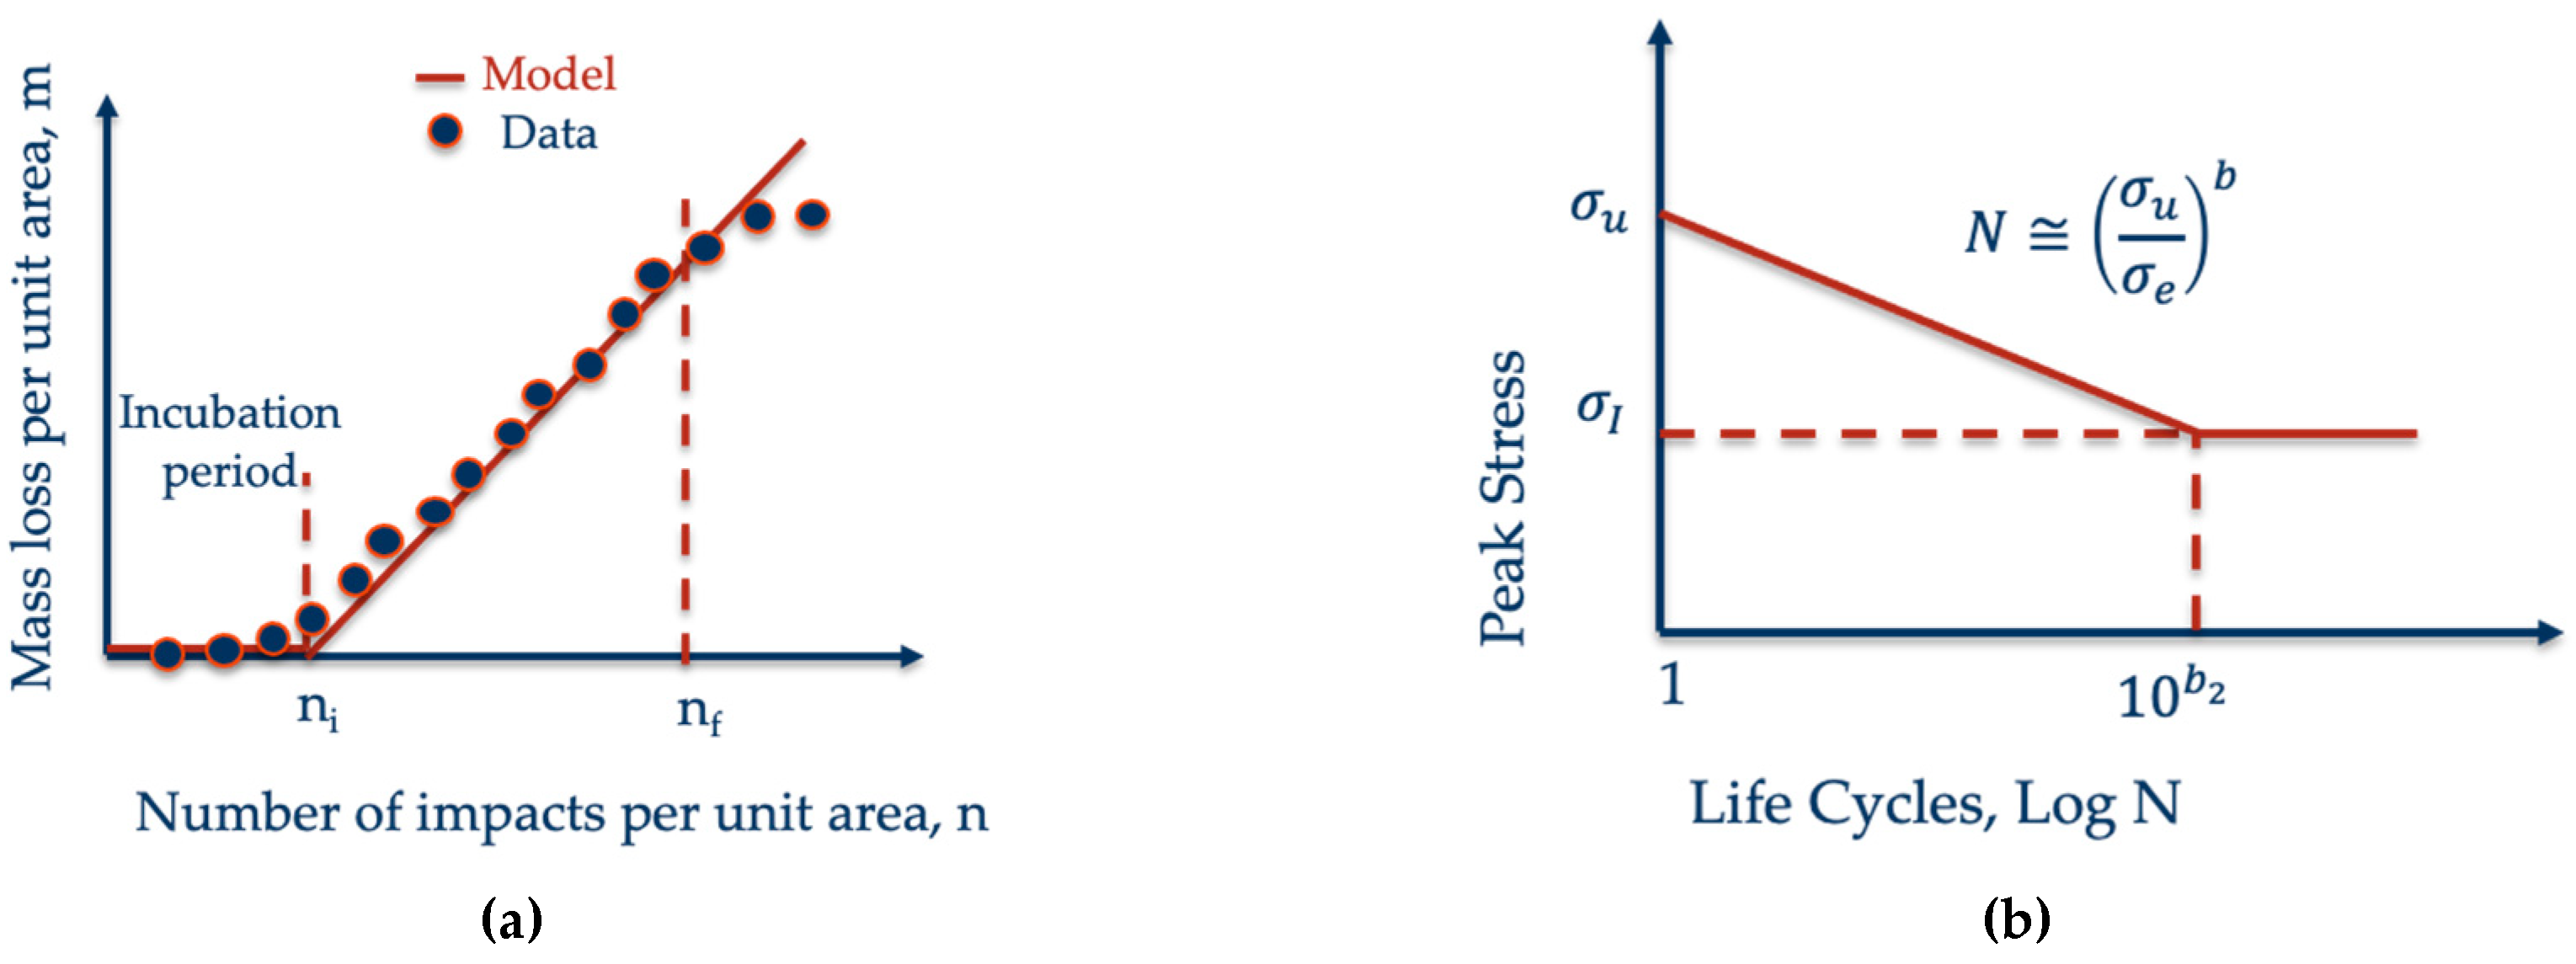
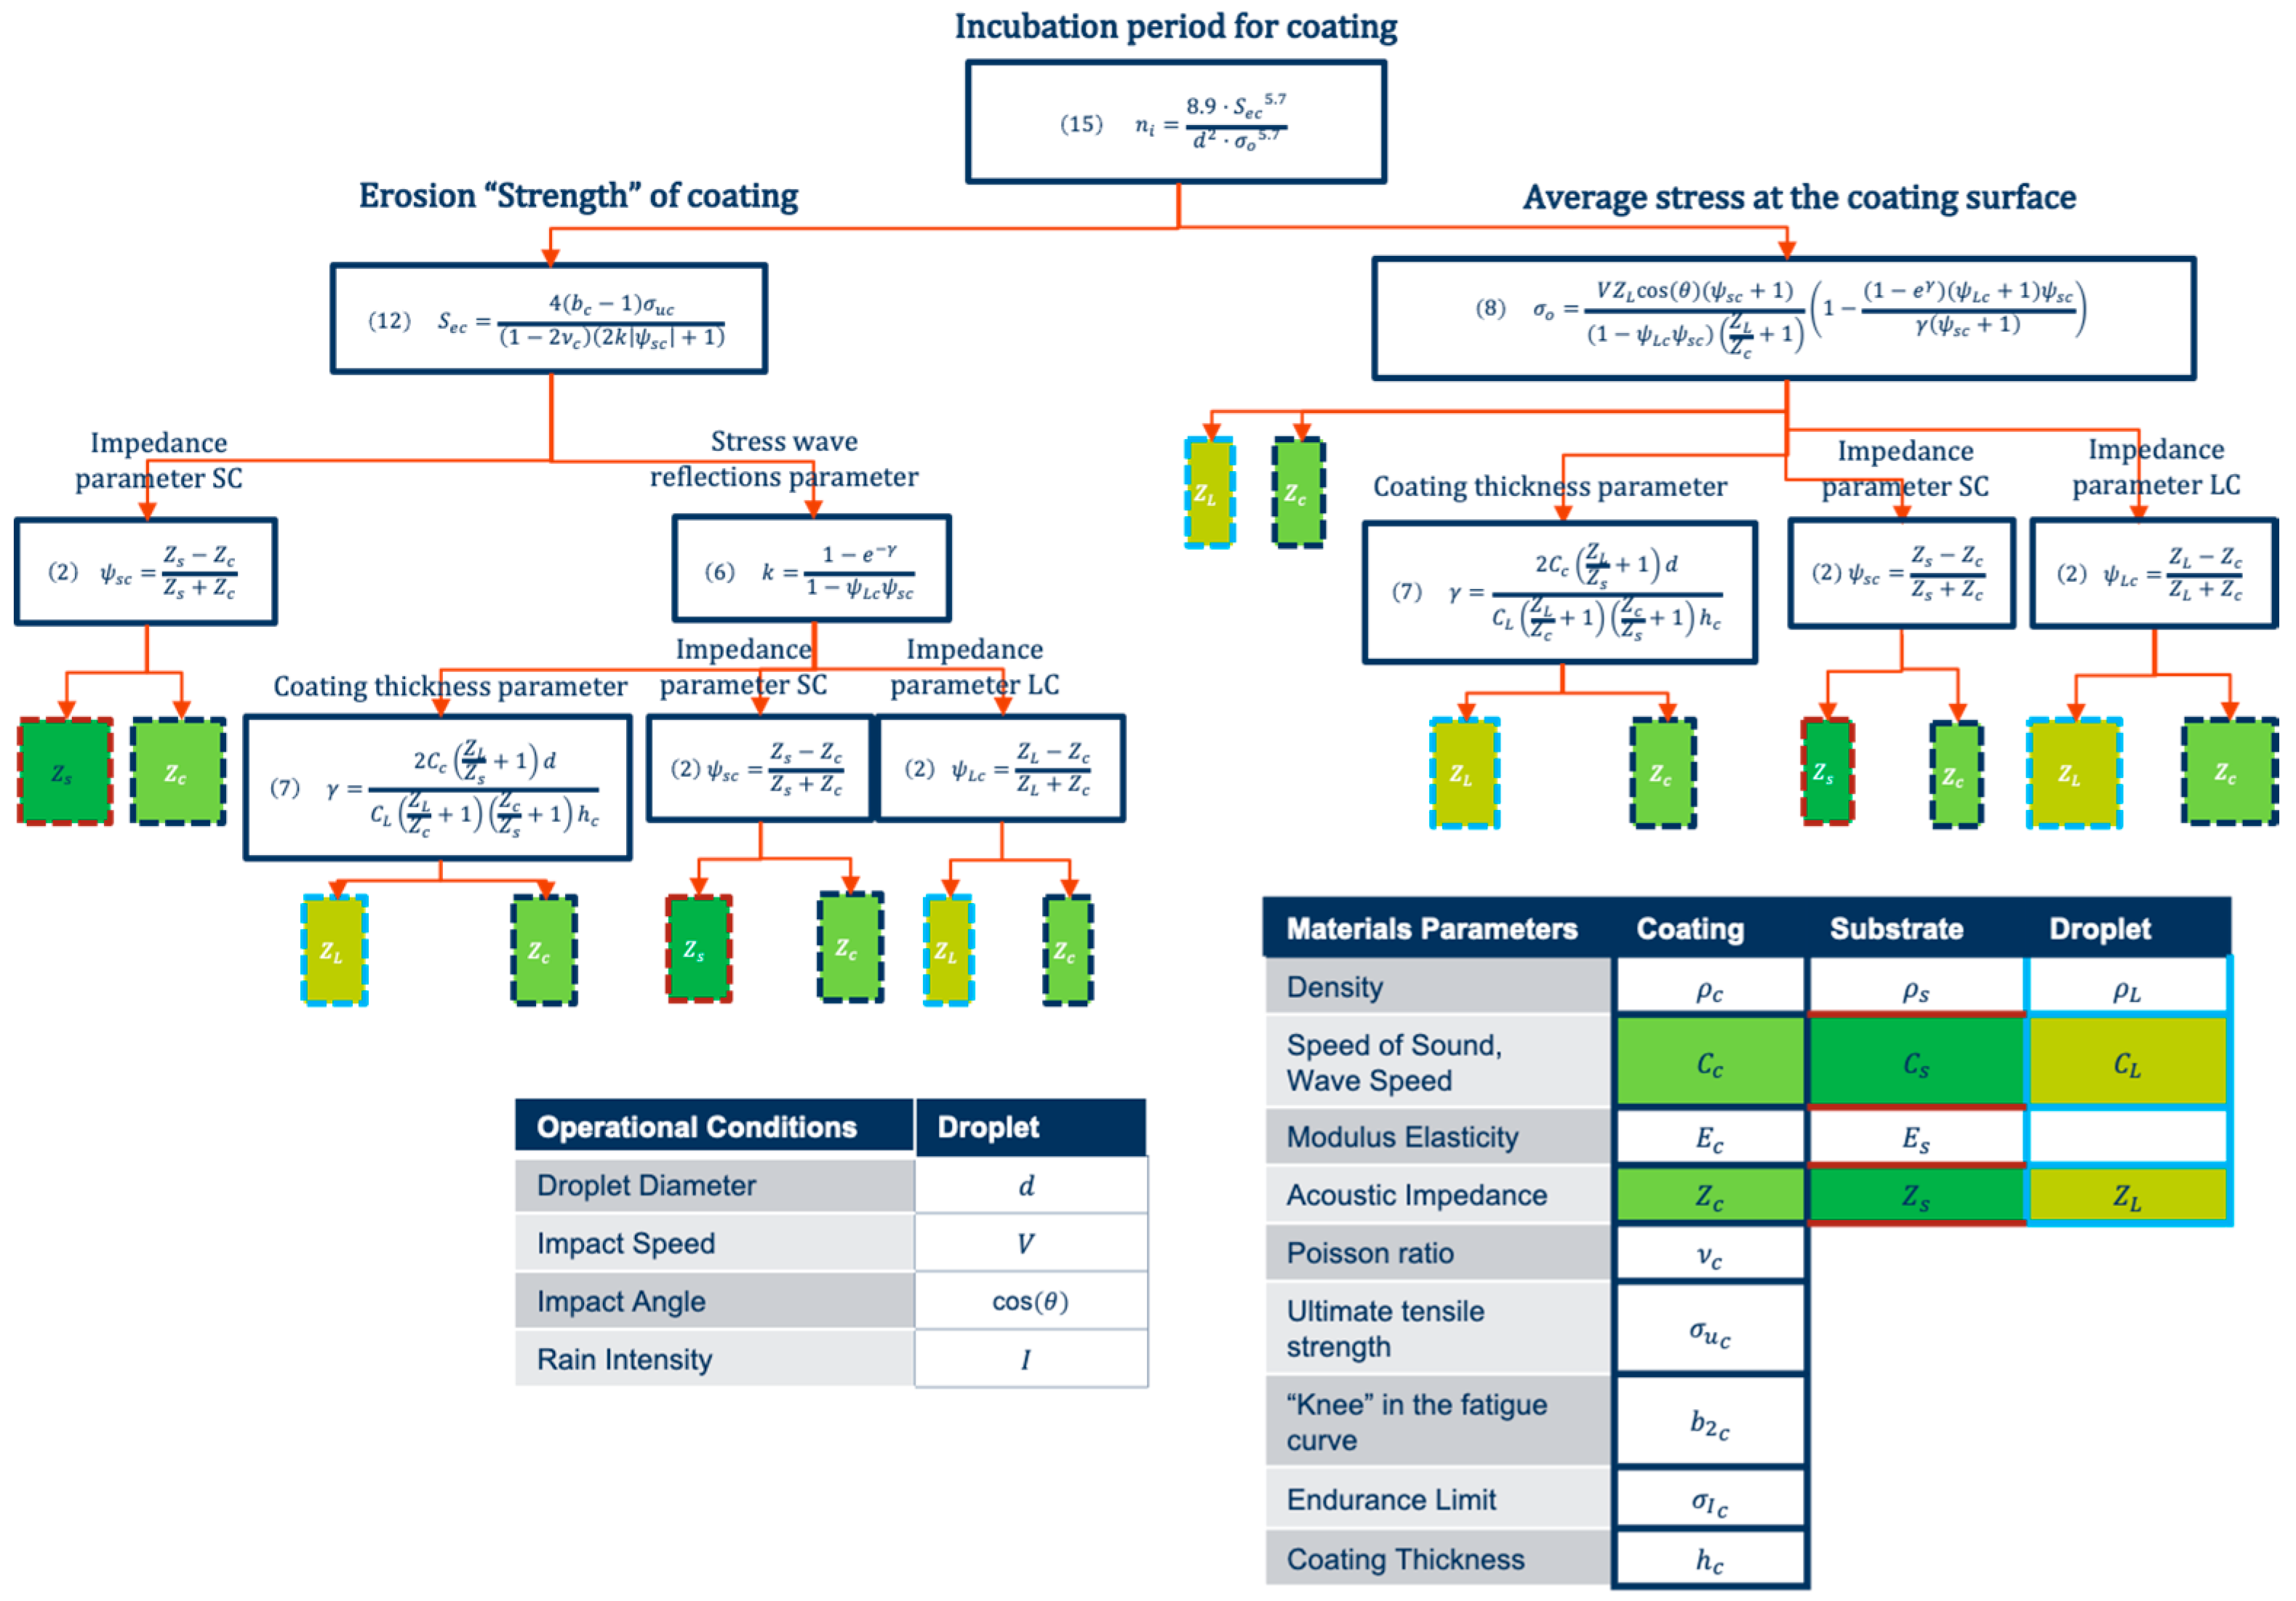
2. Wear Erosion Lifetime Prediction Modelling from Fundamental Material Properties. A Review of Springer Model

In this section a review of the Springer model is exposed in order to be used in the next sections for wear erosion lifetime analysis depending on the material impedance measurements as input modelling data.
The progression of erosion can be experimentally measured with applicable Rain Erosion Testing. One method is in terms of the average erosion depth versus time or mass loss versus time (directly related to the number of impacts, see Figure 5). There is initially an incubation period in which damage progresses without perceptible change in the material weight loss. After a sufficient amount of fatigue degradation has accumulated, the material tends to lose mass with a constant erosion rate. This marks the end of the incubation period and a steady mass loss period begins, where the weight loss varies nearly linearly with time.
Springer analytical model [13] quantitatively predicts the erosion of coated materials under the previously untested conditions. The erosion evolution can be approximated by two straight lines as depicted in Figure 5 with
m = 0 0 < n i c m = α c ( n n i c ) n i c   <   n   <   n f c
where the mass loss m produced by a given number of droplets impacts n, can be estimated once the incubation time of the coating n i c and the slope of the erosion rate on the coating α c are identified.
In order to establish these parameters, the stress history of the coating and the substrate is assessed analytically. It is affected by the shockwave progression due to the vibro-acoustic properties of each layer, and by the frequency of the repeated water droplet impacts (see Figure 6).
Upon impingement on the coating, two different wave fronts travel into the liquid and coating respectively. The wave front in the coating further advances towards the coating-substrate interface, where a portion of the stress wave is reflected back into the coating and the remaining part is transmitted to the substrate. Due to this reflection a new wave is now advancing in the coating with a different amplitude depending on the relative acoustic impedances of the coating and substrate,
φ L c = Z L Z c Z L + Z c ; φ s c = Z s Z c Z s + Z c
where Z = ρ C is the impedance of the material, ρ is the density and C the elastic wave speed (the speed of sound of the medium). ZL, ZC, and ZS are the elastic impedances of the consecutive materials (i.e., in our problem they are the liquid (L), coating (C), and substrate (S) layers). φ L c defines the relative impedance parameter defined on the liquid-coating interface and φ s c on the substrate-coating one.
This 1D formulation, see Figure 6, examines only the normal impact of a liquid droplet with diameter d, onto a two layered structure with the first layer formed by the coating and the second layer by the substrate (assumed semi-infinite) with thickness h s > 2 d C s C L , which means in fact that the reflections from a subsequent substrate additional layers are not considered in the fatigue analysis.
The magnitude of the traveling waves propagating upwards the coating-liquid interface, and traveling waves propagating downwards the coating-substrate interface, are expressed with the k number of reflections as depicted in Figure 6:
σ 2 k σ 1 = 1 + φ s c 1 φ s c φ L c [ 1 ( φ s c φ L c ) k ] σ 2 k 1 σ 1 = σ 2 k σ 1 φ s c ( φ s c φ L c ) k 1
where the Water-hammer Pressure defines the initial impact pressure σ 1 = P
P = V Z L cos ( θ ) ( Z L Z c + 1 )
That depends on the droplet impact speed V and its impact angle with cos ( θ ) . The stabilized stress at the interface coating-substrate can be approximated as
σ = σ 1 lim k σ 2 k = σ 1 1 + φ s c 1 φ s c φ L c = σ 1 1 + Z L Z c 1 + Z L Z s
After a long enough period of time, the stresses at both the coating surface and the substrate interface approaches to the constant value σ , which is also the stress that would occur in the substrate after impingement in the absence of the coating layer. An example on its use within the project is depicted on Figure 7. One can obtain an analytical value of the stress evolution on the coating during the droplet impact. It is an alternative simplified computation to the algorithm presented in the previous section based on a 3D numerical modelling.
To evaluate the average stress values at the coating-liquid and coating-substrate interfaces during the duration of the impact, it is introduced a parameter k that depends on the average number of reflections in the coating layer
k = 1 e γ 1 ψ L c ψ s c
where the coating thickness hc enters its computation through the parameter γ that depends on it and also on the droplet diameter d. It may be calculated as
γ = 2 C c ( Z L Z s + 1 ) d C L ( Z L Z c + 1 ) ( Z c Z s + 1 ) h c
Finally, the average stress on the coating surface at x = 0 is defined with σ o as
σ o = P ( ψ s c + 1 ) ( 1 ψ L c ψ s c ) ( 1 ( 1 e γ ) ( ψ L c + 1 ) ψ s c γ ( ψ s c + 1 ) ) σ o = V Z L cos ( θ ) ( ψ s c + 1 ) ( Z L Z c + 1 ) ( 1 ψ L c ψ s c ) ( 1 ( 1 e γ ) ( ψ L c + 1 ) ψ s c γ ( ψ s c + 1 ) )
If the value of the relative impedance parameter of the substrate-coating interface equals zero, ψ s c = 0 , so the coating material is considered the same as the substrate, and this expression reduces to σ o = σ 1 = P that may be used to compute the average stress for homogeneous materials.
The average stress on the coating-substrate interface at x = h is defined then with σ h as
σ h = P ( ψ s c + 1 ) ( 1 ψ L c ψ s c ) ( 1 ( 1 e γ ) ψ L c ψ s c γ ) σ h = V Z L cos ( θ ) ( ψ s c + 1 ) ( Z L Z c + 1 ) ( 1 ψ L c ψ s c ) ( 1 ( 1 e γ ) ψ L c ψ s c γ )
And, as above, if the value of the relative impedance parameter of the substrate-coating interface equals zero,   ψ s c = 0 , so the coating material is considered the same as the substrate, this expression reduces to σ o = σ h = P .
The incubation period of time neglecting mass loss prior the erosion develops at a given rate, as depicted in Figure 5, is analyzed with fatigue concepts. It may be estimated applying Miner’s rule to the impingement force cycles and considering the averaged stress values with the equivalent dynamic stress σ e per unit area on the impact locations, see Figure 5c.
An approximation value for the fatigue life N is then given by a function of the equivalent dynamic stress σ e
N = ( σ u c σ e ) b c b c = b 2 c l o g 10 ( σ u c σ I c )
where the subscript c indicates to the coating material, bc defines the fatigue slope, b2c matches to the “knee” in the fatigue curve (that may be estimated with its endurance limit σ I ) and the coating ultimate tensile strength σ u c is defined for N = 1.
A parameter of the material “strength” S c is introduced with a semi-empirical approach and depends on the poison coefficient ν c (included to consider the location of the impact force on the radial averaged stress), and other relevant properties of both the coating material and substrate treated previously,
S c = 4 ( b c 1 ) σ u c ( 1 2 ν c ) [ 1 ( σ I c σ u c ) b c 1 ] S c = 4 ( b c 1 ) σ u c ( 1 2 ν c )
An important issue for fatigue analysis is how to consider the effect of the fatigue slope parameter for the coating b c since it is difficult to obtain experimentally for typical LEP elastomeric materials. Equation (11) may be simplified assuming that σ I c   <   σ u c and b c 1 .
It may be stated as an equivalent erosion resistance parameter for the coating S e c including the damping effect of the coating described previously by means of the average number of reflections k and the relative impedance parameter ψ s c that acts on the interface wave reflections,
S e c = 4 ( b c 1 ) σ u c ( 1 2 ν c ) ( 2 k | ψ s c | + 1 )
Fatigue life of the material is then estimated with the number of impacts during the incubation time period as
n i c * = a 1 ( S e c σ o ) a 2
where a1 and a2 can be considered determined constants that may be fitted experimentally, S e c represents the erosion strength of the material and depends on its fundamental properties defined in Equation (12) and the averaged stress of the coating surface during the impact event defined in Equation(8). In [1], the parameter values where defined as
n i c * = 7 × 10 6 ( S e c σ o ) 5 , 7
That may also be expressed in terms of the number impacts per site when considering the circular projected area of the droplet with a given diameter d
n i c = 8.9 d 2 ( S e c σ o ) 5 , 7
where using appropriates units allow one to predict the number of impacts per m2 at which the coating material starts to develop erosion with a given erosion rate that may also be computed from the previous estimated parameters as
α c = 7.3310 5 d 3 ρ c σ o 4 S e c 4
The equivalent analysis may be used to determine the erosion strength at interface coat-substrate instead of surface. Accordingly, Equations (11) and (15) are written introducing the fundamental properties of the substrate as
n i h = 8.9 d 2 ( S e s σ h ) 5 , 7 S e s = 4 ( b s 1 ) σ u s ( 1 2 ν s ) [ 1 ( σ I s σ u s ) b s 1 ] ( 2 k | ψ s c | + 1 ) 4 ( b s 1 ) σ u s ( 1 2 ν s ) ( 2 k | ψ s c | + 1 )
As we have previously stated from [13] in order to predict the incubation time and the mass removal rate, the stress history in the coating and in the substrate has to be identified analytically or numerically. It is affected by the shockwave progression due to the vibro-acoustic properties of each layer, and by the time interval of the repeated water droplet impacts. Fatigue life of the material is then calculated, and the model can be applied to estimate the stress at different locations through the thickness, i.e., the coating surface or at the coating–substrate interface. Nevertheless, it is assumed that the bond and adhesion of the boundary interface is ideally perfect, so the modelling does not account for the microstructural imperfections and lack of adhesion of such interfaces and does not account either for the shear stresses developed on the 3D impact event.
Considering for previous assumptions, the method has been applied successfully for wear erosion damage in [15]. In that case, the erosion strength of the coating material defined in Equation (12) was empirically obtained by means of the RET (Rain Erosion Testing) testing as a unique value instead of obtaining the fundamental properties values separately.
Figure 8 shows a complete map of the liquid droplet, coating LEP and substrate (primer or filler) material impedances as input parameters of the modelling with the related equations previously stated. The impedance of the LEP thin coating and substrate materials need to be characterized and used as input data in the modelling. The appropriate variable working frequency range depending on the impact and material settings is analysed in next section and defined so the corresponding impedance characterization with Ultrasonic testing for such measurements.

3. Single Droplet Impact Modelling Considering Viscoelastic Material Characterization

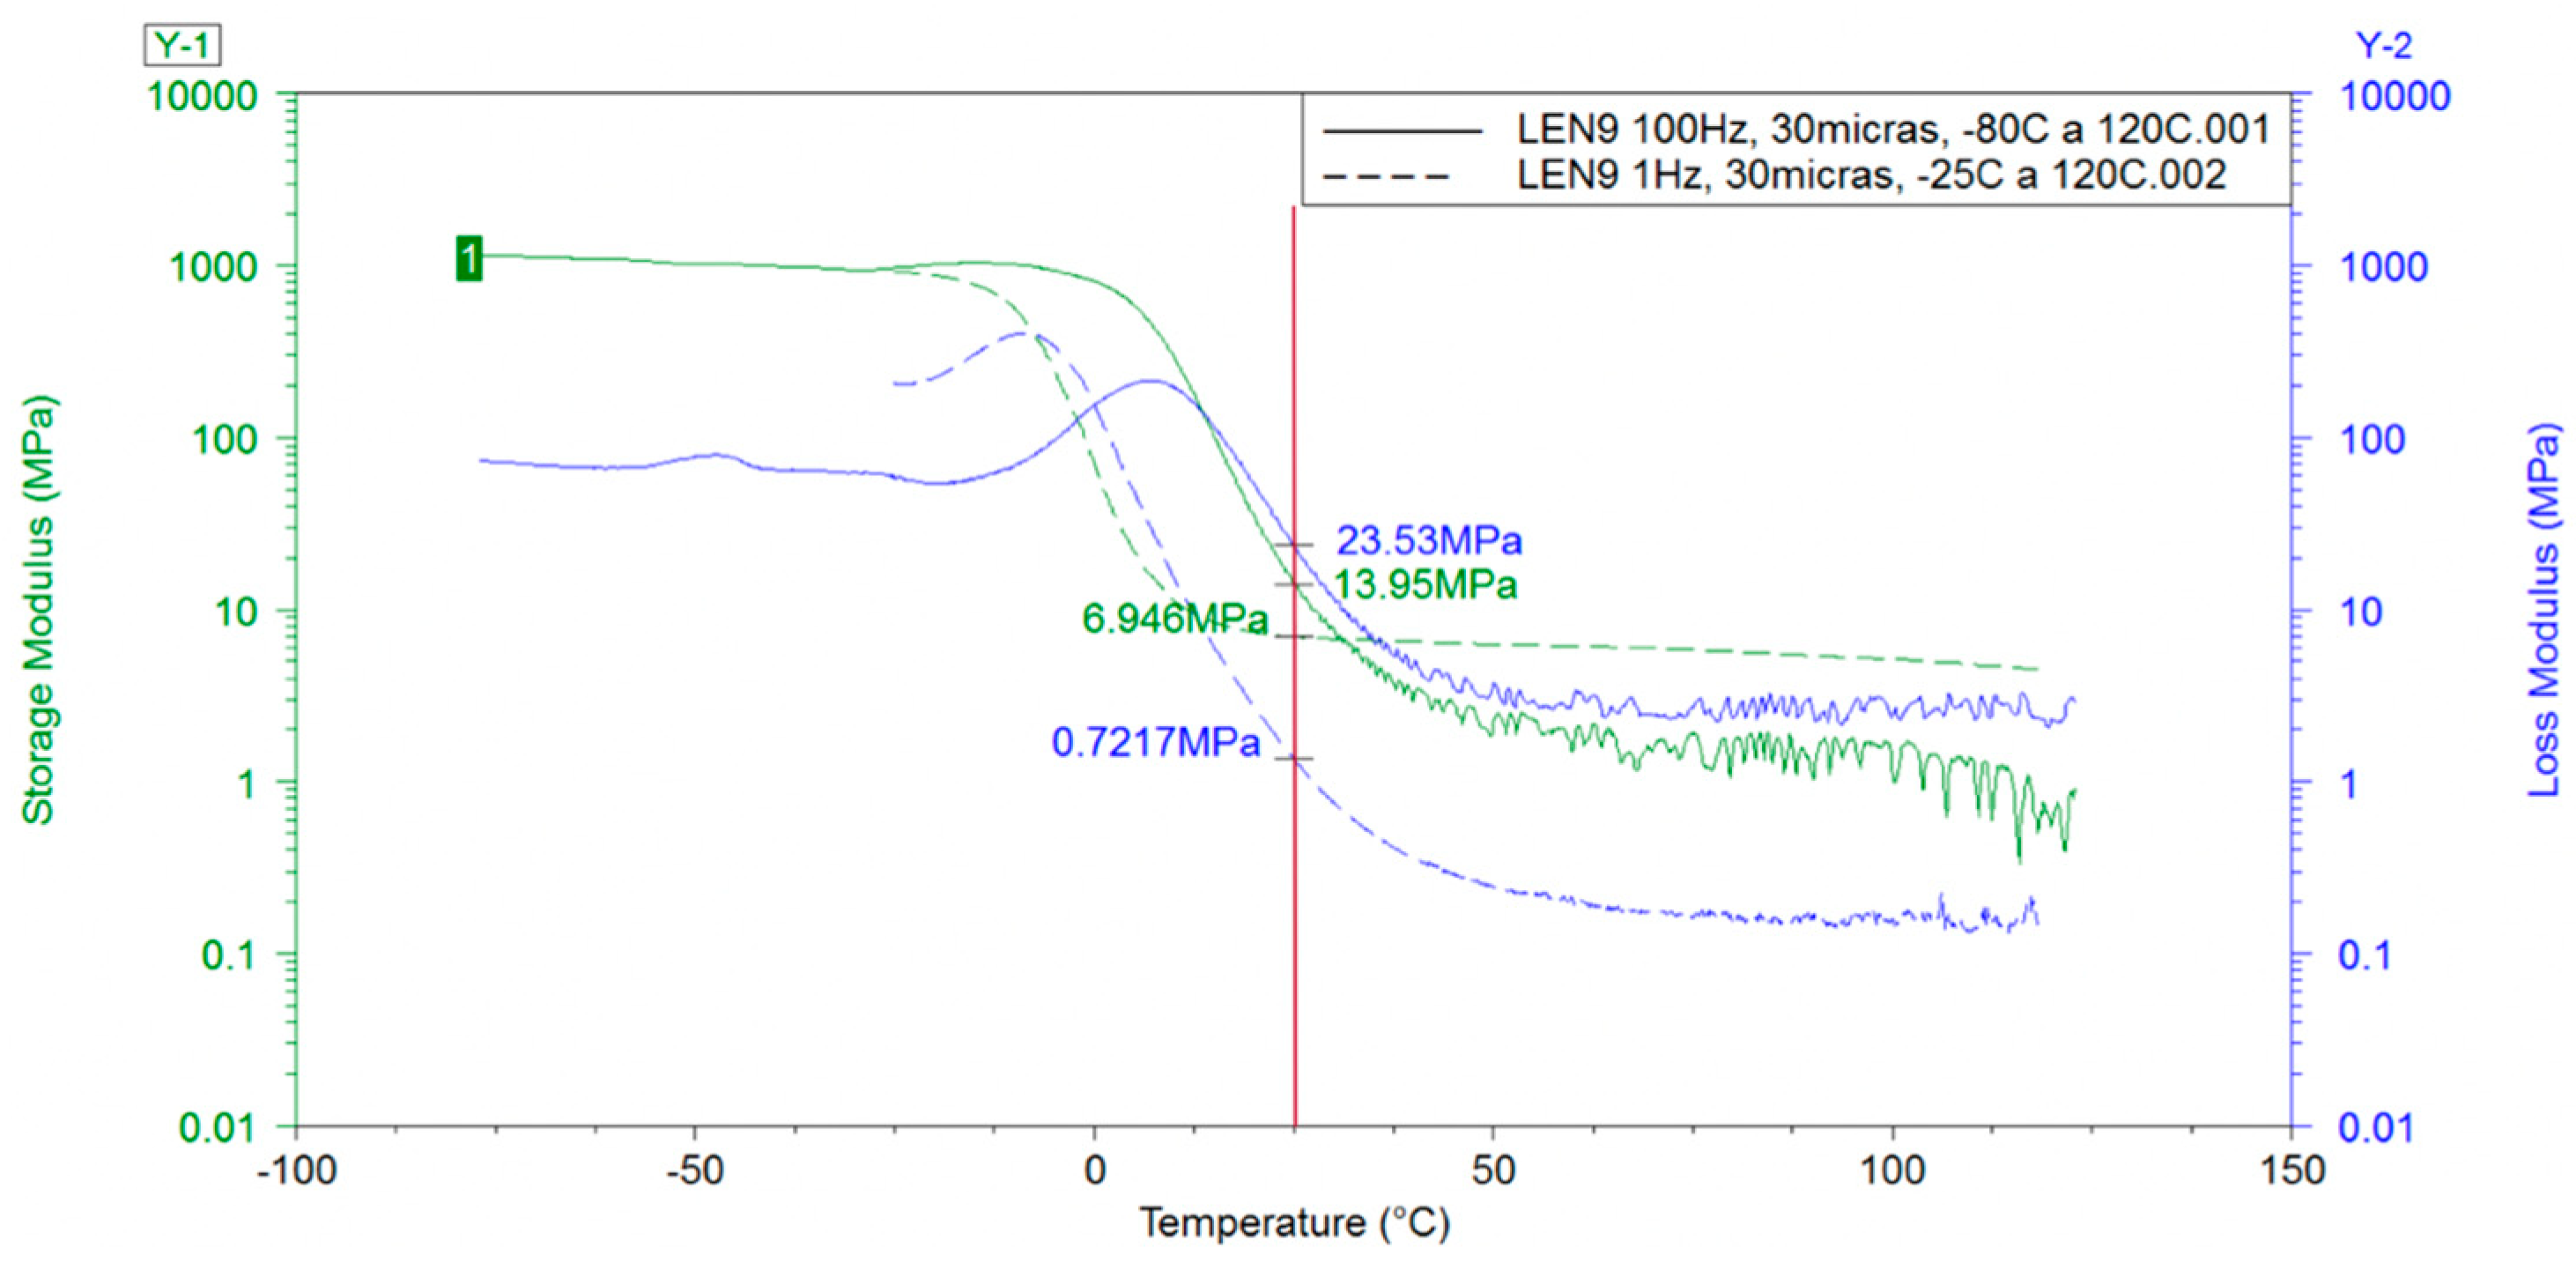
3.1. Thin Coatings mechAnical Properties at High-Strain-Rates

The waterdrop impact introduces a very high-rate pressure transient build-up. The viscoelastic material experiences a very rapidly increasing stress field that leads to a distortion and a subsequent strain relaxation. The large deformation stress-strain behavior of elastomeric materials is strongly dependent on strain rate. ISO 18872 standard [23] is defined for high strain rate testing of polymeric materials. In [24,25,26] is analyzed for particular materials the deformation behavior over a wide range in strain rates. The problem is widely studied in the literature in regards of different mechanical properties, chemistry systems (molecular transitions and relaxations) and loading cases (considering tensile or compression). For our droplet impact analysis and modelling, it is important to note that the Ultimate Strength σ u characterization represents an important input parameter because is directly related with the erosion strength and is exponentially related to lifetime estimation (see Equations (12) and (14) respectively). Its rate dependent value [26] is an important source of deviation on the modelling accuracy. Representative engineering stress-strain plots of a polyurethane-based polymer material under dynamic tension loading with three curves per selected strain rate level can be obtained from [26]. Characterizing LEP materials at high strain rates is difficult, even at small amplitudes because the regime of interest at a very high frequency is limited.
The highly transient material behavior during waterdrop collisions require to define the range of frequency of its data set. Stiffness of a polymer is measured as a modulus, a ratio of stress to strain at a certain stage of deformation. LEP polymers are viscoelastic materials and as a result their mechanical and acoustical property will depend very much upon measurement frequency and temperature, [27,28,29,30,31]. Viscoelastic variation in application of solid particle erosion analysis under high speed impact conditions is reported in [18].
This material behavior can be obtained from the frequency response data from Dynamic Mechanical Thermal Analysis (DMTA) where a sinusoidal strain is imposed on a rectangular sample as a function of temperature, see Figure 9.
For the dynamic experiments the modulus is complex E* and is given by E* = E′ + iE″ whereby E′ describes the elastic or energy storage component of the modulus and E″ the loss of energy as heat in a cycle deformation. The modulus of a viscoelastic material is a function of time as well as temperature which is the basis for time-temperature superposition principles which may be used to predict the temperature-frequency behavior of a polymer.
The Dynamic Mechanical Thermal Analysis (DMTA) is the appropriate test to determine the viscoelastic properties, however, the information provided by this technique is only valid up to a frequency of 100 Hz, and therefore, it is not useful in the present context.
The Time-Temperature superposition principle may be required to determine temperature-dependent mechanical properties in a broad range of frequencies. It also may consider transforming the data from the frequency to the time domain for the computational analysis (by performing convolution calculations and inverse Fourier transform on Eand E″ data set).
On the other hand, Dielectric Thermal Analysis (DETA) supplies information on the molecular motion up to a frequency of 107 Hz by means of measuring the complex dielectric permittivity (ε*) over the entire frequency range, so the regime of interest, see Figure 10. It gives complete information for shifts in Tg transitions depending on frequency and temperature variations, but it has a lack on the mechanical values of E′ and E″ since it only gives us dielectric data. Thus, it is necessary to obtain with additional time-temperature superposition the relevant mechanical data and converting it to the complex Young modulus (E*). To that end, a series of mathematical models capable of performing such interconversion may be applied [32,33,34].
A direct measurement of the required mechanical elastic properties in high frequency ranges can be obtained from Ultrasonic measurements as detailed in the literature [28,29,30]. There is a good correlation between the ultrasonic properties’ attenuation α and sound velocity C and the elastic modulus properties:
E = ρ C 2 ; E   = ρ C 3 π f α
The speed of sound is temperature and frequency dependent so are the acoustic impedance. In next section, further analysis is developed for better understanding the effect of most important parameters that may affect the frequency development of the stress-strain-time evolution and hence the consideration of appropriate speed of sound measurement as input modelling data.

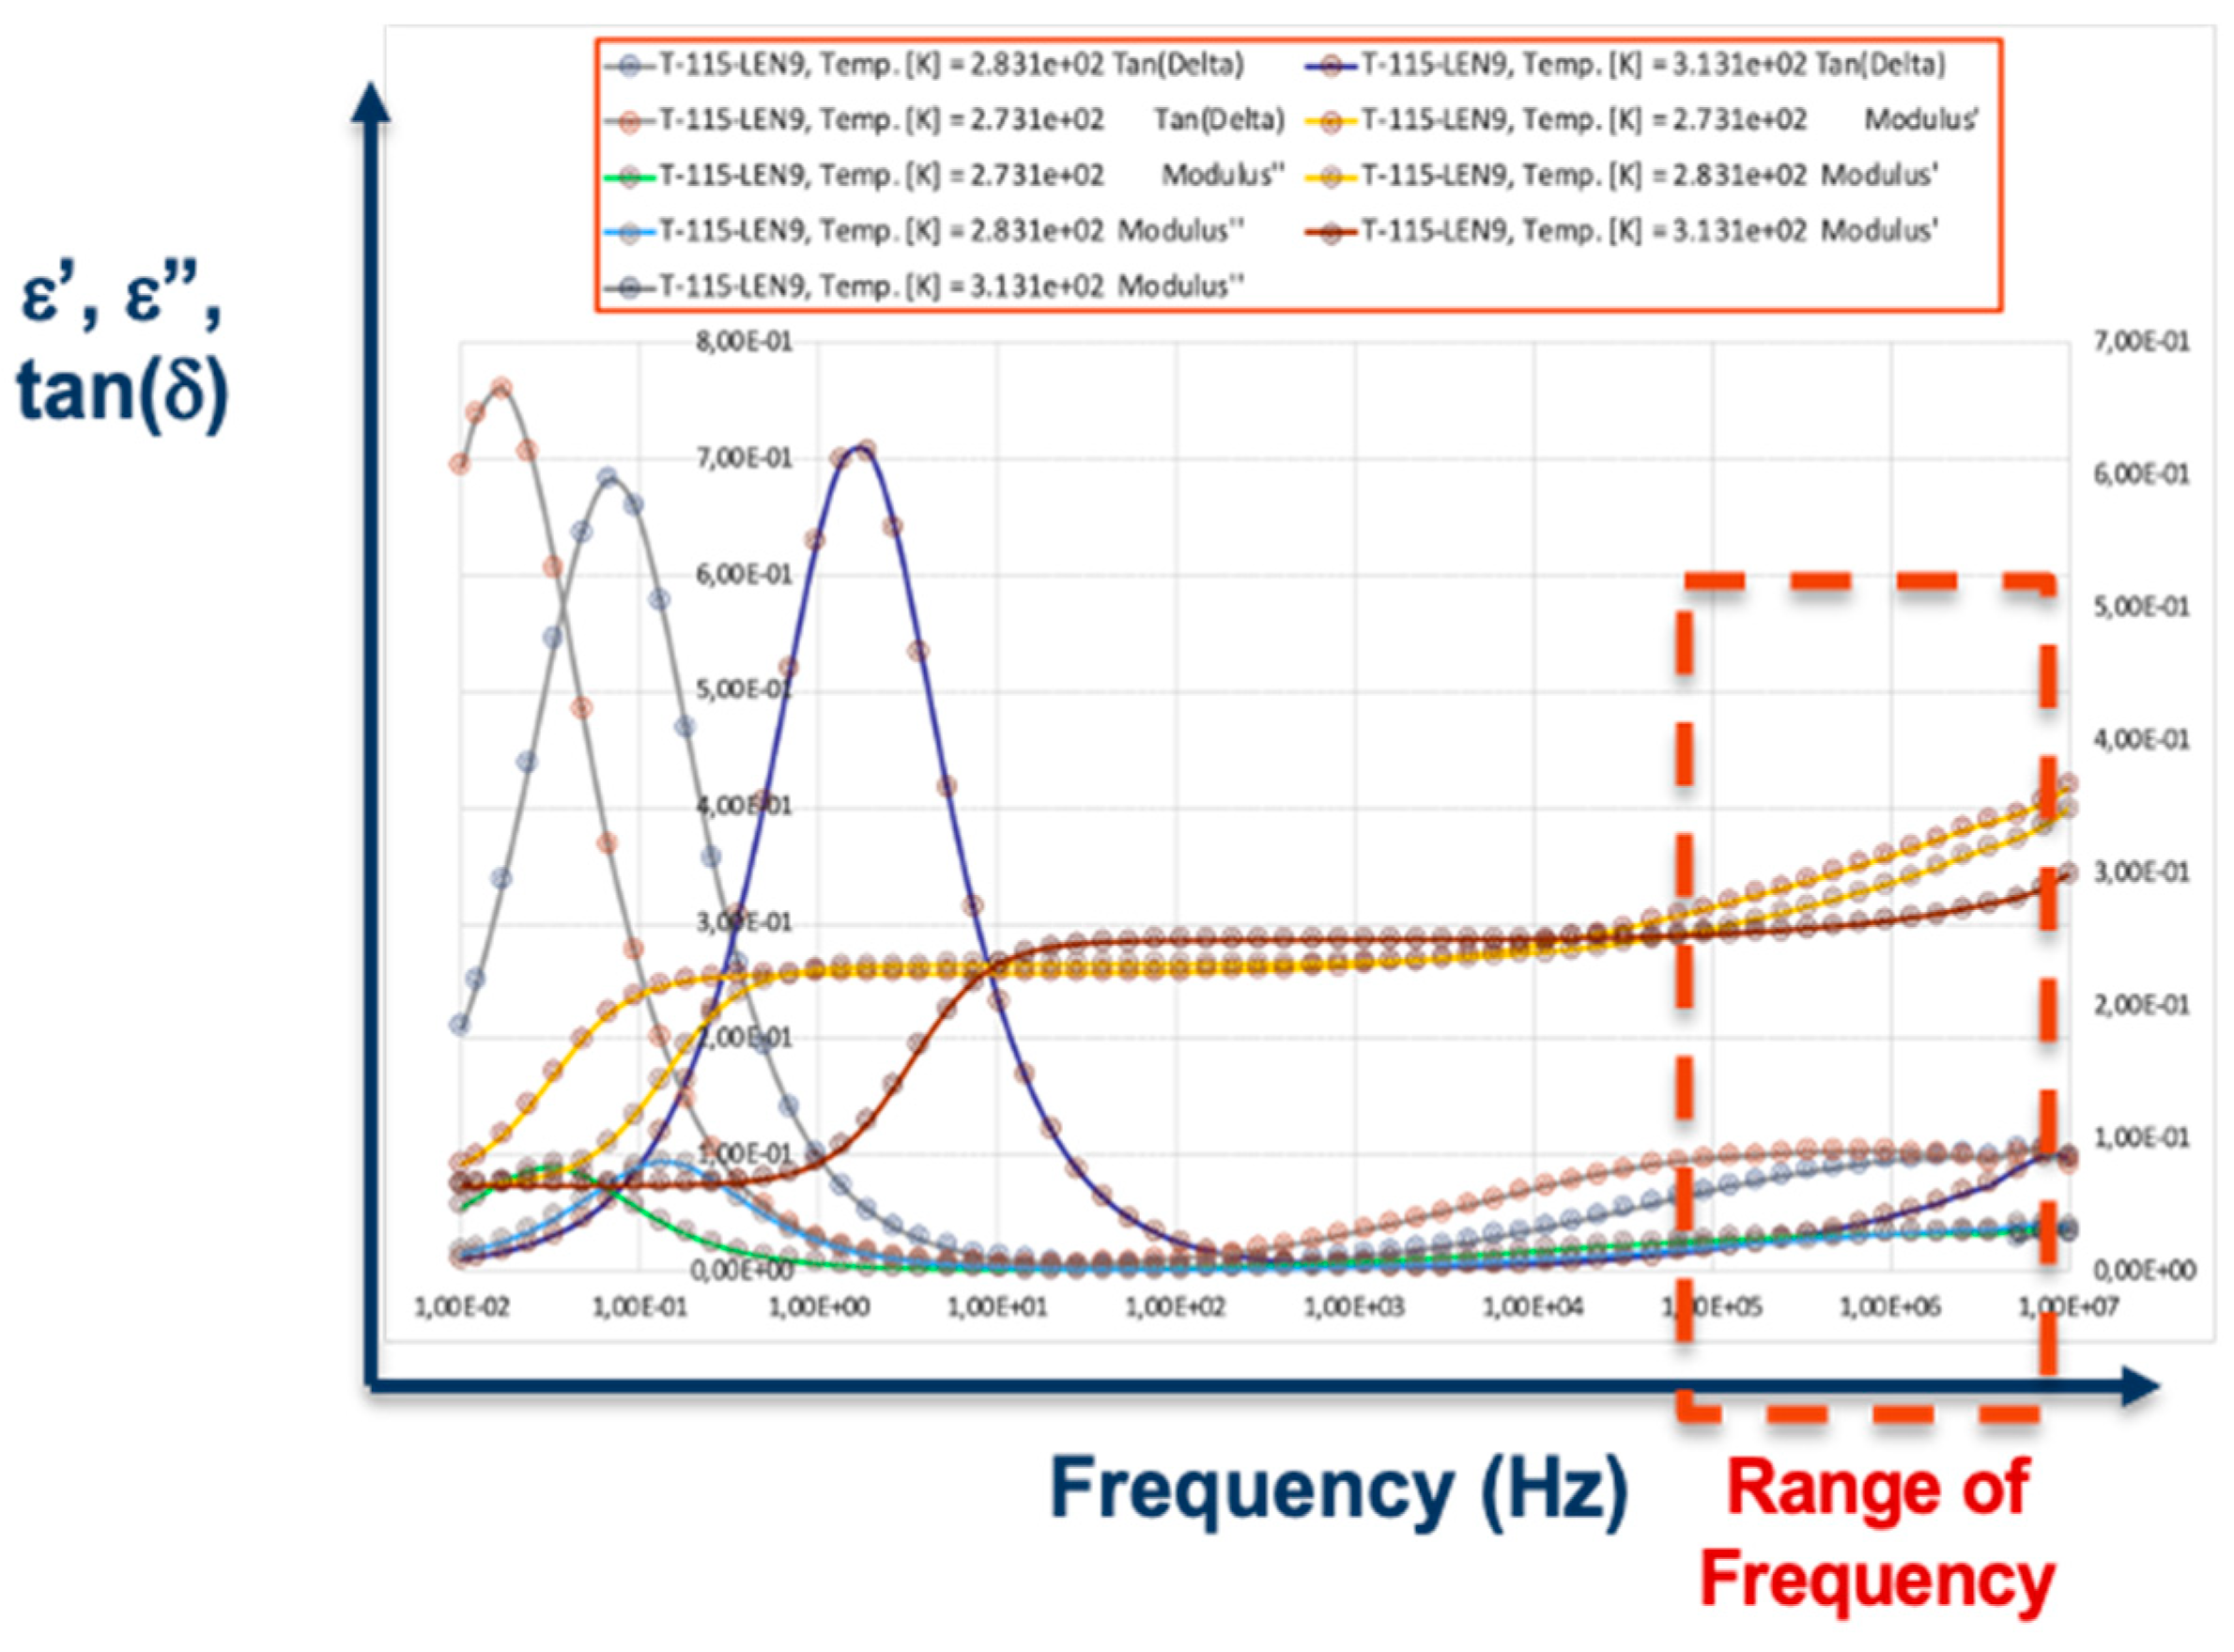
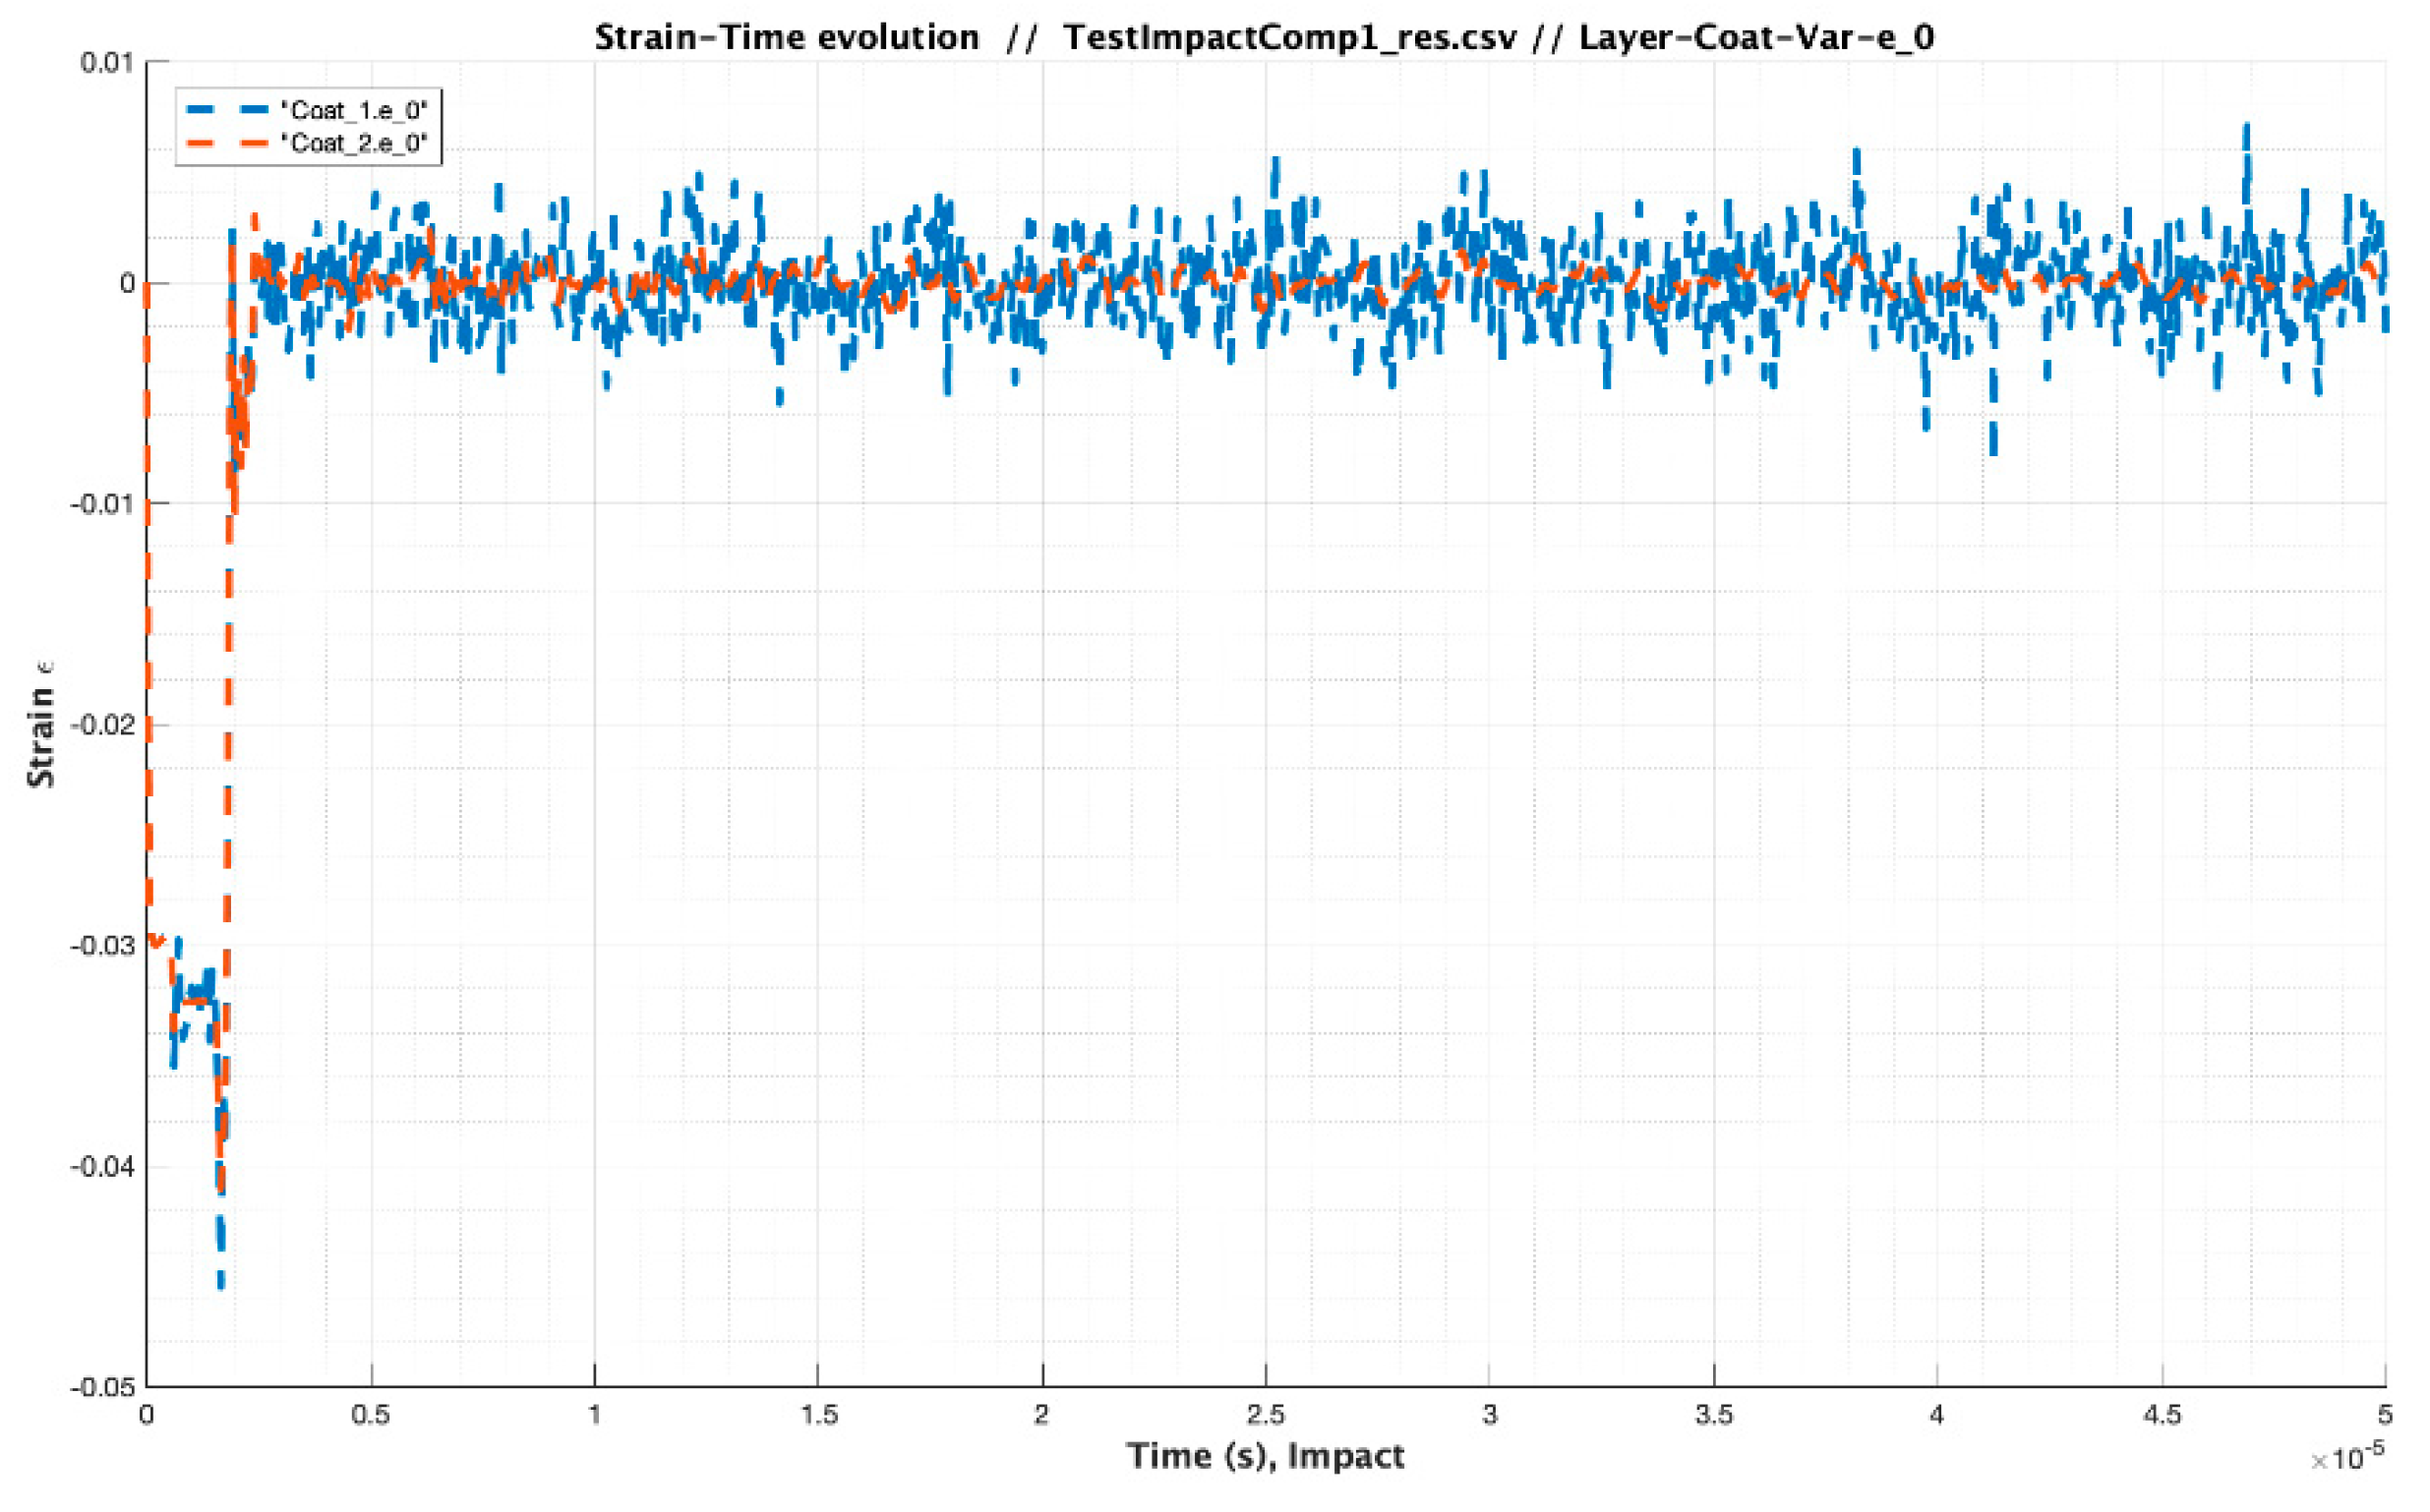
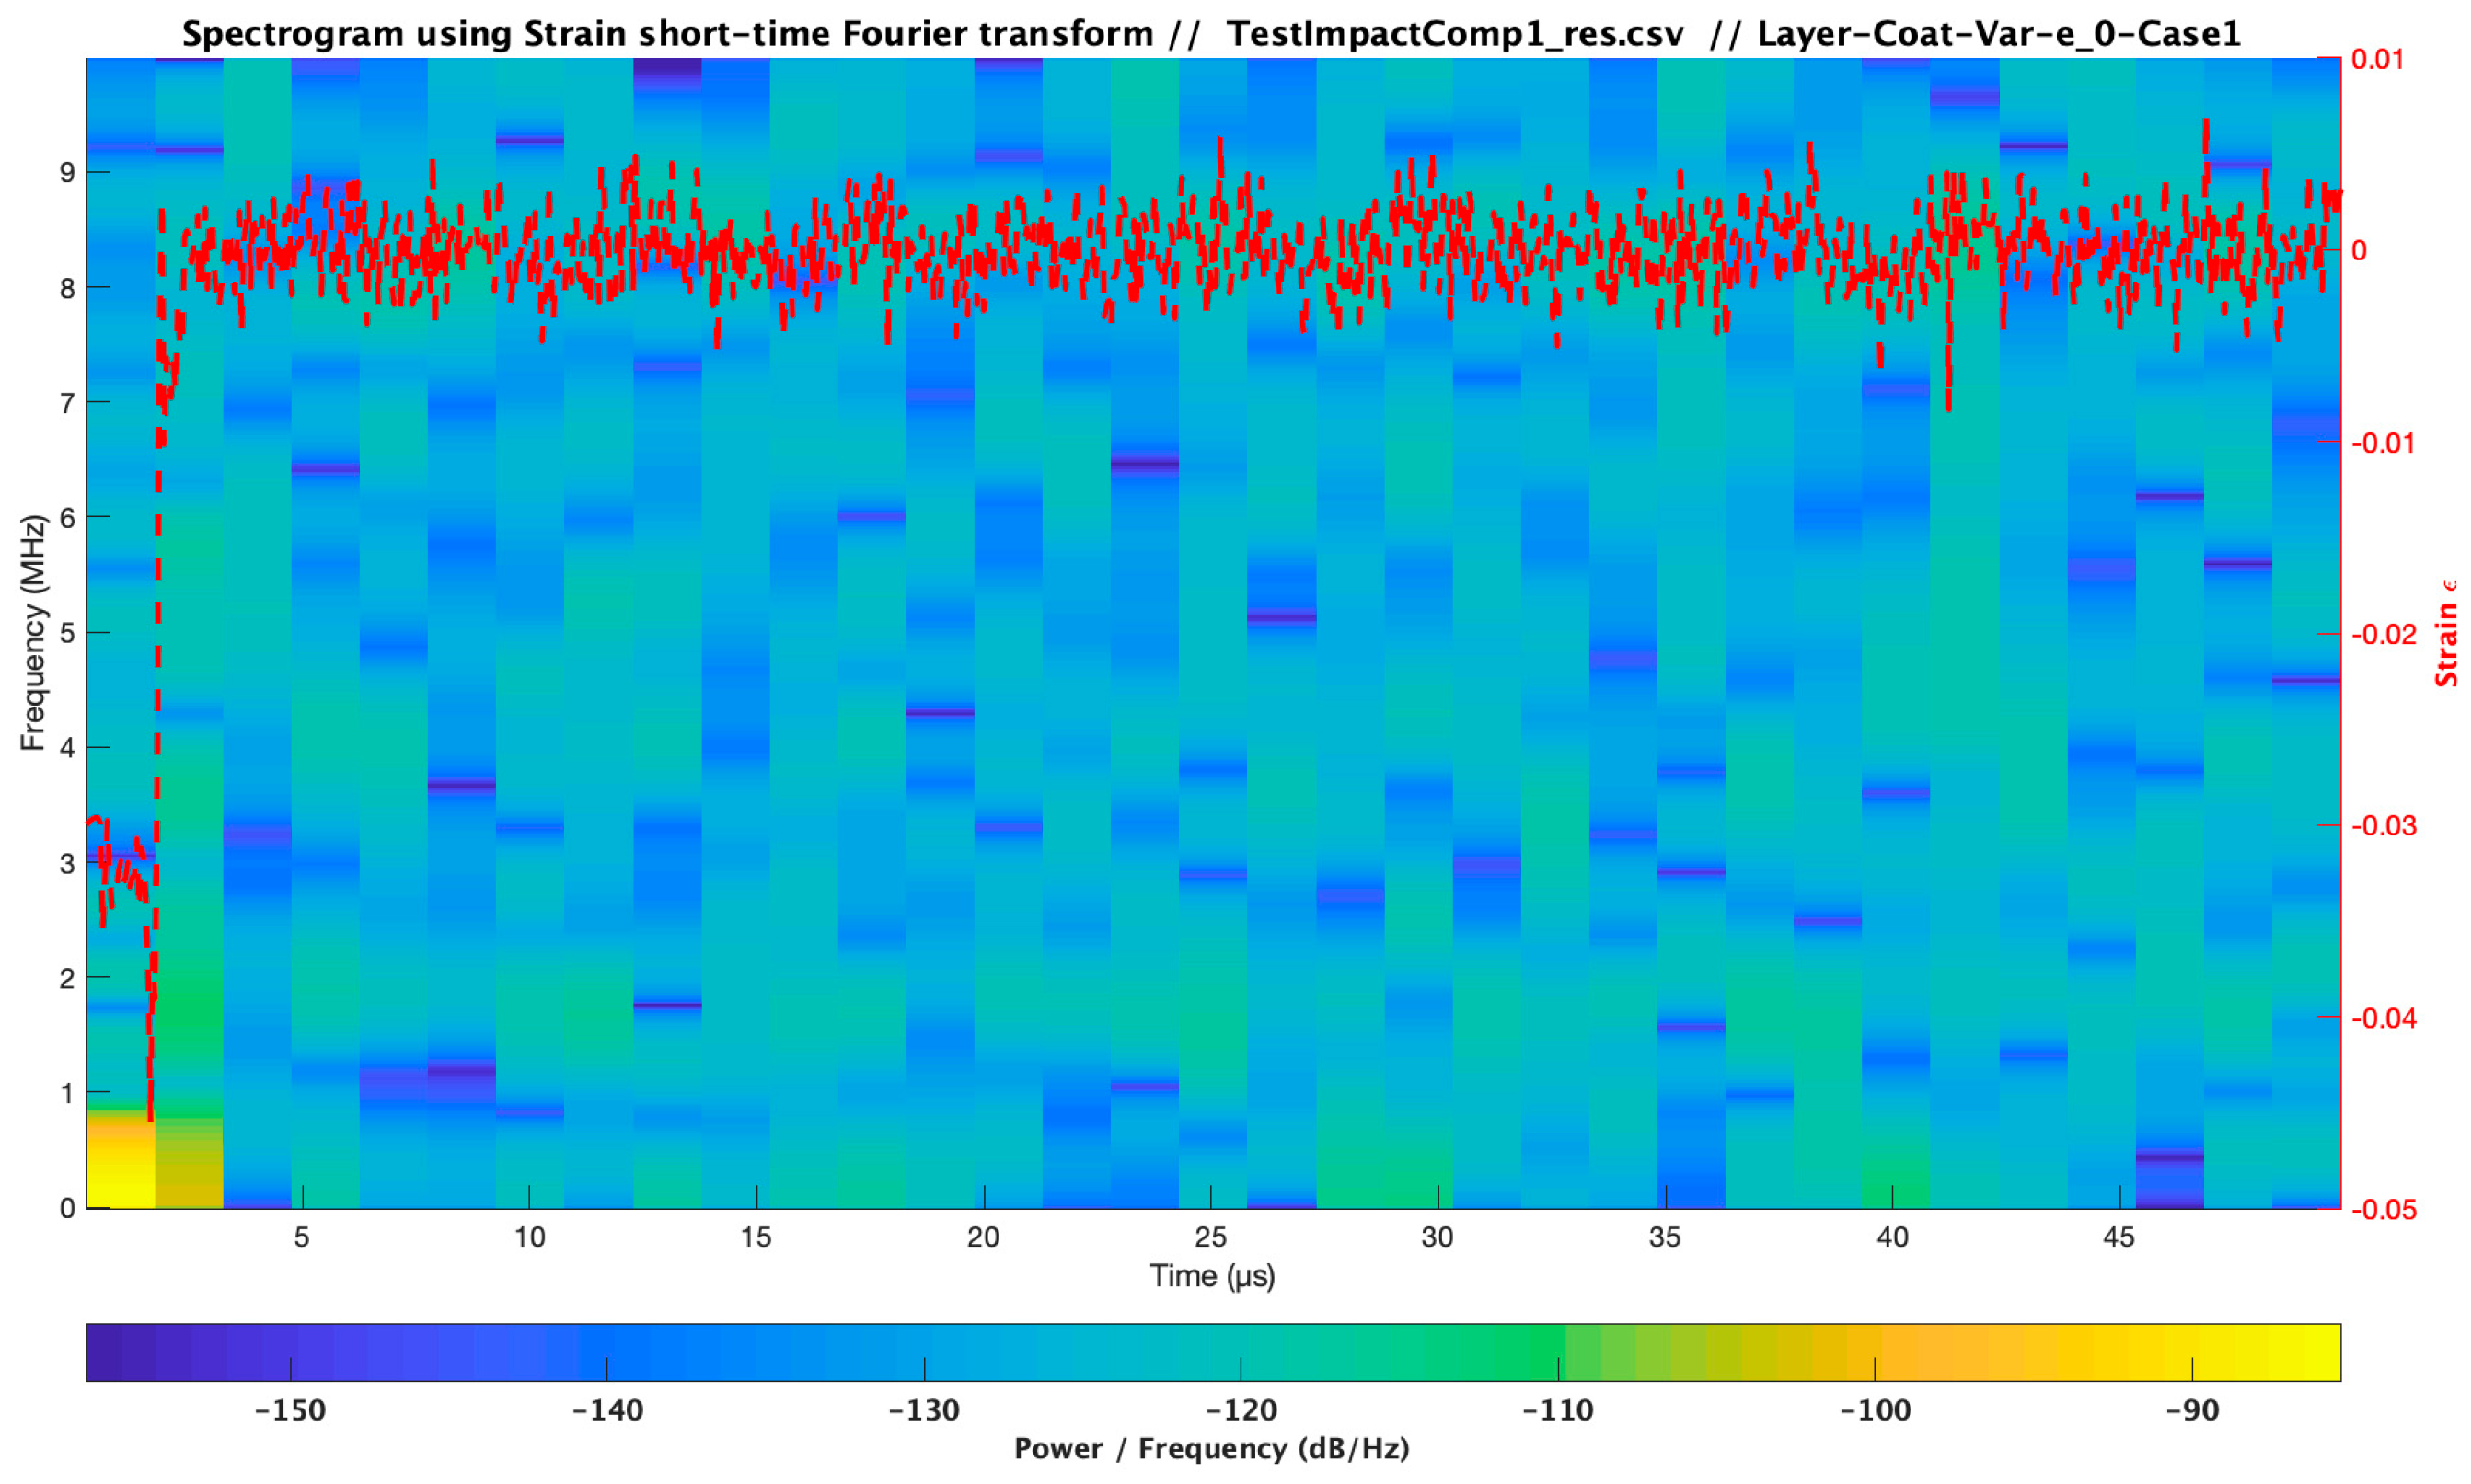
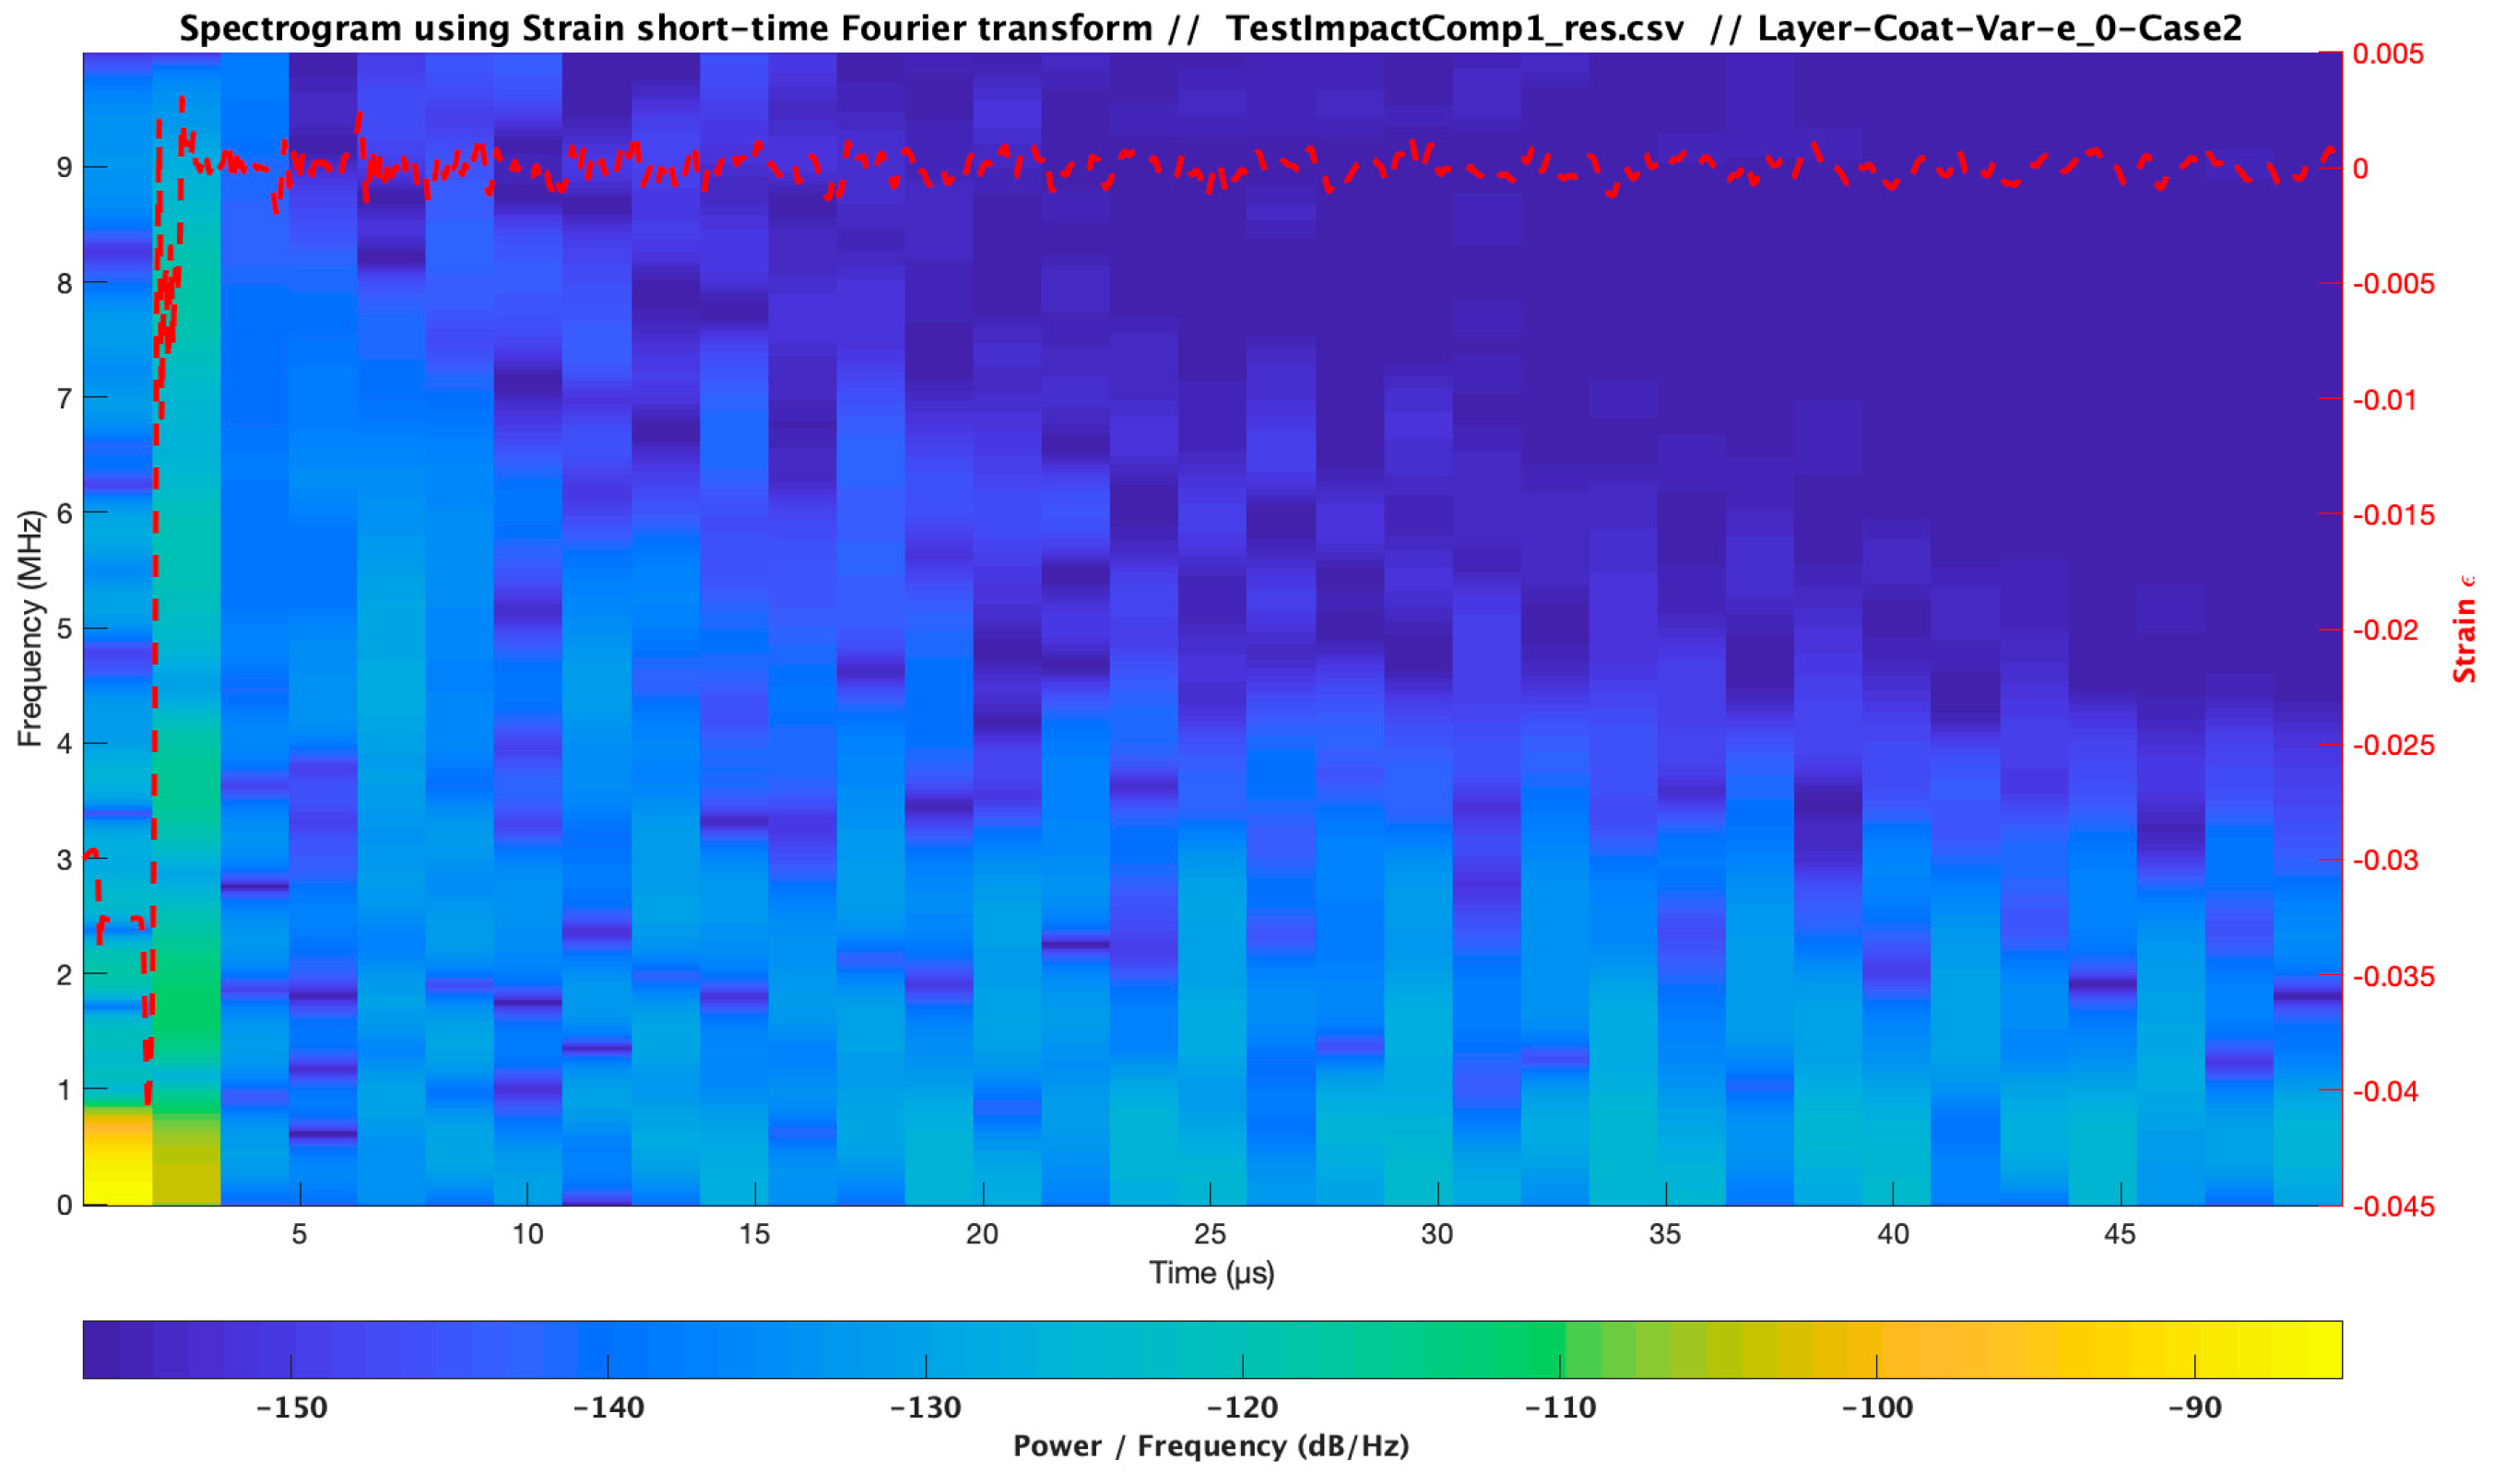
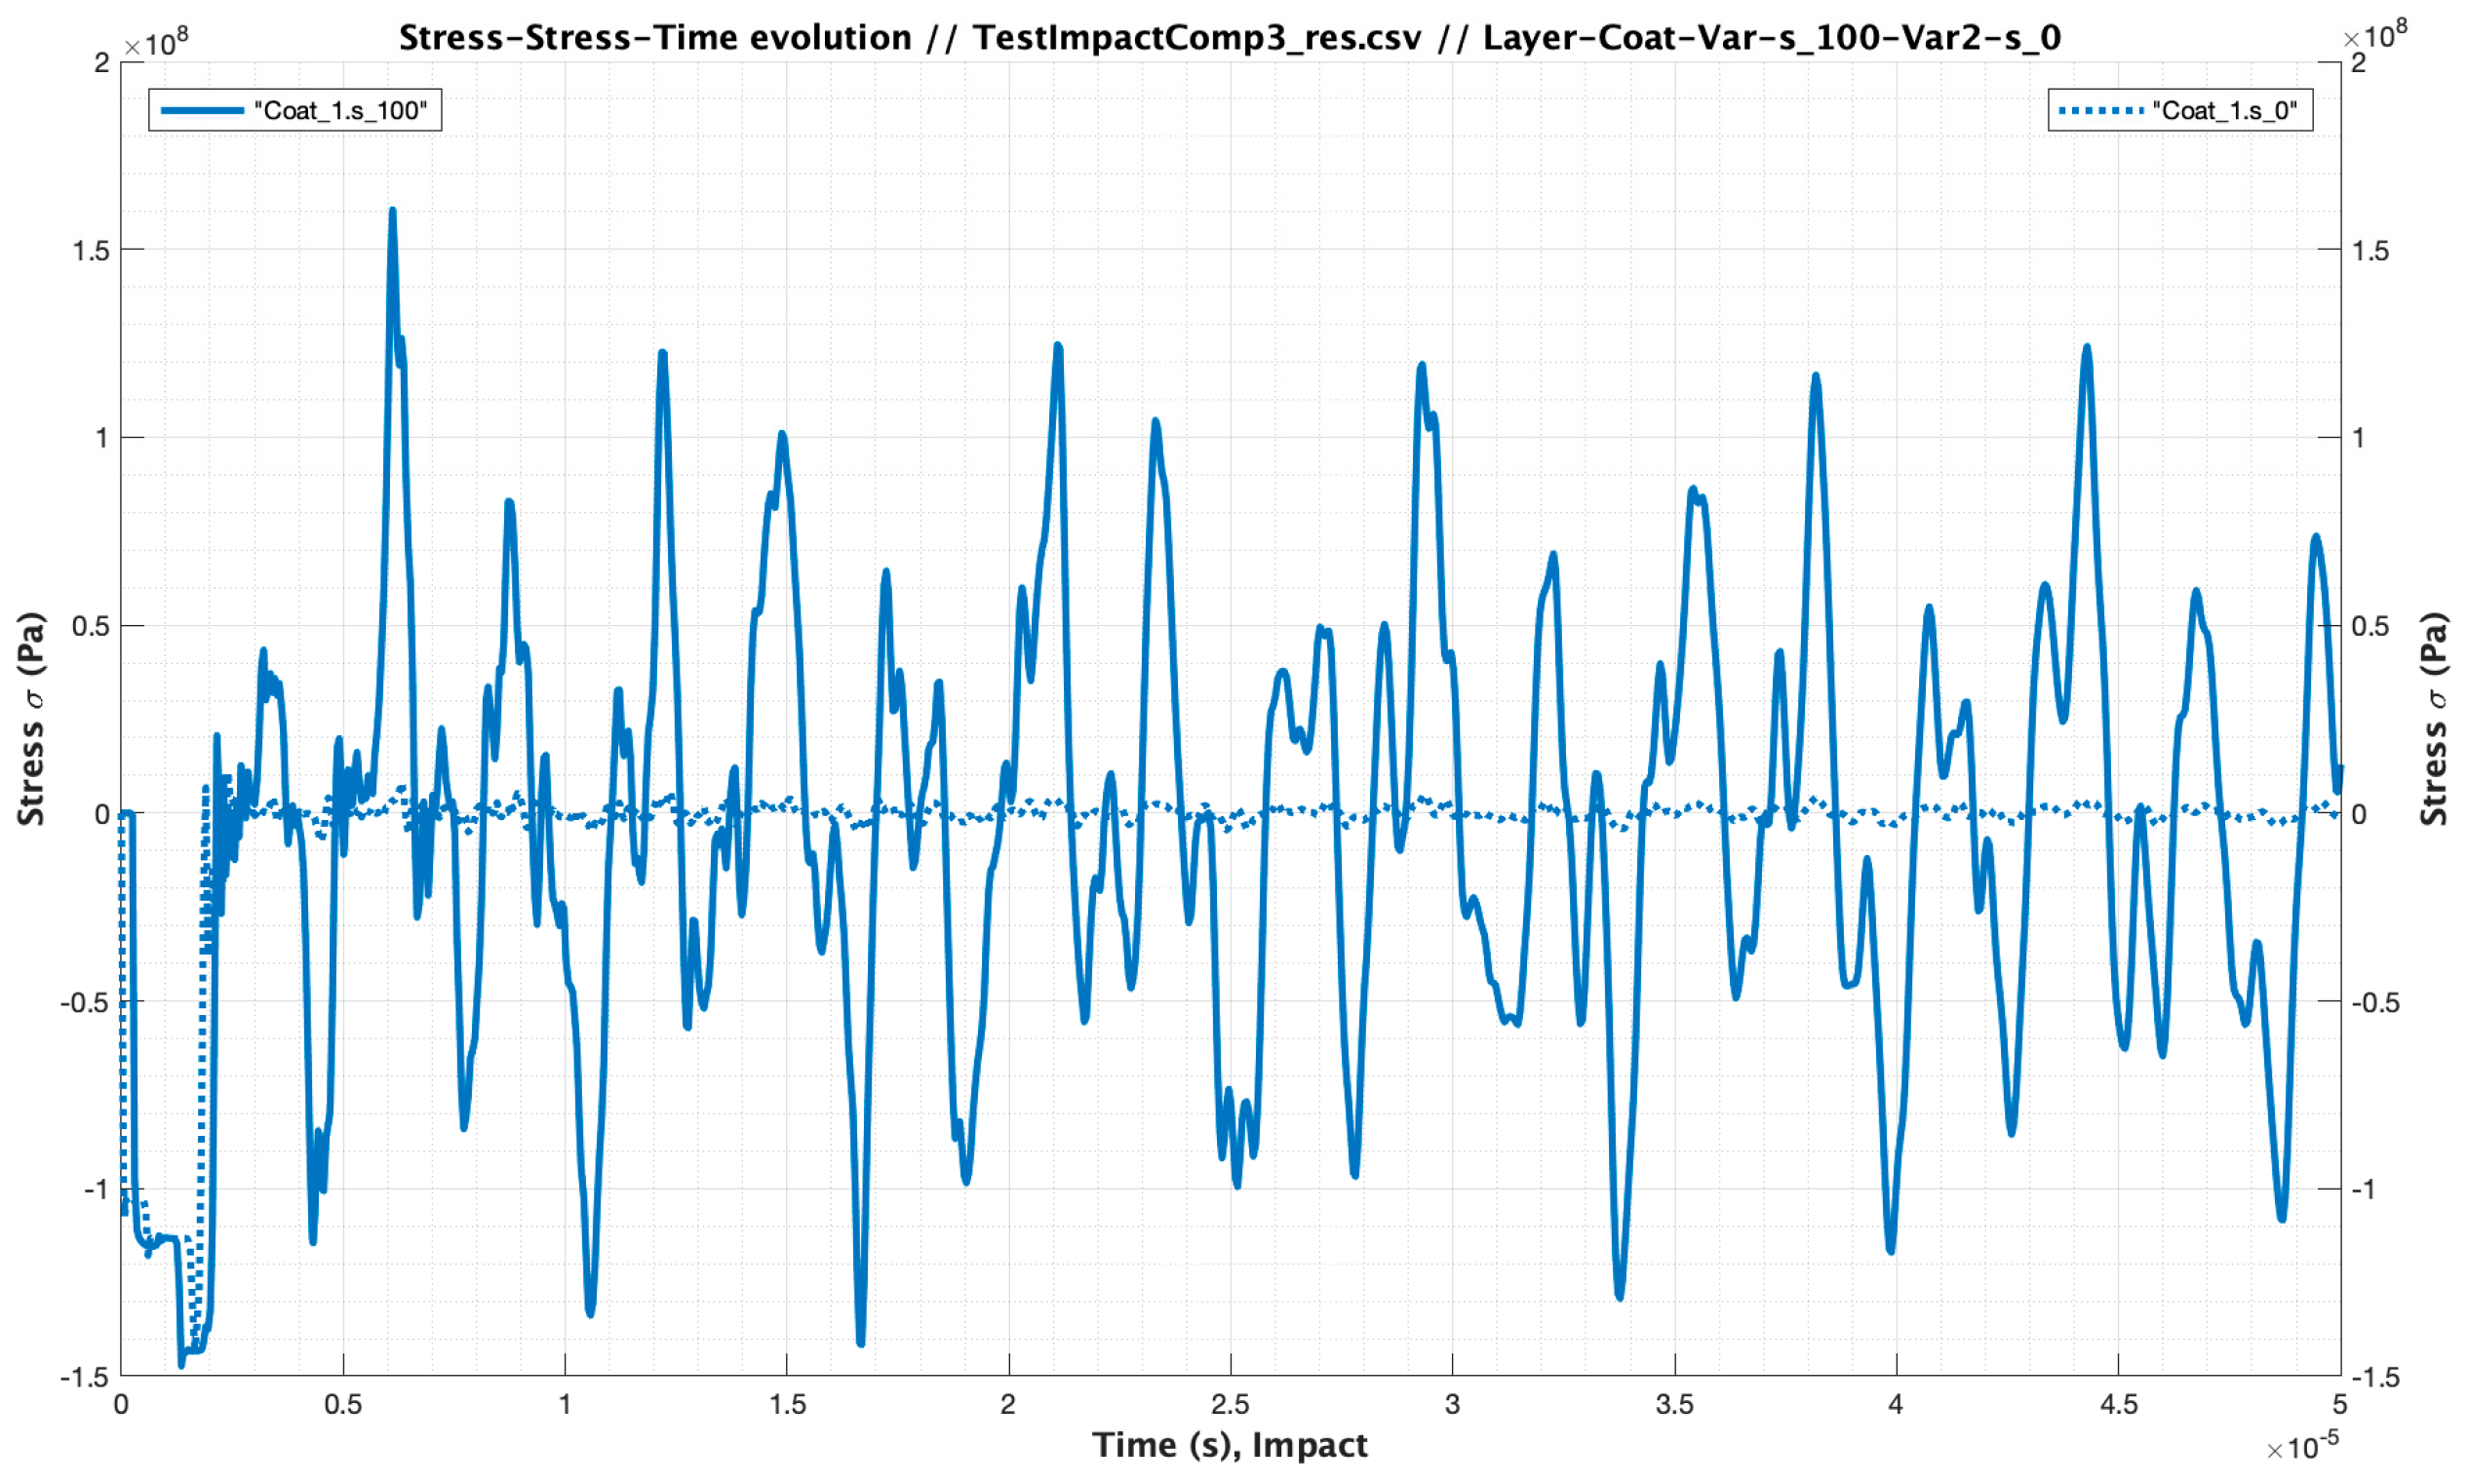
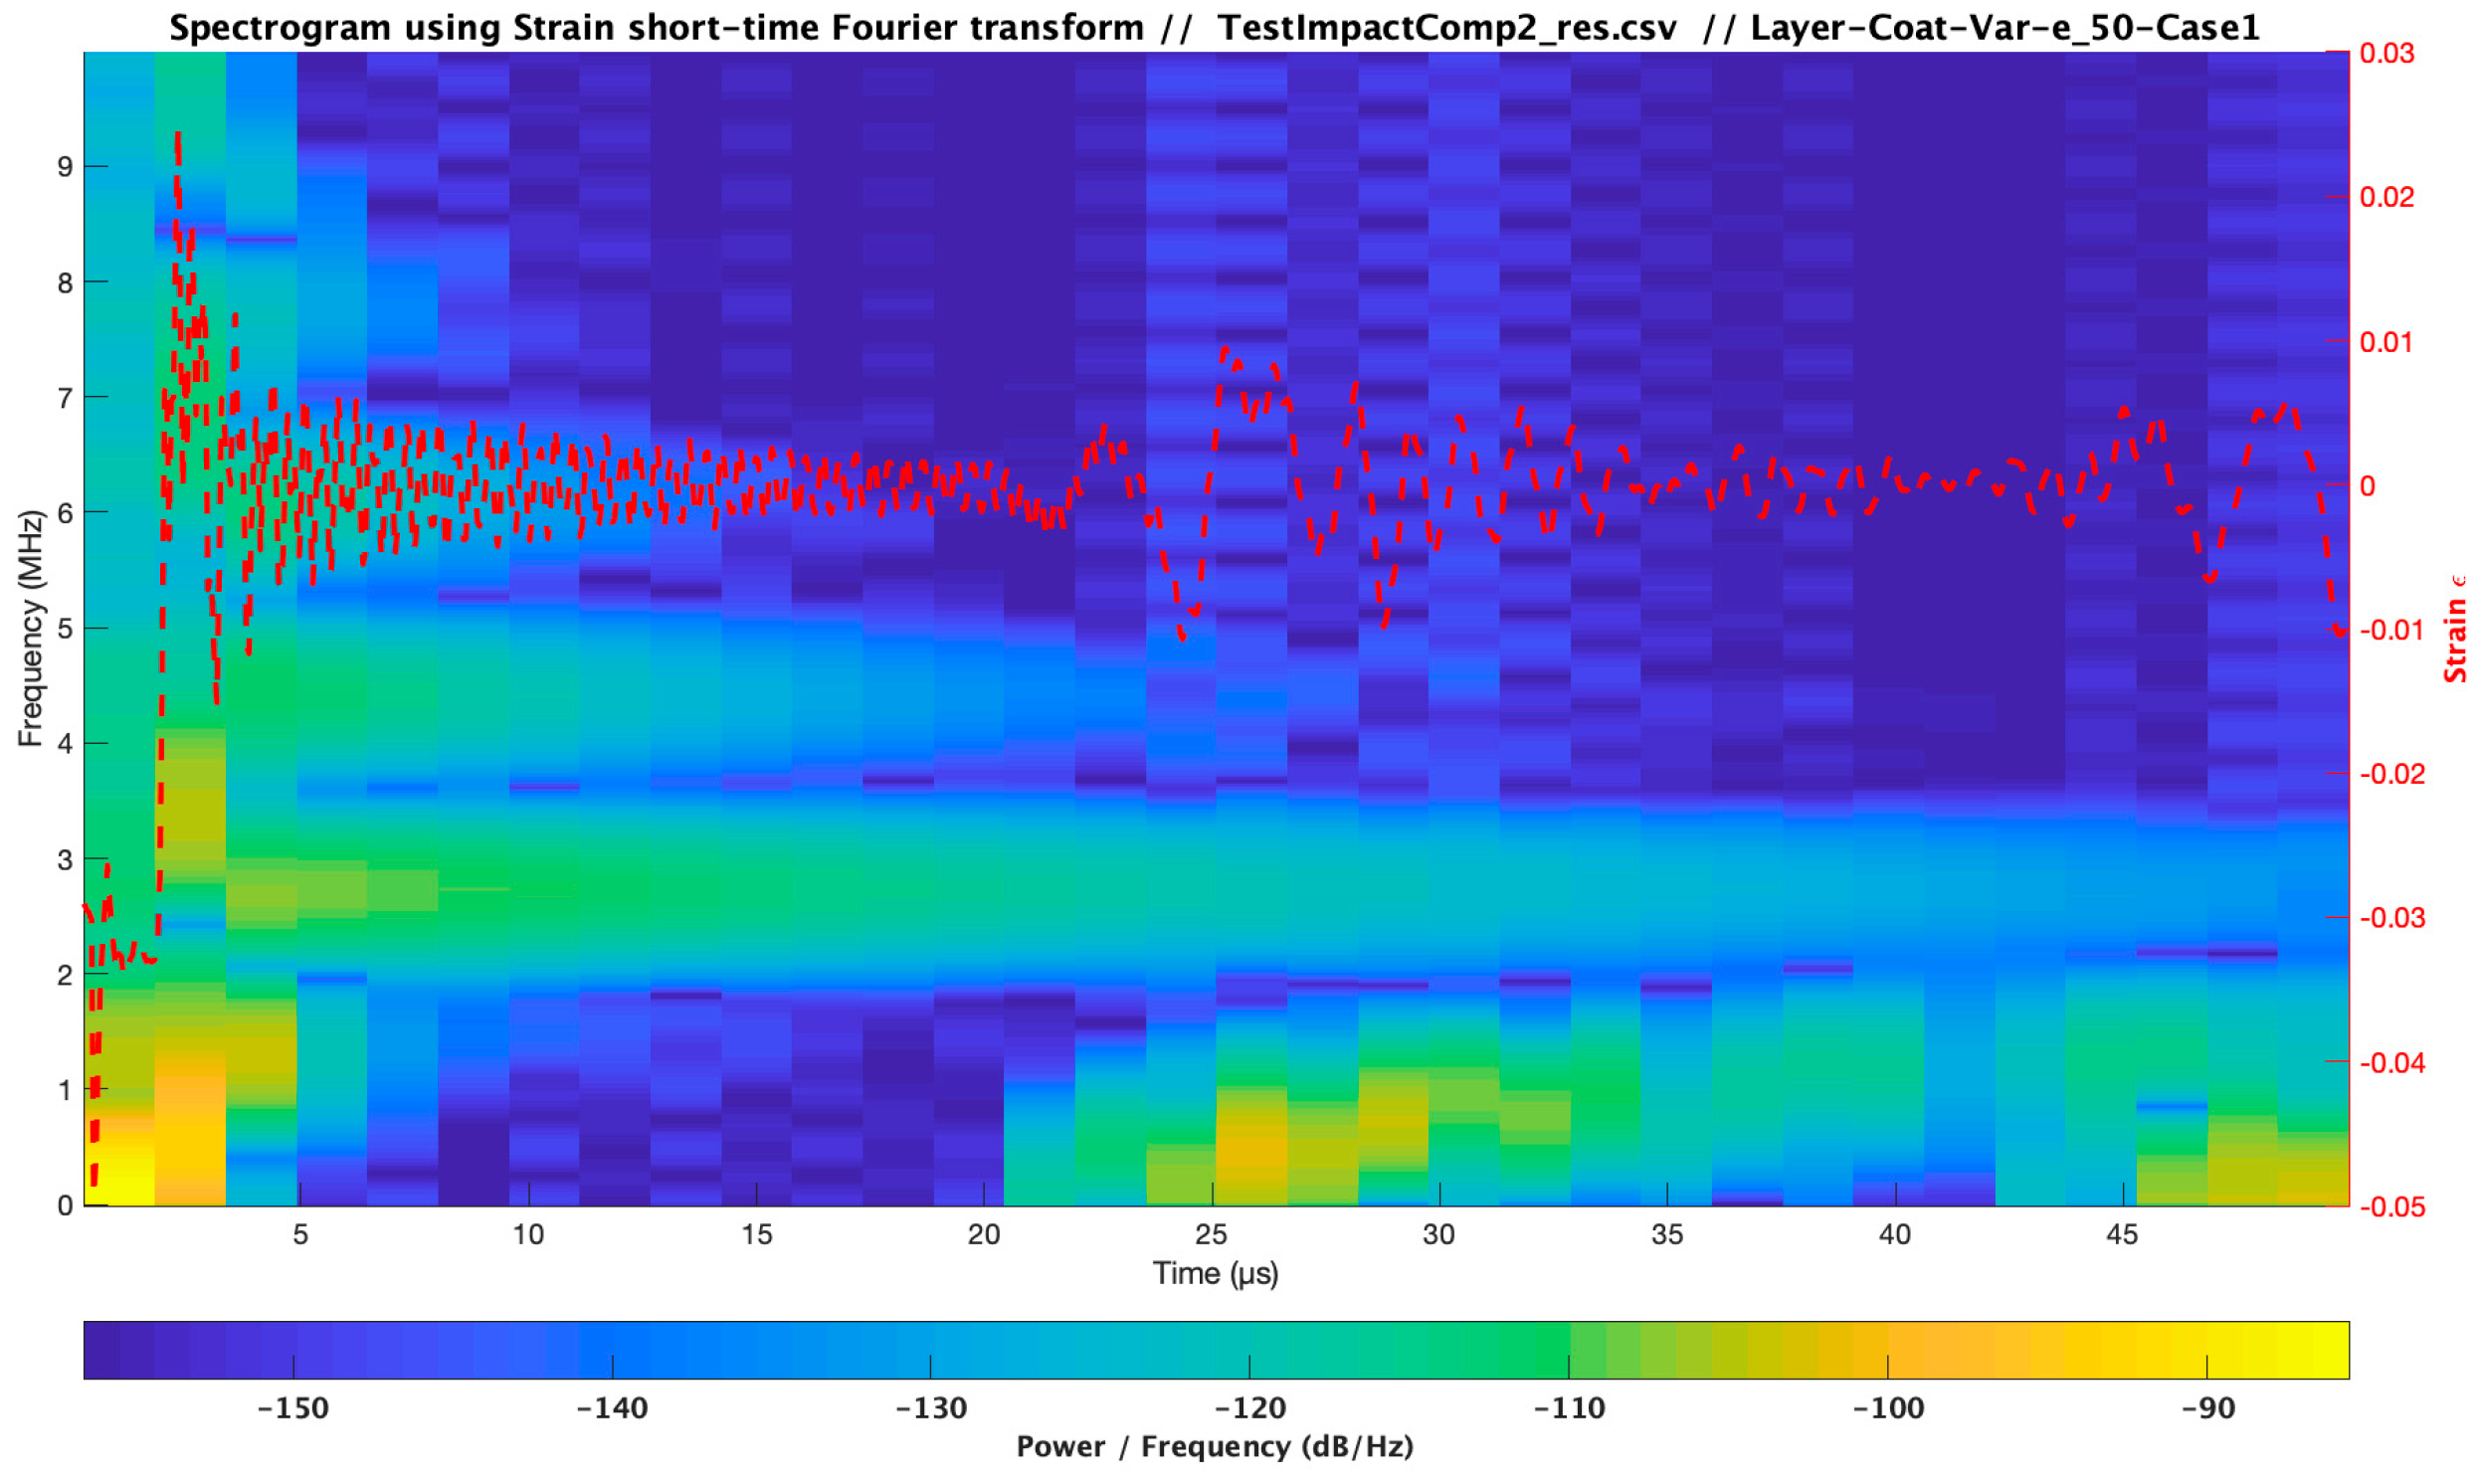
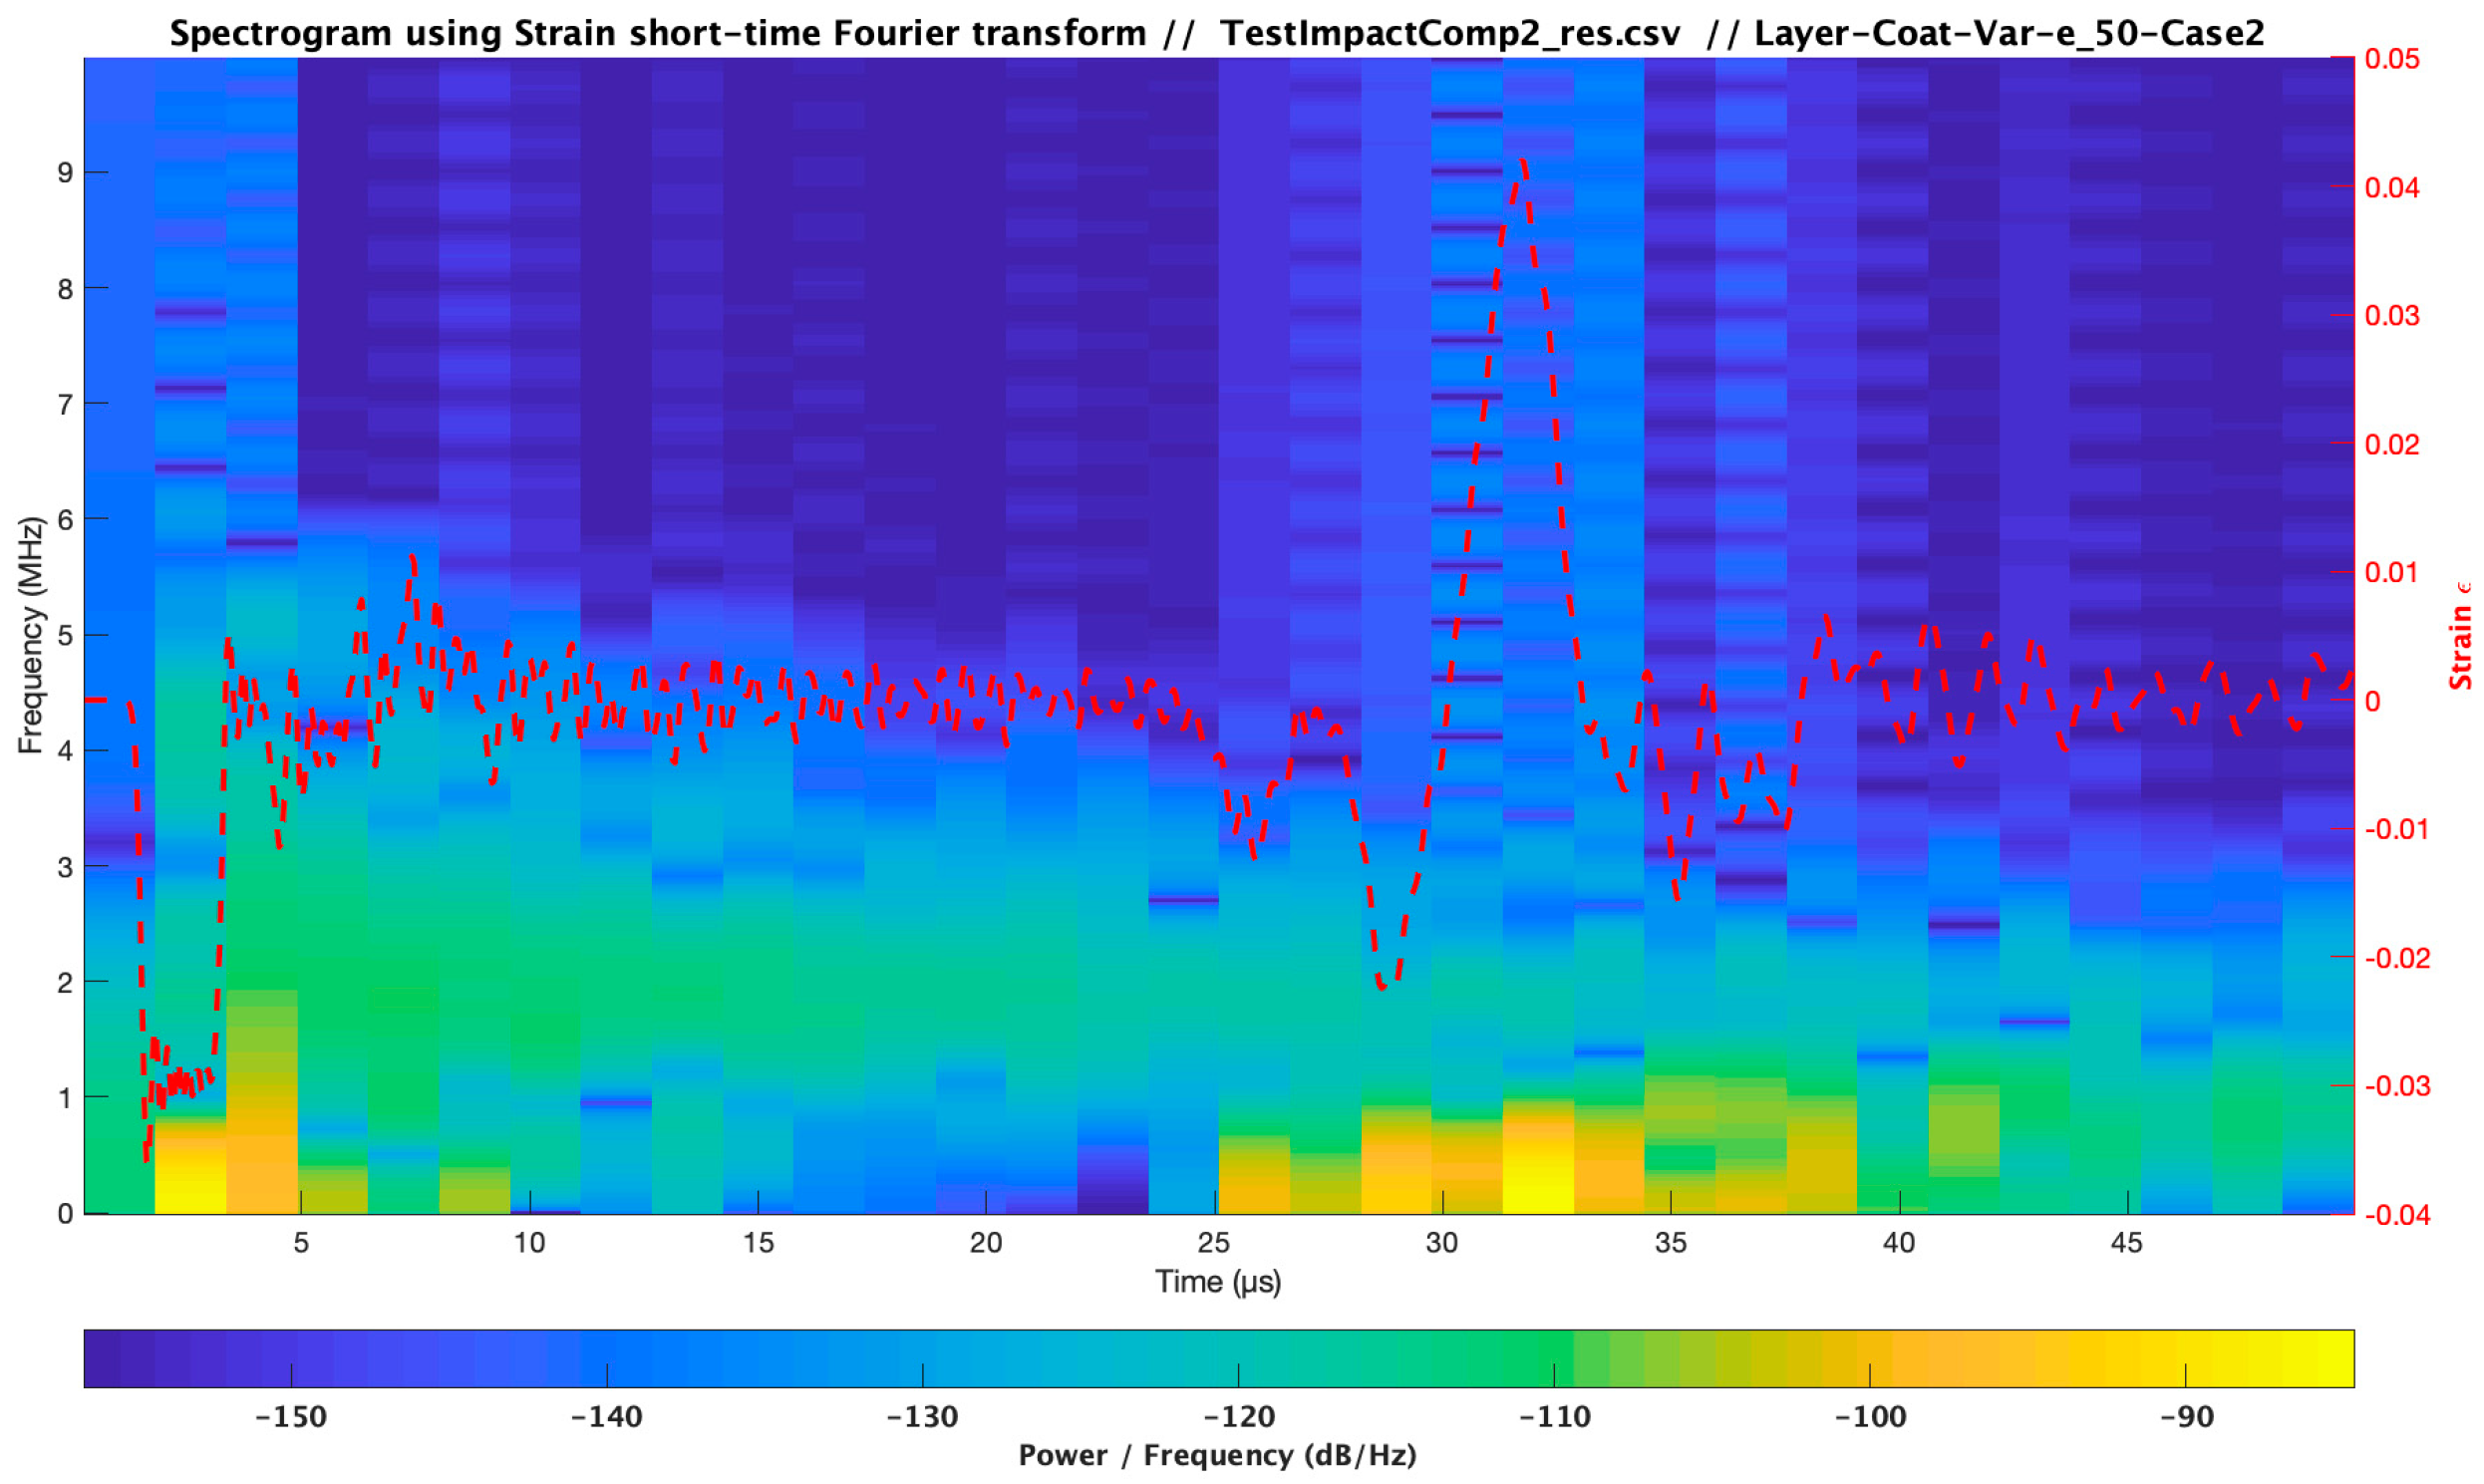
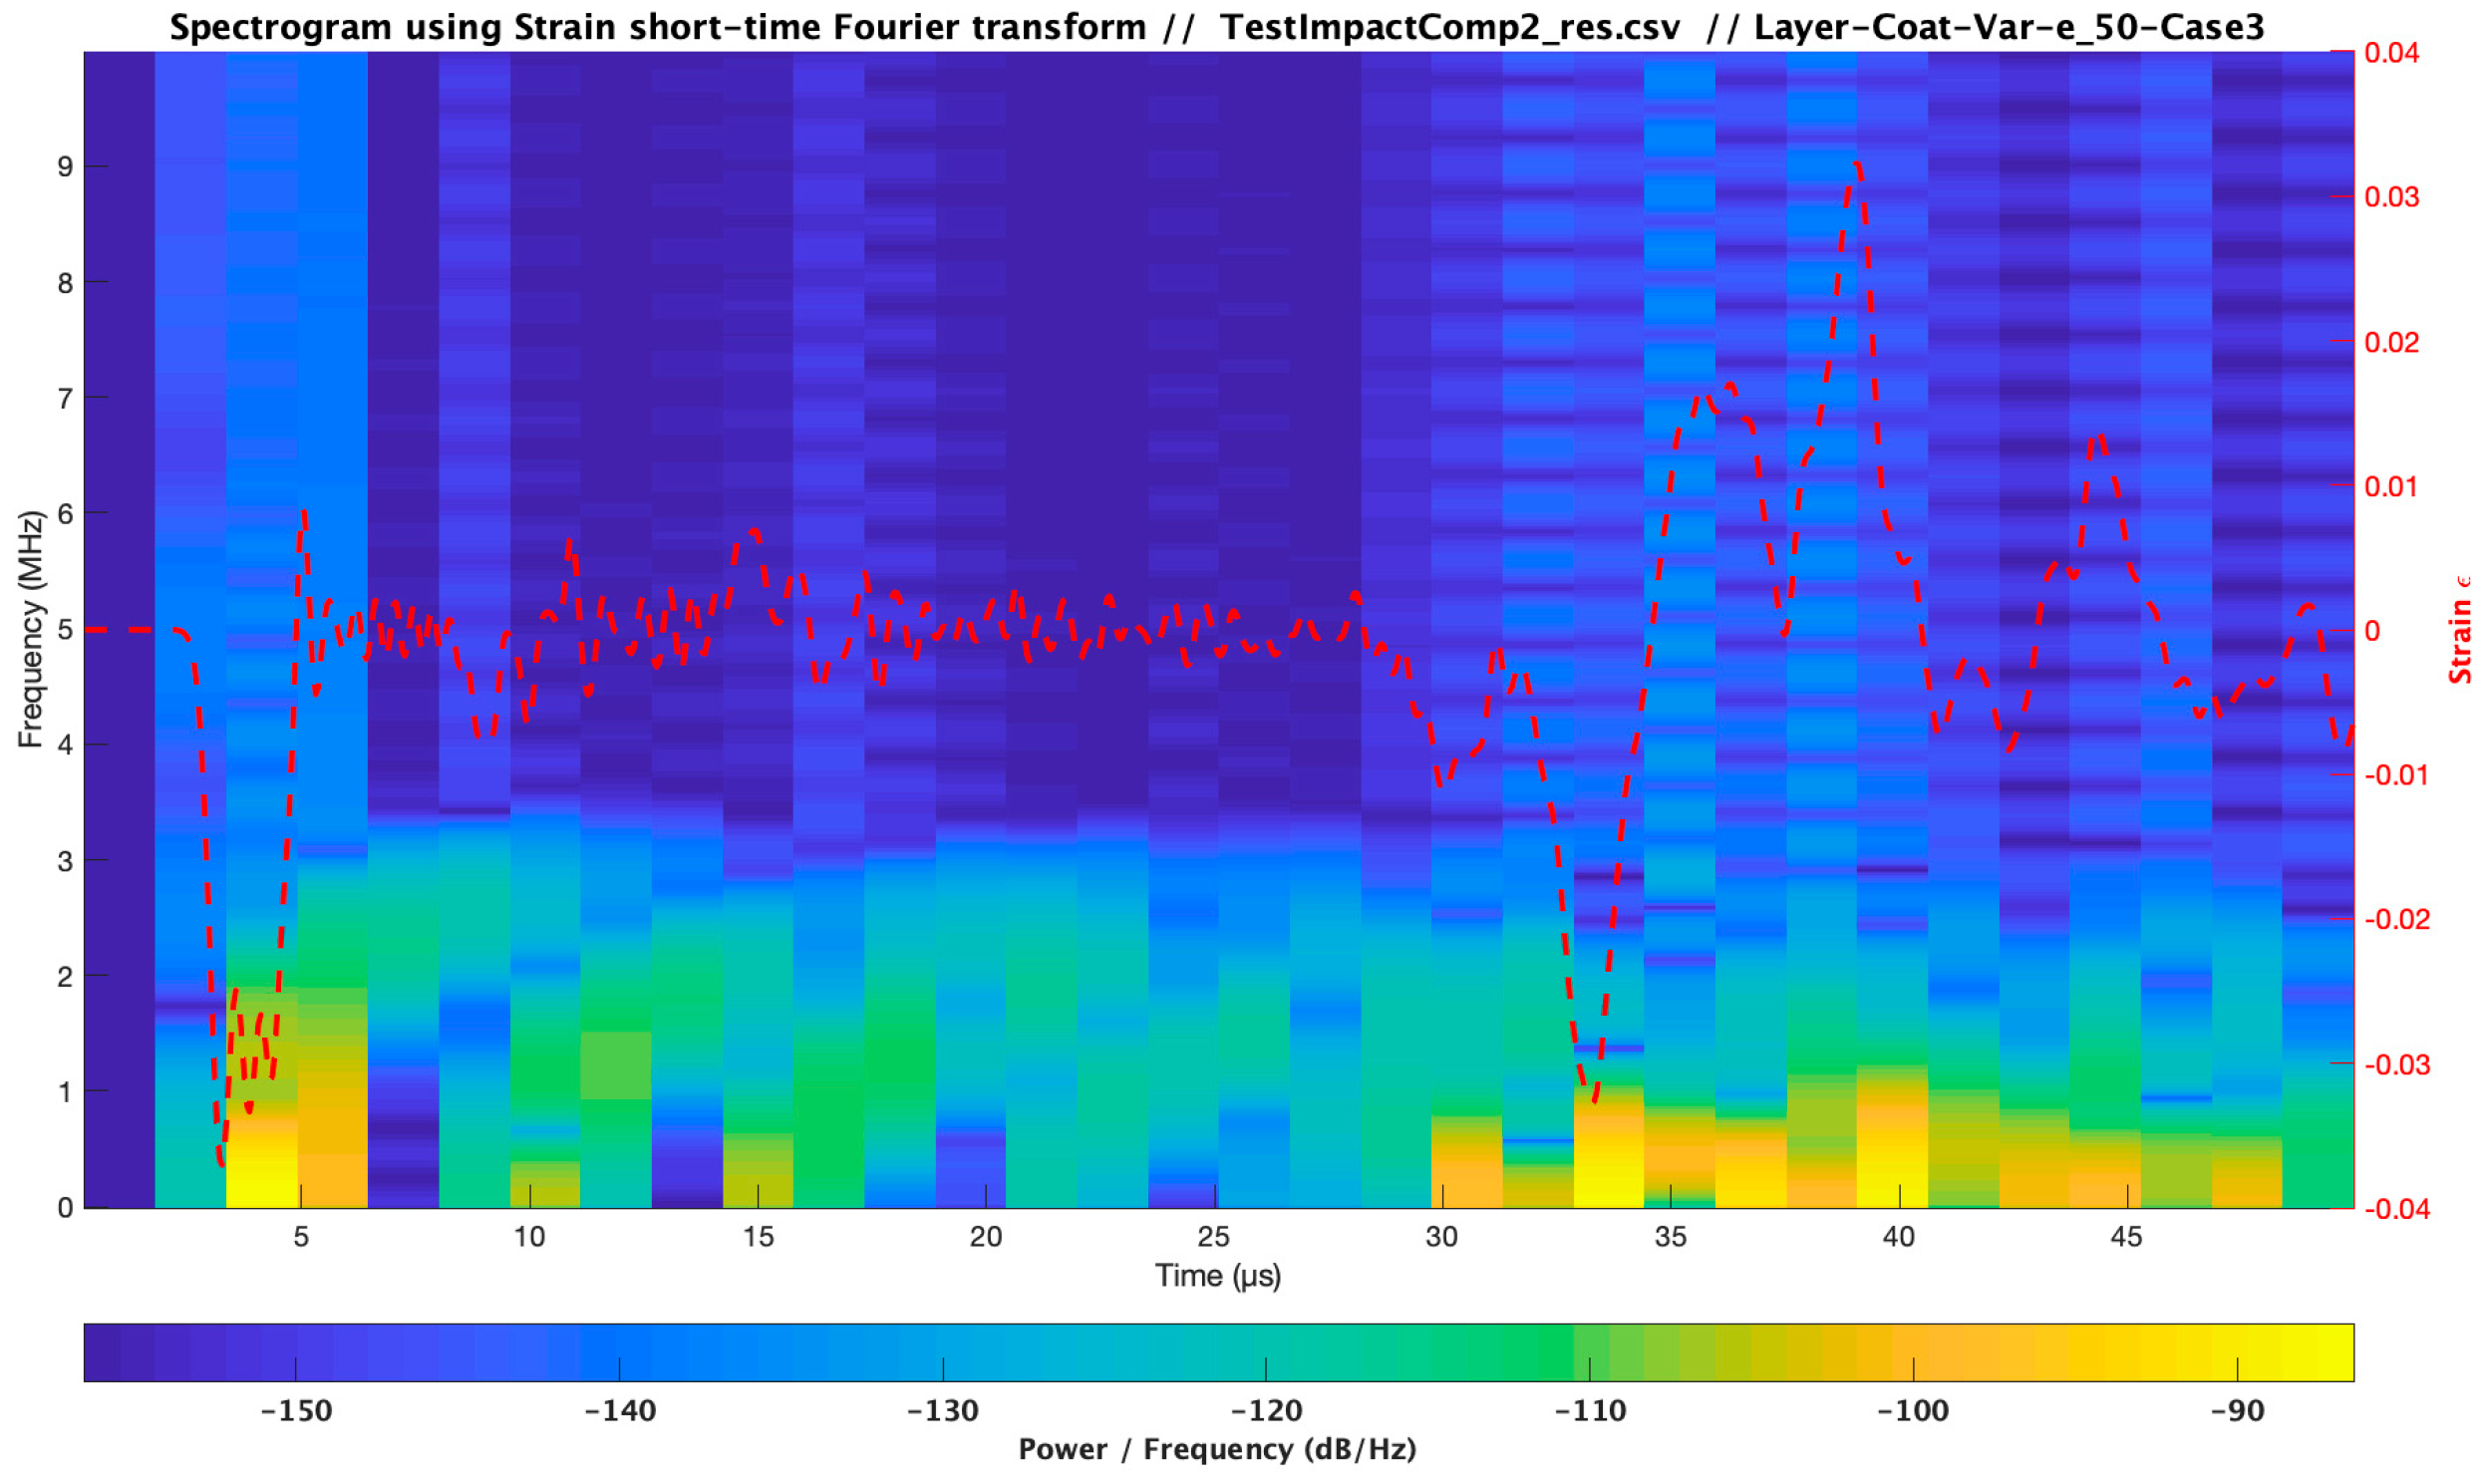
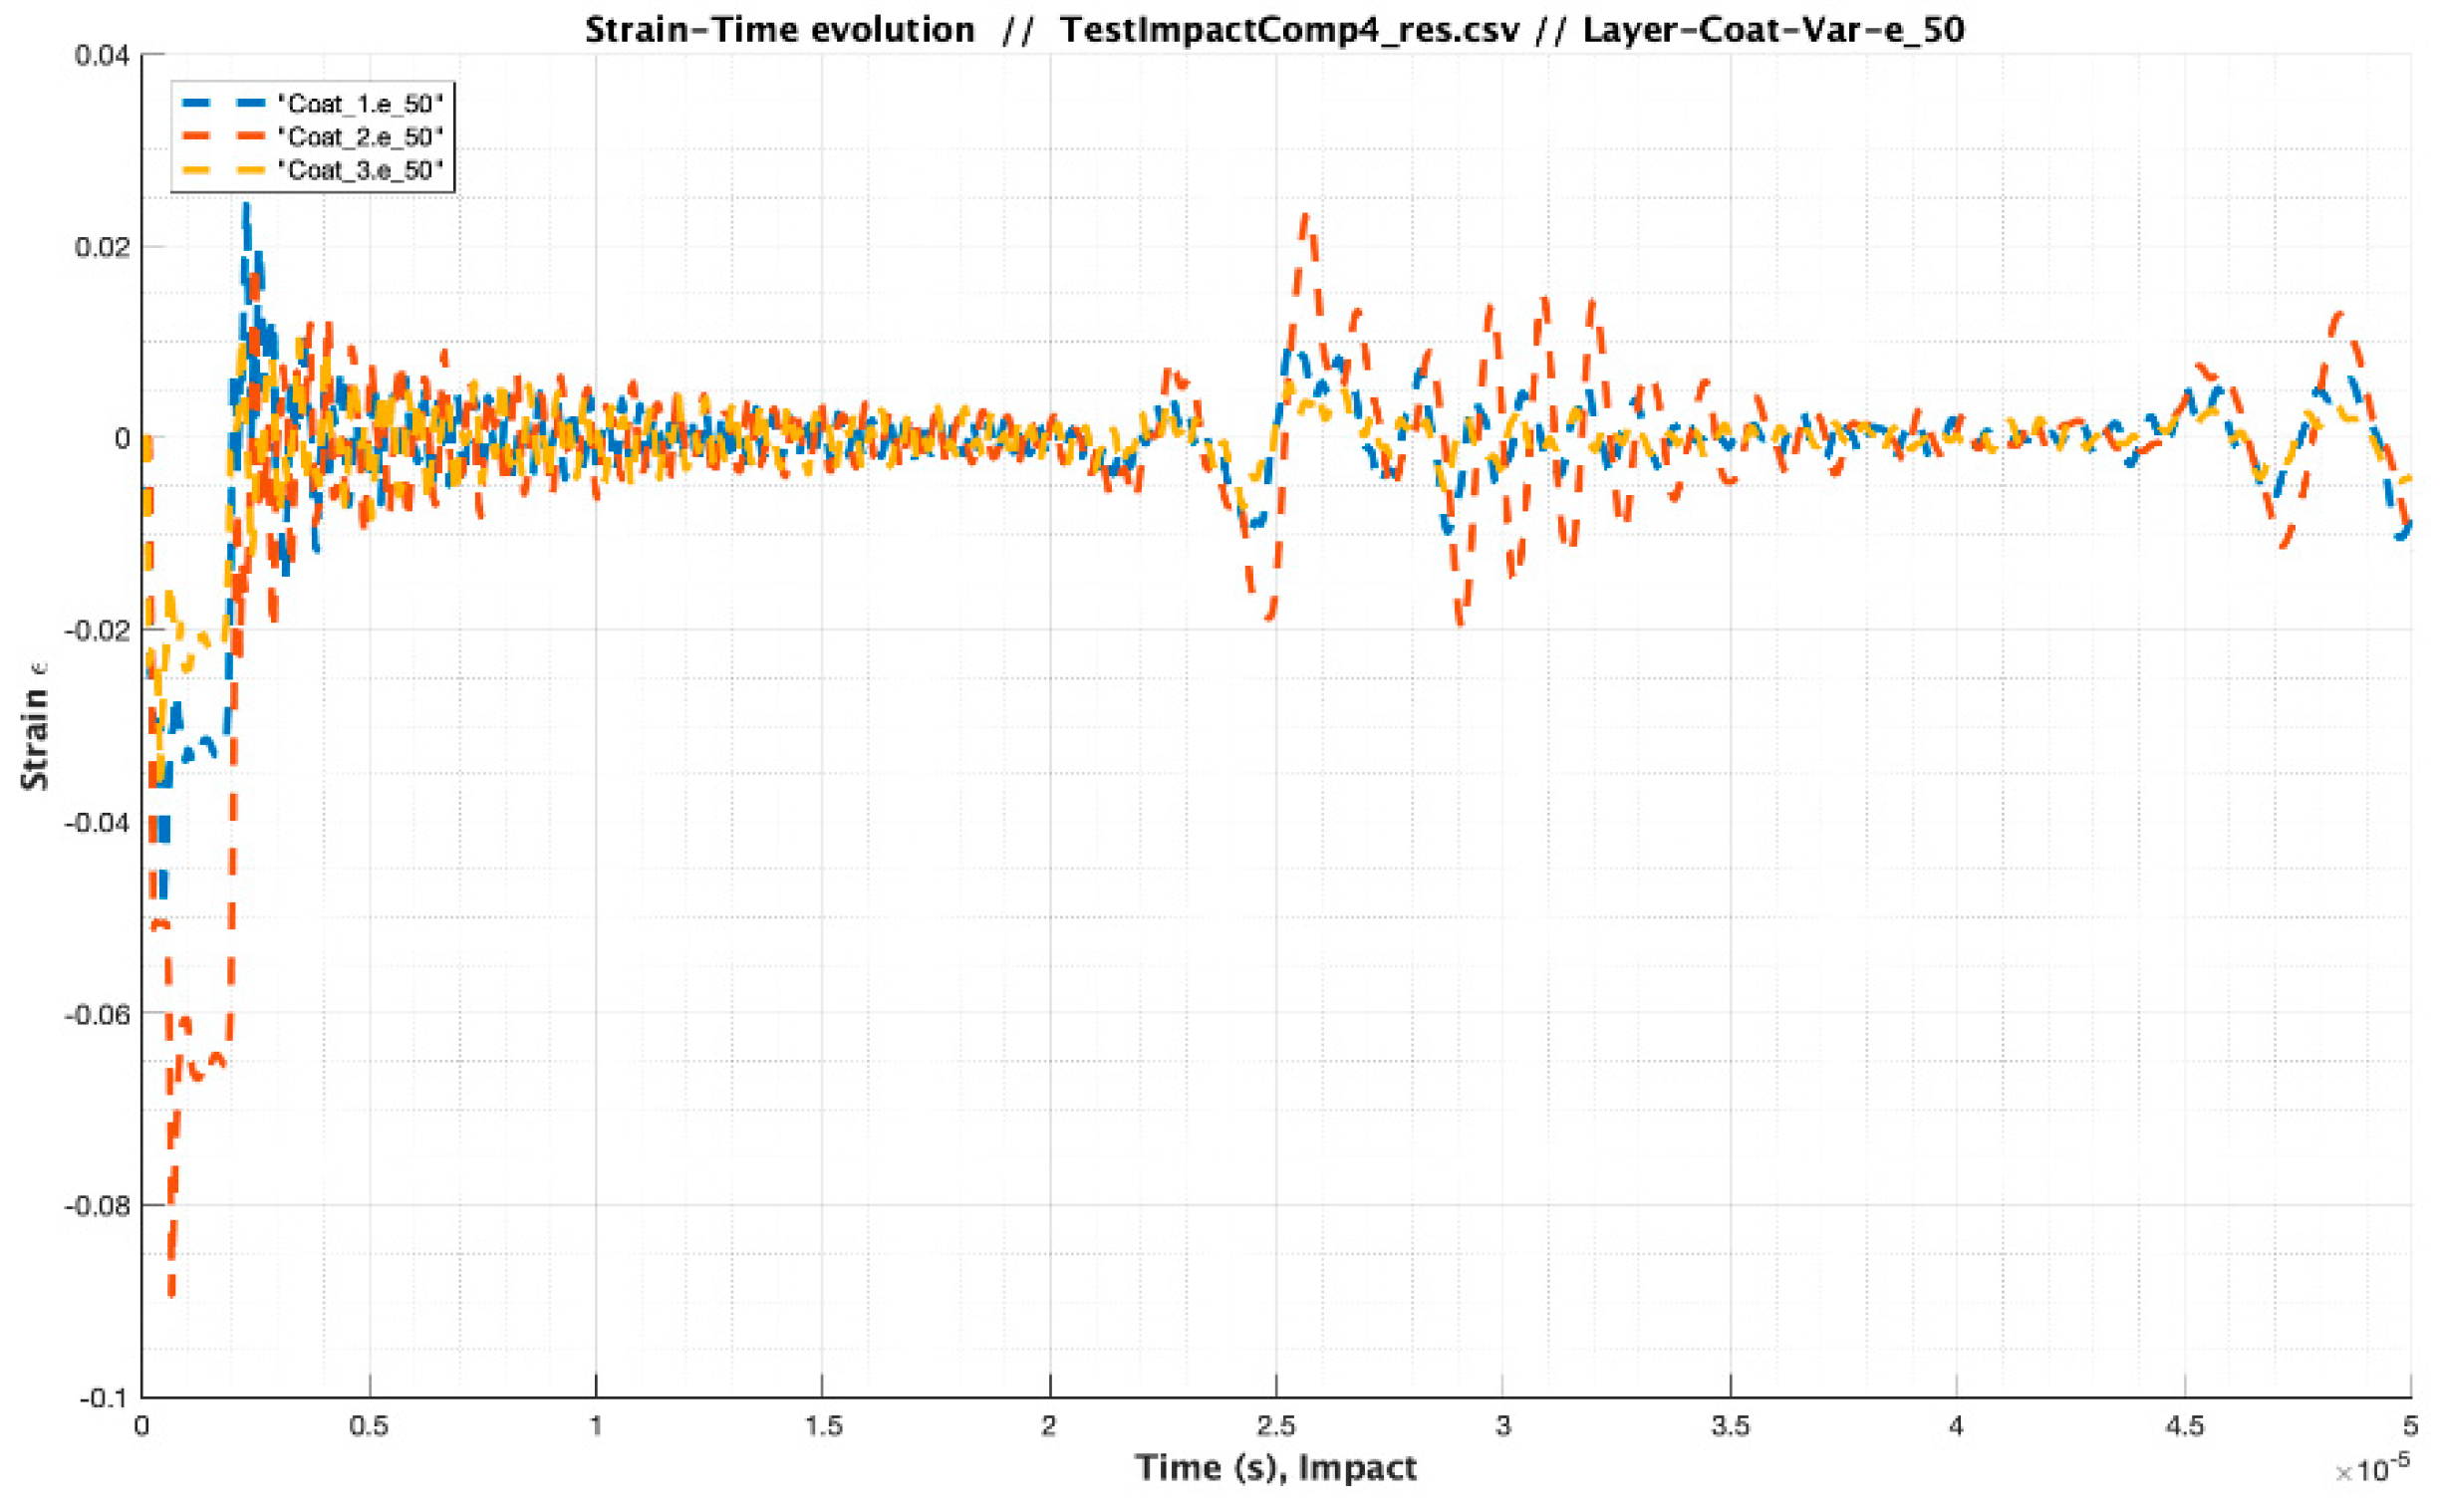
3.2. Stress-Strain Frequency Range Analysis during Droplet Impingement

The working frequency range definition of a given single droplet impact is a complex phenomenon that needs appropriate 3D Stress-Strain analysis out of the scope of this work and depends on many operational variables. In Springer model it is simplified analytically considering the impact as a step-like function defined by means the droplet size, the water and coating speed of sound and the impact speed (see first section of this document). In this work, the impact velocity of the droplets is defined for the conditions of the collision without differentiation of the rotor speed or the gravity effects of the rain droplets. The impact pressure is then considered through Water-hammer pressure that depends on the speed of impact and the liquid and surface impedances. The total impact duration tL depends on the droplet diameter and the speed of sound in the liquid,
t L = 2 d C L
It can be observed in Figure 11 this step wise force pulse definition yields a Fourier Transform decomposition with not valid frequencies due to the abrupt change on the time required to build up and down the contact forces.
A first approximation of the problem would be to consider droplet with shape completely round with diameters in the range of 1–4 mm, so the corresponding duration of impacts tL are 1.35–5.4 µs and if We assume that the time to build up and down is at least half of the impact duration time then, ½ tL, give as a relation for the frequencies of that force pulse with values of 0.18–0.74 MHz, respectively.
In order to improve understanding the stress-strain development in the LEP system, we will introduce different modelling cases of analysis with alternative to Springer model assumptions:
  • Including appropriate coating material models that allow us to observe the viscoelastic behaviour (with consideration for high transient strain rate deformation, and variable stiffness and damping with frequency) and not as a pure elastic event. Water droplet properties are incorporated and assumed constant in this work, but more complex material models could also be included in the developed modelling. Moreover, density variations for coating and water due temperature are also circumvented and are assumed constant during the impact event.
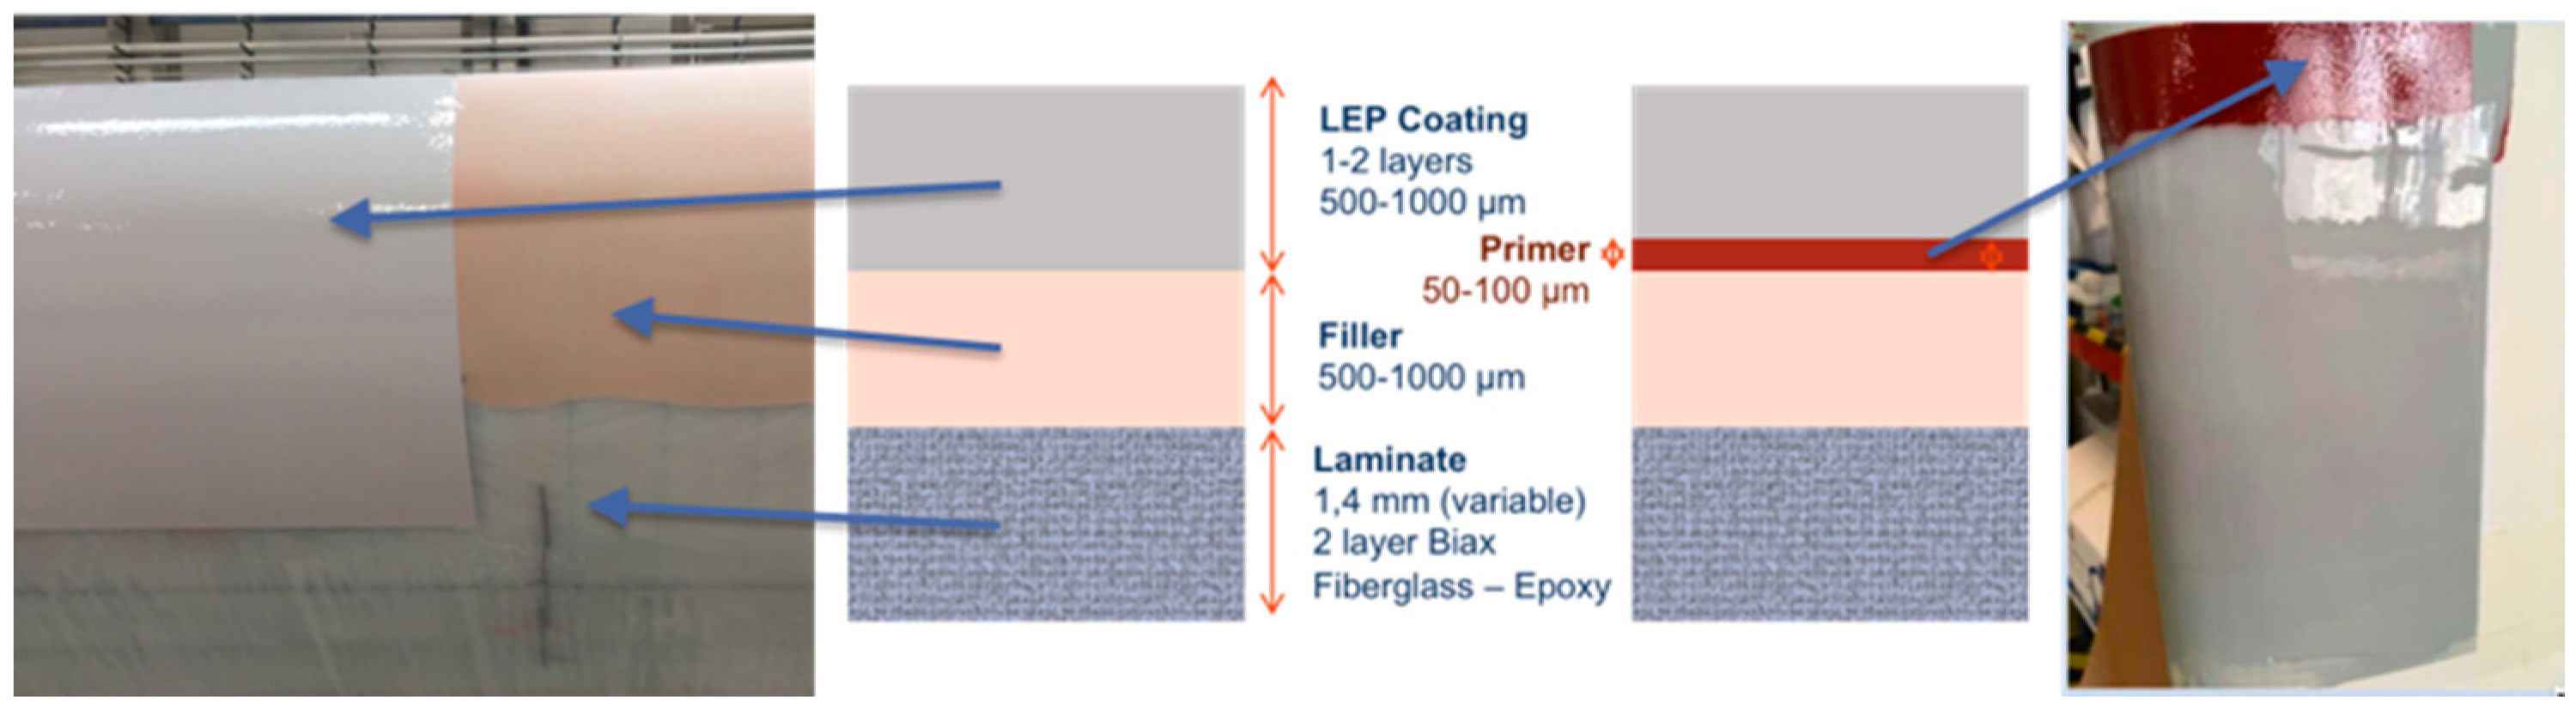
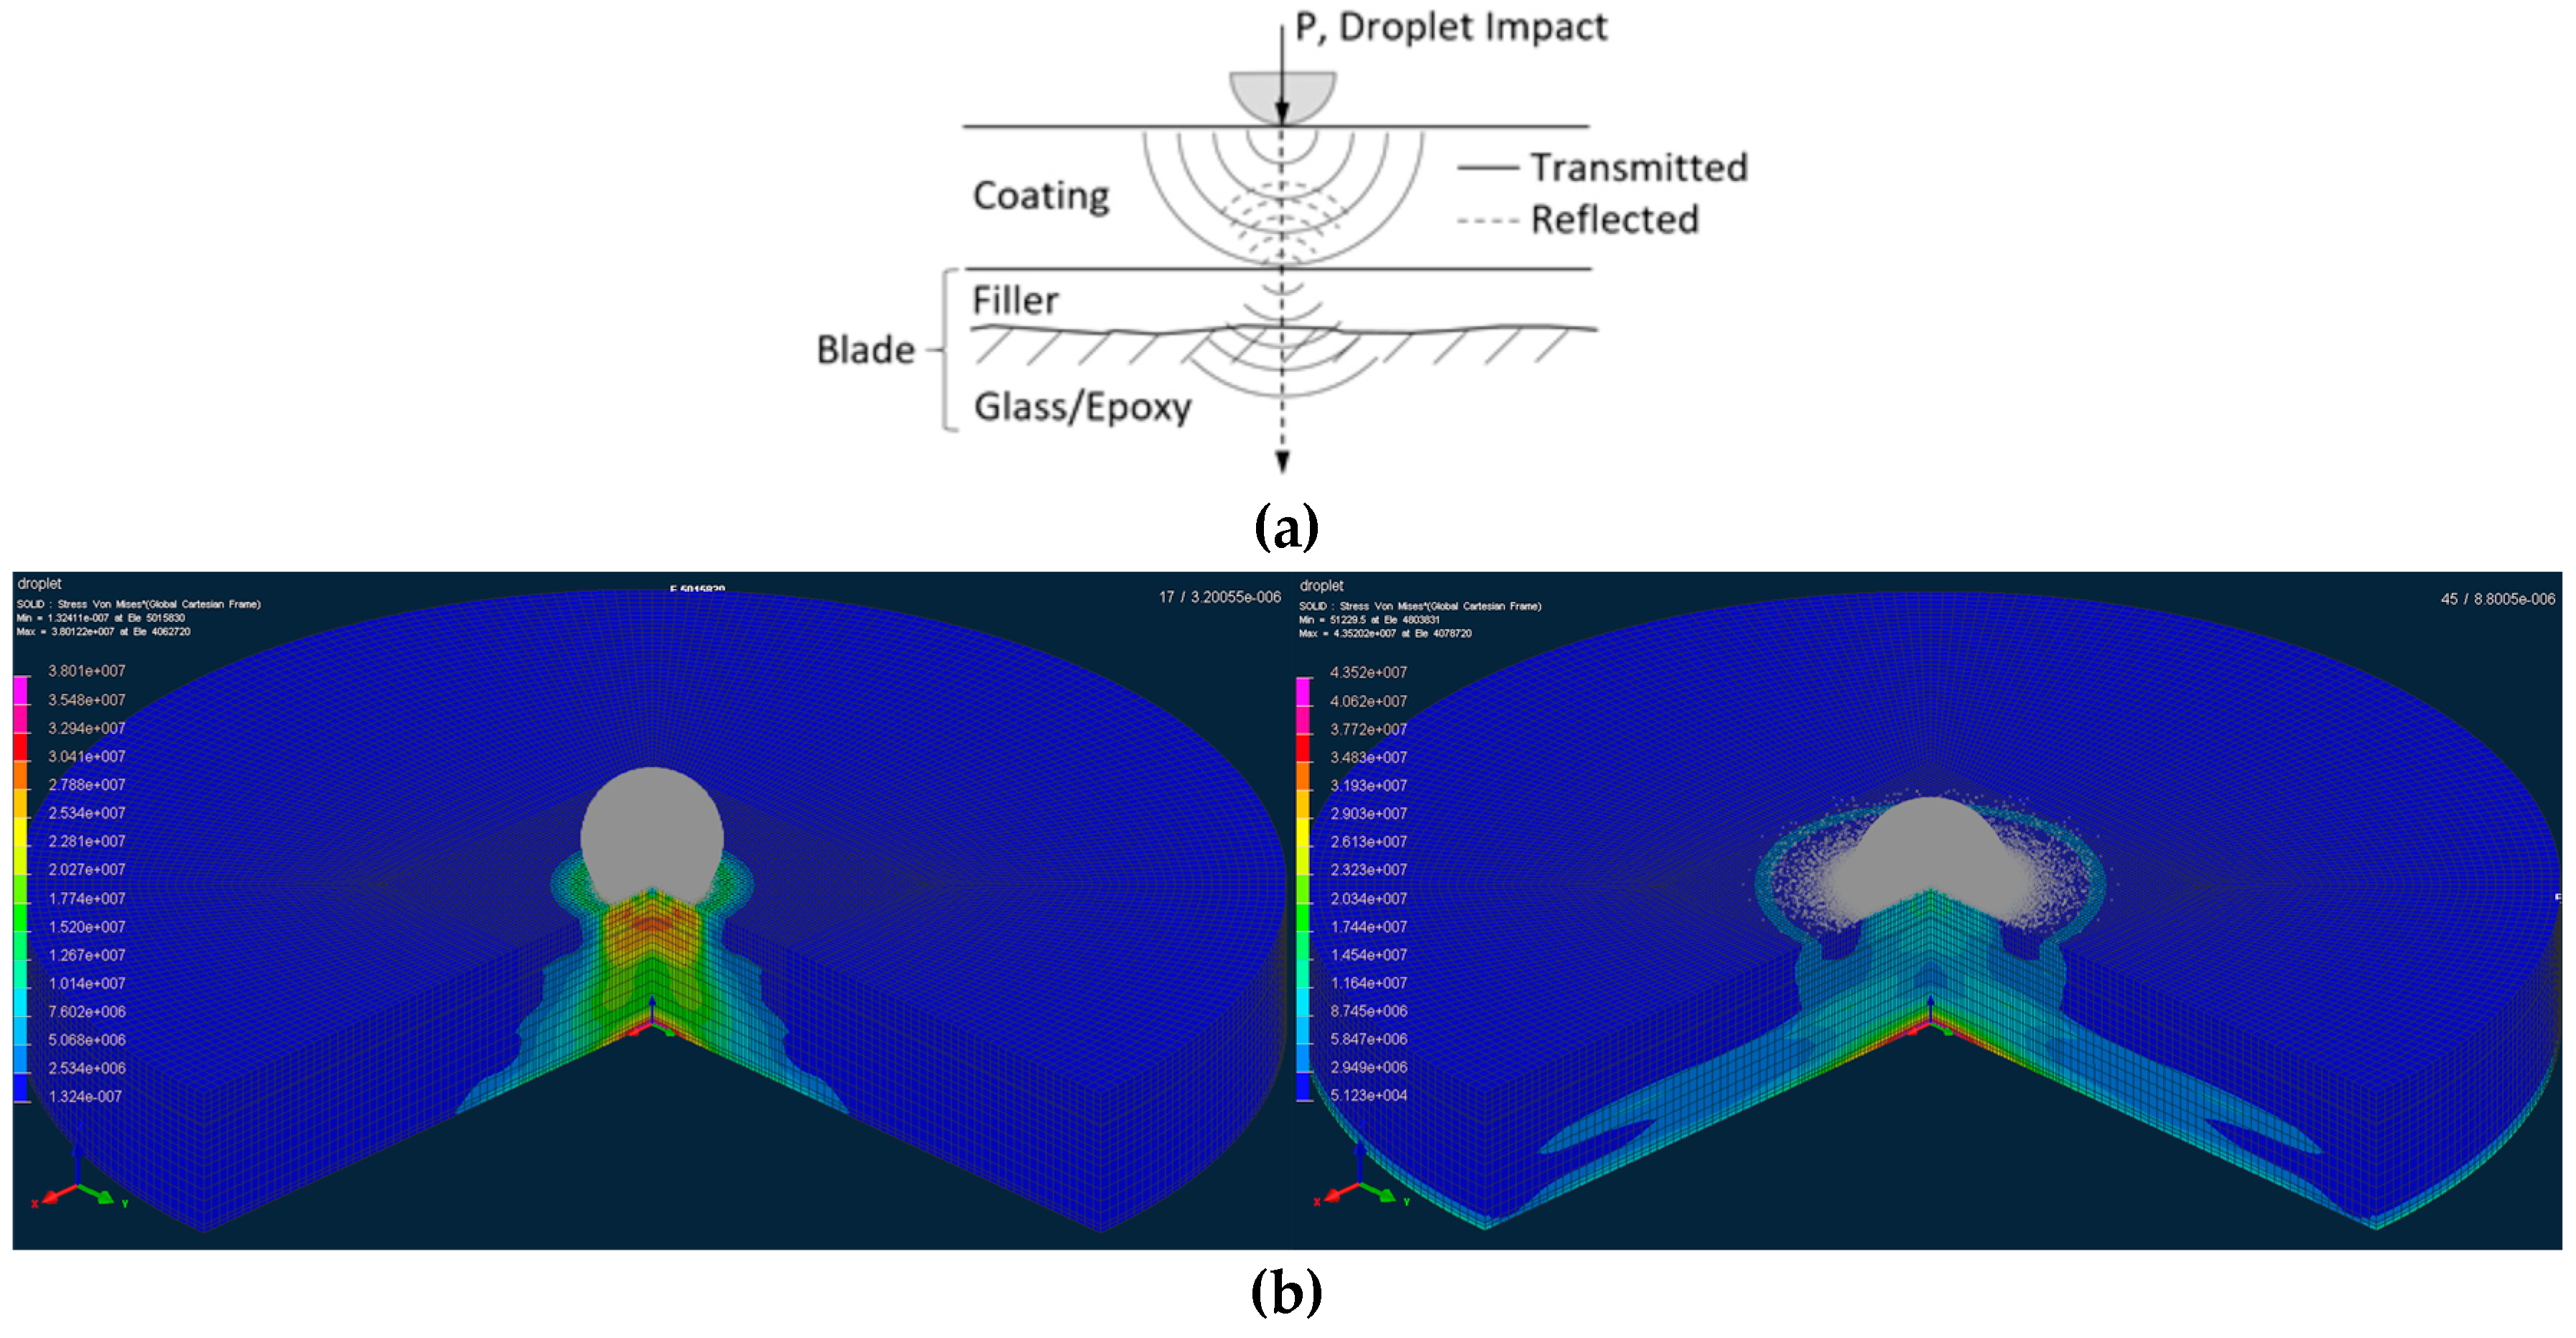
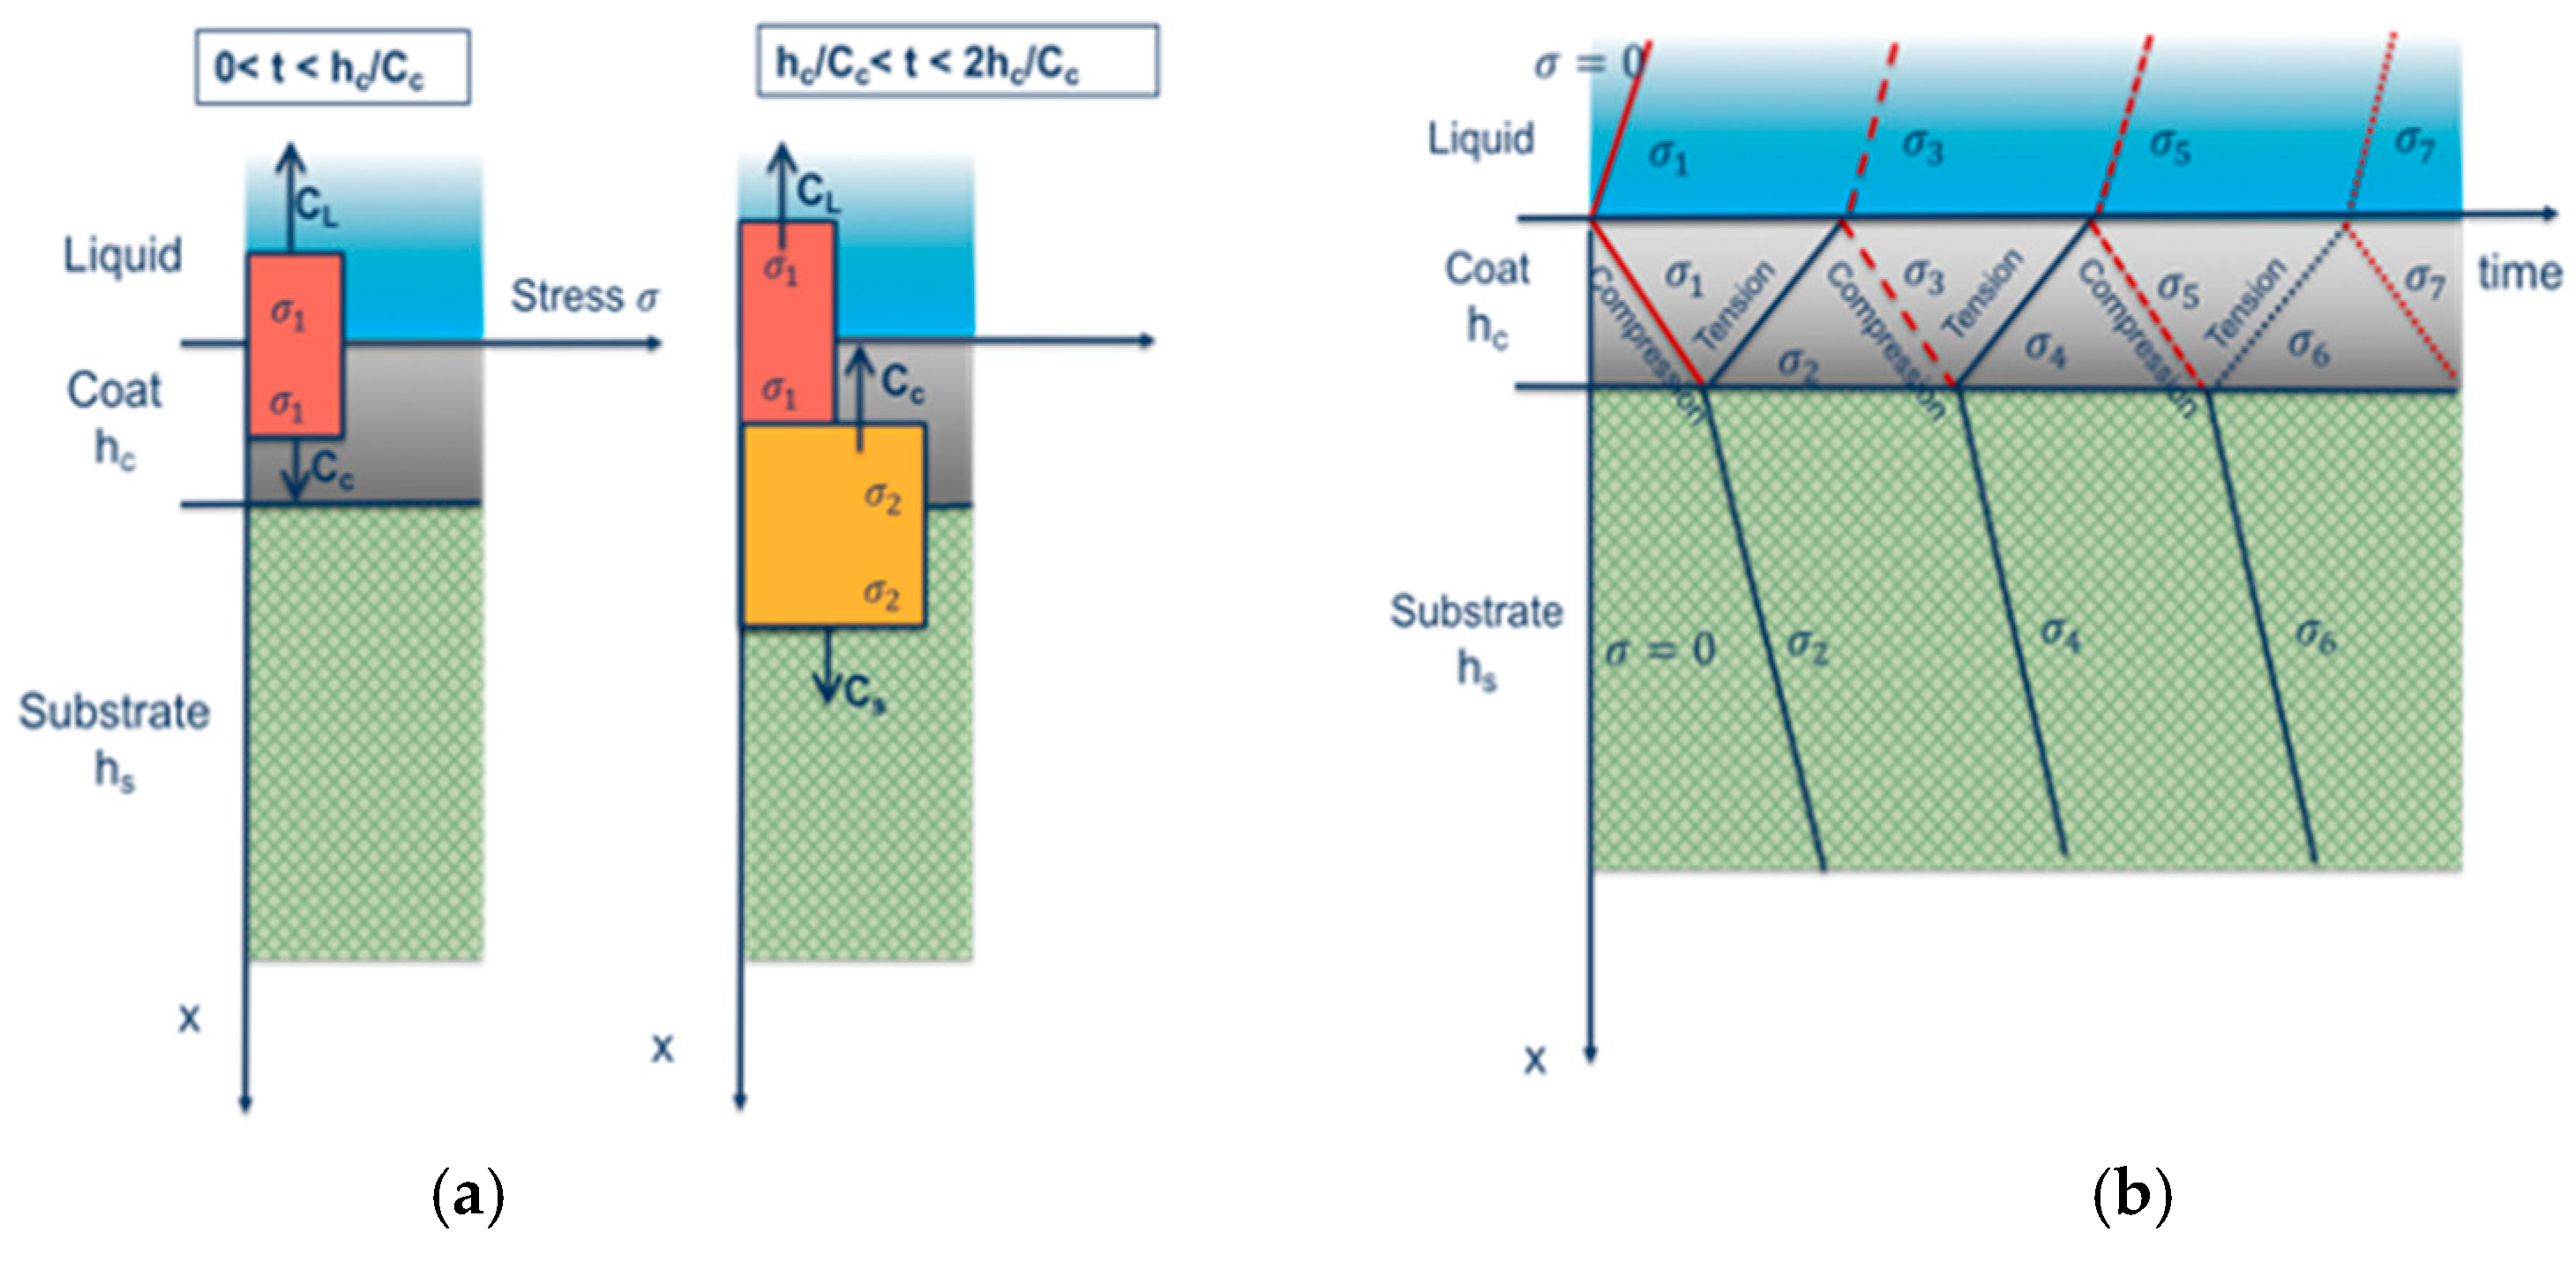
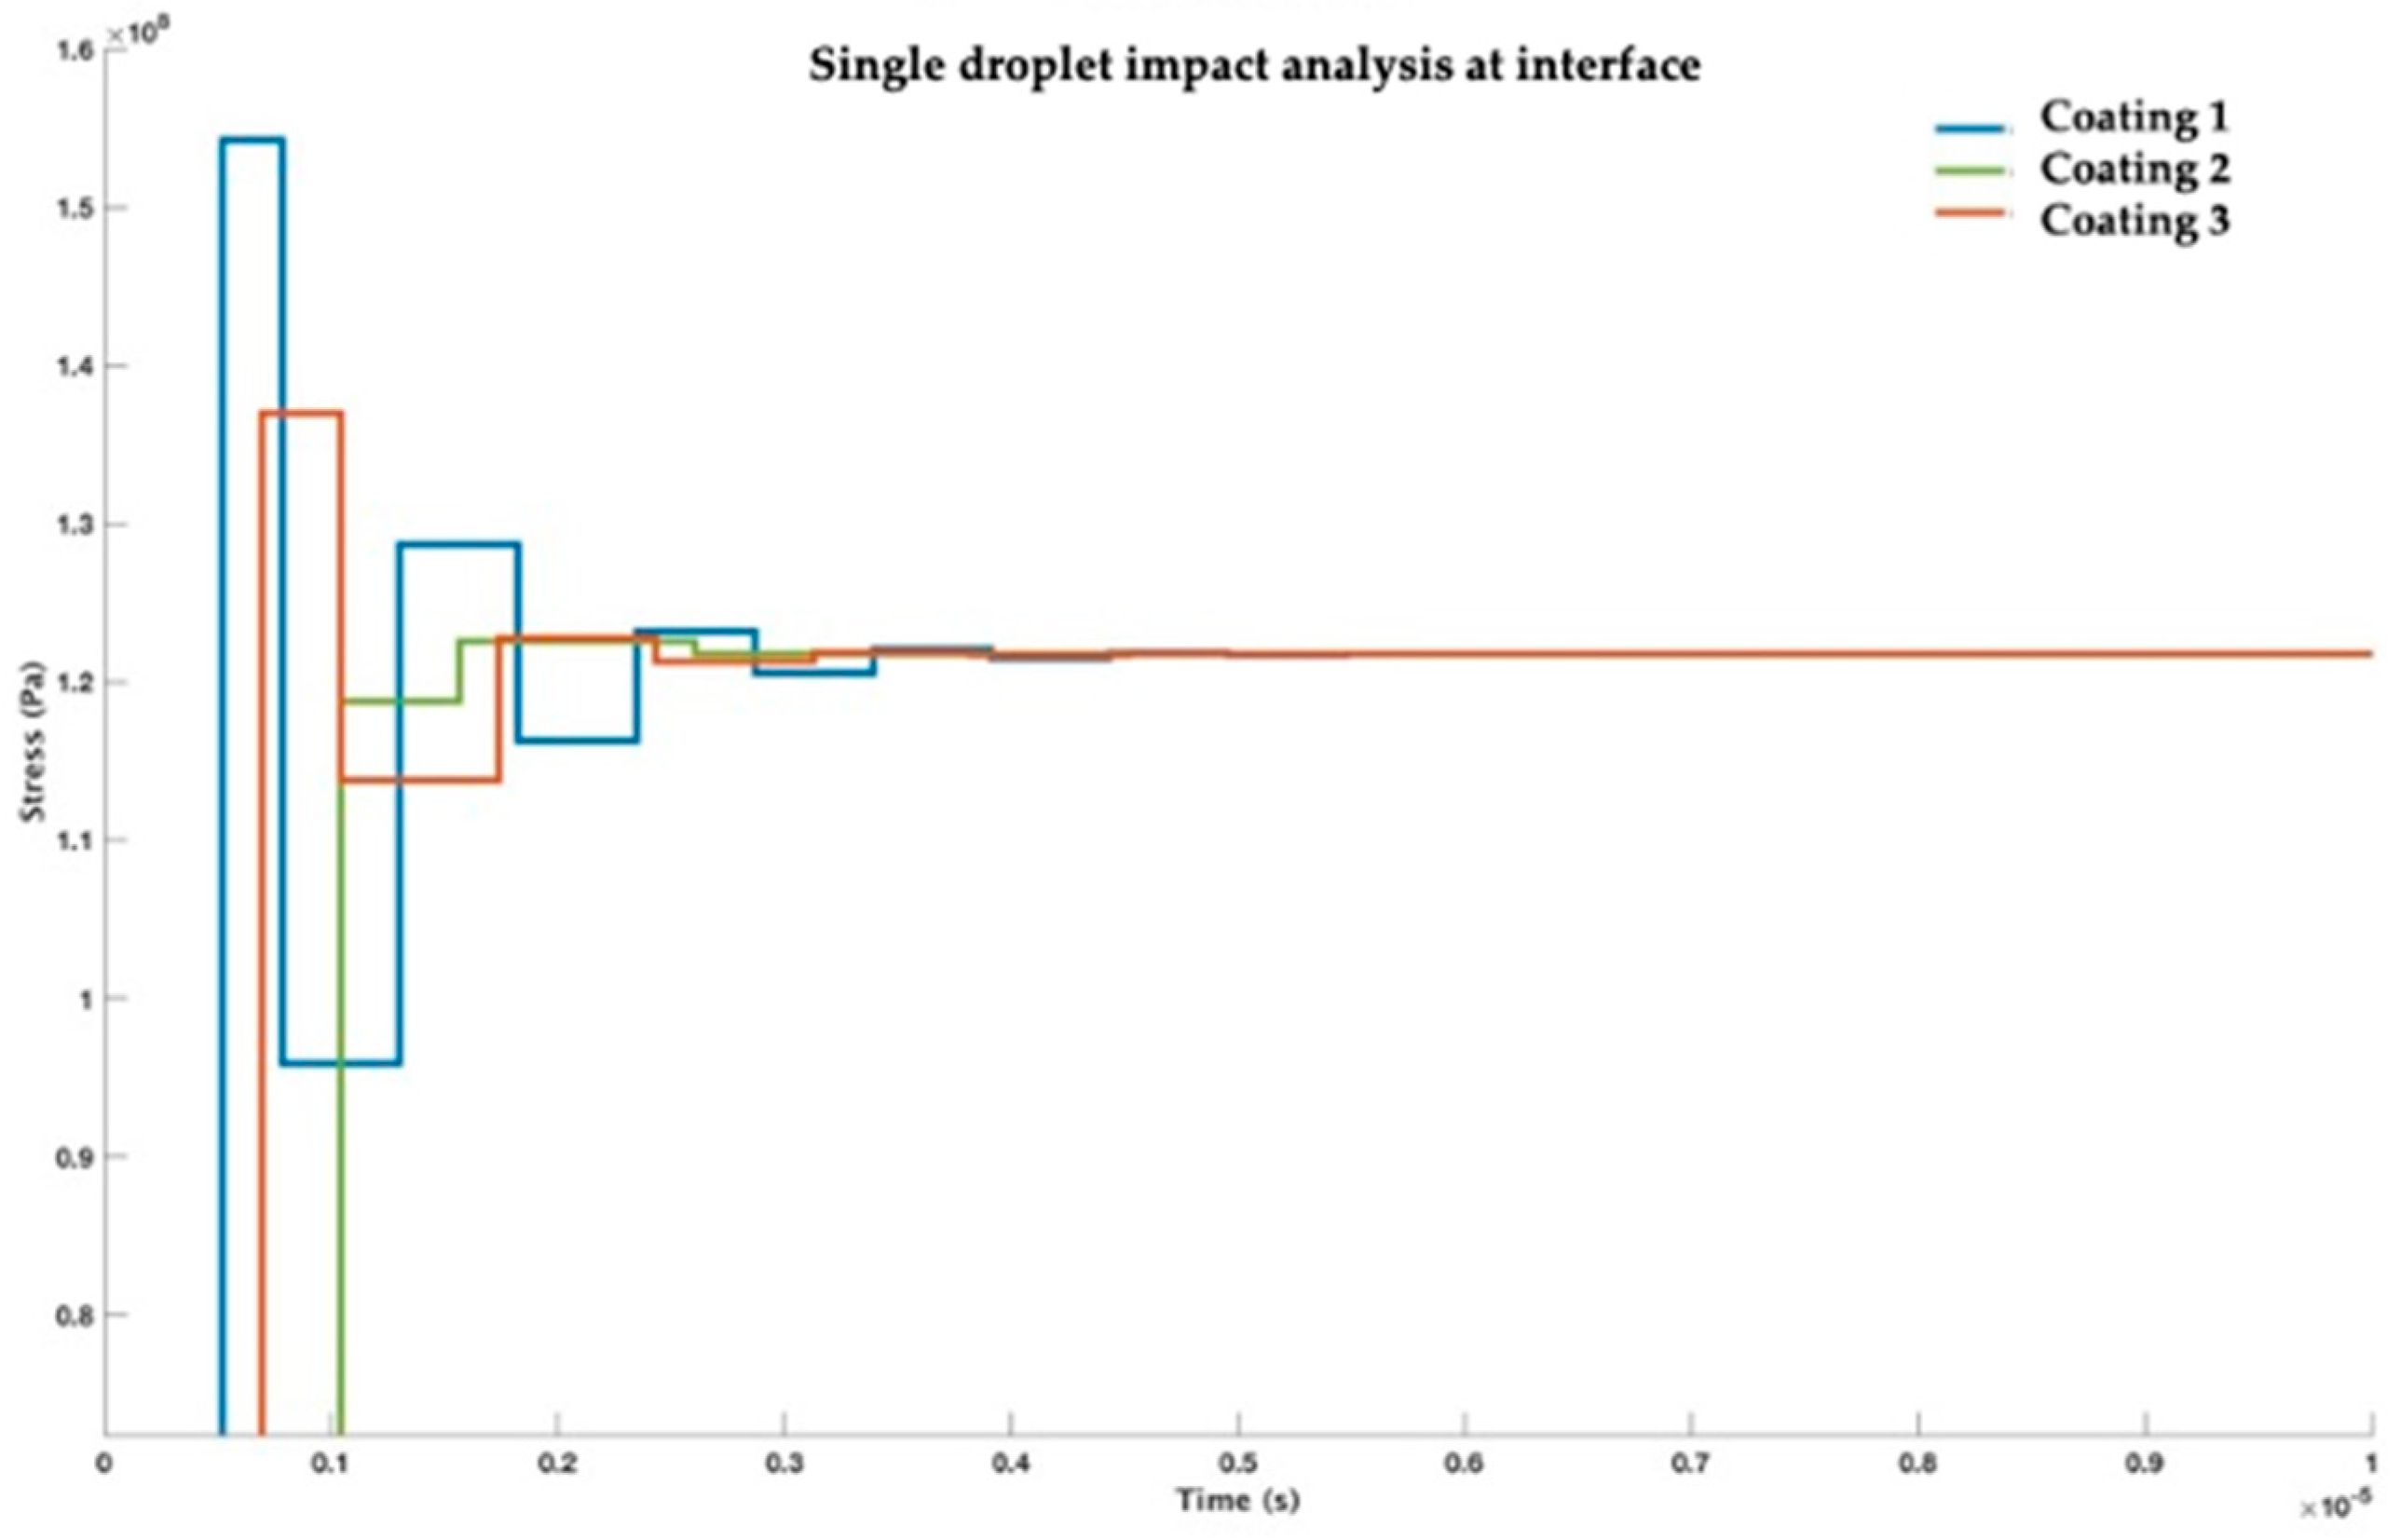
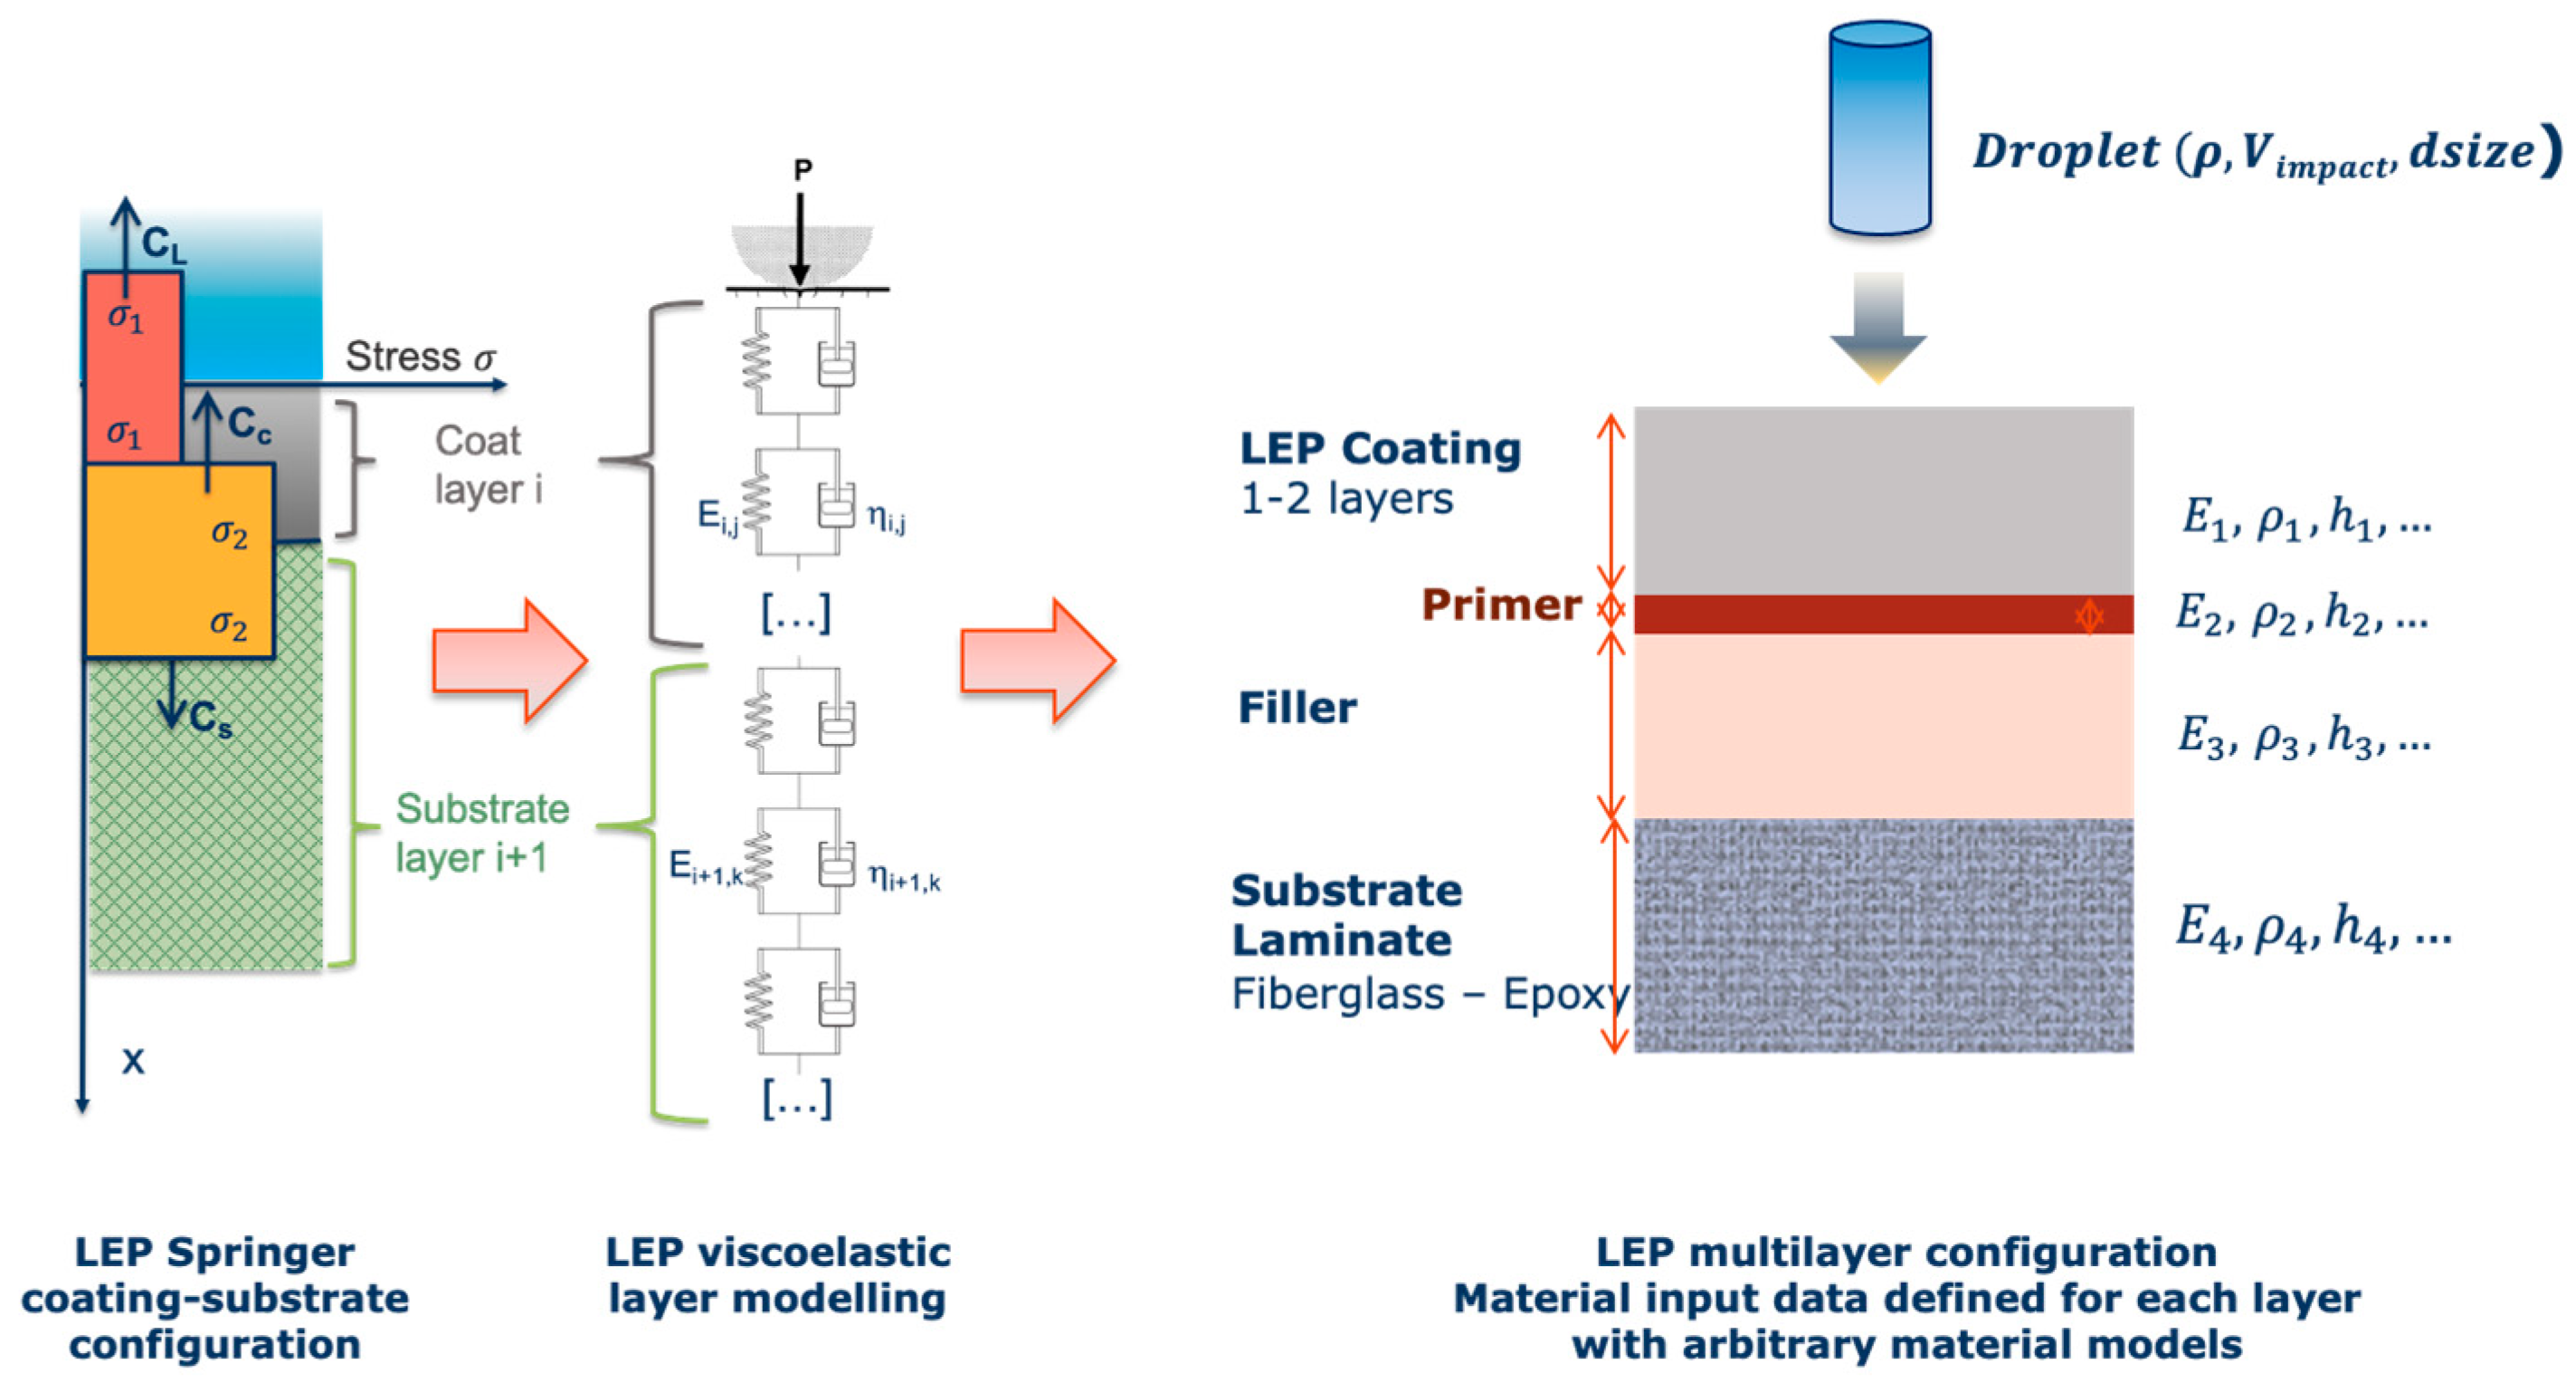
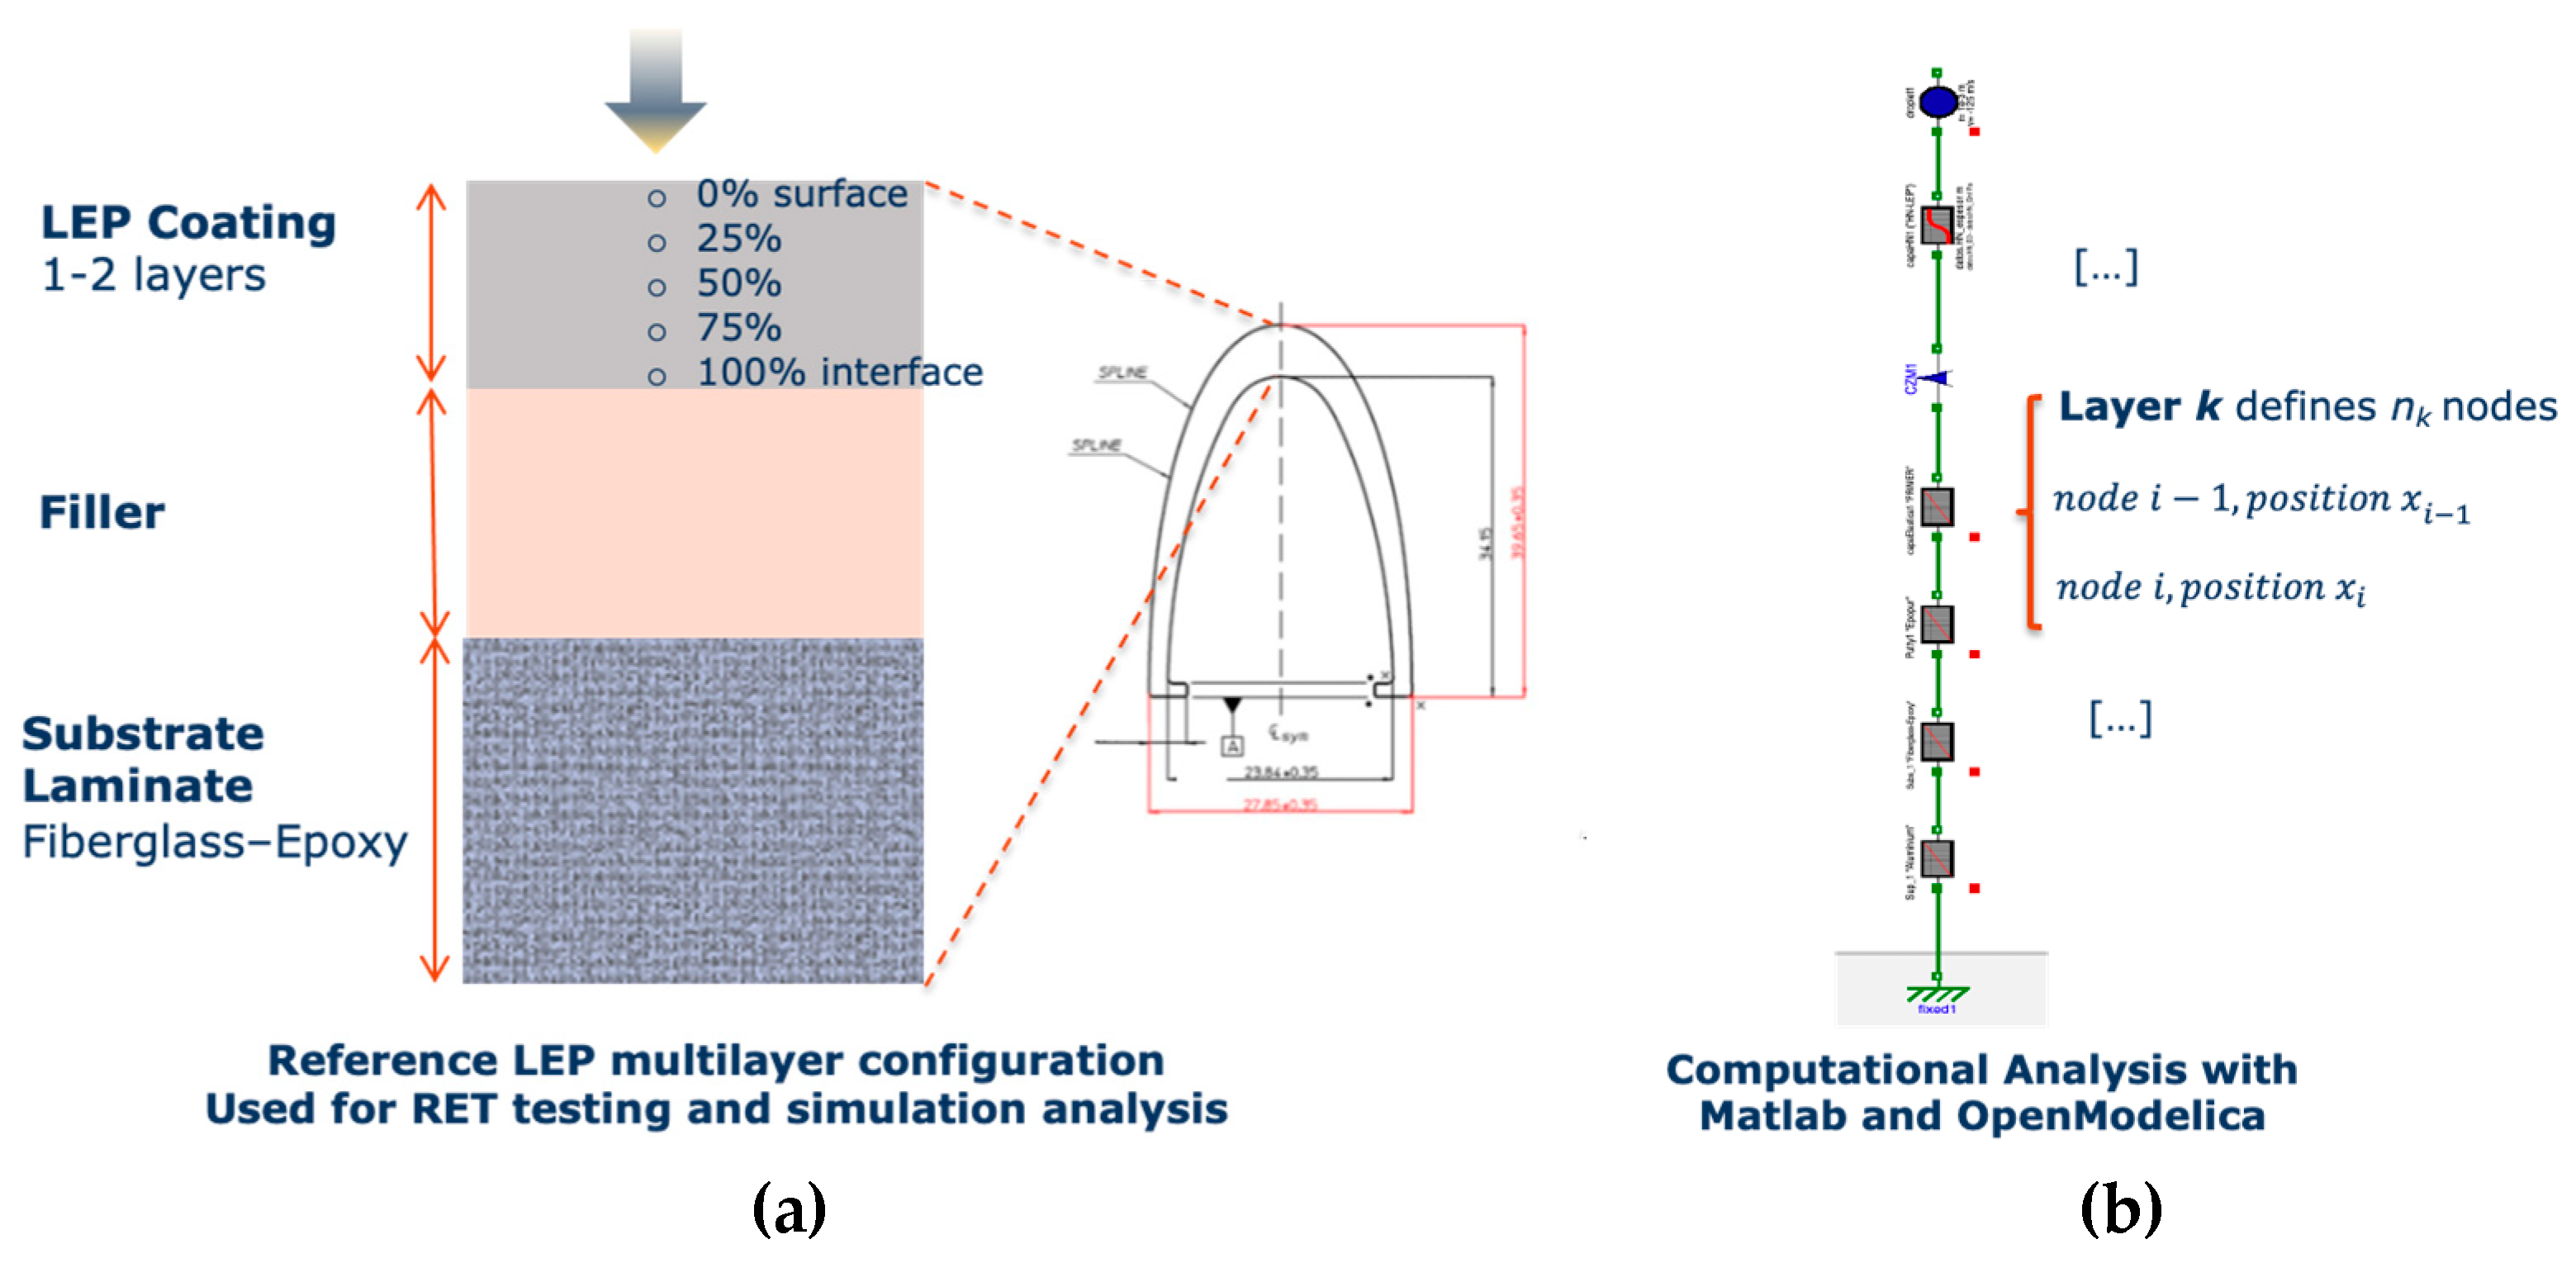
  • Springer model undertakes a two layered structure with the substrate thickness assumed semi-infinite. We will treat the LEP system as a multilayer configuration so We will be able to observe additional wave reflections on the interfaces that affect also the surface coating. The algorithm considers water as an additional layer to allow stress wave reflections at liquid-coating interface. The initial impact conditions consider the coating as a dry surface, nevertheless, the water could also be considered as an additional thin layer from previous droplet impact but it is neglected in this work to avoid complex liquid-coating contact modelling following Springer assumptions simplification.
  • 1D formulation examines the impact of a liquid droplet treating the problem only as tensile-compression event. This simplification is applicable since shear stresses and shear material characterization are out of the scope of the fatigue analysis case involved.
The simplified model proposed that considers these assumptions, see Figure 12, has been numerically developed in Open Modellica [19]. The algorithm that includes the material models is outlined in Figure 13. This LEP configuration is defined for rain erosion testing performed at PolyTech Test & Validation A/S according to DNV-GL-RP-0171 [22], see Figure 14.
The numerical procedure was implemented in a general LEP configuration according to Rain Erosion Testing coupons. Simulations of the stress-strain behavior caused in the multilayer system are computed for a given 1D discretization through the thickness position solving for a set of material nodes that belong to a particular homogenized layer. The Equilibrium equation to be accomplished for any two consecutive nodes in the multilayer system is given by
m i d 2 x i d t 2 = F i 1 , i F i , i + 1
where layer k defines nk nodes, node i−1 defines position xi−1 and node i position xi. The material models implemented to state a given layer k give us distinctive stress-strain behavior that can be modelled as:
  • Pure elastic model, where A is the impact area defined by the droplet size and E is the elastic modulus
    F i 1 , i = A · E ( x i 0 x i 1 0 ) ( x i x i 1 x i 0 + x i 1 0 )
  • Kelvin-Voight (KV) viscoelastic model, where η is the viscosity,
    F i 1 , i = A · E ( x i 0 x i 1 0 ) ( x i x i 1 x i 0 + x i 1 0 ) A · η ( x i 0 x i 1 0 ) ( d x i d t d x i 1 d t )
    and considering appropriate estimation of the viscosity attenuation observed in as:
    σ t o t a l = σ s + σ d ε t o t a l = ε s = ε d σ = E ϵ + η d ε d t E * = E + i E = E + i 2 π f η η = E 2 π f
  • Havriliak-Negami H-N viscoelastic model [32,33,34], where E define the unrelaxed or glassy modulus, and E o is the relaxed rubbery modulus and τ is the relaxation time, see Figure 15 and Figure 16.
    F i 1 , i + τ d F d t = A · E 0 ( x i 0 x i 1 0 ) ( x i x i 1 x i 0 + x i 1 0 ) A · E ( x i 0 x i 1 0 ) ( d x i d t d x i 1 d t )
This simplified computational tool allow us to treat as parameters the material models (as pure elastic, Kelvin-Voight, Havriliak-Negami, etc) and their related properties (density, storage modulus, loss modulus, tan delta, speed of sound, thickness, etc), the operational variables (impact velocity, droplet diameter size, droplet density, droplet speed of sound, etc). In order to quantify the strain rate analysis of the single droplet impact simulation, we will evaluate different cases considering the effect on variations in coating-substrate thickness, viscoelastic material properties, droplet size and droplet impact velocity from a reference configuration used in RET testing (Figure 13). The input data values for these prototype materials of Table 1 where defined initially from previous testing results and here are used for the exposed modelling procedure in order to discuss Stress-Strain frequency range analysis during droplet impingement.
The strain-stress evolution with time is evaluated at different locations of the LEP coating for appropriate comparison. The specific location of the analysis through the layer thickness is defined as variable e_x for the strain and variable s_x for the stress, where x is defined at surface x = 0, interface x = 100, or any intermediate positions with x = 25, 50 or 75 referring all to the given % of the layer thickness, see Figure 13.
A first result for the analysis of the reference testing LEP configuration is plotted in Figure 17. It is observed the strain evolution with time at the surface of the coating layer e_0 comparing two cases: Coat_1 using a pure elastic modelling of the coating material compared with Coat_2 using a Kelvin-Voight modelling.
In addition, the spectrogram of the strain evolution with time for a given location e_x is calculated with the Fourier transform applied in short-time periods though the duration of the impact analysis (0–50 µs). The strain frequency decomposition during the impact event, provide us a plot of the dominant frequency spectrum with a range of values (measured as power (dB) over Frequency (Hz)), for each time analysis period. This procedure allows us to estimate indirectly the highly transient strain-rate variations for the single droplet impact event.
Figure 18 and Figure 19 show as a first simplified approximation, the effect of the inclusion of the attenuation consequence due to the material modelling definition. The reason for such comparison is to clarify that the material properties are frequency dependent so the input data for the modelling. This assumption is important to consider when we define the speed of sound as a constant variable in our analysis. A first conclusion for the developed case is that the most dominant frequencies occur during the first stage of the impact and that Kelvin-Voight material modelling is appropriate to avoid additional frequency noise due to the lack of attenuation when using pure elastic material models.
The computational analysis limits the frequency in a range of 0.5–2 MHz for this initial set-up conditions.

3.3. Influence of Coating-Substrate Thickness Variations

In this section, the strain-stress analysis ponders first the effect of considering a variation on the coating thickness over the reference case for the initial testing coupon of Table 1. Two cases of study are related with variations of the given parameter multiplying its value by 1,4 for Cases 1 and 2 respectively as shown in Table 2
Figure 20 shows the influence of the Coating thickness on the stress developed at surface (s_0) and interface (s_100) for the Case 1 (reference LEP configuration). The peak values observed at interface depends also on the acoustic matching with the filler. Since the material develops different stress-strain values through its thickness, a proper layer location for comparing the strain evolution is considered to be defined at its intermediate 50% thickness location i.e., e_50, s_50. Figure 21 and Figure 22 for Cases 1 and 2 comparison.
It is important to observe the high values of the reflection stresses developed due to the multilayer interfaces effect due to the low value of the substrate thickness of the reference LEP multilayer configuration. Springer model limits this assuming that the substrate (filler) layer has to be considered semi-infinite, h s > 2 d C s C L , which means in fact that the reflections are not considered in the fatigue analysis for computing the average stress values on surface. Other additional effect is considering very thick coatings with h C > 2 d C c C L by means of shells or tapes. Cases 1–3 analyze the effect of increasing 20 times the filler thickness and 1, 10 and 20 times the coating thickness compared to the initial reference LEP multilayer configuration of Table 1, detailed variation input data is defined on Table 3.
It is observed in Figure 23 and Figure 24 the lower value of stress at surface (s_0) and middle location layer (s_50) due to the increment of coating thickness (so its damping capabilities). It is also appreciated the delay on wave stress reflections due to the increase on the substrate-filler thickness.
Figure 25, Figure 26 and Figure 27 show the corresponding influence on the strain frequency spectrum where the higher strain-rate variations are developed in the periods of time closer to the impact pulse and the wave traveling reflections.

3.4. Influence of Coating Viscoelastic Property Variations

In this section, the strain-stress analysis considers the influence of pondering a variation on the coating stiffness over the reference case for the testing coupon of Table 1. Three cases of study are related with variations of the given parameter multiplying its value by 1, 0.5 and 1.5 for Cases 1, 2, and 3, respectively as shown in Table 4.
Figure 28 show the strain in the coating layer due to a variation on the modulus for the three different cases. It is detected an abrupt variation in the strain-rate values and its corresponding effect on the strain frequency spectrum, Figure 29 and Figure 30. The dominant working strain frequency range is increased in the periods of time closer to the impact pulse is increased from 1 MHz, to 3–7 MHz for Cases 2 and 3.

3.5. Influence of Droplet Size Variations

The strain-stress analysis contemplates in this part the effect of pondering a distinction on the droplet diameter over the reference case for the testing coupon. Three cases of study are related with variations of the given parameter multiplying its value by 1,2 and 3 for Case 1, 2, and 3, respectively as shown in Table 5.
Figure 31 illustrates the strain evolution for the three different cases. It is noticed a delayed variation in the strain-rate values with longer periods of impact and also the equivalent effect on the strain frequency spectrum, Figure 32 and Figure 33. The main working strain frequency range is evenly increased for bigger droplets (4–6 mm. in diameter) in the periods of time closer to the impact and the reflections with values from 1 MHz, to 3–7 MHz for Cases 2 and 3.

3.6. Influence of Droplet Impact Velocity Variations

In this section, the strain-stress analysis intends the consequence of a difference on the droplet impact velocity over the reference case for the testing coupon. Three cases of study are related with variations of the given parameter multiplying its value by 1, 0.6 and 1.4 for Cases 1, 2, and 3, respectively as shown in Table 6. It is important to note that a maximum impact velocity in operational conditions of wind turbine blades (only in offshore fields) should be defined around 170 m/s.
Figure 34 clarifies the direct related variation in the strain-rate values with the impact velocity for the three different cases. The corresponding influence on the strain frequency spectrum is depicted in Figure 35 and Figure 36. The principal working strain frequency range is evenly distributed in the periods of time closer to the impact with values from 1 to 7 MHz for Cases 2 and 3, pointing out an important influence of the impact velocity with the frequency range during impact event.

4. Conclusions

Numerical and analytical models have been used in this work as a tool to analyze coating LEP wear surface erosion performance. The modelling description offers a guidance in the analysis based on the material fundamental properties. It is required for a complete analysis to define criteria for identifying suitable acoustical matching of LEP coating and composite substrate interfaces.
Complex material models are considered to observe the highly transient material behavior during waterdrop collisions that require to define the range of frequency of its data set to account for strain rate dependence. The simplified single droplet impact modelling developed in this work has been implemented and its capabilities assessed. The simulated analysis pondering different operational and configuration cases used in industry has been discussed in detail and limits the working frequency in a range of 0.5–7 MHz. The analysis has been developed assuming constant values of mechanical properties during the impact event in order to imitate the Springer modelling assumptions. The upper limit of 5 MHz allows one to consider a conservative constant value for the appropriate measurement of the material impedance providing a limit on the stiffness variation of the viscoelastic response of the selected material. Then, a procedure for the measurement of acoustic impedance with a time-of-flight technique of a thin viscoelastic layer using a planar ultrasonic transducer for the frequency regime of interest can be developed. Details of such developments are reported by the authors in linked research [20].
The material impedance characterization may be obtained at the appropriate Ultrasound frequency testing for the erosion performance modelling input data to avoid lack of accuracy. The computational tool presented would allow one to define erosion performance estimators depending on the relative acoustic impedance of liquid, coating and substrate materials definition reducing the Rain Erosion Testing campaigns to evaluate the rain erosion resistance of selected top-coating systems.

Author Contributions

Designed and developed the computational tool, L.D. and J.R.; Conceived and implemented the material testing specimens, A.Š.; Determined the research program, defined the computational framework scope, its use and the interpretation of the results, supervised the work and wrote the paper, F.S. All authors have read and agreed to the published version of the manuscript.

Funding

This research has been partially funded by the DEMOWIND-2 Project “Offshore Demonstration Blade (ODB)” funded by MINECO with reference PCIN-069-2017, by the ESI-Group Chair at CEU-UCH and from the European Union’s Horizon 2020 research and innovation program under grant agreement No 811473. Project “LEP4BLADES”.

Conflicts of Interest

The authors declare no conflict of interest.

References

  1. Cortés, E.; Sánchez, F.; O’Carroll, A.; Madramany, B.; Hardiman, M.; Young, T.M. On the material characterization of wind turbine blade coatings: Effect of the interphase adhesion on rain erosion performance. Materials 2017, 10, 1146. [Google Scholar] [CrossRef] [Green Version]
  2. Tobin, E.F.; Young, T.M.; Raps, D.; Rohr, O. Comparison of liquid impingement results from whirling arm and water-jet erosion test facilities. Wear 2011, 271, 2625–2631. [Google Scholar] [CrossRef]
  3. Gohardani, O. Impact of erosion testing aspects on current and future flight conditions. Prog. Aerosp. Sci. 2011, 47, 280–303. [Google Scholar] [CrossRef]
  4. Adler, W.F. Waterdrop impact modeling. Wear 1995, 186, 341–351. [Google Scholar] [CrossRef]
  5. Fang, J.; Owens, R.G.; Tacher, L.; Parriaux, A. A numerical study of the sph method for simulating transient viscoelastic free surface flows. J. Nonnewton. Fluid Mech. 2006, 139, 68–84. [Google Scholar] [CrossRef] [Green Version]
  6. Verma, A.S.; Castro, S.G.P.; Jiang, Z.; Teuwen, J.J.E. Numerical investigation of rain droplet impact on offshore wind turbine blades under different rainfall conditions: A parametric study. Compos. Struct. 2020, 241, 112096. [Google Scholar] [CrossRef]
  7. Yonemoto, Y.; Kunugi, T. Universality of Droplet Impingement: Low-to-high viscosities and surface tensions. Coatings 2018, 8, 409. [Google Scholar] [CrossRef] [Green Version]
  8. Keegan, M.H.; Nash, D.H.; Stack, M.M. On erosion issues associated with the leading edge of wind turbine blades. J. Phys. D Appl. Phys. 2013, 46, 383001. [Google Scholar] [CrossRef] [Green Version]
  9. Doagou-Rad, S.; Mishnaevsky, L.; Bech, J.I. Leading edge erosion of wind turbine blades: Multiaxial critical plane fatigue model of coating degradation under random liquid impacts. Wind Energy 2020, 1, 1–15. [Google Scholar] [CrossRef]
  10. Mishnaevsky, L.; Fæster, S.; Mikkelsen, L.P.; Kusano, Y.; Bech, J.I. Micromechanisms of leading edge erosion of wind turbine blades: X-ray tomography analysis and computational studies. Wind Energy 2020, 23, 547–562. [Google Scholar] [CrossRef]
  11. Mishnaevsky, L., Jr.; Sütterlin, J. Micromechanical model of surface erosion of polyurethane coatings on wind turbine blades. Polym. Degrad. Stab. 2019, 166, 283–289. [Google Scholar] [CrossRef]
  12. Chen, J.; Geng, M.; Li, Y.; Yang, Z.; Chai, Y.; He, G. Erosion resistance and damage mechanism of TiN/ZrN nanoscale multilayer coating. Coatings 2019, 9, 64. [Google Scholar] [CrossRef] [Green Version]
  13. Springer, G.S. Erosion by Liquid Impact; John Wiley and Sons: New York, NY, USA, 1976. [Google Scholar]
  14. Slot, H.M.; Gelnick, E.R.M.; Rentrop, C.; van der Heide, E. Leading edge erosion of coated wind turbine blades: Review of coating life models. Renew. Energy 2015, 80, 837–848. [Google Scholar] [CrossRef]
  15. Eisenberg, D.; Laustsen, S.; Stege, J. Wind turbine blade coating leading edge rain erosion model: Development and validation. Wind Energy 2018, 80. [Google Scholar] [CrossRef]
  16. Elhadi Ibrahim, M.; Medraj, M. Water droplet erosion of wind turbine blades: Mechanics, testing, modeling and future perspectives. Materials 2020, 13, 157. [Google Scholar] [CrossRef] [Green Version]
  17. Mishnaevsky, L., Jr. Toolbox for optimizing anti-erosion protective coatings of wind turbine blades: Overview of mechanisms and technical solutions. Wind Energy 2019, 22, 1636–1653. [Google Scholar] [CrossRef]
  18. Arena, G.; Friedrich, K.; Ruso, P.; Padenko, E.; Acierno, D.; Filippone, G.; Wagner, J. Solid particle erosion and viscoelastic properties of thermoplastic polyurethane. eXPRESS Polym. Lett. 2015, 9, 166–176. [Google Scholar] [CrossRef] [Green Version]
  19. OPENMODELICA. Available online: https://openmodelica.org (accessed on 6 June 2020).
  20. Domenech, L.; Garcia-Peñas, V.; Šakalytė, A.; Puthukara, D.; Eskil Skoglund, F.; Sánchez, F. Top coating anti-erosion performance analysis in wind turbine blades depending on relative acoustic impedance. Part 2: Material characterization and rain erosion testing evaluation. Coatings 2020, in press. [Google Scholar]
  21. Standard Test Method for Liquid Impingement Erosion Using Rotating Apparatus; ASTM G73-10; ASTM International: West Conshohocken, PA, USA, 2017.
  22. DNVGL: RP-0171. Testing of Rotor Blade Erosion Protection Systems. Recommended Practice. 2018. Available online: http://www.dnvgl.com (accessed on 1 February 2020).
  23. Plastics—Determination of Tensile Properties at High Strain Rates; ISO 18872:2007; ISO: Geneva, Switzerland, 2007.
  24. Sarva, S.S.; Deschanel, S.; Boyce, M.C.; Chen, W. Stress-strain behavior of a polyurea and a polyurethane from low to high strain rates. Polymer 2007, 48, 2208–2213. [Google Scholar] [CrossRef]
  25. Roland, C.M.; Twigg, J.; van Vu, Y.; Mott, P.H. High strain rate mechanical behavior of polyurea. Polymer 2007, 48, 574–578. [Google Scholar] [CrossRef]
  26. Fan, J.T.; Weerheijm, J.; Sluys, L.J. High-strain-rate tensile mechanical response of a polyurethane elastomeric material. Polymer 2015, 65, 72–80. [Google Scholar] [CrossRef]
  27. Chevalier, Y.; Vinh, J.T. Mechanics of Viscoelastic Materials and Wave Dispersion; Wiley: Hoboken, NJ, USA, 2013. [Google Scholar]
  28. Garceau, P. Characterization of Isotropic and Anisotropic Materials by Progressive Ultrasonic Waves. In Mechanics of Viscoelastic Materials and Wave Dispersion; Wiley: Hoboken, NJ, USA, 2013; pp. 513–554. [Google Scholar] [CrossRef]
  29. Beda, T.; Esteoule, C.; Mohamed, S.; Vinh, J.T. Viscoelastic Moduli of Materials Deduced from Harmonic Responses of Beams. In Mechanics of Viscoelastic Materials and Wave Dispersion; Wiley: Hoboken, NJ, USA, 2013; pp. 555–597. [Google Scholar] [CrossRef]
  30. Brinson, H.F.; Brinson, L.C. Polymer Engineering Science and Viscoelasticity; Springer: New York, NY, USA, 2010; ISBN 978-1-4899-7485-3. [Google Scholar]
  31. Grate, J.W.; Wenzel, S.; White, R.M. frequency-independent and frequency-dependent polymer transitions observed on flexural plate ultrasonic wave sensors. Anal. Chem. 1992, 64, 413–423. [Google Scholar] [CrossRef]
  32. Pascual, B.; Sánchez, F.; Doménech, L.; Cortés, E.; Ribes-Greus, A. Interconversion between dielectric and mechanical measurements of polymeric materials for wind turbine Blades. In Proceedings of the XI Congreso Nacional y II Internacional de Ingeniería Termodinámica, 11CNIT-XI-2018, Albacete, Spain, 12–28 June 2019. [Google Scholar]
  33. Szabo, J.P.; Keough, I.A. Method for analysis of dynamic mechanical thermal analysis data using the Havriliak-Negami model. Thermochim. Acta 2002, 392–393, 1–12. [Google Scholar] [CrossRef]
  34. Garcia-Bernabe, A.; Lidon-Roger, J.V.; Sanchis, M.J.; Diaz-Calleja, R.; del Castillo, L.F. Interconversion algorithm between mechanical and dielectric relaxation measurements for acetate of cis- and trans-2-phenyl-5-hydroxymethyl-1,3-dioxane. Phys. Rev. E 2015, 92, 042307. [Google Scholar] [CrossRef] [PubMed]
Figure 1. Examples of leading edge erosion across a range of years in service, from [1].
Coatings 10 00685 g001
Figure 2. Leading Edge Protection (LEP) system configuration on the blade surface as a post-mould application multilayer system.
Coatings 10 00685 g002
Figure 3. Two different types of erosion failure: Coating surface wear erosion with pits and cracks that progress with mass loss caused by direct impact and stress on surface and coating interface delamination indirectly caused by the coating-substrate interface stresses. The coupons were tested at Whirling arm rain erosion test facility (WARER) at University of Limerick.
Coatings 10 00685 g003
Figure 4. (a) Standard blade structure sketch with a filler intermediate layer showing stress wave behavior under impingement and (b) Liquid droplet-solid surface impact interaction depicted from numerical simulation developed by the authors.
Coatings 10 00685 g004
Figure 5. (a) Evolution of weight loss on experimental rain erosion testing coupons and lifetime prediction model defining the incubation period and mass removal rate (b) Springer Model based Fatigue life N approximation related with the material ultimate strength σu, the parameter “erosion strength”, σe and the parameter b that includes the fatigue knee at the endurance limit σI. Adapted from: [13].
Coatings 10 00685 g005
Figure 6. Stress wave pattern in the coating and in the substrate for the time intervals related with coating thickness hc and its wave speed Cc. (a) Stress wave contact at interface; (b) Stress wave consecutive interactions.
Coatings 10 00685 g006
Figure 7. Variation of stress at coating-substrate interface for three different top coating LEP material candidates for the same substrate. It can be observed the capability to avoid peak values with the appropriate selection of the material impedances.
Coatings 10 00685 g007
Figure 8. Diagram of liquid, coating and substrate material impedances and operational parameters affecting rain erosion performance.
Coatings 10 00685 g008
Figure 9. DMTA developed Testing for prototype LEP used in this work, only valid for low frequencies 1Hz up to 100 Hz but considering Temperature variation.
Coatings 10 00685 g009
Figure 10. DETA dielectric testing was developed with 3 different temperatures for prototype LEP used in this work, valid for high frequencies up to 10 MHz but not contemplating mechanical properties definition.
Coatings 10 00685 g010
Figure 11. Impact force step wise definition and its corresponding Fourier Reconstruction (where impact duration depends on droplet diameter and the peak value depends on the velocity of droplet impact and liquid-coating relative impedances).
Coatings 10 00685 g011
Figure 12. LEP configuration considering viscoelastic material models, multilayer and 1D droplet impact event.
Coatings 10 00685 g012
Figure 13. (a) Reference multilayer configuration for RET coupons. Liquid droplet and each material layer are defined by the input mechanical parameters of Table 1; (b) corresponding numerical configuration outline implemented in OpenModelica.
Coatings 10 00685 g013
Figure 14. Rain erosion test facility and three specimens used at PolyTech Test & Validation A/S according to DNV-GL-RP-0171 [22] for the analysis and experimental validation.
Coatings 10 00685 g014
Figure 15. H-N model. Storage Modulus variation with Frequency. E unrelaxed modulus.
Coatings 10 00685 g015
Figure 16. H-N model. Relaxation Time dependence on Temperature.
Coatings 10 00685 g016
Figure 17. Strain evolution at the coating surface for the reference LEP configuration for RET coupons with input data defined in Table 1. Material models comparison.
Coatings 10 00685 g017
Figure 18. Spectrogram for strain evolution at the coating surface for the Reference multilayer configuration. Material models analysis for Pure elastic consideration.
Coatings 10 00685 g018
Figure 19. Spectrogram for strain evolution at the coating surface for the Reference multilayer configuration. Material models analysis for Kelvin-Voight consideration.
Coatings 10 00685 g019
Figure 20. Stress-Time evolution for Case 1 at surface (s = 0) and interface (s = 100).
Coatings 10 00685 g020
Figure 21. Spectrogram for strain evolution at the middle coating layer. Comparison for coating thickness variation respect to the reference LEP multilayer configuration (Case 1).
Coatings 10 00685 g021
Figure 22. Spectrogram for strain evolution at the middle coating layer. Comparison for coating thickness variation respect to the reference LEP multilayer configuration (Case 2).
Coatings 10 00685 g022
Figure 23. Stress-Time evolution for Cases 1–3 at surface, 0% of Coating thickness, considering the substrate filler as semi-infinite with increased thickness (shells, tapes).
Coatings 10 00685 g023
Figure 24. Stress-Time evolution for Cases 1–3 at middle coating layer, 50% thickness, considering substrate-filler as semi-infinite with increased thickness (shells, tapes).
Coatings 10 00685 g024
Figure 25. Spectrogram for strain evolution at the middle coating layer, 50% thickness, considering substrate-filler as semi-infinite with defined coating thickness for reference LEP configuration. Case 1.
Coatings 10 00685 g025
Figure 26. Spectrogram for strain evolution at the middle coating layer, 50% thickness, considering substrate-filler as semi-infinite with increased thickness (shells, tapes). Case 2.
Coatings 10 00685 g026
Figure 27. Spectrogram for strain evolution at the middle coating layer, 50% thickness, considering substrate-filler as semi-infinite with increased thickness (shells, tapes). Case 3.
Coatings 10 00685 g027
Figure 28. Strain-Time evolution for Case 1,2,3 at middle coating layer, 50% thickness, considering the substrate-filler as semi-infinite with variation in coating modulus.
Coatings 10 00685 g028
Figure 29. Spectrogram for strain evolution at the middle coating layer, 50% thickness, considering substrate-filler as semi-infinite with variation in coating modulus. Case 2.
Coatings 10 00685 g029
Figure 30. Spectrogram for strain evolution at the middle coating layer, 50% thickness, considering substrate-filler as semi-infinite with variation in coating modulus. Case 3.
Coatings 10 00685 g030
Figure 31. Strain-Time evolution for Cases 1–3 at middle coating layer, 50% thickness, considering the substrate-filler as semi-infinite with variation in droplet diameter.
Coatings 10 00685 g031
Figure 32. Spectrogram for strain evolution at the middle coating layer, 50% thickness, considering substrate-filler as semi-infinite with variation in droplet diameter. Case 2.
Coatings 10 00685 g032
Figure 33. Spectrogram for strain evolution at the middle coating layer, 50% thickness, considering substrate-filler as semi-infinite with variation in droplet diameter. Case 3.
Coatings 10 00685 g033
Figure 34. Strain-Time evolution for Cases 1–3 at middle coating layer, 50% thickness, considering the substrate-filler as semi-infinite with variation in droplet velocity.
Coatings 10 00685 g034
Figure 35. Spectrogram for strain evolution at the middle coating layer, 50% thickness, considering substrate-filler as semi-infinite with variation in droplet velocity. Case 2.
Coatings 10 00685 g035
Figure 36. Spectrogram for strain evolution at the middle coating layer, 50% thickness, considering substrate-filler as semi-infinite with variation in droplet velocity. Case 3.
Coatings 10 00685 g036
Table 1. Initial Reference Input data used for the impact modelling of RET testing.
MaterialModulus E (Pa)
/Viscosity (Pa s)
Speed of Sound C
(m/s)
Layer Thickness
/Droplet Diameter (µm)
Impact Velocity Specimen Vcenter
(m/s)
Water droplet2.19 × 1091480.002000121
Coating LEP3.48 × 109/1.591733.00500121
Filler4.90 × 109/3.1831941.001000121
Substrate Laminate1.10 × 10102392.003400121
Table 2. Modelling input data for variation cases in Coating thickness.
Test Impact Comparison_3
Case Analysis
MaterialModulus E (Pa)
/Viscosity (Pa s)
Speed of Sound C
(m/s)
Layer Thickness
(µm)
Impact Velocity Specimen Vcenter
(m/s)
Case 1Coating LEP3.48 × 109/1.591733.00500121
Case 23.48 × 10⁹/1.591733.004 × 500121
Table 3. Modelling input data for variation cases in semi-infinite substrates, h s > 2 d C s C L , in substrate (filler) thickness and in thick coatings (shells and tapes), h C > 2 d C c C L .
Test Impact Comparison_2
Case Analysis
MaterialModulus E (Pa)
/Viscosity (Pa s)
Speed of Sound C
(m/s)
Layer Thickness
(µm)
Impact Velocity Specimen Vcenter
(m/s)
Case 1Coating LEP3.48 × 109/1.591733.00500121
Case 23.48 × 10⁹/1.591733.0010 × 500121
Case 33.48 × 10⁹/1.591733.0020 × 500121
Cases 1,2,3Filler4.90 × 109/3.1831941.0020 × 1000121
Table 4. Modelling input data for variation cases in coating modulus (stiffness) and considering semi-infinite substrates, h s > 2 d C s C L .
Test Impact Comparison_4
Case Analysis
Material Modulus E (Pa)
/Viscosity (Pa s)
Speed of Sound C
(m/s)
Layer Thickness
(µm)
Impact Velocity Specimen Vcenter
(m/s)
Case 1Coating LEP3.48 × 109/1.591733.00500 121
Case 20.5 × 3.48 × 109/1.591733.00500 121
Case 31.5 × 3.48 × 109/1.591733.00500 121
Cases 1,2,3Filler4.90 × 109/3.1831941.0020 × 1000121
Table 5. Modelling input data for variation cases in droplet diameter and considering semi-infinite substrates, h s > 2 d C s C L .
Test Impact Comparison_4
Case Analysis
MaterialModulus E (Pa)
/Viscosity (Pa s)
Speed of Sound C
(m/s)
Layer Thickness
/Droplet Diameter (µm)
Impact Velocity Specimen Vcenter
(m/s)
Case 1Water droplet2.19 × 1091480.002000121
Case 22.19× 1091480.002 × 2000121
Case 32.19 × 1091480.003 × 2000121
Cases 1,2,3Filler4.90 × 109/3.1831941.0020 × 1000121
Table 6. Modelling input data for variation cases in droplet impact velocity and considering semi-infinite substrates, h s > 2 d C s C L .
Test Impact Comparison_4
Case Analysis
Material Modulus E
(Pa)
Speed of Sound C
(m/s)
Droplet Diameter
(µm)
Impact Velocity Specimen Vcenter
(m/s)
Case 1Water droplet2.19 × 1091480.002000 121
Case 22.19 × 1091480.002000 0.6 × 121
Case 32.19 × 1091480.002000 1.4 × 121

