Article

Top Coating Anti-Erosion Performance Analysis in Wind Turbine Blades Depending on Relative Acoustic Impedance. Part 2: Material Characterization and Rain Erosion Testing Evaluation

by
Luis Domenech
1,
Víctor García-Peñas
1,
Asta Šakalytė
2,
Divya Puthukara Francis
3,
Eskil Skoglund
3 and
Fernando Sánchez
1,*
1
Research Institute of Design, Innovation and Technology, University CEU Cardenal Herrera, CEU Universities, Avda. Seminario S/N, 46115 Moncada-Valencia, Spain
2
AEROX Advanced Polymers, 46185 Pobla Vallbona-Valencia, Spain
3
Dolphitec, Studievegen 16, 2815 Gjøvik, Norway
*
Author to whom correspondence should be addressed.
Coatings 2020, 10(8), 709; https://doi.org/10.3390/coatings10080709
Submission received: 10 June 2020 / Revised: 9 July 2020 / Accepted: 15 July 2020 / Published: 22 July 2020
(This article belongs to the Special Issue Recent Trends in Coatings and Thin Film–Modeling and Application)

Abstract

:
Under droplet impingement, surface leading edge protection (LEP) coating materials for wind turbine blades develop high-rate transient pressure build-up and a subsequent relaxation in a range of strain rates. The stress-strain coating LEP behavior at a working frequency range depends on the specific LEP and on the material and operational conditions, as described in this research in a previous work. Wear fatigue failure analysis, based on the Springer model, requires coating and substrate speed of sound measurements as constant input material parameters. It considers a linear elastic response of the polymer subjected to drop impact loads, but does not account for the frequency dependent viscoelastic effects for the materials involved. The model has been widely used and validated in the literature for different liquid impact erosion problems. In this work, it is shown the appropriate definition of the viscoelastic materials properties with ultrasonic techniques. It is broadly used for developing precise measurements of the speed of sound in thin coatings and laminates. It also allows accurately evaluating elastic moduli and assessing mechanical properties at the high frequencies of interest. In the current work, an investigation into various LEP coating application cases have been undertaken and related with the rain erosion durability factors due to suitable material impedance definition. The proposed numerical procedures to predict wear surface erosion have been evaluated in comparison with the rain erosion testing, in order to identify suitable coating and composite substrate combinations. LEP erosion performance at rain erosion testing (RET) technique is used widely in the wind industry as the key metric, in an effort to assess the response of the varying material and operational parameters involved.

1. Introduction

Wind power has become a key technology to provide electricity from renewable and low-emission sources [1]. There is a need to improve existing technologies, by increasing the size of offshore wind turbines to capture more wind energy [2]. Composites use opened up great prospects in the design and manufacture of future wind turbine blades, due to the versatility offered in the material optimization and design. Nevertheless, composites perform poorly under transverse impact (i.e., perpendicular to the reinforcement direction) and are sensitive to environmental factors, such as heat, moisture, icing, salinity and/or UV. Blade manufacturers employ surface coatings to protect the composite structure from exposure to these factors. When considering the repeated impact of rain droplets, the high required tip speed is a key contributor to surface erosion damage on the leading edges of wind turbine blades.
The leading-edge protection (LEP) coating system analyzed in this work [3] is usually molded, painted or sprayed onto the blade surface during whole blade manufacture or during a repair in-field. Industrial processes state that LEP systems can be outlined as a multi-layered system, where a putty filler layer between the laminate and the surface LEP coating is included to smooth the composite surface. A primer layer may be also integrated under the coating and over the filler layer to guarantee adhesion, circumventing delamination between layers, see Figure 1.
Analytical and numerical models are commonly applied to relate top coating erosion lifetime prediction [4,5,6] or alternative accelerated rain erosion testing assessment is also used [7,8]. In order to identify suitable coating and composite substrate combinations based on their potential stress reduction on the surface and interface different studies are related with the droplet impact phenomena [9,10]. Recent studies treat the complexity of the single droplet impact problem with the fatigue analysis under repeated impact [11], and considering material viscoelastic approaches [12,13,14]. The Springer [4] model is applied and industry validated [5] for wear top-coating rain erosion lifetime assessment. It is used in this research [15] to predict wear fatigue failure analysis and as a computational tool for top-coating LEP design. In this work, its application is discussed, focusing on the required coating and substrate suitable combinations, and on the appropriate speed of sound measurements as input material parameters. The numerical model applied for the analysis of rain erosion lifetime estimation is limited to a linear elastic response of the polymer subjected to drop impact loads [4]. It is important to note that polymeric materials recently applied on the LEP systems are mainly viscoelastic materials with good properties for impact energy attenuation in erosion applications [16], that develop different mechanical response depending on temperature and on stress and strain rates [17,18,19]. If these parameters are not incorporated in the mechanical modeling, the predicted stresses of the coating behavior under impingement may wrongly consider the material capabilities.
In order to develop an appropriate parametric approach based on the viscoelastic material characterization, it is also necessary to consider a computational tool that allows one to design and validate the proposed modelling. In this research, a previous analysis of candidate materials in the temporal and frequency domain was developed to define applicable strain rate range for the required characterization. The simulated analysis developed in this research in a linked reference [15] limits the frequency for wind turbine rain erosion applications in a range of 0.5–7 MHz. The analysis has been done considering the constant values of material speed of sound and density for the impedance definition, in order to reproduce the Springer modelling assumptions.
The speed of sound of viscoelastic materials is directly related with its modulus of elasticity [20]. The viscoelastic characterization of the LEP materials at the appropriate working frequency range is limited for dynamic tests based on the vibration of rods or beams [21,22] and only possible using ultrasonic waves [23,24,25]. Moreover, the use of the ultrasound technique in thin film applications has additional issues as coupled thickness layer determination [26,27,28,29,30]. Alternatively, it is well known for viscoelastic materials, that the frequency (strain rate) and temperature dependencies of polymer properties are both related. One may use the time–temperature superposition principle to generate the frequency-dependent curve, but in this case, other testing based on temperature variations are also complex and limited as described in [15]. It is important to point out here that the frequency sensitivity of ultrasound velocities is usually weak, of order tens m/s/decade, as described in [23], but since it depends mainly on the polymers relaxation and Tg, it may be a remarkable source of property variations in the performance analysis developed in this work.
The higher limit of 5 MHz proposed in [15] permits one to consider a conservative method for the suitable measurement of the material impedance, providing an upper bound limit on the stiffness variation of the viscoelastic response of the selected material, as demonstrated in [23,24], and for specific impact erosion applications in [16]. Hence, a procedure for the measurement of acoustic impedance with a time-of-flight technique of a thin viscoelastic layer using a planar ultrasonic transducer for the frequency regime of interest is done in this work, in the next section.
In the current work, impedance measurements at suitable working frequency with Ultrasonic testing are presented and developed as the input material data for the lifetime prediction based on Springer modelling exposed with different application case analysis. An investigation into various LEP coating application cases has been undertaken and related with the rain erosion durability factors. LEP erosion performance at rain erosion accelerated testing technique is used as the key metric in an effort to assess the response of changing material and processing parameters involved and to evaluate the lifetime accuracy analysis.

2. Ultrasonic Measurement of Speed of Sound of Thin Coating LEP Materials

2.1. Test Standards Used for Ultrasonic Material Characterization

The ultrasonic technique is an important procedure for viscoelastic materials’ characterization at high strain rates. It is broadly used for developing precise measurements of speed of sound and attenuation. These two variables are the bases for accurately evaluating elastic moduli, and for assessing mechanical properties at high frequencies. Layer thickness and the speed of sound are important linked parameters also to account for LEP system configuration. If one of the parameters is known, the other one can be determined by simple time-of-flight (TOF) measurement of ultrasound.
An ultrasound examination is based on the propagation of ultrasonic waves in the part to be examined and the follow-up of the transmitted signal (called transmission technique), or of the signal reflected or diffracted by any surface or discontinuity (called reflection technique). Both techniques can use a single probe that acts as a transmitter and receiver, or a double probe, or separate transmitter and receiver probes. In the same way, these two techniques can involve an intermediate reflection coming from one or more surfaces of the examined object.
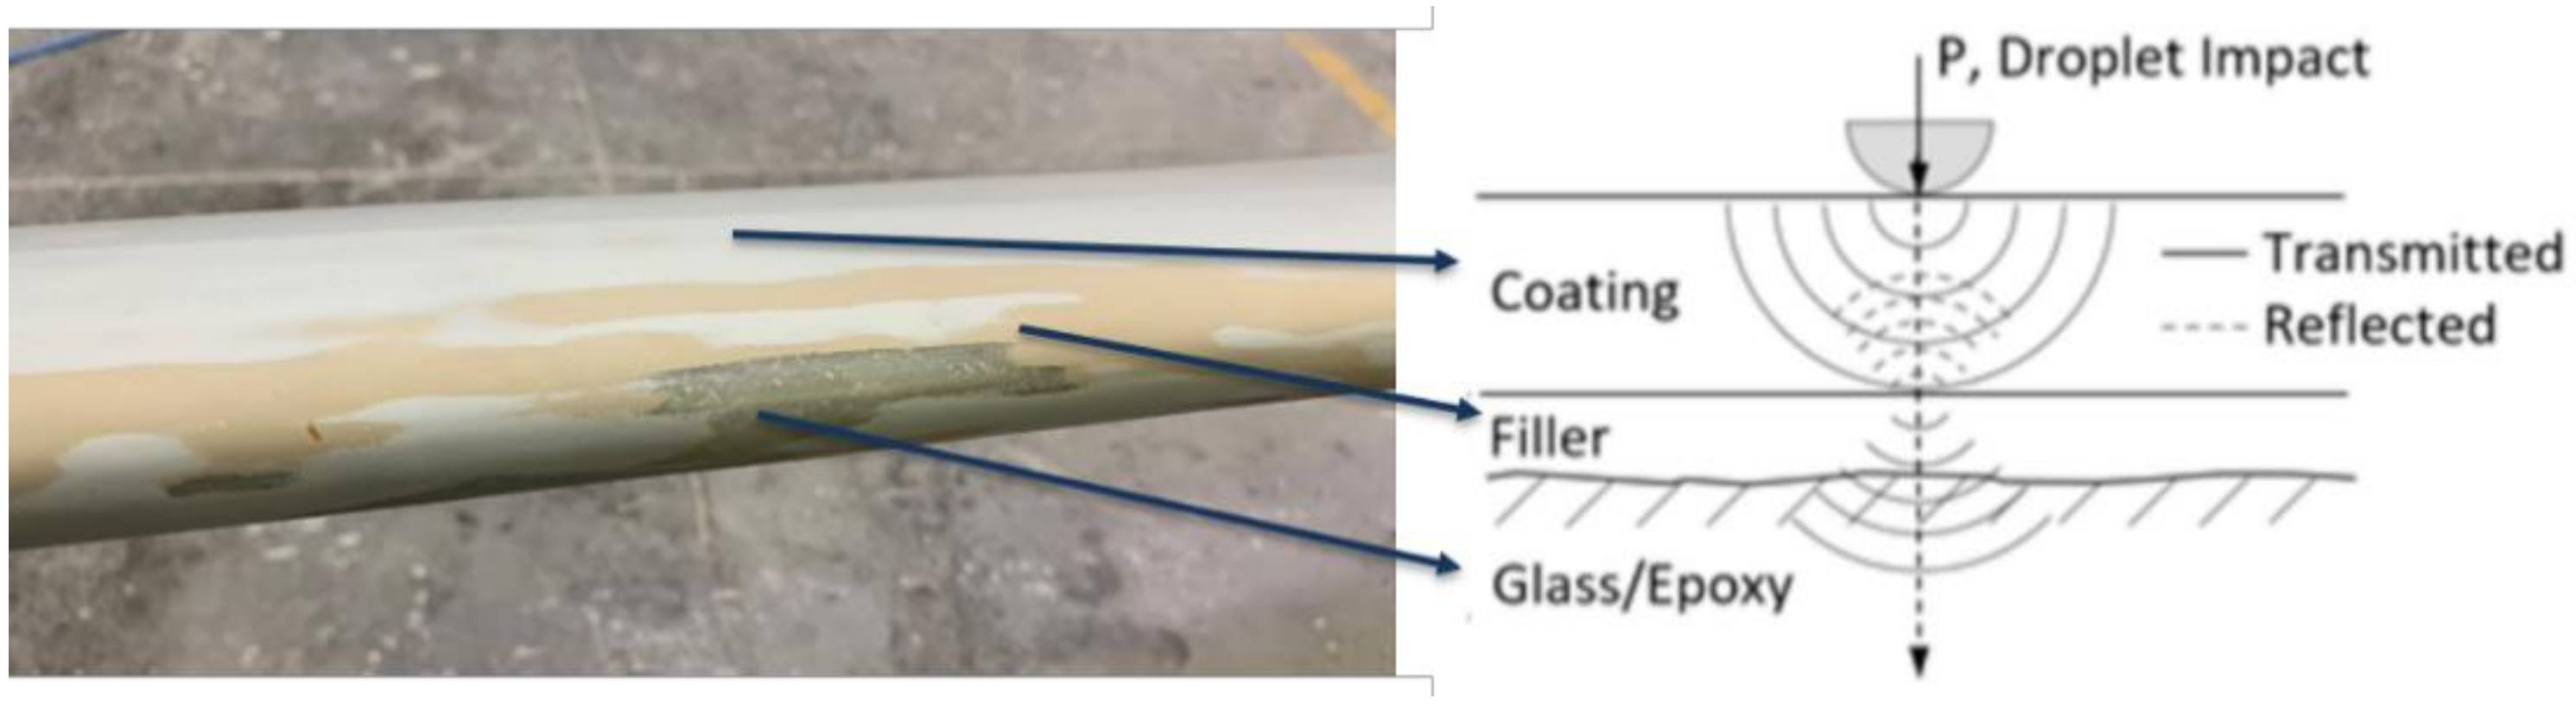
  • The transmission technique (ISO 16823 [31] contains a more detailed description of this technique) is based on the measurement of the signal attenuation after the passage of an ultrasonic wave through the examined part.
  • The reflection technique (pulse echo technique, ISO 16810 [32], and ISO 16811 [33]) uses the reflected or diffracted signal from any interface of interest inside the examined object. This signal is characterized by its amplitude and its position on the time base, the latter being a function of the distance between the reflector and the probe. The location of the reflector is determined by knowledge of this distance, the direction of wave propagation, and the position of the probe. Contact with the test object is generally preferred over separation by a liquid buffer or immersion coupling medium. Although it is applicable, in general terms, to discontinuities in materials and applications, other techniques like the time-of-flight diffraction (TOFD, ISO 16828 [34]) can be used for both detection and sizing of discontinuities provided is performed with necessary consideration of geometry, acoustical properties of the materials, and the sensitivity of the examination.
For speed of sound measurements, the objective is to determine the exact time interval needed for a signal to travel between the front and back surface of a test object with previously known thickness. Attenuation may be calculated from the ratio of the two amplitudes measured. The pulse echo technique uses a broad band frequency range for most engineering solids, from about 300 to about 400 MHz. Preferably, the test object must have smooth, flat, parallel opposing surfaces and minimum thickness (to avoid excess of attenuation). It should meet the limitations for precise signal analysis, like the absence of discontinuities like voids or other particles. In addition, adequate force on the transducer is required to squeeze out excess coupling medium. Note that direct, normal incidence reflections may not appear even if test object shape and boundaries meet the conditions when the material is anisotropic, orthotropic or contains microstructural gradients.

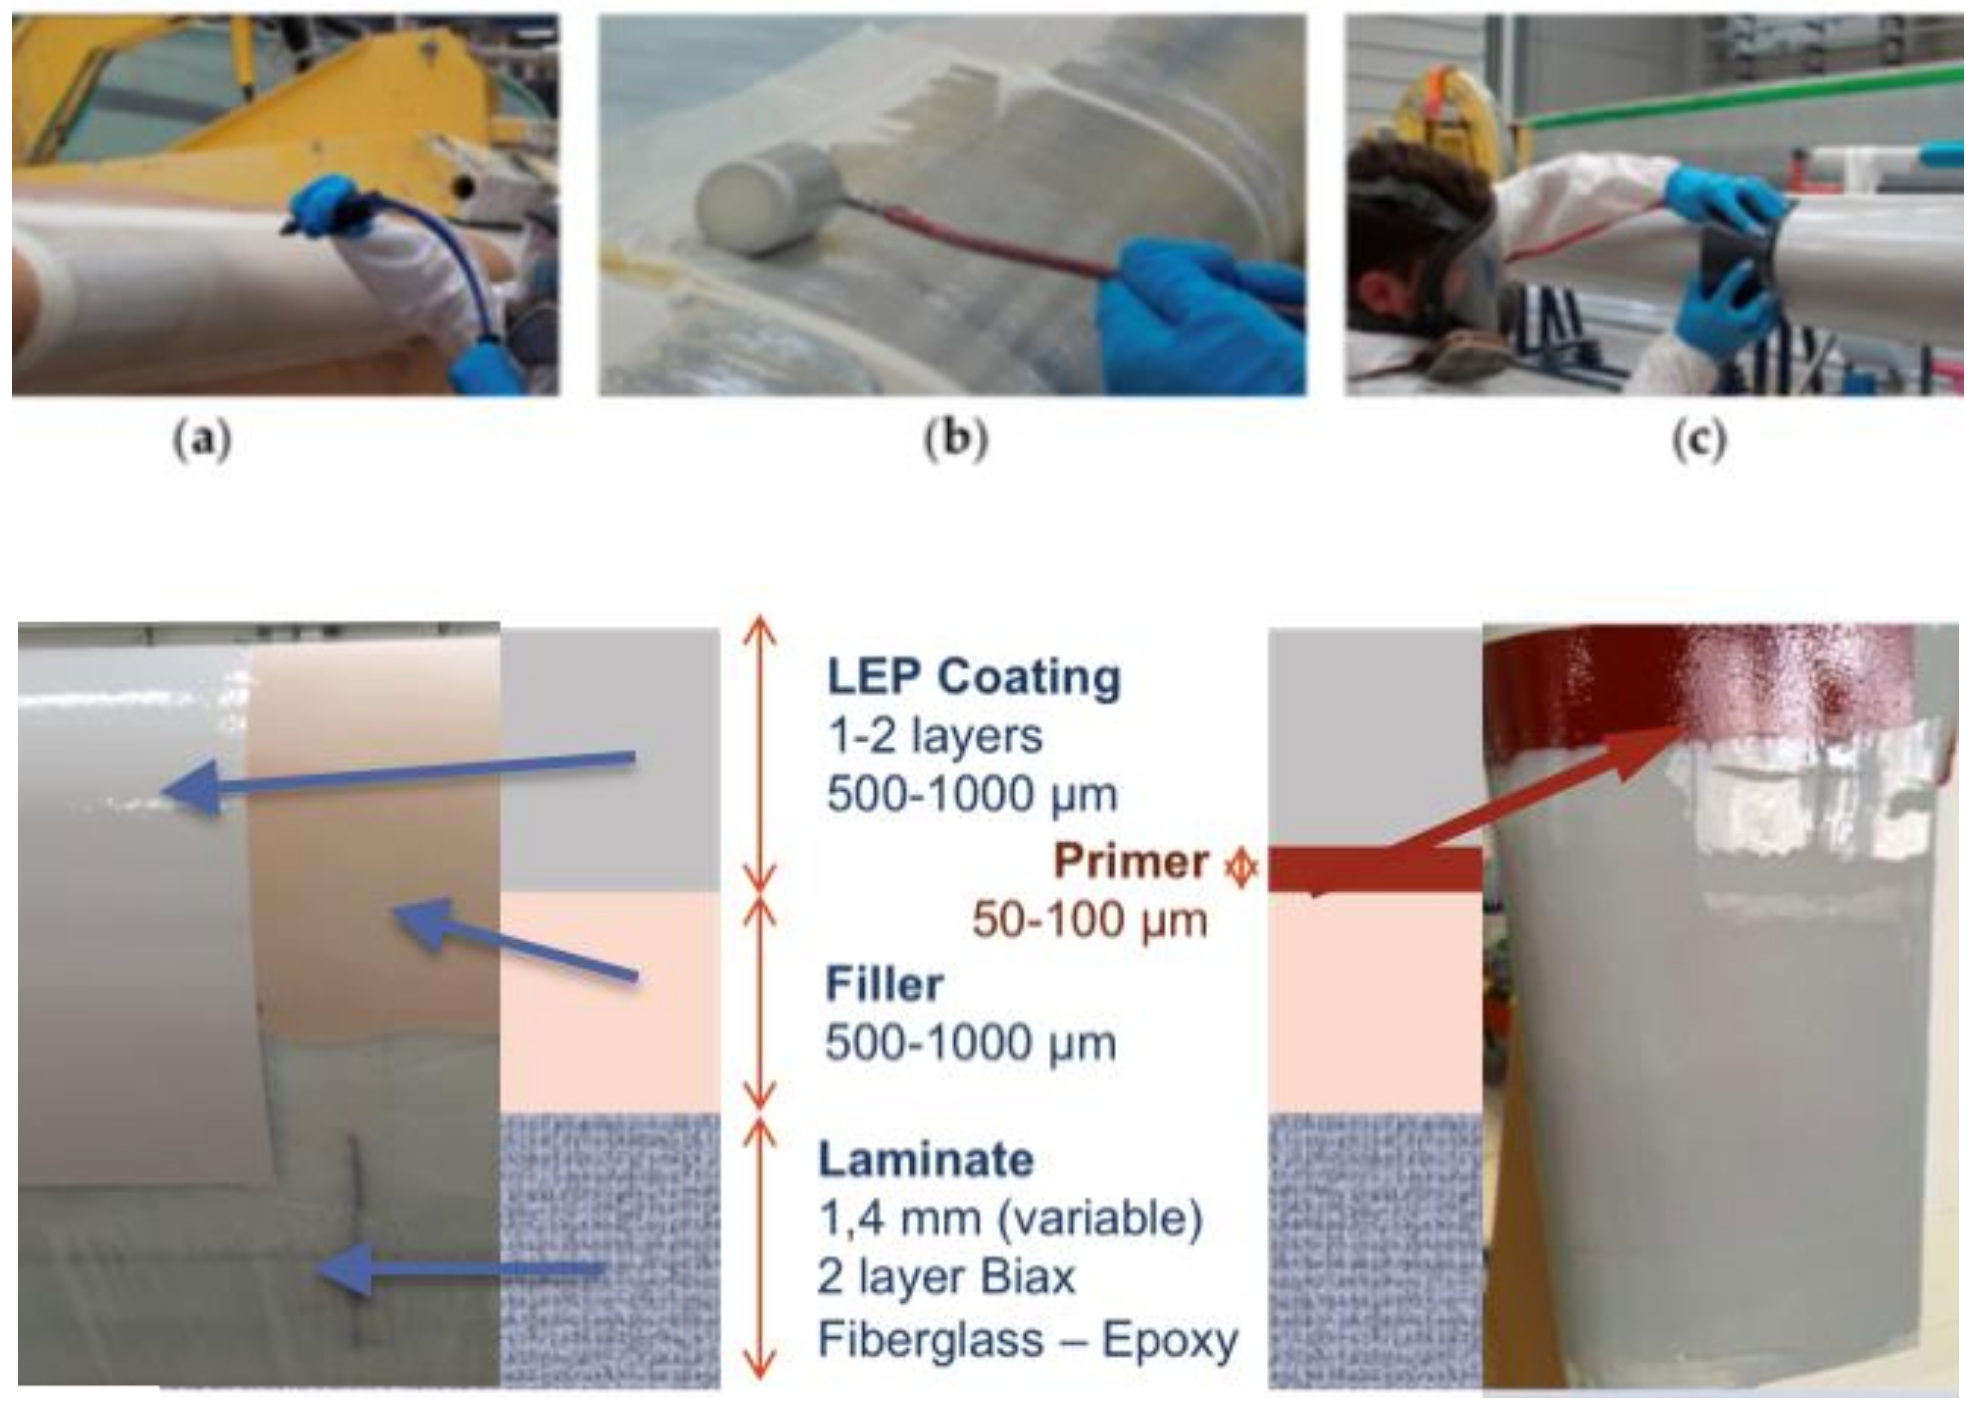
2.2. Ultrasonic Speed of Sound Measurement Methodology for Thin Coating LEP Systems

Ultrasonic testing was undertaken with a Dolphitec ultrasonic system [35] using a pulse echo mode (ISO 16810 [32], and ISO 16811 [33]). This technique is based on analyzing the propagation of ultrasonic wave through the tested material. At each interface of the material, there is a spike in the ultrasonic response. This allows for the measuring the speed of sound through the material by finding the distance between the front-wall echo (spike response of the front face) and the back-wall echo and matching this to the material’s actual physical measured thickness.
Ultrasonic scanning was employed to determine the acoustic impedance of neat LEP coating and filler materials. The acoustic impedance, Z can be calculated by:
Z = ρ C
where, ρ is the materials density and c is the speed of sound. These measurements were captured using both single crystal 2.5 and 5 MHz probes. This allowed for the measurement of material impedance at varying probe frequencies, providing information on viscoelastic response of the selected materials.

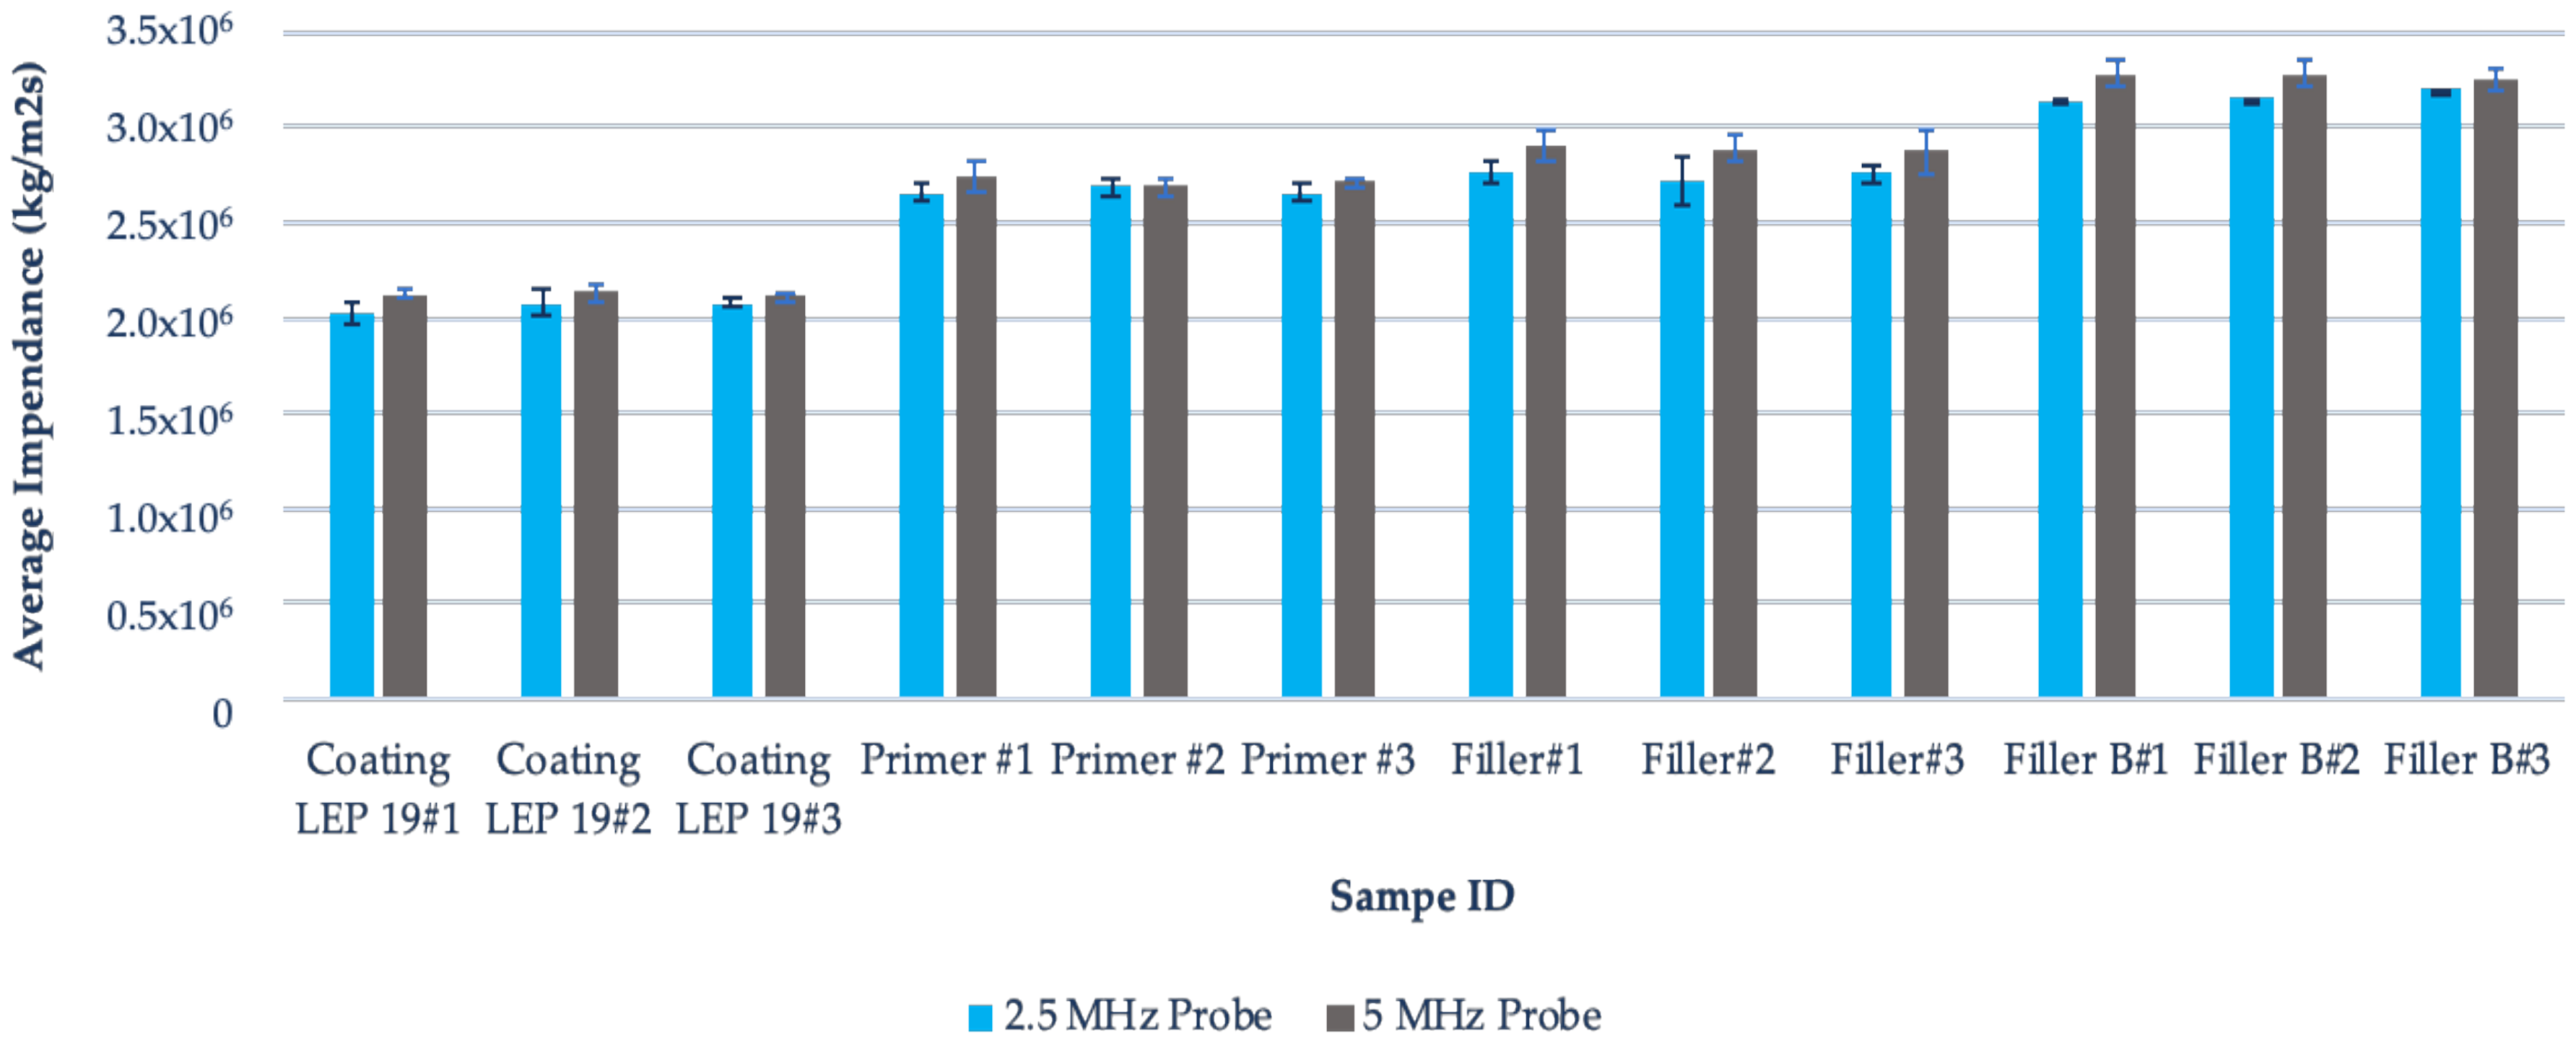
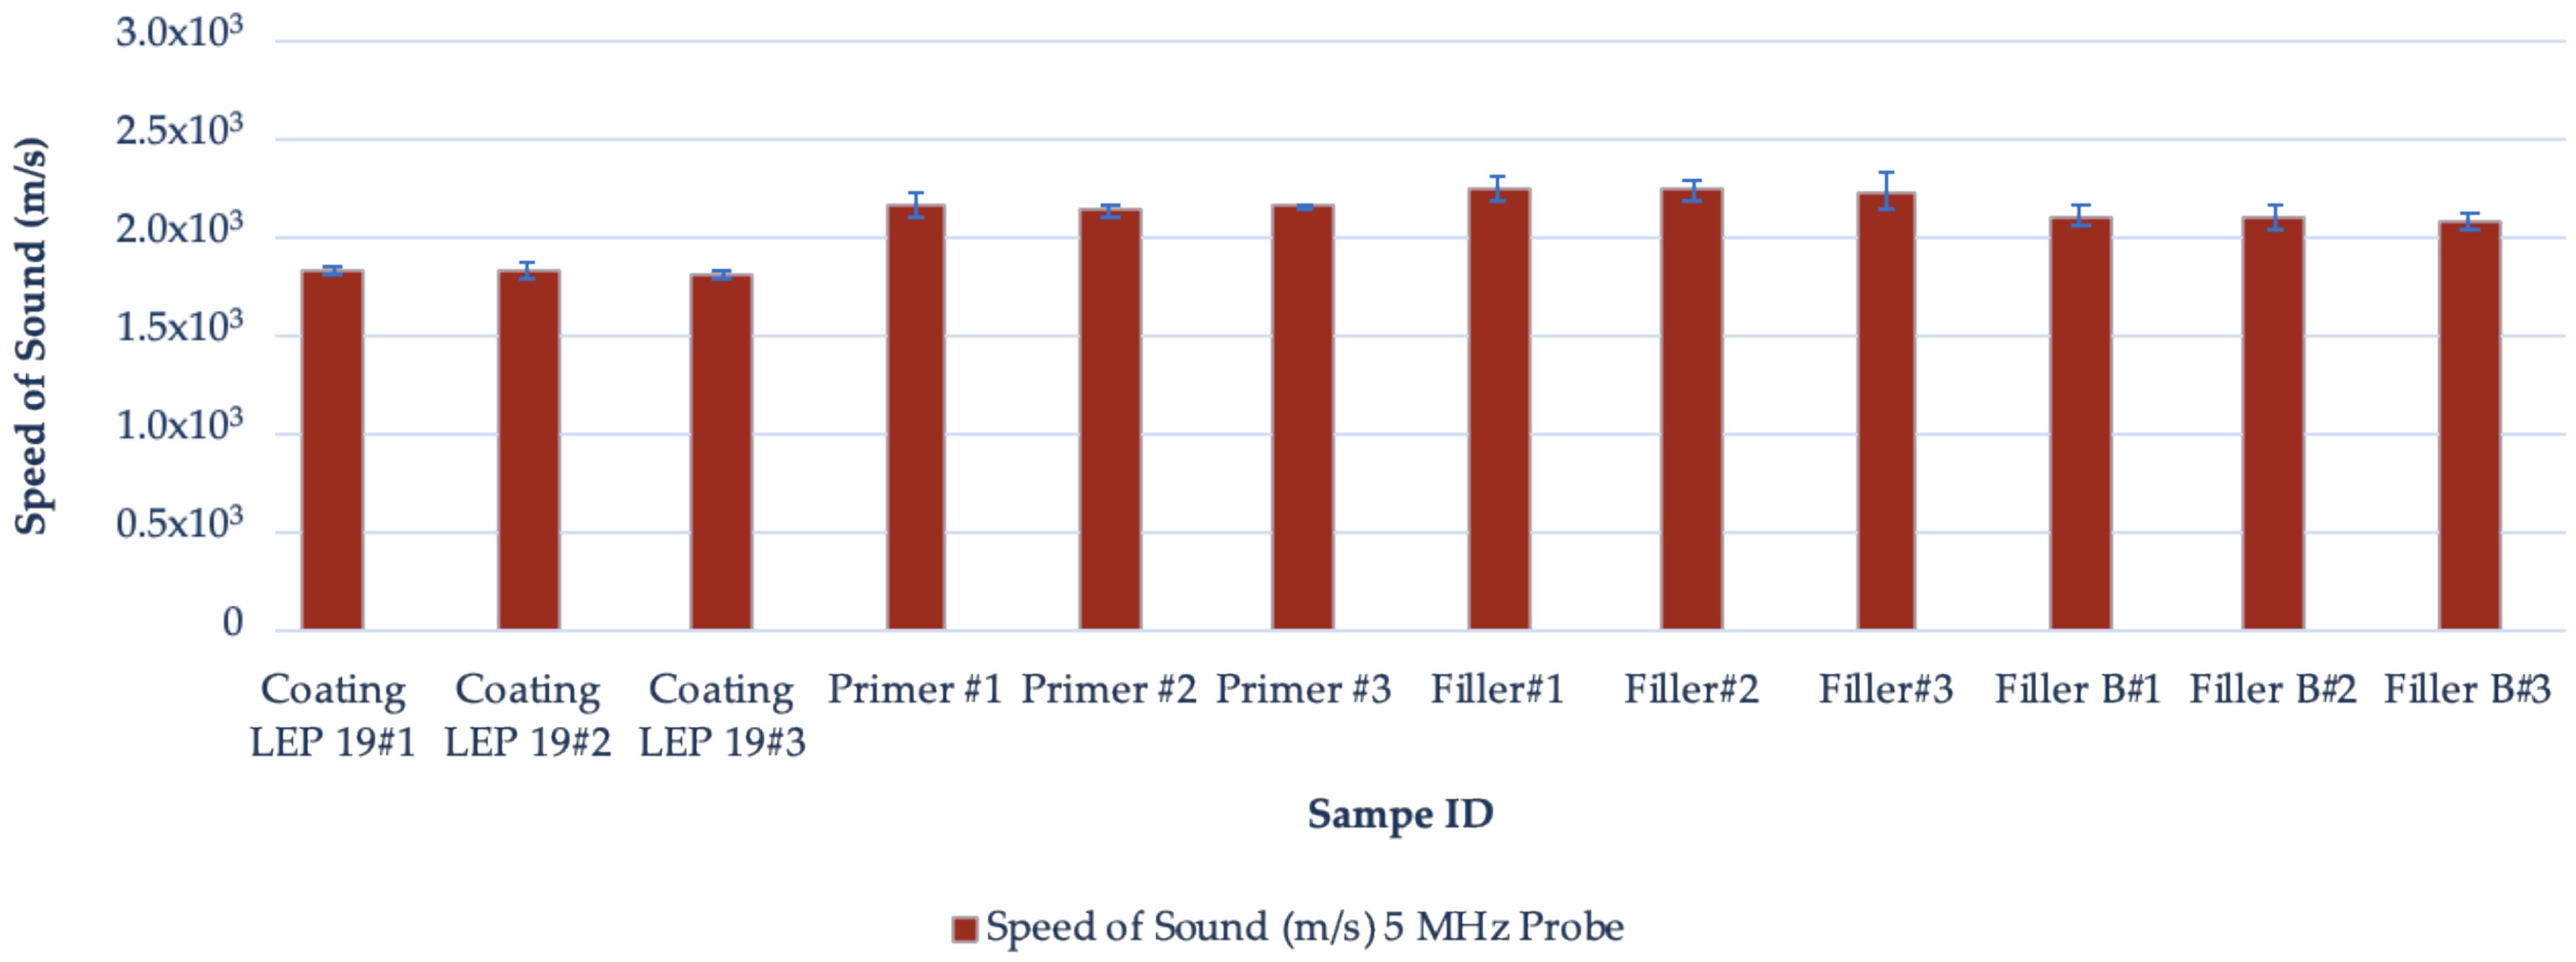
2.3. Testing Case Results

The coupons of LEP coatings, primer and filler materials for the impedance measurements were supplied by Aerox Advance Polymers [36] and the testing developed by Dolphitec [35]. The coupons prepared were of two geometries: a circular disc with a nominal diameter of 65 mm and thickness ranging for 5.5–6.3 mm on average and thin laminates of 400 μm on average, see Figure 2. The testing procedure was defined following the next steps:
For the 2.5 and 5 MHz probes, four locations were marked on each coupon and the thickness was measured at each of these marked locations. Marks/points (starting from #1) are made on various regions on the sample coupon.
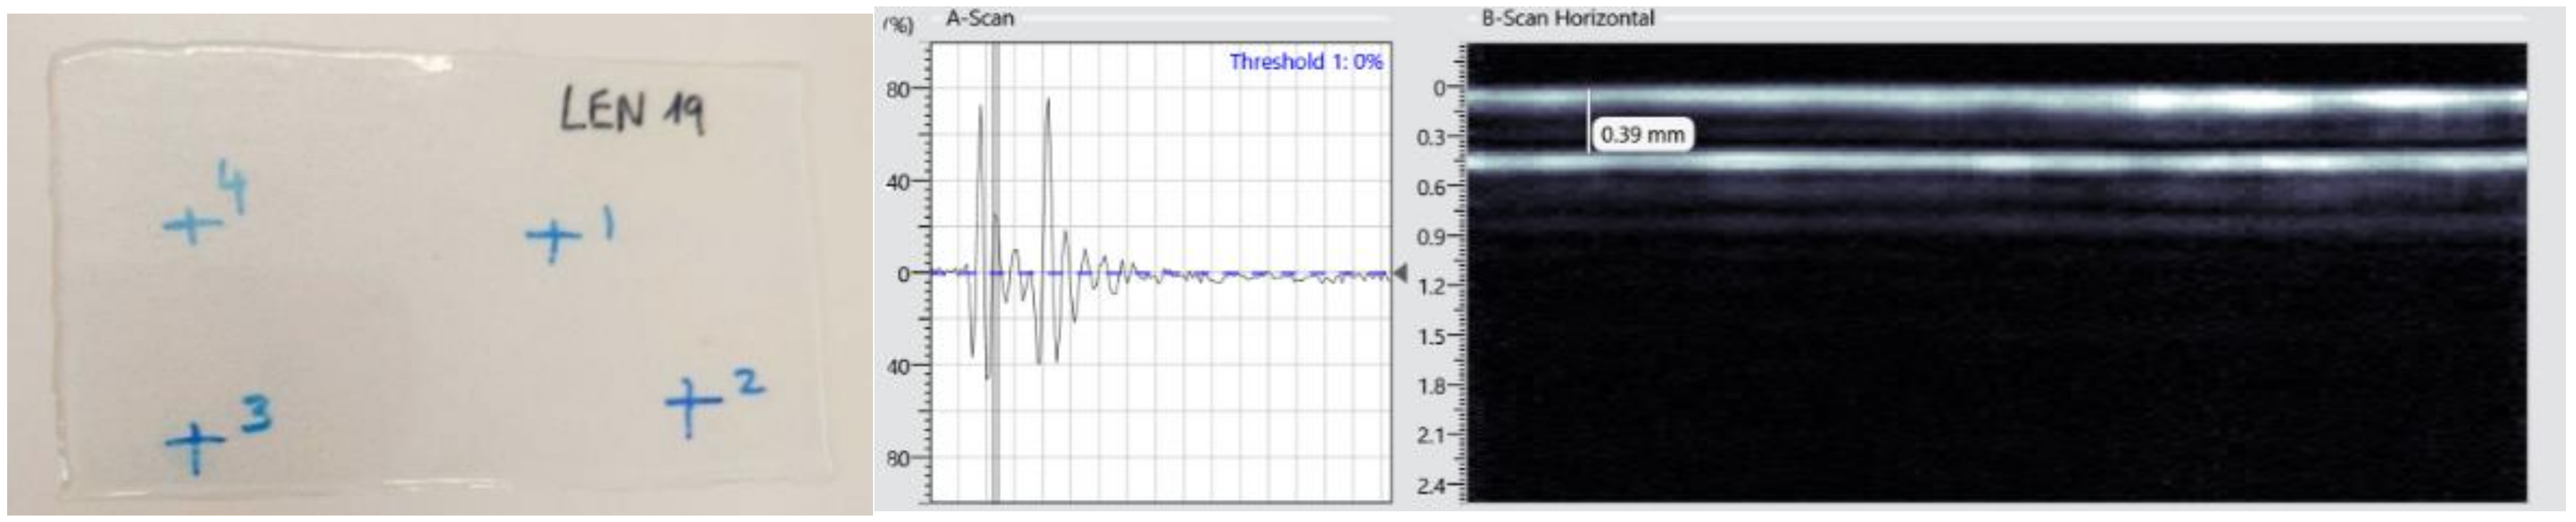
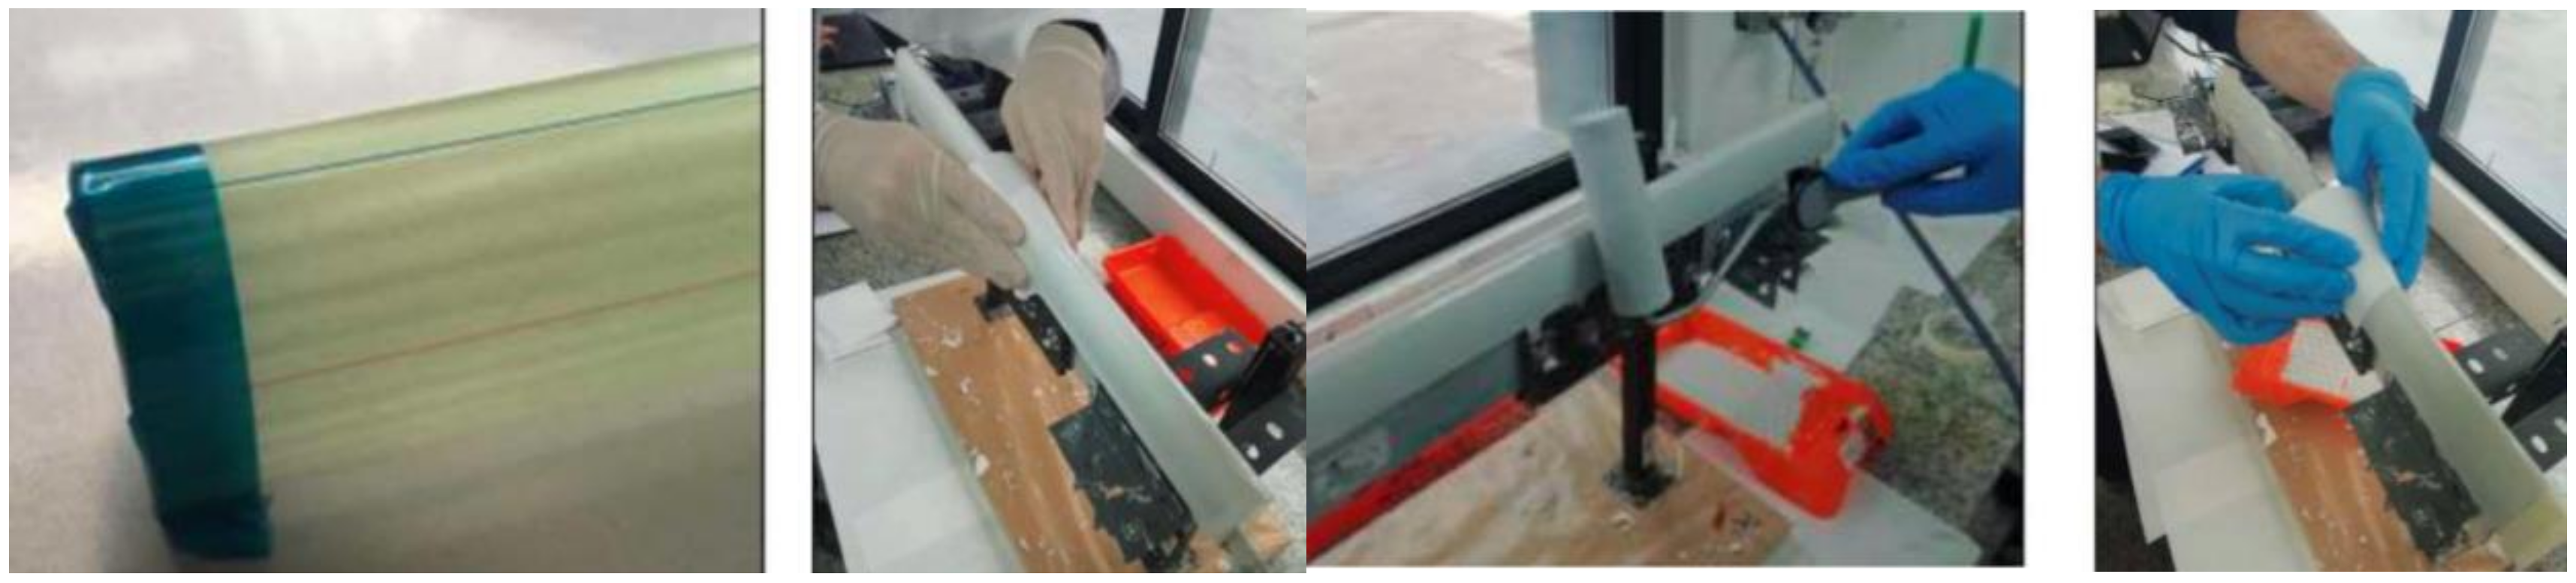
  • Measurements are taken of different locations of the sample coupon using Mitutoyo Digital Vernier caliper.
  • Transducer probe is placed on the coupon on the points marked region.
  • The number of transmitting elements and gain of the probe is adjusted to obtain a clear image of the backwall echo with the corresponding front wall threshold.
  • The crosshair line on the C scan is placed on the point of the coupon, by this the GUI shows the A scan, B scan and C scan image of the coupon at that point.
  • A line measurement tool is used to define a line from the front echo to the backwall on the point on the sample. The measurement tool will display the depth, which here is the thickness of the sample.
  • The velocity is adjusted in the velocity menu to obtain the measured thickness on the line measure tool, as per the Vernier caliper reading of that point/location.
  • Thus, the speed of sound of that location on the coupon is recorded to obtain the impedance, with known values of density using the Equation (1).
Figure 3 shows the impedance measurements using the 2.5 MHz probes. The impendence for the coating LEP, primer and two different fillers were successfully measured in three different batches with 6 measurements developed on each material. All materials measured showed a minor reduction (5–10%) in the impedance values when measured with the 2.5 MHz probe frequency compared to the 5 MHz probe throughout all the materials tested. This would indicate a limited stiffness variation in order to develop the erosion lifetime performance analysis with Springer modelling, assuming a constant impedance value used as input data for each material and measured using the 5 MHz UT probe for all cases. Figure 4 shows the average speed of sound measurements for the 5 MHz probe.

3. Quantitative Analysis of Relative Acoustic Impedance Characterization Affecting Rain Erosion Performance

The wear erosion lifetime prediction model used in this research was computationally evaluated and implemented [15] to link material input data definition with its performance estimation. A complete map of the liquid droplet, coating LEP and substrate (primer or filler) material impedances as input parameters of the equations defined in the modelling is proposed in Figure 5.
In order to discuss assumptions and capabilities of the proposed modelling, different study cases are followed throughout this section of the document.

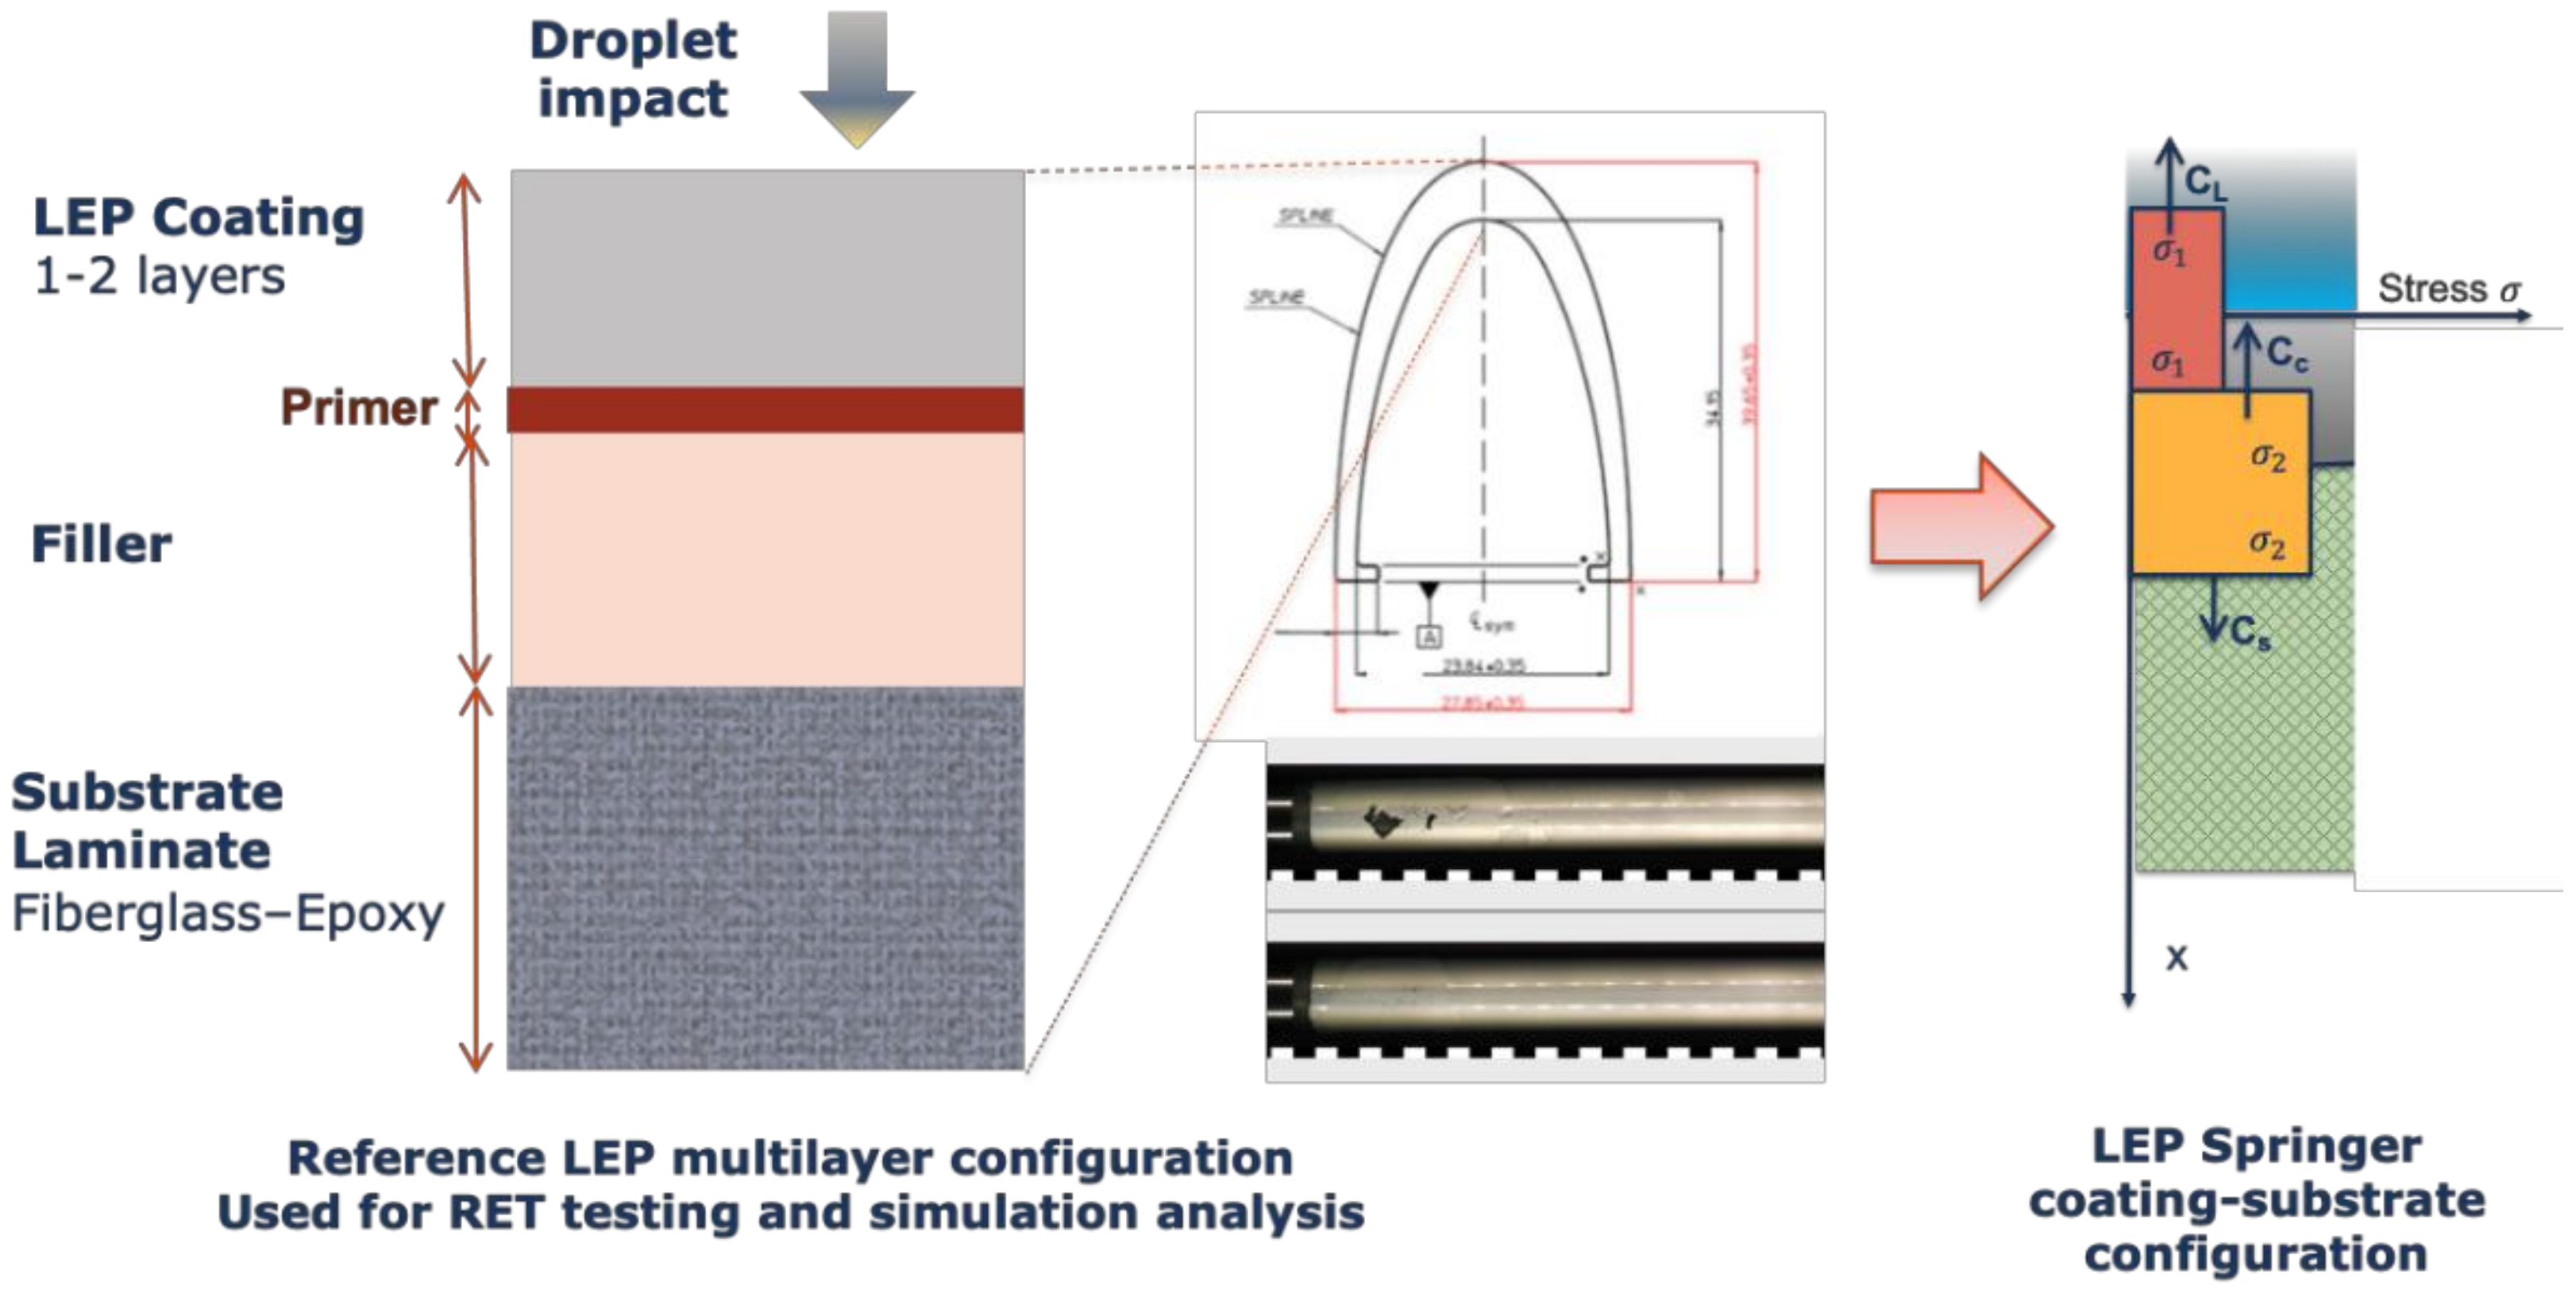
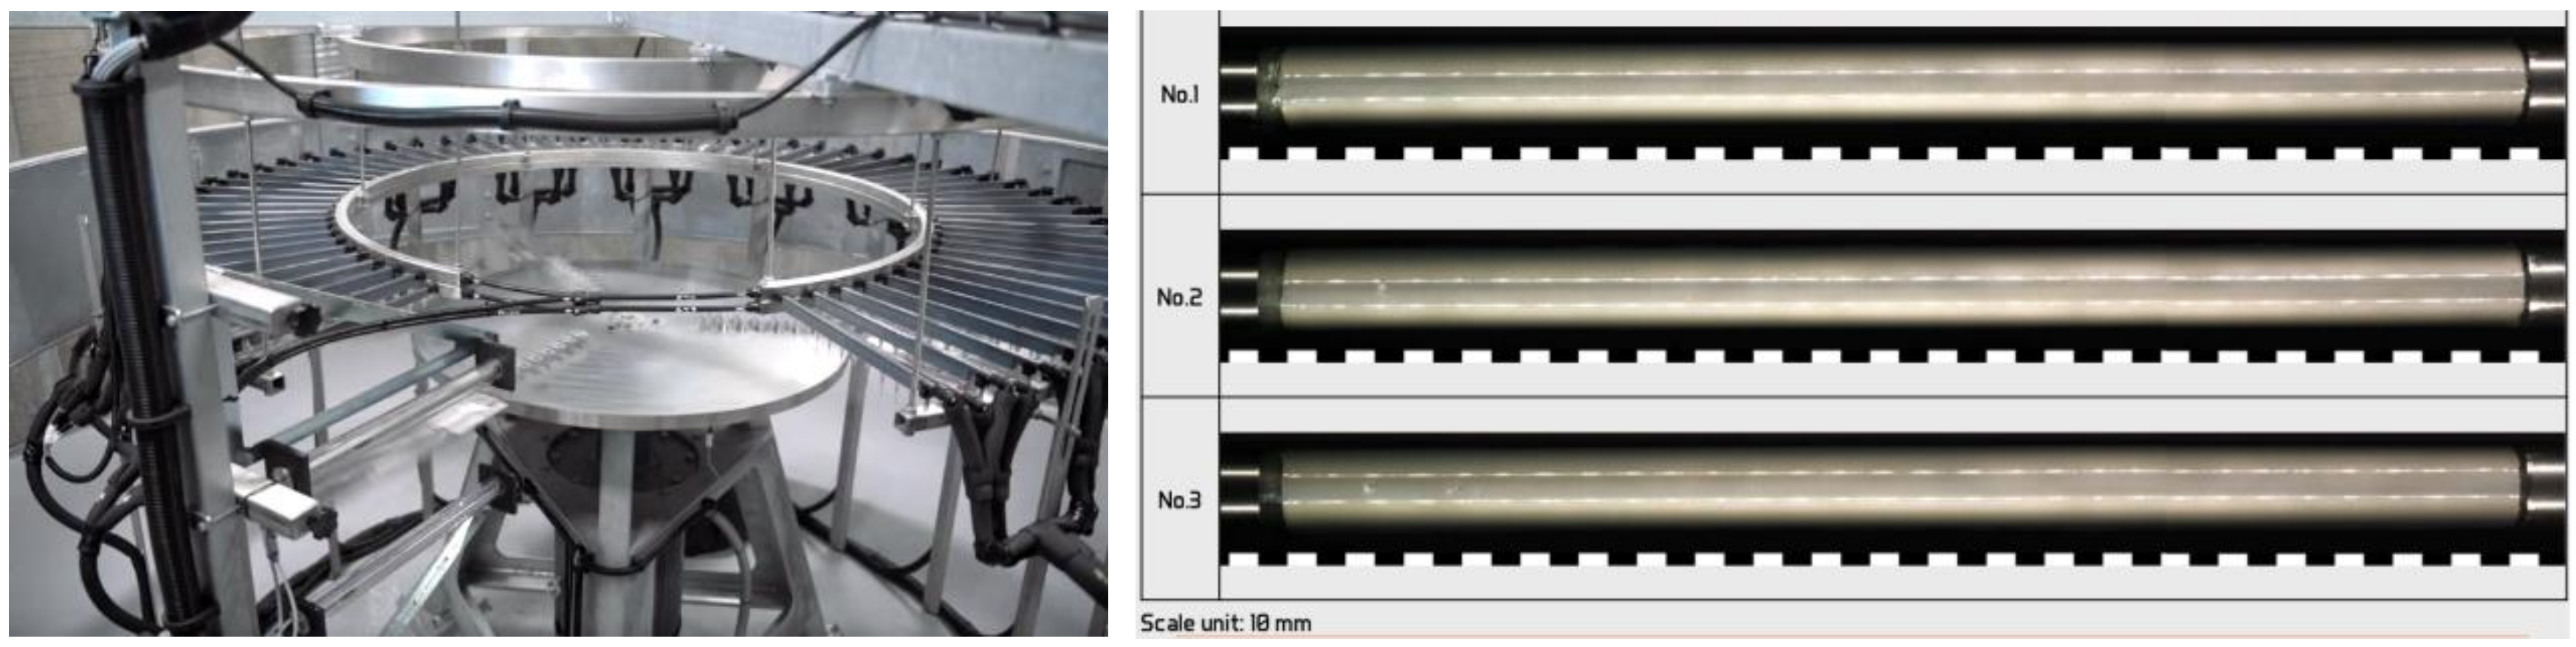
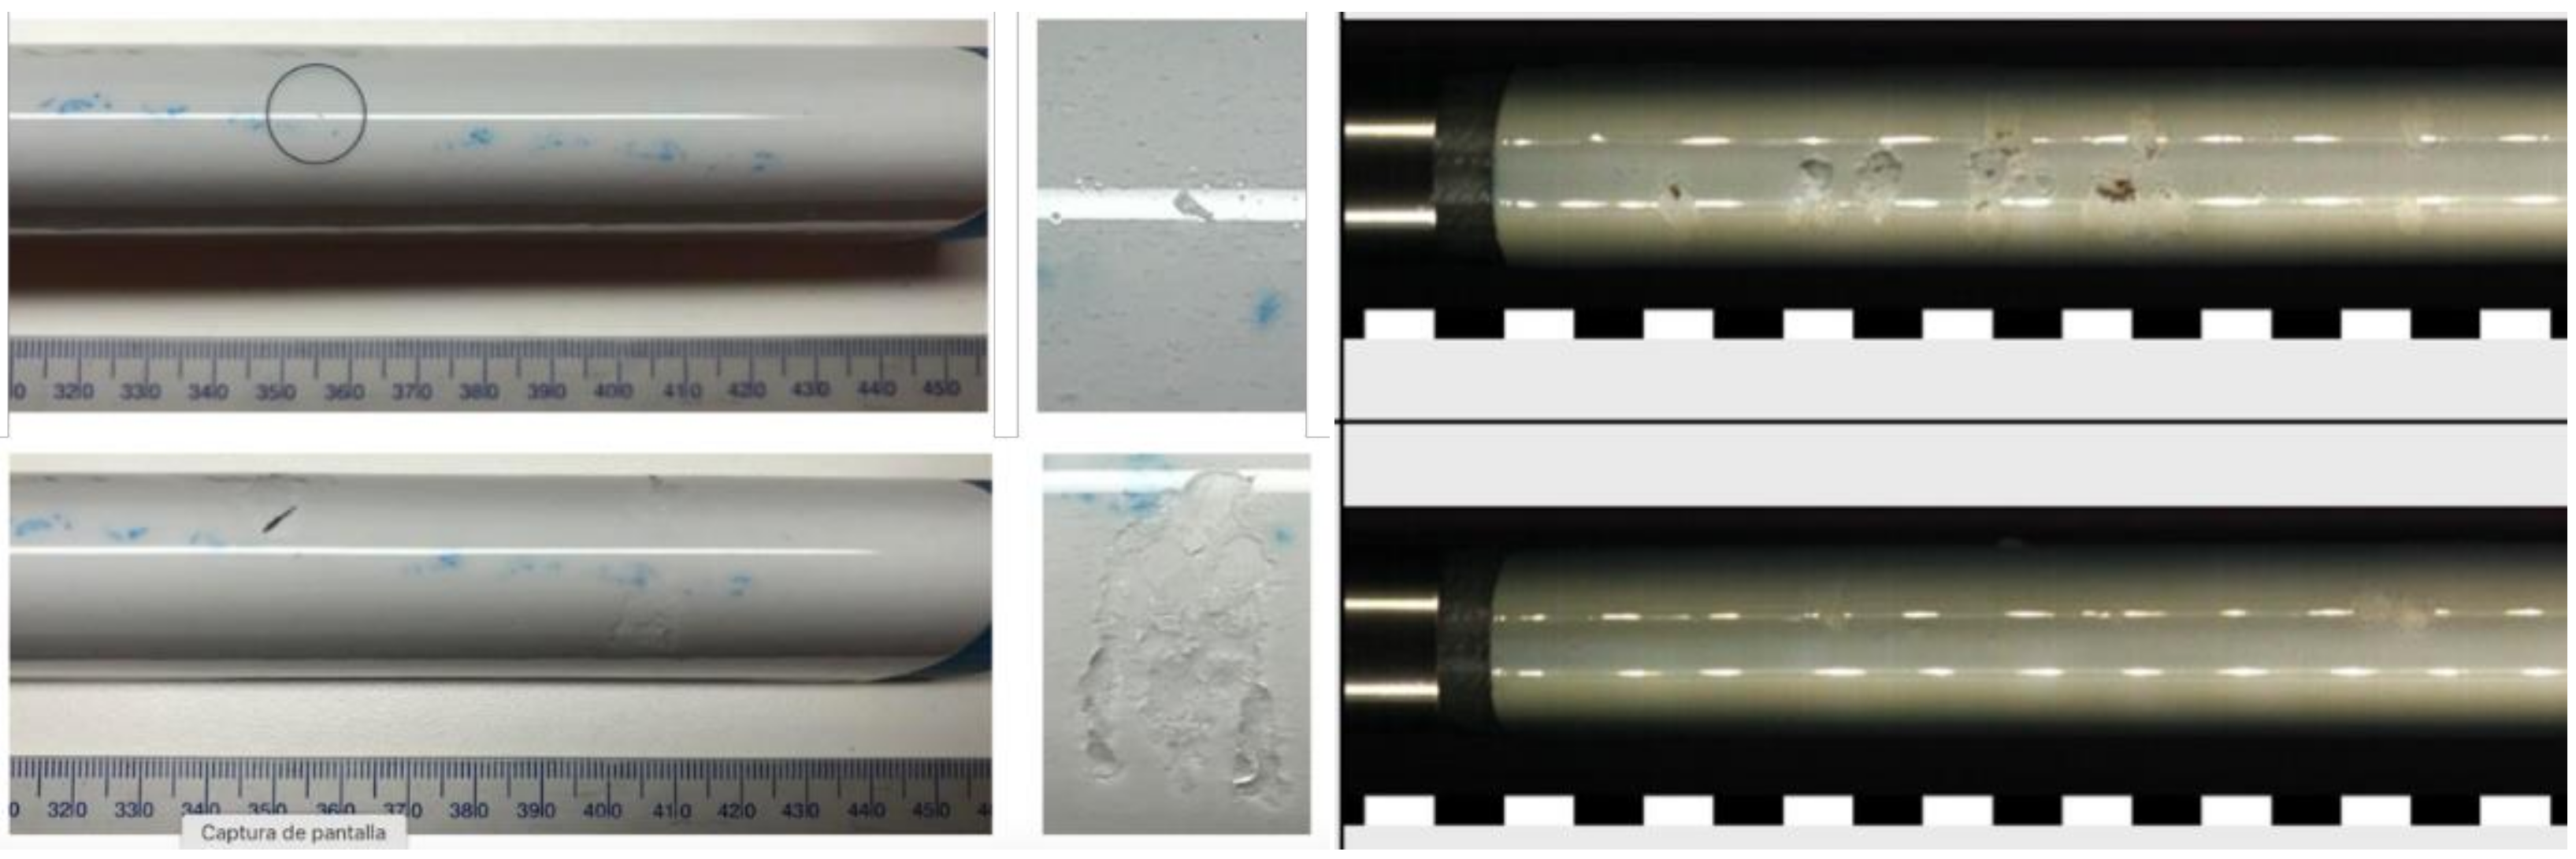
3.1. Case 1. Analysis of a LEP Multilayer System Rain Erosion Testing Based on ASTM G73-10

This analysis case considers the rig features used at University of Limerick based on ASTM G73-10 [37] (Figure 6), with two set of coupons comparing the inclusion of a primer layer and another one with the coating LEP application directly to the sanded filler (see [3] for details). The modelling input data are defined in Table 1.
Figure 7 shows the simulated analysis and the testing results tested at the WARER U.Limerick [3,7], comparing for two experimental batches of given top coating material prototypes, with primer and without primer, only with a filler substrate layer, as depicted in Figure 6. On the left vertical axes, one can observe the mass loss for the simulated results (in straight lines). On the right vertical axes, the box and whispers plots (in red for wear and in blue for debonding) are shown for each batch of the rain erosion testing (RET) tested coupons (developed over five coupons size batches). Horizontal axes define the incubation time for the experimental and simulated coupons. It is observed that since the primer and the filler have very similar impedance values, the expected lifetime is also comparable. Moreover, it is assumed that both materials have semi-infinite thickness (in the case of the primer, only a 50 µm thickness is applied in real). The experimental testing anticipates the wear damage showing inaccuracy on the modelling results. The simulated outcomes include important uncertainties due to fundamental properties values used as input data on the modelling. In this case, LEP top coating material ultimate strength was estimated with numerical extrapolation at high strain rates from [18].
The modelling approach nevertheless is useful to quantify how the expected lifetime of a given configuration correlates with a given fundamental property variation, as introduced in Figure 5. In Figure 8 is shown the lifetime consequence of a LEP material properties variation of 20%, such are the computation of 80% and 120% values of the reference system. In this analyzed case, the wave speed of the coating, cc (in green dotted) and is compared with the Ultimate Strength of the coating, σ u c , (in blue line). One can realize that a variation on the ultimate strength of the material influences more significantly on the expected LEP lifetime (and so its determination by appropriate testing, but out of the scope of this work). An example of that issue is quantified for the speed of sound values that the Springer modelling requires as input data used in this research.
Other analysis is due to the relative impedance values on the interfaces liquid-coating and coating-substrate that affect directly the lifetime performance results, see Figure 9. The parameters φ L c and φ s c defined in Equation (2) (see Figure 5 for complete reference of the used equations), allow one to identify suitable combinations to optimize lifetime performance by means of acoustic matching.
It is important to note that the stress history and the criteria to consider how the stress waves affect fatigue damage is based on a simplified one-dimensional and pure elastic single impact analysis as introduced in previous section. Figure 10 shows the considered stress evolution at coating LEP surface due to consecutive reflections defined in Equations (3)–(5), introduced in [15] and depicted in Figure 5, for our reference system comparing lifetime prediction due to 50% variation of the coating speed of sound cc (computing 50% and 150% of the reference values). The key parameter in this case is the averaged stress σ o calculated for the estimated impact duration. It is defined as a constant value in Equation (8), introduced in [15], and directly applies in lifetime prediction with the number of impacts estimation during incubation time, Equation (15). It is observed that a reduction and an increment of the reference value reduce, in both cases, the coating LEP lifetime estimation. This is due that the coating speed of sound values affect not only the coating-substrate reflections, also the liquid-coating interface and hence to the waterhammer pressure at surface.
Figure 11 shows the equivalent analysis when the variation is due to the filler-substrate speed of sound cs. In this case, that a 50% reduction on its value may yield and improvement of lifetime estimation and a 150% of its reference value consequences an abrupt loss on erosion lifetime. Figure 12 depicts the stress history with the same assumptions, but at the interface coating-substrate, calculating σ h with Equation (9), introduced in [15].
The analysis allows one to define appropriate criteria for evaluate the coating LEP capability to reduce or enhance the surface and interface stress, depending on its relative coating-substrate impedance (or speed of sound). Its optimization in terms of fatigue lifetime may be coupled with another parameter analysis, as discussed later in this section. By using other numerical simulation techniques and more complex material models, the accurateness on this estimation may be also improved.

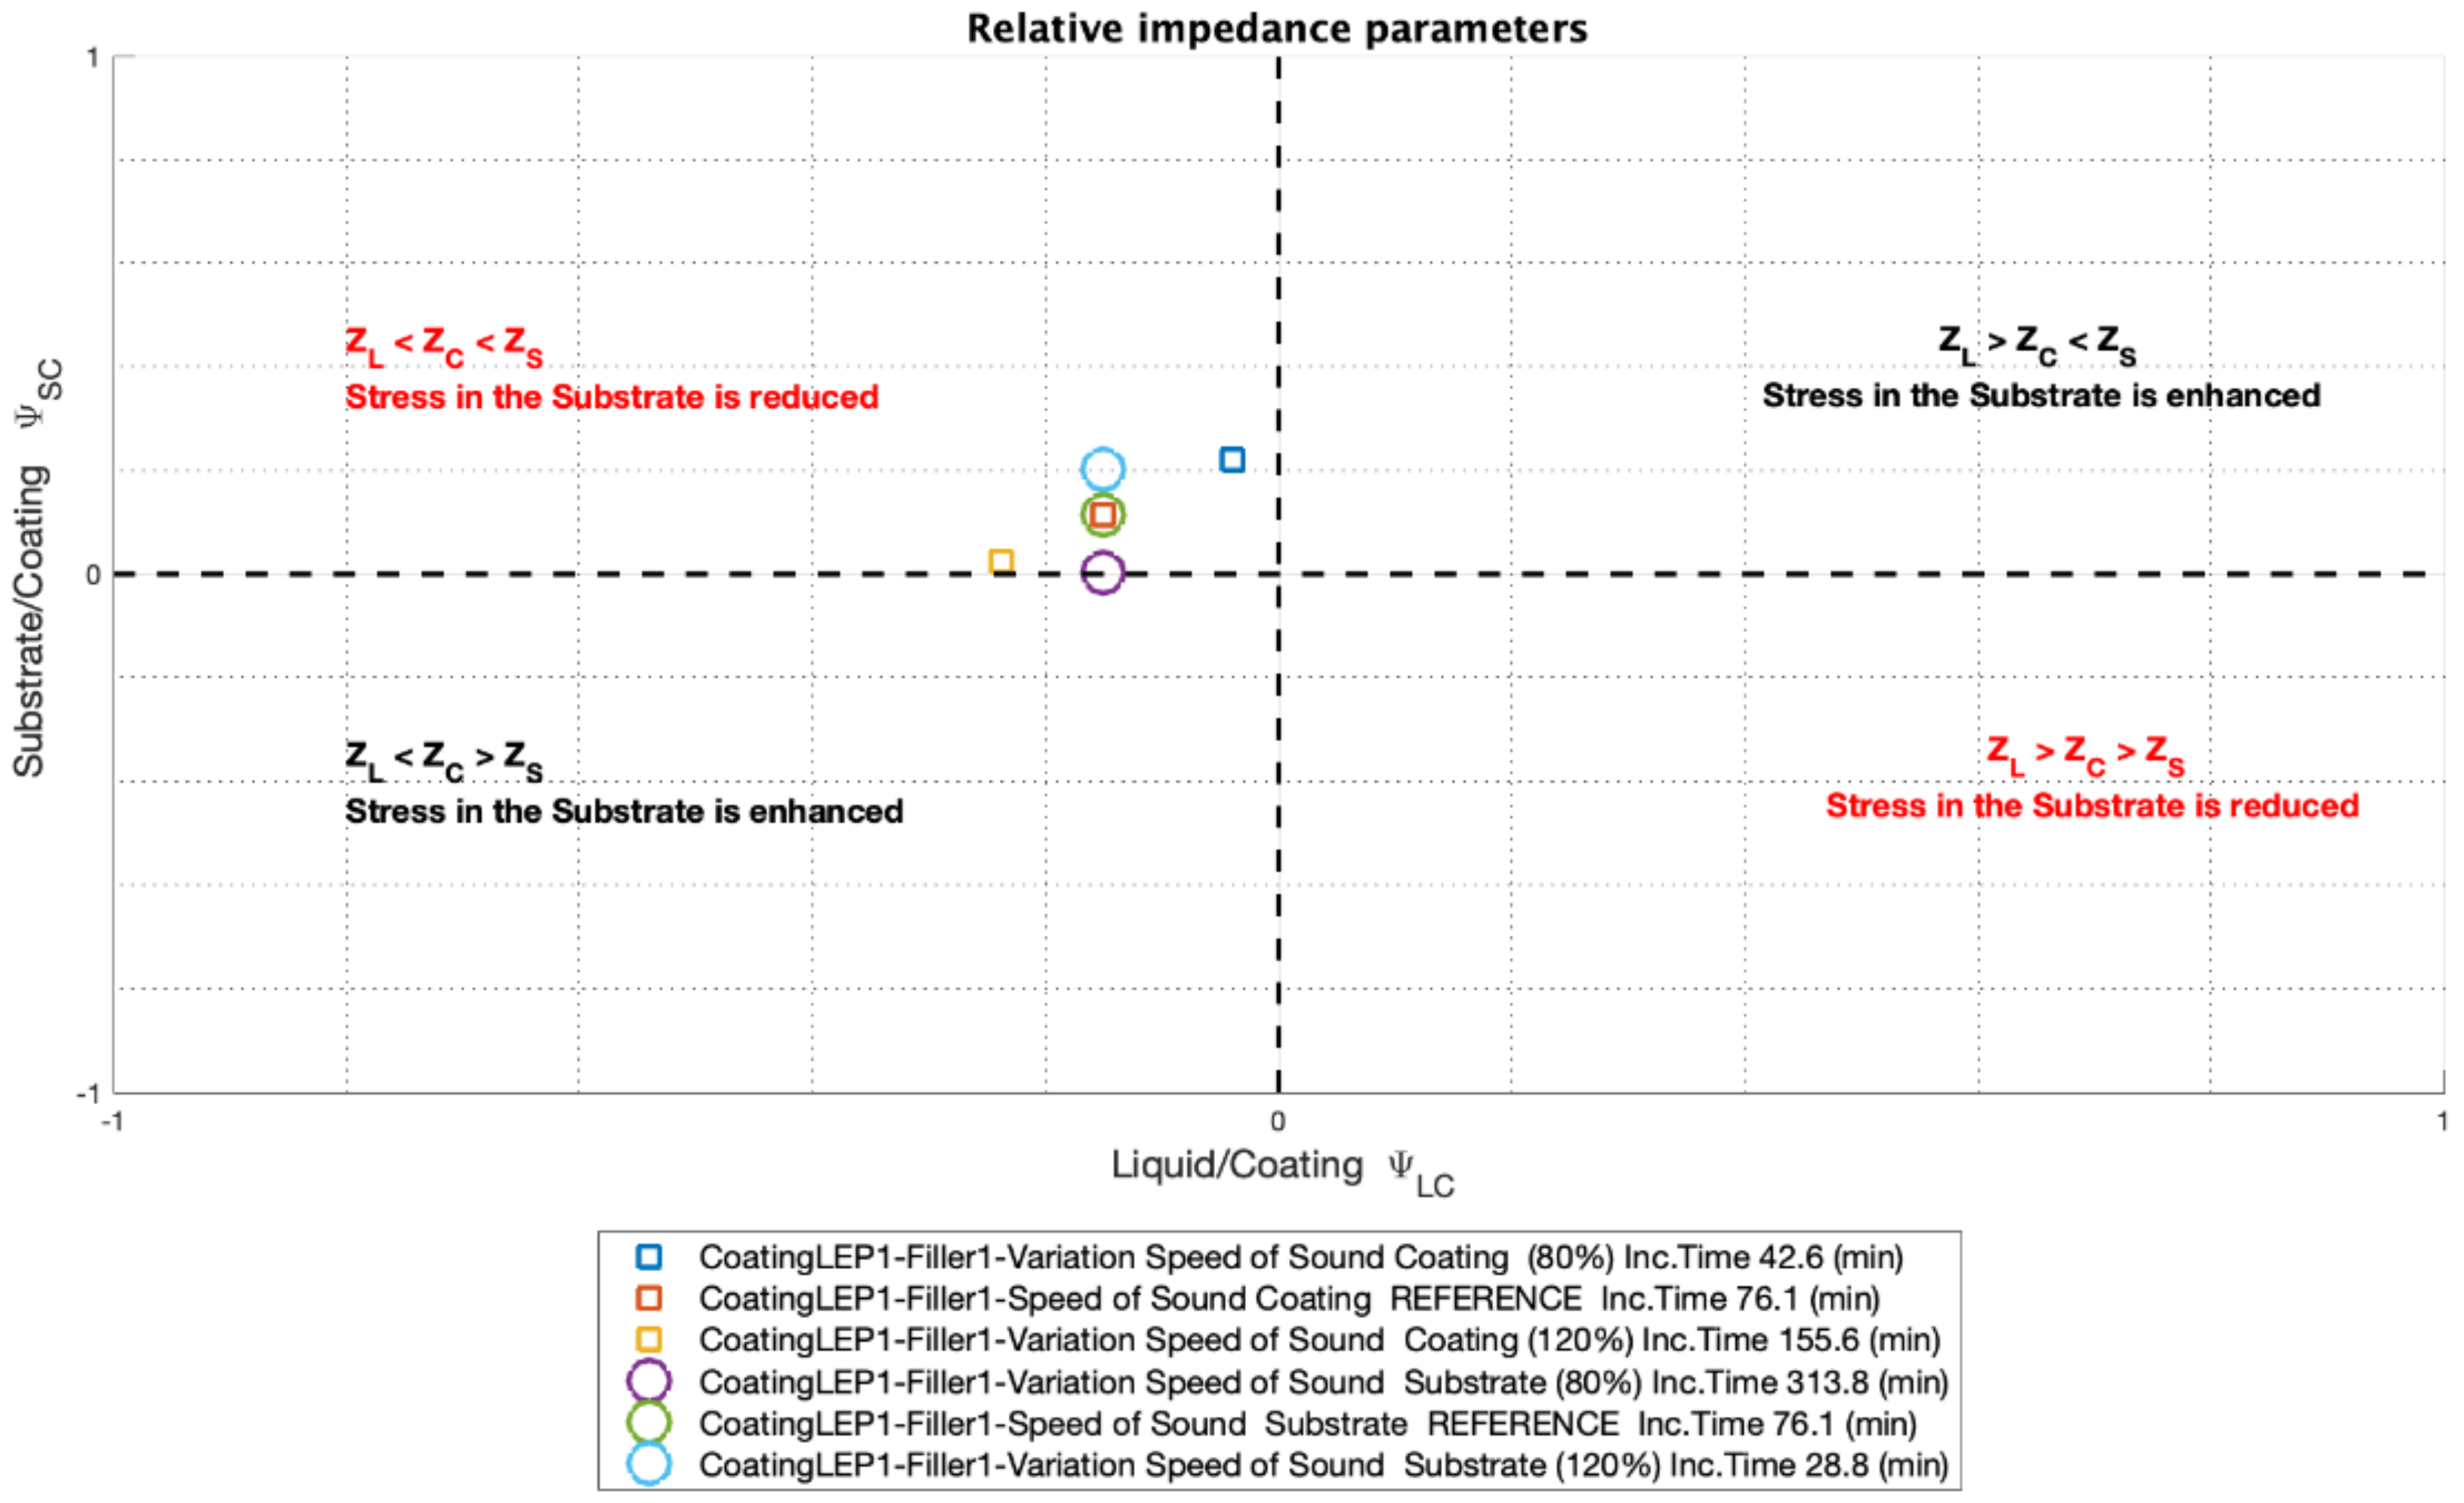
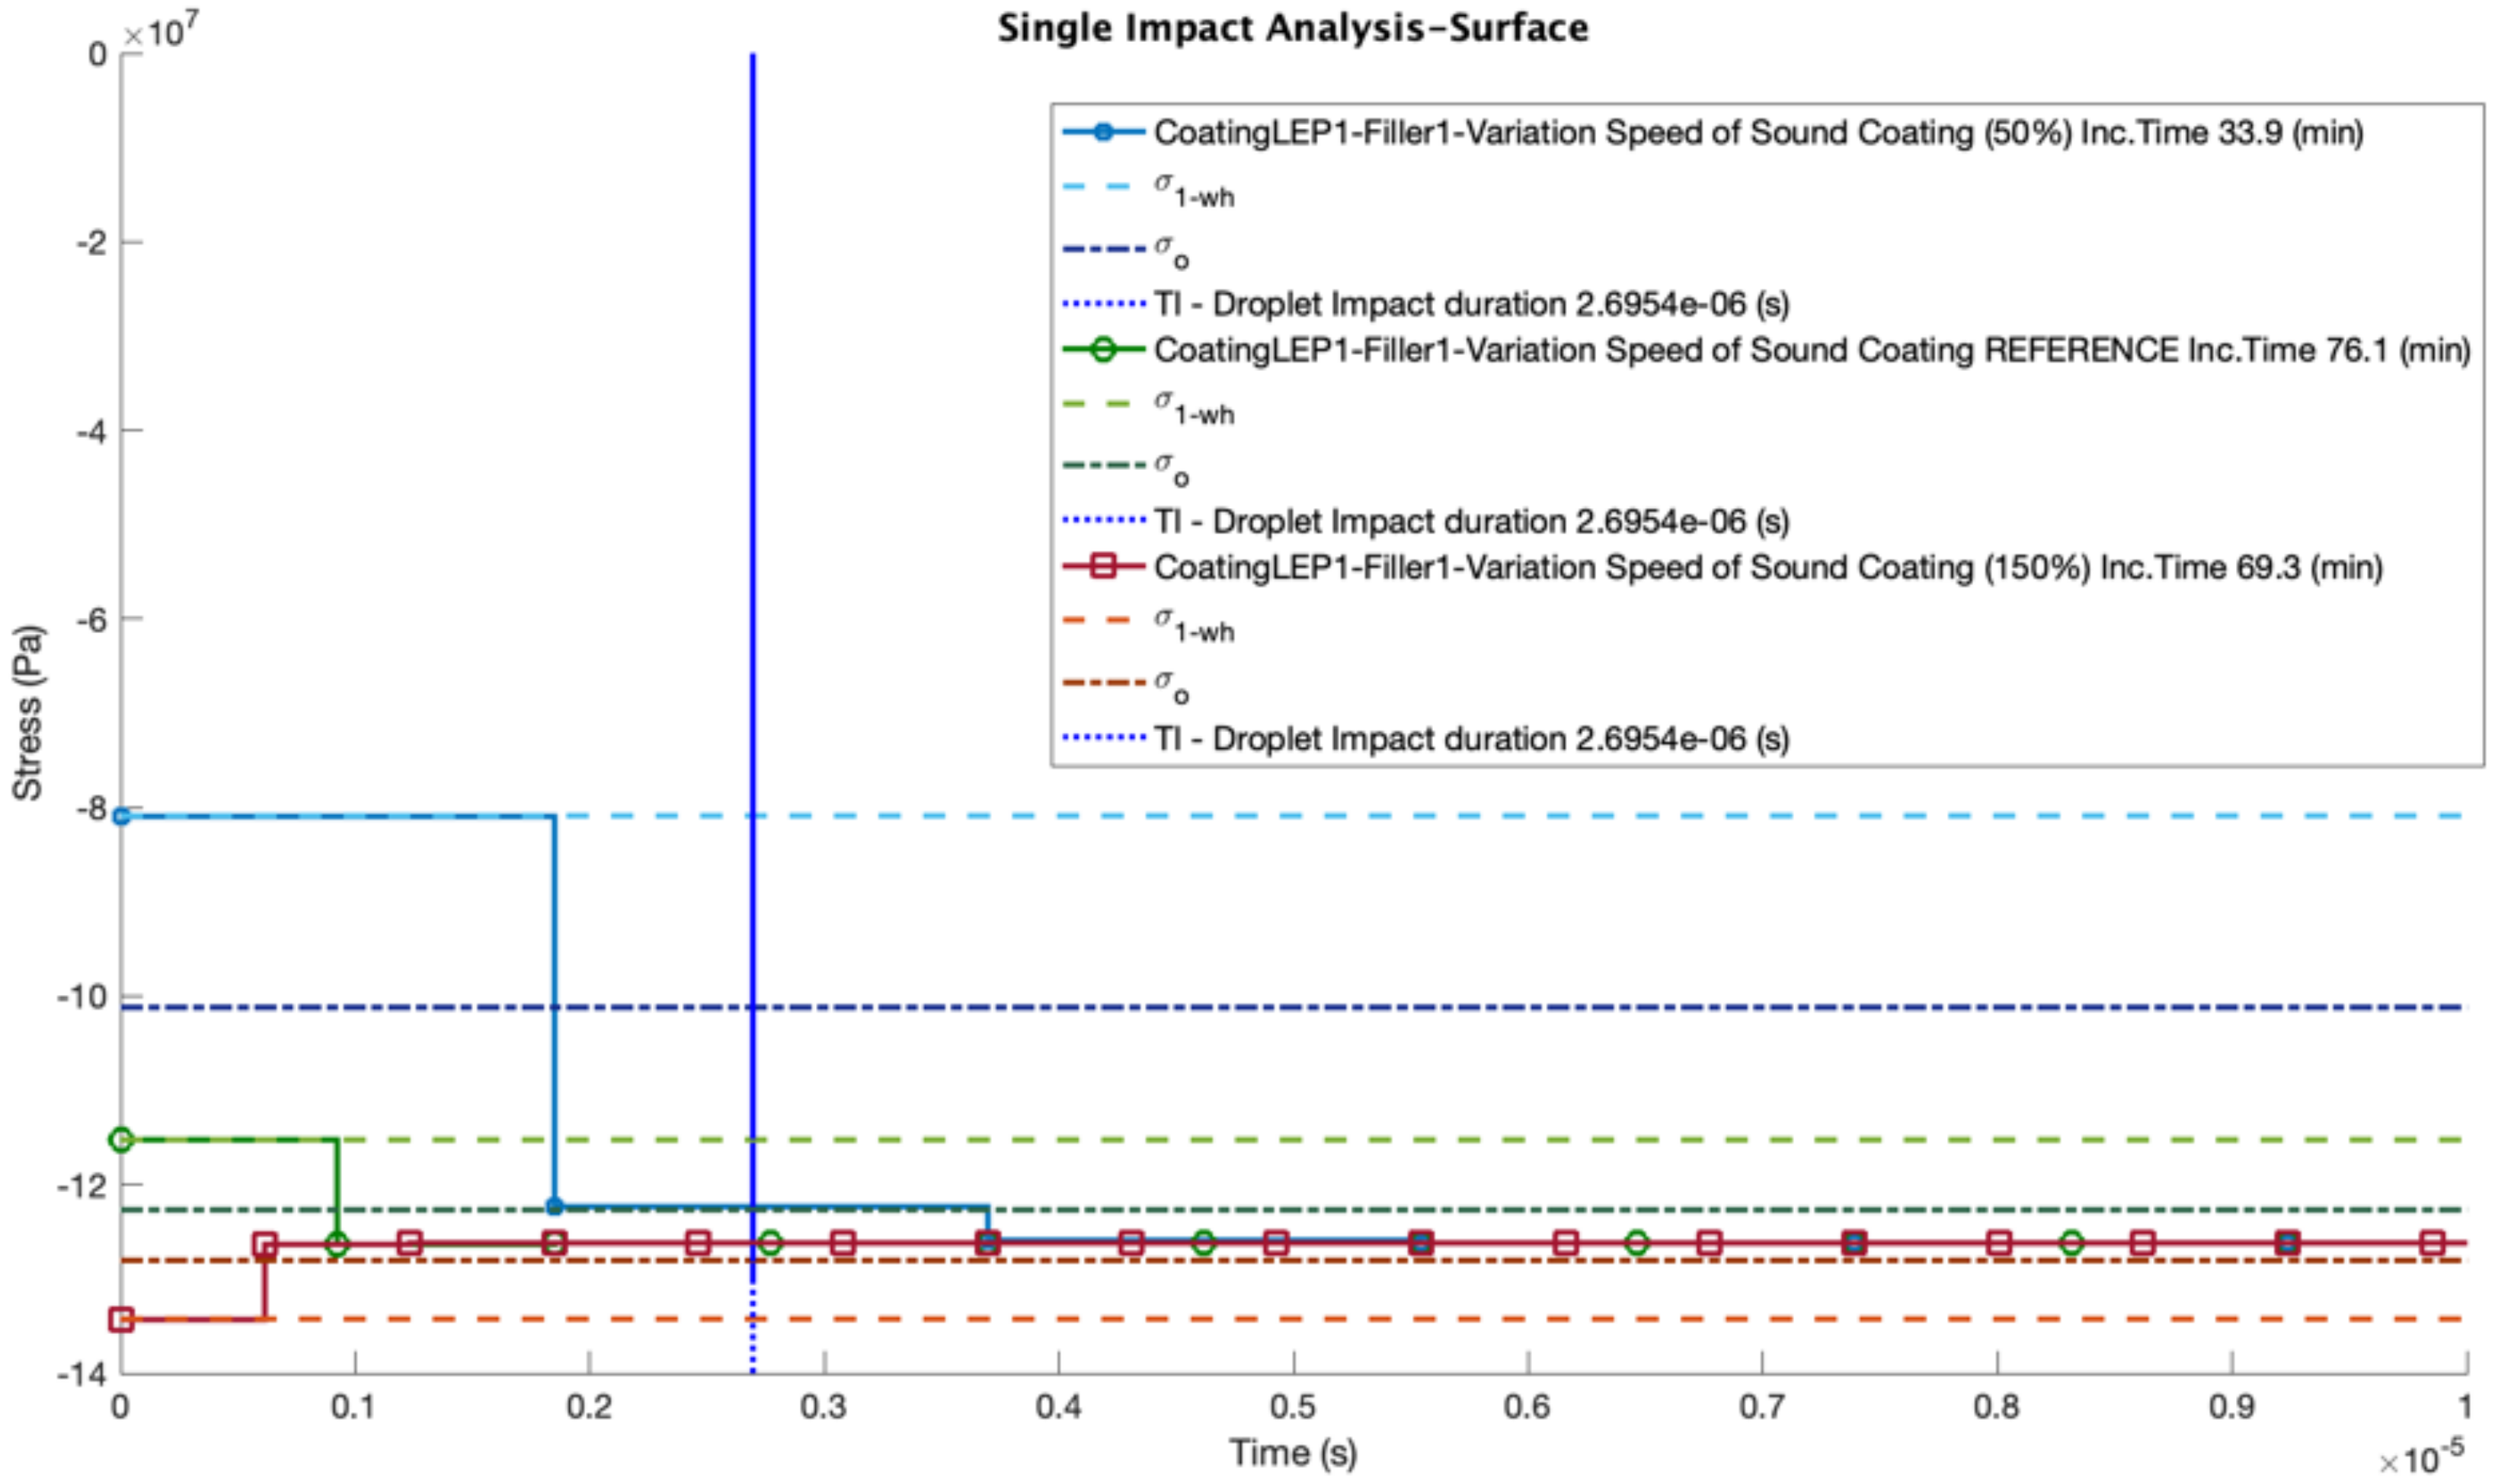
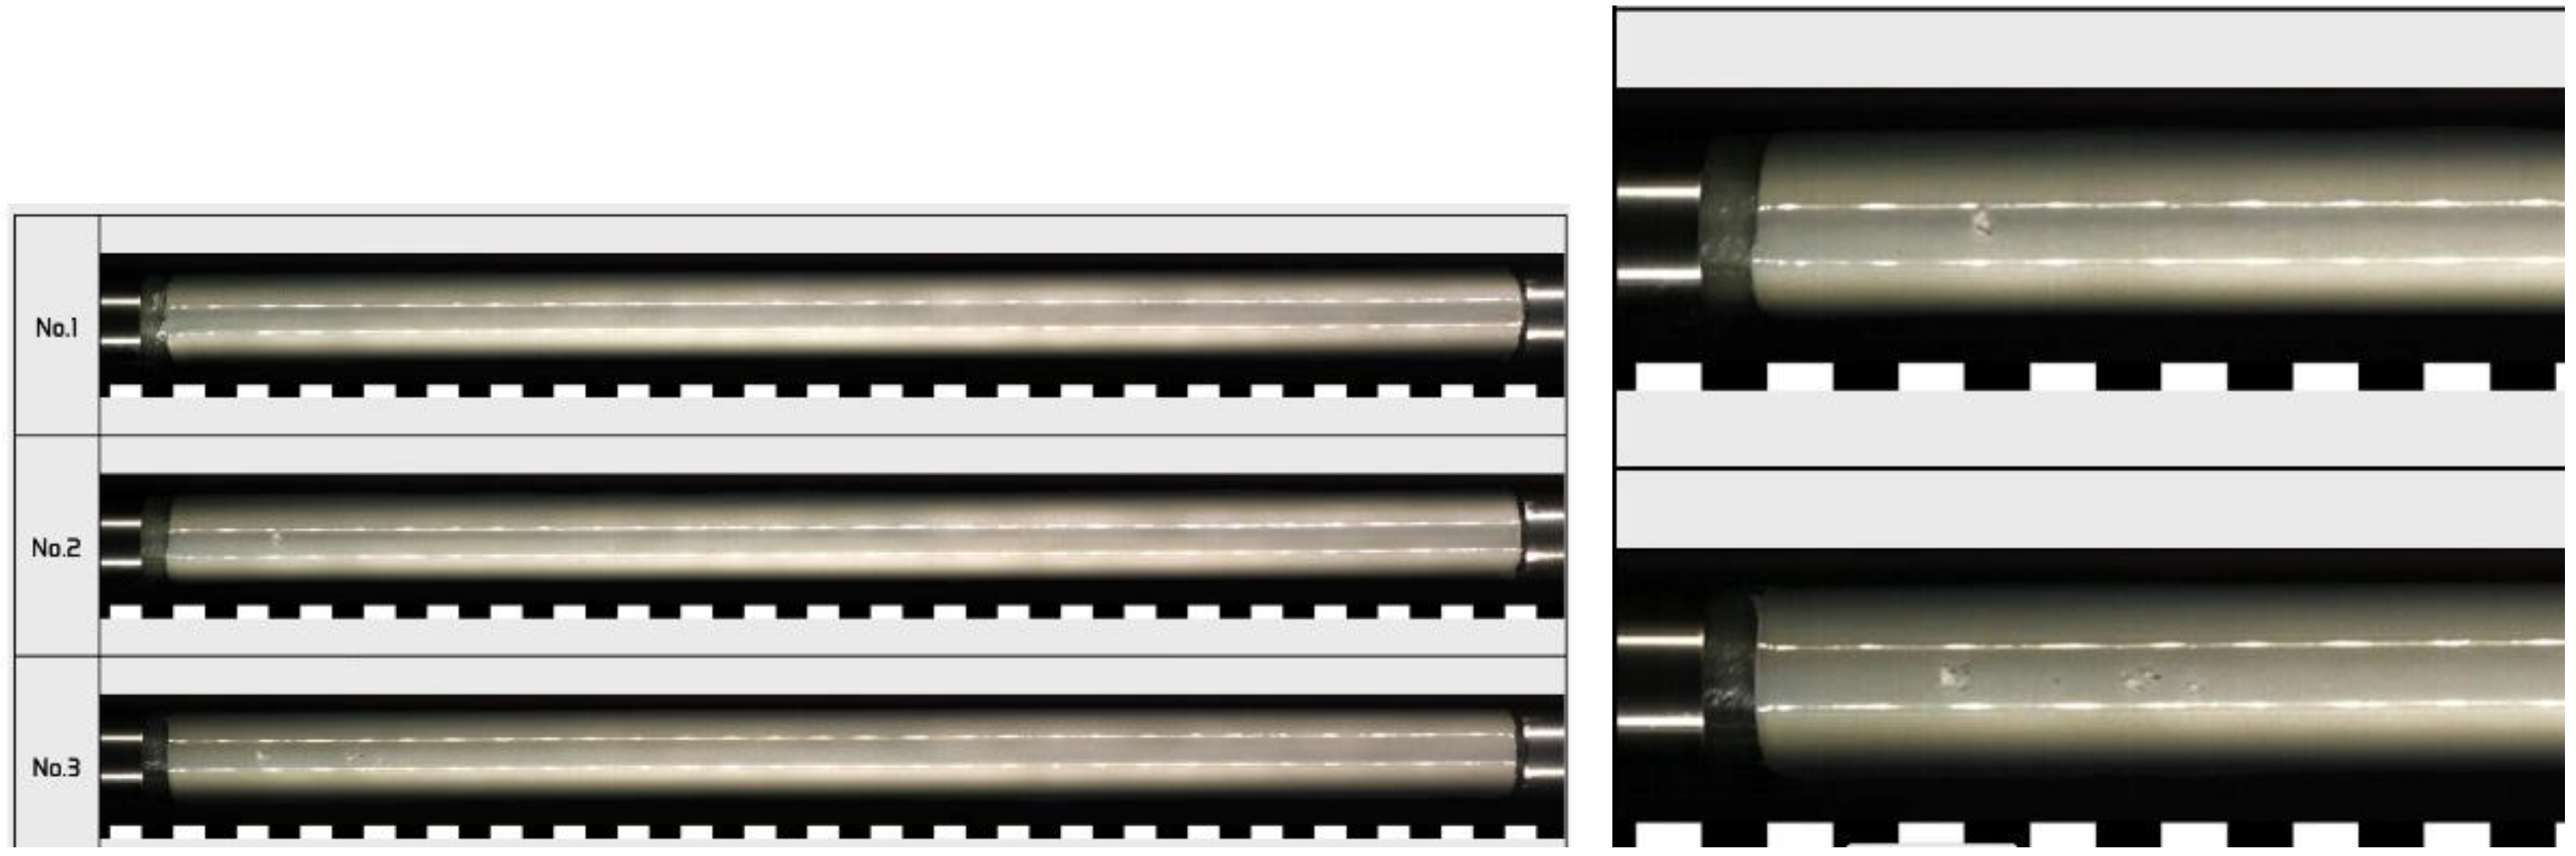
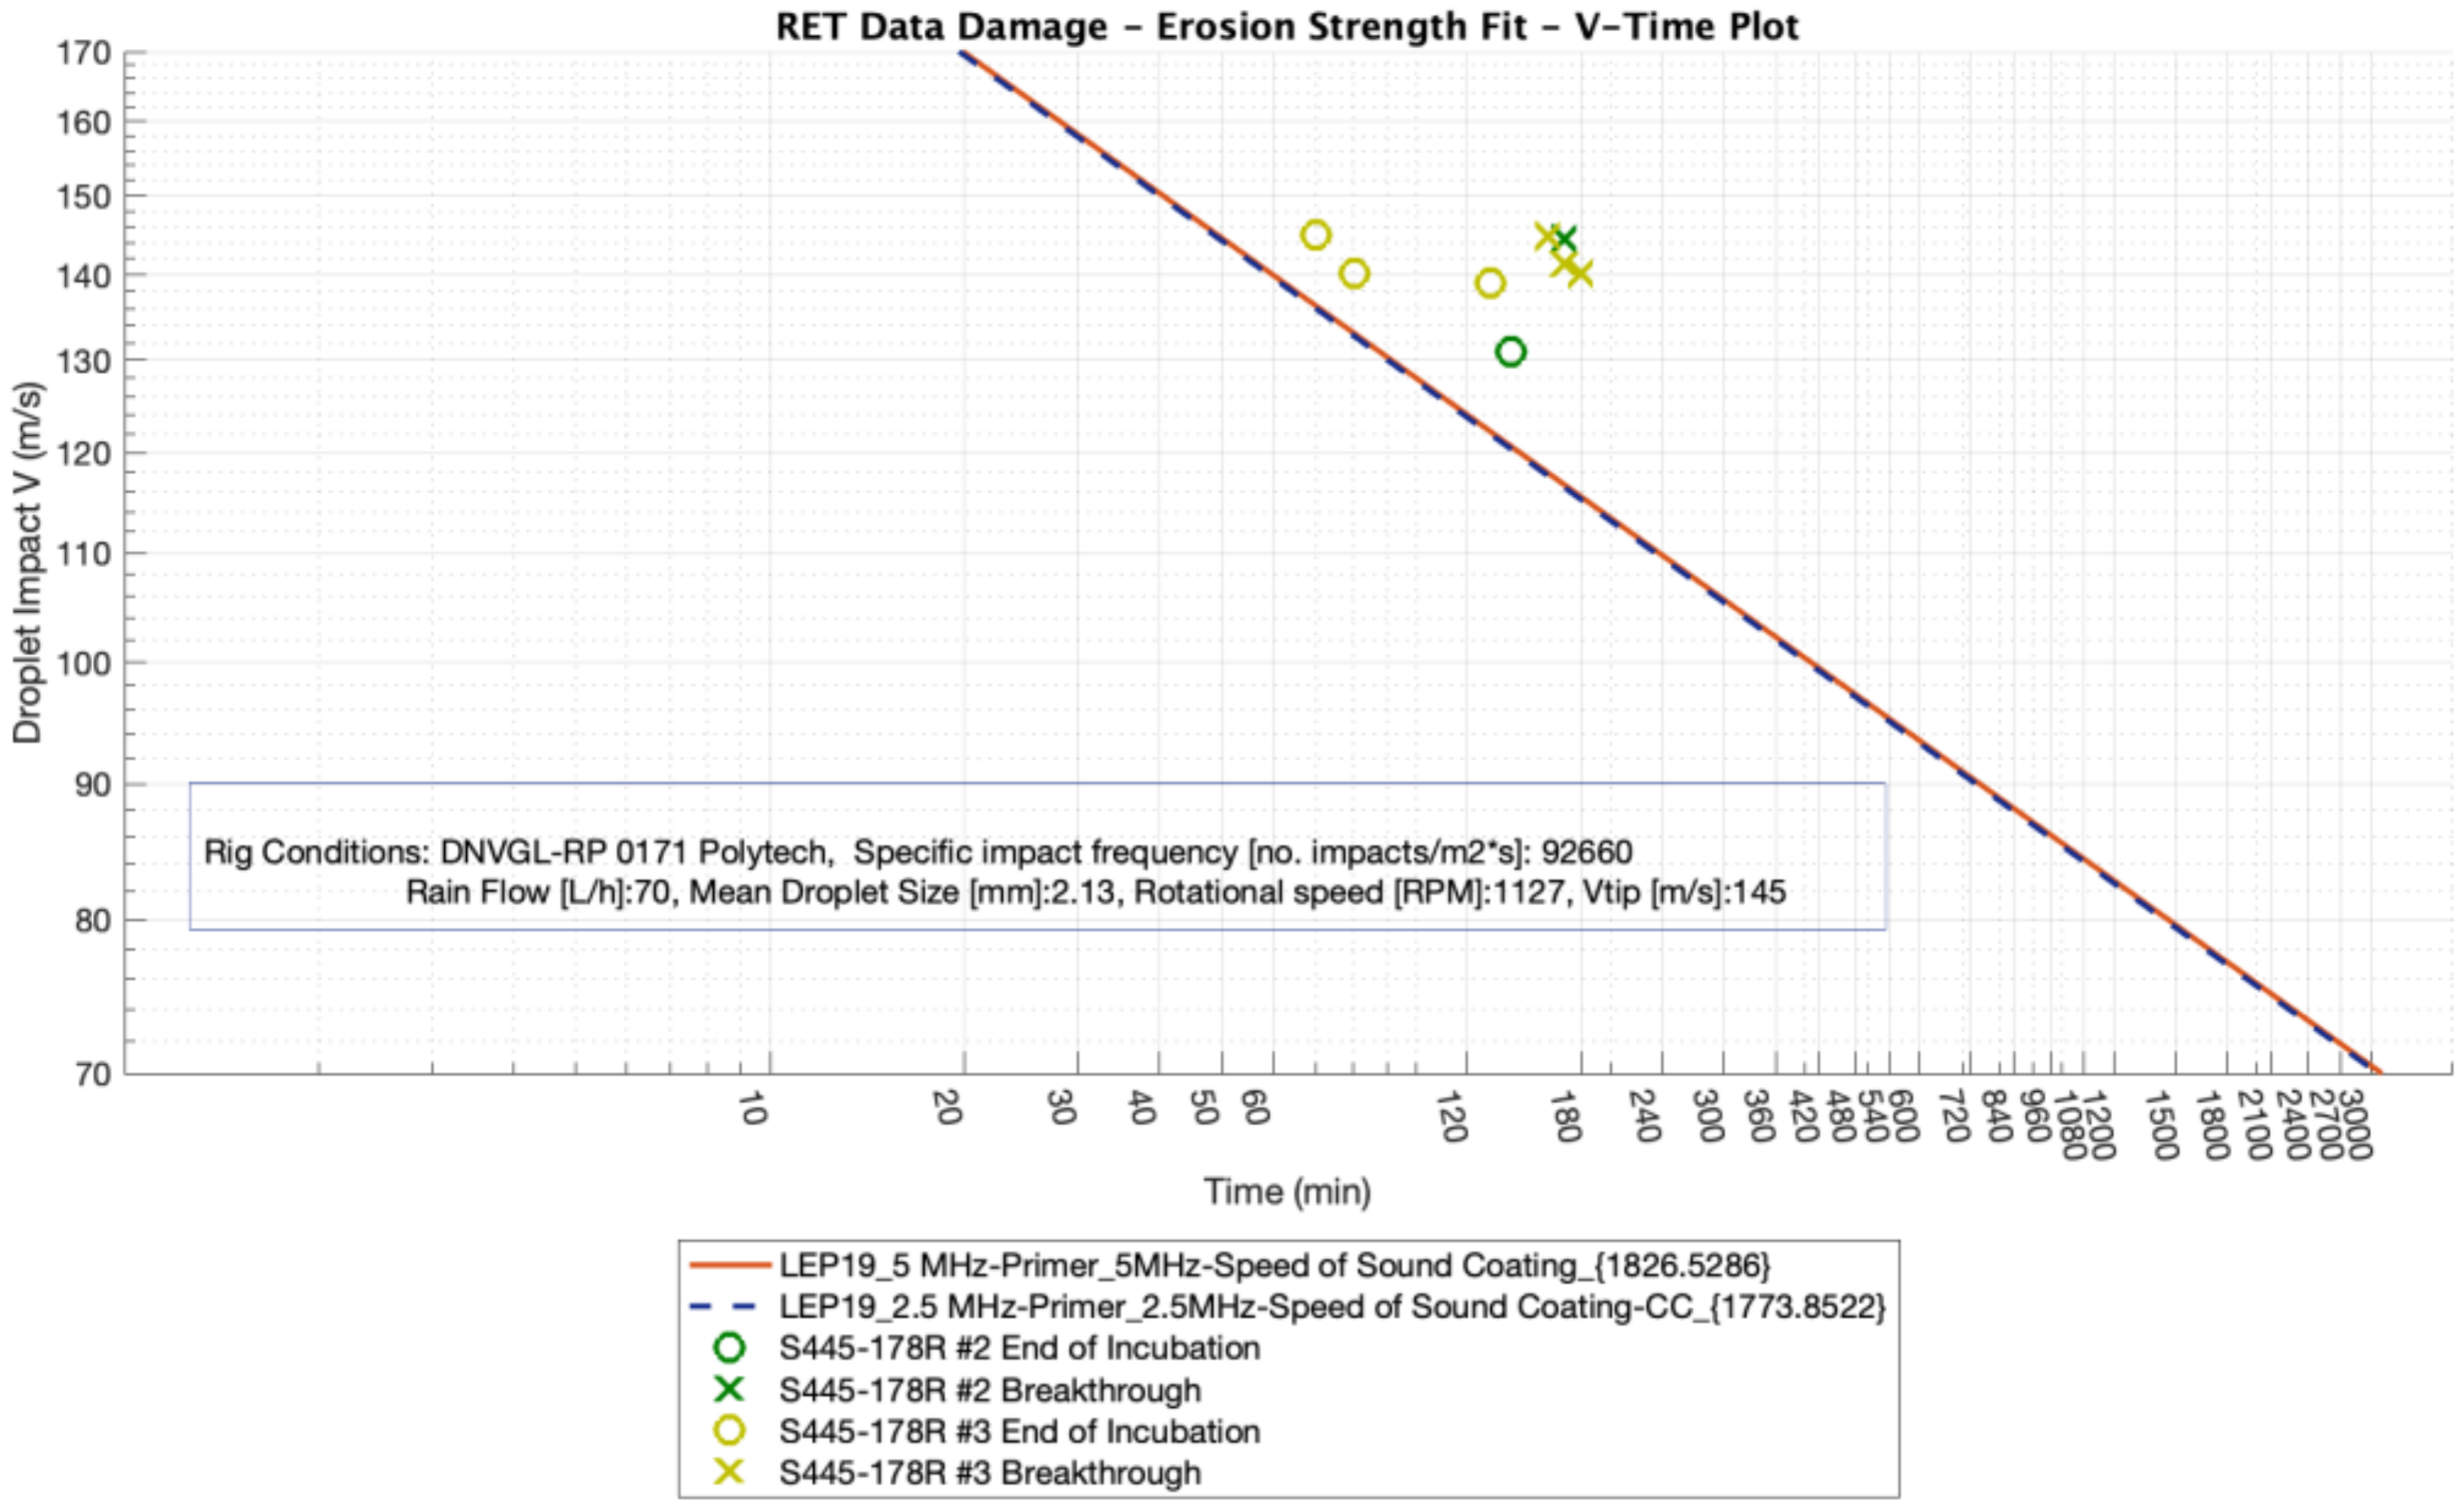
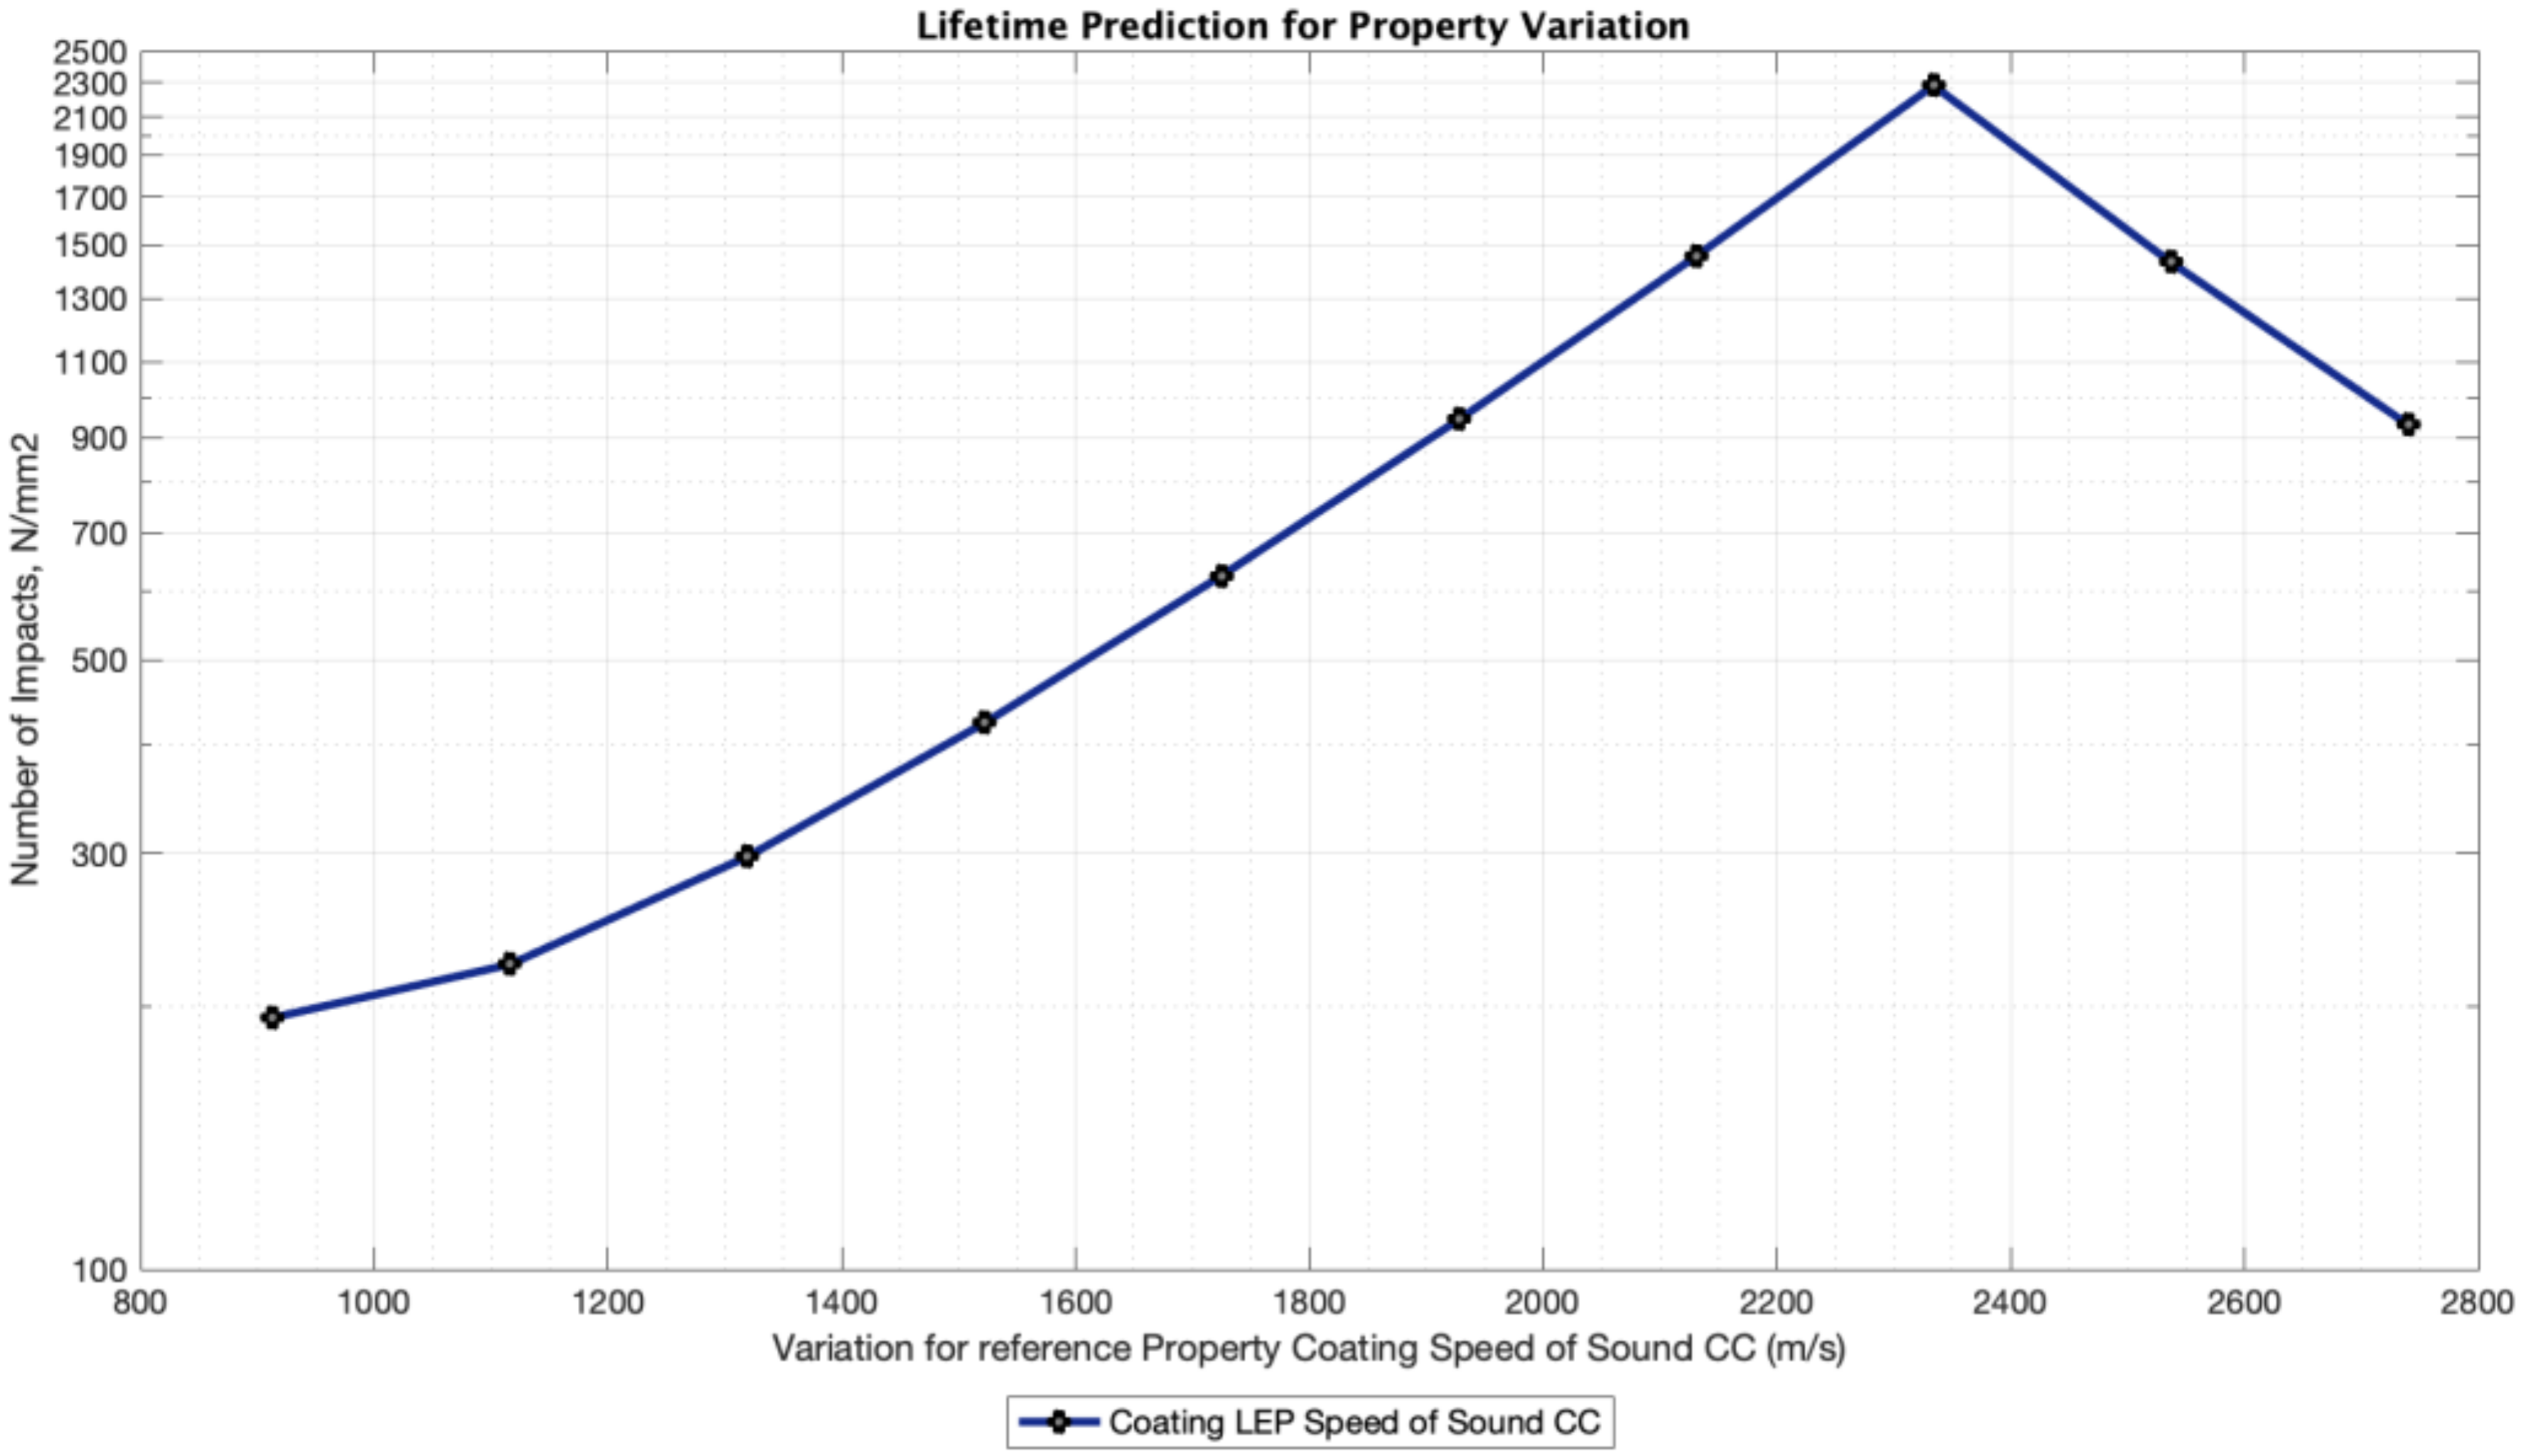
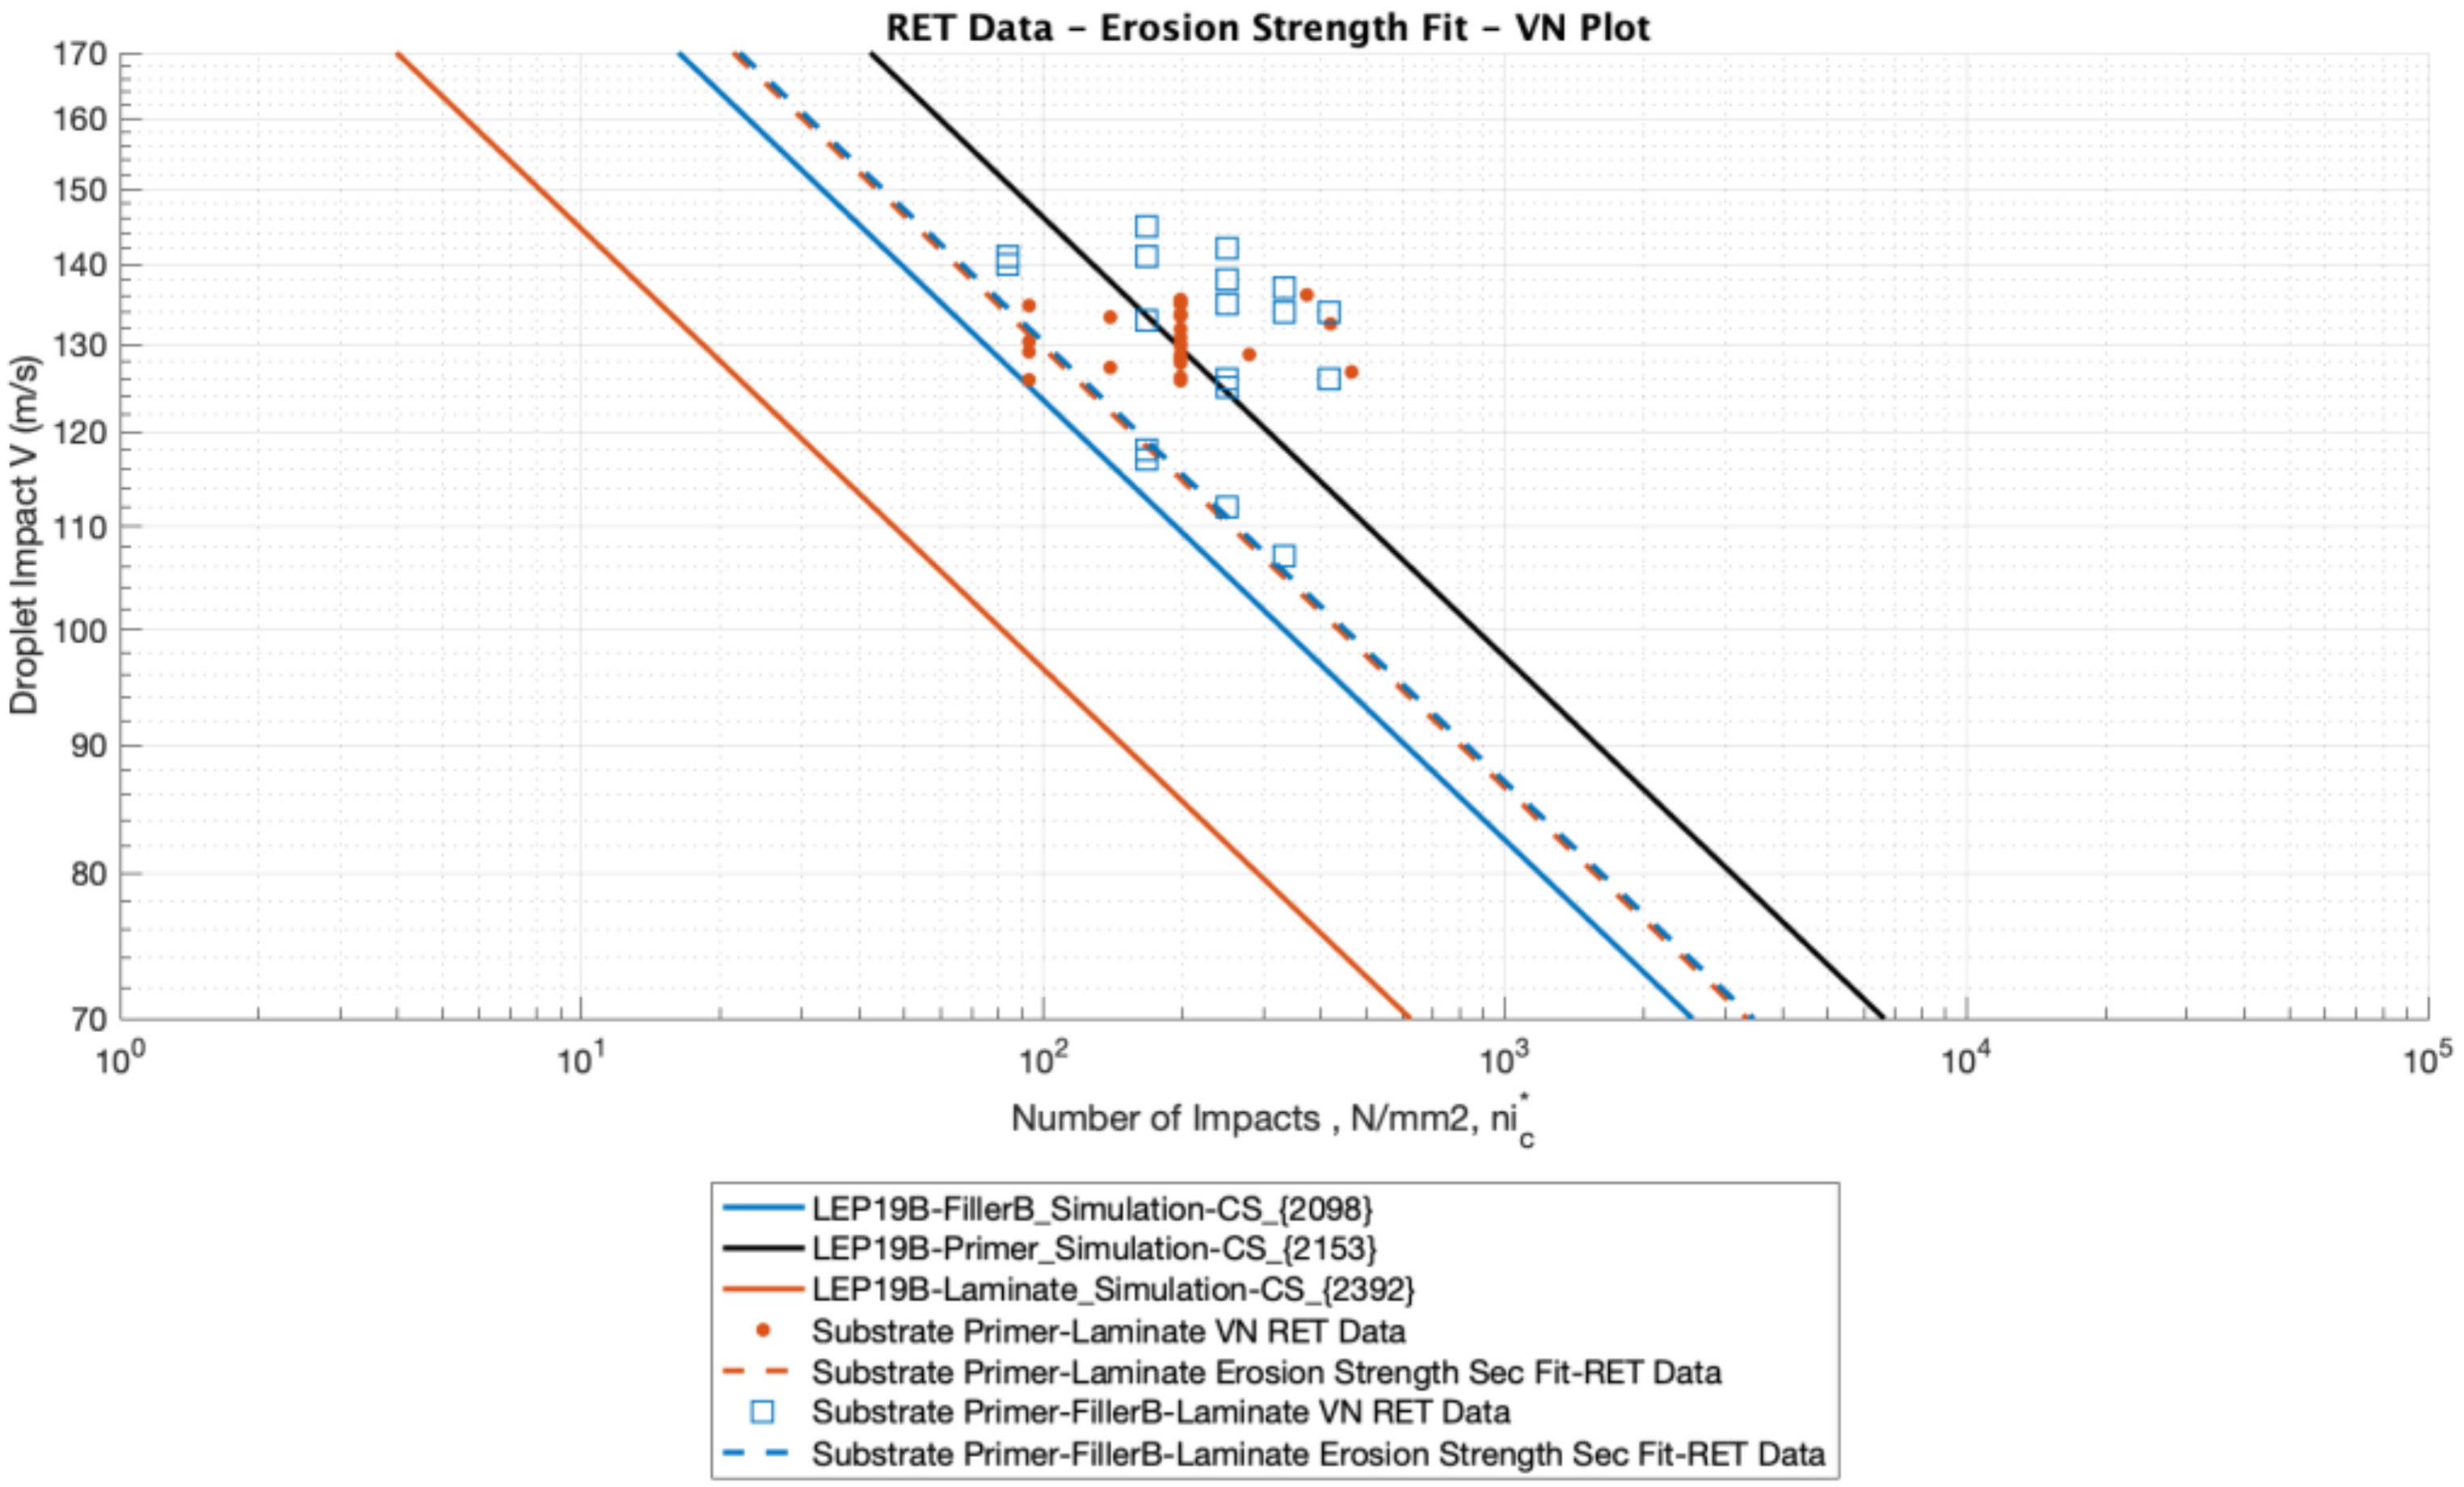
3.2. Case 2. Relative Coating-Substrate Impedance Variability. Analysis of a LEP Multilayer System Rain Erosion Testing Based on DNVGL-RP-0171

This second case ponders a batch of three coupons with a LEP configuration definition used for testing based on DNVGL-RP-0171 [38], following the modelling introduced and implemented in [15,39] and validated at PolyTech [40], as depicted in Figure 13, Figure 14 and Figure 15.
The modelling input data is defined in Table 2 that correspond to the speed of sound testing measurements developed for this research, in which the results are exposed in Figure 3. The objective is to validate the Springer modelling capabilities in regard to frequency-dependent speed of sound measurements.
Figure 16 shows RET testing data results tested at Polytech facilities. The two experimental coupons are configured with an intermediate primer layer to avoid delamination and to observe wear damage uniquely. It is observed the two RET test coupons (referenced S445-178R#2 and S445-178R#3) showing wear erosion damage progression at intermediate time intervals.
The testing results data are also plotted in Figure 17 with a velocity-time representation (equivalent to V-N number of impacts until failure), where the velocity varies for each coupon depending on the location distance to the root of the rotating arm (see [38] for details on such a testing procedure) defining a slope introduced in Equation (15), from [15]. Simulated performance results are observed when using speed of sound measured values as input data at different UT frequencies of 5 or 2.5 MHz. It is detected that both cases offer the same simulated results, noting no influence on such impedance measurement deviations. The modelling results predict erosion damage earlier than RET testing. The accuracy of this modelling is reasonable, since many other material and operational parameters uncertainties are involved. Nevertheless, considering, in our problem, the unique variation due to the coating wave speed Cc, see Figure 18, the incubation time estimation (number of impacts until failure) is obtained for each simulated Cc value. It is observed the effect of increasing the coating speed of sound value Cc produces an improvement in erosion performance for a range of Cc values. One may also observe that, for the optimum value of Cc, a change in Cc becomes negative for this upper range values. Figure 19 shows the equivalent analysis but for a substrate speed of sound value Cs variation range. Both results allow one to define optimum values for material stiffness design reference. Figure 20 illustrates the limits of erosion performance deviation when considering a 10% value of its original reference for the speed of sound variation, in the coating and in the substrate. It is pointed out the stronger influence of the substrate speed of sound, mainly due to its responsibility on transferring the energy of impact to the blade laminate (in the Springer model, it is considered of semi-infinite thickness).

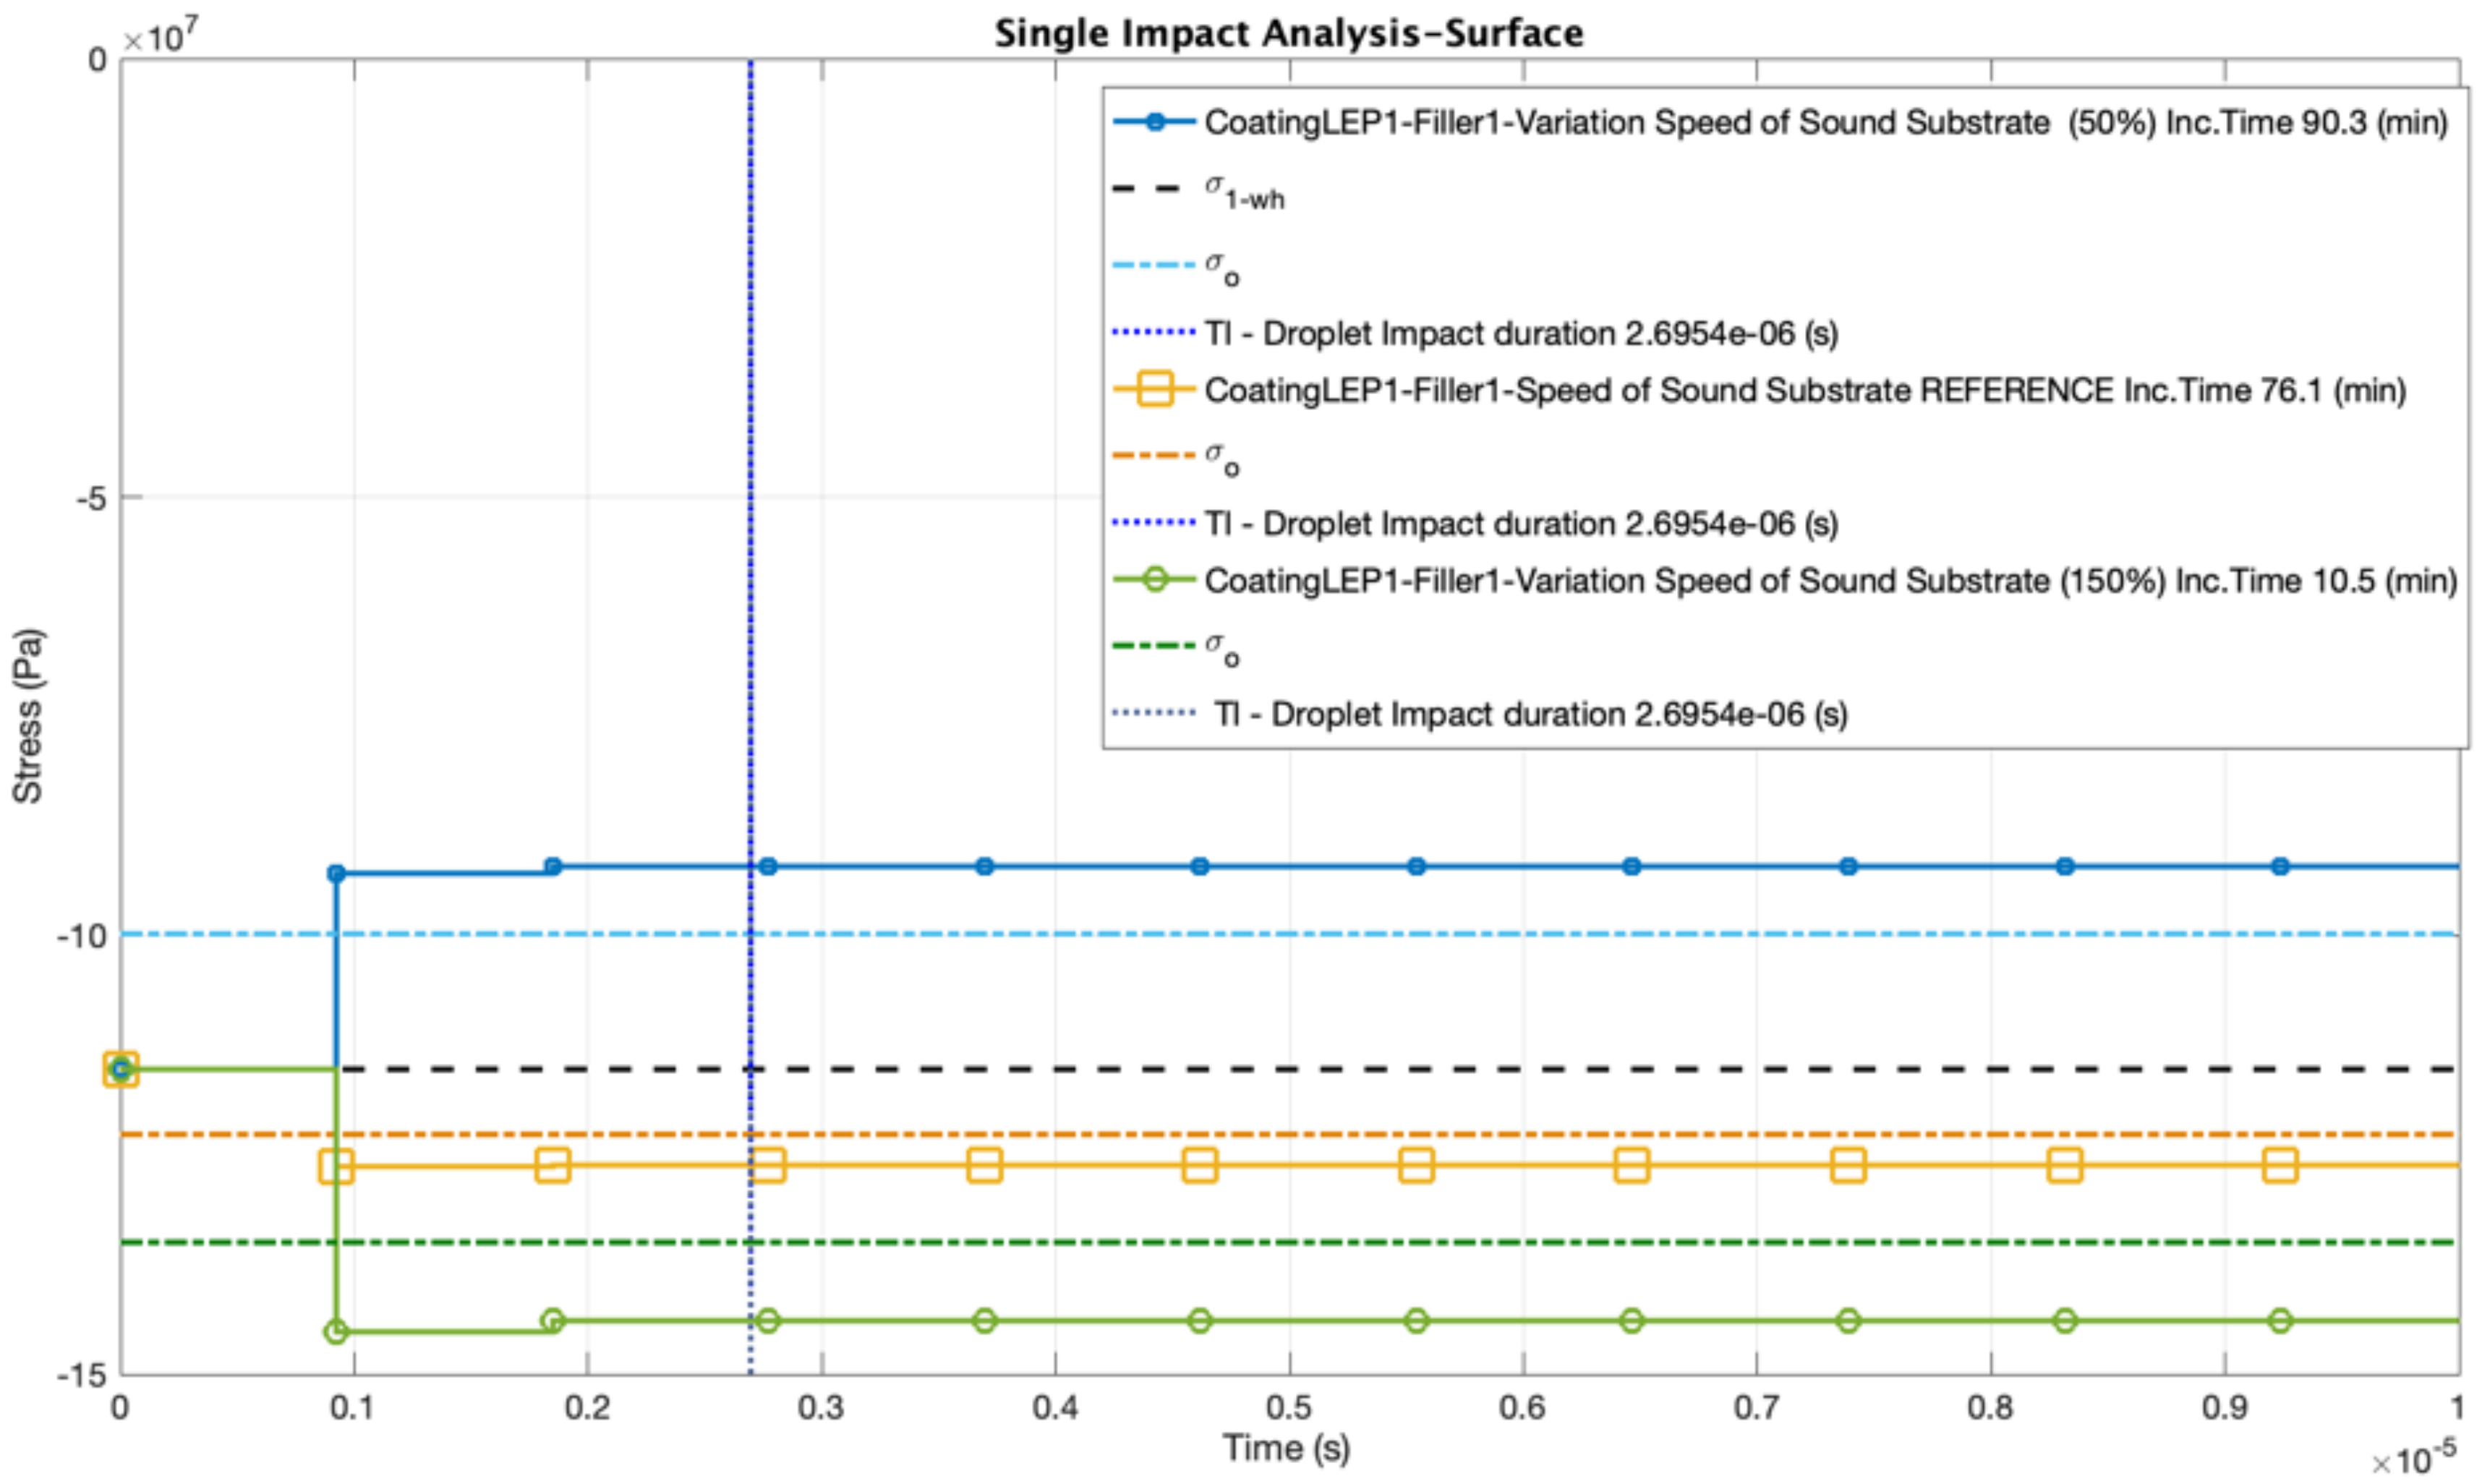
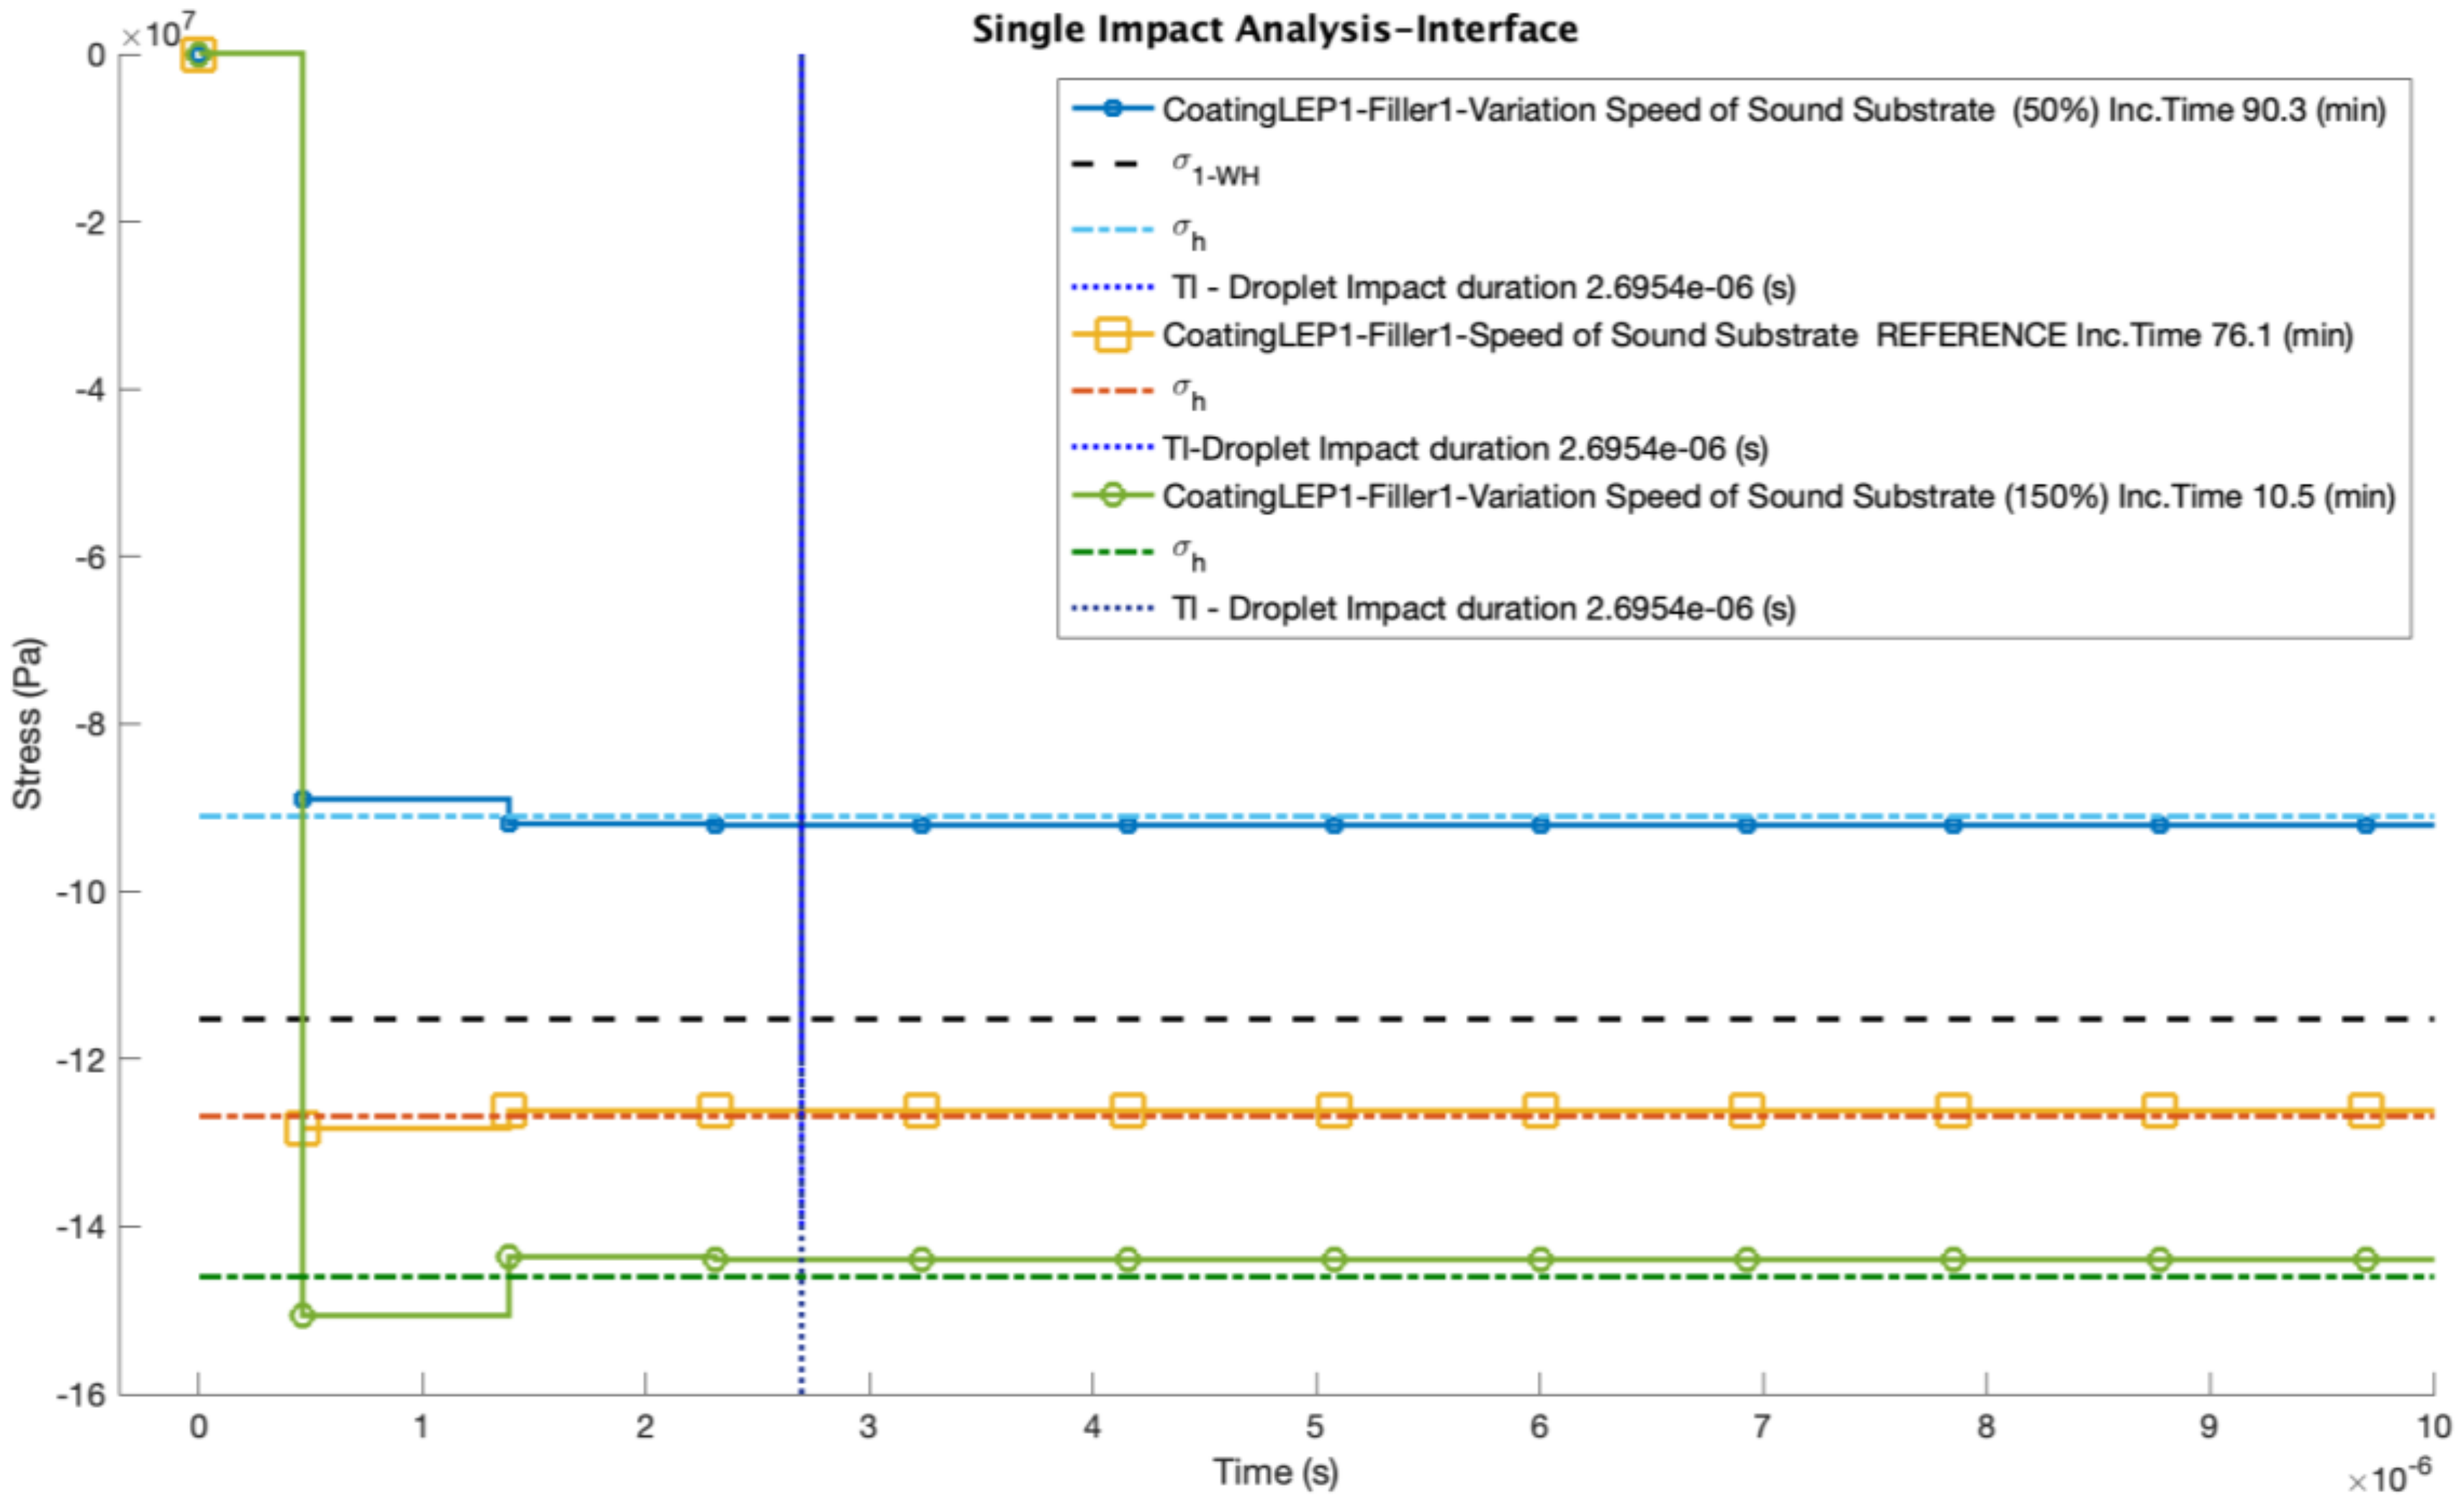
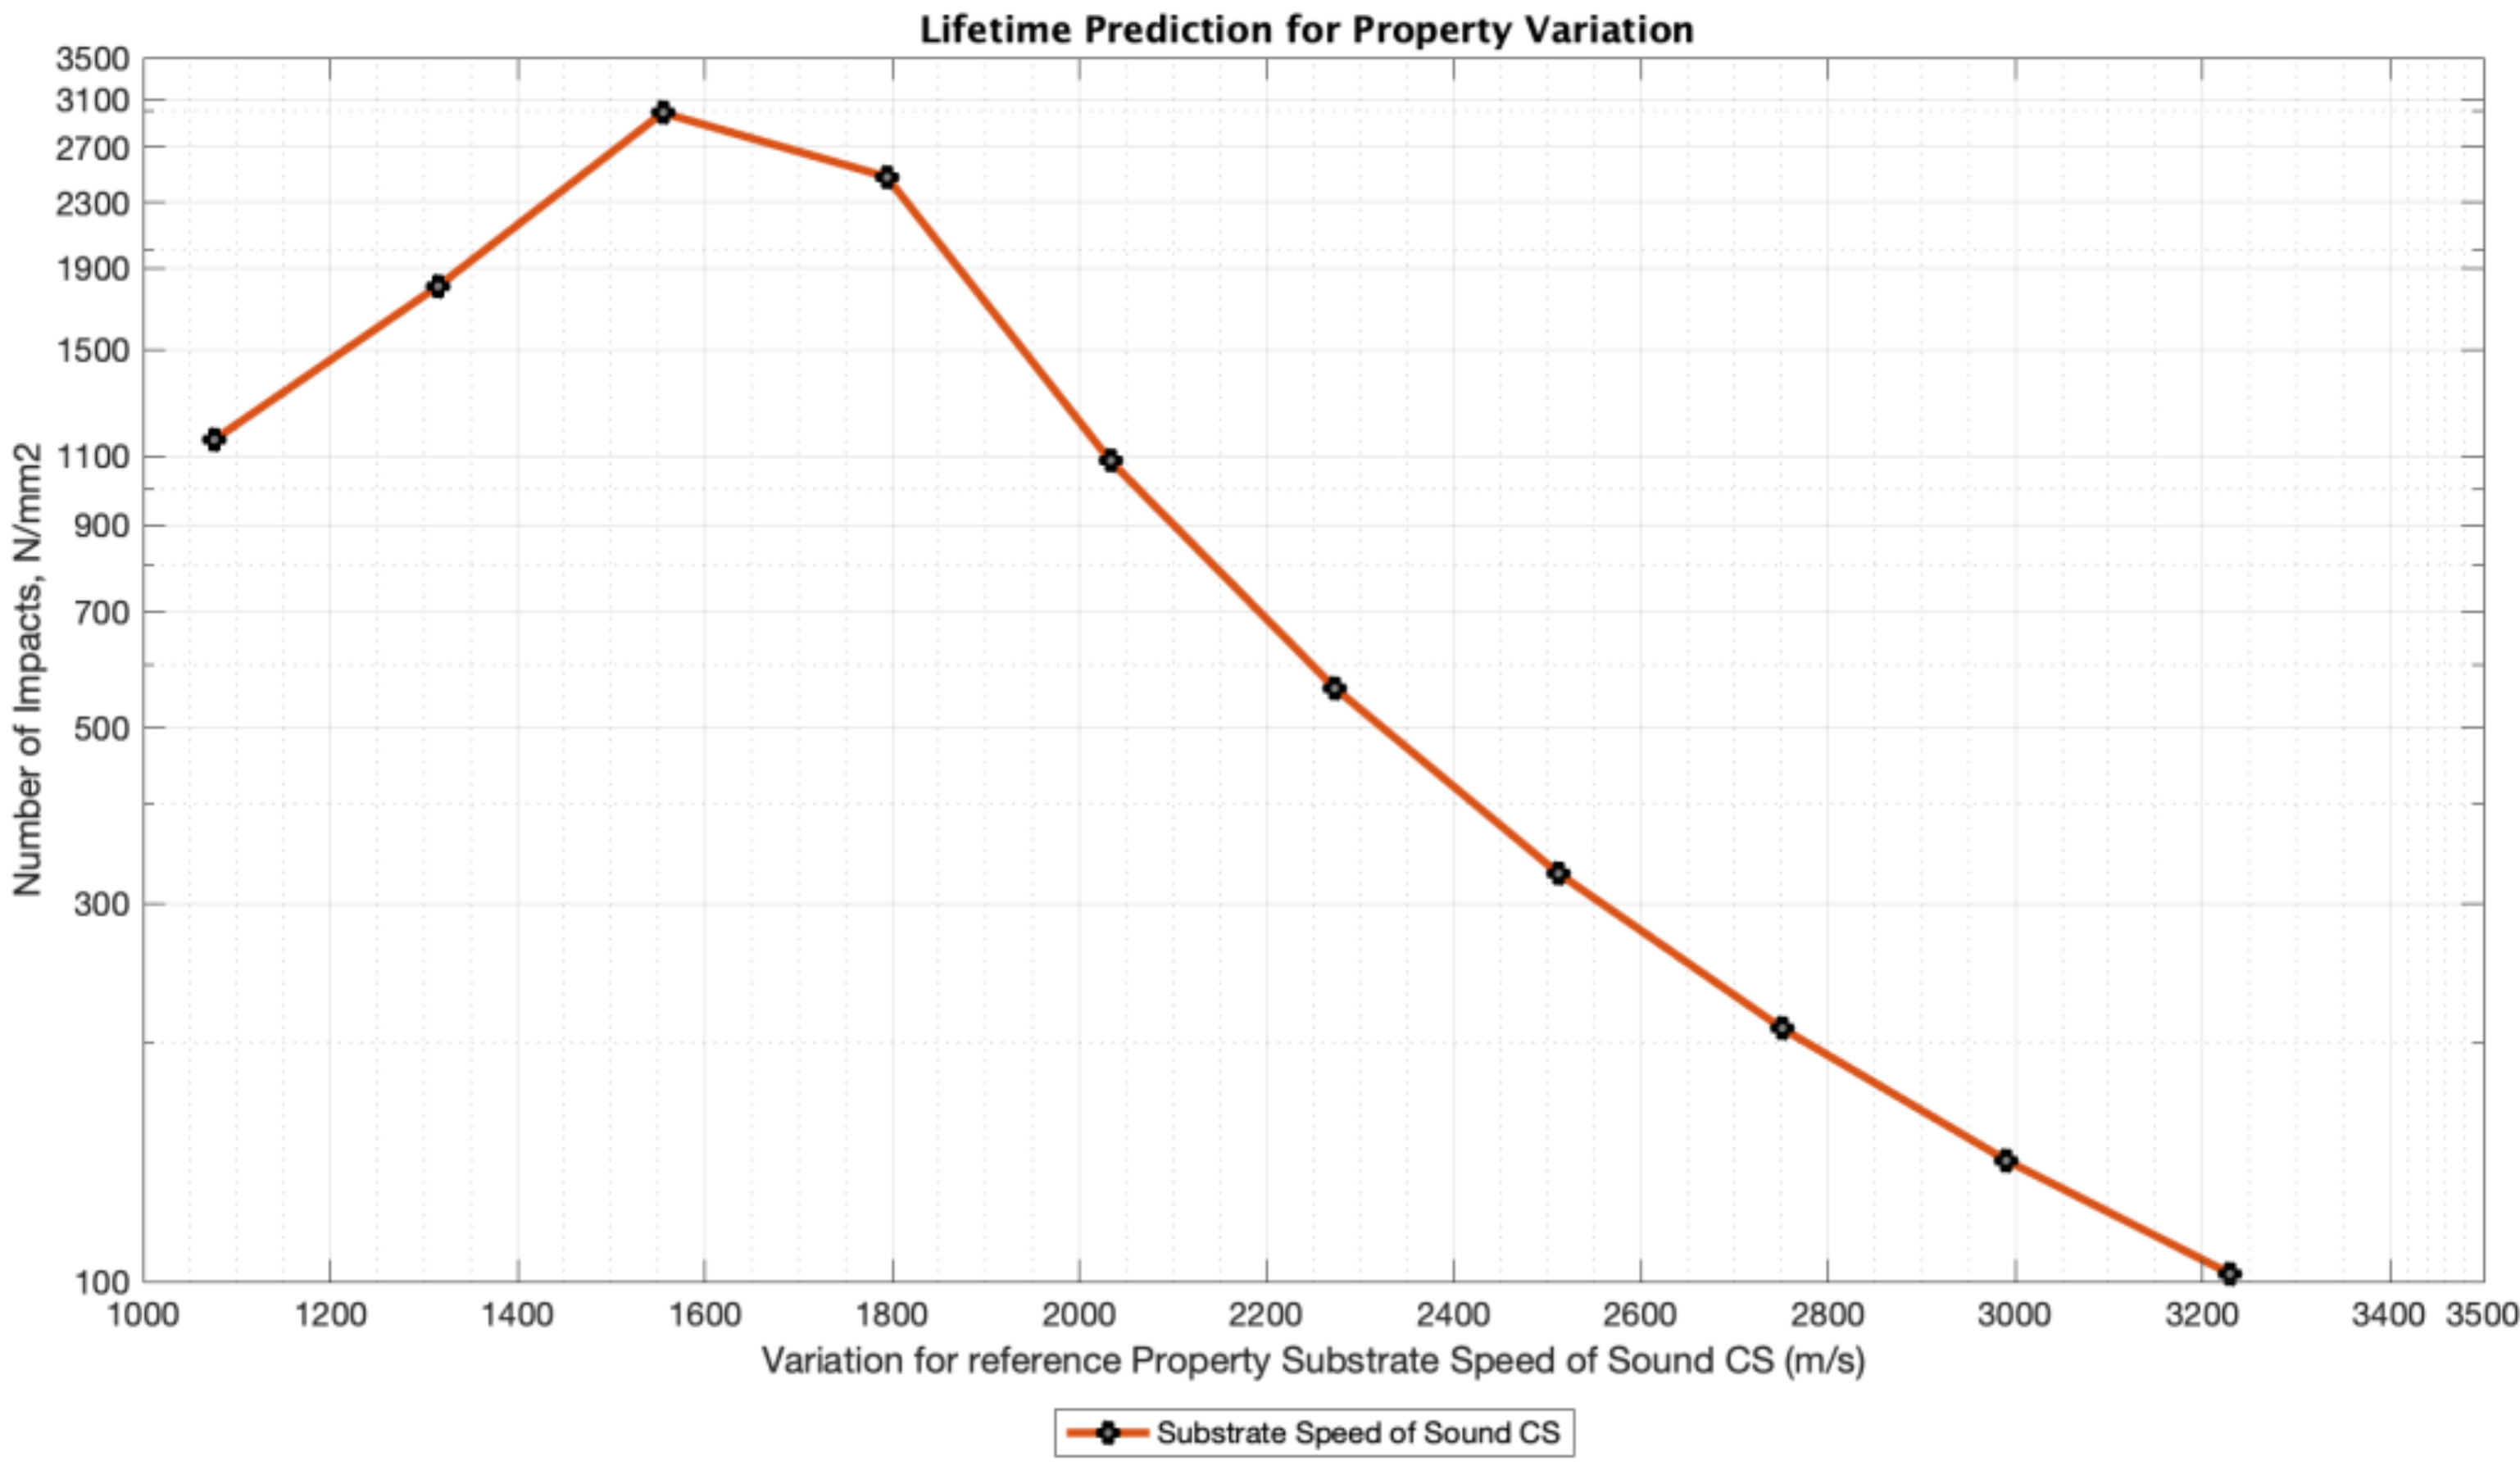
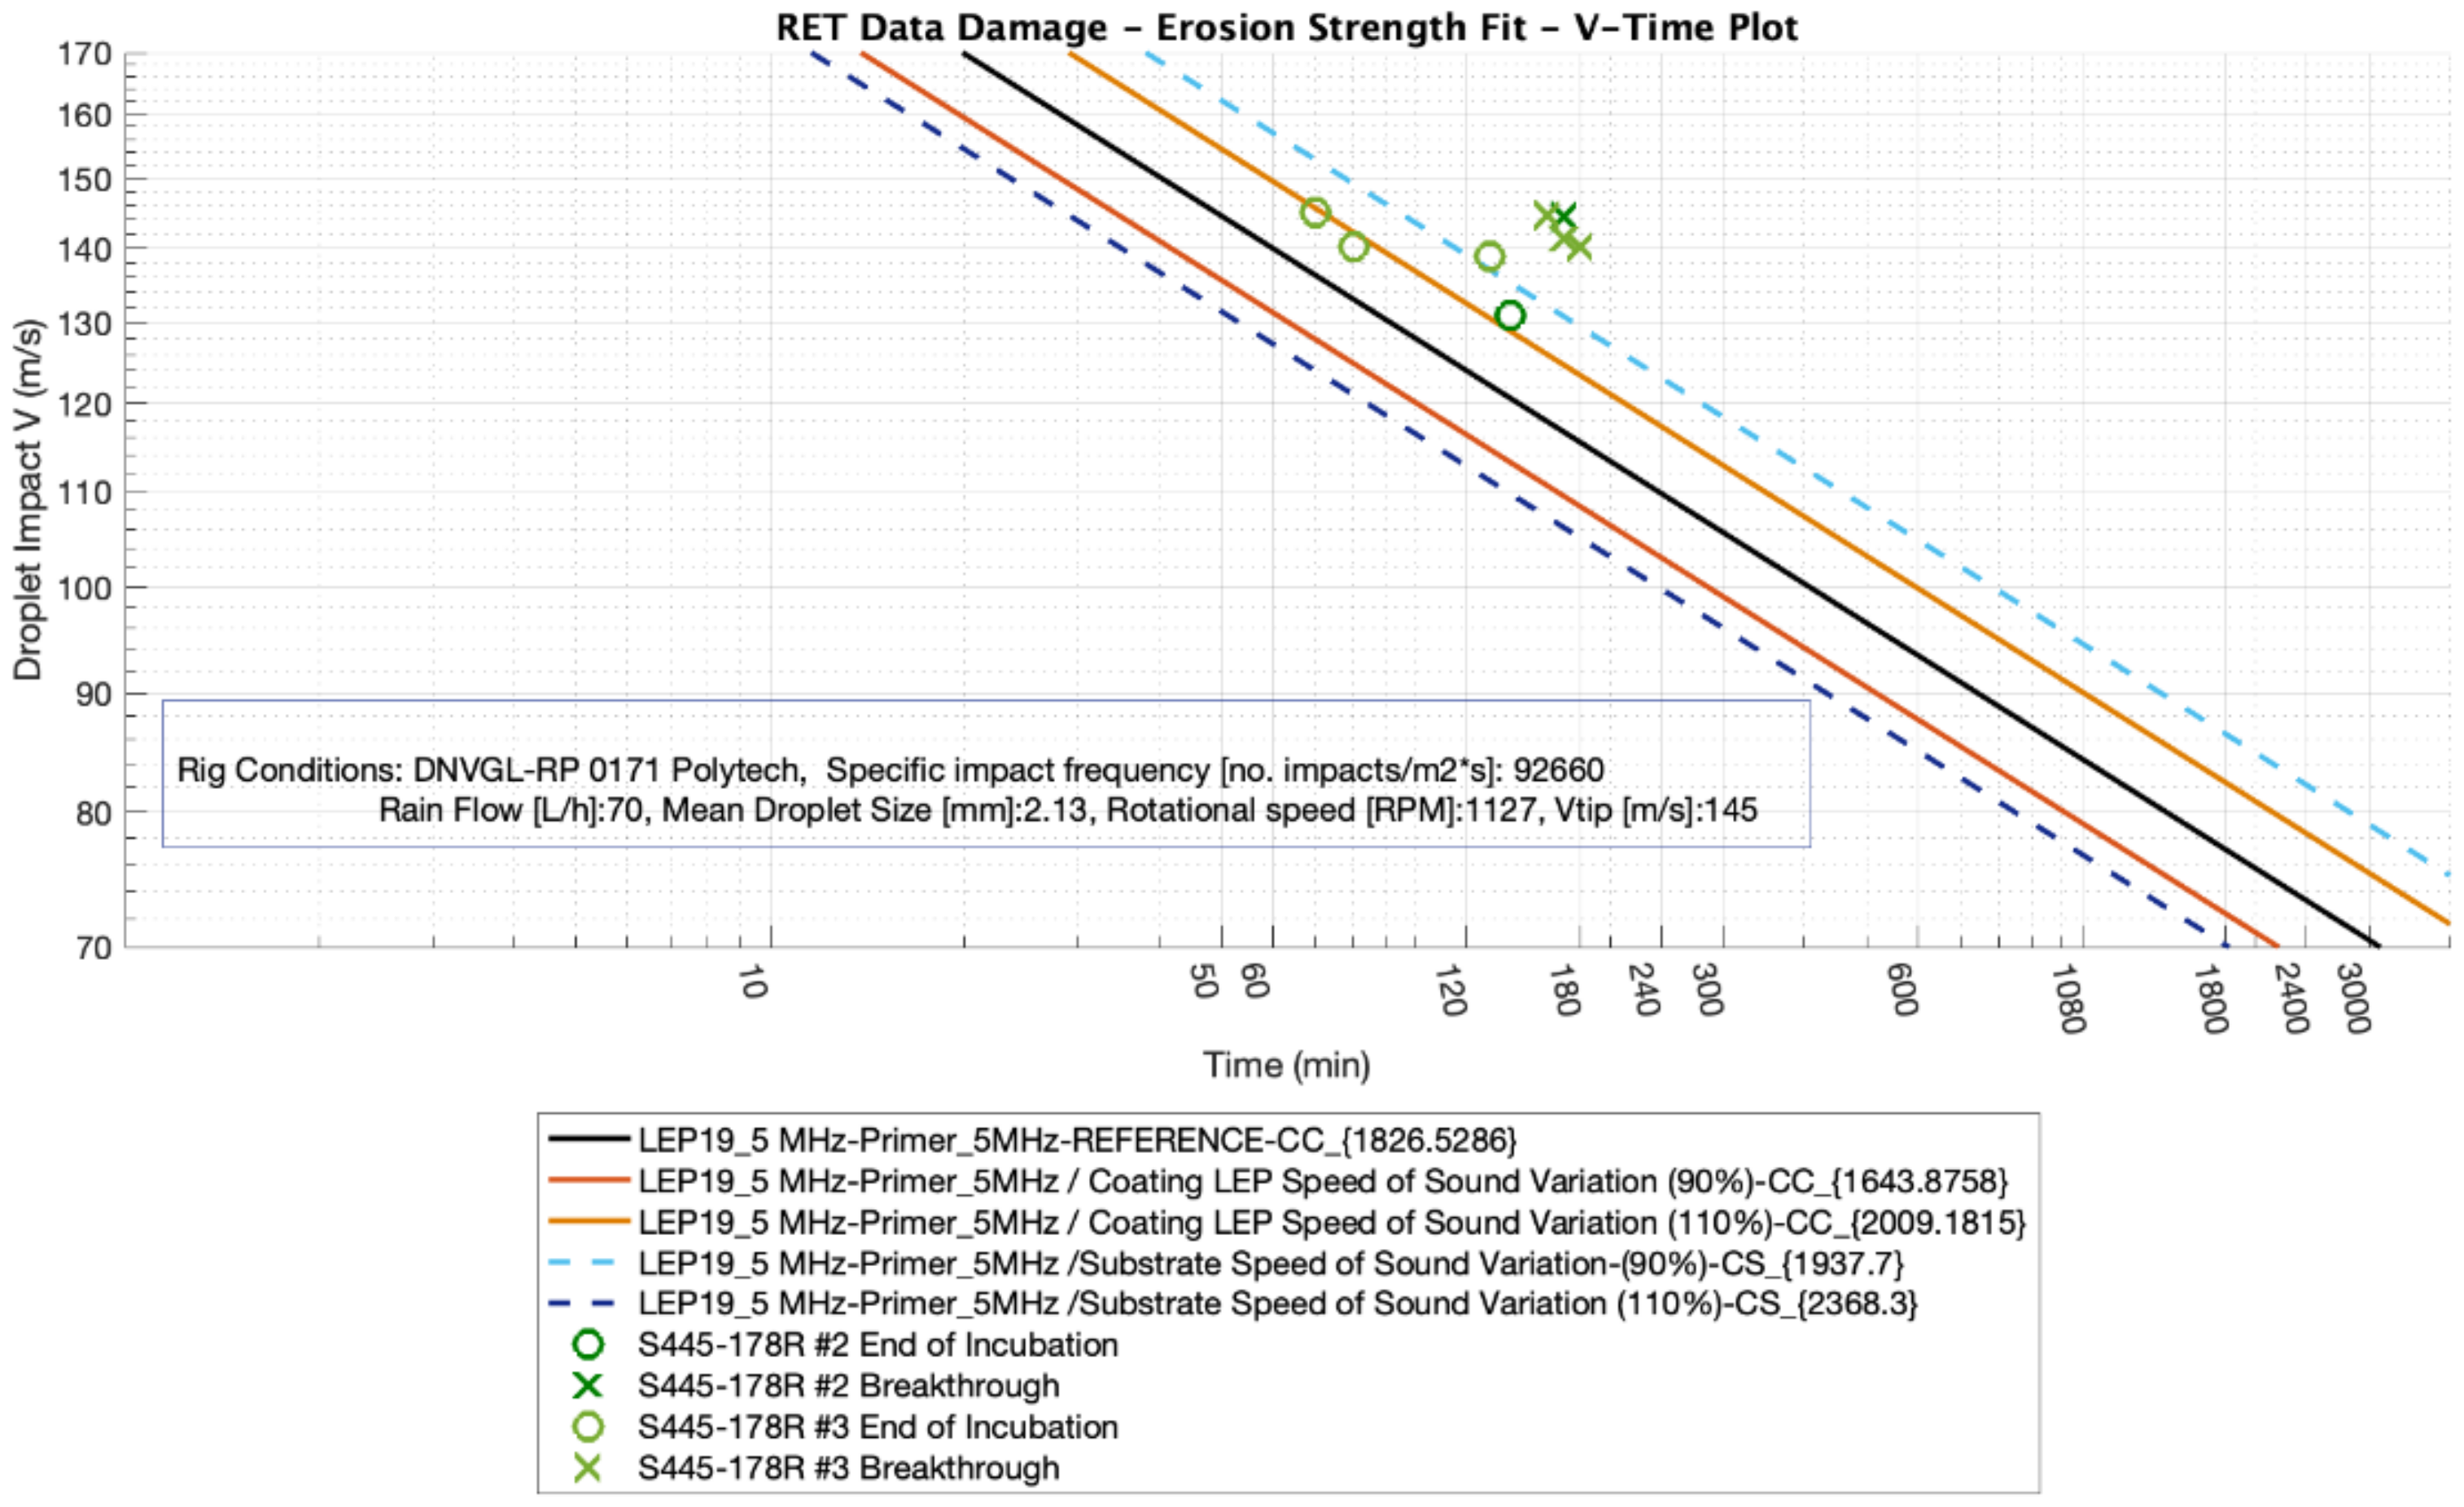
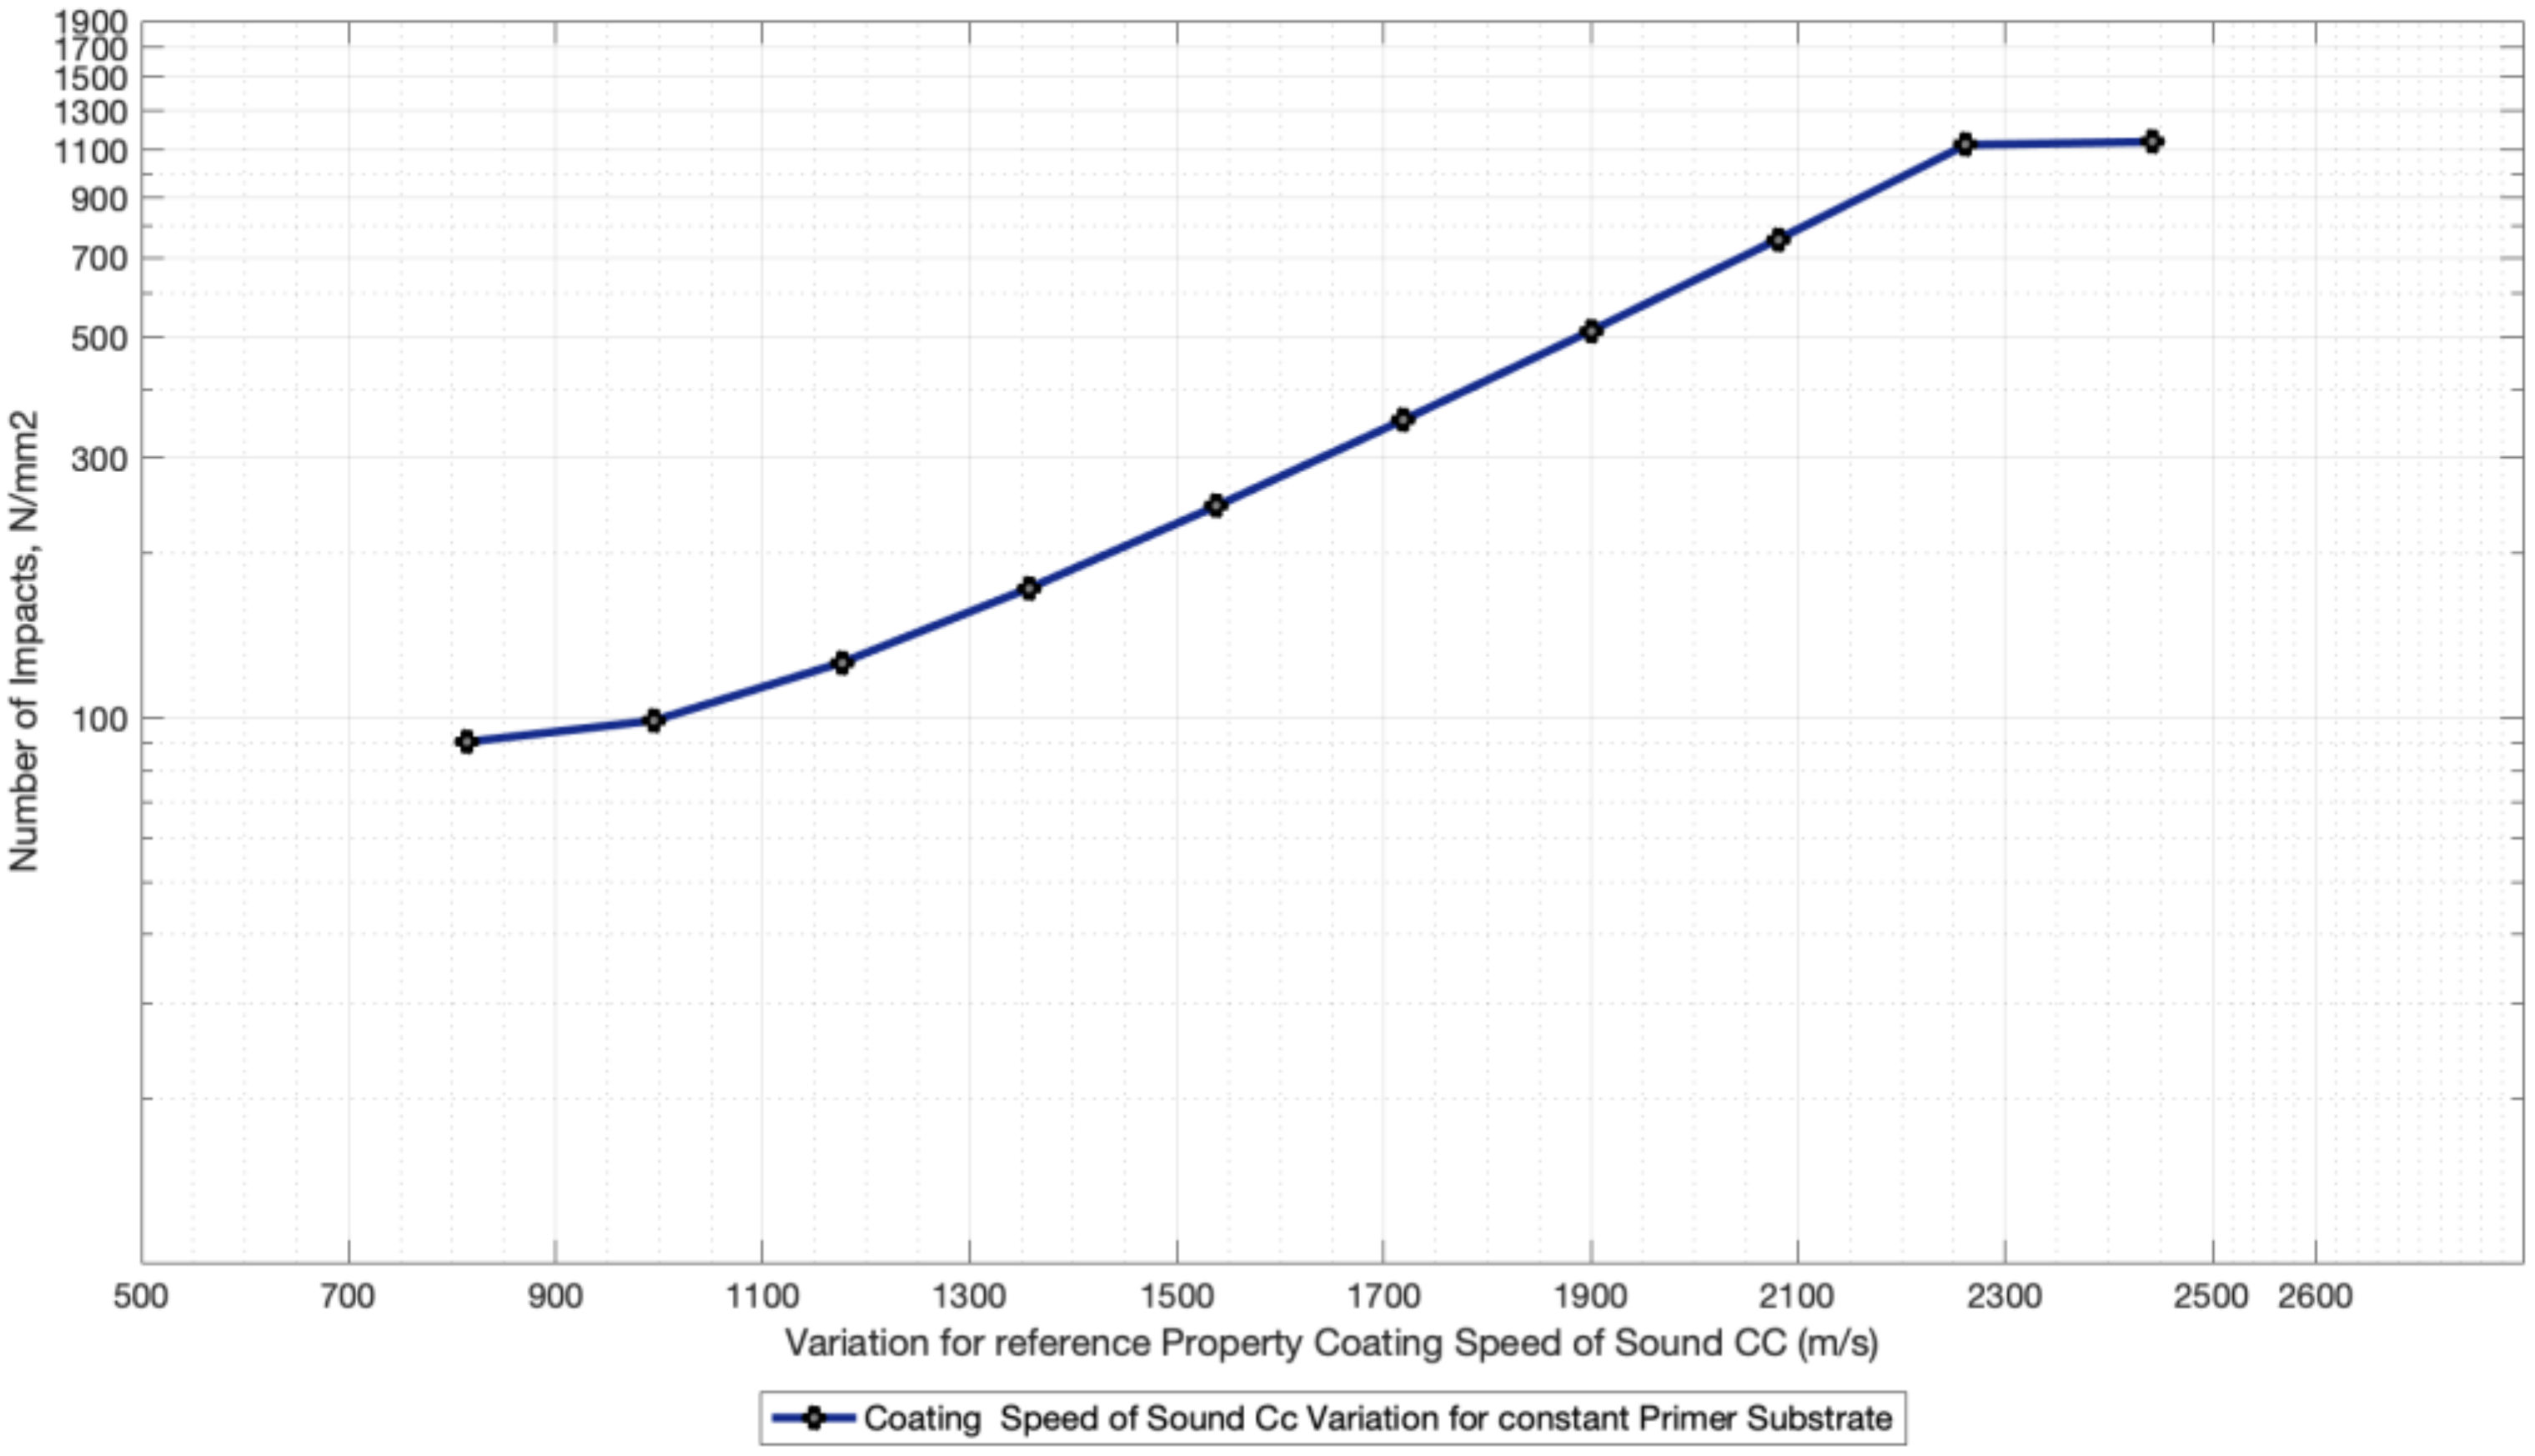
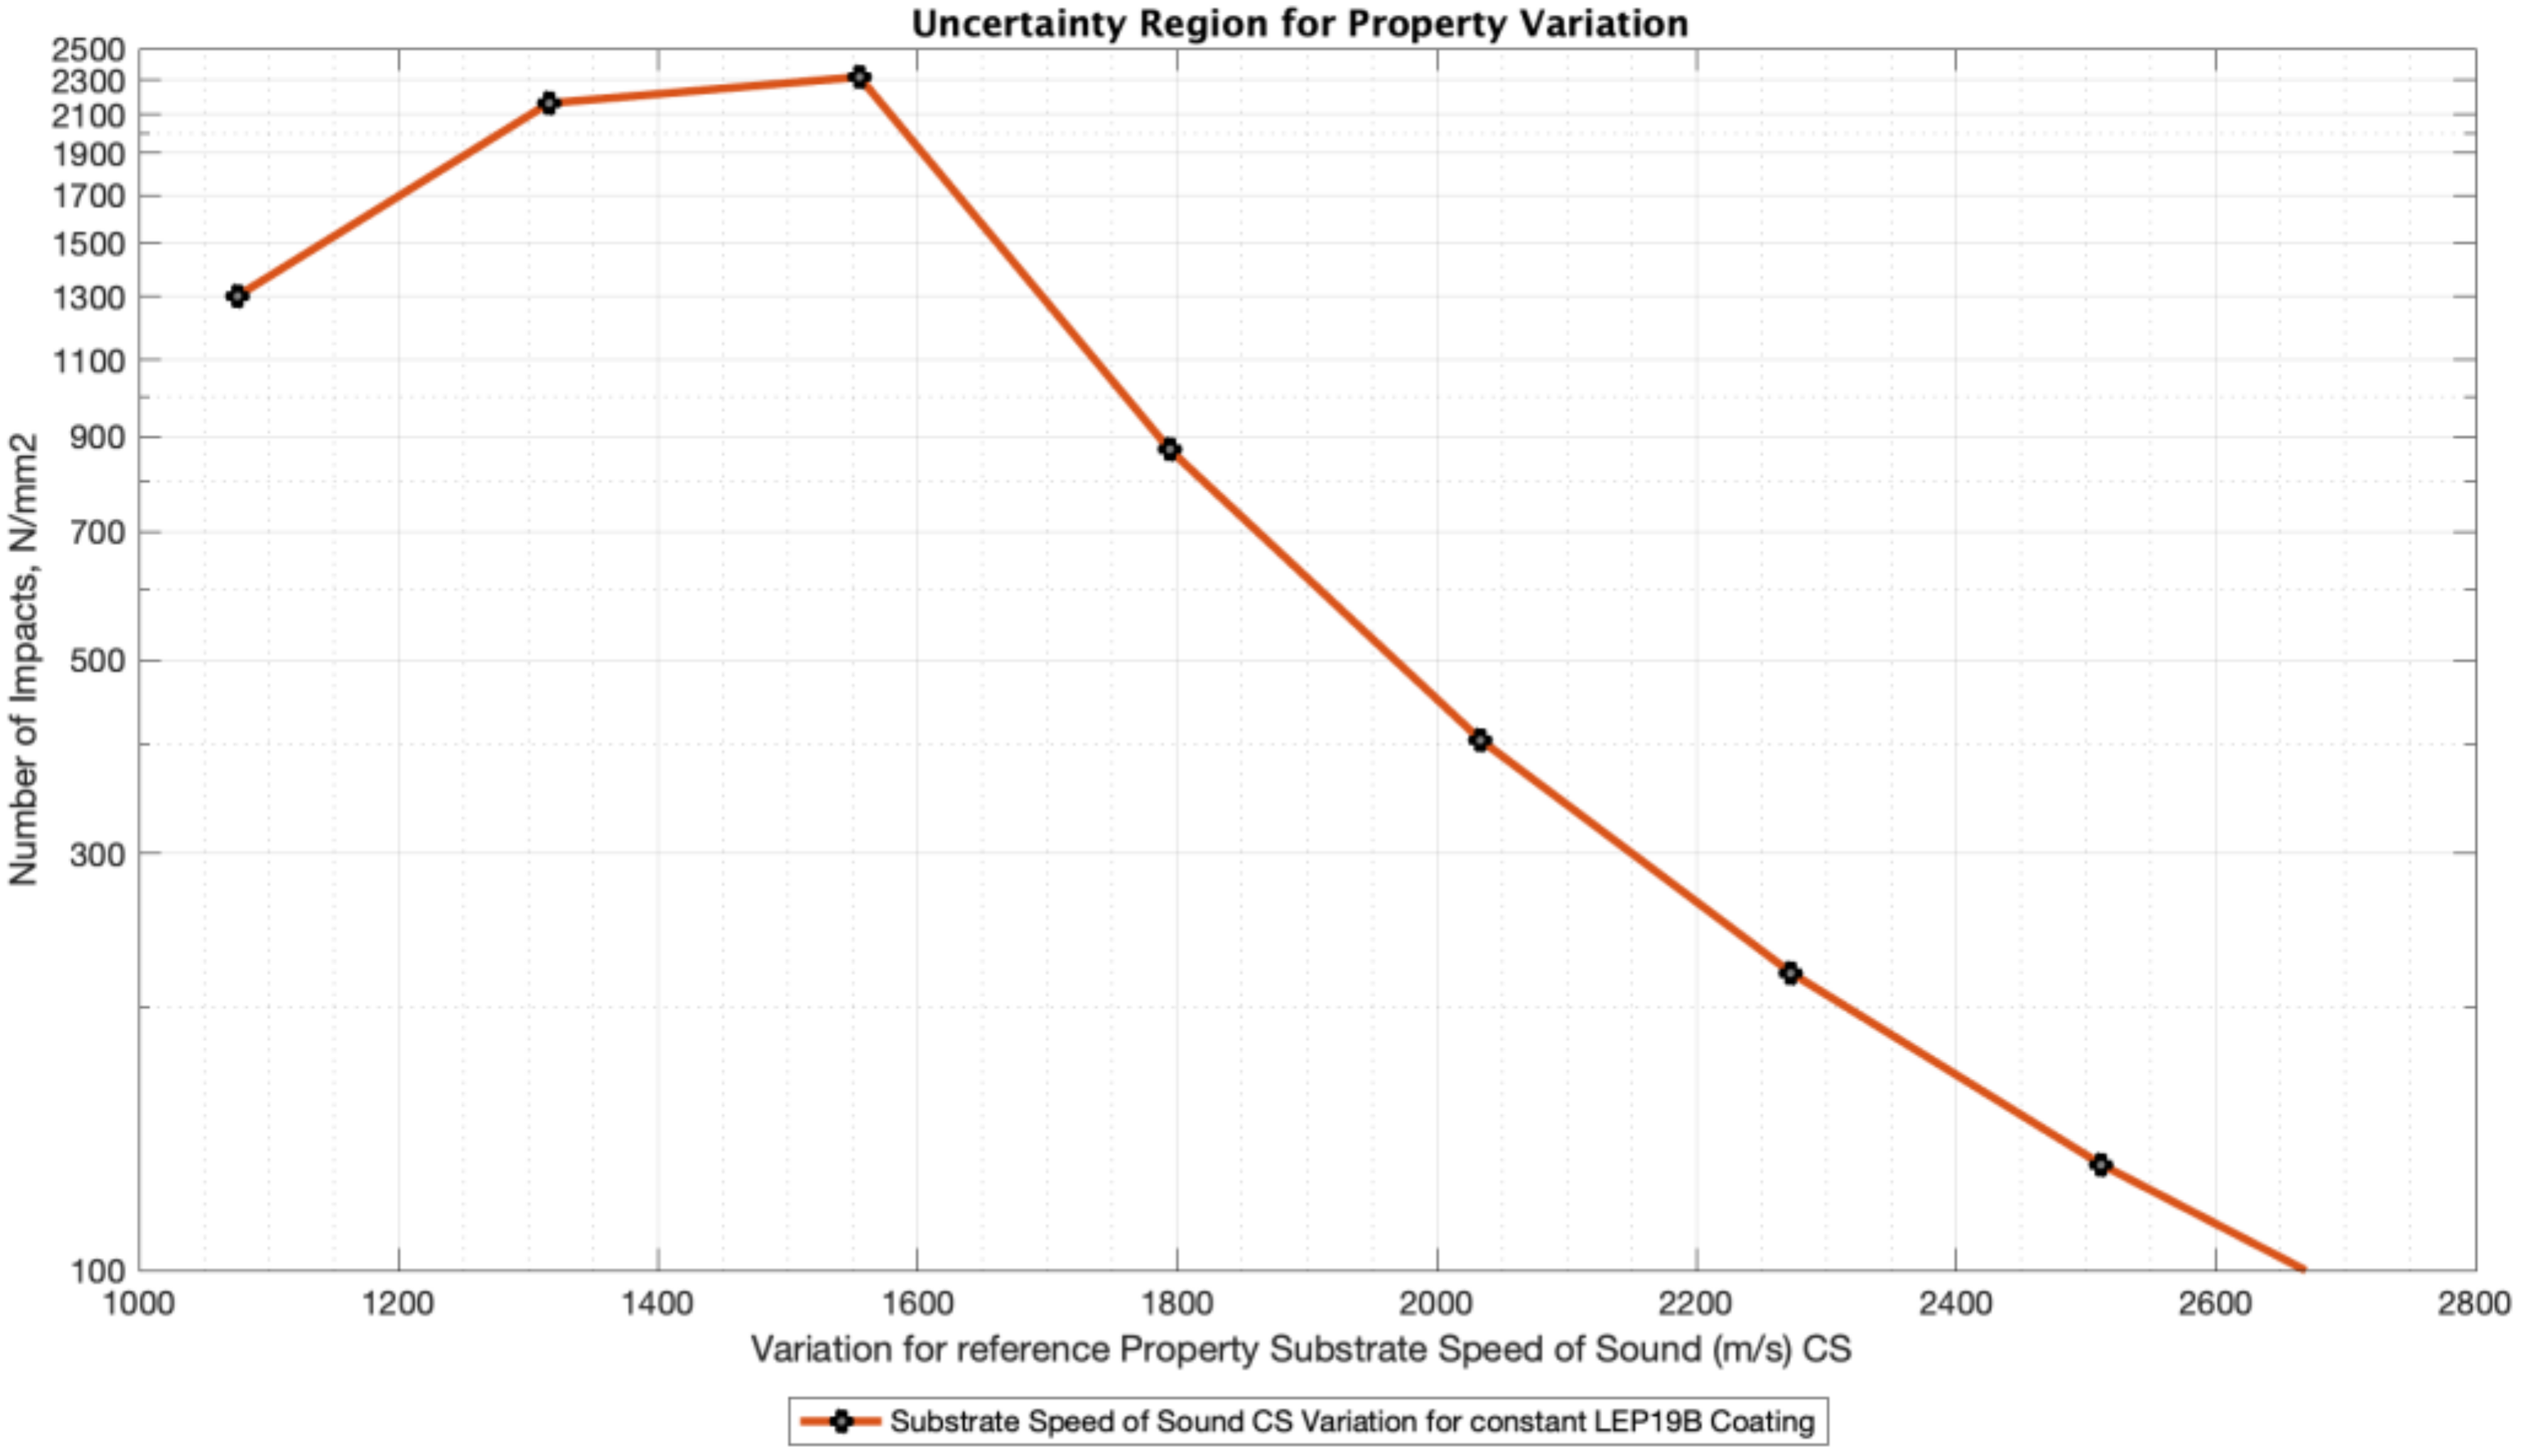
3.3. Case 3. Substrate Impedance Variability. Analysis of a LEP Multilayer System Rain Erosion Testing Based on DNVGL-RP-0171

This third case ponders the effect of considering different substrate materials with the same coating LEP. Figure 21 shows a blade section in reparation. It is observed different substrate material layers from the structural laminate where a filler (putty) layer between the laminate and the coating is included. Some manufacturers also include a primer layer under the coating and over the filler to improve adhesion. Depending on each industrial solution, the inclusion of interfaces may accelerate erosion by delaminating between layers. It is important in terms of repairing that the LEP configuration keeps uniform through the thickness with the appropriate substrate. In this section, the possible different erosion lifetime is analyzed due to the substrate layer impedance variation. Upon impingement, the wave front in the top coating further advances towards the coating-substrate interface, where a portion of the stress wave is reflected back into the coating with a different amplitude, depending on the relative material acoustic impedances, and the remaining part is transmitted to the substrate layer and hence to the blade.
In this worked case are used two batches of three coupons, each with two LEP configurations, as depicted in Figure 13, for rain erosion testing based on DNVGL-RP-0171. The modelling input data are defined in Table 2 that correspond to the speed of sound testing measurements developed for this research and of which the results are exposed in Figure 3 and Figure 4. Particularly, the simulation is different to previous case 2, mainly because of the use of a different coating LEP; see Table 3 for its input data. The analysis considers RET testing results obtained at ORE-Catapult [41] with a configuration of coating LEP19B layer with a Primer layer (without filler layer) and then the laminate (glass fiver reinforced epoxy). The second test ponders the RET testing results obtained at PolyTech [40] with a configuration of coating LEP19B, primer layer and filler B as an intermediate substrate before the fourth GFRE-laminate layer.
Figure 22 and Figure 23 show the RET data testing results of the two LEP configurations, evaluating the effect of using (primer-laminate) or (primer-fillerB-laminate) as substrate layers with LEP19B as the coating layer. The damage points are depicted in a V-N plot with the number of droplets impacts, until failure for each impact velocity.
We may calculate and fit the erosion strength S e c _ f i t from the RET data as described in Equations (12) and (15), see [15] and Figure 5, in terms of number of droplet impacts N, and observed velocity. The erosion strength S e c _ f i t of both LEP systems are derived using their RET data by matching the V f i t and n i c _ f i t values for a given RET data VN plot result as
S e c _ f i t = σ o n i c _ f i t   d 2 8.9 1 5 , 7 σ o = V f i t Z L cos θ ψ s c + 1 Z L Z c + 1 1 ψ L c ψ s c 1 1 e γ ψ L c + 1 ψ s c γ ψ s c + 1
In our case, all the S e c _ f i t values were obtained for all the damages (coupling V f i t and n i c _ f i t ) of each tested batch. The mean value of each set of initial failure points defined S e c _ s e t was obtained and plotted in a V-N curve for a complete range of V and N values with Equation (15), as introduced in [15]. See experimental RET data results in Figure 22 with V-N curve in dotted lines for the primer-laminate or primer-fillerB-laminate used as substrate layers for each configuration. Subsequent intermediate progression of damages until breakthrough are also plotted as aforementioned. It is perceived that Springer V-N curve slope obtained for the aforementioned fit erosion strength follows the experimental data for the initial damages (incubation time).
It is observed in Figure 22 for comparison and modelling accuracy validation that Springer modelling simulations from fundamental properties (filled lines) of wear damage are also plotted, considering the three cases of LEP19B as the coating layer combined with fillerB or primer or laminate as substrate layer (with labelling LEP19B-fillerB, LEP19B-primer, LEP19B-laminate, respectively). This is due to the fact that the Springer model only accounts for a semi-infinite substrate layer, and does not consider a multilayer configuration as depicted in Figure 13. Since our tested systems contemplate all a thin primer layer and then a filler or a laminate layer, the three possibilities were simulated, and the results are plotted for comparison. The modelling results predict erosion damage earlier than RET testing for the laminate and the filler B cases. In the contrary, Primer simulation shows that the RET damages occur later than predicted. These results are as expected and are justified that in reality the RET coupons have a multilayer configuration, where the primer is the first substrate layer, but only with a thickness of 500 μm. That means that the overall mechanical effect is a mixture between the thicker substrates (laminate or fillerB) and the primer. A worse performance is expected when considering a pure primer layer and better for pure laminate substrate or pure fillerB substrate (in agreement with the modelling results shown).
Figure 24 and Figure 25 show that the incubation time estimation (number of impacts until failure) is obtained for each simulated Cc and Cs value respectively. It is observed again (as in the previous case 2) the effect of increasing the coating speed of sound value Cc and the substrate speed of sound value Cs in a variation range. Both results allow one to define the influence of the substrate material responsibility on transferring the energy of impact to the blade laminate, when considering its reparation with added filler or putty layers. We can determine that the modelling estimates well wear failure and it is validated with the erosion strength derivation from RET testing data, which in fact is assumed to be necessary within performance estimation methodology for correct erosion analysis.

4. Conclusions

In the current work, an investigation into various LEP configuration cases have been undertaken and related with the rain erosion durability factors, in an effort to assess the response of changing material and processing parameters involved on its blade application.
Diverse cases are developed throughout the research work, in order to ponder the key issues on appropriate LEP system definition for its mechanical characterization, to avoid a lack of accuracy on erosion performance analysis. Viscoelastic material models are originally considered within a coating layer impedance characterization methodology, based on ultrasound measurements for the modelling input data in rain erosion lifetime applications. The computational tool has been used to define erosion performance analysis, depending on the relative acoustic impedance of liquid, coating and substrate materials. The proposed numerical procedures to predict wear surface erosion have been used to identify suitable LEP coating and composite substrate combinations. Experimental campaigns of LEP erosion performance at rain erosion accelerated rain erosion testing (RET) technique have been used as the validation key metric to assess the response of each combined material configuration.

Author Contributions

Conceptualization, F.S.; investigation, L.D., V.G.-P., A.Š. and D.P.F.; methodology, F.S.; resources, A.Š., D.P.F., E.S. and F.S.; software, L.D. and V.G.-P; supervision, E.S. and F.S.; validation, F.S.; writing – original draft, F.S. All authors have read and agreed to the published version of the manuscript.

Funding

This research has been partially funded by the DEMOWIND-2 Project Offshore Demonstration Blade (ODB) Funded by MINECO with reference PCIN-069-2017, by the ESI-Group Chair at CEU-UCH and from the European Union’s Horizon 2020 research and innovation program under grant agreement No 811473. Project “LEP4BLADES”.

Conflicts of Interest

The authors declare no conflict of interest.

References

  1. Eurostat Renewable Energy Statistics. Available online: https://ec.europa.eu/eurostat/statistics-explained/index.php/Renewable_energy_statistics (accessed on 9 July 2020).
  2. International Energy Agency. World Energy Outlook 2019; IEA: Paris, France, 2019; pp. 613–614. Available online: https://www.iea.org/reports/world-energy-outlook-2019 (accessed on 9 July 2020).
  3. Cortés, E.; Sánchez, F.; O’Carroll, A.; Madramany, B.; Hardiman, M.; Young, T. On the Material Characterisation of Wind Turbine Blade Coatings: The Effect of Interphase Coating–Laminate Adhesion on Rain Erosion Performance. Materials 2017, 10, 1146. [Google Scholar] [CrossRef] [PubMed] [Green Version]
  4. Springer, G.S. Erosion by Liquid Impact; John Wiley and Sons: New York, NY, USA, 1976. [Google Scholar]
  5. Eisenberg, D.; Laustsen, S.; Stege, J. Wind turbine blade coating leading edge rain erosion model: Development and validation. Wind. Energy 2018, 21, 942–951. [Google Scholar] [CrossRef]
  6. Slot, H.; Gelinck, E.; Rentrop, C.; Van Der Heide, E. Leading edge erosion of coated wind turbine blades: Review of coating life models. Renew. Energy 2015, 80, 837–848. [Google Scholar] [CrossRef]
  7. Tobin, E.F.; Young, T.; Raps, D.; Rohr, O. Comparison of liquid impingement results from whirling arm and water-jet rain erosion test facilities. Wear 2011, 271, 2625–2631. [Google Scholar] [CrossRef]
  8. Ibrahim, M.E.; Medraj, M. Water Droplet Erosion of Wind Turbine Blades: Mechanics, Testing, Modeling and Future Perspectives. Materials 2020, 13, 157. [Google Scholar] [CrossRef] [PubMed] [Green Version]
  9. Adler, W.F. Waterdrop impact modeling. Wear 1995, 186, 341–351. [Google Scholar] [CrossRef]
  10. Gohardani, O. Impact of erosion testing aspects on current and future flight conditions. Prog. Aerosp. Sci. 2011, 47, 280–303. [Google Scholar] [CrossRef]
  11. Doagou-Rad, S.; Jr, L.M.; Bech, J.I. Leading edge erosion of wind turbine blades: Multiaxial critical plane fatigue model of coating degradation under random liquid impacts. Wind. Energy 2020, 1–15. [Google Scholar] [CrossRef]
  12. Fang, J.; Owens, R.G.; Tacher, L.; Parriaux, A. A numerical study of the SPH method for simulating transient viscoelastic free surface flows. J. Non Newtonian Fluid Mech. 2006, 139, 68–84. [Google Scholar] [CrossRef] [Green Version]
  13. Verma, A.S.; Castro, S.G.; Jiang, Z.; Teuwen, J.J. Numerical investigation of rain droplet impact on offshore wind turbine blades under different rainfall conditions: A parametric study. Compos. Struct. 2020, 241, 112096. [Google Scholar] [CrossRef]
  14. Yonemoto, Y.; Kunugi, T. Universality of Droplet Impingement: Low-to-High Viscosities and Surface Tensions. Coatings 2018, 8, 409. [Google Scholar] [CrossRef] [Green Version]
  15. Luis, D.; Jordi, R.; Asta, Š.; Fernando, S. Top coating anti-erosion performance analysis in wind turbine blades depending on relative acoustic impedance. Part 1: Modelling approach. Coatings 2020, 10, 685. [Google Scholar] [CrossRef]
  16. Arena, G. Solid particle erosion and viscoelastic properties of thermoplastic polyurethanes. Express Polym. Lett. 2015, 9, 166–176. [Google Scholar] [CrossRef] [Green Version]
  17. Sarva, S.S.; Deschanel, S.; Boyce, M.C.; Chen, W. Stress–strain behavior of a polyurea and a polyurethane from low to high strain rates. Polymer 2007, 48, 2208–2213. [Google Scholar] [CrossRef]
  18. Roland, C.M.; Twigg, J.N; Vu, Y.; Mott, P.H. High strain rate mechanical behavior of polyurea. Polymer 2007, 48, 574–578. [Google Scholar] [CrossRef]
  19. Fan, J.; Weerheijm, J.; Sluys, B. High-strain-rate tensile mechanical response of a polyurethane elastomeric material. Polymer 2015, 65, 72–80. [Google Scholar] [CrossRef]
  20. Brinson, H.F.; Brinson, L.C. Stress and Strain Analysis and Measurement, in Polymer Engineering Scienceand Viscoelasticity; Springer Science+Business Media: New York, NY, USA, 2015. [Google Scholar] [CrossRef]
  21. ISO 18872:2007. In Plastics—Determination of Tensile Properties at High Strain Rates; ISO: Geneva, Switzerland, 2007.
  22. Beda, T.; Esteoule, C.; Soula, M.; Vinh, J.T. Viscoelastic Moduli of Materials Deduced from Harmonic Responses of Beams. In Mechanics of Viscoelastic Materials and Wave Dispersion; Wiley: Hoboken, NJ, USA, 2013; pp. 555–597. [Google Scholar] [CrossRef]
  23. Sinha, M.; Buckley, D.J. Acoustic Properties of Polymers. In Physical Properties of Polymers Handbook; Mark, J.E., Ed.; Springer: New York, NY, USA, 2007; pp. 1021–1031. [Google Scholar]
  24. Sasmita, F.; Tarigan, T.Z.S.; Judawisastra, H.; Priambodo, T.A. Study of Elastic Modulus Determination of Polymers with Ultrasonic Method. Int. J. Adv. Sci. Eng. Inf. Technol. 2019, 9, 874. [Google Scholar] [CrossRef]
  25. Garceau, P. Characterization of Isotropic and Anisotropic Materials by Progressive Ultrasonic Waves. In Mechanics of Viscoelastic Materials and Wave Dispersion; Wiley: Hoboken, NJ, USA, 2013; pp. 513–554. [Google Scholar] [CrossRef]
  26. Grate, J.W.; Wenzel, S.W.; White, R.M. Frequency-independent and frequency-dependent polymer transitions observed on flexural plate wave ultrasonic sensors. Anal. Chem. 1992, 64, 413–423. [Google Scholar] [CrossRef]
  27. Lellinger, D.; Tadjbach, S.; Alig, I. Determination of the elastic moduli of polymer films by a new ultrasonic reflection method. In Macromolecular Symposia; Wiley-Vch Verlag: Weinheim, Germany, August 2002; Volume 184, pp. 203–214. [Google Scholar]
  28. Bai, X.; Sun, Z.; Chen, J.; Ju, B.-F. A novel technique for the measurement of the acoustic properties of a thin linear-viscoelastic layer using a planar ultrasonic transducer. Meas. Sci. Technol. 2013, 24, 125602. [Google Scholar] [CrossRef]
  29. Hsu, D.K.; Hughes, M.S. Simultaneous ultrasonic velocity and sample thickness measurement and application in composites. J. Acoust. Soc. Am. 1992, 92, 669. [Google Scholar] [CrossRef]
  30. Kiefer, D.A.; Fink, M.; Rupitsch, S.J. Simultaneous Ultrasonic Measurement of Thickness and Speed of Sound in Elastic Plates Using Coded Excitation Signals. IEEE Trans. Ultrason. Ferroelectr. Freq. Control. 2017, 64, 1744–1757. [Google Scholar] [CrossRef] [PubMed]
  31. ISO 16823:2012. In Non-Destructive Testing—Ultrasonic Testing—Transmission Technique; ISO: Geneva, Switzerland, 2012.
  32. ISO 16810:2012. In Non-Destructive Testing—Ultrasonic Testing—General Principles; ISO: Geneva, Switzerland, 2012.
  33. ISO 16811:2012. In Non-Destructive Testing—Ultrasonic Testing—Sensitivity and Range Setting; ISO: Geneva, Switzerland, 2012.
  34. ISO 16828:2012. In Non-Destructive Testing—Ultrasonic Testing—Time-of-Flight Diffraction Technique as a Method for Detection and Sizing of Discontinuities; ISO: Geneva, Switzerland, 2012.
  35. Available online: https://portal.dolphitech.com/ (accessed on 9 July 2020).
  36. Available online: https://www.aerox.es/ (accessed on 9 July 2020).
  37. ASTM G73-10. In Standard Test Method for Liquid Impingement Erosion Using Rotating Apparatus; ASTM International: West Conshohocken, PA, USA, 2017.
  38. DNVGL: RP-0171. In Testing of Rotor Blade Erosion Protection Systems; Recommended Practice; DNV GL: Oslo, Norway, 2018; Available online: http://www.dnvgl.com (accessed on February 2020).
  39. OpenModellica. Available online: https://openmodelica.org (accessed on 9 July 2020).
  40. Available online: https://www.poly-tech.dk (accessed on 9 July 2020).
  41. Available online: https://ore.catapult.org.uk (accessed on 9 July 2020).
Figure 1. Leading Edge Protection (LEP) system application procedures, i.e., (a) spray; (b) roller; (c) trowel. Multilayer configuration.
Coatings 10 00709 g001
Figure 2. (Left) Thin Coating LEP used for UT coupon, (Right) Example of how a Time of Flight measurement is used in a tested coupon.
Coatings 10 00709 g002
Figure 3. Average impedance measurements with the 2.5 and 5 MHz probes.
Coatings 10 00709 g003
Figure 4. Average Speed of Sound measurements with the 5 MHz probe.
Coatings 10 00709 g004
Figure 5. Map of impedance values as input data for the wear erosion lifetime modelling, implemented equations in [15]. Diagram of liquid, coating and substrate material impedances and operational parameters affecting rain erosion performance.
Coatings 10 00709 g005
Figure 6. Reference multilayer configuration for rain erosion testing (RET) coupons (ASTM G73-10). Liquid droplet and each material layer are defined by the input mechanical parameters of Table 1.
Coatings 10 00709 g006
Figure 7. Rain erosion testing lifetime analysis for experimental tested and simulated material LEP configuration comparing coating LEP configuration with No-primer layer (application directly to the filler), and coating LEP configuration with intermediate primer layer.
Coatings 10 00709 g007
Figure 8. Lifetime analysis for experimental tested and simulated material LEP prototype comparing 20% variation of LEP Speed of Sound and Ultimate Strength.
Coatings 10 00709 g008
Figure 9. Relative impedance values comparing lifetime prediction due to 20% variation (computing 80% and 120% values) of the Coating cc and Substrate cs Speed of Sound.
Coatings 10 00709 g009
Figure 10. Surface stress evolution analysis for simulated material LEP prototype comparing 50% variation of LEP coating Speed of Sound.
Coatings 10 00709 g010
Figure 11. Surface stress evolution analysis for simulated material LEP prototype comparing 50% variation of Filler Substrate Speed of Sound.
Coatings 10 00709 g011
Figure 12. Interface stress evolution analysis for simulated material LEP prototype comparing 50% variation of Filler Substrate Speed of Sound.
Coatings 10 00709 g012
Figure 13. Reference multilayer configuration for RET coupons (DNVGL-RP-0171). Liquid droplet and each material layer are defined by the input mechanical parameters of Table 2.
Coatings 10 00709 g013
Figure 14. Application execution steps of RET testing coupons used in this work (DNVGL-RP-0171).
Coatings 10 00709 g014
Figure 15. Rain erosion test facility and three specimens used at PolyTech Test and Validation A/S according to DNV-GL-RP-0171 [38], for the analysis and experimental validation.
Coatings 10 00709 g015
Figure 16. RET images of coupons S445-178R#2 and S445-178R#3 at intermediate testing time and zoom details to appreciate erosion damage.
Coatings 10 00709 g016
Figure 17. V-Time plot for simulated coating LEP prototype, comparing both the effect of the droplet impact velocity variations through the RET coupon from the root to the tip, according to DNVGL-RP-0171 and the comparing the simulated results when UT measuring at 2.5 and 5 MHz.
Coatings 10 00709 g017
Figure 18. Incubation time estimation due to a unique variation of the coating wave speed Cc.
Coatings 10 00709 g018
Figure 19. Incubation time estimation due to a unique variation of the substrate (primer or filler) wave speed Cs.
Coatings 10 00709 g019
Figure 20. V-Time plot for simulated LEP prototype, comparing both the effect of a 10% variation on the coating and substrate speed of sound variations.
Coatings 10 00709 g020
Figure 21. Blade section in reparation showing different areas with different substrates. Droplet impact reflected/transmitted stress on interface due to relative impedance.
Coatings 10 00709 g021
Figure 22. V-N plot for RET testing and simulated coating LEP prototype comparing both the effect of the droplet impact velocity variations though the RET coupon from the root to the tip according DNVGL-RP-0171 and comparing the simulated results when varying the substrate impedance.
Coatings 10 00709 g022
Figure 23. RET images of coupons at intermediate testing time for the two configurations: left, (LEP19B-Primer-Laminate) and right, (LEP19B-Primer-FillerB-Laminate).
Coatings 10 00709 g023
Figure 24. Incubation time (Number of impacts until failure) numerical estimation, due to a unique variation of the coating wave speed Cc when considering the Primer as the substrate layer.
Coatings 10 00709 g024
Figure 25. Incubation time (Number of impacts until failure) numerical estimation, due to a unique variation of the substrate wave speed CS when considering the LEP19B material as the substrate layer.
Coatings 10 00709 g025
Table 1. Reference Input data used for the Lifetime Springer modelling in Case1. ASTM G73-10.
MaterialDensity (gr/cm3)Modulus E (Pa)Speed of Sound C (m/s)Layer Thickness (µm)Impact Velocity specimen Vcenter (m/s)
Water droplet1.002.19 × 1091480.002000 (diameter)135
Coating LEP_11.1603.48 × 1091733.00800135
Primer_11.2605.12 × 1092016.0050135
Filler_11.3004.90 × 1091941.001000135
Laminate Substrate1.9301.10 × 10102392.001000135
Aluminum support2.7007.1 × 10105127.003300135
Table 2. Reference Input data used for the Lifetime Springer modelling in Case2. DNVGL-RP-0171.
MaterialModulus E (Pa)Speed of Sound C (m/s)Layer Thickness (µm)Impact Velocity Specimen Vcenter (m/s)
Water droplet2.19 × 1091480.002000 (diameter)121
LEP19_2.5 MHz3.48 × 1091733.00500121
LEP19_5 MHz5.12 × 1092016.00500121
Filler_5 MHz6.53 × 1092241.001000121
Filler_2.5 MHz5.9 × 1092134.001000121
Primer_5 MHz5.84 × 1092153.00100121
Primer_2.5 MHz5.66 × 1092119.00100121
FillerB_5 MHz6.87 × 1092098.001000121
FillerB_2.5 MHz6.47 × 1092030.001000121
Laminate Substrate1.10 × 10102392.003400121
Table 3. Reference Input data used for the Lifetime Springer modelling in Case 3. DNVGL-RP-0171.
MaterialModulus E (Pa)Speed of Sound C (m/s)Layer Thickness (µm)Impact Velocity Specimen Vcenter (m/s)
Water droplet2.19 × 1091480.002000 (diameter)121
LEP19B_5 MHz3.05 × 1091628.00500121
LEP19B_25 MHz2.98 × 1091609.00500121

