
Implementing Vancomycin Population Pharmacokinetic Models: An App for Individualized Antibiotic Therapy in Critically Ill Patients

Abstract
:1. Introduction
2. Results

| Llopis | Revilla | Goti | |
|---|---|---|---|
| Mean (SD) | |||
| Age (years) | 53.67 (23.53) | ||
| Weight (Kg) | 68.87 (14.63) | ||
| Creatinine (mg/dL) | 0.76 (0.19) | ||
| Clcr (mL/min) * | 106.79 (41.63) | 95.5 (42.27) | |
| Vc (L) | 28.51 (6.06) | 70.32 (43.96) | 79.67 (35.26) |
| Vp (L) | 90.9 (19.32) | 38.4 (0) | |
| Cl (L/h) | 4.66 (1.52) | 4.32 (1.67) | 3.69 (1.34) |
| Trough concentration (mg/L) | 15.52 (9.24) | ||
| Estimated | 9.21 (4.74) | 15.76 (9.92) | 15.57 (7.15) |
| Accuracy (%) | 83.94 (54.65) | 136.88 (81.17) | 143.6 (93.92) |
| Bias (%) | −34.47 (63.38) | 10.61 (66.37) | 13.54 (64.93) |
| RMSE (mg/L) | 10.69 (12.81) | 10.65 (12.23) | 9.06 (9) |
| Predicted (mg/L) | 9.26 (5.09) | 15.5 (9.49) | 13.87 (5.55) |
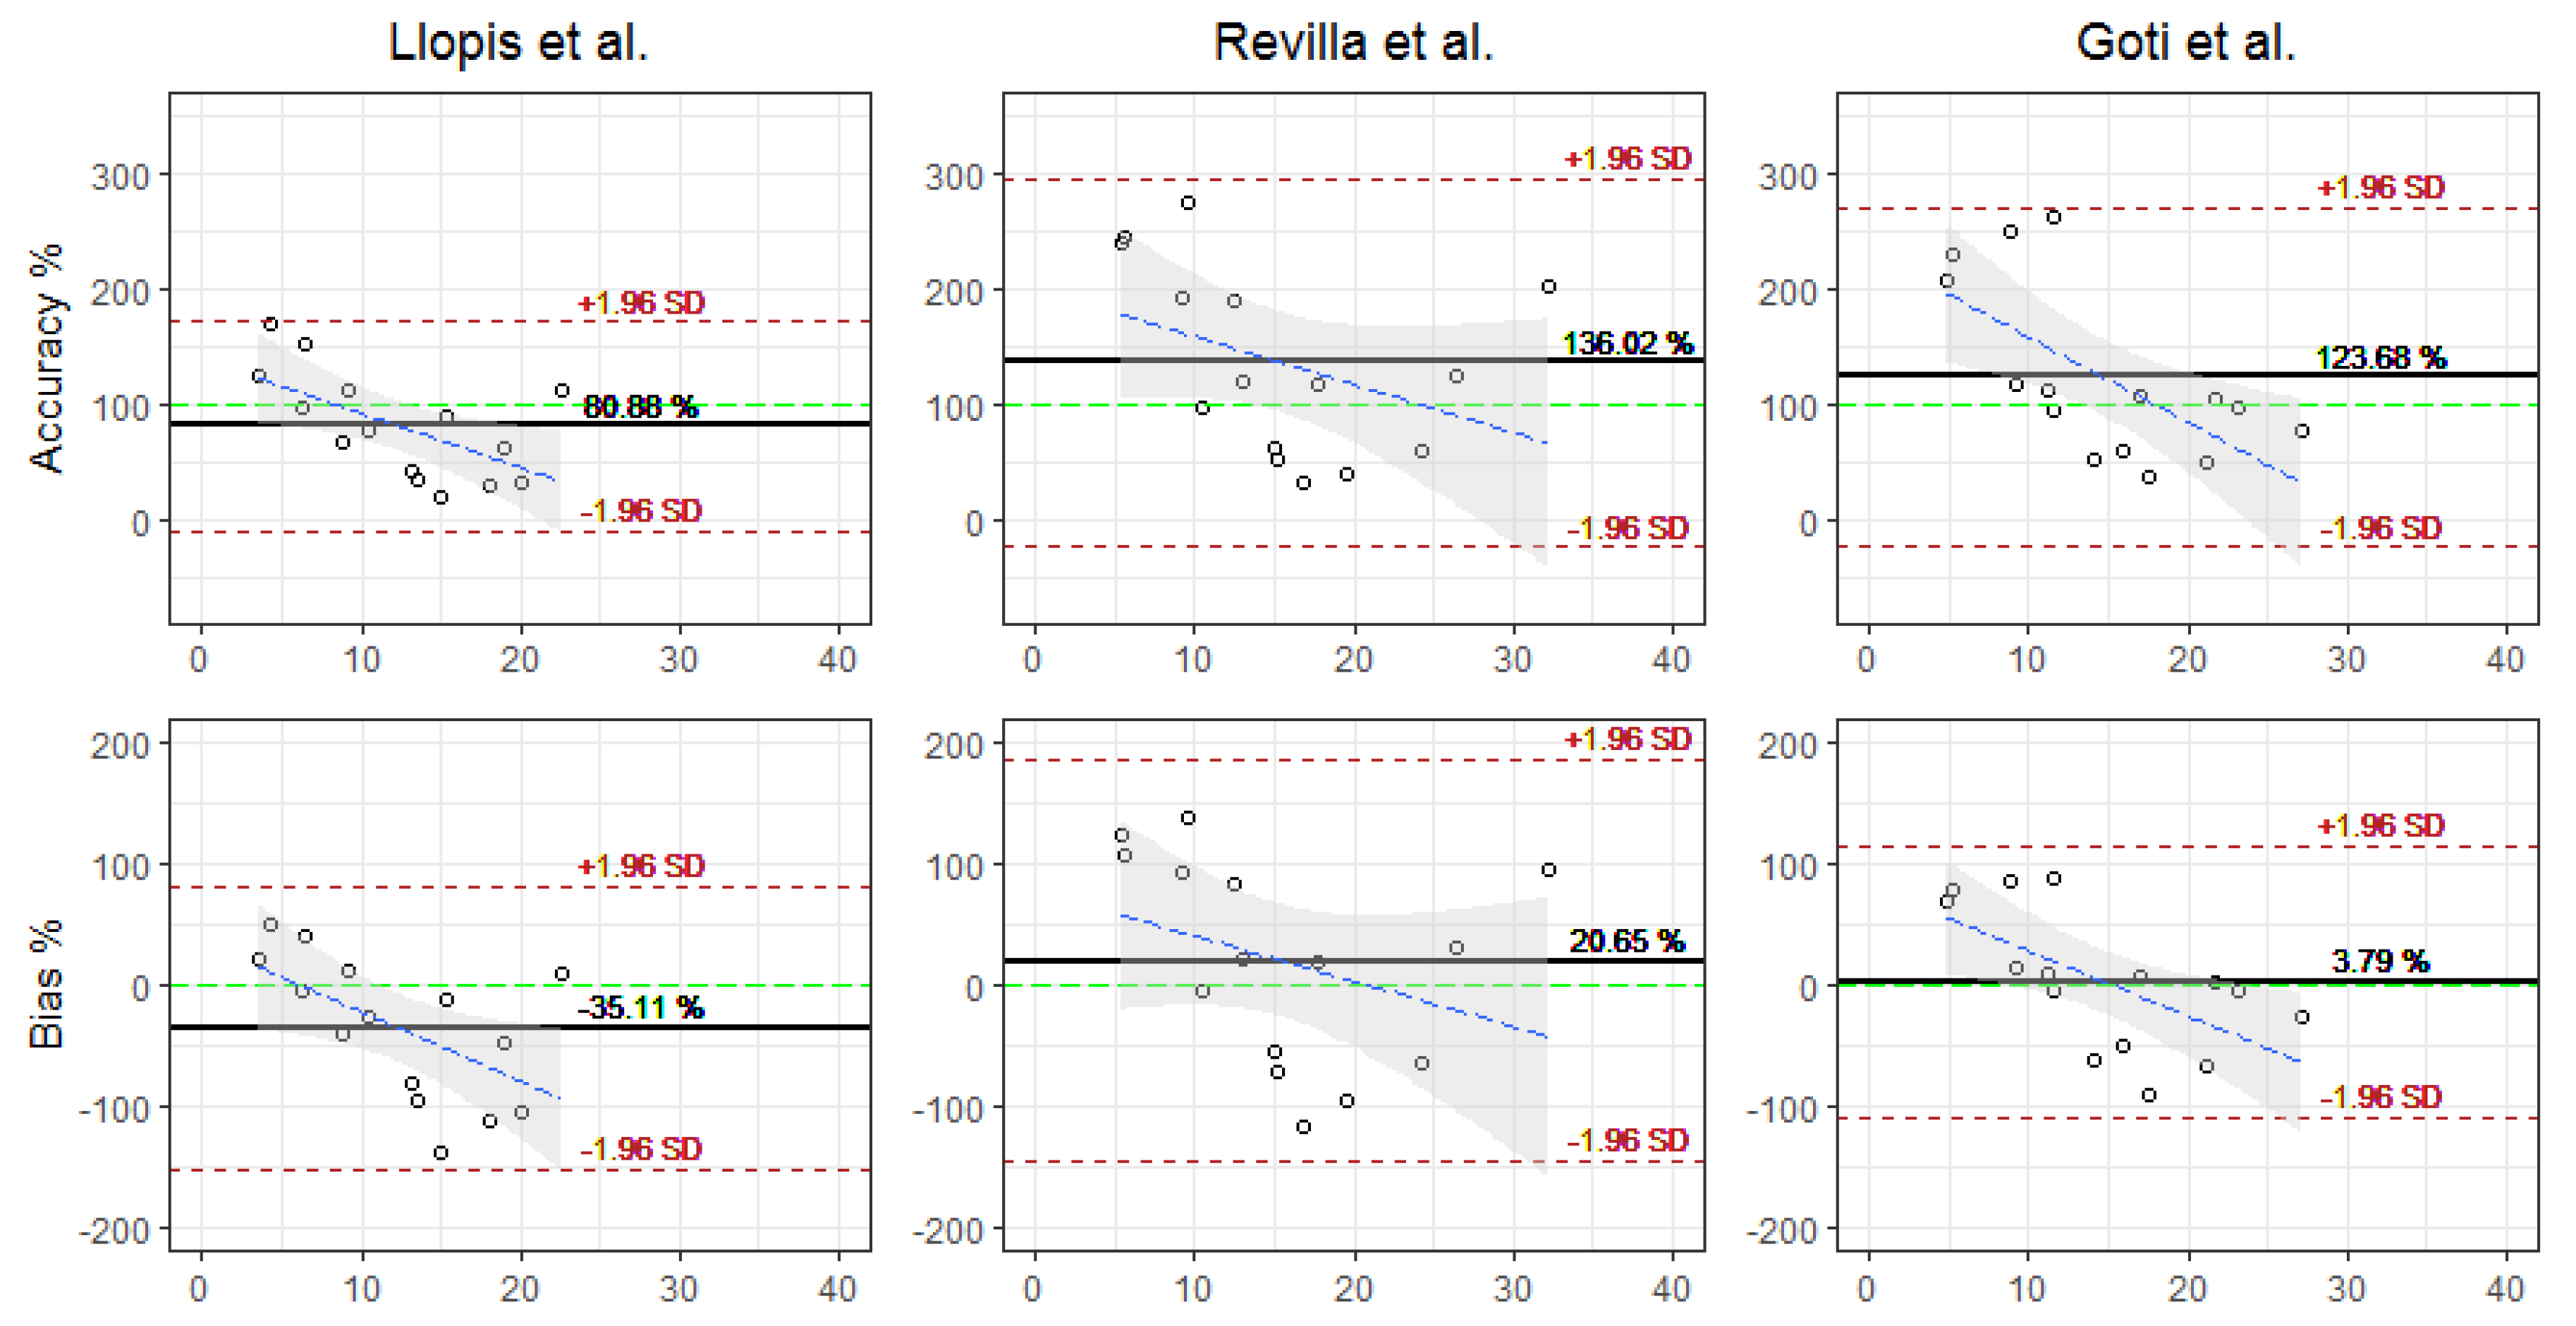
| Accuracy (%) | 80.88 (46.5) | 136.02 (81.57) | 123.68 (75.22) |
| Bias (%) | −35.11 (59.73) | 9.78 (66.64) | 3.79 (57.42) |
| RMSE (mg/L) | 10.63 (6.65) | 10.46 (11.83) | 7.46 (8.81) |
| Llopis et al. [38] | Revilla et al. [39] | Goti et al. [40] | |
|---|---|---|---|
| Fixed parameters | mg/dL mg/dL | mL/min mL/min mg/dL mg/mL years | |
| Interindividual variability (CV%) | |||
| Intraindividual variability (SD mg/L) |
3. Discussion
4. Materials and Methods
4.1. Selected Structural Models
4.2. App Development
4.3. Data Extraction
4.4. Models’ Evaluation
4.5. Statistical Analysis
5. Conclusions
Author Contributions
Funding
Institutional Review Board Statement
Informed Consent Statement
Data Availability Statement
Acknowledgments
Conflicts of Interest
References
- Donagher, J.; Martin, J.H.; Barras, M.A. Individualised medicine: Why we need Bayesian dosing. Intern. Med. J. 2017, 47, 593–600. [Google Scholar] [CrossRef]
- Vali, L.; Jenkins, D.R.; Vaja, R.; Mulla, H. Personalised dosing of vancomycin: A prospective and retrospective comparative quasi-experimental study. Br. J. Clin. Pharmacol. 2021, 87, 506–515. [Google Scholar] [CrossRef] [PubMed]
- Abdul-Aziz, M.H.; Alffenaar, J.C.; Bassetti, M.; Bracht, H.; Dimopoulos, G.; Marriott, D.; Neely, M.N.; Paiva, J.A.; Pea, F.; Sjovall, F.; et al. Antimicrobial therapeutic drug monitoring in critically ill adult patients: A Position Paper. Intensive Care Med. 2020, 46, 1127–1153. [Google Scholar] [CrossRef] [PubMed]
- Gorham, J.; Taccone, F.S.; Hites, M. Ensuring target concentrations of antibiotics in critically ill patients through dose adjustment. Expert Opin. Drug Metab. Toxicol. 2022, 18, 177–187. [Google Scholar] [CrossRef] [PubMed]
- Wicha, S.G.; Martson, A.G.; Nielsen, E.I.; Koch, B.C.P.; Friberg, L.E.; Alffenaar, J.W.; Minichmayr, I.K.; International Society of Anti-Infective Pharmacology (ISAP); The PK/PD Study Group of the European Society of Clinical Microbiology, Infectious Diseases (EPASG). From Therapeutic Drug Monitoring to Model-Informed Precision Dosing for Antibiotics. Clin. Pharmacol. Ther. 2021, 109, 928–941. [Google Scholar] [CrossRef]
- Abulfathi, A.A.; Chirehwa, M.; Rosenkranz, B.; Decloedt, E.H. Evaluation of the Effectiveness of Dose Individualization to Achieve Therapeutic Vancomycin Concentrations. J. Clin. Pharmacol. 2018, 58, 1134–1139. [Google Scholar] [CrossRef]
- Ye, Z.K.; Tang, H.L.; Zhai, S.D. Benefits of therapeutic drug monitoring of vancomycin: A systematic review and meta-analysis. PLoS ONE 2013, 8, e77169. [Google Scholar] [CrossRef]
- Yoon, S.; Park, K.R.; Lee, S.; Song, S.H.; Park, W.B.; Jang, I.J.; Yu, K.S. Assessment of Appropriateness of an Initial Dosing Regimen of Vancomycin and Development of a New Dosing Nomogram. Basic Clin. Pharmacol. Toxicol 2018, 122, 233–238. [Google Scholar] [CrossRef]
- Seng, J.J.B.; Yong, M.H.A.; Peh, Z.X.; Soong, J.L.; Tan, M.H. Appropriateness of vancomycin therapeutic drug monitoring and its outcomes among non-dialysis patients in a tertiary hospital in Singapore. Int. J. Clin. Pharm. 2018, 40, 977–981. [Google Scholar] [CrossRef]
- Bel Kamel, A.; Bourguignon, L.; Marcos, M.; Ducher, M.; Goutelle, S. Is Trough Concentration of Vancomycin Predictive of the Area Under the Curve? A Clinical Study in Elderly Patients. Ther. Drug Monit. 2017, 39, 83–87. [Google Scholar] [CrossRef]
- Hale, C.M.; Seabury, R.W.; Steele, J.M.; Darko, W.; Miller, C.D. Are Vancomycin Trough Concentrations of 15 to 20 mg/L Associated With Increased Attainment of an AUC/MIC >/= 400 in Patients With Presumed MRSA Infection? J. Pharm. Pract. 2017, 30, 329–335. [Google Scholar] [CrossRef]
- Kufel, W.D.; Seabury, R.W.; Mogle, B.T.; Beccari, M.V.; Probst, L.A.; Steele, J.M. Readiness to implement vancomycin monitoring based on area under the concentration-time curve: A cross-sectional survey of a national health consortium. Am. J. Health Syst. Pharm. 2019, 76, 889–894. [Google Scholar] [CrossRef]
- Neely, M.N.; Kato, L.; Youn, G.; Kraler, L.; Bayard, D.; van Guilder, M.; Schumitzky, A.; Yamada, W.; Jones, B.; Minejima, E. Prospective Trial on the Use of Trough Concentration versus Area under the Curve To Determine Therapeutic Vancomycin Dosing. Antimicrob. Agents Chemother. 2018, 62, e02042-17. [Google Scholar] [CrossRef]
- Neely, M.N.; Youn, G.; Jones, B.; Jelliffe, R.W.; Drusano, G.L.; Rodvold, K.A.; Lodise, T.P. Are vancomycin trough concentrations adequate for optimal dosing? Antimicrob. Agents Chemother. 2014, 58, 309–316. [Google Scholar] [CrossRef]
- Rybak, M.J.; Le, J.; Lodise, T.P.; Levine, D.P.; Bradley, J.S.; Liu, C.; Mueller, B.A.; Pai, M.P.; Beringer, A.W.; Rodvold, K.A.; et al. Validity of 2020 vancomycin consensus recommendations and further guidance for practical application. Am. J. Health Syst. Pharm. 2021, 78, 1364–1367. [Google Scholar] [CrossRef]
- Rybak, M.J.; Le, J.; Lodise, T.P.; Levine, D.P.; Bradley, J.S.; Liu, C.; Mueller, B.A.; Pai, M.P.; Wong-Beringer, A.; Rotschafer, J.C.; et al. Therapeutic monitoring of vancomycin for serious methicillin-resistant Staphylococcus aureus infections: A revised consensus guideline and review by the American Society of Health-System Pharmacists, the Infectious Diseases Society of America, the Pediatric Infectious Diseases Society, and the Society of Infectious Diseases Pharmacists. Am. J. Health Syst. Pharm. 2020, 77, 835–864. [Google Scholar]
- Sault, A.D.; Parent, M.; Simard, C. Methods of Therapeutic Drug Monitoring to Guide Vancomycin Dosing Regimens: Trough Concentration versus Ratio of Area Under the Curve to Minimum Inhibitory Concentration. Can. J. Hosp. Pharm. 2022, 75, 89–96. [Google Scholar] [CrossRef]
- Seabury, R.W.; Stoessel, A.M.; Steele, J.M. Vancomycin Trough Concentration Poorly Characterizes AUC: Is It Time to Transition to AUC-Based Vancomycin Monitoring? Ann. Pharm. 2017, 51, 926–927. [Google Scholar] [CrossRef]
- Broeker, A.; Nardecchia, M.; Klinker, K.P.; Derendorf, H.; Day, R.O.; Marriott, D.J.; Carland, J.E.; Stocker, S.L.; Wicha, S.G. Towards precision dosing of vancomycin: A systematic evaluation of pharmacometric models for Bayesian forecasting. Clin. Microbiol. Infect. 2019, 25, 1286.e1281–1286.e1287. [Google Scholar] [CrossRef]
- Cunio, C.B.; Uster, D.W.; Carland, J.E.; Buscher, H.; Liu, Z.; Brett, J.; Stefani, M.; Jones, G.R.D.; Day, R.O.; Wicha, S.G.; et al. Towards precision dosing of vancomycin in critically ill patients: An evaluation of the predictive performance of pharmacometric models in ICU patients. Clin. Microbiol. Infect. 2020, 27, 783.e7–783.e14. [Google Scholar] [CrossRef]
- Ferreira, A.; Martins, H.; Oliveira, J.C.; Lapa, R.; Vale, N. In Silico Pharmacokinetic Study of Vancomycin Using PBPK Modeling and Therapeutic Drug Monitoring. Curr. Drug Metab. 2021, 22, 150–162. [Google Scholar] [PubMed]
- Heus, A.; Uster, D.W.; Grootaert, V.; Vermeulen, N.; Somers, A.; In’t Veld, D.H.; Wicha, S.G.; De Cock, P.A. Model-informed precision dosing of vancomycin via continuous infusion: A clinical fit-for-purpose evaluation of published PK models. Int. J. Antimicrob. Agents 2022, 59, 106579. [Google Scholar] [CrossRef] [PubMed]
- Tangden, T.; Ramos Martin, V.; Felton, T.W.; Nielsen, E.I.; Marchand, S.; Bruggemann, R.J.; Bulitta, J.B.; Bassetti, M.; Theuretzbacher, U.; Tsuji, B.T.; et al. The role of infection models and PK/PD modelling for optimising care of critically ill patients with severe infections. Intensive Care Med. 2017, 43, 1021–1032. [Google Scholar] [CrossRef] [PubMed]
- Uster, D.W.; Wicha, S.G. Optimized sampling to estimate vancomycin drug exposure: Comparison of pharmacometric and equation-based approaches in a simulation-estimation study. CPT Pharmacomet. Syst. Pharmacol. 2022, 11, 711–720. [Google Scholar] [CrossRef] [PubMed]
- Cusumano, J.A.; Klinker, K.P.; Huttner, A.; Luther, M.K.; Roberts, J.A.; LaPlante, K.L. Towards precision medicine: Therapeutic drug monitoring-guided dosing of vancomycin and beta-lactam antibiotics to maximize effectiveness and minimize toxicity. Am. J. Health Syst. Pharm. 2020, 77, 1104–1112. [Google Scholar] [CrossRef]
- Toro-Alzate, L. Antimicrobial Resistance in Colombia under the Scope of One Health Approach. Available online: https://bibalex.org/baifa/Attachment/Documents/z9IWbbJEsU_20210712160831689.pdf (accessed on 3 June 2022).
- Koch, B.C.P.; Muller, A.E.; Hunfeld, N.G.M.; de Winter, B.C.M.; Ewoldt, T.M.J.; Abdulla, A.; Endeman, H. Therapeutic Drug Monitoring of Antibiotics in Critically Ill Patients: Current Practice and Future Perspectives With a Focus on Clinical Outcome. Ther. Drug Monit. 2022, 44, 11–18. [Google Scholar] [CrossRef]
- Andryukov, B.G.; Lyapun, I.N.; Matosova, E.V.; Somova, L.M. Biosensor Technologies in Medicine: From Detection of Biochemical Markers to Research into Molecular Targets (Review). Sovrem. Tekhnologii Med. 2021, 12, 70–83. [Google Scholar] [CrossRef]
- McNaught, A.D.; Wilkinson, A.; International Union of Pure and Applied Chemistry; Royal Society of Chemistry (Great Britain). IUPAC Compendium of Chemical Terminology, 2nd ed.; Royal Society of Chemistry: Cambridge, UK, 2000. [Google Scholar]
- Kumar, S.; Tripathy, S.; Jyoti, A.; Singh, S.G. Recent advances in biosensors for diagnosis and detection of sepsis: A comprehensive review. Biosens. Bioelectron. 2019, 124–125, 205–215. [Google Scholar] [CrossRef]
- Olejnik, B.; Koziol, A.; Brzozowska, E.; Ferens-Sieczkowska, M. Application of selected biosensor techniques in clinical diagnostics. Expert Rev. Mol. Diagn. 2021, 21, 925–937. [Google Scholar] [CrossRef]
- McGrady, K.A.; Benton, M.; Tart, S.; Bowers, R. Evaluation of traditional initial vancomycin dosing versus utilizing an electronic AUC/MIC dosing program. Pharm. Pract. 2020, 18, 2024. [Google Scholar]
- Mu, F.; He, J.; Fan, F.; Shi, G. Dual-emission fluorescence biosensing of vancomycin based on AIEgen-peptide conjugates and aptamer-modified Au nanoclusters. Anal. Chim. Acta 2021, 1150, 238177. [Google Scholar] [CrossRef]
- Mu, F.; Zhou, X.; Fan, F.; Chen, Z.; Shi, G. A fluorescence biosensor for therapeutic drug monitoring of vancomycin using in vivo microdialysis. Anal. Chim Acta 2021, 1151, 338250. [Google Scholar] [CrossRef]
- Pang, Y.; Wan, N.; Shi, L.; Wang, C.; Sun, Z.; Xiao, R.; Wang, S. Dual-recognition surface-enhanced Raman scattering(SERS)biosensor for pathogenic bacteria detection by using vancomycin-SERS tags and aptamer-Fe3O4@Au. Anal Chim. Acta 2019, 1077, 288–296. [Google Scholar] [CrossRef]
- Wang, C.; Gu, B.; Liu, Q.; Pang, Y.; Xiao, R.; Wang, S. Combined use of vancomycin-modified Ag-coated magnetic nanoparticles and secondary enhanced nanoparticles for rapid surface-enhanced Raman scattering detection of bacteria. Int. J. Nanomed. 2018, 13, 1159–1178. [Google Scholar] [CrossRef]
- Hughes, D.M.; Goswami, S.; Keizer, R.J.; Hughes, M.A.; Faldasz, J.D. Bayesian clinical decision support-guided versus clinician-guided vancomycin dosing in attainment of targeted pharmacokinetic parameters in a paediatric population. J. Antimicrob. Chemother 2020, 75, 434–437. [Google Scholar] [CrossRef]
- Llopis-Salvia, P.; Jimenez-Torres, N.V. Population pharmacokinetic parameters of vancomycin in critically ill patients. J. Clin. Pharm. Ther. 2006, 31, 447–454. [Google Scholar] [CrossRef]
- Revilla, N.; Martin-Suarez, A.; Perez, M.P.; Gonzalez, F.M.; Fernandez de Gatta Mdel, M. Vancomycin dosing assessment in intensive care unit patients based on a population pharmacokinetic/pharmacodynamic simulation. Br. J. Clin. Pharmacol. 2010, 70, 201–212. [Google Scholar] [CrossRef]
- Goti, V.; Chaturvedula, A.; Fossler, M.J.; Mok, S.; Jacob, J.T. Hospitalized Patients With and Without Hemodialysis Have Markedly Different Vancomycin Pharmacokinetics: A Population Pharmacokinetic Model-Based Analysis. Ther. Drug Monit. 2018, 40, 212–221. [Google Scholar] [CrossRef]
- Bang, J.Y.; Kang, H.I.; Lee, H.J.; Chong, Y.P.; Hong, S.K.; Lee, E.K.; Choi, B.M.; Noh, G.J. Development of a new pharmacokinetic model for target-concentration controlled infusion of vancomycin in critically ill patients. Clin. Exp. Pharmacol. Physiol. 2022, 49, 202–211. [Google Scholar] [CrossRef]
- Narayan, S.W.; Thoma, Y.; Drennan, P.G.; Yejin Kim, H.; Alffenaar, J.W.; Van Hal, S.; Patanwala, A.E. Predictive Performance of Bayesian Vancomycin Monitoring in the Critically Ill. Crit. Care Med. 2021, 49, e952–e960. [Google Scholar] [CrossRef]
- Hughes, J.H.; Tong, D.M.H.; Lucas, S.S.; Faldasz, J.D.; Goswami, S.; Keizer, R.J. Continuous Learning in Model-Informed Precision Dosing: A Case Study in Pediatric Dosing of Vancomycin. Clin. Pharmacol. Ther. 2021, 109, 233–242. [Google Scholar] [CrossRef] [PubMed]
- Uster, D.W.; Stocker, S.L.; Carland, J.E.; Brett, J.; Marriott, D.J.E.; Day, R.O.; Wicha, S.G. A Model Averaging/Selection Approach Improves the Predictive Performance of Model-Informed Precision Dosing: Vancomycin as a Case Study. Clin. Pharmacol. Ther. 2021, 109, 175–183. [Google Scholar] [CrossRef] [PubMed]
- Marsot, A.; Boulamery, A.; Bruguerolle, B.; Simon, N. Vancomycin: A review of population pharmacokinetic analyses. Clin. Pharm. 2012, 51, 1–13. [Google Scholar] [CrossRef] [PubMed]
- Purwonugroho, T.A.; Chulavatnatol, S.; Preechagoon, Y.; Chindavijak, B.; Malathum, K.; Bunuparadah, P. Population pharmacokinetics of vancomycin in Thai patients. Sci. World J. 2012, 2012, 762649. [Google Scholar] [CrossRef] [PubMed]
- Deng, C.; Liu, T.; Wu, K.; Wang, S.; Li, L.; Lu, H.; Zhou, T.; Cheng, D.; Zhong, X.; Lu, W. Predictive performance of reported population pharmacokinetic models of vancomycin in Chinese adult patients. J. Clin. Pharm. Ther. 2013, 38, 480–489. [Google Scholar] [CrossRef]
- Aljutayli, A.; Marsot, A.; Nekka, F. An Update on Population Pharmacokinetic Analyses of Vancomycin, Part I: In Adults. Clin. Pharm. 2020, 59, 671–698. [Google Scholar] [CrossRef]
- Guo, T.; van Hest, R.M.; Roggeveen, L.F.; Fleuren, L.M.; Thoral, P.J.; Bosman, R.J.; van der Voort, P.H.J.; Girbes, A.R.J.; Mathot, R.A.A.; Elbers, P.W.G. External Evaluation of Population Pharmacokinetic Models of Vancomycin in Large Cohorts of Intensive Care Unit Patients. Antimicrob. Agents Chemother. 2019, 63, e02543-18. [Google Scholar] [CrossRef]
- Roberts, J.A.; Taccone, F.S.; Udy, A.A.; Vincent, J.L.; Jacobs, F.; Lipman, J. Vancomycin dosing in critically ill patients: Robust methods for improved continuous-infusion regimens. Antimicrob Agents Chemother 2011, 55, 2704–2709. [Google Scholar] [CrossRef]
- Olney, K.B.; Wallace, K.L.; Mynatt, R.P.; Burgess, D.S.; Grieves, K.; Willett, A.; Mani, J.; Flannery, A.H. Comparison of Bayesian-derived and first-order analytic equations for calculation of vancomycin area under the curve. Pharmacotherapy 2022, 42, 284–291. [Google Scholar] [CrossRef]
- Yu, Y.X.; Lu, J.; Lu, H.D.; Li, L.; Li, J.J.; Shi, L.; Duan, L.F.; Zhuang, Z.W.; Xue, S.D.; Shen, Y.; et al. Predictive performance of reported vancomycin population pharmacokinetic model in patients with different renal function status, especially those with augmented renal clearance. Eur. J. Hosp. Pharm. 2022, 29, e6–e14. [Google Scholar] [CrossRef]
- Matsumoto, K.; Oda, K.; Shoji, K.; Hanai, Y.; Takahashi, Y.; Fujii, S.; Hamada, Y.; Kimura, T.; Mayumi, T.; Ueda, T.; et al. Clinical Practice Guidelines for Therapeutic Drug Monitoring of Vancomycin in the Framework of Model-Informed Precision Dosing: A Consensus Review by the Japanese Society of Chemotherapy and the Japanese Society of Therapeutic Drug Monitoring. Pharmaceutics 2022, 14, 489. [Google Scholar] [CrossRef]
- Aljutayli, A.; Thirion, D.J.G.; Bonnefois, G.; Nekka, F. Pharmacokinetic equations versus Bayesian guided vancomycin monitoring: Pharmacokinetic model and model-informed precision dosing trial simulations. Clin. Transl. Sci. 2022, 15, 942–953. [Google Scholar] [CrossRef]
- Turner, R.B.; Kojiro, K.; Shephard, E.A.; Won, R.; Chang, E.; Chan, D.; Elbarbry, F. Review and Validation of Bayesian Dose-Optimizing Software and Equations for Calculation of the Vancomycin Area Under the Curve in Critically Ill Patients. Pharmacotherapy 2018, 38, 1174–1183. [Google Scholar] [CrossRef]
- Oommen, T.; Thommandram, A.; Palanica, A.; Fossat, Y. A Free Open-Source Bayesian Vancomycin Dosing App for Adults: Design and Evaluation Study. JMIR Form. Res. 2022, 6, e30577. [Google Scholar] [CrossRef]
- Wicha, S.G.; Kees, M.G.; Solms, A.; Minichmayr, I.K.; Kratzer, A.; Kloft, C. TDMx: A novel web-based open-access support tool for optimising antimicrobial dosing regimens in clinical routine. Int. J. Antimicrob. Agents 2015, 45, 442–444. [Google Scholar] [CrossRef]
- Oda, K.; Hashiguchi, Y.; Kimura, T.; Tsuji, Y.; Shoji, K.; Takahashi, Y.; Matsumoto, K.; Kawamura, H.; Saito, H.; Takesue, Y. Performance of Area under the Concentration-Time Curve Estimations of Vancomycin with Limited Sampling by a Newly Developed Web Application. Pharm. Res. 2021, 38, 637–646. [Google Scholar] [CrossRef]
- Bae, S.H.; Yim, D.S.; Lee, H.; Park, A.R.; Kwon, J.E.; Sumiko, H.; Han, S. Application of Pharmacometrics in Pharmacotherapy: Open-Source Software for Vancomycin Therapeutic Drug Management. Pharmaceutics 2019, 11, 224. [Google Scholar] [CrossRef]
- Yager, R.C.; Taylor, N.; Stocker, S.L.; Day, R.O.; Baysari, M.T.; Carland, J.E. Would they accept it? An interview study to identify barriers and facilitators to user acceptance of a prescribing advice service. BMC Health Serv. Res. 2022, 22, 514. [Google Scholar] [CrossRef]
- Giavarina, D. Understanding Bland Altman analysis. Biochem. Med. 2015, 25, 141–151. [Google Scholar] [CrossRef]


Disclaimer/Publisher’s Note: The statements, opinions and data contained in all publications are solely those of the individual author(s) and contributor(s) and not of MDPI and/or the editor(s). MDPI and/or the editor(s) disclaim responsibility for any injury to people or property resulting from any ideas, methods, instructions or products referred to in the content. |
© 2023 by the authors. Licensee MDPI, Basel, Switzerland. This article is an open access article distributed under the terms and conditions of the Creative Commons Attribution (CC BY) license (https://creativecommons.org/licenses/by/4.0/).
Share and Cite
Mena, M.; Garcia, J.-C.; Bustos, R.-H. Implementing Vancomycin Population Pharmacokinetic Models: An App for Individualized Antibiotic Therapy in Critically Ill Patients. Antibiotics 2023, 12, 301. https://doi.org/10.3390/antibiotics12020301
Mena M, Garcia J-C, Bustos R-H. Implementing Vancomycin Population Pharmacokinetic Models: An App for Individualized Antibiotic Therapy in Critically Ill Patients. Antibiotics. 2023; 12(2):301. https://doi.org/10.3390/antibiotics12020301
Chicago/Turabian StyleMena, Manuel, Julio-Cesar Garcia, and Rosa-Helena Bustos. 2023. "Implementing Vancomycin Population Pharmacokinetic Models: An App for Individualized Antibiotic Therapy in Critically Ill Patients" Antibiotics 12, no. 2: 301. https://doi.org/10.3390/antibiotics12020301