Article

Balancing the Virulence and Antimicrobial Resistance in VISA DAP-R CA-MRSA Superbug

Department of Biomedical and Biotechnological Sciences, University of Catania, 95123 Catania, Italy
*
Author to whom correspondence should be addressed.
These authors contributed equally to this work.
Antibiotics 2022, 11(9), 1159; https://doi.org/10.3390/antibiotics11091159
Submission received: 29 July 2022 / Revised: 22 August 2022 / Accepted: 24 August 2022 / Published: 27 August 2022

Abstract

:
Background: Methicillin-resistant Staphylococcus aureus (MRSA) with intermediate resistance to Vancomycin (VISA) is reported worldwide. These strains frequently emerge among hospital-associated (HA)-MRSA and rarely within community-acquired (CA)-MRSA. Here, the genomic and transcriptomic adaptations distinguishing VISA daptomycin resistant (DAP-R) CA-MRSA, which emerged in a hospitalized patient under glycopeptide treatment, were explored. Methods: Whole-genome sequencing, RNA-Seq and bioinformatics were carried out. Results: Our CA-MRSA clustered in the USA400 lineage showing additional antimicrobial resistance (AMR) versus DAP and glycopeptides. Resistomics revealed adaptations related to glycopeptide, daptomycin and rifampin resistance (mprF nsSNPS and overexpression of glycopeptide and daptomycin-resistance related genes). Similar changes were detected in virulence traits (agrA HI-nsSNPs and toxin gene underexpression), in which a decrease was observed despite the abundance of virulence-related genes. Our results predicted a balance in adaptations, decreasing the virulence and biological costs to support the co-occurrence of extensive AMR in a hypervirulent genomic background. Conclusion: Our data show that VISA DAP-R CA-MRSA shifts the potential hypervirulent behavior of CA-MRSA towards the acquisition and maintenance of extensive AMR, by a decrease in virulence and biological costs mediated by a “compensatory modulatory mutation” silencing the Agr quorum-sensing cascade.

1. Introduction

Hospital- and community-acquired methicillin-resistant Staphylococcus aureus (MRSA) are considered high-priority micro-organisms because the severity of their infections is often difficult to treat [1]. Exploiting a plethora of complex infection-related mechanisms of infection, S. aureus causes a wide range of serious infections, i.e., abscesses of various organs, bacteremia, infective endocarditis (IE), pneumonia, as well as osteoarticular, skin and soft tissue, pleuropulmonary and device-related infections. Complicated therapeutical management is often necessary to treat MRSA infections, even with the emergence of new Gram-positive drugs [1]. From an evolutionary viewpoint, S. aureus constantly has reprogrammed its antimicrobial resistance (AMR) mechanisms in response to increasing antimicrobial pressure and virulence mechanisms to adapt its host defense response. Antimicrobial and immune system activity are key factors in conditioning bacterial survival [2,3,4,5,6,7] and in the selection of new lineages or pathogen variants. Both mechanisms are crucial for survival under adverse conditions such as host immune system defenses, antimicrobial treatment and the need to survive in new challenging niches.
Reflecting these two evolutionary and selective drives, MRSA selected three different variants related to the modality of transmission: (i) healthcare-associated methicillin-resistant S. aureus (HA-MRSA), (ii) community-acquired S. aureus (CA-MRSA) and (iii) livestock-associated S. aureus (LA-MRSA), each of which is strongly adapted to different environments. Among these, HA-MRSA infections are mainly reported following contact with healthcare settings. Community-associated MRSA (CA-MRSA) infections have been reported since the 1990s in individuals who had no prior hospitalization [8], whilst LA-MRSA are associated with livestock [9]. CA-MRSA is particularly virulent compared to HA-MRSA in that, on the contrary, it is highly resistant to antimicrobial treatment [10,11]. This aspect reflects different genomics of HA-MRSA versus CA-MRSA. HA-MRSA is characterized by a huge pool of antimicrobial resistance (AMR) genes and lower virulence-related genes. CA-MRSA has a lower content of AMR genes (in general restricted to β-lactams and macrolides) and a higher pool of virulence-related genes, including the Panton-Valentine Leukocidin (PVL) toxin gene. This is a β-pore-forming cytotoxin creating pores in the membranes of infected cells that can cause necrotic lesions in the skin, in the mucosa and can also determine necrotic hemorrhagic pneumonia [10,11].
Virulence and resistance factors share similar mechanisms of dissemination and co-selection between species or genera. These mechanisms are mediated by horizontal gene transfer (HGT) of mobile genetic elements (MGEs), compensatory or adaptive mutations [12,13] and intrinsic factors related to the nature of micro-organisms such as biofilm-producing or intracellular bacteria [2,3,6,7], involvement of the same cellular structures such as efflux pumps [4], porins [5], cell wall alterations [6] and two-component regulatory systems [7].
MRSA antimicrobial resistance towards first-choice and last resort antimicrobials such as glycopeptides and daptomycin is one of the great challenges for the current management of MRSA infections. These strains emerge typically and frequently among HA-MRSA because of the selective pressure arising during severe antimicrobial treatment; on the other hand, they are very rare among CA-MRSA [14,15].
In our experimental plan, global integrated genomic and transcriptomic profiling was applied to better understand the adaptations of a new VISA DAP-R CA-MRSA superbug that attracted our attention for its biological characteristic of extensive antimicrobial resistance, including glycopeptide and daptomycin resistance.

2. Results

A comparative genomic and transcriptomic approach was exploited to uncover the gained adaptations by VISA DAP-R CA-MRSA, acquired under the selective pressure of teicoplanin treatment, versus its VSSA DAP-S CA-MRSA isogenic parents.
First, the genomic lineage and background characterizing VISA DAP-R CA-MRSA, as well as the genomic markers associated with the take-over of extensive antimicrobial resistance (VISA and DAP-R), were determined. In-depth genomic characterization (phylogeny, genomic epidemiology, molecular typing, whole-genome non-synonymous single nucleotide polymorphisms) was conducted by whole-genome sequencing (WGS) and bioinformatics, focusing mainly on the traits impacting AMR and Virulence.
Similarly, a pool of the statistically significant differentially expressed genes (DEGs), their expression trend (over- or under-expression) and the main enriched dysregulated KEGG pathways were determined by RNA-seq and bioinformatics.
Finally, the phenotypical biofilm production ability (together with already known delta-hemolysis production ability) and growth-curve kinetics were evaluated to assess the production of prototype (adhesion and toxigenicity, respectively) virulence factors and the biological AMR and virulence fitness costs.

2.1. Biological Fitness Costs of AMR and Virulence

AMR and virulence biological fitness costs were evaluated in terms of variation in generation time and lag growth-phase duration in 1-R vs 1-S, as previously published [16]. A longer generation time was found in 1-R (60′) than in 1-S (30′). In addition, growth kinetic experiments showed that the lag growth-phase of VISA DAP-R CA-MRSA 1-R was greater (2.00 h) than VSSA DAP-S CA-MRSA 1-S (1.0 h), as well as more similar to MW2 CA-MRSA (2.30 h) and S. aureus ATCC 29213 (2.25 h) (Table 1).

2.2. Biofilm Production
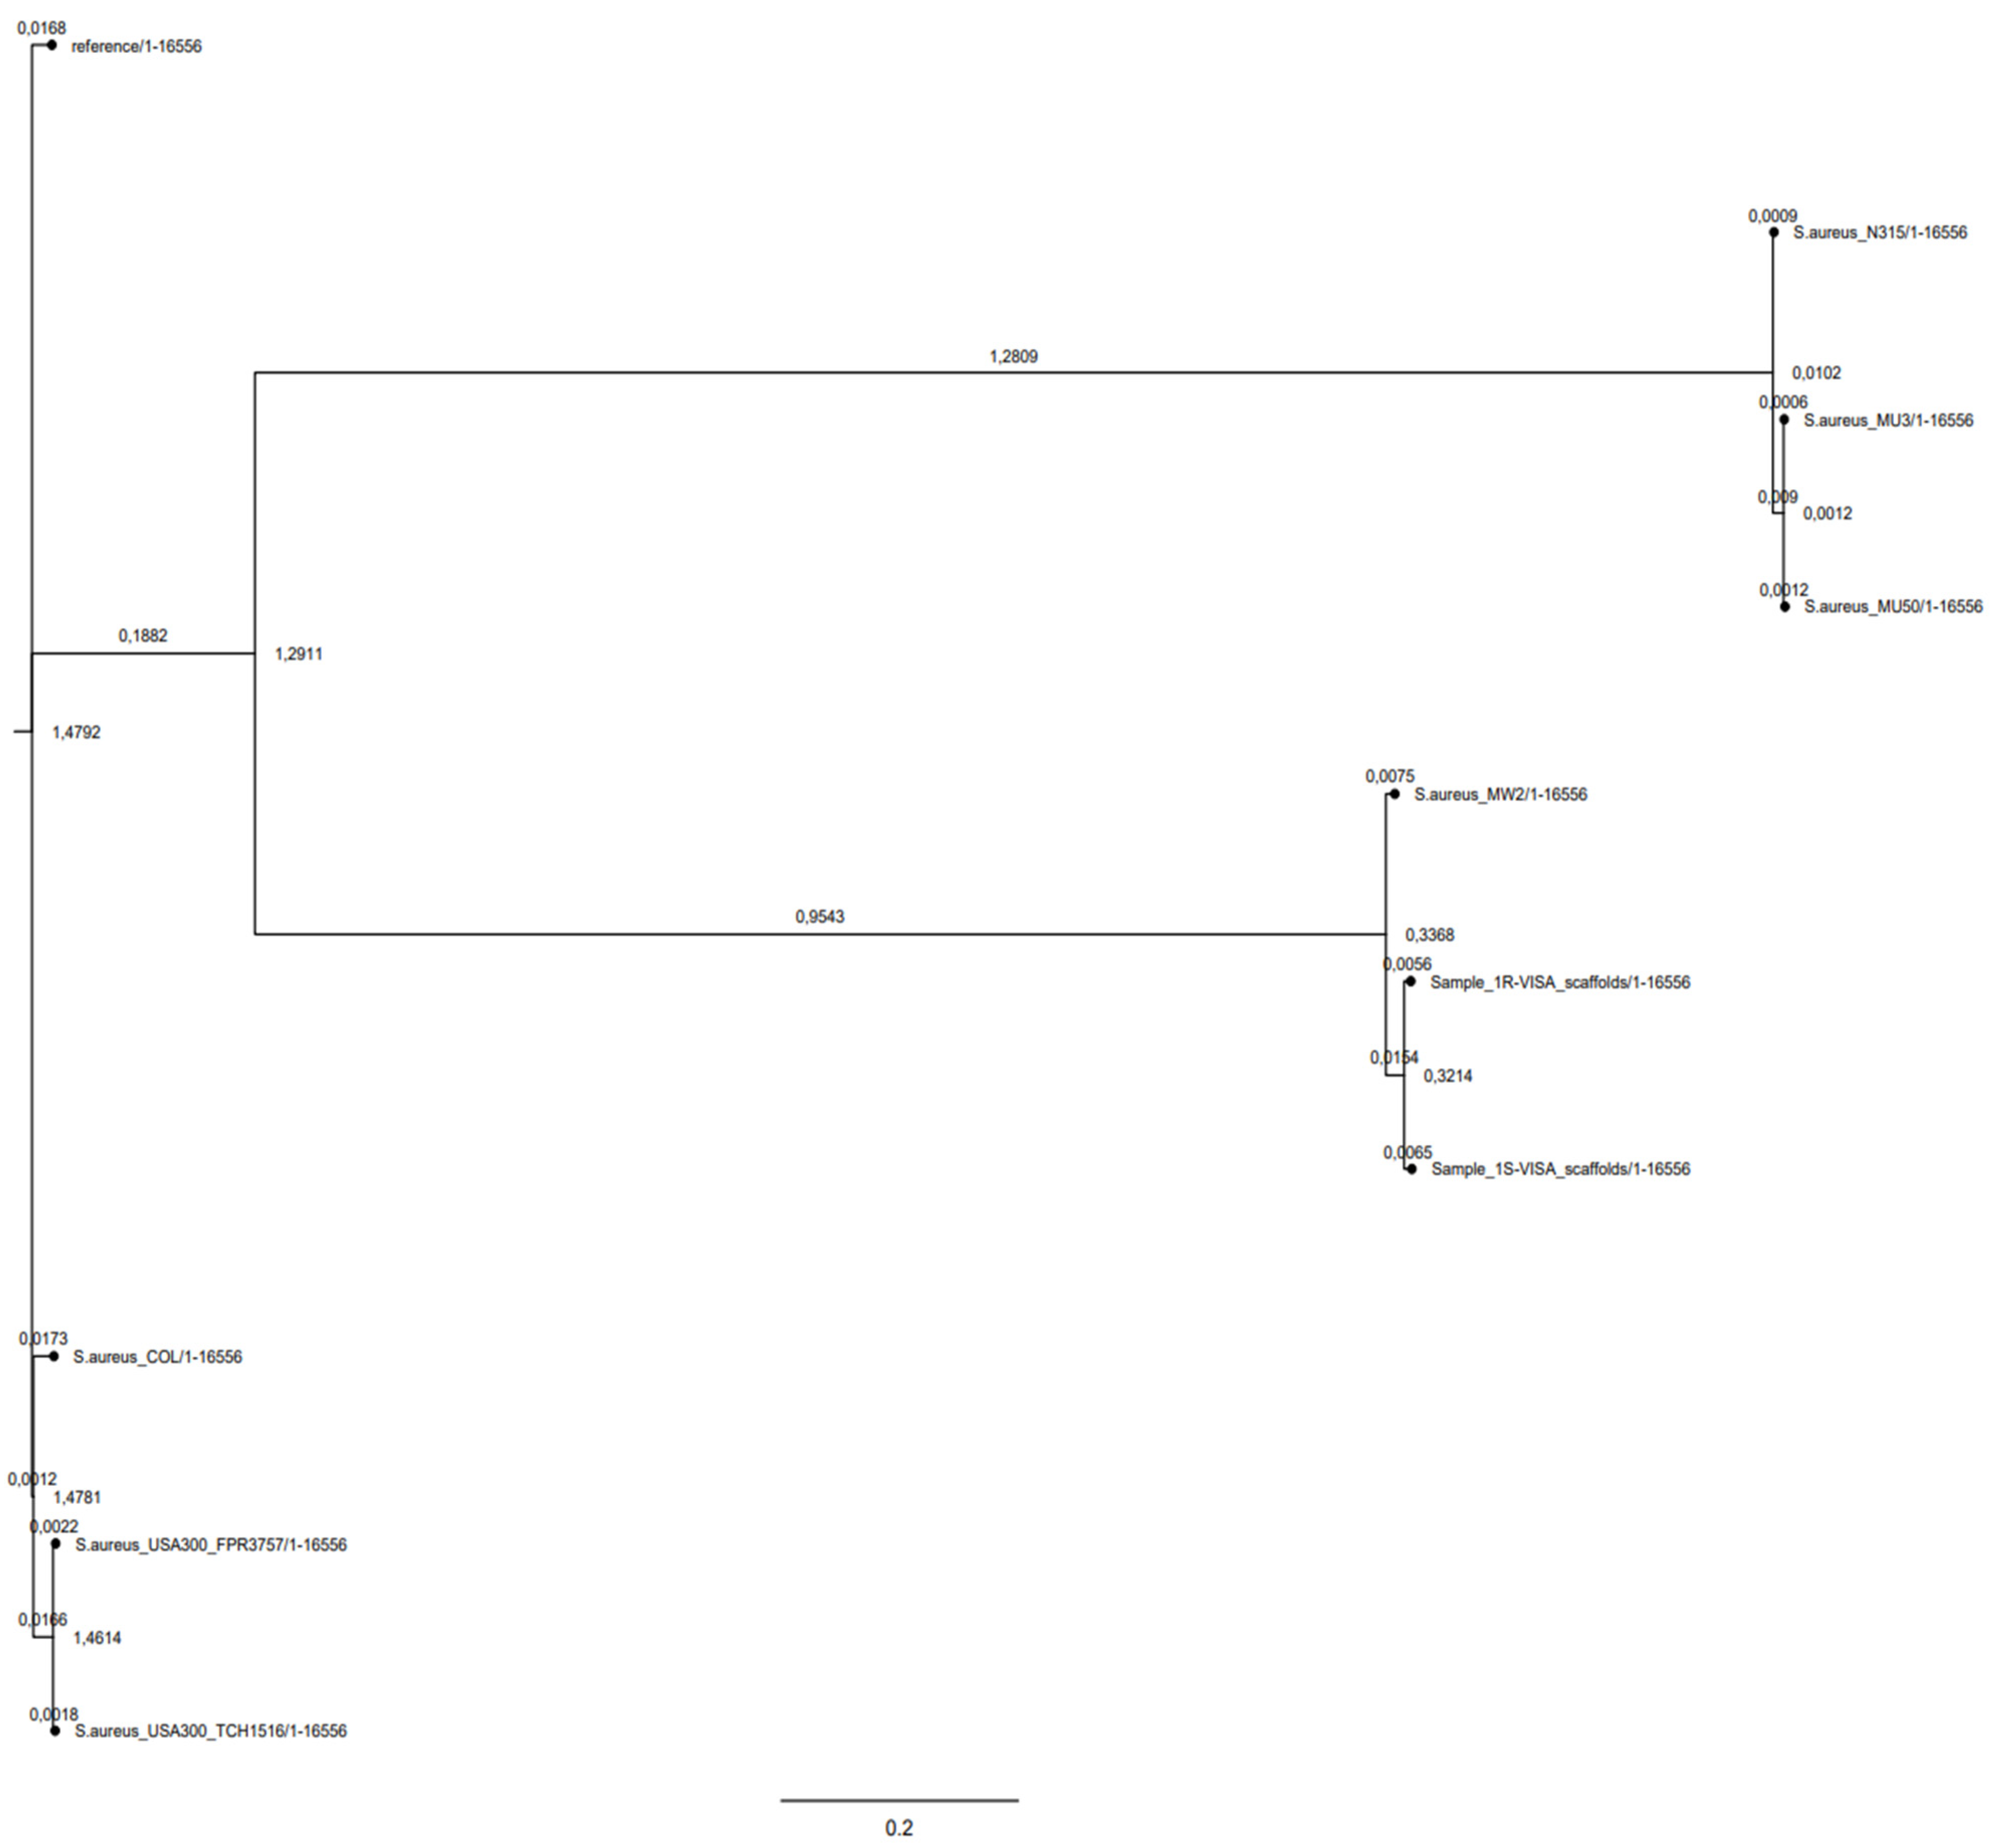
Biofilm production assays showed that 1-S and 1-R MRSA strains were not biofilm producers (Table 2).

2.3. Phylogeny

CSI phylogeny clearly showed the clusterization of 1-S and 1-R MRSA strains in the USA-400 CA-MRSA phylogenetic lineage. The phylogenetic tree showed a close relationship between the 1-S/R MRSA strain pair and the ST-1 MRSA cluster. This highlighted the strong phylogenetic and genomic relationship with the MW2 CA-MRSA, notoriously a USA400, agr-III, CA-MRSA prototype (Figure 1).

2.4. Genomic Characterization

The WGS characterization confirmed and increased our previously published data [17], i.e., ST-1, SCCmec-type IVa, agr-type III, spa-type t127, genomic integration of two staphylococcal phages and five plasmid replication initiating genes (Table 3).
Resistomics, consistently with the antibiotypes, showed the following acquired AMR-genes: (1) ant(6)-Ia and aph(3′)-III (aminoglycoside-resistance); (2) blaZ and mecA (β-lactam-resistance); (3) ermC (macrolide-resistance); (4) tetK (tetracycline-resistance) in both strains (Table 3).
Virulome analysis found the major staphylococcal virulence factors including 22 adherence related genes, 22 immune evasion related genes, 8 secretion system coding genes, 14 exoenzyme encoding genes and 26 toxin coding genes, including lukS/F encoding the PVL in both strains (Table 3).

2.5. Genomic SNPs

SNPomes, mapped on MW2 CA-MRSA RefGen, evidenced 619 and 609 wgSNPs in the 1-S and 1-R genomes versus MW2 RefGen, respectively, whilst 104 wgSNPs were recorded between 1-S and 1-R. Furthermore, in 1-R versus 1-S, HI-nsSNPs were found in four genes, among which agrA (Arg170*) and 22 MI-nsSNPs “already associated to AMR” in mprF (Thr345Ala) were related to DAP-R and rpoB nsSNPs for RIF-R (His481Tyr). In addition, MI-nsSNPs in cap8H (Tyr130His), cap8K (Val120Gly), eta (Leu47Ile), sdrD (Thr1313Ser) and ebh (Val1768Asp) virulence-related genes were found in 1-R versus 1-S (Table 3, Table 4 and Table 5).

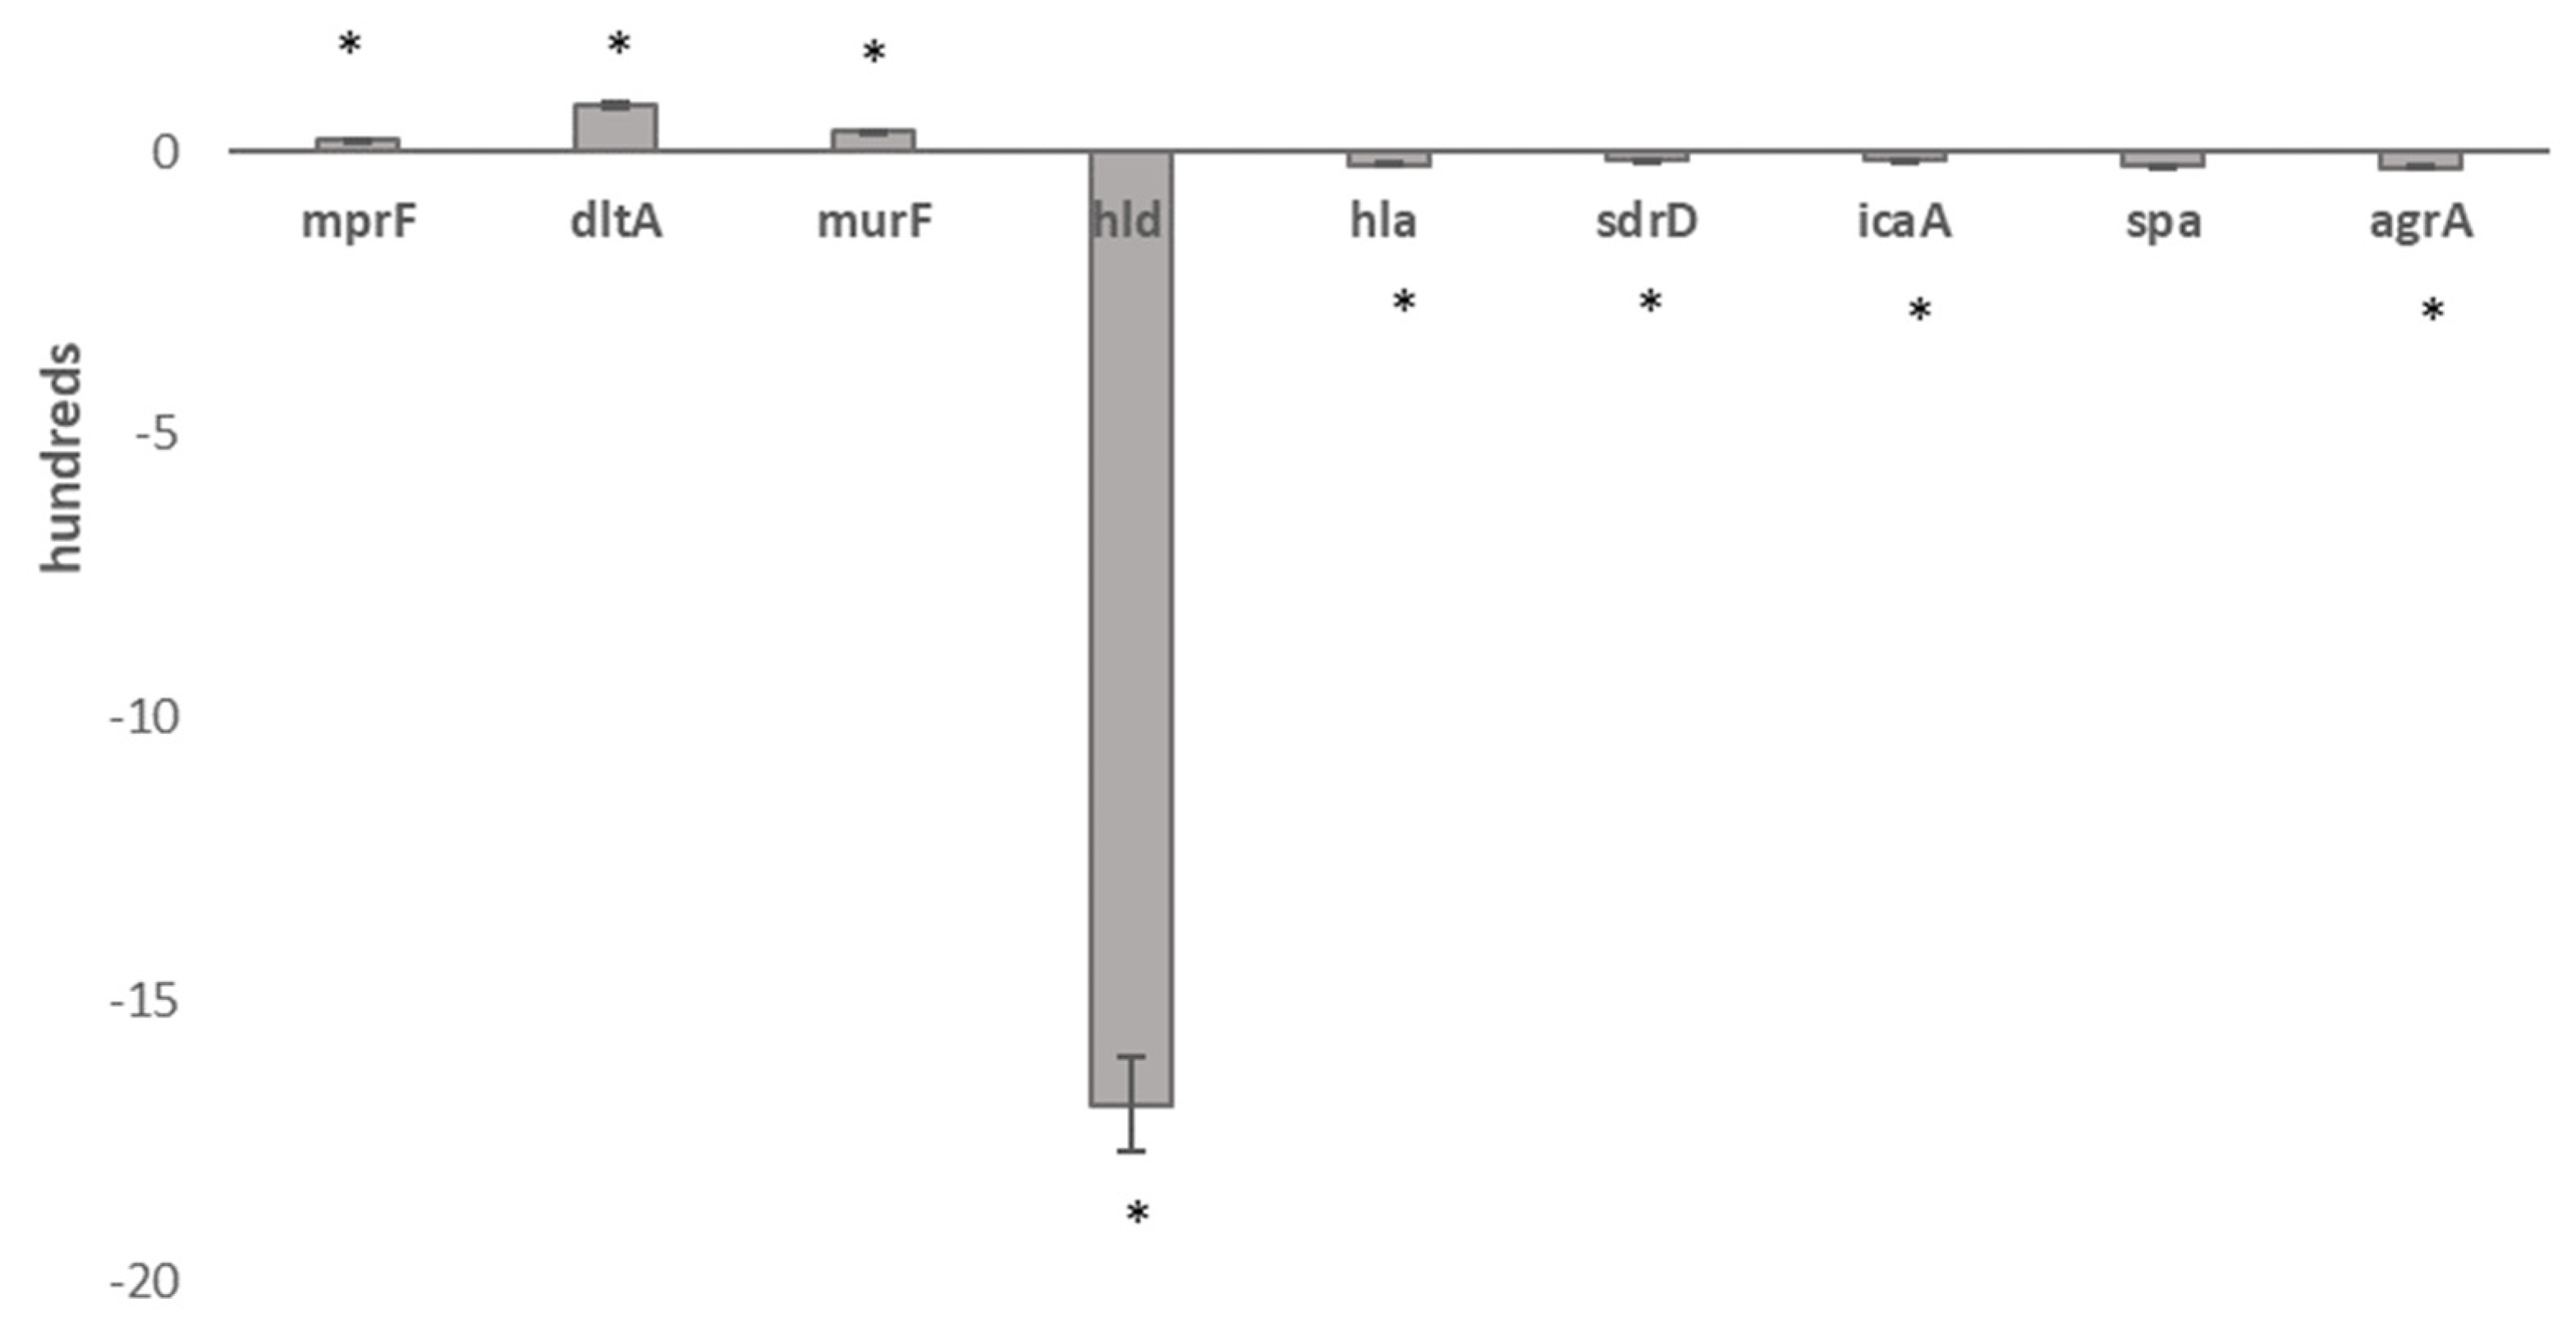
2.6. Comparative Transcriptomics

A complete overview of comparative transcriptomes in 1-R vs. 1-S revealed 145 overexpressed and 265 under-expressed transcripts. Among these, applying the medium filter and EASE score threshold ≤ 1.0, David enrichment analysis evidenced two main enriched clusters of DEGs, including the KEGG pathways, i.e., glycolysis and gluconeogenesis, microbial metabolism in diverse environments, mismatch repair, homologous recombination and DNA replication, as shown in Table 6.
Filtered TS and SI library-integrated output data of the DEGs showed interesting dysregulation in subsets of genes related to AMR resistance and virulence (adhesion and toxigenicity). Extrapolating the transcriptomic traits impacting the biology of CA-MRSA DAP-R VISA phylogenomic lineage, key differential expression was found in the following GO-TERM biological process (BP) gene-clusters: (1) AMR-related traits: overexpression in tcaA (Glycopeptide-resistance), murF (D-cycloserine), dltA and mprF (DAP/VAN-R); underexpression in norA and norB (FQs) and in tet38 (Tetracycline-resistance); (2) Virulence-related traits: Adhesion: under-expression in sdrC and sdrD (ser-Asp rich proteins), eap/map (extracellular adherence protein/MHC analogous protein); Effector delivery system: underexpression in esaA (Type VII secretion system); Exotoxins: underexpression in hla, hld, hlgB/C (hemolysins), seh (enterotoxin H) and in the enterotoxin homologous type A coding gene MW1552; Membrane-acting toxin and Superantigen: underexpression in spa (staphylococcal protein A); Exoenzymes: underexpression in lip (Lipase) and splB (serine-protease); Immune modulatory proteins: overexpression in cap8N (capsule), sbi (staphylococcal binder of immunoglobulin); underexpression in cap8C/G/P (capsule), isaB (immunodominant staphylococcal antigen B; Biofilm: underexpression in icaA (intercellular adhesin A); (3) AMR and virulence transcriptional regulators: overexpression in vraRS, sigB, saeR and rot; underexpression in walKR, srrA, agrBCA, sarS, graR and sarS (Table 7).
Real-time qPCRs of the set of characterizing transcripts, murF, hld, hla, dltA, mprF, spa, agrA, icaA and sdrD, clearly confirm the expression trends found in RNA-seq transcriptional data outputs (Figure 2).

3. Discussion

HA-MRSA and CA-MRSA emerged as different variants of clear adaptive events that occurred within the same species. The genomic composition of the two MRSA lineages clearly indicated that evolution led to highly balanced genomes with HA-MRSA strongly adapted to survive in extreme antimicrobial selective pressure whilst CA-MRSA overcame the host-response [18,19,20,21].
In this scenario, our data describe, for the first time, a new CA-MRSA superbug that emerged as a result of a convergent cross-selection mechanism that makes the CA-MRSA superbug able to decrease its hypervirulence, supporting and maintaining extensive antimicrobial resistance.
These new genomically related USA-400, ST-1, spatype-t127, agr-III, SCCmecIVa, PVL-positive, glycopeptide and daptomycin-resistant CA-MRSA were characterized by the co-occurrence of an extensively antimicrobial resistance profile and decreased virulence despite their great virulence potential.
New insights arose on the layout of genomic and transcriptomic adaptations occurring in this exceptional circumstance in which MRSA harbors simultaneous adaptations related to and impacting antimicrobial resistance and virulence.
Two convergent key motifs emerged as key points of its success: (i) the selection of a compensatory “Silencing regulatory” mutation in the agr-locus, strategic quorum sensing regulator pathway, involved in virulence and antibiotic resistance; (ii) dysregulation in essential primary metabolic pathways associated with a prevalent underexpression trend in DEGs. These co-events determine and allow a balancing of the antimicrobial resistance and virulence adaptations that lead to the setup of increased antimicrobial resistance by decreasing virulence and restoring intrinsic biological costs.
Focusing on antimicrobial-resistance adaptive traits, our findings showed features related to the acquired resistance towards glycopeptides and daptomycin. Resistomics highlighted that MI-nsSNPs in mprF are associated with glycopeptide and daptomycin resistance. In addition, AMR-related transcriptomics revealed overexpression in tcaA, associated with reduced glycopeptide resistance, as well as in dltA and mprF related to daptomycin-glycopeptide resistance. Looking uniquely at glycopeptide resistance, our data indicate that tcaA can have an impact on the level of teicoplanin resistance in terms of MIC values rather than on teicoplanin resistance phenotype acquisition. This observation could seem in contrast with previous findings reporting that tcaA inactivation and tcaRAB deletion determine an increase in teicoplanin resistance [22,23]. These data speculatively implicate that if tcaRAB inactivation increased teicoplanin resistance, on the contrary, an overexpression should decrease teicoplanin resistance. Our data show tcaA overexpression in the teicoplanin-resistant 1-R (TEC MIC 32 mg/L) versus its teicoplanin-susceptible parent 1-S, indicating a positive association with increased teicoplanin resistance. Therefore, the role of tcaA genes in teicoplanin resistance is still not fully clarified.
In S. aureus, daptomycin resistance and reduced susceptibility to vancomycin are often associated with multifactorial mechanisms [24,25,26,27]. Our data confirm dltA and mprF overexpression as the basis of a mechanism of electrostatic repulsion responsible for daptomycin resistance in MRSA, as previously published [24,25,26,27]. dltA and mprf determine an alteration of the surface envelope by alanylation and lysinylation teichoic acids as well as in the membrane phosphatidylglycerol, responsible for increased positive net charge that blocks DAP docking to its target [24,26]. From these new RNA-seq experiments, dltA and mprF overexpression were clearly, statistically significant and differentially expressed in 1-R with respect to 1-S. These data contrasted with our previous findings, likely due to the different methodology used [17].
Furthermore, in VISA DAP-R CA-MRSA, other traits associated, as expected, with other AMR-resistance traits were found. These were acquired resistant SNPs related to rifampin resistance (rpoB), and dysregulation in murF related to D-cycloserine resistance, in norA and norB implicated in FQ-resistance, and tet38 involved in tetracycline-resistance.
Focusing on virulence, virulomics revealed the characteristic huge virulence potential of VISA DAP-R CA-MRSA due to a great pool of virulence-related genes conferring potentially extraordinary abilities of adherence, anti-phagocytosis, immune system evasion and toxigenicity in agreement with previously published data [28].
However, new consideration arises from our data regarding the presence of a stop codon compensatory modulatory mutation in agrA. This allows the CA-MRSA genomic background to shift towards a wide AMR phenotype. The agrA compensatory regulatory mutation, associated or not to the dysregulation in the master regulators (vraRS, sigB, saeR, rot overexpression and walKR, srrA, agrBCA, sarS, graR underexpression), confers the ability to drastically decrease CA-MRSA toxigenicity to adapt the strain to support the antimicrobial resistance burden needed for maintaining extensive AMR. A stop codon, as a “compensatory regulatory mutation” leading to a 170 AA residue truncated AgrA, acts with a “double smart strategy”. The former is as an “agr quorum-sensing silencer”, the latter is a “virulence-modulator”. It is well known that agr-locus positively regulates the production of numerous toxin-coding genes by antisense regulatory RNA-III and negative adhesion [29]. AgrA is the histidine kinase receptor of the agr-system involved in the regulation of S. aureus virulence in response to bacterial cell density. Truncated AgrA is crucial and strategic to block the cascade leading to the activation/repression of the regulatory pathways related both to toxigenicity and antimicrobial resistance. Virulence-related transcriptomic data confirmed that AgrA non-functionality is concomitant with the underexpression of the agr-locus, hemolysin coding genes (hla,hld,hlgB/C) and enterotoxins (seh, MW1552), and is further supported by the lack of delta-hemolysin production ability.
Moreover, these data confirmed other results that clearly demonstrate that VISA or DAP-R MRSA is typically associated with the decreased agr-functionality frequently showed in agr-II MRSA with increased and extensive AMR [17,24,25,26,27].
Focusing on biological fitness costs, resistant bacteria pay biological fitness costs for their changes that can diminish their growth rate; our data could appear in contrast with this observation as our VISA DAP-R CA-MRSA showed different strategies to balance the AMR fitness costs [16,30]. VISA DAP-R CA-MRSA faces AMR fitness costs by increasing the generation time compensated with an extension of the lag growth phase that restores the growth kinetics of more susceptible S. aureus. Additionally, two strategies of transcriptomic adaptations were evidenced. VISA DAP-R CA-MRSA was able to balance the biological costs shifting the transcriptional rate as follows: (i) an underexpression trend in differentially expressed genes, including numerous accessory virulence-related genes, i.e., toxin genes (as discussed above), adhesin genes (sdrC, sdrD, eap/map), type VII secretion system genes (esaA), membrane-acting toxin and superantigen genes (spa), exoenzyme genes (lip, splB), immune-modulatory genes coding for the capsular antigens (cap8C/G/P), immunodominant staphylococcal antigen B (isaB) and biofilm production (icaA), confirmed by the lack of biofilm production; (ii) dysregulation of several essential primary metabolic pathways (glycolysis, gluconeogenesis, microbial metabolism in diverse environments, mismatch repair, homologous recombination and DNA replication) and master transcriptional regulators (overexpression in vraRS, sigB, saeR and rot and underexpression in walKR, srrA, agrBCA, sarS and graR).

4. Conclusions

Our data reveal that convergent evolution, exerted by environmental selective pressure, selects MRSA hybrid variants with extensive antimicrobial resistance towards the last resort antimicrobials, i.e., glycopeptides and daptomycin, within “decreased hypervirulent” CA-MRSA by a balanced pool of adaptations supporting and maintaining the burden of enhanced antimicrobial resistance.
This mechanism is very interesting and to be taken into consideration as it could determine the selection of new hybrid variants that are “extremely dangerous” in the potential severity of infections and in the therapeutical options that could dramatically complicate the future scenario of bacterial infection management.

5. Materials and Methods

5.1. Bacterial Strains

One S. aureus isogenic strain-pair (1-S and 1-R) of ST-1, agr-III, delta-hemolysin negative, was recovered from a patient hospitalized in an Italian hospital, as previously described [17]. Briefly, a 69-year-old female patient was admitted on 30th of March 2012 to the coronary care unit (CCU) with fever and cardiac decompensation due to mitralic and aortic valve insufficiency. Echocardiography revealed infective endocarditis (IE) on the native mitral and biological aortic valves, and the 1-S MRSA was isolated from blood cultures. Treatment with intravenous (IV) teicoplanin plus gentamycin was begun with initial defervescence. On the 11th day of treatment, the patient was again febrile, and blood cultures yielded a second MRSA (1-R strain) with daptomycin and vancomycin resistance. Vancomycin and gentamycin were then suspended, and IV quinupristin/dalfopristin (Q/D) was prescribed. However, because of the initial unavailability of this drug, IV linezolid was administered for 10 days. Later, Q/D was again available and administered alone for 4 more weeks. During the latter treatment, blood cultures were negative, and the patient was afebrile. However, at the end of this antibiotic treatment, the patient developed a central venous catheter (CVC)-related infection due to Stenotrophomonas maltophilia and had fatal septic shock, as previously described [17]. In detail, the first (1-S) MRSA strain was susceptible to vancomycin, teicoplanin, daptomycin, linezolid, trimethoprim/sulfamethoxazole and rifampin but resistant to cefoxitin (CFX), ampicillin, amoxicillin/clavulanate, fluoroquinolones, erythromycin, clindamycin and tetracycline. On the contrary, the second isogenic MRSA (1-R), isolated under teicoplanin therapy, was characterized by additional resistance to glycopeptides and daptomycin according to the EUCAST guidelines 2021 [31]. The antimicrobial susceptibility and molecular characterization were in part, previously characterized [17] and reported in Table 2 and Table 3.

5.2. Biological Costs Determined by the Growth Kinetics Test

The 1-S and 1-R MRSA strains were tested for maximum growth rate and length of the lag growth phase. Both MRSA strains were inoculated in Mannitol Salt Agar (MSA) (Oxoid) plates and incubated overnight at 37 °C. One colony of each isolate was resuspended in phosphate-buffered saline and diluted to an optical density of 0.05 at 600 nm. In total, 1 mL of each suspension was then added to 50 mL of BHI broth. Optical density readings at 600 nm were taken every 30 min over 6 h and plotted against time. The generation time was considered the time it takes for bacterial population duplication, and the lag phase duration was at the beginning of the maximum growth rate. Generation time and lag growth phase duration for 1-S and 1-R were compared by the independent samples t-test, and a p-value ≤ 0.05 was considered the cut-off of statistical significance. This experiment was repeated three times, and CA-MRSA MW2 and S. aureus ATCC29213 were used as controls [32].

5.3. Biofilm Production

1-S and 1-R MRSA strains were tested for their ability to produce biofilm by a spectrophotometric quantitative assay. Each strain was grown in Tryptone Soy Broth (Oxoid, Basingstoke, UK), with the addition of 0.25% glucose (TSBG), and biofilm production assays were performed in microtiter plates as previously described [33].

5.4. Whole-Genome Sequencing

Genomic DNA was extracted using the PureLink Genomic DNA Mini Kit (Invitrogen, Waltham, MA, USA) following the manufacturer’s protocol. DNA quality was evaluated by Qubit, and its concentration was determined by Picogreen (Life Technologies, Carlsbad, CA, USA). Whole-genome sequencing (WGS) was performed using the Illumina Mi-Seq sequencing system, using both a paired-end library with 150 bp reads (400 bp average insert size) and a mate-pair library with 250 bp reads (8 kb average insert size). After the sequence data generation, raw reads were processed by Fast QC (v0.11.7) to assess data quality, and the Trimmomatic tool (v0.38) was used to remove sequencing adapters for paired end reads to filter low-quality bases (Q_score < 30) and short reads (<150 bp) as well as for mate pair reads to the process by requiring a minimum base quality of 20 (Phred scale) and a minimum read length of 100 nucleotides to filter out sequences composed only by Ns and to improve the per base score of the mate pair reads. The total number of PE and MP reads is reported with the estimated coverage in Supplementary Table S1. The trimmed reads were used for downstream analysis [27,34].

5.5. De-Novo Genome Assembly

De novo genome assembly was performed using SPAdes software (v3.12.0). Reads were initially normalized with khmer 1.3, and then they were error-corrected using the Bayesian Hammer utility of SPAdes. Finally, assembly was performed using the recommended parameters for such Illumina data. The SPAdes software produced a contigs file for each sample, post-assembly controls and metrics were evaluated using Quast software (v4.6.3) and are presented in Supplementary Table S2 [27,34].

5.6. Gene Annotation

The assembled contigs were processed using Prokka software (1.14.6) to predict genes and annotate those sequences using a core set of conserved prokaryotic genes [27,34].

5.7. Single Nucleotide Variants (SNVs)

For SNVs, genomic re-sequencing was performed from the paired-end library raw reads as already published [27,34]. Briefly, Illumina raw reads were trimmed by the Trimmomatic tool (v0.38), requiring a minimum base quality of 20 (Phred scale) and a minimum read length of 36 nucleotides. Only trimmed reads were included in the downstream analysis. Each sample was aligned by BWA v. 0.7.5 on S. aureus MW2 (BA000033.2) and used as a reference genome. Each .bam file was sorted by Samtools (v.0.1.19), and duplicate reads were marked using the Picard Mark Duplicates utility. Complex variants, SNVs and indels were detected by “Freebayes” (v.0.9.14), requiring a minimum mapping quality of 25 (Phred scale) and a minimum base quality of 30.
Sequenced reads were properly aligned with the reference genome, 97.28% for 1-S and 97.29% for 1-R.
To select only SNVs present in the VISA DAP-R- CA-MRSA, wg nsSNVs were computationally filtered versus those present in the VSSA DAP-S CA-MRSA parent. All non-synonymous SNPs present in COL-R isolates were confirmed by Sanger sequencing.

5.8. Whole-Genome Single Nucleotide Polymorphisms (wgSNPs) Effect Prediction

wgSNPs effect prediction was evaluated using snpEff (v.4.3T). High (HI), low (LI), moderate (MI) or modifier impact (MFI) was assigned according to the criteria previously published [35]. In detail: high impact: the variant is assumed to have disruptive impact, probably causing protein truncation, loss of function or triggering nonsense-mediated decay; low impact: assumed to be mostly harmless or unlikely to change protein behavior; moderate impact: a non-disruptive variant that might change protein effectiveness; modifier impact: usually non-coding variants or variants affecting non-coding genes where predictions are difficult, or there is no evidence of impact [34]. Only high (HI) and moderate (MI) effect wgSNPs were considered and, consequently, described.

5.9. Phylogeny and Genomic Epidemiology

The whole-genome sequencing raw data were evaluated by free tools of the Center for Genomic Epidemiology (CGE, http://www.genomicepidemiology.org/, accessed on 1 July 2022) to investigate the genetic and molecular features of the strain-pair. In detail, spaTyper (v1.0) was used to determine the staphylococcal protein A (spa) type of each strain, SCCmecFinder (v1.2) identified the staphylococcal cassette chromosome mec (SCCmec), PlasmidFinder (v2.0) was used for plasmid search, PHAge Search Tool (PHAST) was used considering only the prophage regions detected with a completeness score >90 to detect the prophages, VirulenceFinder (v2.0) was used to identify the virulence factors to define the Virulome and ResFinder (v3.2) was used for the detection of the acquired antimicrobial resistance genes [36,37,38,39,40,41,42]. Analyses were performed with default setting parameters.

5.10. RNA-Seq

5.10.1. RNA-Seq Bacterial Cultures

An aliquot of an overnight culture was diluted 1:50 in 30 mL of brain heart infusion (BHI) in a sterile 50 mL flask (OD600 nm 0.05) to obtain approximately 5 × 10⁵ CFU/mL inoculum for each strain. Cells were grown under shaking at 250 rpm with normal atmospheric conditions at 37 °C and harvested in the exponential growth phase (OD600 0.5, 2 × 10⁸ CFU/mL ∼ 3–4 h). RNA extraction started immediately after cell harvesting to maintain RNA integrity. The cell density was determined by colony counting after plating onto Mueller–Hinton (MH) agar and incubation.

5.10.2. RNA-Seq Libraries

RNA-seq was carried out using the Illumina Mi-seq sequencing platform. To improve RNA-seq data, two replicates using two different libraries were conducted, a Single-End Library with 50 bp reads (SI, Short-Insert Library) and a Paired-end Read Library with 150 bp reads (TS, Tru-Seq Library) and an average insert size of 350/400 bp.

5.10.3. RNA-Extraction

Specific RNA extractions for the Tru-Seq Library and Short-Insert Library preparation were performed according to the specific protocols, as a strategy to optimize the collected RNA-seq data, as previously published [27,34].

5.10.4. Tru-Seq Library Preparation

The total RNA quality was verified using a 2200 TapeStation RNA Screen Tape device (Agilent, Santa Clara, CA, United States), and its concentration was ascertained using an ND-1000 spectrophotometer (NanoDrop, Wilmington, DE, United States). The Agilent TapeStation 2200 system, an automated instrument for nucleic acid gel electrophoresis, assigned RNA integrity number (RIN) values ranging from 1 to 10, with 10 being the highest quality. Only samples with preserved 16S and 23S peaks and RIN values > 8 were used for the library’s construction. The RIN values > 8 indicate intact and high-quality RNA samples for downstream applications, as previously published [27,34]. Ribosomal RNA was removed using the Bacteria Ribo-Zero rRNA Removal Kit from 2 μg of RNA. The depleted RNA was used for the Illumina Truseq RNA stranded kit without PolyA enrichment. The obtained libraries were evaluated with high-sensitivity D1000 screen Tape (Agilent Tape Station 2200), and the indexed libraries quantified with the ABI9700 qPCR instrument using the KAPA Library Quantification Kit in triplicates was according to the manufacturer’s protocol (Kapa Biosystems, Woburn, MA, United States). From the pooled library, 2 nm final concentrations were used for sequencing with a 150 PE read sequencing module [27,34].

5.10.5. Short-Insert Library Preparation

After ribosomal depletion, sequencing libraries were created using the Illumina mRNA-seq sample preparation kit following the supplier’s instructions, except that total RNA was not fragmented, and double-stranded cDNA was size-selected (100–400 bp) to maximize the recovery of small-size RNA. The prepared libraries were valued with high-sensitivity D1000 screen Tape (Agilent Tape Station 2200), as described for the TS Library. The indexed libraries were quantified in triplicate with the ABI7900 qPCR instrument using the KAPA Library Quantification Kit, according to the manufacturer’s protocol (Kapa Biosystems, Woburn, MA, United States). From the pooled library, 5 μL at a final concentration of 4 nM were utilized for MiSeq sequencing with an A single-end stranded library with reads of a 50-bp sequencing module [27,34].

5.10.6. Tru-Seq Library Raw Read Post-Processing

After sequence data generation, raw reads were processed using FastQC (v.0.11.2) to assess data quality. The sequenced reads were then trimmed using Trimmomatic (v.0.33.2) to remove only sequencing adapters for PE reads. A minimum base quality of 15 (Phred scale) over a four-base sliding window was required. Only sequences with a length above 36 nucleotides were included in the downstream analysis, and likewise, only trimmed reads were included in the downstream analysis [27,34].

5.10.7. Short-Insert Library Raw Read Post-Processing

After sequence data generation, raw reads were processed using FastQC (v.0.11.2) to assess data quality. Reads were then trimmed using Trimmomatic (v.0.33.2) to remove sequencing adapters for single-end reads, requiring a minimum base quality of 15 (Phred scale) and a minimum read length of 15 nucleotides. Only trimmed reads were included in the downstream analysis [27,34].

5.10.8. Tru-Seq and Short-Insert Read Analysis

TS and SI RNA-seq reads were annotated on S. aureus MW2 (BA000033.2) used as RefGen, as well as transcripts assembled and quantified using Rockhopper (v.2.03) [27,34]. Analyses were run using default parameter settings with verbose output to obtain expression data. Rockhopper normalizes read counts for each sample using the upper quartile gene expression level. Starting from the p-values calculated according to the Anders and Huber approach, differentially expressed genes (DEGs) were assigned by computing q-values ≤ 0.01 based on the Benjamini–Hochberg correction with a false discovery rate of <1%. In addition, Rockhopper is a versatile tool using biological replicates when available and surrogate replicates when biological replicates for two different conditions are unavailable, considering the two conditions under investigation as surrogate replicates for each other [27,34].

5.11. DAVID Enrichment Analysis

The online tool DAVID (v.6.8) (http://david.abcc.ncifcrf.gov/ accessed on 1 July 2022) was used to detect affected pathways among DEGs. The gene lists of the strain-pair, grouped according to over- and underexpressed genes, were uploaded as Official Gene Symbols of the S. aureus MW2 reference genome, automatically selecting the list type (Gene list) of S. aureus. The Functional Annotation Chart was obtained using an EASE score threshold ≤0.5 and a minimum count number of four genes. The DAVID Functional Categories were investigated by the KEGG pathway and PANTHER Classification System [43] and grouped in annotation clusters refined of the same genes.

5.12. Real-Time qPCR validation

To validate RNA-seq data, real-time qPCRs for a set of characterizing transcripts, murF, dltA, mprF, hld, hla, spa, agrA, icaA, and sdrD, were carried out in the same RNA-seq growth phase. Primer lists are provided in Tab.S3; gyrB was used as a normalizer gene. Real-time qPCRs and statistical analyses were carried out as previously published [31,32].

5.13. DNA-Sequencing and RNA-Sequencing Data Accession Number

The genomic and transcriptomic reads were deposited in the National Center for Biotechnology Information (NCBI) Genome database in the Sequence Read Archive (SRA) under the BioProject PRJNA860577 with the Biosample Genomic Paired End and RNA-seq raw sequences n° SAMN29849119, SAMN29849120 and with Biosample Genomic mate-pair draft sequences n°SAMN30428603, SAMN30428604.

Supplementary Materials

The following are available online at https://www.mdpi.com/article/10.3390/antibiotics11091159/s1, Table S1: Total number of paired end and mate pair reads and Estimated Coverage Generated by the Trimming after the sequencing process, Table S2A,B: Summary Table of Post-Assembly Statistics and Metrics generated using the Quast software, Table S3. Primer set used in real time qPCR Validation.

Author Contributions

All authors contributed to the manuscript. V.C. conceived and designed the study. V.C., R.S., A.Z., E.A. and F.L.V. performed the genomics, transcriptomics and bioinformatics analysis. G.P. contributed to the bioinformatics analysis. S.S. critically revised the manuscript. All authors have read and agreed to the published version of the manuscript.

Funding

This study was supported by a research grant, PRIN2017SFBFER, from MIUR, Italy. “Starting Grant” of the “Piano di incentivi per la ricerca di Ateneo” Prot. n. 253556 del 16 marzo 2021, University of Catania.

Institutional Review Board Statement

Not applicable.

Informed Consent Statement

Not applicable.

Data Availability Statement

Genomic and transcriptomic reads can be found in National Center for Biotechnology Information (NCBI) Genome database in the Sequence Read Archive (SRA) under the BioProject PRJNA860577 with the Biosample Genomic Paired End and RNA-seq raw sequences n° SAMN29849119, SAMN29849120 and with Biosample Genomic mate-pair draft sequences n°SAMN30428603, SAMN30428604.

Acknowledgments

We wish to thank the Scientific Bureau of the University of Catania (Italy) for language support services.

Conflicts of Interest

The authors declare no conflict of interest.

References

  1. WHO. WHO Publishes List of Bacteria for which New Antibiotics Are Urgently Needed. 2017. Available online: https://www.who.int/news/item/27-02-2017-who-publishes-list-of-bacteria-for-which-new-antibiotics-are-urgently-needed (accessed on 1 January 2020).
  2. Patel, R.M.D. Biofilms and Antimicrobial Resistance. Clin. Orthop. Relat. Res. 2005, 437, 41–47. [Google Scholar] [CrossRef] [PubMed]
  3. Seral, C.; Van Bambeke, F.; Tulkens, P.M. Quantitative analysis of gentamicin, azithromycin, telithromycin, ciprofloxacin, moxifloxacin, and oritavancin (LY333328) activities against intracellular Staphylococcus aureus in mouse J774 macrophages. Antimicrob. Agents Chemother. 2003, 47, 2283–2292. [Google Scholar] [CrossRef] [PubMed]
  4. Barbosa, T.M.; Levy, S.B. Differential expression of over 60 chromosomal genes in Escherichia coli by constitutive expression of MarA. J. Bacteriol. 2000, 182, 3467–3474. [Google Scholar] [CrossRef] [PubMed]
  5. Tsai, Y.K.; Fung, C.P.; Lin, J.C.; Chen, J.H.; Chang, F.Y.; Chen, T.L.; Siu, L.K. Klebsiella pneumoniae outer membrane porins OmpK35 and OmpK36 play roles in both antimicrobial resistance and virulence. Antimicrob. Agents Chemother. 2011, 55, 1485–1493. [Google Scholar] [CrossRef] [PubMed]
  6. Moya, B.; Juan, C.; Albertí, S.; Pérez, J.L.; Oliver, A. Benefit of having multiple ampD genes for acquiring beta-lactam resistance without losing fitness and virulence in Pseudomonas aeruginosa. Antimicrob. Agents Chemother. 2008, 52, 3694–3700. [Google Scholar] [CrossRef] [PubMed]
  7. Yeung, A.T.; Bains, M.; Hancock, R.E. The sensor kinase CbrA is a global regulator that modulates metabolism, virulence, and antibiotic resistance in Pseudomonas aeruginosa. J. Bacteriol. 2011, 193, 918–931. [Google Scholar] [CrossRef]
  8. David, M.Z.; Daum, R.S. Community-associated methicillin-resistant Staphylococcus aureus: Epidemiology and clinical consequences of an emerging epidemic. Clin. Microbiol. Rev. 2010, 23, 616–687. [Google Scholar] [CrossRef]
  9. Cuny, C.; Lothar, H.W.; Wolfgang, W. Livestock-Associated MRSA: The Impact on Humans. Antibiotics 2015, 4, 521–543. [Google Scholar] [CrossRef]
  10. Yamaguchi, T.; Ando, R.; Matsumoto, T.; Ishii, Y.; Tateda, K. Association between cell growth and vancomycin resistance in clinical community-associated methicillin-resistant Staphylococcus aureus. Infect. Drug Resist. 2019, 12, 2379–2390. [Google Scholar] [CrossRef]
  11. Almeida, S.T.; Paulo, A.C.; Babo, J.; Borralho, J.; Figueiredo, C.; Gonçalves, B.; Lança, J.; Louro, M.; Morais, H.; Queiroz, J.; et al. Absence of methicillin-resistant Staphylococcus aureus colonization among immunocompetent healthy adults: Insights from a longitudinal study. PLoS ONE 2021, 16, e0253739. [Google Scholar]
  12. Burrus, V.; Waldor, M.K. Shaping bacterial genomes with integrative and conjugative elements. Res. Microbiol. 2004, 155, 376–386. [Google Scholar] [CrossRef] [PubMed]
  13. Handel, A.; Regoes, R.R.; Antia, R. The role of compensatory mutations in the emergence of drug resistance. PLoS Comput. Biol. 2006, 2, e137. [Google Scholar] [CrossRef] [PubMed]
  14. Turner, N.A.; Sharma-Kuinkel, B.K.; Maskarinec, S.A.; Eichenberger, E.M.; Shah, P.P.; Carugati, M.; Holland, T.L.; Fowler, V.G., Jr. Methicillin-resistant Staphylococcus aureus: An overview of basic and clinical research. Nat. Rev. Microbiol. 2019, 17, 203–218. [Google Scholar] [CrossRef] [PubMed]
  15. McGuinness, W.A.; Malachowa, N.; DeLeo, F.R. Vancomycin Resistance in Staphylococcus aureus. Yale J. Biol. Med. 2017, 90, 269–281. [Google Scholar]
  16. Singh, A.; Singh, S.; Singh, J.; Rahman, M.; Pathak, A.; Prasad, K.N. Survivability and fitness cost of heterogeneous vancomycin-intermediate Staphylococcus aureus. Indian J. Med. Microbiol. 2017, 35, 415–416. [Google Scholar] [CrossRef]
  17. Capone, A.; Cafiso, V.; Campanile, F.; Parisi, G.; Mariani, B.; Petrosillo, N.; Stefani, S. In Vivo development of daptomycin resistance in vancomycin-susceptible methicillin-resistant Staphylococcus aureus severe infections previously treated with glycopeptides. Eur. J. Clin. Microbiol. Infect. Dis. 2016, 35, 625–631. [Google Scholar] [CrossRef]
  18. Gillen, A.L.; Conrad, J.; Cargill, M. The Genesis and Emergence of Community-Associated Methicillin-Resistant Staphylococcus aureus (CA-MRSA): An Example of Evolution in Action? Answ. Res. J. 2015, 8, 391–401. [Google Scholar]
  19. Lindsay, J.A.; Holden, M.T. Staphylococcus aureus: Superbug, super genome? Trends Microbiol. 2004, 12, 378–385. [Google Scholar] [CrossRef]
  20. Malachowa, N.; DeLeo, F.R. Mobile genetic elements of Staphylococcus aureus. Cell. Mol. Life Sci. 2010, 67, 3057–3071. [Google Scholar] [CrossRef]
  21. Jamrozy, D.; Coll, F.; Mather, A.E.; Harris, S.R.; Harrison, E.M.; MacGowan, A.; Karas, A.; Elston, T.; Török, M.E.; Parkhill, J.; et al. Evolution of mobile genetic element composition in an epidemic methicillin-resistant Staphylococcus aureus: Temporal changes correlated with frequent loss and gain events. BMC Genom. 2017, 18, 684. [Google Scholar] [CrossRef]
  22. Maki, H.; McCallum, N.; Bischoff, M.; Wada, A.; Berger-Bächi, B. tcaA inactivation increases glycopeptide resistance in Staphylococcus aureus. Antimicrob. Agents Chemother. 2004, 48, 1953–1959. [Google Scholar] [CrossRef] [PubMed]
  23. Yoo, J.I.; Kim, J.W.; Kang, G.S.; Kim, H.S.; Yoo, J.S.; Lee, Y.S. Prevalence of amino acid changes in the yvqF, vraSR, graSR, and tcaRAB genes from vancomycin intermediate resistant Staphylococcus aureus. J. Microbiol. 2013, 51, 160–165. [Google Scholar] [CrossRef] [PubMed]
  24. Cafiso, V.; Bertuccio, T.; Purrello, S.; Campanile, F.; Mammina, C.; Sartor, A.; Raglio, A.; Stefani, S. dltA overexpression: A strain-independent keystone of daptomycin resistance in methicillin-resistant Staphylococcus aureus. Int. J. Antimicrob. Agents 2014, 43, 26–31. [Google Scholar] [CrossRef]
  25. Cafiso, V.; Bertuccio, T.; Spina, D.; Purrello, S.; Campanile, F.; Di Pietro, C.; Purrello, M.; Stefani, S. Modulating activity of vancomycin and daptomycin on the expression of autolysis cell-wall turnover and membrane charge genes in hVISA and VISA strains. PLoS ONE 2012, 7, e29573. [Google Scholar] [CrossRef] [PubMed]
  26. Mishra, N.N.; Bayer, A.S.; Weidenmaier, C.; Grau, T.; Wanner, S.; Stefani, S.; Cafiso, V.; Bertuccio, T.; Yeaman, M.R.; Nast, C.C.; et al. Phenotypic and genotypic characterization of daptomycin-resistant methicillin-resistant Staphylococcus aureus strains: Relative roles of mprF and dlt operons. PLoS ONE 2014, 9, e107426. [Google Scholar] [CrossRef]
  27. Cafiso, V.; Stracquadanio, S.; Lo Verde, F.; De Guidi, I.; Zega, A.; Pigola, G.; Stefani, S. Genomic and Long-Term Transcriptomic Imprints Related to the Daptomycin Mechanism of Action Occurring in Daptomycin-and Methicillin-Resistant Staphylococcus aureus Under Daptomycin Exposure. Front. Microbiol. 2020, 11, 1893. [Google Scholar] [CrossRef]
  28. Li, M.; Cheung, G.Y.; Hu, J.; Wang, D.; Joo, H.S.; DeLeo, F.R.; Otto, M. Comparative analysis of virulence and toxin expression of global community-associated methicillin-resistant Staphylococcus aureus strains. J. Infect. Dis. 2010, 202, 1866–1876. [Google Scholar] [CrossRef]
  29. Traber, K.E.; Lee, E.; Benson, S.; Corrigan, R.; Cantera, M.; Shopsin, B.; Novick, R.P. agr function in clinical Staphylococcus aureus isolates. Microbiology 2008, 154 Pt 8, 2265. [Google Scholar] [CrossRef]
  30. Beceiro, A.; Tomás, M.; Bou, G. Antimicrobial resistance and virulence: A successful or deleterious association in the bacterial world? Clin. Microbiol. Rev. 2013, 26, 185–230. [Google Scholar] [CrossRef]
  31. EUCAST. Available online: https://www.eucast.org/eucast_news/news_singleview/?tx_ttnews%5Btt_news%5D=459cHash=160a5b91371e598957e10178fb3aa143 (accessed on 1 July 2022).
  32. Ramadhan, A.A.; Hegedus, E. Survivability of vancomycin resistant enterococci and fitness cost of vancomycin resistance acquisition. J. Clin. Pathol. 2005, 58, 744–746. [Google Scholar] [CrossRef]
  33. Cafiso, V.; Bertuccio, T.; Santagati, M.; Demelio, V.; Spina, D.; Nicoletti, G.; Stefani, S. agr-Genotyping and transcriptional analysis of biofilm-producing Staphylococcus aureus. FEMS Immunol. Med. Microbiol. 2007, 51, 220–227. [Google Scholar] [CrossRef] [PubMed]
  34. Cafiso, V.; Lo Verde, F.; Zega, A.; Pigola, G.; Rostagno, R.; Borrè, S.; Stefani, S. Genomic Characterization of a New Biofilm-Forming and Adhesive ST398 Human-Adapted MSSA Lineage Causing Septic Knee Arthritis Following Surgical Reconstruction. Microorganisms 2021, 9, 305. [Google Scholar] [CrossRef]
  35. Cingolani, P.; Platts, A.; Wang, l.; Coon, M.; Nguyen, T.; Wang, L.; Land, S.J.; Lu, X.; Ruden, D.M. A program for annotating and predicting the effects of single nucleotide polymorphisms, SnpEff: SNPs in the genome of Drosophila melanogaster strain w1118; iso-2; iso-3. Fly 2012, 6, 80–92. [Google Scholar] [CrossRef] [PubMed] [Green Version]
  36. Zankari, E.; Hasman, H.; Cosentino, S.; Vestergaard, M.; Rasmussen, S.; Lund, O.; Aarestrup, F.M.; Larsen, M.V. Identification of acquired antimicrobial resistance genes. J. Antimicrob. Chemother. 2012, 67, 2640–2644. [Google Scholar] [CrossRef] [PubMed]
  37. Bartels, M.D.; Petersen, A.; Worning, P.; Nielsen, J.B.; Larner-Svensson, H.; Johansen, H.K.; Andersen, L.P.; Jarløv, J.O.; Boye, K.; Larsen, A.R.; et al. Comparing whole-genome sequencing with Sanger sequencing for spa typing of methicillin-resistant Staphylococcus aureus. J. Clin. Microbiol. 2014, 52, 4305–4308. [Google Scholar] [CrossRef]
  38. Joensen, K.G.; Scheutz, F.; Lund, O.; Hasman, H.; Kaas, R.S.; Nielsen, E.M.; Aarestrup, F.M. Real-time whole-genome sequencing for routine typing, surveillance, and outbreak detection of verotoxigenic Escherichia coli. J. Clin. Microbiol. 2014, 52, 1501–1510. [Google Scholar] [CrossRef]
  39. Carattoli, A.; Hasman, H. PlasmidFinder and in silico pMLST: Identification and typing of plasmid replicons in whole-genome sequencing (WGS). In Horizontal Gene Transfer; Humana: New York, NY, USA, 2020; pp. 285–294. [Google Scholar]
  40. Johansson, M.; Bortolaia, V.; Tansirichaiya, S.; Aarestrup, F.M.; Roberts, A.P.; Petersen, T.N. Detection of mobile genetic elements associated with antibiotic resistance in Salmonella enterica using a newly developed web tool: MobileElementFinder. J. Antimicrob. Chemother. 2021, 76, 101–109. [Google Scholar] [CrossRef]
  41. Zhou, Y.; Liang, Y.; Lynch, K.H.; Dennis, J.J.; Wishart, D.S. PHAST: A fast phage search tool. Nucleic Acids Res. 2011, 39, W347–W352. [Google Scholar] [CrossRef]
  42. Van Der Mee-Marquet, N.; Corvaglia, A.R.; Valentin, A.S.; Hernandez, D.; Bertrand, X.; Girard, M.; Kluytmansf, J.; Donnio, P.Y.; Francois, P. Analysis of prophages harboured by the human-adapted subpopulation of Staphylococcus aureus CC398. Infect. Genet. Evol. 2013, 18, 299–308. [Google Scholar] [CrossRef]
  43. Huang, D.W.; Sherman, B.T.; Lempicki, R.A. Systematic and integrative analysis of large gene lists using DAVID bioinformatics resources. Nat. Protoc. 2009, 4, 44–57. [Google Scholar] [CrossRef]
Figure 1. Phylogenetic SNP tree of 1-S and 1-R versus a representative group of HA-MRSA (Reference:SA-NCTC8325, SA-COL, SA-Mu3,SA-Mu50,SA-N315), and CA-MRSA (SA-USA-300 FPR3757, SA-USA-300TCH 1516, SA-MW2 USA-400).
Antibiotics 11 01159 g001
Figure 2. Real-time qPCR validation of RNA-seq data in 1-R vs. 1-S. Legend: * Statistically significant differentially expressed genes.
Antibiotics 11 01159 g002
Table 1. Generation times and lag growth phase kinetics.
StrainSccmec
Cassette
Agr-GroupDAP and Glycopeptide
Resistance
PVLGeneration
Time Average (min)
Lag Growth Phase
Duration Average (h)
1S CA-MRSAIVaIIIVSSA, DAP-S+301.0
1R CA-MRSAIvaIIIVISA, DAP-R+602.00
MW2 CA-MRSAIvaIIIVSSA, DAP-S+302.30
S. aureus ATCC 29213IIIIVSSA, DAP-S-302.25
Table 2. Antimicrobial patterns, δ-hemolysis and biofilm production.
StrainsMICBiofilmδ-hemolysis
CFXDAPVANTECRIF  
1-S320.511<0.06No ProducerNegative
1-R482832>256No ProducerNegative
MICs and δ-hemolysis data were previously published in Capone et al., 2016.
Table 3. Genomic, resistomic and virulomic characterization.
StrainMLSTPFGEAgr-TypeSpa-TypeSCCmecPlasmidsPhagesVirulomeResistomeResistance Gene SNPs
GeneNUCL.
Change
AA ChangeAMR
1-SST-1
[17]
USA 400
[17]
III
[17]
t127IVarep5a
(pN315)

rep7a
(repC-Cassette)

rep7c (MSSA476)

rep10 (pDLK1)

rep16 (pSAS)


Phage Staph
phiJB-NC028669

Phage Staph-ST398_4NC023499
ebpS, ebh, vwb, eap, atl, fib, spa, clfA, clfB vwb, fnbA, fnbB, eap, sdrC, sdrD, sdrE sdrH, icaRABC, cnaAdherenceAminoglycosides-R:
ant(6)-Ia, aph(3′)-III

β-lactams-R:
blaZ, mecA

Macrolides-R:
ermC

Tetracyclines-R:
tetK
gyrA251C > TS84LFQs
grlA239 C > TS80FFQs
hla, hlgACB, hld [17], hlb, eta, lukE, lukSF-PV, set2, set3, set16, set17, set18, set19 set20, set21, set22, set23 set25, set26, SEnt-ike, SEntHSEntA, sal, tstToxins 
sspABC, geh, nuc
hysA, lip, splABCF
sspB2, sak, scn
Exoenzyme
genes
 cap8J, cap8I, cap8H,
cap8G, capF, cap8E, capD, cap8C, cap8B, cap5A, isb, capD, cap8P, capC, capB,capA, cap8O, cap8M, cap8M, cap8L, cap8K, cap5M
Host Immune
Evasion
 essB, esaB, essA
esaA, esxA, esxB, esaC, essC
Secretion System
1-RST-1
[17]
USA 400
[17]
III
[17]

t127
IVarep5a
(pN315)

rep7a
(repC-Cassette)

rep7c (MSSA476)

rep10 (pDLK1)

rep16 (pSAS)


Phage Staph
phiJB-NC028669

Phage Staph-ST398_4NC023499
ebpS, ebh, vwb, eap, atl, fib, spa, clfA, clfB vwb, fnbA, fnbB, eap, sdrC, sdrD, sdrE sdrH, icaRABC, cnaAdherenceAminoglycosides-R:
ant(6)-Ia, aph(3′)-III

β-lactams-R:
blaZ, mecA

Macrolides-R:
ermC

Tetracyclines-R:
tetK
gyrA251C > TS84LFQs
grlA239 C > TS80FFQs
rpoB1441C > TH481YRIF [17]
mprF1033A > GT345ADAP [17]
hla, hlgACB, hld [17], hlb, eta, lukE, lukSF-PV, set2, set3, set16, set17, set18, set19 set20, set21, set22, set23 set25, set26, SEnt-ike, SEntHSEntA, sal, tstToxins 
sspABC, geh, nuc
hysA, lip, splABCF
sspB2, sak, scn
Exoenzyme
genes
 cap8J, cap8I, cap8H, cap8G, capF, cap8E, capDcap8C, cap8B, cap5A, isb, capDcap8P, capC, capB, capA, cap8O, cap8M, cap8M, cap8Lcap8K, cap5MHost Immune
Evasion
 essB, esaB, essA
esaA, esxA, esxB, esaC, essC
Secretion System 
Legend: [17] n° of the reference.
Table 4. HI nsSNPs in 1-R vs. 1-S on MW2 CA-MRSA RefGen mapping.
GeneProductnsSNPs
HI-nsSNPs
MW1125YfhO family proteinGly75 *
MW1482proline dipeptidaseThr265Ala
MW23478-amino-7-oxononanoate synthase (bioF)Glu272 *
MW1963Accessory gene regulator protein A (agrA)Arg170 *
Legend: * stop codon.
Table 5. MI nsSNPs in 1-R vs. 1-S on MW2 CA-MRSA RefGen mapping.
GeneProductnsSNPs
MI- nsSNPs
MW0014Cyclic-di-AMP phosphodiesteraseIle186Met
MW0165N-acetylmuramic acid 6-phosphate etheraseIle156Asn
MW0447Ribonuclease M5Asp98Glu
MW1054Exfoliative toxin ALeu47Ile
MW1080Pseudouridine synthaseGlu294Val
MW1664Peroxiredoxin osmotic stress-related proteinAsn87Lys
MW1826DUF2154 domain-containing protein VraTAla59Glu
MW2107D-ornithine--citrate ligase SfnaDLeu195Trp
MW2286Malate:quinone oxidoreductase 1Val280Glu
MW2393D-histidine (S)-2-aminobutanoyltransferase CntLGlu31Leu
MW2533HTH-type transcriptional regulatorGly41Asp
MW0131Capsular polysaccharide synthesis enzyme HTyr130Hys
MW0134Capsular polysaccharide synthesis enzyme KVal120Glu
MW2070Cobalt-zinc-cadmium resistance protein czcDAsp52Glu
MW1283Dihydrodipicolinate synthase DapAAla101Thr
MW1247Phosphatidylglycerol lysyl-transferase MprFThr345Ala Leu538Phe
MW2304Proton/sodium-glutamate symport proteinVal232Glu
MW1324Extracellular matrix-binding protein EbhVal1768Asp
MW2287L-lactate permease LctPIle178Phe
MW1307UDP-NAG--NAM-(pentapeptide) pyrophosphoryl-undecaprenol
N-acetylglucosamine transferase MurG
Ile121ASn
MW0497DNA-directed RNA polymerase subunit beta RpoBHis481Tyr
MW0517Serine-aspartate repeat-containing protein SdrDThr1313Ser
Table 6. DAVID enrichment analysis of the transcriptome DEGs in 1-R vs. 1-S.
Kegg PathwayGene Number in ClusterProductsp-Value
Annotation Cluster 1
Enrichment Score: 1.06
   
Glycolysis/Gluconeogenesis


Microbial metabolism
in diverse environments
12


17
6-phosphofructokinase (pfkA) MW1642
Acetate--CoA ligase (acsA) MW1676
Bifunctional acetaldehyde-CoA/alcohol dehydrogenase (adhE) MW0123
Glucose-6-phosphate isomerase (pgi) MW0844
Glucokinase (glcK) MW1499
Glyceraldehyde-3-phosphate dehydrogenase (gap) MW0734
Phosphoglycerate kinase (pgk) MW0735
Pyruvate kinase (pykA) MW1641
Triosephosphate isomerase (tpiA) MW0736
PTS system transporter subunit IIA (crr) MW1312
Fructose-1,6-bisphosphate aldolase (fdaB) MW2525
Phosphoglucomutase (pgcA) MW2411––
Glutamate-1-semialdehyde aminotransferase (gsaB) MW1804
Carbamate kinase (arcC) MW2553
Delta-aminolevulinic acid dehydratase (hemB) MW1612
Dipeptidase PepV (pepV) MW1694
Formate--tetrahydrofolate ligase (fhs) MW1675
Fructose-1,6-bisphosphate aldolase (fdaB) MW2525
Fumarate hydratase (fumC) MW1792
3-hexulose-6-phosphate synthase (hxlA) MW0525
Citrate synthase (citZ) MW 1639
Phosphoglucomutase (pgcA) MW2411
Glyoxalase MW2442
Malate:quinone oxidoreductase (mqo1) MW2286
Nitrate reductase subunit beta (narH) MW2318
Putative translaldolase (tal) Mw1721
Respiratory nitrate reductase subunit gamma (narI) MW2316
Sulfite reductase (NADPH) flavoprotein subunit alpha (cysJ) MW2540
Uroporphyrinogen III synthase (hemD) MW1613
3.2 × 10⁻²


2.3 × 10⁻¹
Annotation Cluster 2
Enrichment Score: 0.88
   
Mismatch repair
Homologous recombination
DNA replication
7ATP-dependent DNA helicase PcrA MW1846
ATP-dependent DNA helicase RecG (recG) MW1110
DNA polymerase III PolC (polC) MW1147
DNA polymerase III subunit delta (holA) MW1538
DNA repair protein RecO (MW1518)
DNA polymerase III subunit epsilon MW1835
DNA primase (SAOUHSC_01663)
NAD-dependent DNA ligase (lig) MW1845
Single-stranded-DNA-specific exonuclease RecJ MW1586
Recombination and DNA strand exchange inhibitor protein (mutS2) MW1027
4.3 × 10⁻²
2.1 × 10⁻¹
2.5 × 10⁻¹
Table 7. Antimicrobial resistance and virulence resistance related DEGs by transcriptomics.
Gene IDDescriptionRPKM 1-RExpression 1-RRPKM 1-SExpression 1-Sq-Value
AMR-RELATED TRAITS
Overexpression
MW2277Teicoplanin resistance-associated protein A (TcaA)3354000
MW0005DNA gyrase subunit B (GyrB)4268000
MW2005UDP-N-acetylmuramoylalanyl-D-glutamyl-2, 6-diaminopimelate-
D-alanyl-D-alanyl ligase (MurF)
3659000
MW0814D-alanine--poly(phosphoribitol) ligase subunit 1 (DltA)83135000
MW1247 Oxacillin resistance-related FmtC protein (MprF)2338000
Underexpression
MW0657Quinolone resistance protein (NorA)0014210
MW1325Quinolone resistance protein (NorB)0018260
MW0111Tetracycline resistance protein (Tet38)009300
VIRULENCE-RELATED TRAITS
Adhesion
Underexpression
MW0516Ser-Asp-rich fibrinogen-binding bone sialoprotein-binding protein SdrC0020300
MW0517Ser-Asp-rich fibrinogen-binding bone sialoprotein-binding protein SdrD0012180
MW1880 Truncated cell surface protein map-w (EapP/Map) 0011160
Effector delivery system
Underexpression
MW0259Type VII secretion protein EsaA0017260
Exotoxins
Underexpression
MW1959Delta-hemolysin (hld)00168525160
MW1044Alpha-hemolysin (hla)0021310
MW2344Gamma-hemolysin component B (hlgB)0021310
MW2343Gamma-hemolysin component C (hlgC)0038570
MW0051Enterotoxin H (seh)0028420
MW1552Enterotoxin homologous Protein0036375000
Membrane-acting toxin and Superantigen
Underexpression
MW0084Immunoglobulin G binding protein A precursor (SpA)0023346.92 × 10−94
Exoenzyme s
Underexpression
MW2590Triacylglycerol lipase precursor (Lip)007112.97 × 10−8
MW1754Serine protease SplB0028420
Immune modulatory proteins
Overexpression
MW0137 Capsular polysaccharide synthesis enzyme Cap8N127000
MW2341IgG-binding protein SBI (sbi)2440008.22 × 10−3
Underexpression
MW0126 Capsular polysaccharide synthesis enzyme Cap8C000201.01 × 10−3
MW0130 Capsular polysaccharide synthesis enzyme Cap8G000201.35 × 10−3
MW0139Capsular polysaccharide synthesis enzyme Cap8P0014210
MW2559Immunodominant antigen B (IsaB)00821220
Biofilm
Underexpression
MW2586Poly-beta-1,6-N-acetyl-D-glucosamine synthase icaA0013200
 
AMR AND VIRULENCE TRANSCRIPTIONAL REGULATORS
Overexpression
MW1824Two-component response regulator VraR232378000
MW1825Two-component sensor histidine kinase VraS270438000
MW1988 RNA polymerase sigma factor SigB267045.39 × 10−3
MW0668Response regulator SaeR89145000
MW1705Repressor toxin Rot72117001.87 × 10−3
Underexpression
MW0018Response regulatory protein WalR002700
MW0019Sensor protein kinase WalK002300
MW1446Respiratory response protein SrrA001392080
MW1960Accessory gene regulator B (AgrB)07307892.9 × 10−53
MW1962Accessory gene regulator C (AgrC)0082120
MW1963Accessory gene regulator A (AgrA)011277172.5 × 10−57
MW0085HTH-type transcriptional regulator SarS (SarS)0026390
MW0621 Response regulator protein GraR0032480
Publisher’s Note: MDPI stays neutral with regard to jurisdictional claims in published maps and institutional affiliations.

