Article

Modulation of Multiple Gene Clusters’ Expression by the PAS-LuxR Transcriptional Regulator PteF

by
Cláudia M. Vicente
1,2,3,
Tamara D. Payero
1,2,
Antonio Rodríguez-García
1,2,
Eva G. Barreales
1,
Antonio de Pedro
1,
Fernando Santos-Beneit
2,4 and
Jesús F. Aparicio
1,*
1
Department of Molecular Biology, Area of Microbiology, Faculty of Biology, Universidad de León, 24071 León, Spain
2
Institute of Biotechnology INBIOTEC, Parque Científico de León, Avda. Real, No 1, 24006 León, Spain
3
Toulouse Biotechnology Institute (TBI), CNRS, INRAE, INSA, Université de Toulouse, 31077 Toulouse, France
4
Environmental Technology, Institute of Sustainable Processes, University of Valladolid, 47011 Valladolid, Spain
*
Author to whom correspondence should be addressed.
Antibiotics 2022, 11(8), 994; https://doi.org/10.3390/antibiotics11080994
Submission received: 28 June 2022 / Revised: 17 July 2022 / Accepted: 22 July 2022 / Published: 24 July 2022

Abstract

:
PAS-LuxR transcriptional regulators are conserved proteins governing polyene antifungal biosynthesis. PteF is the regulator of filipin biosynthesis from Streptomyces avermitilis. Its mutation drastically abates filipin, but also oligomycin production, a macrolide ATP-synthase inhibitor, and delays sporulation; thus, it has been considered a transcriptional activator. Transcriptomic analyses were performed in S. avermitilis ΔpteF and its parental strain. Both strains were grown in a YEME medium without sucrose, and the samples were taken at exponential and stationary growth phases. A total of 257 genes showed an altered expression in the mutant, most of them at the exponential growth phase. Surprisingly, despite PteF being considered an activator, most of the genes affected showed overexpression, thereby suggesting a negative modulation. The affected genes were related to various metabolic processes, including genetic information processing; DNA, energy, carbohydrate, and lipid metabolism; morphological differentiation; and transcriptional regulation, among others, but were particularly related to secondary metabolite biosynthesis. Notably, 10 secondary metabolite gene clusters out of the 38 encoded by the genome showed altered expression profiles in the mutant, suggesting a regulatory role for PteF that is wider than expected. The transcriptomic results were validated by quantitative reverse-transcription polymerase chain reaction. These findings provide important clues to understanding the intertwined regulatory machinery that modulates antibiotic biosynthesis in Streptomyces.

1. Introduction

Polyene macrolide antifungals are natural products produced by Streptomycetes and related bacteria. These are filamentous soil-dwellers that undergo a complex life cycle involving differentiation and sporulation and they are well known for their ability to produce an impressive array of bioactive compounds. The control of these compounds’ production is a rather complex process involving multiple levels of intertwined regulation. Typically, the lowest level is governed by pathway-specific transcriptional regulators, which are encoded within the respective biosynthetic gene clusters.
PAS-LuxR regulators are transcription factors that combine an N-terminal PAS sensory domain [1] with a C-terminal helix-turn-helix (HTH) motif of the LuxR type for DNA-binding [2]. The sensory domain is thought to detect a physical or chemical stimulus and regulate, in response, the activity of the effector domain [3]. The archetype of this class of regulators, PimM, was first identified in the antifungal pimaricin biosynthetic gene cluster from Streptomyces natalensis [4]. It was characterized as a transcriptional activator of pimaricin biosynthesis because antifungal production was abolished upon gene deletion, and later, its mode of action was characterized at the molecular level [5]. Since its discovery, homologous regulatory proteins have been found to be encoded in all the known biosynthetic gene clusters of antifungal polyketides (polyenes), and they have been shown to be functionally equivalent, to the extent that the production of pimaricin is restored in S. natalensis ΔpimM upon the introduction of heterologous regulators of the PAS-LuxR class, such as nysRIV (nystatin), amphRIV (amphotericin), or pteF (filipin), into the strain [6]. Furthermore, the introduction of a single copy of pimM into the amphotericin-producing strain S. nodosus, into the filipin-producing strain S. avermitilis, or into the rimocidin producing strain S. rimosus, boosted the production of all polyenes, thus indicating that these regulators are fully exchangeable [6]. Interestingly, these regulatory proteins have only been found to be encoded in polyene gene clusters, in which they participate as the final transcriptional regulator of the regulatory cascade leading to antifungal biosynthesis.
Although PAS-LuxR regulators were initially considered pathway-specific transcriptional regulators due to their location in the chromosome, recent results have shown that they should be considered regulators with a wider range of implications. The canonical operator of PimM was used to search for putative targets of the orthologous protein PteF in the genome of S. avermitilis, finding multiple binding sites located inside or upstream from genes involved in different aspects of both primary and secondary metabolism [7], thus suggesting that the regulator could govern those processes. These included genetic information processing, DNA replication and repair, energy metabolism, carbohydrate metabolism, lipid metabolism, morphological differentiation, transcriptional regulation, and secondary metabolite biosynthesis, among others. Several of these operators were selected, and their binding to PimM DNA-binding domain was demonstrated by electrophoretic mobility shift assays (EMSAs). As a proof of concept, the biosynthesis of the ATP-synthase inhibitor oligomycin, whose gene cluster included two operators, was studied [7]. The pteF-deleted mutants, who showed a severe loss of filipin production and delayed spore formation in comparison to that of the wild-type strain [8], also showed a severe loss of oligomycin production and reduced expression of olm genes. Gene complementation of the mutant restored the phenotype; thus, PteF was able to co-regulate the biosynthesis of two related secondary metabolites, the polyketide macrolides filipin and oligomycin [7]. Therefore, this cross-regulation could be extended to all the clusters where operators were found, which suggests that PAS-LuxR regulators may affect a plethora of processes previously unforeseen. In this sense, the introduction of PAS-LuxR regulatory genes into different Streptomyces hosts has already proven useful for the awakening of dormant secondary metabolite biosynthetic genes [9,10].
Herein, we have used microarrays to study the transcriptome of an S. avermitilis ΔpteF mutant in comparison with that of its parental strain in order to deepen our knowledge about the processes in which PteF is involved, corroborating our previous results and providing the first evidence that PAS-LuxR regulators can behave as wide domain regulators and control the expression of multiple genes, either directly or indirectly, not only related to secondary metabolism but also to essential cellular functions. Their implication in the regulation of several secondary metabolite gene clusters is particularly noteworthy.

2. Results and Discussion

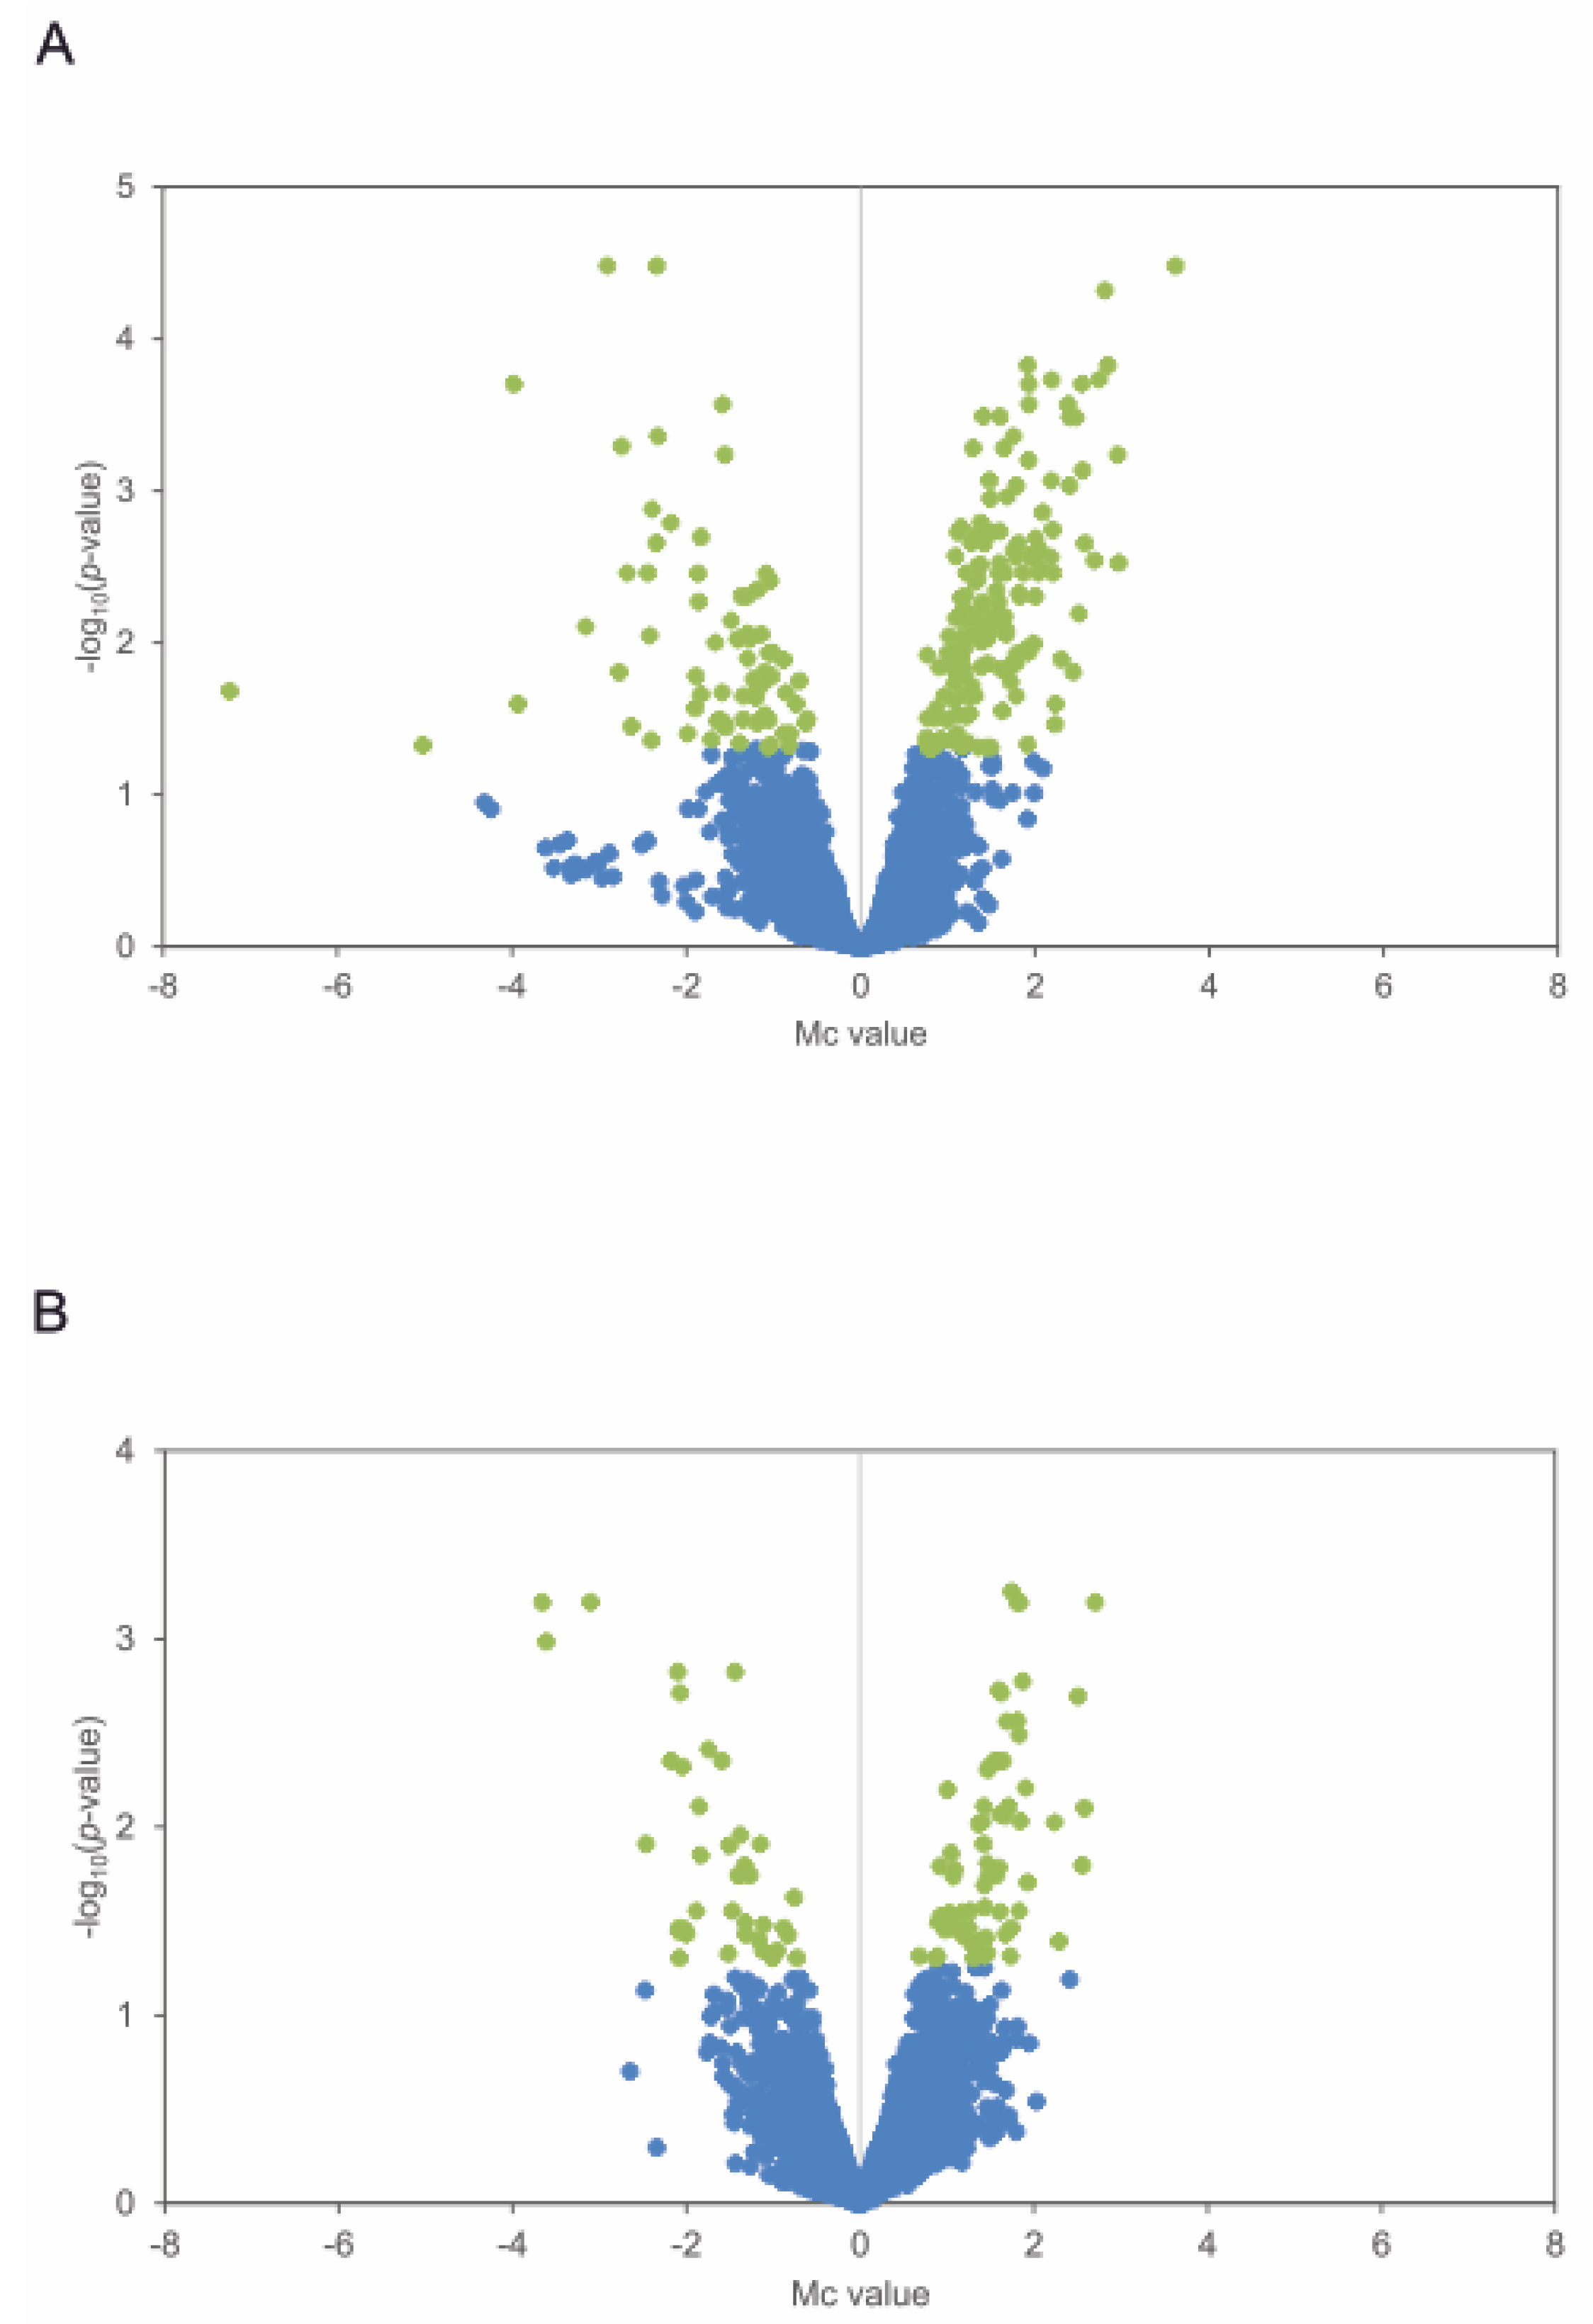
2.1. Identification of Genes with an Altered Expression Profile in S. avermitilis ΔpteF Mutant

S. avermitilis ΔpteF and its parental strain S. avermitilis NRRL 8165 were grown in a YEME medium without sucrose, and samples were taken at the end of the exponential and at the middle of the stationary growth phases (Figure 1). A transcriptomic analysis was performed by microarray hybridization to assess the genes with an altered expression in the mutant when compared with the parental strain at two different times during the growth curve. Given that PteF has been demonstrated to control filipin and oligomycin production as well as have an impact on sporulation [7,8], the sampling times were selected to coincide with the onset of secondary metabolite production and with the metabolic changes linked with morphological differentiation, namely, at the end of exponential phase (t1) and early stationary phase of growth (t2). The genomic DNA was used as a universal reference for all the hybridizations. A result was considered statistically significant if the BH-corrected p-value was <0.05. It is worth noting that these conditions are quite stringent, given that the genes that constituted direct targets of PteF (e.g., the filipin polyketide synthases pteA1 and pteA2; [8]) were not statistically significant. With this criterion, a microarrays analysis showed significant differences (with a fold change above or below ±2) in the expression of 208 genes of the pteF-negative mutant at the end of the exponential phase, and 99 at the stationary phase of growth (Table 1; Figure 2).
Surprisingly, the lack of PteF resulted in the overexpression of a majority of the differentially transcribed genes, at both sampling times, thus indicating that this regulator acts as a negative modulator for the expression of those genes. This was unexpected given that PteF is an activator of both the antifungal filipin [8] and the ATP-synthase inhibitor oligomycin’s [7] biosynthesis.
These genes were related to different cellular processes, including genetic information processing; energy, carbohydrate, and lipid metabolism; DNA replication and repair; morphological differentiation; and transcriptional regulation, among others, but particularly to secondary metabolite biosynthesis (Table 1).

2.1.1. Genes Involved in Genetic Information- and Protein-Processing and Amino Acid Metabolism

This group includes 24 genes that showed differential transcription in at least one of the sampling times (Table 1). These genes code for enzymes involved in amino acid metabolism (seven genes), proteins involved in transcription (eight genes, including five sigma factors), the ribosomal protein L28 (SAVERM2675), two putative acetyltransferases of ribosomal proteins (SAVERM703 and SAVERM758), and enzymes involved in protein processing (five genes) (Supplementary Materials Table S1).
Interestingly, while sigma factors sig10 (SAVERM898), sig13 (SAVERM997), and sig60 (SAVERM213), and ribosomal proteins acetyltransferases SAVERM703 and SAVERM758 showed increased transcription levels in the mutant, sig32 (SAVERM3888), sig40 (SAVERM4561), the L28 ribosomal protein encoding gene rpmB1, and the whiB-like transcriptional factor wblE were clearly underexpressed in the mutant. The Wbl family of transcriptional factors is exclusive of actinobacteria, and their members have been correlated with diverse roles in morphological differentiation and secondary metabolism [11,12].
Notably, the genes rocA (SAVERM2723) and putA (SAVERM2724), which encode delta-1-pyrroline-5-carboxylate dehydrogenase and proline dehydrogenase, respectively, and that have been related to proline catabolism [13], and rocD2 (SAVERM7112) and SAVERM4551, which encode putative ornithine aminotransferases and are also involved in proline metabolism, were underexpressed in the mutant, while leuB (SAVERM2718), which is involved in valine, leucine, and isoleucine biosynthesis; paaI (SAVERM1986), which encodes the phenylacetic acid thioesterase; and putative cysteine desulfurase SAVERM1061 were overexpressed.

2.1.2. Genes Involved in Nucleotide and Vitamin Metabolism, and DNA Replication, Recombination, and Repair

Eighteen genes falling into this category were found to be differentially transcribed in the mutant (Table 1). Ten of them are involved in DNA replication, recombination, and repair. Of these, seven putative transposases belonging to different families showed an enhanced transcription in the mutant. Additionally, two genes involved in DNA repair, ku2 (SAVERM879), which is probably involved in non-homologous DNA end-joining [14], and uvrD1 (SAVERM3463) that codes for a putative ATP-dependent helicase, were also upregulated. Conversely, int12 (SAVERM4626), which encodes a tyrosine-family recombinase/integrase, showed reduced transcription levels at the stationary phase.
The remaining genes were differentially transcribed only in the exponential phase. Four genes are involved in vitamin metabolism, three of them with lower transcription in the mutant, including cobalamin methylase cobJ (SAVERM6407), adenosyltransferase cobA (SAVERM6413), and alkaline phosphatase phoA (SAVERM5915), which besides being part of the PhoRP two-component system [15] is also involved in folate metabolism. The fourth gene, thiC (SAVERM4265), is a thiamine biosynthesis protein (Supplementary materials Table S1). The remaining genes are involved in purine metabolism, including pgmA, purA, and purN, all with an enhanced transcription, and cpdB, possessing a lower transcription.

2.1.3. Carbohydrate Metabolism Genes

Thirteen genes fall into this category, including four most likely belonging to the same operon (SAVERM1009, galE5, mpg2, and SAVERM1014) and putatively involved in galactose metabolism, and showing an enhanced transcription in the mutant. Other genes involved in the metabolism of this sugar were the alpha-galactosidase agaB1 (SAVERM1082), which was underexpressed in the mutant, and the phosphoglucomutase pgmA (SAVERM803), which showed the opposite behavior. Interestingly, three genes of the tricarboxylic acid/glyoxylate cycle (citrate synthase citA2, citrate lyase citE2, and methylmalonyl-CoA mutase meaA1) were overexpressed in the mutant (Supplementary materials Table S1).

2.1.4. Lipid Metabolism Genes

Nine genes related to lipid metabolism were differentially transcribed. These include the putative 3-oxoacyl-ACP synthase II fabB2 (SAVERM2944), the acyl carrier protein fabC4 (SAVERM217), the enoyl-CoA hydratase echA1 (SAVERM492), and the acetyl/propionyl CoA carboxylase alpha subunit accA2 (SAVERM3866), which are all presumably involved in fatty acid biosynthesis, and the 1-acylglycerol-3-phosphate O-acyltransferase plsC1 (SAVERM1485) putatively involved in glycerophospholipid biosynthesis, among others. Interestingly, all these genes showed increased transcription in the mutant during the exponential phase except fabB2, which was underexpressed (Supplementary materials Table S1). However, during the stationary phase, fabB2 also showed enhanced transcription.
Notably, the direct binding of the PteF orthologue PimM to the promoters of two of these genes has been already demonstrated [7]; thus, they have been included in Supplementary materials Table S1, although they did not meet the statistical criteria. These were the acyltransferase plsC1 [16] whose transcription was increased in the mutant (Mc 0.88, uncorrected p-value 0.0471) and fabB2 whose transcription was reduced (Mc −0.84, uncorrected p-value 0.0410 in t1) or increased (Mc 1.12, p-value 0.0048 in t2) depending on the growth phase.

2.1.5. Energy Production Genes

Only three genes belonging to this group were found to be differentially transcribed in the mutant. All of them are involved in oxidative phosphorylation and have a reduced transcription in the mutant: two of them belong to the operon nuo (nuoJ1 and nuoK1), and the other one is the ATP synthase atpF (Supplementary Materials Table S1). Interestingly, all the genes belonging to the nuo operon (SAVERM4837-SAVERM4850), although in several cases not meeting the statistical criteria, showed the same decreased transcription profile in the mutant.

2.1.6. Transport and External Signals Processing

This group includes 25 genes that showed differential transcription in at least one of the sampling times (Table 1). Interestingly, twelve of them code or participate in the formation of ATP-binding cassette transporters (Supplementary Materials Table S1). Of these, four are putatively involved in sugar transport (SAVERM1804, SAVERM2246, SAVERM2247, and SAVERM2609) and showed reduced transcription in the mutant.
Four transporters belonging to the major facilitator superfamily showed differential transcription in the mutant: SAVERM2455 with a reduced transcription, SAVERM610, the sulfate transporter SAVERM4600, and SAVERM6941 with an enhanced transcription.
Notably, in agreement with the enhanced transcription of SAVERM610, the genes fecC1 (SAVERM600) and fecB (SAVERM602), which constitute part of a putative ABC transporter iron(III)/siderophore transport system, were also overexpressed. Based on protein similarity, SAVERM600-602 could constitute an ABC transport system homologous to the system FecBCD from E. coli involved in iron dicitrate transport [17]. The SAVERM600 and SAVERM611 genes flank a gene cluster involved in the biosynthesis of the siderophore nrp6 whose expression is also upregulated in the mutant (see below and Table 2 and Supplementary Materials Table S1). Altogether, these results suggest that the ABC system SAVERM600-602 and the transporter SAVERM610 would be involved in iron transport using the siderophore nrp6. These transcriptomic results are further supported by the direct binding of PimM to the promoters of SAVERM602 and SAVERM610 [7].

2.1.7. Genes Involved in Cell Envelope Biosynthesis and Morphological Differentiation

This group includes eleven genes that showed differential transcription in at least one of the sampling times. These genes code for enzymes involved in cell envelope biosynthesis (the N-acetylmuramoyl-L-alanine amidase ampD1), and morphological differentiation (eight genes). The latter are particularly interesting because in Streptomyces morphological differentiation is usually accompanied by physiological differentiation [18]. The differential expression of the genes involved in morphological differentiation was somewhat expected given that S. avermitilis ΔpteF mutants show a delay in spore formation [8].
Our results indicate that the transcriptional regulators wlbE and bldC that are associated with deficient phenotypes in spore formation (white) and in aerial mycelium development (bald), respectively, are underexpressed in the mutant. Similarly, the secreted subtilisin inhibitor sit2 involved in morphological differentiation via sigU in S. coelicolor [19], and SAVERM2505 that encodes a DNA-binding protein orthologous to S. lividans transcriptional regulator ClgR, which controls the expression of ATP-dependent protease Clp involved in morphological differentiation [20], are also downregulated (Supplementary Materials Table S1). Interestingly, the clpC1 gene had also been proposed as a direct PteF molecular target given the PimM binding to its coding region [7].
Conversely, the gene ctpB, which encodes a cation-transporting P-type ATPase involved in Bacillus subtilis sporulation activation [21]; the gene mreC, needed for spore cell-wall synthesis in S. coelicolor [22]; and both kipI and its antagonist kipA, which have been involved in sporulation control in B. subtilis [23,24], showed enhanced transcription in the mutant (Supplementary Materials Table S1).

2.1.8. Regulatory Genes

As described here, a large set of genes with diverse functions are under the control of PteF, including several regulatory genes listed in the categories described above. This prompted us to analyze other possible transcriptional regulators differentially expressed in the mutant, as these could be mediators of the regulatory control. A complete list of the regulatory genes whose expression is affected in the mutant is presented in Supplementary Materials Table S1.
A total of 31 transcriptional regulators showed a significant differential transcription in the mutant when compared with the parental strain. Such a large number reflects the pleiotropic nature of PAS-LuxR regulators [7,8,25], and probably justifies all the biological processes affected by the mutation (see the functional categories listed above).
Among the regulators controlled by PteF, it is interesting to highlight eight directly involved in diverse secondary metabolites’ biosynthesis control, namely, avaL2 (SAVERM2268) and avaL1 (SAVERM2270), both TetR-family regulators putatively involved in the biosynthesis of a γ-butyrolactone [26]; avaR1 (SAVERM3705), which encodes the avenolide receptor protein [27,28,29]; olmRII (SAVERM2901) and olmRI (SAVERM2902), both LuxR-family positive regulators of macrolide oligomycin biosynthesis [30]; pteR (SAVERM410), the SARP-LAL regulator of the polyene macrolide filipin biosynthesis [8,26,31]; aveR (SAVERM935), a LAL-family positive regulator of avermectin biosynthesis [32]; and SAVERM2989, a MarR-family transcriptional regulator from the neopentalenolactone biosynthetic cluster [26]. All these regulatory genes showed decreased transcription in the mutant, except for pteR and aveR, which were overexpressed (Table 2 and Supplementary Materials Table S1).
Interestingly, the expression of the olmRI and olmRII genes had already been proven to be negatively affected by the lack of PteF [7]. Furthermore, pteF-deletion mutants showed a severe loss of oligomycin production, whereas the gene complementation of the mutant restored the parental-strain’s phenotype, and gene duplication in the wild-type strain boosted oligomycin production [7]. Similarly, pteR has also been reported as a PteF molecular target, via the action of another hierarchical regulator that would be activated by PteF [8].
Besides the abovementioned regulators, other noteworthy findings include the identification of SAVERM2301, which codes for a RedD orthologue; the transcriptional activator of the undecylprodigiosin pathway in S. coelicolor [33]; bldC (SAVERM4130), a MerR-family regulator involved in the morphological differentiation and secondary metabolite production in S. coelicolor [34]; and cutS (SAVERM2404), a sensor kinase involved in actinorhodin biosynthesis in S. lividans [35], all of them being down-regulated in the mutant (Supplementary Materials Table S1).

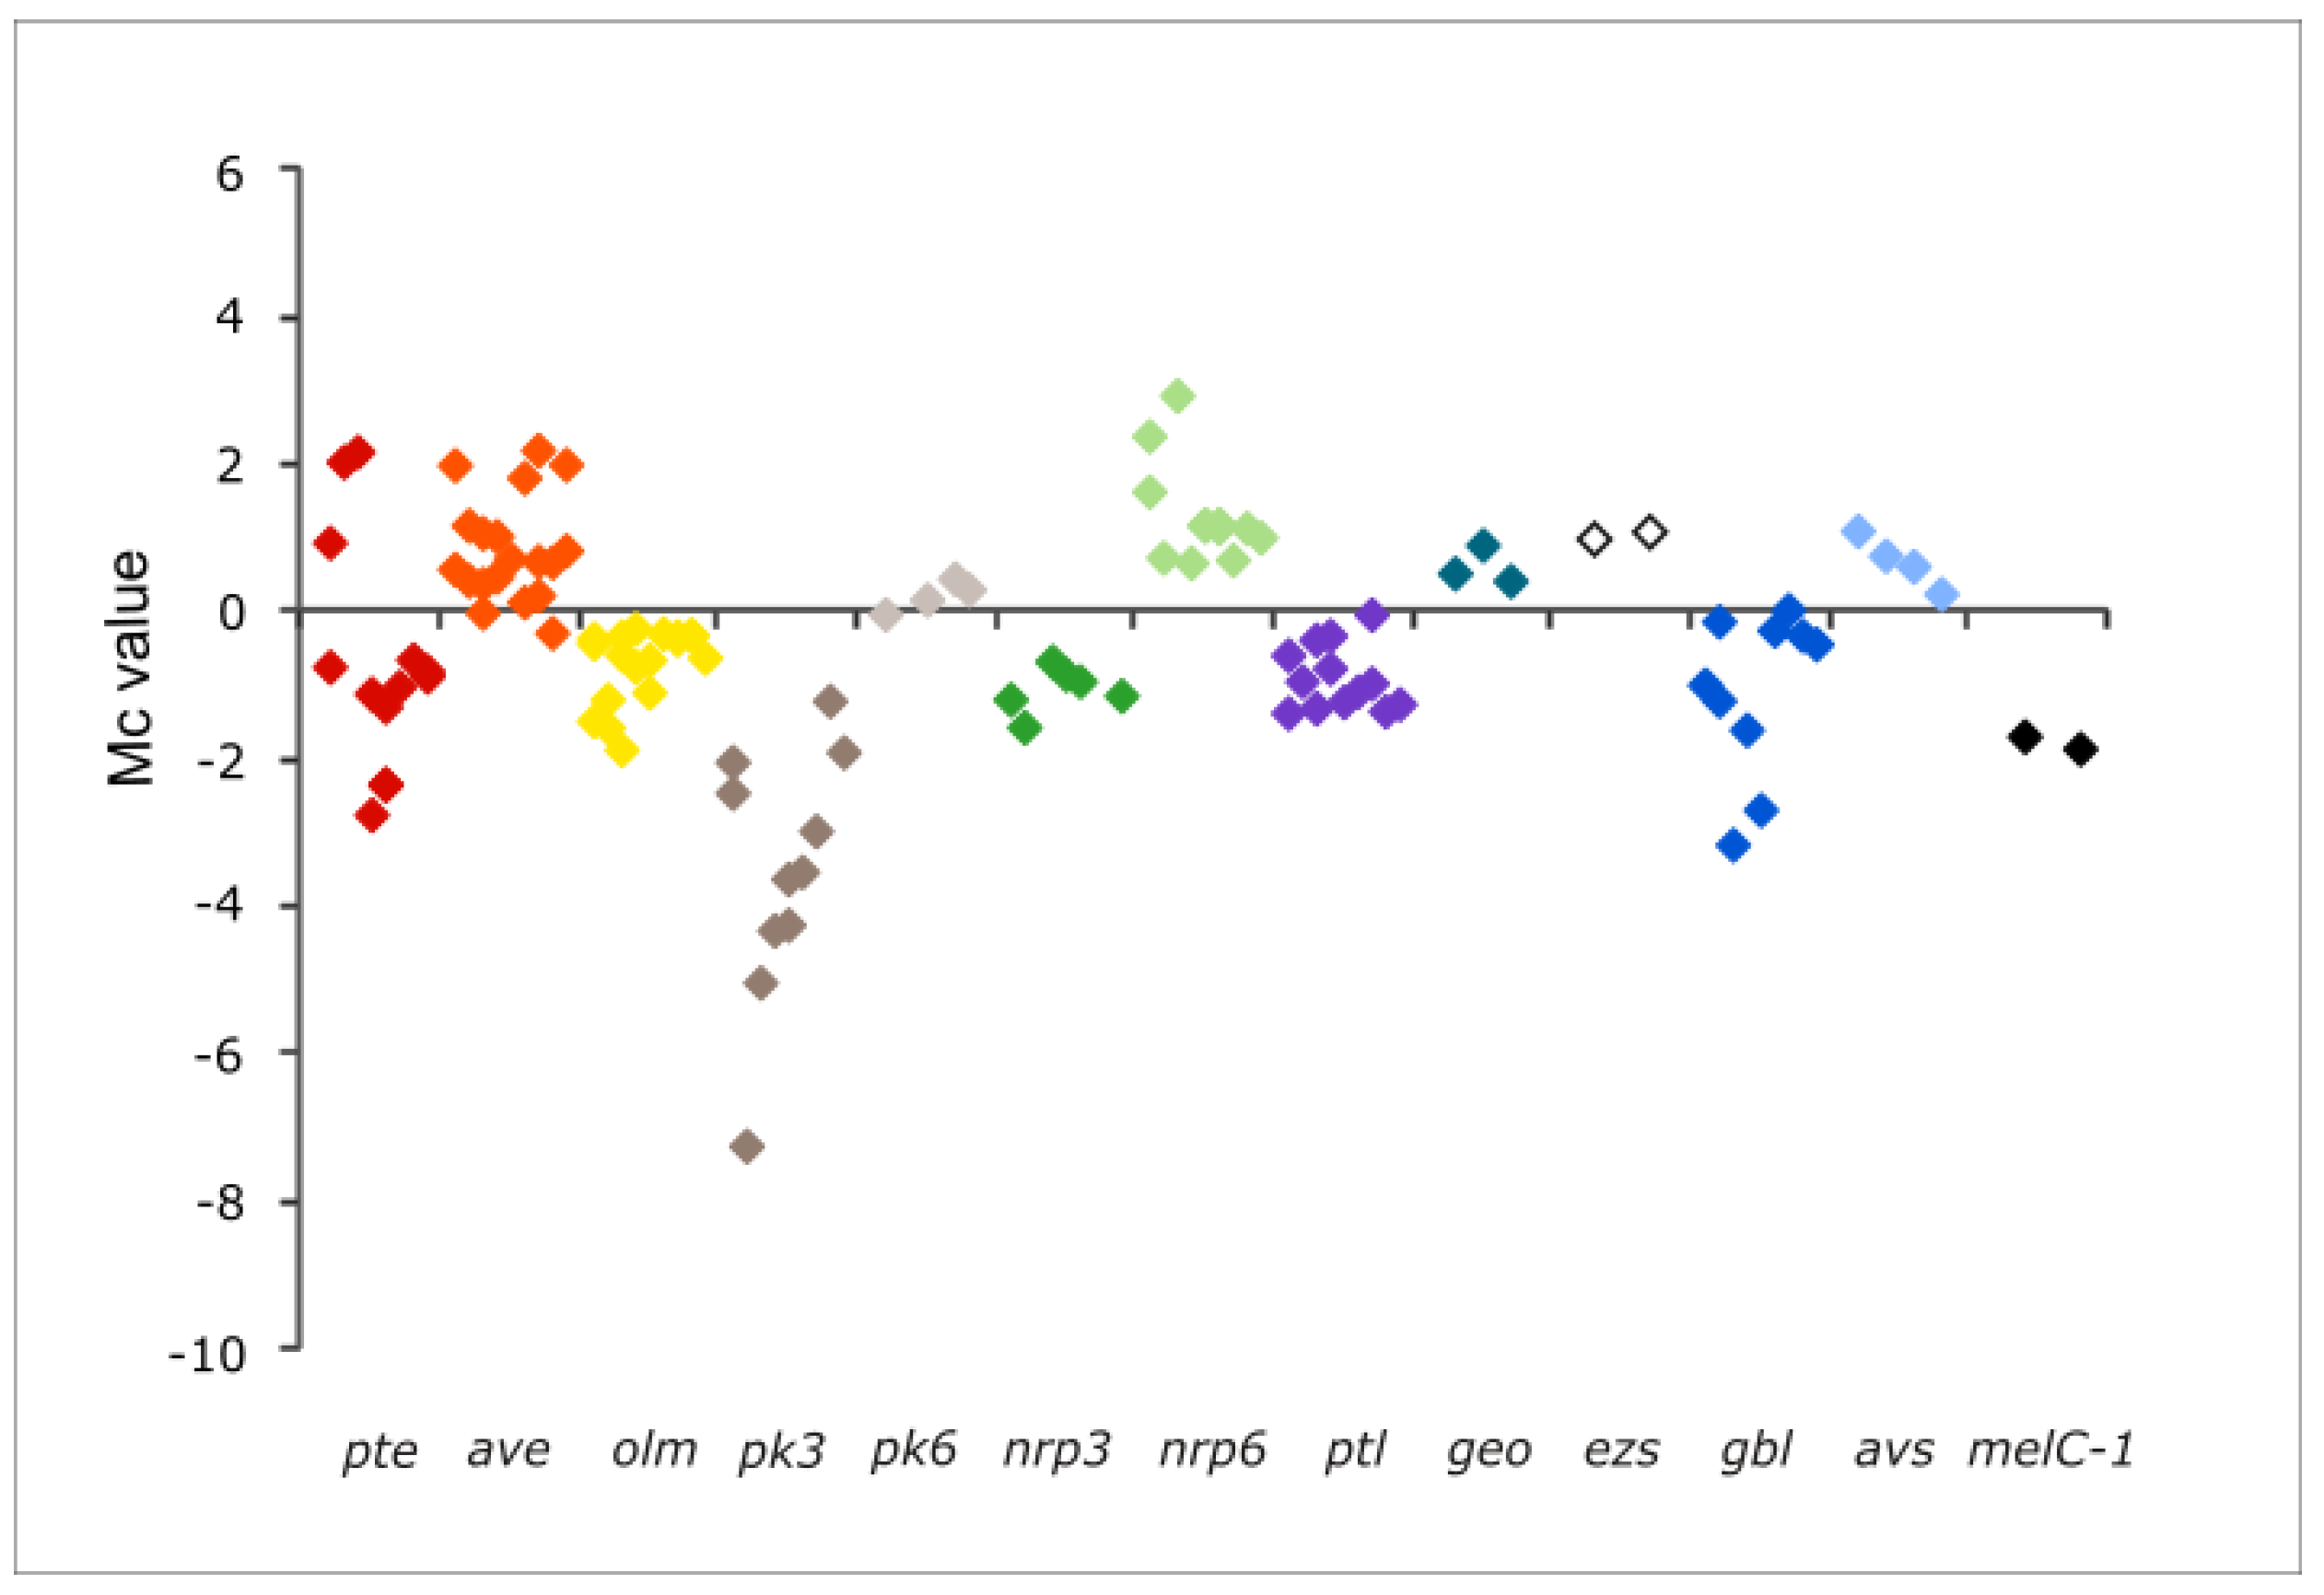
2.1.9. Secondary Metabolite Genes

The functional group more clearly affected by pteF’s deletion was that of the genes involved in secondary metabolite biosynthesis (Table 1). In this category, when one or more genes critical for metabolite biosynthesis were found statistically significant, the transcription of the other genes belonging to the same cluster with uncorrected p-values < 0.05 was also considered significant. Following this broader criterion, sixty-one genes belonging to this group, regardless of the regulatory genes mentioned above, showed a significant differential transcription in the mutant when compared with the parental strain in at least one of the sampling times (Supplementary Materials Table S1). Notably, almost all the genes were detected at the exponential-growth phase. In particular, those related to secondary metabolism precursor biosynthesis were only detected at this sampling time. These genes were: the ornithine aminotransferases rocD3 (SAVERM2285) and rocD2 (SAVERM7112), and the proline dehydrogenase putA (SAVERM2724), which were underexpressed, and the phosphoglucomutase pgmA (SAVERM803), the 3-isopropylmalate dehydrogenase leuB (SAVERM2718), the phosphoribosylglycinamide formyltransferase purN (SAVERM3445), and the putative citrate synthase citA2 (SAVERM3859), which were overexpressed.
However, the most striking result of the microarray analyses was the identification of differential transcription in 67 genes (including regulatory genes) belonging to 10 out of the 38 putative secondary metabolite gene clusters encoded by S. avermitilis genome [26]. Table 2 includes the transcriptional values of the genes belonging to differentially expressed secondary metabolite gene clusters. For the gene cluster boundaries’ definition, we used the StrepDB database [36] in conjunction with information described by Ikeda et al. [26].
The secondary metabolites whose biosynthesis would be affected by pteF deletion were of different natures, and included the polyketides filipin (pte), oligomycin (olm), avermectin (ave), and the product of pks3; the non-ribosomal peptides nrp3 and the siderophore nrp6; the vibrioferrin-like polyhydroxycarboxylate siderophore avs; the terpenoid neopentalenoketolactone (ptl); the γ-butyrolactone (gbl); and melanin (melC-1).
In all these clusters, the differential transcription of at least one key biosynthetic gene was observed. The number of genes affected were: 11 in the nrp6 cluster (out of 12), 10 (out of 13 and 14 respectively) in the case of the filipin and oligomycin clusters, 8 (out of 11) in the case of the pk3 cluster, 7 in the case of the avermectin (out of 19) cluster, 6 in the nrp3 cluster (out of 10), 6 in the ptl cluster (out of 14), 5 (out of 5) in the gbl cluster, and 2 in the avs (out of 4) and melanin melC-1 (out of 2) clusters (Table 2).
Furthermore, a closer look at the transcription of the remaining genes of each of these clusters revealed that most of the genes of a given cluster followed the same tendency. Figure 3 shows the transcription profiles of the secondary metabolite gene clusters genes affected by the mutation including the regulatory genes, and Table 2 provides the transcription values observed for each of the genes.
Seven of the secondary metabolite gene clusters showed an overall reduced transcription, including filipin pte, oligomycin olm, neopentalenoketolactone ptl, and melanin melC-1 clusters; the silent cluster for γ-butyrolactone gbl; and the cryptic gene clusters pk3 and nrp3. Conversely, three gene clusters showed an overall enhanced transcription, including the macrolide avermectin ave, the siderophore avs, and the cryptic non-ribosomal peptide nrp6 (Figure 3).
Interestingly, besides the genes mentioned above, all the genes belonging to the clusters coding for the terpenoid albaflavenol/albaflavenone (ezs), and the cryptic polyketide pk4, also followed the same tendency. In these cases, the transcription values did not meet the statistical criteria, but their uncorrected p-values were <0.05 in all instances (Table 2). In the case of the ezs genes (SAVERM3031-3032), they showed an average of two-fold more transcriptions in the mutant, whereas pk4 genes (SAVERM7184-7186) showed between seven- and nine-fold fewer transcriptions than in the parental strain.

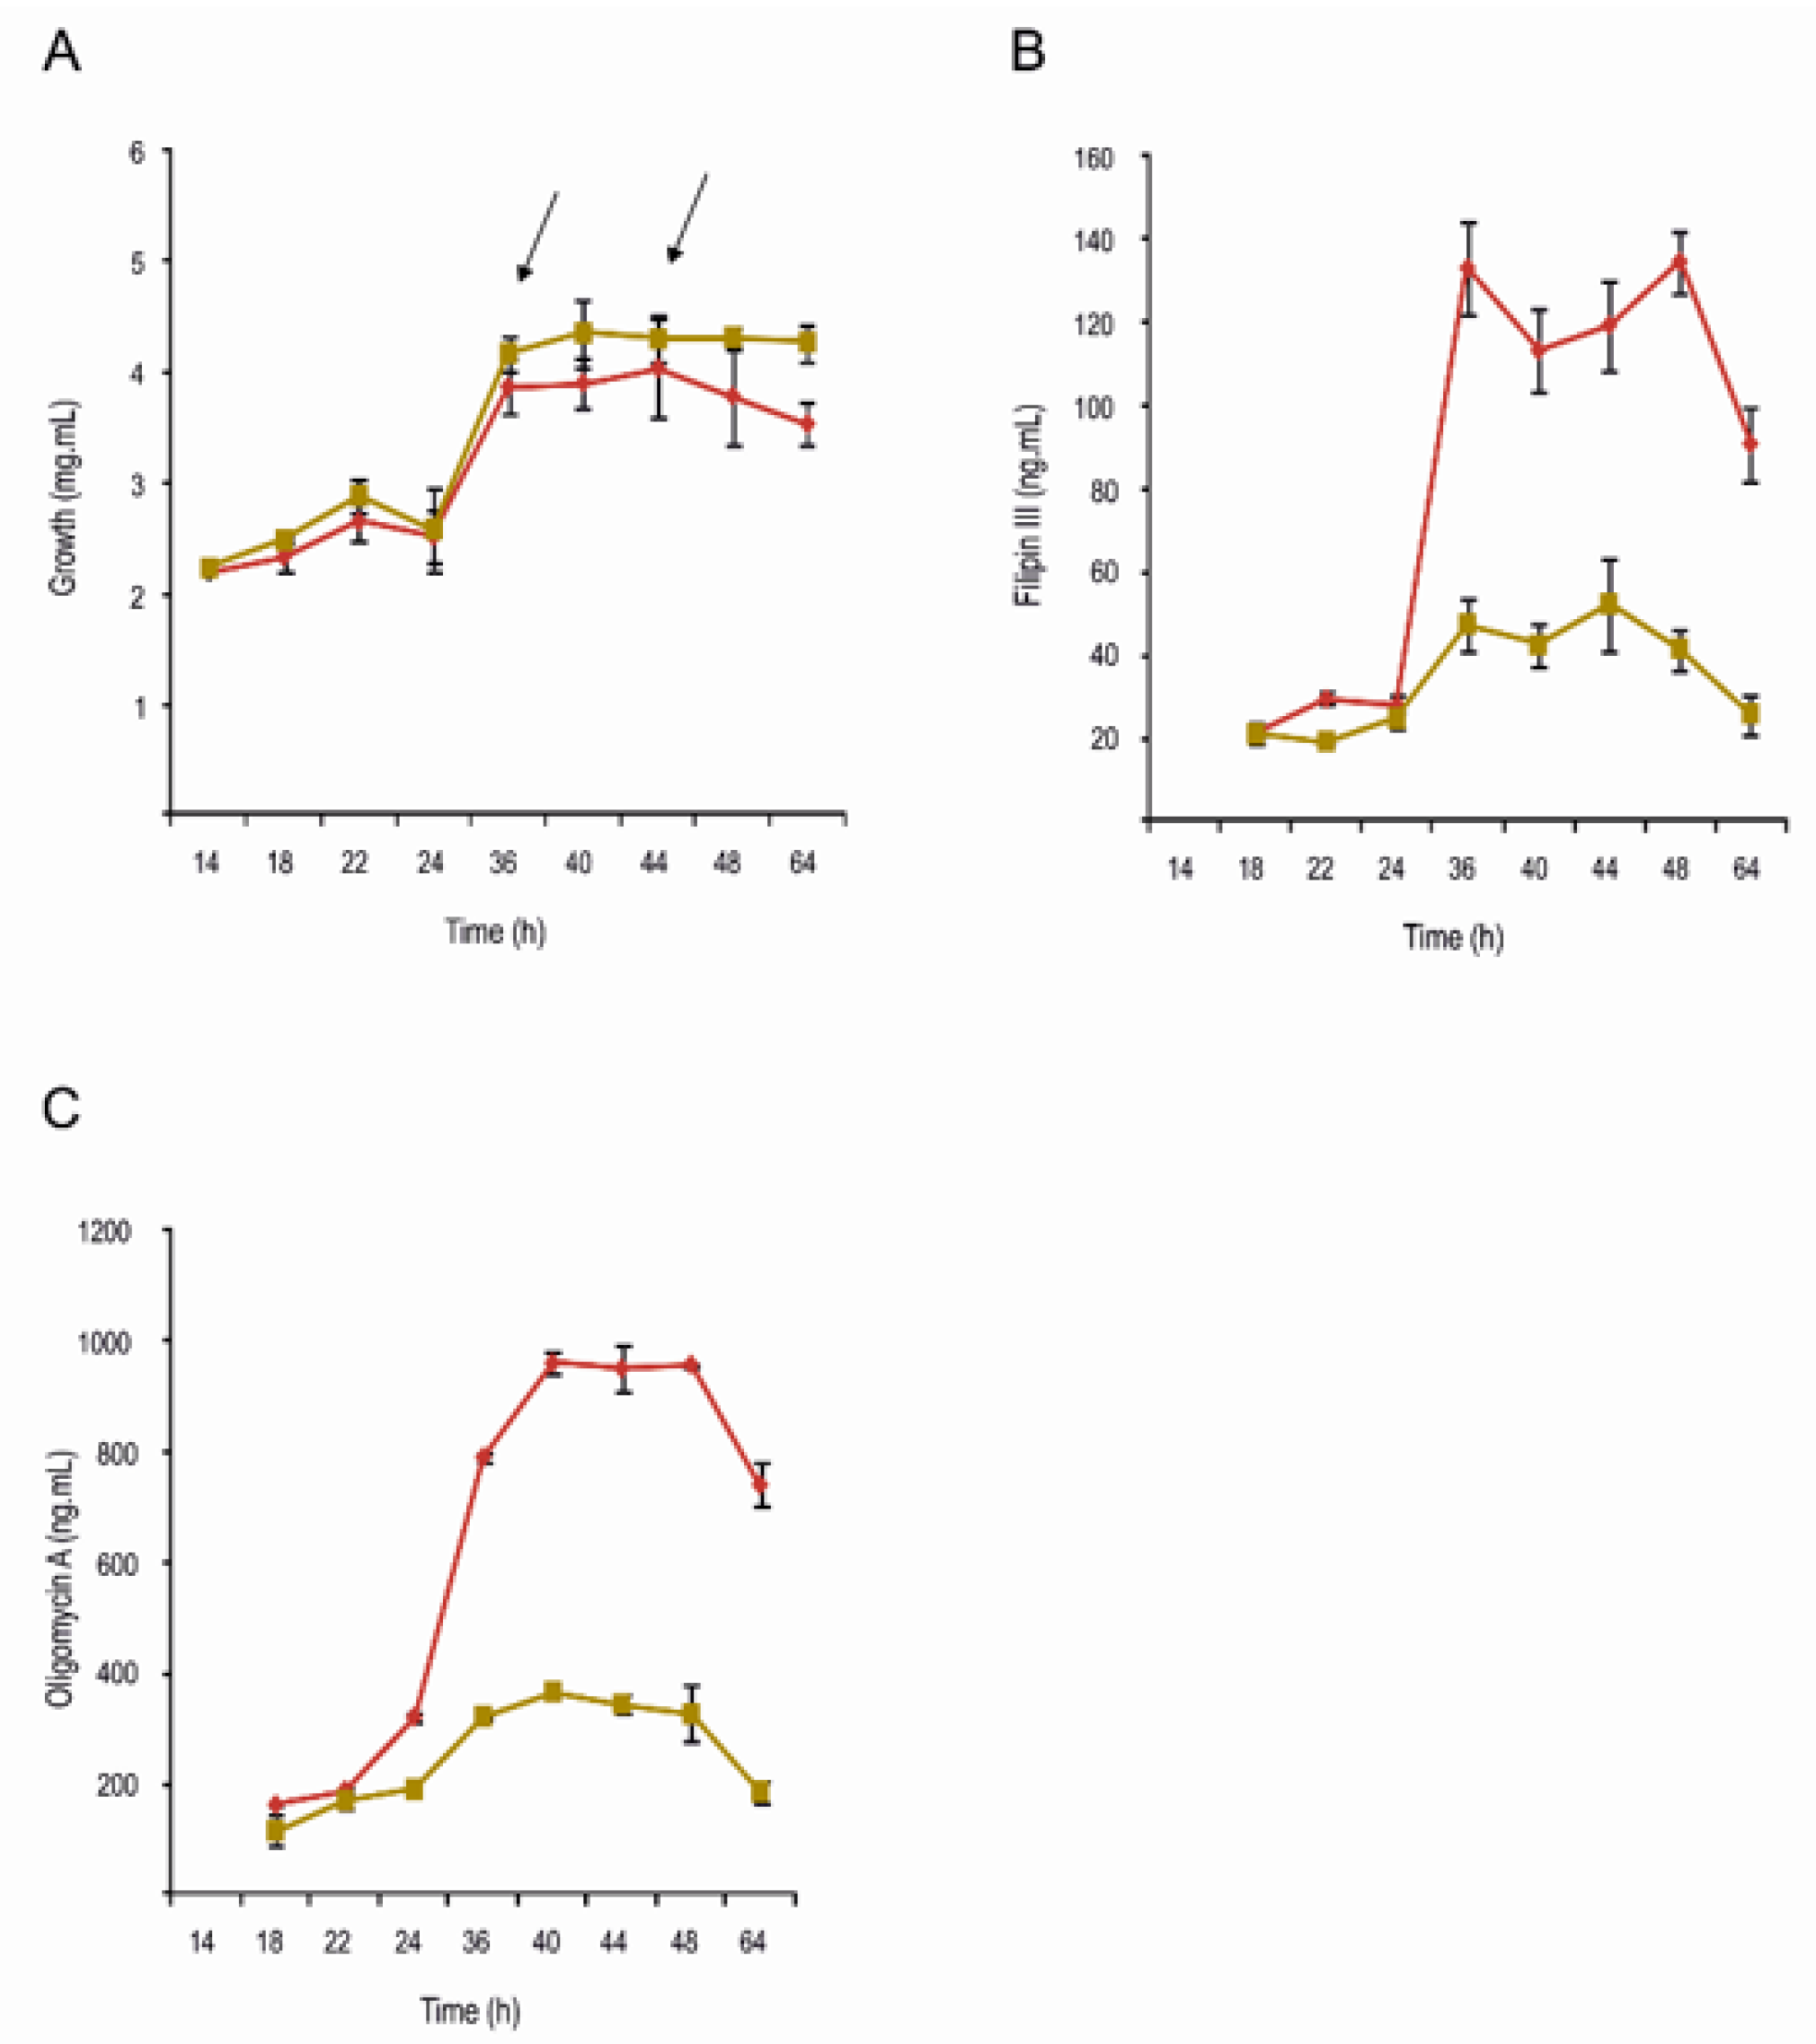
2.2. Filipin and Oligomycin Production Are Strongly Reduced in S. avermitilis ΔpteF

Although many of the metabolites whose biosynthesis would be affected by pteF deletion are of an unknown structure (cryptic) and the others are not produced under laboratory conditions (silent) [26], the production of two of them could be readily monitored in S. avermitilis ΔpteF. These were the antifungal pentaene filipin, which is encoded by the pte cluster where the regulator is situated, and the ATP-synthase inhibitor oligomycin, which is encoded by the olm cluster. In both cases, the production of the secondary metabolite was strongly reduced upon the inactivation of the regulatory gene pteF (Figure 1). This agrees with the reduced transcription of most of the biosynthetic genes of both clusters (Figure 3). The exceptions were the discrete thioesterase pteH, the cholesterol oxidase pteG, and the SARP-LAL regulator pteR of the filipin cluster, which were overexpressed. These results corroborate our previous observations by RT-qPCR [7,8].
It is worth noting that two direct targets of PteF in the filipin cluster, pteA1 and pteA2 [8], do not fall into significant underexpression values in the mutant strain. This is thought to be derived from the stringent criterion used for defining the statistically significant genes, although we cannot exclude the possibility of an effect on the expression of those genes by any of the 33 transcriptional regulators affected upon the mutation of pteF.

2.3. Validation of Microarray Results by Using Quantitative RT-PCR

Quantitative RT-PCR was used on the reversed-transcribed RNA samples to confirm that the differential expression indicated by the microarray data was supported by an independent method. The selected genes covered a wide range of expression, including up-regulation and down-regulation. Twelve genes were validated, including genes for the biosynthesis of filipin (pteC, pteB, pteR, and pteG), oligomycin (olmRI, olmRII, and olmB), avermectin (aveR), the isomerase of the pk3 cluster (SAVERM2273), one ABC transporter of the nrp6 cluster (fecB), the alpha galactosidase agaB1, and the heat shock internal membrane protease htpX1 (SAVERM4891).
Overall, the RT-qPCR data and microarray data showed a good concordance (Supplementary Materials Figure S1). The range of dynamics for the relative log2 fold change obtained from the RT-qPCRs (−6.53 to +7.54) was higher than that obtained from Mc values from microarrays (−7.24 to +2.94), indicating that RT-qPCRs are more sensitive. This probably reflects on the Pearson’s correlation coefficient (R2) for the plot, resulting in a lower value than what could be expected. Nevertheless, the obtained value (R2 = 0.892) still indicates a good correlation of results.

2.4. Concluding Remarks

Until now, PAS-LuxR regulator-encoding genes have been found only in polyene macrolide gene clusters, thus constituting a hallmark of these types of clusters. In this context, they are transcriptional activators essential for the biosynthesis of the polyene encoded within the cluster. Their expression is a bottleneck in the biosynthesis of antifungals; thus, polyene production is easily incremented upon a gene dosage increase [25]. Additionally, the heterologous gene complementation of mutants restores the strain’s ability to produce the antifungal compound, thus proving that these regulators are highly conserved [6]. Recently, we have obtained evidence indicating that although these regulators were initially thought to be pathway-specific, they are actually regulatory proteins with a wider range of connotations in addition to polyene biosynthesis. Thus, PteF, the regulator of filipin biosynthesis, was proven to control oligomycin production in S. avermitilis [7]. This prompted us to propose that the introduction of PAS-LuxR-regulatory genes into Streptomyces species could prove useful for the awakening of dormant secondary metabolite biosynthetic genes [7,8]. This hypothesis was confirmed when PimM, the archetype of the PAS-LuxR regulators, was introduced into S. albus J1074, and the production of the hybrid non-ribosomal peptide-polyketide antimycin was activated [9]. Recently, a similar result has been described in S. albus S4, where a PimM orthologue (the candicidin regulator FscRI) was identified as necessary for antimycin production [37].
Herein, we have studied the transcriptome of an S. avermitilis ΔpteF mutant in comparison with that of its parental strain. Our results corroborate our previous observations [7,8], reinforcing the idea that PAS-LuxR regulators control many different cellular processes of bacterial metabolism at the transcriptional level, but particularly stress the importance of PAS-LuxR’s involvement on secondary metabolite biosynthesis.
Notably, 10 (or 12 if we include ezs and pk4 gene clusters) out of the 38 putative secondary metabolite gene clusters encoded by S. avermitilis genome [26] showed altered expression in the mutant. In some instances, the modified expression of biosynthetic genes of a given cluster could be explained by the effect of the mutation on the expression of one or more cluster-situated regulators. This is the case of the aveR regulator of the avermectin ave cluster, the regulators avaL1 and avaL2 of the γ-butyrolactone gbl cluster, the oligomycin regulators olmRI and olmRII, and the MarR regulator (SAVERM2989) of the pentalenolactone ptl cluster. AveR, the transcriptional activator of avermectin biosynthesis [32], is overexpressed four-fold in the mutant and concomitantly the remaining genes of the ave cluster showed enhanced transcription. Conversely, OlmRI and OlmRI, positive regulators of oligomycin biosynthesis [30], showed decreased transcription in the mutant (Mc values −1.56 and −1.47, respectively), and so did the remaining genes of the cluster. It is not known whether AvaL1 and AvaL2 are positive regulators, but it is conceivable given that they show reduced transcription values upon the mutation of the pteF gene (fold changes of 6.4 and 8.9, respectively) together with the remaining genes of the gbl cluster, including the γ-butyrolactone synthase avaA. Both AvaL1 and AvaL2 show convincing similarity to γ-butyrolactone receptor proteins, and although these proteins normally act by repressing the transcription of the synthase gene [38,39,40], there are cases that display the opposite behavior, such as FarA from S. lavendulae, which activates the transcription of the synthase farX [41]. The same occurs with the MarR regulator of the ptl cluster [26] whose transcription is diminished (2-fold) in the mutant as well as that of all ptl genes. In the remaining gene clusters, there are no cluster-situated regulatory genes; thus, the effect of the mutation must be explained either by the direct action of PteF on key biosynthetic genes or via the action of other regulatory proteins. In this sense, 30 regulatory genes not situated in the clusters indicated above, most of them with unknown function, were differentially expressed upon the mutation of pteF (Supplementary Materials Table S1).
Previous studies have already demonstrated that PAS-LuxR regulators bind a specific conserved sequence [6], which has been found in 97 sites in the genome of S. avermitilis outside the filipin cluster [7]. Of these potential binding sites, only 43 were situated in upstream regions of target genes. Among these genes affected by the putative direct binding of PteF, we found that 19 have their expression differentially changed in the microarray data, indicating that PteF effectively controls these processes directly. These include olmA1 and olmA2, and the fecB and SAVERM610 genes from the oligomycin and nrp6 gene clusters, respectively, but also one regulatory gene, namely, the ClgR transcriptional regulator SAVERM2505. Interestingly, this regulator has been implicated with morphological and physiological differentiation in Streptomyces [20,42] and with proteolysis and DNA repair in Corynebacterium glutamicum [43]. Other regulatory genes that show good p-values and a high fold-change—although not meeting the strict statistical criteria, and that could also constitute direct targets of PetF—are SAVERM4561 and SAVERM6982 (fold-changes of 1.75 and 1.5, respectively) (Supplementary Materials Table S1). These regulators encode an RNA polymerase σ24 factor and a MerR regulator. While the σ-factor targets are unknown, it is expected that the transcription of several genes can be affected. Conversely, the MerR regulator has been shown to regulate Streptomyces development [44]. In the absence of novel evidence, the remaining regulatory genes differentially expressed upon mutation are thought to be controlled by pteF indirectly given that they do not show binding sequences in their upstream regions.
To our knowledge, this is the second time a genome-wide transcriptomic study has been conducted to describe the pleiotropic nature of a cluster-situated regulator, including that of the regulator of lincomycin biosynthesis LmbU from S. linconensis [45]. The cross-regulation of disparate natural-product biosynthetic gene clusters by a cluster-situated regulator has already been described by several groups, although not in genome-wide studies [7,37,46]. Moreover, the ability of some of these regulators to modulate the effects of regulators that act more globally [47], as well as the competition between global regulators [48], have also been reported. Our findings extend further and indicate that PAS-LuxR regulators should be considered wide domain regulators. They affect the expression of multiple genes involved in both primary and secondary metabolism.
The findings reported herein should provide important clues to understanding the intertwined regulatory machinery that modulates the antibiotic biosynthesis in Streptomyces, and suggest that the heterologous expression of PAS-LuxR regulators is likely to represent a powerful general strategy for the discovery of novel bioactive natural products.

3. Materials and Methods

3.1. Strains and Cultivation

S. avermitilis NRRL 8165 and its mutant S. avermitilis ΔpteF [8] were routinely grown and sporulated as described elsewhere [49].

3.2. Nucleic Acid Extractions

RNA was extracted as described elsewhere [8]. Briefly, 2 mL from liquid cultures in YEME medium without sucrose was harvested by centrifugation and immediately frozen by immersion in liquid nitrogen. Cells were resuspended in lysis solution [600 µL RLT buffer (RNeasy mini kit; Qiagen); 6 µL 2-mercaptoethanol] and disrupted using a sonicator (Ultrasonic processor XL; Misonix Inc., Farmingdale, New York, NY, USA). RNeasy® Mini kit (Qiagen, Hilden, Germany) was used for RNA isolation using RNase-Free DNase Set (Qiagen, Hilden, Germany) as specified by manufacturer, followed by two consecutive digestions with TURBOTM DNase from Ambion® according to the manufacturer’s instructions. Total RNA concentration was determined with a NanoDrop ND-1000 spectrophotometer (Thermo Scientific, Waltham, MA, USA), and quality and integrity were checked in a Bioanalyzer 2100 apparatus (Agilent Technologies, Santa Clara, CA, USA). Total genomic DNA (gDNA) was isolated from stationary phase cultures following the salting-out procedure [50].

3.3. Microarray Hybridizations

The microarray experiment was performed using a common reference design [51]. The microarray chip Custom Gene Expression Microarray, 8 × 15 K (Agilent) was customized to include different sets of probes, as indicated elsewhere [52]. For each microarray hybridization, 10 pmol of Cy3-labelled cDNA obtained from total RNA were mixed with 80 pmol of Cy5-labelled genomic DNA as the common reference. Labelling, hybridization, washing, and scanning conditions were carried out as indicated previously [53]. Three biological replicates from independent cultures were made for each experimental condition. Probe design and gene annotation were performed using the publicly available S. avermitilis NRRL 8165 genome sequence with the accession number BA000030.4.

3.4. Identification of Differentially Transcribed Genes

Microarray data were normalized and analyzed with the Bioconductor package LIMMA (Linear Models for Microarray Analysis) [54,55]. Spot quality weights were estimated as indicated in the Supplementary section (Tables S2 and S3). Both local and global normalizations were used [56]. Firstly, weighted medians of log2 Cy3/Cy5 intensities were calculated for print-tip correction and afterwards global Loess was applied [57]. The normalized log2 of the Cy3/Cy5 intensities is referred to in this work as the Mg value, which is proportional to the abundance of transcripts for a particular gene [58]. The information from the within-array spot duplicates [55] and empirical array weights [59] were considered in the linear models [54]. The Mg transcription values of the four experimental conditions were compared using two contrasts, mutant versus wild type, corresponding to the two studied growth phases (exponential and stationary). For each gene, the Mc value is the binary log of the differential transcription between the mutant and the wild strain. The Benjamini–Hochberg (BH) false-discovery rate correction was applied to the p-values. A positive Mc value indicates upregulation, and a negative one, downregulation. For each contrast, a result was considered statistically significant if the BH-corrected p-value was <0.05. However, on certain occasions when the transcription profile of a gene matched that of genes statistically significant and functionally related, or for comparison with previous published results obtained by RT-qPCR or by EMSA assays [7,8], we used an uncorrected p-value with a level of significance <0.05.
The microarray data have been deposited in the National Center for Biotechnology Information-Gene Expression Omnibus under accession number GSE185887.

3.5. Assessment of Filipin and Oligomycin Production

Filipin production was quantified as described elsewhere [39], whereas oligomycin was measured following the procedure described by Vicente et al. [7].

3.6. Reverse Transcription-Quantitative PCR

Reverse transcription of total RNA was performed on selected samples with 5 µg of RNA and 12.5 ng/µL of random hexamer primer (Invitrogen, Waltham, MA, USA) using SuperScript™ III reverse transcriptase (Invitrogen, Waltham, MA, USA) as described previously [60]. Reactions were carried out on two biological replicates with three technical replicates each and appropriate controls were included to verify the absence of gDNA contamination in RNA and primer-dimer formation. Primers (see Supplementary Materials Table S4) were designed to generate PCR products between 97 and 153 bp, near the 5′ end of mRNA. The PCR reactions were initiated by incubating the sample at 95 °C for 10 min followed by 40 cycles at 95 °C for 15 s, 62–70 °C (depending on the set of primers used) for 34 s, and 72 °C for 30 s. To check the specificity of real-time PCR reactions, a DNA melting curve analysis was performed by holding the sample at 60 °C for 60 s followed by slow ramping of the temperature to 95 °C. Baseline and threshold values were determined by the StepOnePlus software. Ct values were normalized with respect to rrnA1 mRNA (encoding 16S rRNA). Relative changes in gene expression were quantified using the Pfaffl method [61] and the REST© software [62]. The corresponding real-time PCR efficiency (E) of one cycle in the exponential phase was calculated according to the equation E = 10 [−1/slope] [63] using 5-fold dilutions of genomic DNA ranging from 0.013 to 40 ng (n = 5 or 6 with three replicates for each dilution) with a coefficient of determination R2 > 0.99 (Supplementary Materials Figure S2).

Supplementary Materials

The following supporting information can be downloaded at: https://www.mdpi.com/article/10.3390/antibiotics11080994/s1, Figure S1: Validation of microarray results using RT-qPCR; Figure S2: Primer efficiency; Table S1: Differentially expressed genes in S. avermitilis ΔpteF when compared to its parental strain; Table S2: Determination of the quality flag for array spots; Table S3: Assigned weights to each spot flags; Table S4: Sequence of primers used for qPCR.

Author Contributions

Conceptualization, C.M.V. and J.F.A.; methodology, C.M.V., T.D.P., E.G.B. and A.R.-G.; validation, F.S.-B. and A.d.P.; formal analysis, C.M.V. and J.F.A.; investigation, C.M.V., T.D.P., E.G.B., A.d.P. and A.R.-G.; resources, F.S.-B.; writing—original draft preparation, J.F.A.; writing—review and editing, C.M.V. and J.F.A.; project administration, C.M.V. and J.F.A.; funding acquisition, J.F.A. All authors have read and agreed to the published version of the manuscript.

Funding

This research was funded by the Spanish Ministerio de Economía, Industria y Competitividad (grants BIO2013-42983-P and PCIN-2016-190 to J.F.A.), FPU contracts of the Ministerio de Educación, Cultura y Deporte (AP2007-02055 to T.D.P., FPU13/01537 to A.d.P.), a contract from the Junta de Castilla y León co-financed by the European Social Fund (to E.G.B.), and a fellowship from the Portuguese Fundação para a Ciência e a Tecnologia (SFRH/BD/64006/2009 to C.M.V.).

Institutional Review Board Statement

Not applicable.

Informed Consent Statement

Not applicable.

Data Availability Statement

The microarray data are deposited in the National Center for Biotechnology Information-Gene Expression Omnibus under accession number GSE185887.

Conflicts of Interest

The authors declare no conflict of interest. The funders had no role in the design of the study; in the collection, analyses, or interpretation of data; in the writing of the manuscript; or in the decision to publish the results.

References

  1. Hefti, M.H.; Francoijs, K.-J.; de Vries, S.C.; Dixon, R.; Vervoort, J. The PAS fold: A redefinition of the PAS domain based upon structural prediction. Eur. J. Biochem. 2004, 271, 1198–1208. [Google Scholar] [CrossRef]
  2. Santos, C.L.; Correia-Neves, M.; Moradas-Ferreira, P.; Mendes, M.V. A walk into the LuxR regulators of Actinobacteria: Phylogenomic distribution and functional diversity. PLoS ONE 2012, 7, e46758. [Google Scholar] [CrossRef] [Green Version]
  3. Möglich, A.; Ayers, R.A.; Moffat, K. Structure and signaling mechanism of Per-ARNT-Sim domains. Structure 2009, 17, 1282–1294. [Google Scholar] [CrossRef] [Green Version]
  4. Antón, N.; Santos-Aberturas, J.; Mendes, M.V.; Guerra, S.M.; Martín, J.F.; Aparicio, J.F. PimM, a PAS domain positive regulator of pimaricin biosynthesis in Streptomyces natalensis. Microbiology 2007, 53, 3174–3183. [Google Scholar] [CrossRef] [Green Version]
  5. Santos-Aberturas, J.; Vicente, C.M.; Guerra, S.M.; Payero, T.D.; Martín, J.F.; Aparicio, J.F. Molecular control of polyene macrolide biosynthesis: Direct binding of the regulator PimM to eight promoters of pimaricin genes and identification of binding boxes. J. Biol. Chem. 2011, 286, 9150–9161. [Google Scholar] [CrossRef] [Green Version]
  6. Santos-Aberturas, J.; Payero, T.D.; Vicente, C.M.; Guerra, S.M.; Cañibano, C.; Martín, J.F.; Aparicio, J.F. Functional conservation of PAS-LuxR transcriptional regulators in polyene macrolide biosynthesis. Metab. Engl. 2011, 13, 756–767. [Google Scholar] [CrossRef]
  7. Vicente, C.M.; Payero, T.D.; Santos-Aberturas, J.; Barreales, E.G.; de Pedro, A.; Aparicio, J.F. Pathway-specific regulation revisited: Cross-regulation of multiple disparate gene clusters by PAS-LuxR transcriptional regulators. Appl. Microbiol. Biotechnol. 2015, 99, 5123–5135. [Google Scholar] [CrossRef]
  8. Vicente, C.M.; Santos-Aberturas, J.; Payero, T.D.; Barreales, E.G.; De Pedro, A.; Aparicio, J.F. PAS-LuxR transcriptional control of filipin biosynthesis in S. avermitilis. Appl. Microbiol. Biotechnol. 2014, 98, 9311–9324. [Google Scholar] [CrossRef]
  9. Olano, C.; García, I.; González, A.; Rodríguez, M.; Rozas, D.; Rubio, J.; Sánchez-Hidalgo, M.; Braña, A.F.; Méndez, C.; Salas, J.A. Activation and identification of five clusters for secondary metabolites in Streptomyces albus J1074. Microb. Biotechnol. 2014, 7, 242–256. [Google Scholar] [CrossRef] [Green Version]
  10. Martínez-Burgo, Y.; Santos-Aberturas, J.; Rodríguez-García, A.; Barreales, E.G.; Tormo, J.R.; Truman, A.W.; Reyes, F.; Aparicio, J.F.; Liras, P. Activation of Secondary Metabolite Gene Clusters in Streptomyces clavuligerus by the PimM Regulator of Streptomyces natalensis. Front. Microbiol. 2019, 10, 580. [Google Scholar] [CrossRef]
  11. Fowler-Goldsworthy, K.; Gust, B.; Mouz, S.; Chandra, G.; Findlay, K.C.; Chater, K.F. The actinobacteria-specific gene wblA controls major developmental transitions in Streptomyces coelicolor A3(2). Microbiology 2011, 157, 1312–1328. [Google Scholar] [CrossRef] [Green Version]
  12. Bush, M. The actinobacterial WhiB-like (Wbl) family of transcription factors. Mol. Microbiol. 2018, 110, 663–676. [Google Scholar] [CrossRef]
  13. Menzel, R.; Roth, J. Purification of the putA gene product. A bifunctional membrane-bound protein from Salmonella typhimurium responsible for the two-step oxidation of proline to glutamate. J. Biol. Chem. 1981, 256, 9755–9761. [Google Scholar] [CrossRef]
  14. Zhang, X.; Chen, W.; Zhang, Y.; Jiang, L.; Chen, Z.; Wen, Y.; Li, J. Deletion of ku homologs increases gene targeting frequency in Streptomyces avermitilis. J. Ind. Microbiol. Biotechnol. 2012, 39, 917–925. [Google Scholar] [CrossRef]
  15. Sola-Landa, A.; Rodríguez-García, A.; Apel, A.K.; Martín, J.F. Target genes and structure of the direct repeats in the DNA-binding sequences of the response regulator PhoP in Streptomyces coelicolor. Nucleic Acids Res. 2008, 36, 1358–1368. [Google Scholar] [CrossRef] [Green Version]
  16. Yao, J.; Rock, C.O. Phosphatidic acid synthesis in bacteria. Biochim. Biophys. Acta 2013, 1831, 495–502. [Google Scholar] [CrossRef] [Green Version]
  17. Staudenmaier, H.; Van Hove, B.; Yaraghi, Z.; Braun, V. Nucleotide sequences of the fecBCDE genes and locations of the proteins suggest a periplasmic-binding-protein-dependent transport mechanism for iron (III) dicitrate in Escherichia coli. J. Bacteriol. 1989, 171, 2626–2633. [Google Scholar] [CrossRef] [Green Version]
  18. McCormick, J.R.; Flärdh, K. Signals and regulators that govern Streptomyces development. FEMS Microbiol. Rev. 2012, 36, 206–231. [Google Scholar] [CrossRef] [Green Version]
  19. Gordon, N.D.; Ottaviano, G.L.; Connell, S.E.; Tobkin, G.V.; Son, C.H.; Shterental, S.; Gehring, A.M. Secreted-protein response to sigmaU activity in Streptomyces coelicolor. J. Bacteriol. 2008, 190, 894–904. [Google Scholar] [CrossRef] [Green Version]
  20. Bellier, A.; Gominet, M.; Mazodier, P. Post-translational control of the Streptomyces lividans ClgR regulon by ClpP. Microbiology 2006, 152, 1021–1027. [Google Scholar] [CrossRef] [Green Version]
  21. Campo, N.; Rudner, D.Z. SpoIVB and CtpB are both forespore signals in the activation of the sporulation transcription factor sigmaK in Bacillus subtilis. J. Bacteriol. 2007, 189, 6021–6027. [Google Scholar] [CrossRef] [Green Version]
  22. Kleinschnitz, E.-M.; Heichlinger, A.; Schirner, K.; Winkler, J.; Latus, A.; Maldener, I.; Wohlleben, W.; Muth, G. Proteins encoded by the mre gene cluster in Streptomyces coelicolor A3(2) cooperate in spore wall synthesis. Mol. Microbiol. 2011, 79, 1367–1379. [Google Scholar] [CrossRef]
  23. Wang, L.; Grau, R.; Perego, M.; Hoch, J.A. A novel histidine kinase inhibitor regulating development in Bacillus subtilis. Genes Dev. 1997, 11, 2569–2579. [Google Scholar] [CrossRef] [Green Version]
  24. Jacques, D.A.; Langley, D.B.; Hynson, R.M.G.; Whitten, A.E.; Kwan, A.; Guss, J.M.; Trewhella, J. A novel structure of an antikinase and its inhibitor. J. Mol. Biol. 2011, 405, 214–226. [Google Scholar] [CrossRef]
  25. Aparicio, J.F.; Barreales, E.G.; Payero, T.D.; Vicente, C.M.; de Pedro, A.; Santos-Aberturas, J. Biotechnological production and application of the antibiotic pimaricin: Biosynthesis and its regulation. Appl. Microbiol. Biotechnol. 2016, 100, 61–78. [Google Scholar] [CrossRef] [Green Version]
  26. Ikeda, H.; Kazuo, S.Y.; Omura, S. Genome mining of the Streptomyces avermitilis genome and development of genome-minimized hosts for heterologous expression of biosynthetic gene clusters. J. Ind. Microbiol. Biotechnol. 2014, 41, 233–250. [Google Scholar] [CrossRef]
  27. Kitani, S.; Miyamoto, K.T.; Takamatsu, S.; Herawati, E.; Iguchi, H.; Nishitomi, K.; Uchida, M.; Nagamitsu, T.; Omura, S.; Ikeda, H.; et al. Avenolide, a Streptomyces hormone controlling antibiotic production in Streptomyces avermitilis. Proc. Natl. Acad. Sci. USA 2011, 108, 16410–16415. [Google Scholar] [CrossRef] [Green Version]
  28. Wang, J.B.; Zhang, F.; Pu, J.Y.; Zhao, J.; Zhao, Q.F.; Tang, G.L. Characterization of AvaR1, an autoregulator receptor that negatively controls avermectins production in a high avermectin-producing strain. Biotechnol. Lett. 2014, 36, 813–819. [Google Scholar] [CrossRef]
  29. Zhu, J.; Sun, D.; Liu, W.; Chen, Z.; Li, J.; Wen, Y. AvaR2, a pseudo c-butyrolactone receptor homologue from Streptomyces avermitilis, is a pleiotropic repressor of avermectin and avenolide biosynthesis and cell growth. Mol. Microbiol. 2016, 102, 562–578. [Google Scholar] [CrossRef]
  30. Yu, Q.; Bai, L.; Zhou, X.; Deng, Z. Inactivation of the positive LuxR-type oligomycin biosynthesis regulators OlmRI and OlmRII increases avermectin production in Streptomyces avermitilis. Chinese Sci. Bull. 2012, 57, 869–876. [Google Scholar] [CrossRef] [Green Version]
  31. Payero, T.D.; Vicente, C.M.; Rumbero, Á.; Barreales, E.G.; Santos-Aberturas, J.; De Pedro, A.; Aparicio, J.F. Functional analysis of filipin tailoring genes from Streptomyces filipinensis reveals alternative routes in filipin III biosynthesis and yields bioactive derivatives. Microb. Cell Fact 2015, 14, 114. [Google Scholar] [CrossRef] [Green Version]
  32. Kitani, S.; Ikeda, H.; Sakamoto, T.; Noguchi, S.; Nihira, T. Characterization of a regulatory gene, aveR, for the biosynthesis of avermectin in Streptomyces avermitilis. Appl. Microbiol. Biotechnol. 2009, 82, 1089–1096. [Google Scholar] [CrossRef]
  33. Narva, K.E.; Feitelson, J.S. Nucleotide sequence and transcriptional analysis of the redD locus of Streptomyces coelicolor A3(2). J. Bacteriol. 1990, 172, 326–333. [Google Scholar] [CrossRef] [Green Version]
  34. Hunt, A.C.; Servín-González, L.; Kelemen, G.H.; Buttner, M.J. The bldC developmental locus of Streptomyces coelicolor encodes a member of a family of small DNA-binding proteins related to the DNA-binding domains of the MerR family. J. Bacteriol. 2005, 187, 716–728. [Google Scholar] [CrossRef] [Green Version]
  35. Chang, H.M.; Chen, M.Y.; Shieh, Y.T.; Bibb, M.J.; Chen, C.W. The cutRS signal transduction system of Streptomyces lividans represses the biosynthesis of the polyketide antibiotic actinorhodin. Mol. Microbiol. 1996, 21, 1075–1085. [Google Scholar]
  36. StrepDB—The Streptomyces Annotation Server. Available online: http://strepdb.streptomyces.org.uk/ (accessed on 1 June 2022).
  37. McLean, T.C.; Hoskisson, P.A.; Seipke, R.F. Coordinate regulation of antimycin and candicidin biosynthesis. mSphere 2016, 1, e00305-16. [Google Scholar] [CrossRef] [Green Version]
  38. Zou, Z.; Du, D.; Zhang, Y.; Zhang, J.; Niu, G.; Tan, H. A γ-butyrolactone-sensing activator/repressor, JadR3, controls a regulatory mini-network for jadomycin biosynthesis. Mol. Microbiol. 2014, 94, 490–505. [Google Scholar] [CrossRef]
  39. Zhou, Z.X.; Xu, Q.Q.; Bu, Q.T.; Liu, S.P.; Yu, P.; Li, Y.Q. Transcriptome-guided identification of SprA as a pleiotropic regulator in Streptomyces chattanoogensis. Appl. Microbiol. Biotechnol. 2015, 99, 1287–1298. [Google Scholar] [CrossRef]
  40. Barreales, E.G.; Payero, T.D.; Jambrina, E.; Aparicio, J.F. The gamma-butyrolactone system from Streptomyces filipinensis reveals novel clues to understand secondary metabolism control. Appl. Environ. Microbiol. 2020, 86, e00443-20. [Google Scholar] [CrossRef]
  41. Kitani, S.; Doi, M.; Shimizu, T.; Maeda, A.; Nihira, T. Control of secondary metabolism by farX, which is involved in the gamma-butyrolactone biosynthesis of Streptomyces lavendulae FRI-5. Arch. Microbiol. 2010, 192, 211–220. [Google Scholar] [CrossRef]
  42. Guyet, A.; Gominet, M.; Benaroudj, N.; Mazodire, P. Regulation of the clpP1clpP2 operon by the pleiotropic regulator AdpA in Streptomyces lividans. Arch. Microbiol. 2013, 195, 831–841. [Google Scholar] [CrossRef] [PubMed]
  43. Engels, S.; Ludwig, C.; Schweitzer, J.E.; Mack, C.; Bott, M.; Schaffer, S. The transcriptional activator ClgR controls transcription of genes involved in proteolysis and DNA repair in Corynebacterium glutamicum. Mol. Microbiol. 2005, 57, 576–591. [Google Scholar] [CrossRef] [PubMed]
  44. Schumacher, M.A.; Hengst, C.D.; Bush, M.J.; Le, T.B.K.; Tran, N.T.; Chandra, G.; Zeng, W.; Travis, B.; Brennan, R.G.; Buttner, M.J. The MerR-like protein BldC binds DNA direct repeats as cooperative multimers to regulate Streptomyces development. Nat. Commun. 2018, 9, 1139. [Google Scholar] [CrossRef] [Green Version]
  45. Lin, C.-Y.; Pang, A.-P.; Zhang, Y.; Qiao, J.; Zhao, G.-R. Comparative transcriptomic analysis reveals the significant pleiotropic regulatory effects of LmbU on lincomycin biosynthesis. Microb. Cell Fact 2020, 19, 30. [Google Scholar] [CrossRef]
  46. Santamarta, I.; López-García, M.T.; Kurt, A.; Nárdiz, N.; Alvarez-Álvarez, R.; Pérez-Redondo, R.; Martín, J.F.; Liras, P. Characterization of DNA-binding sequences for CcaR in the cephamycin-clavulanic acid supercluster of Streptomyces clavuligerus. Mol. Microbiol. 2011, 81, 968–981. [Google Scholar] [CrossRef]
  47. Huang, J.; Shi, J.; Molle, V.; Sohlberg, B.; Weaver, D.; Bibb, M.J.; Karoonuthaisiri, N.; Lih, C.J.; Kao, C.M.; Buttner, M.J.; et al. Cross-regulation among disparate antibiotic biosynthetic pathways of Streptomyces coelicolor. Mol. Microbiol. 2005, 58, 1276–1287. [Google Scholar] [CrossRef]
  48. Santos-Beneit, F.; Rodríguez-García, A.; Sola-Landa, A.; Martín, J.F. Cross-talk between two global regulators in Streptomyces: PhoP and AfsR interact in the control of afsS, pstS and phoRP transcription. Mol. Microbiol. 2009, 72, 53–68. [Google Scholar] [CrossRef]
  49. Barreales, E.G.; Payero, T.D.; de Pedro, A.; Aparicio, J.F. Phosphate effect on filipin production and morphological differentiation in Streptomyces filipinensis and the role of the PhoP transcription factor. PLoS ONE 2018, 13, e0208278. [Google Scholar] [CrossRef] [Green Version]
  50. Kieser, T.; Bibb, M.J.; Buttner, M.J.; Chater, K.F.; Hopwood, D.A. Practical Streptomyces Genetics; John Innes Foundation: Norwich, UK, 2000. [Google Scholar]
  51. Gadgil, M.; Lian, W.; Gadgil, C.; Kapur, V.; Hu, W.S. An analysis of the use of genomic DNA as a universal reference in two channel DNA microarrays. BMC Genom. 2005, 6, 66. [Google Scholar] [CrossRef] [Green Version]
  52. Beites, T.; Rodríguez-García, A.; Santos-Beneit, F.; Moradas-Ferreira, P.; Aparicio, J.F.; Mendes, M.V. Genome-wide analysis of the regulation of pimaricin production in Streptomyces natalensis by reactive oxygen species. Appl. Microbiol. Biotechnol. 2014, 98, 2231–2241. [Google Scholar] [CrossRef]
  53. Guerra, S.M.; Rodríguez-García, A.; Santos-Aberturas, J.; Vicente, C.M.; Payero, T.D.; Martín, J.F.; Aparicio, J.F. LAL regulators SCO0877 and SCO7173 as pleiotropic modulators of phosphate starvation response and actinorhodin biosynthesis in Streptomyces coelicolor. PLoS ONE 2012, 7, e31475. [Google Scholar] [CrossRef] [PubMed] [Green Version]
  54. Smyth, G.K. Linear models and empirical bayes methods for assessing differential expression in microarray experiments. Stat. Appl. Genet. Mol. Biol. 2004, 3, 3. [Google Scholar] [CrossRef]
  55. Smyth, G.K.; Michaud, J.; Scott, H.S. Use of within-array replicate spots for assessing differential expression in microarray experiments. Bioinformatics 2005, 21, 2067–2075. [Google Scholar] [CrossRef]
  56. Wu, W.; Xing, E.P.; Myers, C.; Mian, I.S.; Bissell, M.J. Evaluation of normalization methods for cDNA microarray data by k-NN classification. BMC Bioinform. 2005, 6, 191. [Google Scholar] [CrossRef] [Green Version]
  57. Smyth, G.K.; Speed, T.P. Normalization of cDNA microarray data. Methods 2003, 31, 265–273. [Google Scholar] [CrossRef] [Green Version]
  58. Mehra, S.; Lian, W.; Jayapal, K.P.; Charaniya, S.P.; Sherman, D.H.; Hu, W.S. A framework to analyze multiple time series data: A case study with Streptomyces coelicolor. J. Ind. Microbiol. Biotechnol. 2006, 33, 159–172. [Google Scholar] [CrossRef]
  59. Ritchie, M.; Diyagama, D.; Neilson, J.; Van Laar, R.; Dobrovic, A.; Holloway, A.; Smyth, G.K. Empirical array quality weights in the analysis of microarray data. BMC Bioinform. 2006, 7, 261. [Google Scholar] [CrossRef] [Green Version]
  60. Barreales, E.G.; Vicente, C.M.; de Pedro, A.; Santos-Aberturas, J.; Aparicio, J.F. Promoter engineering reveals the importance of heptameric direct repeats for DNA-binding by SARP-LAL regulators in Streptomyces natalensis. Appl. Environ. Microbiol. 2018, 84, e00246-18. [Google Scholar] [CrossRef] [Green Version]
  61. Pfaffl, M.W. A new mathematical model for relative quantification in real-time RT-PCR. Nucleic Acids Res. 2001, 29, e45. [Google Scholar] [CrossRef]
  62. Pfaffl, M.W.; Horgan, G.W.; Dempfle, L. Relative expression software tool (REST) for group-wise comparison and statistical analysis of relative expression results in real-time PCR. Nucleic Acids Res. 2002, 30, e36. [Google Scholar] [CrossRef]
  63. Rasmussen, R. Quantification on the LightCycler. In Rapid Cycle Real-Time PCR, Methods and Applications; Meuer, S., Wittwer, C., Nakagawara, K., Eds.; Springer Press: Heidelberg, Germany, 2000; pp. 21–34. [Google Scholar]
Figure 1. Growth and antibiotic production in YEME medium without sucrose. Strains S. avermitilis wt (red), and ΔpteF mutant (ochre). (A) Growth curves; (B) Filipin production; (C) Oligomycin production. Arrows indicate RNA samples’ harvesting times.
Antibiotics 11 00994 g001
Figure 2. Differentially expressed genes in the mutant strain ΔpteF. Volcano plots show differential gene expression distribution during exponential phase (A) and stationary phase (B). Statistically significant genes are shown in green (log10 p-value ≥ 1.3).
Antibiotics 11 00994 g002
Figure 3. Transcription profiles of secondary metabolite gene clusters genes in S. avermitilis ΔpteF. Only clusters whose transcription was affected by the mutation are included. All the genes of a given cluster are shown in the plot, including regulatory genes. Colored squares are the plots of differential transcription values for individual genes in the mutant. pte, filipin (red); ave, avermectin (orange); olm, oligomycin (yellow); pk, polyketide (gray); nrp, non-ribosomal peptide (green); ptl, neopentalenoketolactone (purple); geo, geosmin (teal); ezs, albaflavenol/albaflavenone (white); gbl, γ-butyrolactone (dark blue); avs, vibrioferrin-like siderophore (light blue); melC-1, melanin (black).
Antibiotics 11 00994 g003
Table 1. Differential transcription and functional classification of genes affected by pteF deletion. The number of genes that are under- (↓) or over-expressed (↑) are indicated.
Genes Underexpressed aGenes Overexpressed aTotal
Exponential phase (t1)63145208
Stationary phase (t2)356499
Identified Genes b
Functiont1t2
Genetic information- and protein-processing; amino acid metabolism20 (7 ↓; 13 ↑)11 (5 ↓; 6 ↑)
Nucleotide and vitamin metabolism; DNA replication, recombination, and repair16 (4 ↓; 12 ↑)4 (1 ↓; 3 ↑)
Carbohydrate metabolism13 (3 ↓; 10 ↑)1 (1 ↓)
Lipid metabolism8 (1 ↓; 7 ↑)4 (4 ↑)
Energy production2 (2 ↓)1 (1 ↓)
Transport and external signals’ processing20 (12 ↓; 8 ↑)8 (4 ↓; 4 ↑)
Cell envelope biosynthesis and morphological differentiation9 (4 ↓; 5 ↑)5 (4 ↓; 1 ↑)
Regulation27 (12 ↓; 15 ↑)12 (3 ↓; 9 ↑)
Secondary metabolism60 (34 ↓; 26 ↑)6 (2 ↓; 4 ↑)
Miscellaneous38 (11 ↓; 27 ↑)19 (1 ↓; 18 ↑)
a Only statistically significant genes with a fold-change value equal higher to ±2 are included. b All identified genes were accounted for.
Table 2. Transcriptional values of genes belonging to differentially expressed secondary metabolite gene clusters in S. avermitilis ∆pteF when compared to its parental strain. (t1). The p-values are indicated in bold type when found statistically significant. Mc values higher than 1 and their corresponding fold-change above 2 are also in bold.
GeneDescriptionFold-ChangeMcCorrected p-Valuep-Value
Filipin cluster (pte)
407pteHThioesterase1.930.950.13950.0076
408pteGcholesterol oxidase4.142.050.00250.0000
410pteRSARP-family transcriptional regulator4.532.180.00090.0000
411pteEFerredoxin2.14−1.100.25330.0233
412pteDcytochrome P450 monooxygenase6.68−2.740.00050.0000
413pteCcytochrome P450 monooxygenase5.03−2.330.00040.0000
414pteBDehydrogenase5.06−2.340.00000.0000
415pteA5modular polyketide synthase2.01−1.010.11360.0054
416pteA4modular polyketide synthase2.43−1.280.00950.0002
417pteA3modular polyketide synthase1.56−0.640.35140.0457
418pteA2modular polyketide synthase1.83−0.870.36390.0506
419pteA1modular polyketide synthase1.74−0.800.43880.0752
Non-ribosomal peptide-6 (nrp6)
600fecC1ABC transporter iron(III)/siderophore transport system ATP-binding protein5.282.400.00030.0000
601fecD1ABC transporter iron(III)/siderophore permease1.680.750.56250.1290
602fecBABC transporter iron(III)/siderophore-binding protein7.732.950.00060.0000
603nrps6non-ribosomal peptide synthetase1.600.680.31190.0342
604 hypothetical protein2.271.180.02240.0005
605fadD2acyl-CoA synthetase2.301.200.00490.0001
606 hypothetical protein1.640.710.35250.0464
607 taurine catabolism dioxygenase2.221.150.00170.0000
608fabC2acyl carrier protein2.031.020.11360.0054
609fabH43-oxoacyl-ACP synthase III2.221.150.11820.0058
610 MFS transporter protein2.281.190.01660.0004
611 beta-hydroxylase3.121.640.00050.0000
Avermectin cluster (ave)
935aveRLuxR-family transcriptional regulator4.002.000.00490.0001
936aveFC-5 ketoreductase1.510.590.60160.1518
937aveDC5-O-methyltransferase1.350.430.61480.1603
938aveA1type I polyketide synthase2.271.180.18200.0122
939aveA2type I polyketide synthase1.310.390.72640.2537
940aveCpost-polyketide modification protein1.000.000.99930.9950
941aveEcytochrome P450 monooxygenase2.061.040.13760.0074
942aveA3type I polyketide synthase1.400.490.63280.1725
943aveA4type I polyketide synthase1.660.730.44350.0764
944 aorf-1Reductase1.100.140.93300.6990
945aveBIdTDP-L-oleandrose transferase (glycosyltransferase)1.620.700.60520.1543
946aveBIIdTDP-glucose 4.6-dehydratase1.170.230.80270.3477
947aveBIIIglucose-1-phosphate thymidyltransferase2.111.080.20270.0154
948aveBIVdTDP-4-keto-6-deoxy-L-hexose 4-reductase1.21−0.280.88280.5032
949aveBVdTDP-4-keto-6-deoxyhexose 3.5-epimerase1.600.680.53870.1160
950aveBVIdTDP-4-keto-6-deoxy-L-hexose2.3-dehydratase1.790.840.43080.0711
951aveBVIIdTDP-6-deoxy-L-hexose 3-O-methyltransferase4.032.010.00200.0000
952aveBVIIIdTDP-4-keto-6-deoxy-L-hexose 2.3-reductase3.561.830.00490.0001
953aveGThioesterase4.592.200.00180.0000
Melanin cluster (melC-1) b
1136melC1tyrosinase co-factor protein3.20−1.680.07760.0015
1137melC2Tyrosinase3.61−1.850.00780.0000
γ-butyrolactone cluster (gbl)
2266avaCPhosphatase1.97−0.980.07940.0030
2267avaBOxidoreductase2.30−1.200.27770.0279
2268avaL2TetR-family transcriptional regulator8.88−3.150.00780.0001
2269avaAgamma-butyrolactone biosynthesis protein3.01−1.590.14560.0083
2270avaL1TetR-family transcriptional regulator6.41−2.680.00350.0000
Polyketide-3 cluster (pk3)
2272 hypothetical protein5.46−2.450.20000.0150
2273 Isomerase151.17−7.240.02080.0005
2274 secreted protein32.45−5.020.04730.0014
2275 transmembrane efflux protein19.97−4.320.11240.0053
2276 3-oxoacyl-ACP synthase III18.90−4.240.12420.0063
2277 Thioesterase12.30−3.620.22220.0183
2278 F420-dependent dehydrogenase11.47−3.520.30370.0327
2279 acyl-CoA synthetase7.84−2.970.35220.0462
2280pks3-1modular polyketide synthase2.30−1.200.62880.1702
2281pks3-2modular polyketide synthase3.73−1.900.58930.1436
2282pks3-3acyl carrier protein4.08−2.030.39740.0593
Oligomycin cluster (olm)
2890ccrA1crotonyl-CoA reductase1.34−0.420.43680.0743
2891 hypothetical protein2.27−1.180.22800.0193
2892olmA4modular polyketide synthase1.26−0.330.47600.0913
2893olmA5modular polyketide synthase1.16−0.220.64210.1789
2894olmBcytochrome P450 monooxygenase2.13−1.090.15120.0087
2895olmA7modular polyketide synthase1.56−0.640.07460.0028
2896olmA6modular polyketide synthase1.67−0.740.14430.0080
2897olmA3modular polyketide synthase1.25−0.320.36100.0493
2898olmA2modular polyketide synthase1.24−0.310.57850.1377
2899olmA1modular polyketide synthase1.53−0.610.18170.0121
2900 P450-like protein1.48−0.570.24740.0224
2901olmRIILuxR-family transcriptional regulator2.77−1.470.07120.0026
2902olmRILuxR-family transcriptional regulator2.95−1.560.00060.0000
2903olmCThioesterase3.63−1.860.12350.0062
Neopentalenolactone cluster (ptl)
2989 MarR-family transcriptional regulator2.08−1.060.04870.0015
2990gap1glyceraldehyde-3-phosphate dehydrogenase2.57−1.360.24690.0222
2991ptlH1-deoxypentalenic acid 11-beta hydroxylase1.91−0.930.15290.0089
2992ptlGtransmembrane efflux protein1.29−0.370.90680.5988
2993ptlF1-deoxy-11beta-hydroxypentalenic acid dehydrogenase1.69−0.760.26390.0251
2994ptlEBaeyer-Villiger monooxygenase2.46−1.300.00870.0001
2995ptlDDioxygenase2.31−1.210.09620.0041
2996ptlChypothetical protein2.10−1.070.53670.1153
2997ptlBfarnesyl diphosphate synthase1.95−0.960.56900.1322
2998ptlApentalenene synthase2.53−1.340.55920.1269
2999ptlIpentalenene C13 hydroxylase; cytochrome P4502.36−1.240.49430.0993
3000ptlRAraC-family transcriptional regulator1.49−0.580.53790.1158
3001ptlJLyase1.24−0.310.61090.1579
3002ptlLhypothetical protein1.02−0.030.97540.8867
Albaflavenol/albaflavenone cluster (ezs)
3031cyp14epi-isozizaene hydroxylase (cytochrome P450 monooxygenase)2.001.000.29180.0301
3032ezsepi-isozizaene synthase (sesquiterpene cyclase)2.141.100.16210.0097
Non-ribosomal peptide-3 cluster (nrp3)
3155 MbtH-like protein2.27−1.180.26960.0261
3156nrps3-1non-ribosomal peptide synthetase2.95−1.560.08670.0035
3157 export protein1.58−0.660.64070.1773
3158nrps3-2non-ribosomal peptide synthetase1.79−0.840.61490.1623
3159nrps3-3non-ribosomal peptide synthetase1.91−0.930.52900.1123
3160 Aminotransferase2.19−1.130.43840.0749
3161dapF2diaminopimelate epimerase2.04−1.030.50450.1029
3162 hypothetical protein2.87−1.520.16680.0101
3163 hypothetical protein2.36−1.240.32270.0384
3164 hypothetical protein3.01−1.590.00030.0000
Polyketide-4 cluster (pk4)
7184pks4modular polyketide synthase9.32−3.220.29800.0315
7185 UDP-glucose:sterol glucosyltransferase8.28−3.050.27530.0271
7186cyp26cytochrome P450 hydroxylase7.36−2.880.24190.0213
Polyhydroxycarboxylate siderophore cluster (avs)
7320avsAsiderophore synthetase component2.161.110.02950.0007
7321avsBsiderophore synthetase component1.710.770.24740.0223
7322avsCsiderophore synthetase component1.550.630.46540.0862
7323avsDdiaminopimelate decarboxylase1.190.250.81250.3606
a Not involved in avermectin biosynthesis; b Values from stationary phase (t2) analysis.
Publisher’s Note: MDPI stays neutral with regard to jurisdictional claims in published maps and institutional affiliations.

