Article

Rational Use of Danofloxacin for Treatment of Mycoplasma gallisepticum in Chickens Based on the Clinical Breakpoint and Lung Microbiota Shift

1
National Reference Laboratory of Veterinary Drug Residues (HZAU) and MAO Key Laboratory for Detection of Veterinary Drug Residues, Wuhan 430070, China
2
MOA Laboratory for Risk Assessment of Quality and Safety of Livestock and Poultry Products, Wuhan 430070, China
3
National Center for Veterinary Drug Safety Evaluation, College of Veterinary Medicine, China Agricultural University, Beijing 100193, China
4
Institute of Food Safety and Nutrition, Jiangsu Academy of Agricultural Sciences, Nanjing 210014, China
*
Author to whom correspondence should be addressed.
Antibiotics 2022, 11(3), 403; https://doi.org/10.3390/antibiotics11030403
Submission received: 20 February 2022 / Revised: 11 March 2022 / Accepted: 13 March 2022 / Published: 17 March 2022
(This article belongs to the Special Issue Antimicrobial Use and Antimicrobial Resistance in Food Animals)

Abstract

:
The study was to explore the rational use of danofloxacin against Mycoplasma gallisepticum (MG) based on its clinical breakpoint (CBP) and the effect on lung microbiota. The CBP was established according to epidemiological cutoff value (ECV/COWT), pharmacokinetic–pharmacodynamic (PK–PD) cutoff value (COPD) and clinical cutoff value (COCL). The ECV was determined by the micro-broth dilution method and analyzed by ECOFFinder software. The COPD was determined according to PK–PD modeling of danofloxacin in infected lung tissue with Monte Carlo analysis. The COCL was performed based on the relationship between the minimum inhibitory concentration (MIC) and the possibility of cure (POC) from clinical trials. The CBP in infected lung tissue was 1 μg/mL according to CLSI M37-A3 decision tree. The 16S ribosomal RNA (rRNA) sequencing results showed that the lung microbiota, especially the phyla Firmicutes and Proteobacteria had changed significantly along with the process of cure regimen (the 24 h dosing interval of 16.60 mg/kg b.w for three consecutive days). Our study suggested that the rational use of danofloxacin for the treatment of MG infections should consider the MIC and effect of antibiotics on the respiratory microbiota.

1. Introduction

Mycoplasma gallisepticum (MG), mainly causes sinusitis, bronchitis, and air sacculitis, and leads to chronic respiratory diseases (CRD), with reduced chicken immunity and increases the chance of co-infection with other pathogens [1,2]. MG produces a variety of metabolites that cause dysfunction of the respiratory mucosal epithelial cells. It can also migrate to the lungs and air sacs, leading to lung and balloon lesions, resulting in effusion [3,4]. Typical symptoms of MG infection are severe weight loss, coughing, runny nose, and a vocal sound when breathing, with a slow and long course [5]. The disease can decrease the growth rate of the chicken and the conversion rate of the feed to bring huge economic loss to poultry farming [6,7,8].
Danofloxacin is a third-generation animal-specific fluoroquinolone developed by Pfizer Inc. of the United States [9]. Compared with other antibacterial drugs, danofloxacin have stronger cell permeability, higher drug concentration in plasma and tissues, and stronger antibacterial activity that can exhibit an antibacterial effect even when the drug concentration is low [10]. Danofloxacin is widely used in the treatment of respiratory diseases caused by Mycoplasma, Actinobacillus and Glaesserella parasuis [11,12,13]. Therefore, it is expected to have potentially wide applications for controlling respiratory tract disease caused by MG [14,15,16].
Clinical studies have shown that chicken CRD caused by MG can be cured by danofloxacin, and few resistant strains emerged [17]. Pharmacokinetic–pharmacodynamic (PK–PD) models reflect the relationship among the drug, bacteria, and the infected animal, and the model also quantifies the effects of antimicrobials on target pathogens at the same time [18,19]. In general, the concentration of drugs in plasma is relatively easy to measure compared to tissue or lavage fluid [20]. However, it has been reported that for non-mixed infections, the concentration of free drug in the target tissue is the determining factor for treating local infections [21]. The PK data in the target tissue is more convincing than the data in the plasma; a reasonable dosing regimen is given by this data using WinNonlin and Monte Carlo analysis [22]. Previous studies have reported the methods for establishing a PK–PD model by drug concentrations in target tissues to replace drug concentrations in plasma [23].
The breakpoints play an important role in clinical microbiology and are used to define the sensitivity and resistance of strains to antimicrobial agents [24]. The main factors considered in the formulation of the breakpoint include the epidemiological cut-off value (ECV), the PK and PD data in the target animal, the MIC of clinical pathogenic bacteria in clinical effectiveness trials, and prognostic results on the clinical and bacteriological level [25]. These are defined in terms of the ECV, the clinical cutoff value (COCL), and the PK–PD cutoff value (COPD) [26,27]. The ECV is the upper boundary of the wild-type MIC distribution for organisms that do not have detectable acquired resistance mechanisms [28]. The PK–PD cutoff is defined as the highest possible MIC for which a given percentage of target animals (usually 90%) achieve a defined PK–PD parameter value (e.g., PK–PD parameter value for a bactericidal effect) [29]. The COCL is determined according to the relationship between clinical outcomes and antimicrobial susceptibility by statistical approaches [27].
The 16S rRNA gene sequencing technique has become the most widely used method to investigate the composition of microbial ecosystems of digestive and respiratory tracts in recent years [30,31,32,33]. There are some evidence that the consists of the respiratory microbiota of chickens depend on the feed, living environment, and immunity of chickens [34,35,36]. However, no studies have shown the influences on the lung microbiota after administration of the drug. Consequently, it is very necessary to get a picture of the effect of antibiotics used on the lung microbiota for the selection of the most effective treatment method.
This study established CBP based on CLSI and EUCAST, in order to standardize rational and precise use of danofloxacin for the treatment of MG and minimize the emergence of danofloxacin resistance. In addition, the effect of danofloxacin in the treatment of MG infection on chicken lung microbiota was analyzed by 16S rDNA sequencing.

2. Materials and Methods

2.1. Chemicals and Reagents

A standard Danofloxacin drug sensitivity test (>94.2%) was purchased from Dr. Ehrenstorfer (Augsburg, Germany). Danofloxacin mesylate raw material powder for animal experiments (≥98.5%) was purchased from Dalian Ronghai Biotechnology Co., Ltd. (Dalian, Ronghai, China). All the chemical reagents and organic solvents were analytical reagents (AR) or HPLC grade. Ampicillin (≥98%) was purchased from Beijing Solarbio Technology Co., Ltd. (Beijing, China). Hydrolyzed milk protein was purchased from BIOSHARP Biotechnology Co., Ltd. (Beijing, China). DMEM high glucose was obtained from Shanghai Hengfei Biological Technology Co., Ltd. (Shanghai, China). The method of the medium for isolation and culture of MG is described in a patent application (number 201910323646.6).
The preparation of FM-4 base fluid was as follows: 2.5 g NaCI, 0.2 g KCI, 0.8 g Na2HPO4·12H2O, 0.1 g MgSO4·7H2O, 0.05 g KH2PO4, 5.0 g glucose, 2.5 g hydrolyzed milk protein, 2.5 g yeast extract powder and 400 mL deionized water were mixed, autoclaved at 105 °C for 20 min and finally stored at 4 °C for later use.
To prepare FM-4 broth, 80 mL of healthy inactivated fetal bovine serum, 80 mL of DMEM high glucose, 0.5 mL of penicillin (1 million IU/mL), and 1 mL of phenol red (1%) were added to 400 mL of modified FM-4 base solution. In order to ensure that MG grows more quickly, 4 mL of 1% Arginine, 4 mL of 1% Cysteine, and 4 mL of 1% Coenzyme I (NAD) were added.
The preparation of FM-4 agar plates was as follows. Before sterilization, 1.0~1.2% agar was added to the modified FM-4 base solution, adjusting the pH to 8.0 (±0.2) with 1 mol/L NaOH, boiling to fully dissolve, and autoclaving at 105 °C for 20 min.

2.2. Isolation and Cultivation of MG

The 111 MG strains were collected from clinical samples and deposited in the National Reference Laboratory of Veterinary Drug Residues in Huazhong Agricultural University. The chicken respiratory tract cotton swabs were processed aseptically placed in the FM-4 medium for enrichment culture in a 37 °C, 5% CO2 incubator for 3–5 days until the culture changed from red to yellow. The culture was then filtered (0.22 μm) and plated on an FM-4 agar plate. All bacterial isolates were confirmed by polymerase chain reaction (PCR). The primer sequences for the identification of MG are shown in Table 1.
The reaction conditions were pre-denaturation at 94 °C for 5 min, denaturation at 94 °C for 45 s, annealing at 55 °C for 45 s, extension at 72 °C for 1 min, 34 cycles of amplification, and final extension at 72 °C for 5 min, and the amplified products were analyzed by 1.5% agarose gel electrophoresis.

2.3. Animals

A total of 130 three-week-old broilers (half male and female) with an average weight of 500~550 g were offered for the PK study and the other 165 broilers for the clinical trials. These broilers were placed in different cages with good ventilation and warmth, free access to drinking water, and fed to a group diet that did not contain any antibiotics and additives. The use of chickens and all experimental protocols in this study were approved by the Institutional Animal Care and Use Committee at HZAU (approval number HZAUSW-2018-046). All procedures regarding animal care and testing were carried out according to the recommendation for the care and use of laboratory animals of Hubei provincial public service facilities.

2.4. Determination of ECV

2.4.1. Antimicrobial Susceptibility Determination

The sensitivity was determined by the color change unit (CCU) of the medium [37]. The CCU of the strain was determined by tenfold dilutions using the FM-4 medium, and the highest dilution that resulted in color change was the CCU of the strain [38]. E. coli (ATCC 25922) was selected as the QC strain.
The MIC of danofloxacin to MG was determined by the micro broth dilution method. The bacterial solution was diluted with the modified FM-4 liquid medium until the titer was 105 CCU/mL, and then the bacteria diluent was added to the bacterial culture plate. Positive control and negative control were set up in the 96-well plate at the same time. After adding the sample, the plate was sealed with sterile medical tape and placed in a 37 °C incubator for five days.
MIC judgment method was when the control group with added bacteria were yellow, and the color of the negative control wells did not change, recording the MIC of the well without color change, which was the MIC of danofloxacin for the strain. The MIC measurement was repeated three times.

2.4.2. Formulation of ECV

The MIC, MIC50, and MIC90 of danofloxacin against MG were analyzed. The obtained MIC data were simulated by the nonlinear regression method proposed by Turnidge et al. [28] and the ECOFFinder software [39,40].

2.5. Establishment of COPD

2.5.1. Selection of Pathogenic Strain M19

The pathogenic strains of MG with MIC value at MIC90 and the healthy SPF (Specific Pathogen Free) embryos of 5–7 days were selected for this study. MG was injected into the yolk sac of the chicken embryo after the strains had grown to the logarithmic phase (1 × 10⁹ CCU/mL). Each strain was one group, each group had 10 chicken embryos, and the control group (FM-4 medium) was set up for the control. The volume of MG was 0.5 mL for each chicken embryo. After injection, the chicken embryos were cultured in an incubator with a constant temperature of 37 °C, and an amount of moisture was needed. The survival of infected chicken embryos was also observed and counted, and the pathological symptoms of dead and the blank control chicken embryo were also observed for one week. The MG strains were isolated and identified from the infected chicken embryos to ensure the success of the infection test.

2.5.2. PD Study of M19 In Vitro and Ex Vivo

The MIC and MBC for the M19 strain were determined in vitro and ex vivo (plasma and lung tissue) by the micro-dilution method as mentioned above. The mutant prevention concentration (MPC) of danofloxacin was determined using the agar dilution method. For each of the MG strains, the volume of 100 μL of culture with the CCU of 1010 CCU/mL was inoculated onto the FM-4 agar plates containing serial dilutions of danofloxacin (1 to 32 MIC). MPC was defined as the lowest concentration that inhibited bacterial growth for 168 h at 37 °C. The experiment was repeated three times.
The in vitro and ex vivo killing curves of danofloxacin in FM-4 and lung tissue were drawn by monitoring the CCU changes during the incubation of M19 under a series of danofloxacin concentrations (1/2 to 32 MIC) for a continuous time period (0, 4, 8, 12, 16, 20, 24, 28, 32, 36, 40, 44 and 48 h). The killing curves were determined in triplicate for each concentration.

2.5.3. PK Studies of Danofloxacin in Chicken Plasma and Lung

The isolated M19 strain was selected for PK studies according to the chicken embryo infection test results (Supplementary Table S1). The 130 broilers were randomly and equally divided into Group A and Group B. Group A and Group B were divided into 13 groups, respectively, 5 in each group. Group A was given 5 mg/kg b.w at a single dose by gavage without treatment. Group B was challenged with M19 for about one week until the flock had significant respiratory symptoms and then given 5 mg/kg b.w at a single dose by gavage at 5 mg/kg b.w. Five broilers were killed in each group at every sampling time point. Then blood samples (5 mL) and lung samples from broilers were obtained at 0, 0.25, 1, 1.5, 2, 4, 6, 8, 12, 24, 36, and 48 h after administration.

2.5.4. High-Performance Liquid Chromatography (HPLC) Method for Danofloxacin Determination

The danofloxacin present in the plasma and lung tissue samples after extraction were analyzed using the Waters 2695 series HPLC and a Waters 2487 UV detector set at a wavelength of 283 nm. An Agilent Agilent SB-Aq column (250 × 4.6 mm i.d., 5 μm; Agilent Technologies, Santa Clara, CA, USA) was used for separation. The mobile phases were 0.05% phosphoric acid and acetonitrile. The injection volume and flow rates were 20 μL and 0.8 mL/min, respectively. The peak time of danofloxacin was 10.64 min, and there were no endogenous interferences on the chromatograms.

2.5.5. The Protein Binding Rate

The protein binding rate substitutes the result of the liquid phase test into the formula, using Equation (1):
Fb = (Dt − Df)/Dt × 100%
where Dt represents the drug concentration (total concentration) of the lung tissue in the dialysis bag; Df represents the drug concentration in the buffer (free drug concentration) outside of the dialysis bag.

2.5.6. PK Analysis

PK parameters were calculated from the concentration of danofloxacin in plasma and lung tissue by WinNonlin software (version 5.2.1, Pharsight Corporation, Mountain View, CA, USA). A two-compartment model in WinNonlin software obtained the PK parameters according to the characteristics of the concentration-time figures.

2.5.7. PK–PD Integration and Modeling

The determination of the time-killing curve ex vivo was as follows. The determination method of bactericidal curve ex vivo was the same as in vitro, except that the medium was replaced with plasma or lung fluid. The ex vivo killing-time curve was fitted to a PD model by the hypothesis that a decrease in danofloxacin concentration is based on incubation time with the inhibitory sigmoid Emax model.
According to the ex vivo time-killing curve, the Sigmoid Emax model ( E = E max ( E max E 0 ) C N C N + EC 50 N ) was used to calculate the AUC24/MIC (AUIC) of danofloxacin at different concentrations, C represented AUC24/MIC, which indicated the bacteriological outcome of AUC over 24 h were calculated using MIC in vitro and PK parameters in vivo. E was a difference of antibacterial CCU logarithm of lung samples incubated with drug; Emax was a maximum difference of antibacterial CCU logarithm of lung samples incubated with drug; E0 was the difference after 24 h incubation in CCU antibacterial logarithm in control samples; EC50 was the PK–PD parameter value ex vivo when the 50% maximal bactericidal effect was produced in the lung tissue sample; N was the Hill coefficient, which was used to describe the slope of the PK–PD parameter value and the effect E linearization ex vivo, and determined the S-shaped curve.

2.5.8. The Monte Carlo Analysis and Establishment of COPD

A total of 10,000 iterations by Monte Carlo simulation (MCS) were conducted using Oracle Crystal Ball software (version 7.2.2) (Oracle Corporation, Redwood Shores, CA, USA) and was based on PK parameters and calculated PK–PD targets of lung tissues (AUC24h/MIC) for bactericidal action (E = −3) [41]. The AUC24h was presumed to be log-normally distributed for the confidence intervals (CI) and mean values. The PK–PD target was evaluated. Conservative value (AUC/MIC = 37.34) was selected to calculate the probability of target attainment (PTA). COPD was defined as the MIC when the PTA was ≥90%.

2.6. Exploration of COCL

2.6.1. Dose Regimen Based on PK–PD Model

Calculation of the dosage under different parameters used the dosage Equation (2),
Dose = CL × MIC × ( AUC 24 / MIC ) ex F × f u
where CL refers to the clearance rate of danofloxacin in the chicken respiratory tract; (AUC24/MIC)ex refers to the PK–PD parameter value corresponding to different therapeutic effects (bactericidal, antibacterial and eradication); MIC is the minimum inhibitory concentration of M19 strain; F is the bioavailability; fu is the free drug concentration ratio.
The probabilities of distribution for daily doses were run for 10,000 trials to achieve the target value of 90% for (E = 0) bacteriostatic, (E = −3) bactericidal, and (E = −4) bacterial elimination effects.

2.6.2. Infection Model and Clinical Trials

A total of 165 healthy broilers (500 ± 50 g) were divided into 11 groups: five groups were the experimental group, five groups were the negative control group, and one group was the blank control group, with 15 broilers in each group. The five experimental groups and five negative control groups were challenged with five representative strains, M2, M19, M24, M57, and M73, by tracheal perfusion inoculation of 1 × 10¹⁰ CCU bacterial suspension once a day for 7 d. The blank control group was inoculated with blank FM-4 broth. The dosage regimens were recommended by the PK–PD therapeutic dosage regimen. After oral administration, these broilers were monitored daily for one week. The cure rate and mortality were counted. After successful infection, the clinical bacteriology prognosis was determined by the real-time fluorescence quantitative PCR method by extracting the throat swab DNA of each group of chickens at regular intervals every day during the all experiment period.

2.6.3. The Establishment of the Standard Curve of MG by Real-Time PCR

Strain and samples. MG S6 was obtained from the National Reference Laboratory of Veterinary Drug Residues. Salmonella ATCC 14028, Klebsiella pneumoniae CMCC 46117, Pseudomonas aeruginosa ATCC 27853, Staphylococcus aureus ATCC 6538 were purchased from Huankai Microbial Technology Co., Ltd. (Guangdong, China). Pasteurella pneumotropica ATCC 35149, Corynebacterium kutscheri ATCC 15,677 were purchased from American Type Culture Collection (Manassas, VA, USA).
Throat swabs from clinical trials were sampled as described [42], and transferred to the laboratory for real-time PCR testing. One throat swab per bird was used for real-time PCR as follows: First, the tracheal swab was streaked onto FM-4 agar and then placed into 400 µL of sterile physiologic saline. After vortexing for 2 min, the mixture was used for DNA isolation.
DNA extraction. DNAs from MG S6 and clinical samples were extracted with a commercial DNA isolation kit (QIAMP DNA mini kit, Berlin, Germany).
Primers. Forward and reverse PCR primers, MG-1F (5′-GATTTCGAAGAATCAACTGT-3′) and MG-2R (5′-AAGGGATTAATATTCCCAAC-3′) were selected to amplify an internal portion of an MG lipoprotein gene. The expected amplicon size was 400 bp with Vector NTI 4.0 software (Infomax, Inc., North Bethesda, MD, USA).
Construction of plasmid standard. A standard plasmid pUC57-MG containing the sequence of the target fragment was synthesized by Beijing Kinco Xinye Biotechnology Co., Ltd. (Beijing, China). The obtained plasmid standard was amplified with the universal sequencing primers M13-F (5′-TGTAAAACGACGGCCAGT-3′) and M13-R (5′-CAGGAAACAGCTATGACC-3′) of vector pUC57 and sequenced by Beijing Kinco Xinye Biotechnology Co., Ltd.
Real-time PCR assay system and conditions. Real-time PCR was performed using a LightCyclerTM 2.0 (Roche Diagnostics, Mannheim, Germany). Each reaction had a volume of 20 µL, including 18 µL of reaction mixture containing 1 × LC FastStart DNA SYBR Green I Master Mix (Roche), MgCl2 (4 mM), a 0.5 µM concentration of each primer and 2 µL of template DNA.
Cycling parameters were as follows. Initial denaturation at 95 °C for 10 min followed by 40 cycles of denaturation at 95 °C for 10 s, annealing at 50 °C for 5 s and extension at 72 °C for 20 s. Melting curve analysis was performed automatically by LightCycler 2.0 software (Version 3), and the melting peaks were expected to occur at a melting temperature (Tm) of 80 °C.
Standard curve construction. Measurement of the concentration of the plasmid standard was performed with an ultra-micro UV spectrophotometer (Roche Molecular Biochemicals, Indianapolis, IN, USA).
Calculation of the copy concentration of the plasmid standard according to the Equation (3):
A ( copies / μ L ) = 6.02 × 10 23 × C ( ng / μ L ) × 10 9 L ( bp ) × 660
where A represents the copies of plasmid standard. C represents the concentration of the sample. L represents the template length. Plasmid standard was diluted to 5 × 10⁶, 5 × 10⁵, 5 × 10⁴, 5 × 10³, 5 × 10², 5 × 101, 5 × 100 copies/μL at a 10-fold ratio, and sterile PCR-grade deionized water is negative for comparison. A standard curve was drawn based on real-time fluorescence quantitative PCR amplification.
Sensitivity and specificity of real-time PCR. To verify the sensitivity of the method, six plasmid standards with a gradient of concentration dilutions (5 × 10⁵, 5 × 10⁴, 5 × 10³, 5 × 10², 5 × 101 and 5 × 100 copies/μL) that were used as positive templates, sterile PCR-grade deionized water was used as a negative control for quantitative fluorescence PCR, respectively.
For specificity, real-time PCR was applied to the templates prepared from the following strains: Salmonella ATCC 14028, Klebsiella pneumoniae CMCC 46117, Pseudomonas aeruginosa ATCC 27853, Staphylococcus aureus ATCC 6538, Pasteurella pneumotropica ATCC 35149, Corynebacterium kutscheri ATCC 15677. These strains were selected for testing the specificity of real-time PCR.
Real-time PCR with clinical samples. The throat swabs were taken from each group of chickens at regular intervals every day during the experiment period. The same procedure was applied for DNA preparation from all of the samples. MG S6 strain DNA and sterile PCR-grade deionized water were used as positive and negative controls in each PCR run, respectively. Performing real-time PCR amplification and taking the number of cycles (Ct) of the reaction as the abscissa of the amplification curve of the PCR assay, and the intensity of the fluorescence signal could be seen as the ordinate to obtain the amplification curve and the standard curve.

2.6.4. Statistical Analysis for the Establishment of COCL

The obtained data were analyzed by WindoW, CART and nonlinear regression analysis to obtain the final COCL. The WindoW approach, which constrains the determination of COCL to values contained within a window (or limited) range of MICs, included “MaxDiff” and “CAR”. The former represents the difference between higher and lower POC at a certain MIC. The latter was determined according to the clinical outcome and the corresponding MIC distribution. However, “CAR” could not be set as the lowest MIC or the highest MIC if “CAR” was gradually increasing with MIC, then the “CAR” should choose the second small “CAR”. The boundaries of WindoW were determined by two inflection points [27].
The second approach to establish COCL was the CART model (Salford Predictive Modeler software). MIC and POC were predictive variables and target variables, respectively. Moreover, the Gini coefficient minimization criterion was used to select the MIC node automatically.
Nonlinear regression analysis proposed by EUCAST was a new approach based on the formula between POC and MIC. Log2MIC was the independent variable, and the POC was the dependent variable. Frequently, the COCL was selected by the highest correlation coefficient of the model.

2.6.5. Evaluation of the Effect of Danofloxacin on the Lung Microbiota of MG Infected Chickens

16S rRNA gene sequencing was used to analyze the effect of danofloxacin on the lung microbiota of MG-infected chickens. The effective tags of all samples were clustered to study the species composition diversity of the samples of different groups, and the OTUs were the sequences that were clustered with 97% consistency (Identity). Species annotations to the representative sequence of OTU with GreenGenes 13_8 database to obtain a relative abundance of the phylum level. It is shown here that at least a phylum that has a relative abundance in a sample is greater than 1%. The index Chao 1, Shannon and inverse Simpson were used to reflect the alpha diversity of the sample. Chao1 predicts the number of microorganisms based on the number of OTUs in the measured samples, which is also a standard for measuring species abundance. Shannon and Simpson are the diversity index that integrates OTU abundance and OTU uniformity.

3. Results

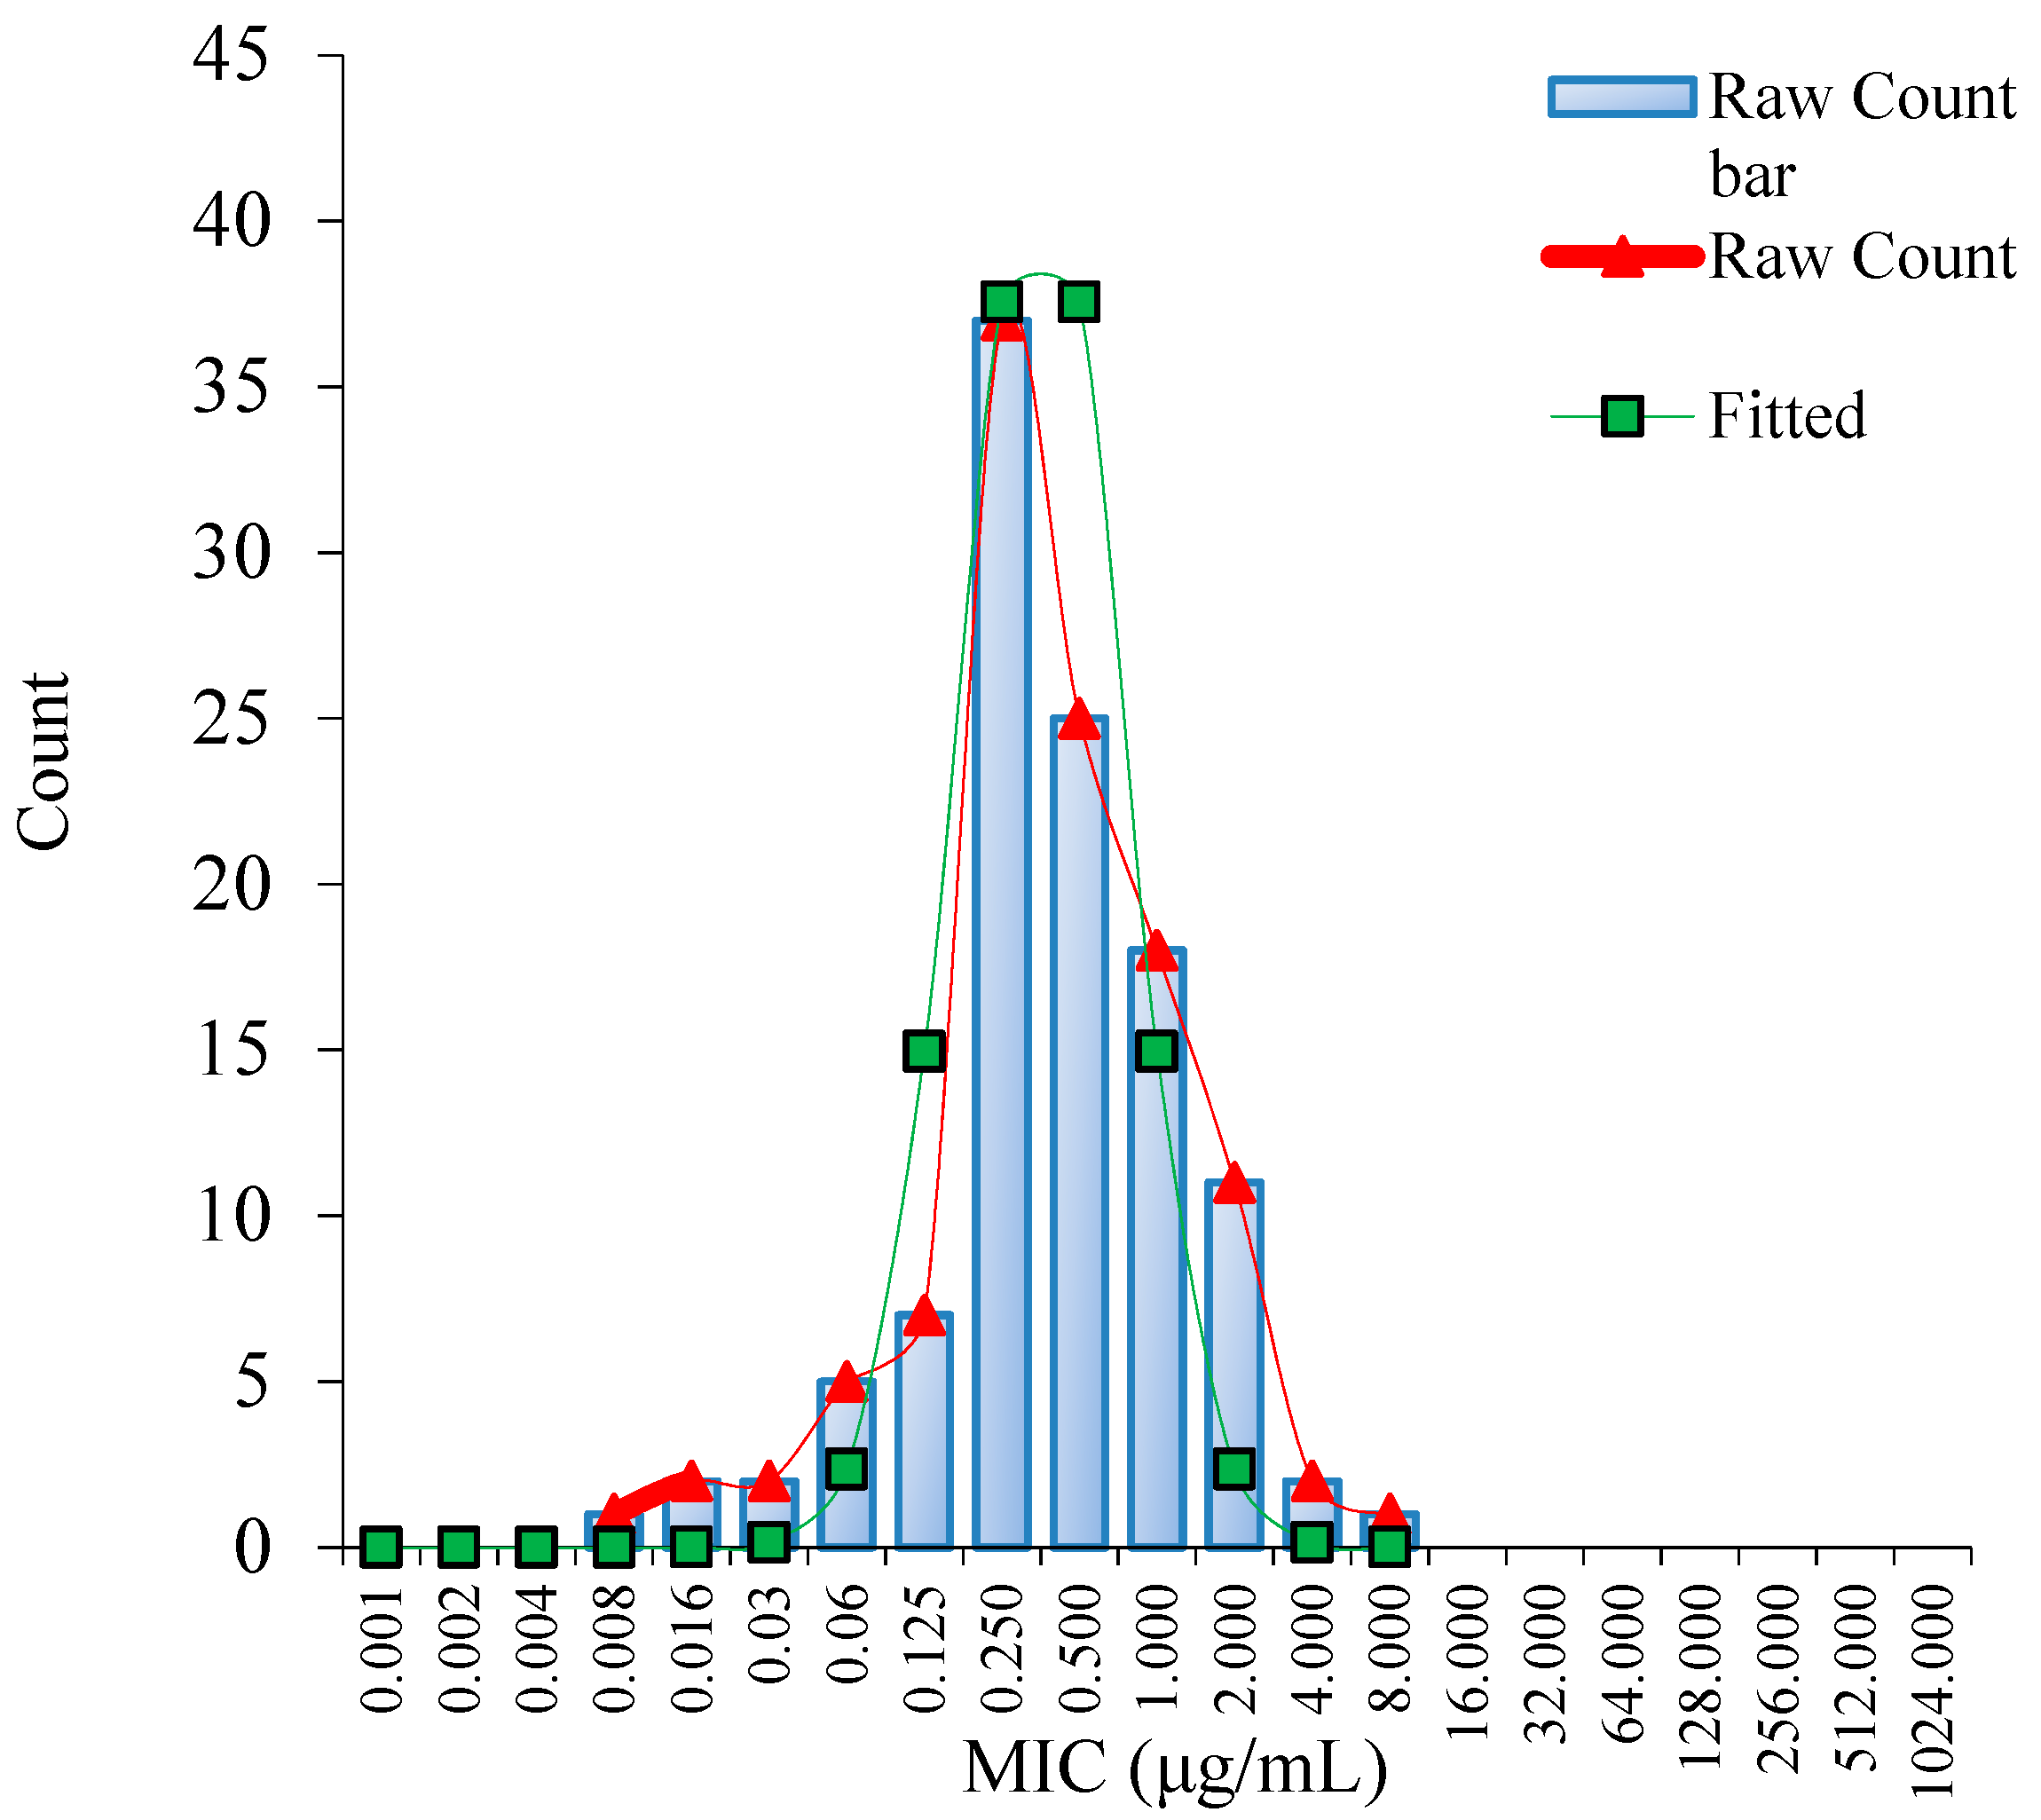
3.1. MIC Distribution and Establishment of the ECV

As shown in Figure S1, all MG isolates have been verified by Polymerase Chain Reaction (PCR). To ensure the accuracy and reliability of experimental procedure, Escherichia coli (E. coli) (ATCC 25922) was selected as the Quality Control (QC) strain. The MIC of danofloxacin for E. coli (ATCC 25922) was 0.03 µg/mL, which was within the acceptable QC range (0.008~0.06 μg/mL) according to CLSI document M37–A3. The MICs of 111 isolated MG strains ranged from 0.008 to 8 μg/mL, including 0.008 µg/mL (0.90%), 0.015 µg/mL (1.80%), 0.03 µg/mL (1.80%), 0.06 µg/mL (4.50%), 0.125 µg/mL (6.30%), 0.25 µg/mL (33.33%), 0.5 µg/mL (22.52%), 1 µg/mL (16.22%), 2 µg/mL (9.91%), 4 µg/mL (1.80%), 8 µg/mL (0.90%). The MIC50 and MIC90 were 1 µg/mL and 2 µg/mL, respectively.
Using the ECOFFinder software, the fitted MIC distribution of danofloxacin against MG was determined (Figure 1). The ECV at 95%, 97.5%, 99.0%, 99.5% and 99.9% confidence intervals were 1 μg/mL, 1 μg/mL, 2 μg/mL, 2 μg/mL and 4 μg/mL, respectively (Table S2). The MIC of 95% confidence rate or 97.5% was selected as the ECV. Accordingly, the ECV of danofloxacin against MG was 1 μg/mL.

3.2. COPD for Danofloxacin against MG

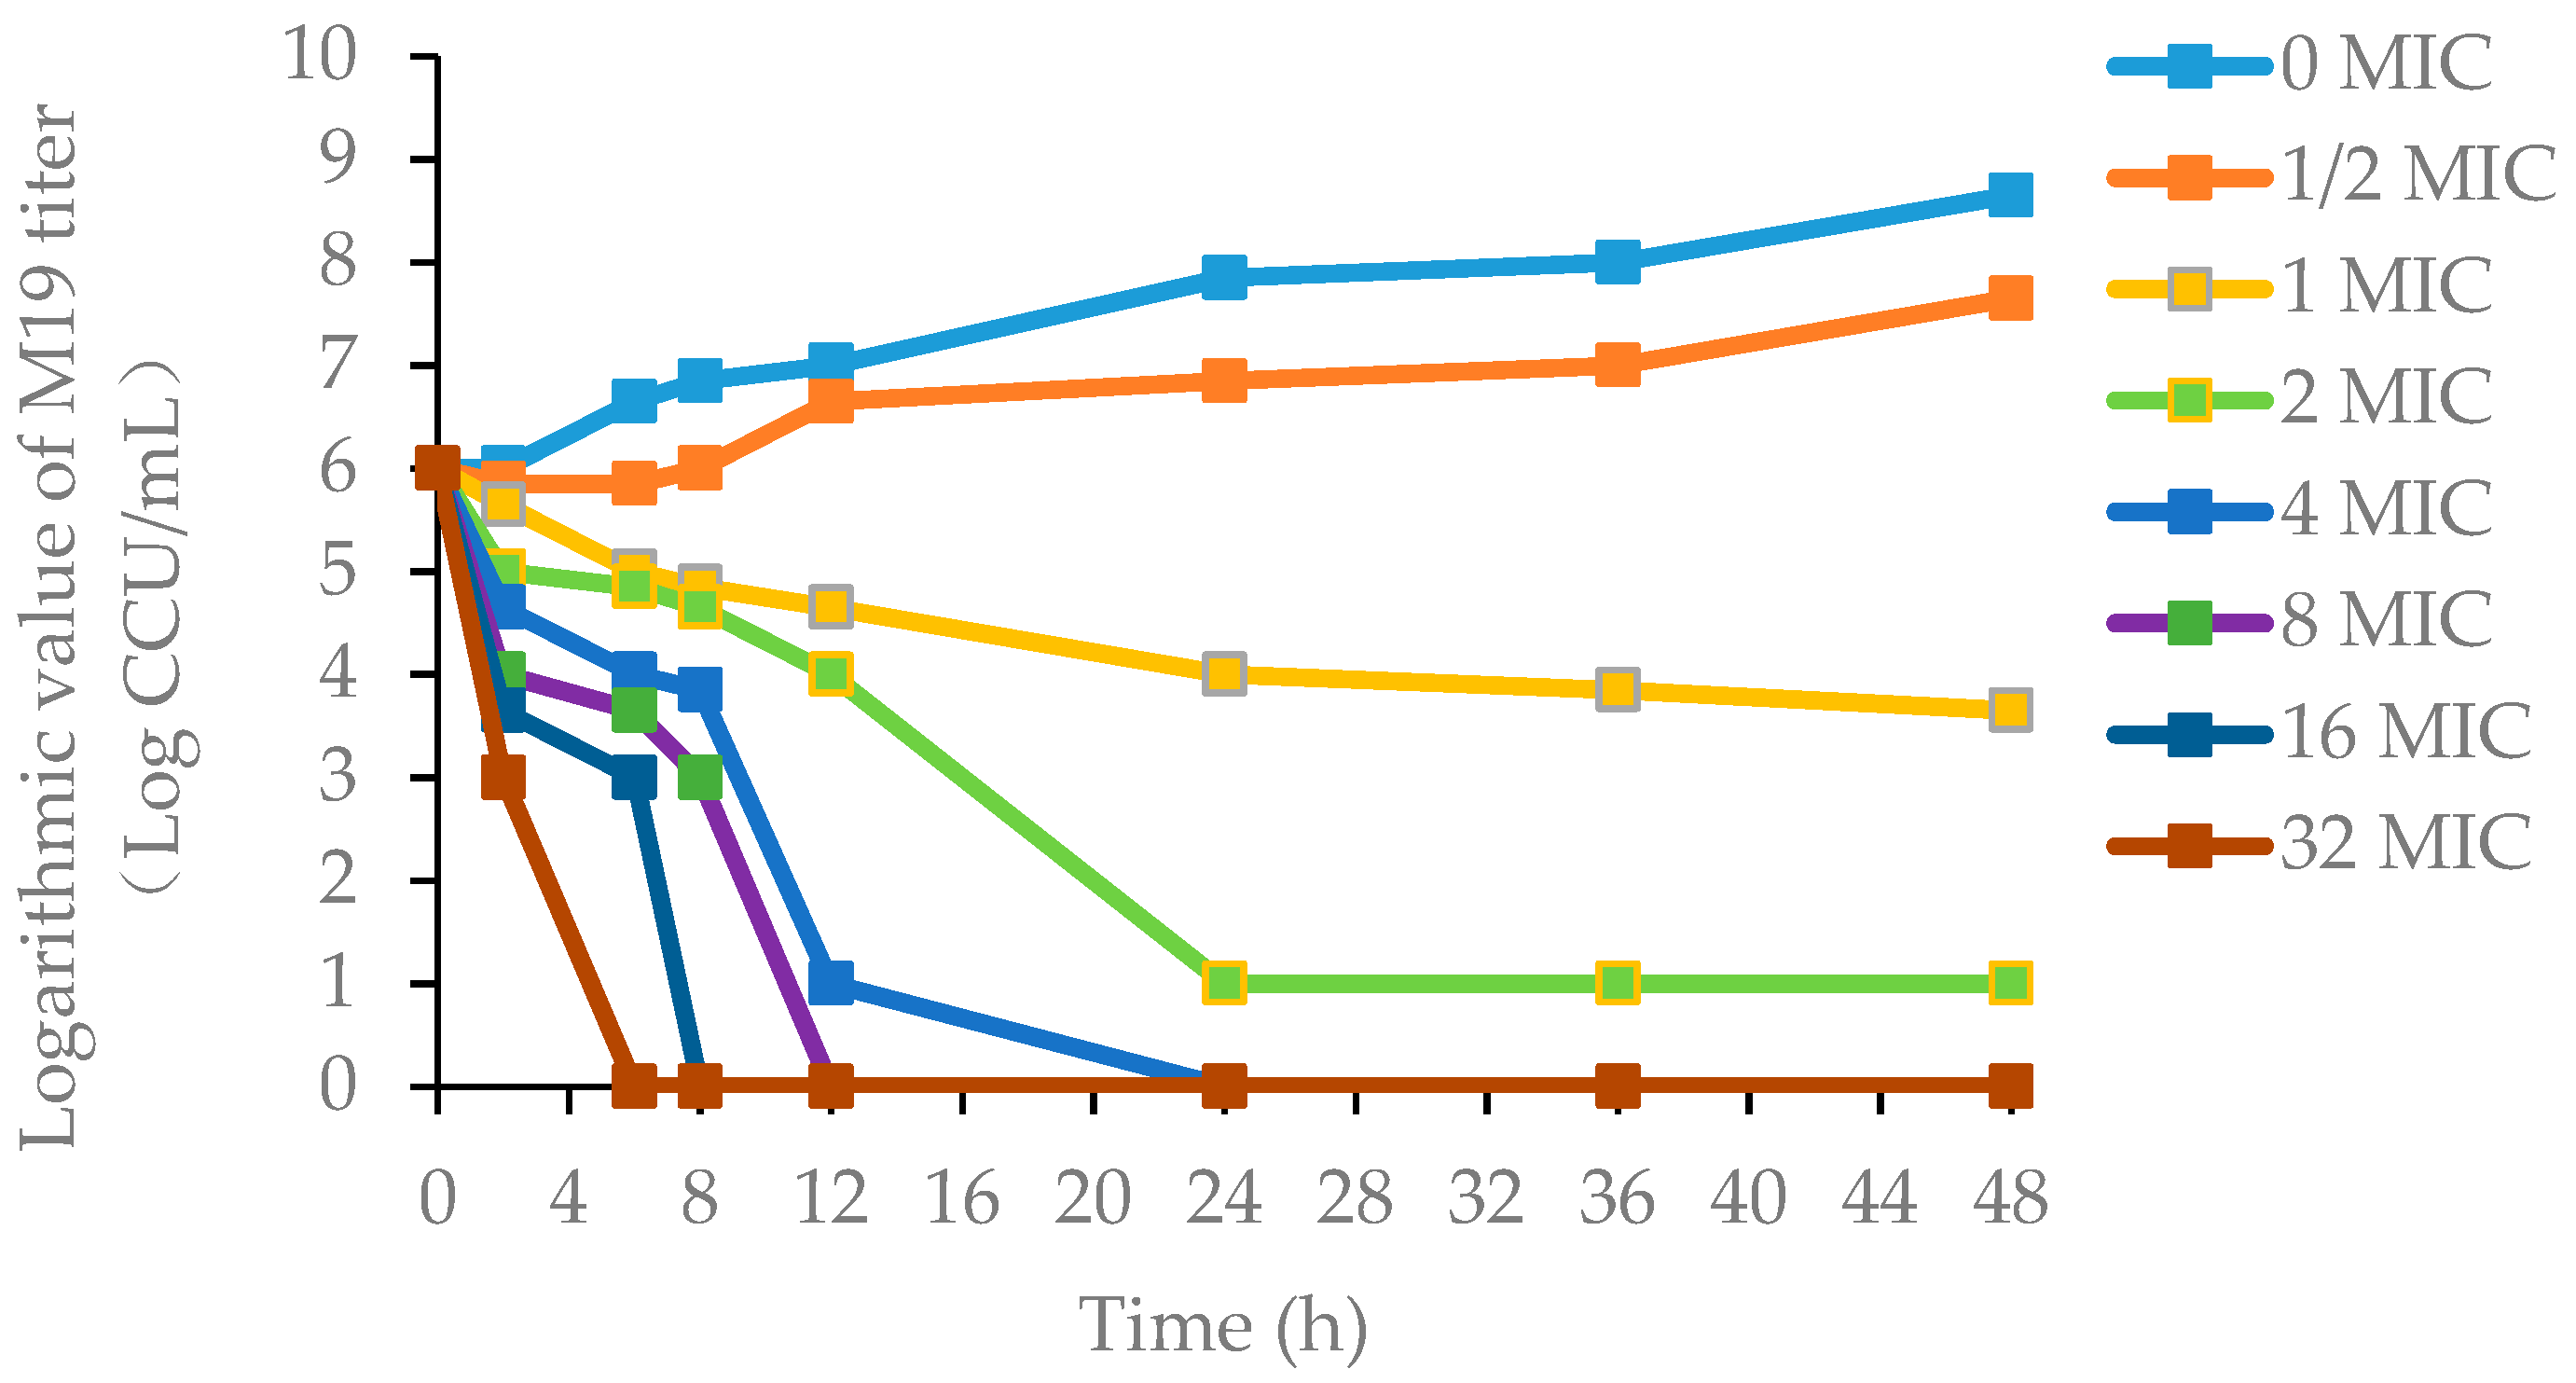
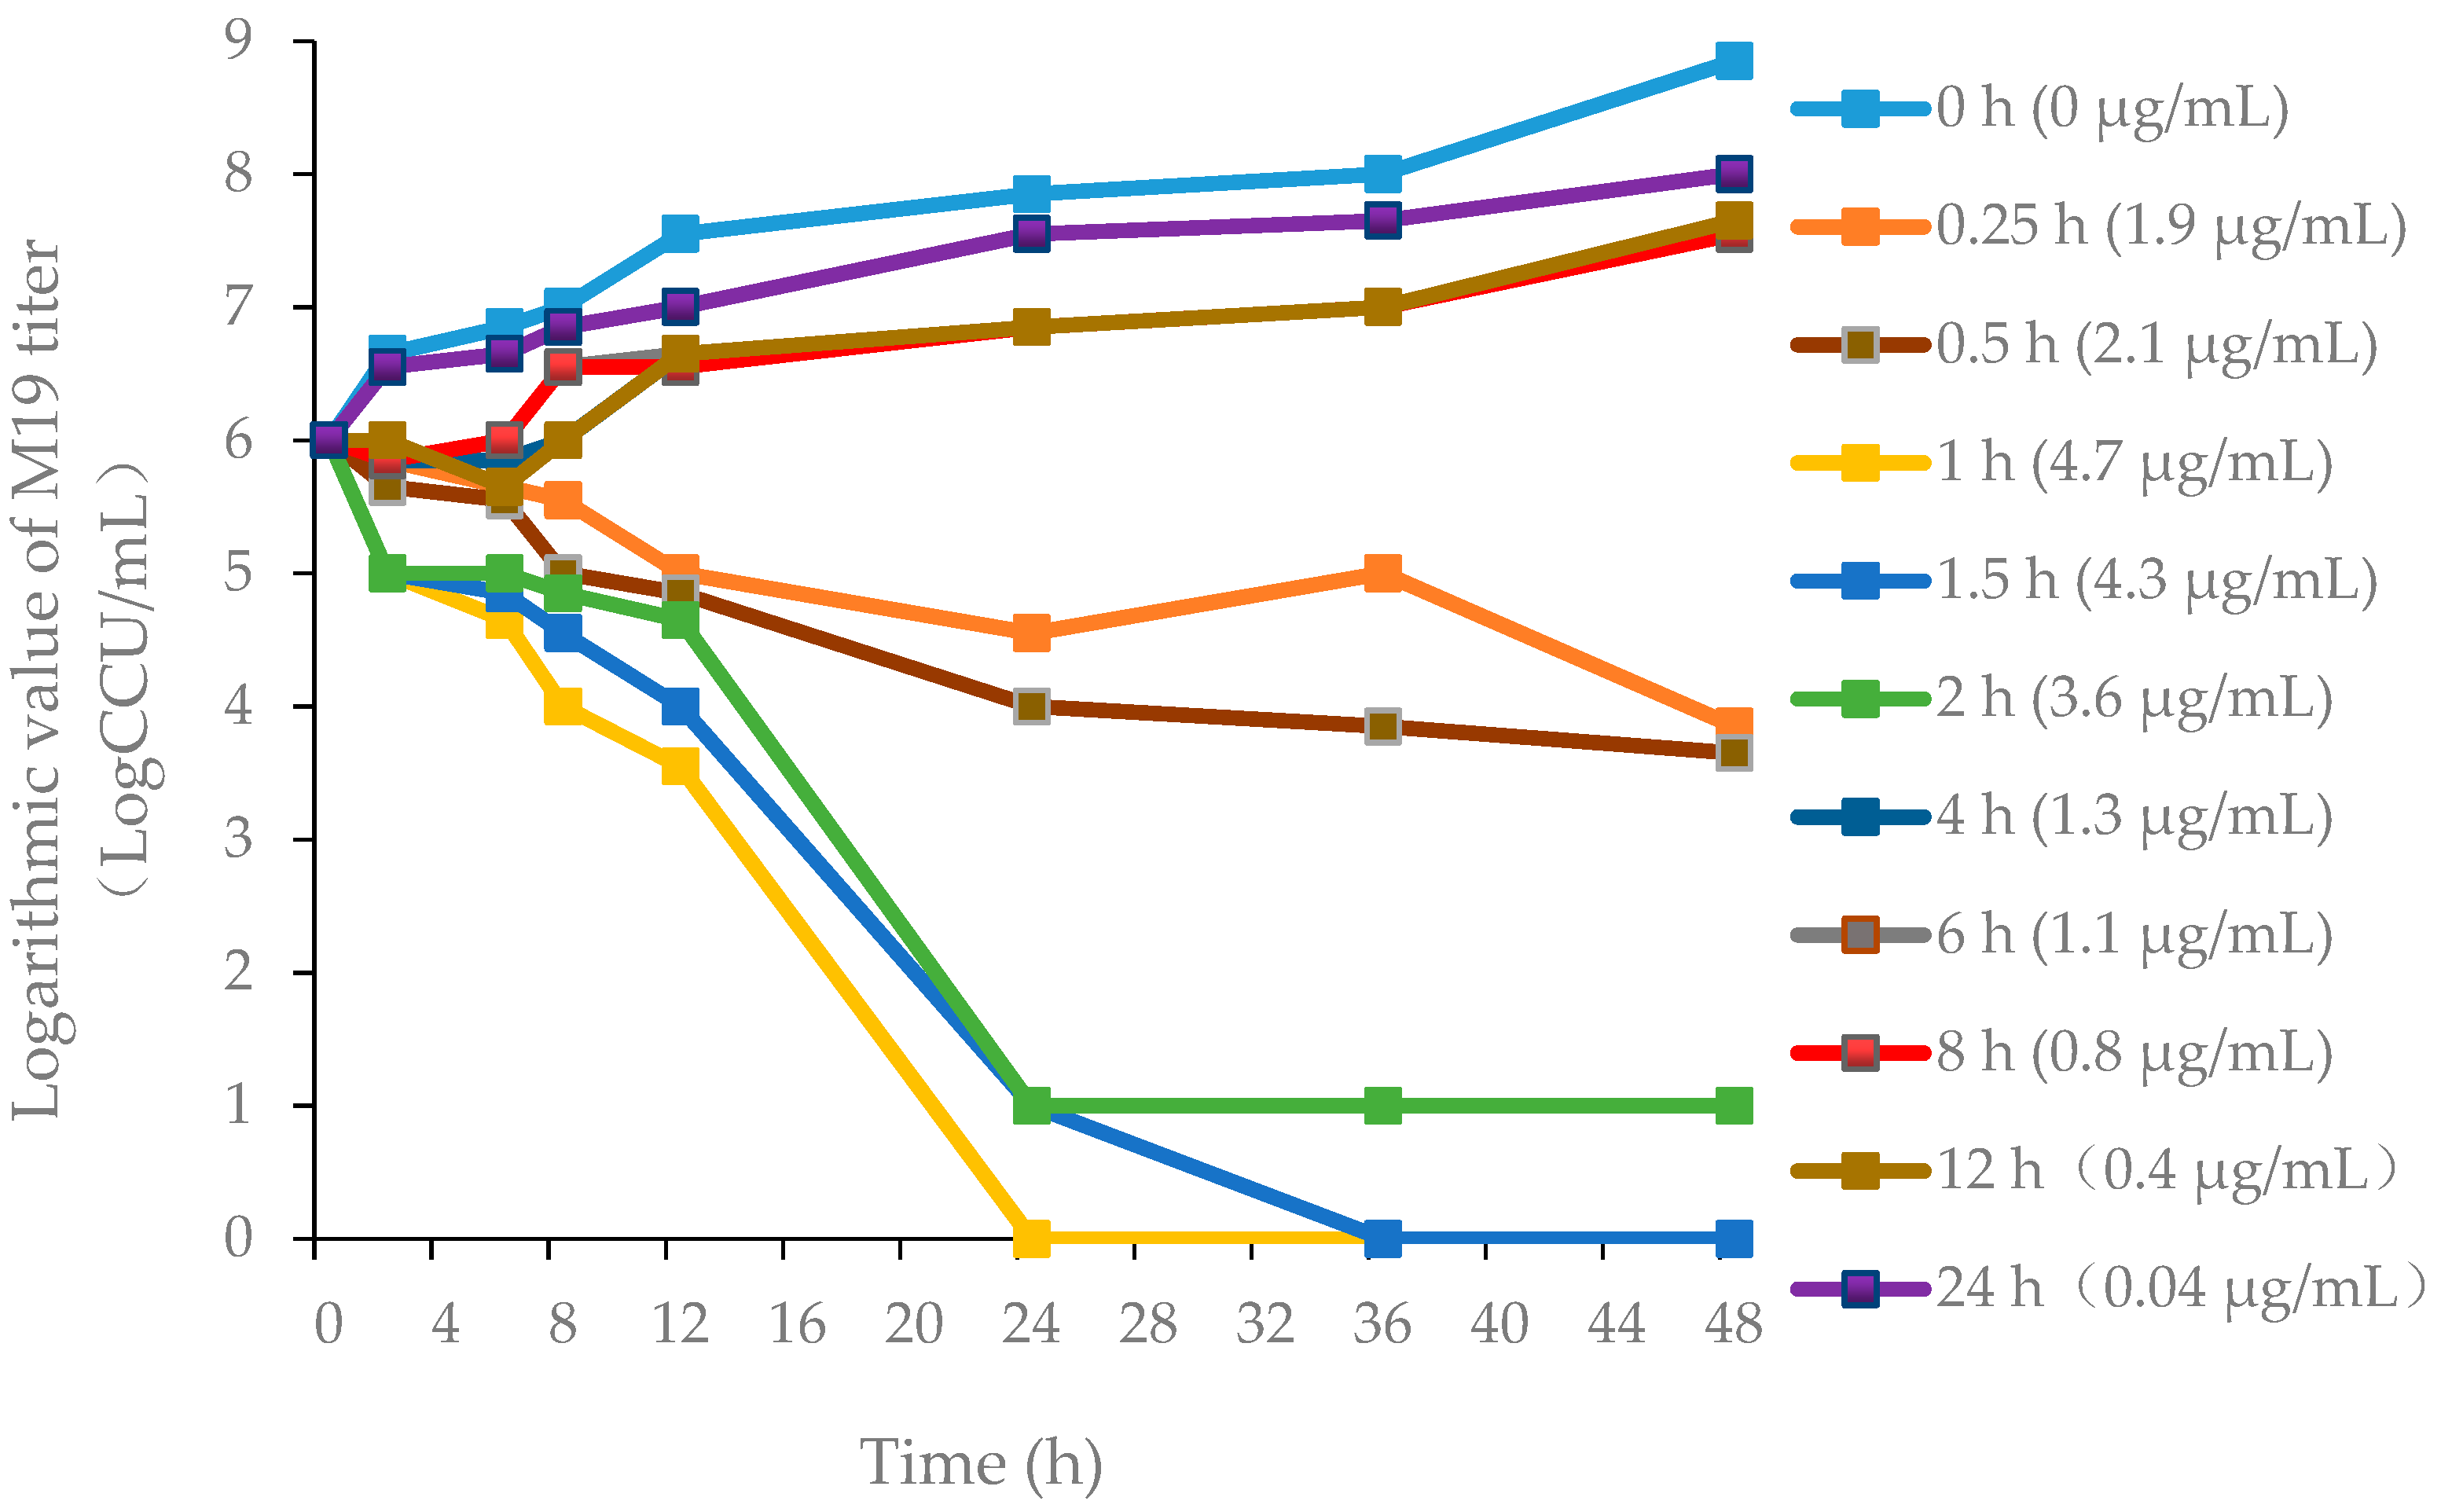
3.2.1. Pharmacodynamics of Danofloxacin against MG in the Plasma and Lung

M19 was chosen as the representative since it was a highly pathogenic strain as verified by the chicken embryo virulence test (Table S1). The MICs of M19 to danofloxacin in FM-4 broth and lung tissue (healthy or infected) were 2 μg/mL. The MBCs in FM-4 broth lung tissue (infected) was 4 μg/mL, and 2 μg/mL, respectively. The data above indicated that the antimicrobial activity of danofloxacin in lung tissue was equivalent to that in FM-4 broth.
The killing-time curves of danofloxacin against M19 in vitro are shown in Figure 2, and the killing-time curves of danofloxacin against M19 in the healthy plasma, the healthy lung and the infected lung are shown in Figure 3, Figures S2 and S3, respectively. The bactericidal effect of danofloxacin against MG in vitro was similar to that of ex vivo. These data demonstrated that danofloxacin had an activity of killing that depends on the concentrations ex vivo, consistent with the in vitro bactericidal activity. The inhibitory efficiency gradually strengthened following the increased drug concentration when danofloxacin concentrations were higher than MIC (2 μg/mL). During 0–12 h, the danofloxacin concentration in the lung was higher than in the plasma. It revealed that danofloxacin had good distribution in the lung tissue and was suitable for pulmonary infections. At each time point, the danofloxacin concentration of the infected group was higher than that of the healthy group, which indicated that the disease had an impact on the distribution of the danofloxacin. The killing-time curves revealed that the antibacterial effect of danofloxacin against MG was concentration-dependent. The best PK–PD parameter for danofloxacin was the Area Under Curve/Minimum Inhibitory Concentration (AUC/MIC).

3.2.2. Verification of HPLC Method for Determination of Danofloxacin

The linear range for the standard curve of danofloxacin ranged from 0.029 to 5 μg/mL (r2 = 0.9994) in plasma and 0.05 to 5 μg/mL (r2 = 0.999) in lung tissue. The limits of quantification (LOQ) were 0.05 μg/mL in plasma and 0.029 μg/mL in lung tissue. The limits of determination (LOD) were 0.027 μg/mL in plasma and 0.014 μg/mL in lung tissue. The mean recovery of danofloxacin was >87.62% in the plasma and lung tissue. The coefficient of variability (CV%) was <2.84% for both intra- and inter-day variation.

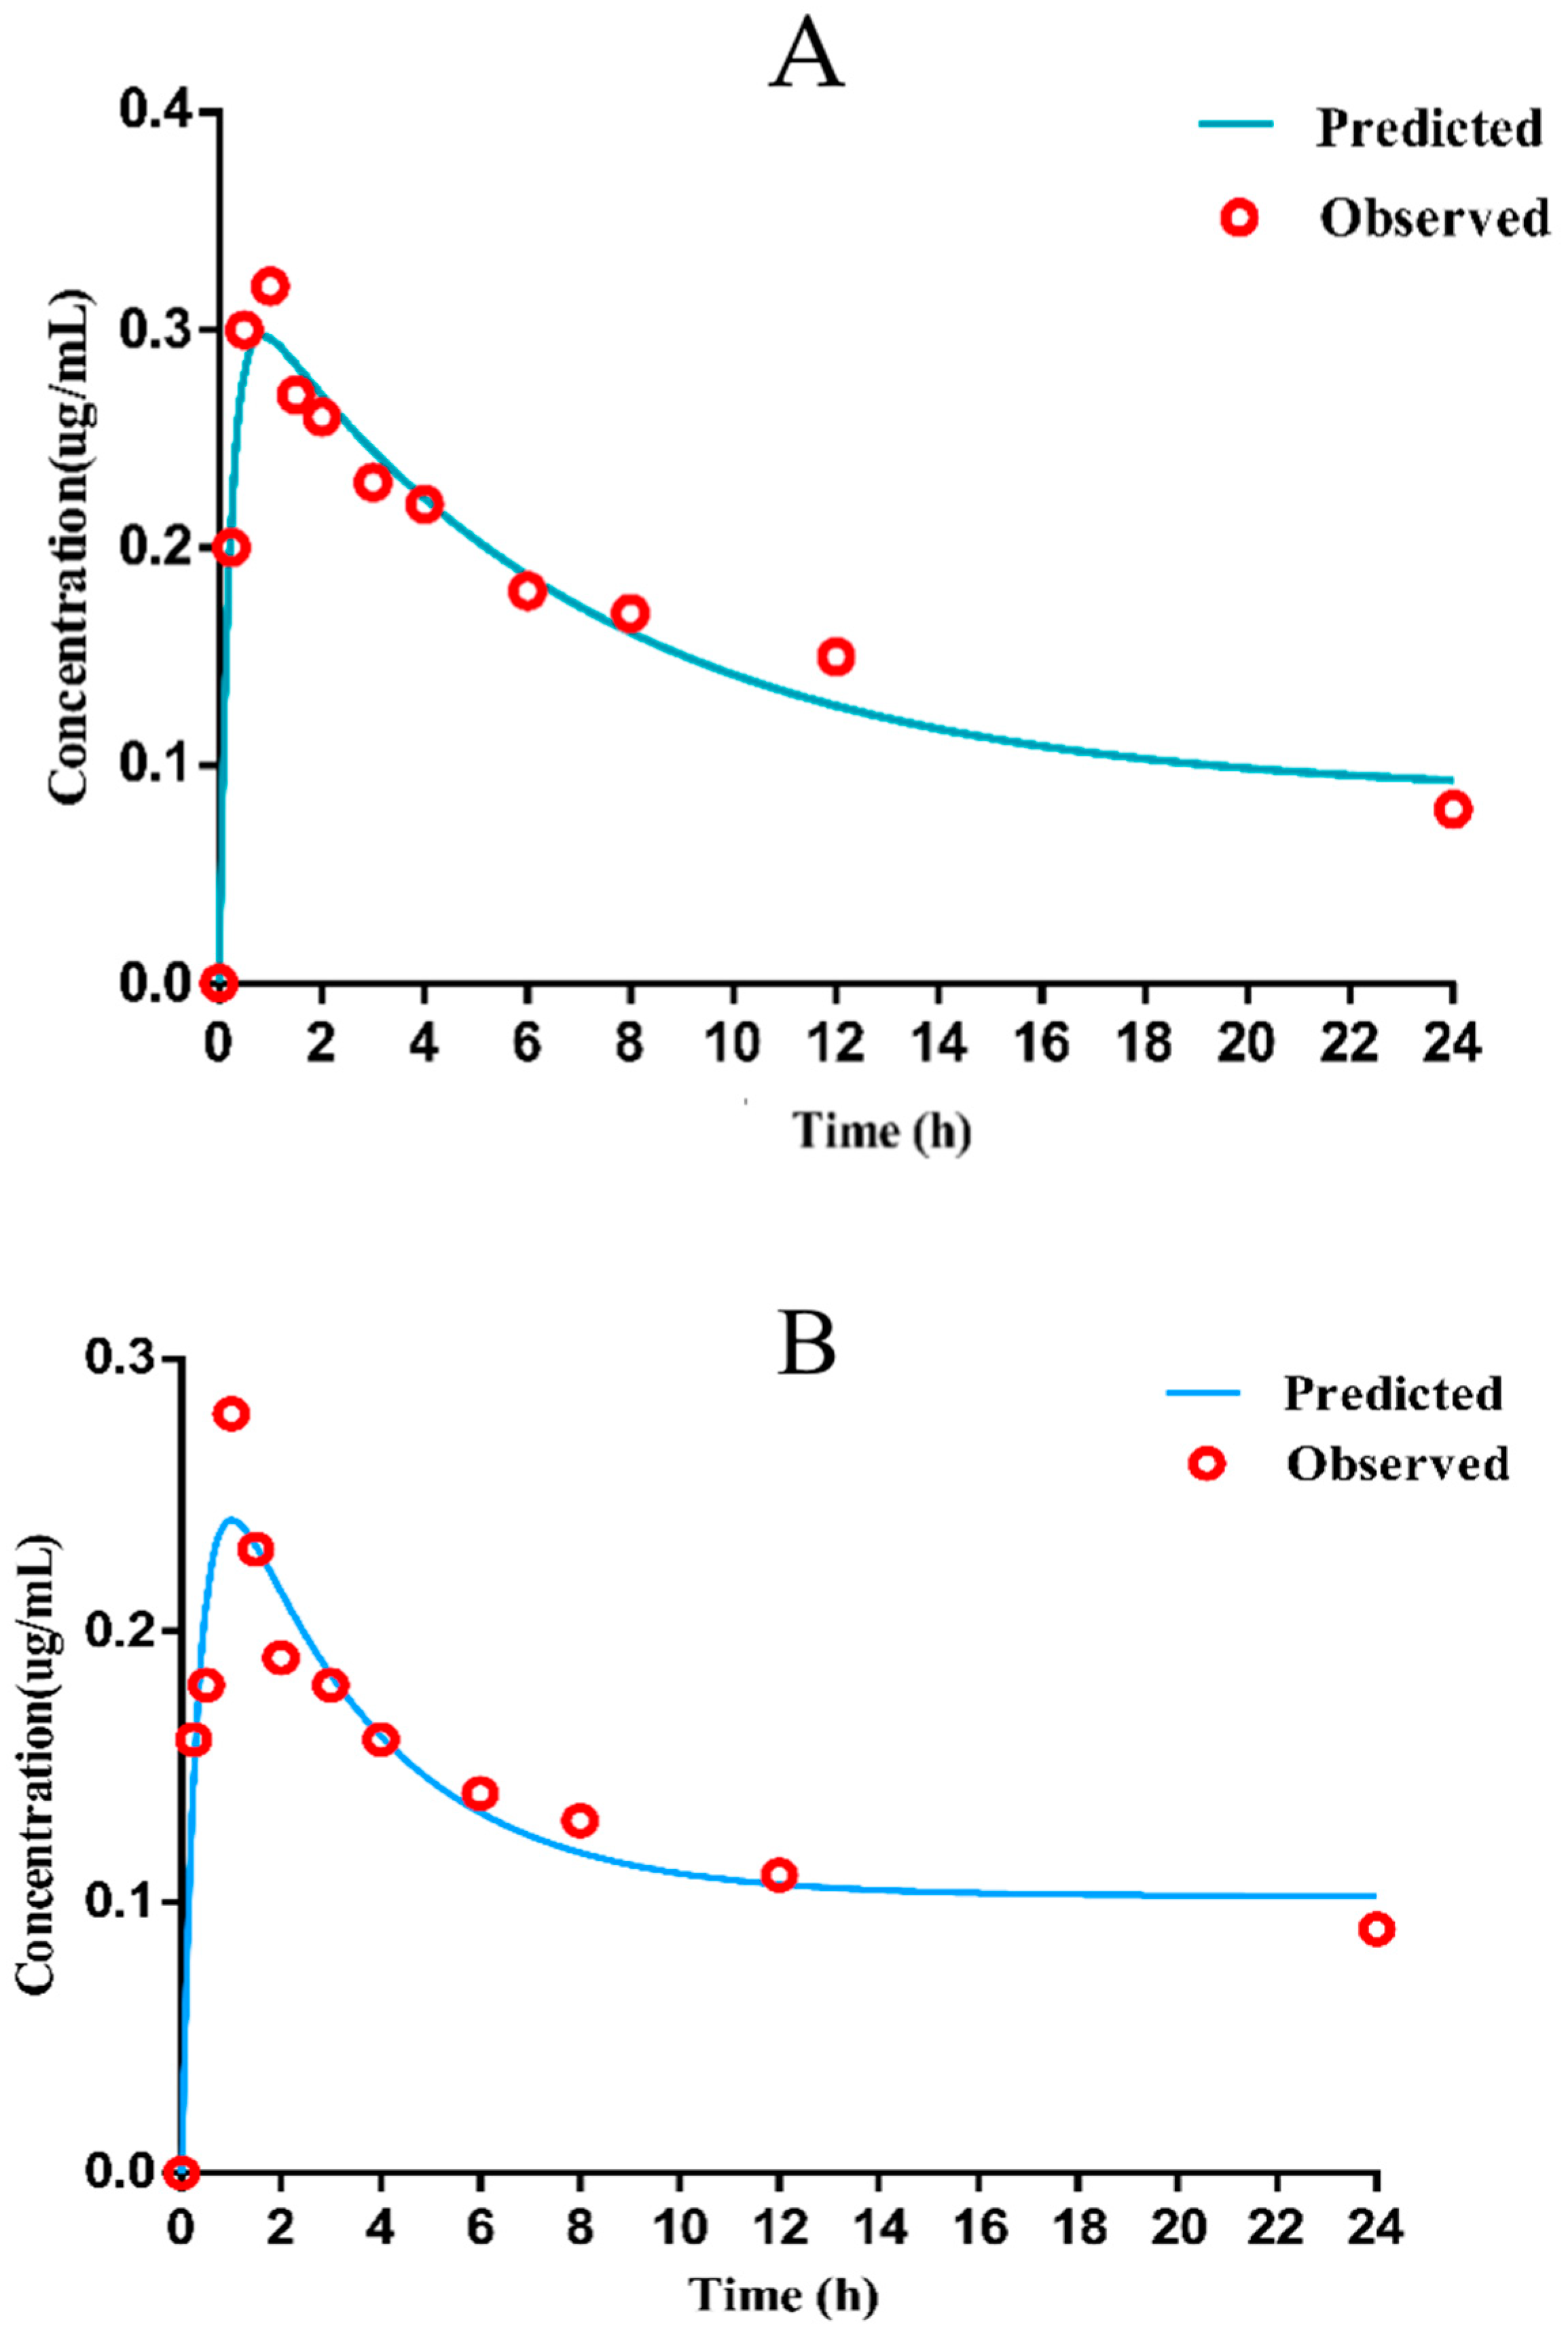
3.2.3. PK Parameters of Danofloxacin in Plasma and Lung

The mean drug-time curve of danofloxacin (Figure 4A,B) in chicken lung tissues (healthy or diseased) includes the distribution phase and absorption phase, which accords with the first-order absorption two-compartment model. The pharmacokinetic data simulated by Winnonlin software are shown in Table 2.
The results shown that the concentration of drug in lung tissue was about 13–16 times higher than that in the plasma (Table S3). As displayed in Table 1, the peak time (Tmax) was 0.99 ± 0.10 h, and the peak concentration (Cmax) was 0.28 ± 0.01 µg/mL, the AUC was 6.12 ± 0.24 h·µg/mL in infected plasma; in infected lung tissue, Tmax was 1.30 ± 0.01 h, Cmax was 4.71 ± 0.29 µg/mL, AUC was 23.67 ± 2.24 h·µg/mL. Since the Tmax in plasma is lower than 1/2 MIC of the selected strain, it was considered that the bactericidal effect could not be achieved. Therefore, the PK parameters in the target diseased lung tissue were selected to determine the COPD of danofloxacin against MG.

3.2.4. Integration Modeling

The parameter values of the Emax, E0, N (Hill coefficient), and AUC24h/MIC of the model for three different levels of the growth inhibition conditions are shown in Table 3. The standards of the AUC24h/MIC ratio calculated for the E = 0 (bacteriostatic activity), E = −3 (bactericidal activity), and E = −4 (bacterial elimination) were 20.09, 37.34, and 46.67 h, respectively.

3.2.5. Monte Carlo Simulation and COPD

As is shown in Supplementary Figure S4, the study analyzed the COPD corresponding to different E values. This study was mainly based on the PD target value when E = −3, which killed 99.9% of the bacteria to achieve clinical treatment to develop a drug resistance standard. Therefore, the COPD of danofloxacin against MG in the lung tissue of this subject was 0.5 μg/mL, at which the probability of target attainment (PTA) ≥ 90%.

3.3. COCL for Danofloxacin against MG

3.3.1. Dose Regiment Based on the PK–PD Model

The protein binding rate of danofloxacin with different drug concentrations in lung tissues remained basically the same; both were 10%. The dose of (AUC24h/MIC)ex corresponding to the purpose of different antibacterial effects of danofloxacin was substituted into the dose calculation equation to determine the dose required to achieve different antibacterial effects (Table S4 and Figure S5). In summary, the 24 h dosing interval of 16.60 mg/kg b.w. of oral administration for three consecutive days was the optimal dosing regimen, as determined by MLXPLORE software.

3.3.2. Establishment of the Standard Curve of MG by Real-Time Fluorescence Quantitative PCR

The initial copy number of the plasmid constructed in this experiment was 1.58 × 10⁹ copies/μL. After PCR amplification of the standard plasmid, the amplified products were sequenced. The obtained sequences were compared using Blastn (NCBI) and showed that the homology between the MG S6 lipoprotein gene and the target fragment was 99.3%, indicating that the recombinant plasmid was successfully constructed. The amplification curves and standard curve of the quantitative fluorescence PCR in this experiment are shown in Figure S6, where the logarithm of the plasmid copy number is taken as the abscissa (X), and the Ct value was taken as the ordinate (Y). The formula was Y = −3.334X + 42.791, the correlation coefficient was R2 = 0.990, and the amplification efficiency value was 99.5%. The real-time fluorescent quantitative PCR method can detect the lowest concentration of plasmid standards at five copies/μL and no amplification curve for other bacteria (Salmonella ATCC 14028, Klebsiella pneumoniae CMCC 46117, Pseudomonas aeruginosa ATCC 27853, Staphylococcus aureus ATCC 6538, Pasteurella pneumotropica ATCC 35149, Corynebacterium kutscheri ATCC 15677), which indicated the good sensitivity and specificity. Use this fluorescence quantitative PCR method to detect a variety of common pathogens. The results are shown in Figure S6. Substituting the Ct value of the PCR assay into the standard curve equation, the initial copy number of clinical sample DNA could be calculated.

3.3.3. Clinical Efficacy Assessment Indicators and Bacteriological Prognosis

The clinical treatment outcome is shown in Table 4. It could be seen from the results that as the MIC value of the infected strain increases, the clinical cure rate, degree of air sac damage, and weight gain were also significantly reduced.
DNA was extracted from the throat swabs of the chicken during all the experiments to calculate the bacterial load (Figure S7). The number of bacteria in the experimental group increased with an increase in infection time. When the administration started, the number of bacteria decreased significantly, and the therapeutic effects of low MIC challenge were better than that of chickens with high MIC, according to most of the observations. Only the group challenged with the high MIC MG strain could be detected on the third day, but the copy number was close to the detection limit.

3.3.4. Determination of COCL

The obtained data were first analyzed by the WindoW method, and the parameter values MaxDiff (the method of maximum difference) and CAR (the cumulative area under the curve (AUC) ratio) were calculated as shown in Table 5 and Figure S8, respectively. The AUCTotal for MIC = 4 μg/mL was calculated as [0.5 × (0.016 × 15)] + [0.5 × (0.25 − 0.016) × (15 + 15)] + [0.5 × (1 − 0.25) × (15 + 15)] + [0.5 × (2 − 1) × (15 + 15)] + [0.5 × (4 − 2) × (15 + 15)] = 44.763; the AUC succ for MIC = 4 μg/mL was calculated as [0.5 × (0.015 × 15)] + [0.5 × (0.25 − 0.016) × (15 + 14)] + [0.5 × (1 − 0.25) × (10 + 14)] + [0.5 × (2 − 1) × (9 + 10)] + [0.5 × (4 − 2) × (8 + 9)] = 1.36, it was also equal to A + B + C + D + E. By this approach, the COCL was determined to be from 0.25 to 2 μg/mL. The CART (the classification and regression tree) results suggested that the COCL should be less than 0.63 μg/mL (Figure S9). Then the COCL was analyzed with a logistic regression model with the MIC as the independent variable (X axis) and the Probability of Cure as the dependent variable (Y axis) (Figure S10). The nonlinear regression equation was Y = 71.708 − 9.463X + 0.453 X2 + 0.206 X3, and the correlation coefficient (R2) was 0.98. Non-linear regression analysis was performed that when the cure rate was 90%, the log2MIC was −1.9, so the COCL was calculated to be less than 0.27 μg/mL. The COCL were analyzed by the WindoW approach, nonlinear regression and CART analysis were 0.25 μg/mL–2 μg/mL, 0.25 μg/mL–0.63 μg/mL and 0.27 μg/mL, respectively. Combining the three COCL value ranges obtained, the 0.25 µg/mL was selected as eligible COCL.

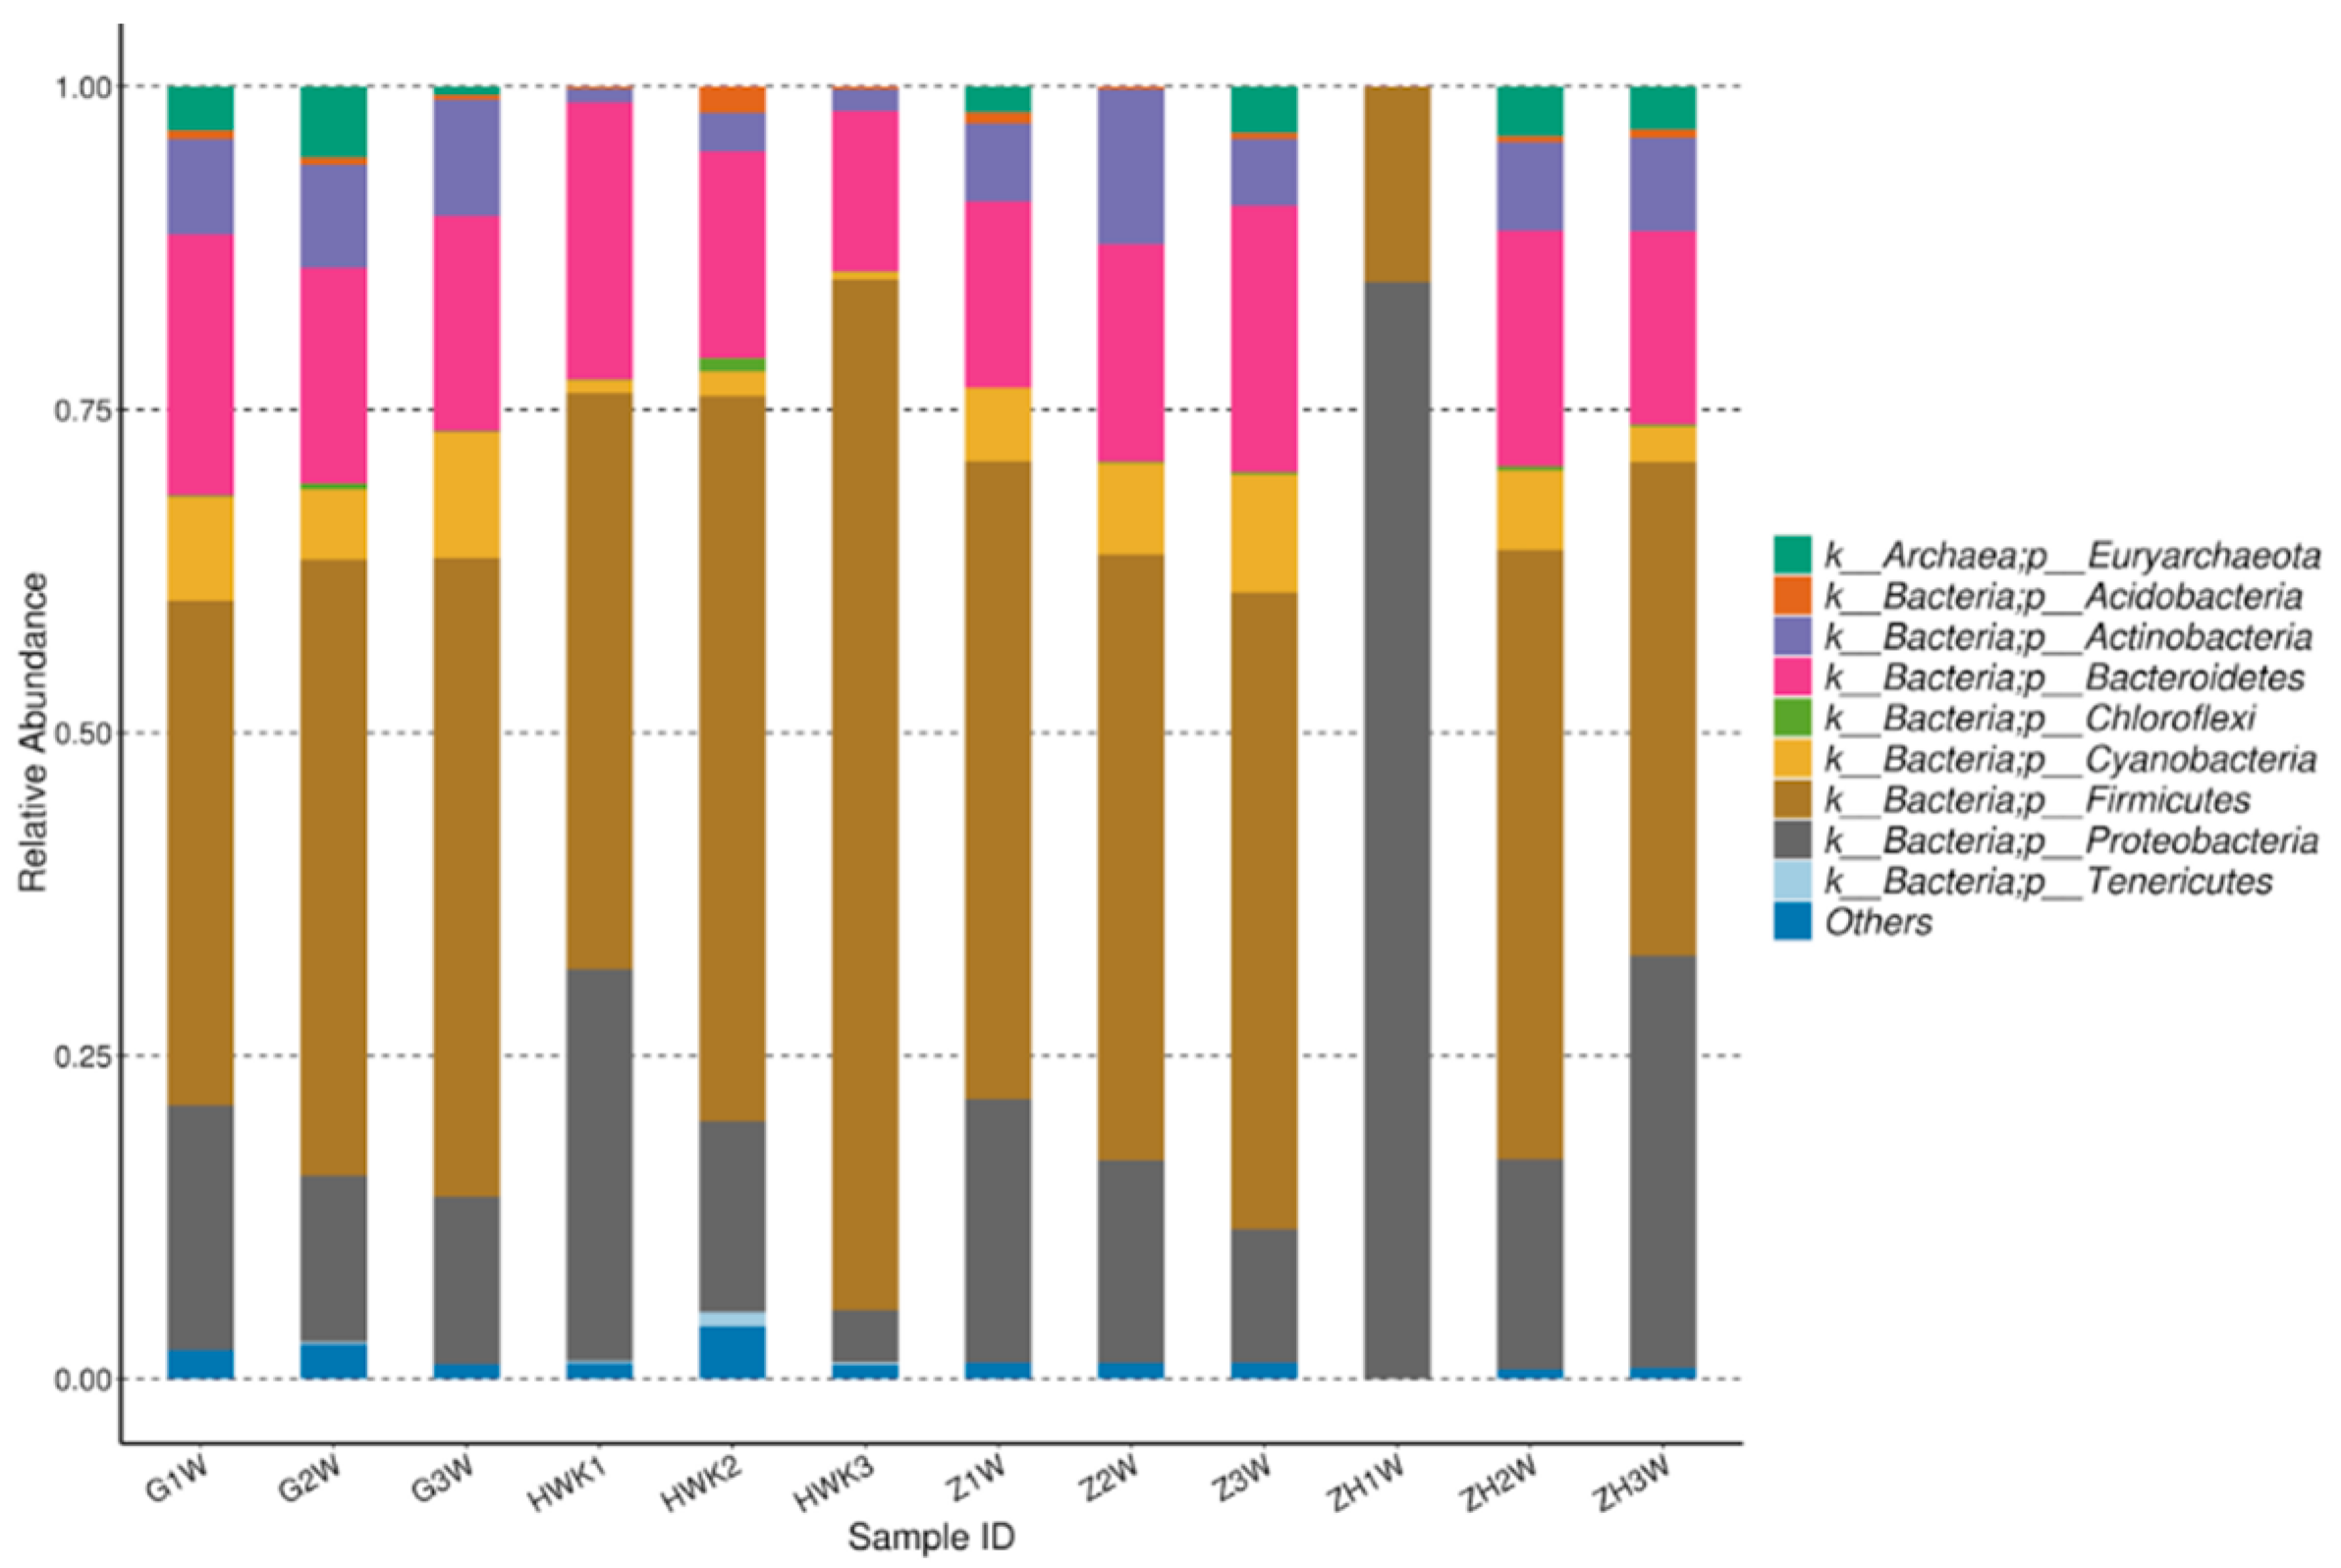
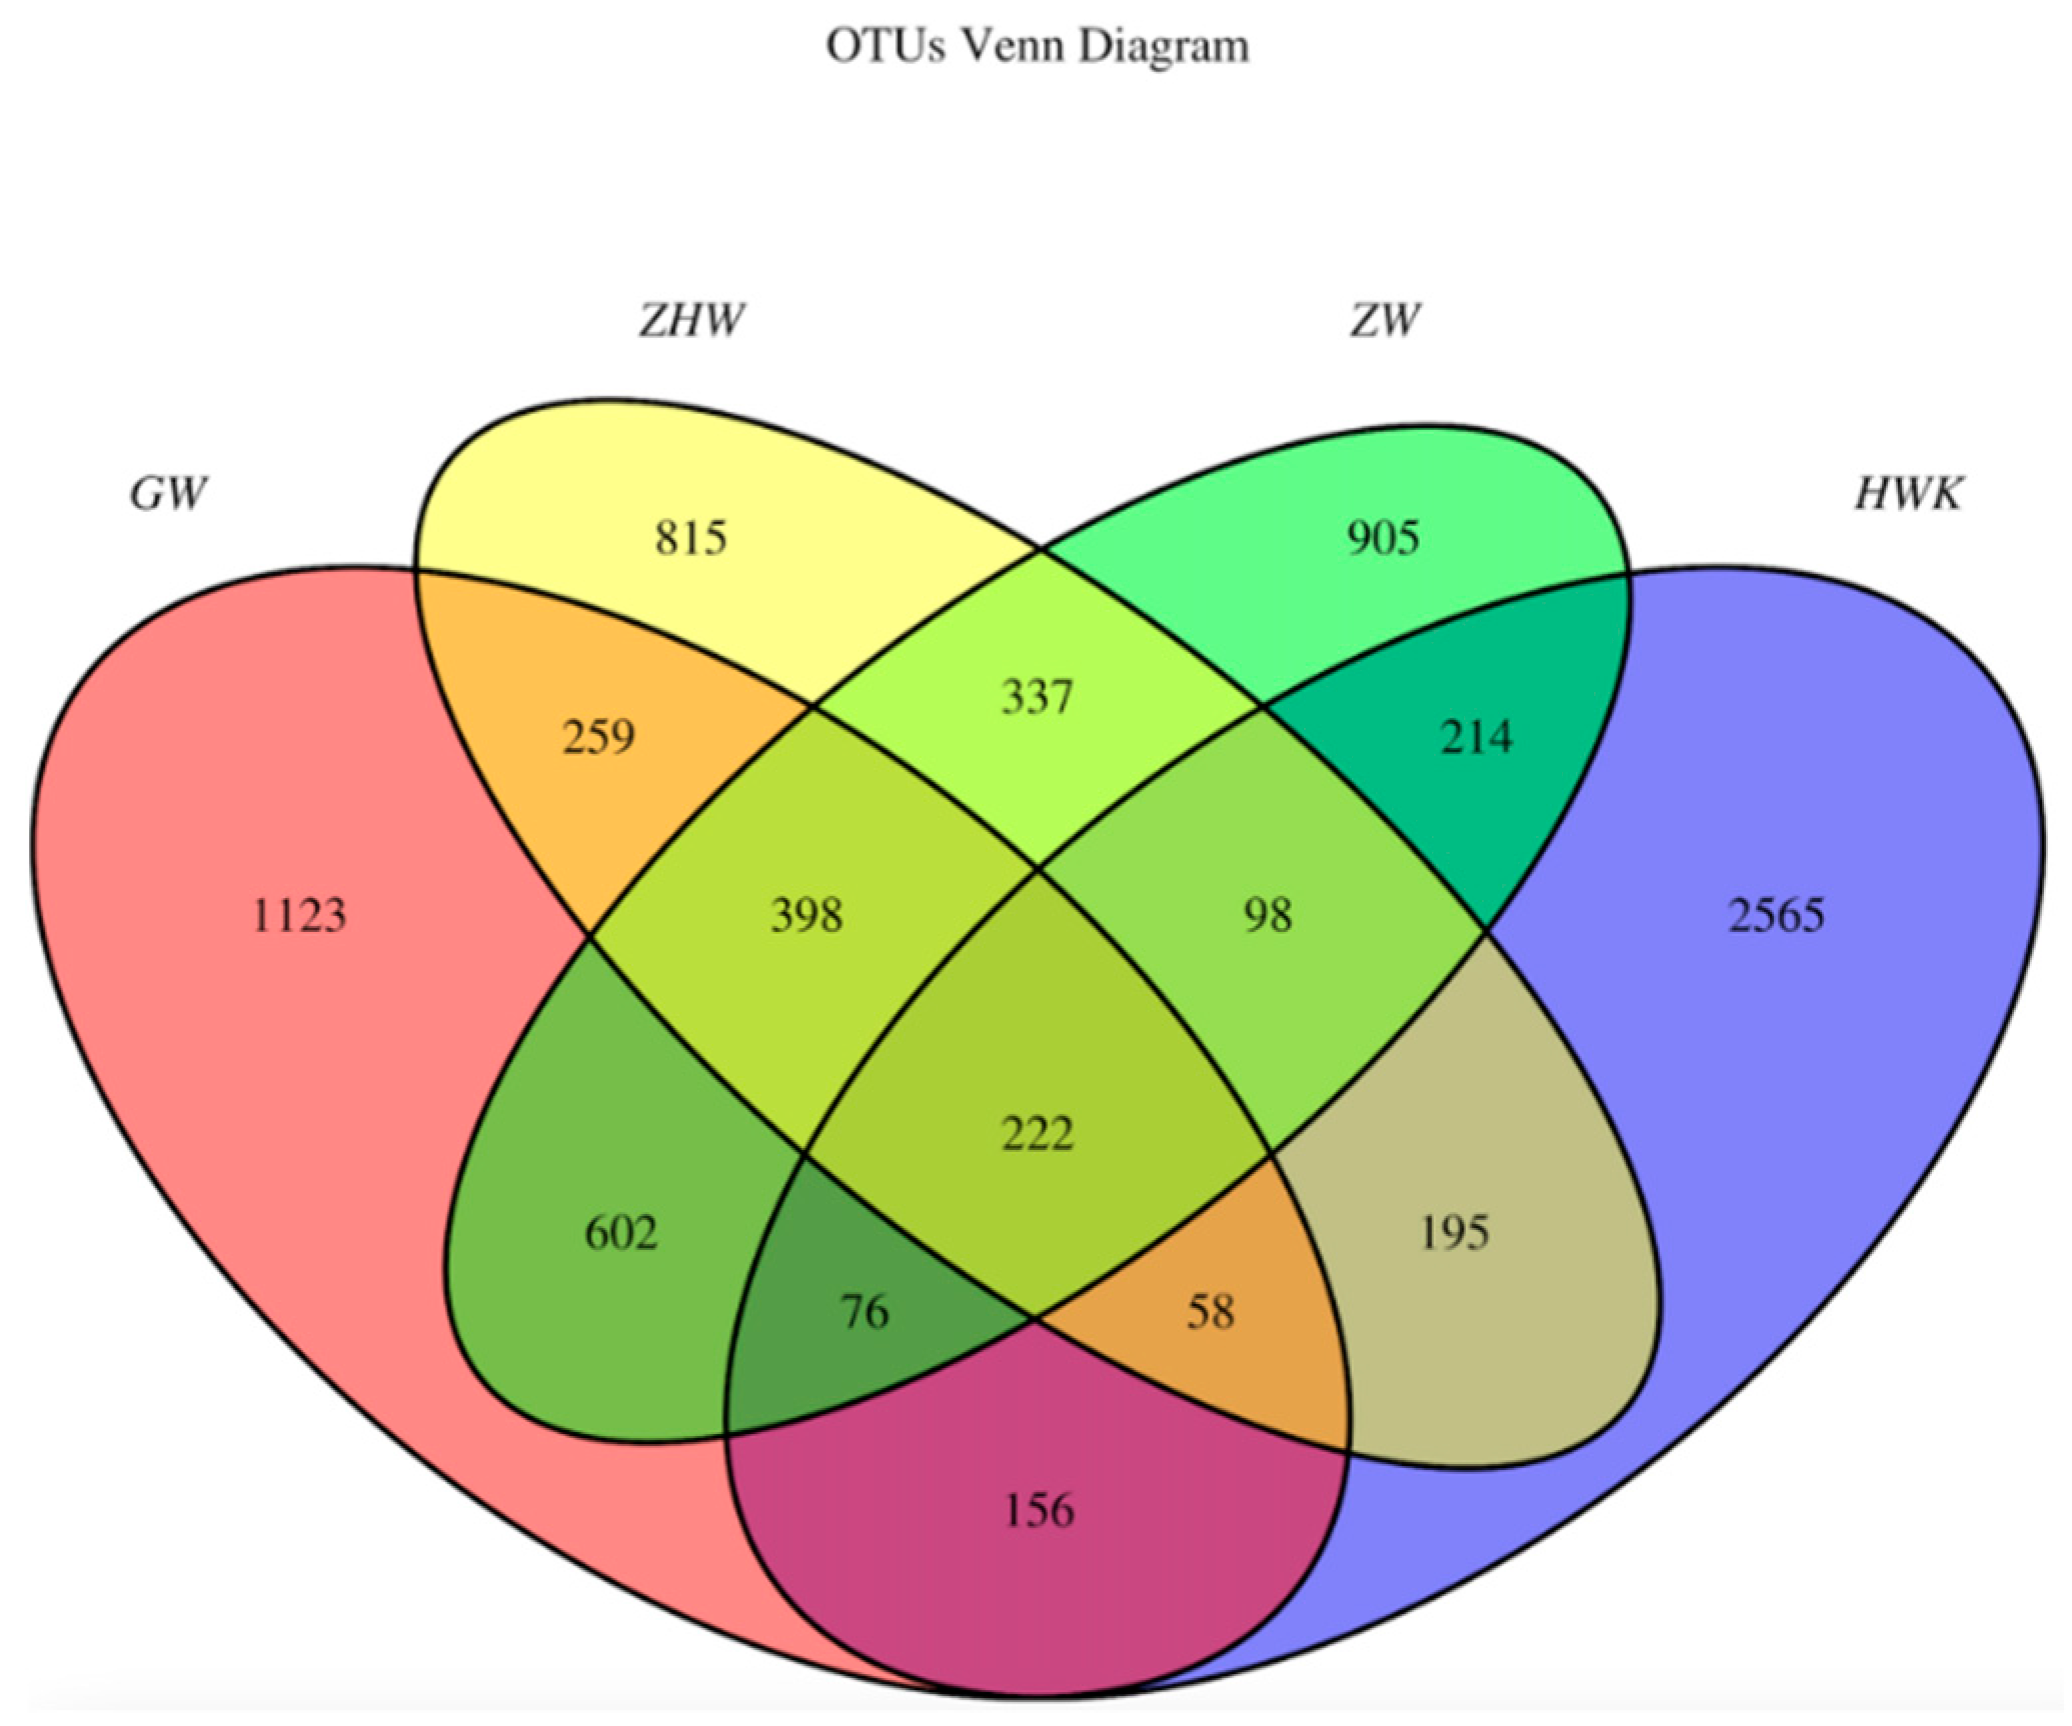
3.3.5. Evaluation of the Effect of Danofloxacin on the Lung Microbiota

As is shown in Figure 5, 36 phyla were identified at the phylum level for the four groups in total, and 14 phyla were accounted for 1% with an abundance of more than 1%. The number of Bacteroidetes, Firmicutes, and Proteobacteria were dominant flora in four groups. Meanwhile, Firmicutes was the most prevalent phylum with an abundance between 39.08% and 79.77%. Moreover, Bacteroidetes and Proteobacteria were accounted for 12.41~21.46% and 4.07~31.90%, respectively. During the trial period, Firmicutes had a great decrease after challenge with MG and an obvious recovery after treatment with danofloxacin. A significant difference (increased) was observed for Proteobacteria for the post-treatment group. Bacteroidetes was no obvious change among the four groups. From the perspective of bacteriological classification, MG belongs to Firmicutes. The number of Firmicutes decreased with the MG infected group because there may be competition for the growth between MG and other Firmicutes. It decreased MG and recovery for the other Firmicutes with the danofloxacin treatment group. Firmicutes reached a similar level with the normal state after cure. Bacteroides have no noticeable change for the four groups since danofloxacin is more effective for treating Gram-positive bacteria, Mycoplasma, and some anaerobic bacteria. However, Bacteroides belongs to Gram-negative bacteria. As for the decrease of Proteobacteria after the challenge with MG and the recovery after treatment with danofloxacin, there was some evidence that danofloxacin is more effective for E. coli [43] and Salmonella [44], which belong to the Proteobacteria.
To identify the common and unique OTUs (Operational Taxonomic Units) among different samples, the Venn diagrams were generated to make qualitative comparisons of the common OTUs between groups and the unique OTUs for each group (Figure 6). Representative sequences for each OTU were retrieved and classified to the genus level. There were 3584, 2894, 2852, and 2382 OTUs detected in the HWK (control group), GW (infection group), ZW (treatment group), and ZHW (post-treatment group) group, respectively. From the Venn diagram (Figure 6), a significant change in the respiratory tract flora was seen in chickens after MG infection. The number of respiratory tract flora decreased significantly after the cure by danofloxacin.
However, when we focused on the unique flora of each group, we found that the unique flora in the control group was the highest. The number of unique flora in the respiratory tract decreased gradually with the MG challenge and the use of danofloxacin and post-treatment. The study shows that the lung microbiota colonized in the respiratory tract decreased after the challenge of MG because the immunity was reduced. MG, as a dominant strain, occupies a large amount of space in the lungs and competes with other flora for territory food, resulting in a decrease in the number of unique flora. There was some potential target pathogen of danofloxacin in the respiratory tract after the infection of MG. It also proved the fact that danofloxacin was a broad-spectrum antibacterial drug. In addition, all kinds of bacteria groups were reached a minimum value because of the use of danofloxacin and the enhancement of chicken immunity.
The Chao 1, inverse Simpson, and Shannon are indices that represent the alpha diversity of microbial communities. The Chao 1 (richness) index shows the number of different taxa present in the sample. However, the indices inverse Simpson and Shannon (diversity) show the difference among the abundance of other taxa. As is shown in Table S5, the control group had the highest average values of Chao 1, followed by the danofloxacin-treated group, the MG infected group, and the post-treatment group. The results show that the number of species of bacteria decreased significantly after the challenge with MG, and the number of bacterial species increased when treated with danofloxacin. However, the number of strains reduced to a minimum value when MG was cured. The average values of microbial diversity indices of the three processing groups were consistently lower than the control group. The studies show that administration of danofloxacin to chicken affected the bacterial taxa in the chicken respiratory tract and resulted in decreased richness and diversity of microbiota.

4. Discussion

The MG infection is transmitted both horizontally and vertically. It is said that the three main strategies for the control of MG infections include, biosecurity and management practices, vaccination, and treatment [45]. Acquisition of fertile eggs and chicks from MG free sources, regular surveillance and monitoring of the flocks culling of the carrier birds, and strict biosecurity measures are needed to prevent the infection in the poultry flocks [46]. For immunization, inactivated, live attenuated and recombinant vaccines are commercially available for MG [47]. Antibiotics that inhibit the metabolic processes of microorganisms, especially fluoroquinoles, are commonly used to treat the infection [48]. Reasonable treatment is recommended to control CRD caused by MG to minimize their economic losses. Although antimicrobials should be used prudently to slow the emergence of resistance, little research has been performed to establish the ECVs, COPD, and COCL of antibacterial agents against MG. It has been proven that early danofloxacin treatment was very effective against MG [15,16].
Several methods have been reported for the establishment of ECVs. For example, Rodriguez-Tudela et al. [49] determined ECVs by twofold dilutions above the modal MIC. Arendrup et al. [50] performed ECVs by twofold dilution steps higher than the MIC50. Paterson and Turnidge [51] estimated ECVs by statistical analysis. The statistical method is a useful tool and has been widely used for the establishment of ECVs. The study used nonlinear regression analysis to determine the ECVs, and the results obtained were the same as those simulated by ECOFFinder software.
A suitable drug susceptibility method could be selected according to the growth characteristics of bacteria [52]. Previous research suggested that the results of drug sensitivity tests obtained by broth dilution methods based on the CLSI guidance document and literature are valid data [53,54]. Using the micro-dilution method, the MIC values for danofloxacin were 0.008–8 μg/mL for the MG isolates, which proved different dilution multiples [55]. In this study, the ECV of danofloxacin against MG was 1 μg/mL. A total of 111 MG isolates, representing a wide range of strains, were collected throughout China, which was considered to be a wide range of sources and representation. It was reported that the MIC range of Mycoplasma capricolum (M. capricolum) against danofloxacin was 0.1–6.4 μg/mL, and the susceptible breakpoint of danofloxacin against M. capricolum was 0.25 μg/mL [56].
The MIC range, MIC50, and MIC90 values for the antimicrobial susceptibility of Mycoplasma hyopneumoniae to enrofloxacin were 0.12–16 μg/mL, 0.25 μg/mL, 4 μg/mL, respectively [57]. It was also reported that the MIC range of Mycoplasma pneumoniae isolates to levofloxacin was 0.125–1 μg/mL [58]. The results above revealed that our study is generally consistent with the results of previous studies. However, the ECV of danofloxacin against MG had not yet been established. It is said that as for a microbiological point of view, both empirical and targeted antimicrobial treatment in respiratory infection is based on the sensitivity profile of isolated microorganisms and the possible resistance mechanisms that they may present, which may vary in different geographic areas according to prescription profiles and vaccination programs [59]. Some MG isolates with higher MIC for danofloxacin were found in our study, which indicated temporal and geographic differences in the prevalence of resistance.
Pharmacokinetic data, MIC distribution, and PK–PD target were essential parts of the establishment of the COPD. Researchers reported that tilmicosin, doxycycline, valnemulin, tiamulin and tylosin have the rationality of AUC/MIC as the PK–PD parameter [60,61,62,63,64]. Furthermore, the drug concentrations in the target sites were directly correlated with clinical efficacy, so the researchers chose the lung tissue in infected chicken as the object to establish COPD [65,66]. The selection of PK–PD parameters have been reported in the literature. Xiao et al. [9] found that danofloxacin showed a significant concentration-dependent bactericidal effect on Salmonella Typhimurium, so the AUC/MIC parameters were selected for the PK–PD model parameters. Yang et al. [67] studied the PK–PD of danofloxacin on E. coli in the piglet ileum ultrafiltrate and found that the correlation and simulation effect of the parameter AUC/MIC as a PK–PD parameter is better than the parameter T (Time) > MIC that represents the cumulative time that the concentration exceeds the MIC. Xu et al. [13] fitted the PK–PD model very well by selecting the AUC/MIC in vivo as the parameter. Bonassa et al. [68] successfully predicted the cure success rate of pathogens under different MICs through Monte Carlo simulation and PK–PD parameters (AUC/MIC). Fernández-Varón et al. [69] found that the PK–PD surrogate markers of efficacy AUC24/MIC and the Monte Carlo simulation show that marbofloxacin with subcutaneous is adequate to treat contagious agalactia affected by Mycoplasma agalactia (M. agalactia) in lactating goats. Zhang et al. [11] reported the PK–PD relationship of danofloxacin to MG in the in vivo infection model by the PK–PD parameter AUC/MIC. Accordingly, our study chose AUC/MIC as the PK–PD parameters for anti-Mycoplasma effects.
The data in Table S3 revealed that the average danofloxacin concentration in lung tissues was higher than the corresponding concentration in plasma (13–15 times higher), which is consistent with previous results [70]. Because danofloxacin can be accumulated at the infection site (lung), the COPD in plasma may not represent the significant parameters of the lung. The pharmacokinetic studies of danofloxacin on chickens are relatively few. Zhang et al. [70] reported that the Cmax, Tmax, and AUC24 of danofloxacin in lung tissues at a dose of 5 mg/kg b.w. in MG infected chickens was 1.14 ± 0.15 μg/mL, 2.67 ± 1.15 h, and 10.26 ± 2.42 μg·h/mL, respectively. It is different from the Cmax (4.71 ± 0.29 μg/mL), Tmax (1.30 ± 0.01 h), and AUC24 (23.67 ± 2.24 μg·h/mL) in our study. The differences in PK parameters among different studies may be due to differences in chicken breeds, and individual differences in experimental animals are also important reasons. Danofloxacin easily penetrates the tissue, so the drug concentration of danofloxacin in lung tissue was higher than that in plasma [11]. The Cmax could be reached in plasma and lung tissue for about 1 h following oral administration, indicating that danofloxacin absorbs rapidly in plasma and lung tissue. The infected groups had a higher drug concentration distribution at the target site, showing that danofloxacin is suitable for the treatment of deep tissue diseases [71].
The trial data in our study showed that the success rate for treatment of MG with MIC of 0.25 μg/mL was 93.3% and of 0.016 μg/mL was as high as 100%. This study used a previously reported method [72] to establish a real-time PCR method to detect changes in the copy number of MG in clinical trials, with the detection limit of 158 copies, which was 1000 times more sensitive than a regular PCR method. With the increase of the infection time, the bacteria increasingly colonize the chickens, which is consistent with the changes in the clinical symptoms of the chickens. The trial results showed that the effective rate and cure rate of the M2 and M24 strains were more than 90%, because the strains were sensitive, and the drug had a better therapeutic effect. The effective rate and cure rate of the M57 strain drug treatment group were low. The possible reason for this is that M57 may contain acquired resistance genes or other resistance mechanisms, and requires further study.
The formulation of the clinical cut-off value mainly includes two aspects: the MIC distribution of bacteria and the data related to clinical efficacy. Because there was no standard method to establish COCL, our study established the COCL mainly based on the following three approaches, which included the “WindoW” approach recommended by CLSI [27] and the nonlinear regression by VetCAST. The latter includes the formula of POC = 1/(1 + e−a + bf (MIC)) to calculate the relation between the dependent variable of POC and the independent variable of MIC [73]. Compared with four other supervised classifiers (J48, the OneR decision rule, the naïve Bayes classifier, and simple logistic regression), the CART method was recommended by Toutain et al. [24], and Cuesta et al. [74] could obtain the best statistical results. Bhat et al. [75] reported that the COCL of cefepime against gram-negative organisms was 8 μg/mL by CART software analysis.
There is a difference among the three cutoff values. In this study, the ECV, the COPD, and the COCL were 1 μg/mL, 0.5 μg/mL, and 0.25 μg/mL, respectively. The ECV value was greater than the COCL. From the MIC distribution of danofloxacin against 111 MG strains, the peak value was equal to the COCL, and 0.5 μg/mL (COPD) and 0.25 μg/mL (COCL) account for 22.5% (25/111) and 16.2% (18/111), respectively. Overall, the difference was not significant. The result of ECV > COPD > COCL might indicate that there were clinically resistant bacteria, and the drug might be clinically ineffective against some clinical bacteria. Further studies are necessary to confirm the relationship between MIC phenotype and resistance genotype.
The respiratory microbiota is a complex community and widely recognized in many aspects of research [76,77,78], but little is known on the change between the challenge with MG and treatment with danofloxacin. It is reported that the composition of the lung microbiota is increasingly well characterised, with changes in microbial diversity or abundance observed in association with chronic respiratory diseases [79]. 16S rRNA sequence data analysis showed that the chicken’s respiratory tract contained various bacterial species. It is consistent with the report that Firmicutes, Proteobacteria and Bacteroidetes were the prevalent flora in lung microbiota [36]. The results suggest that the number of lung microbiota decreased gradually in the trial period, but there was no significant difference between the MG infected group and the treatment group. The OTU Venn diagram shows that the control group has the highest unique flora, and with a huge decrease in the infection group, the unique flora reached the minimum value with the treatment of danofloxacin. This trend might be caused by the reaction of the bacterial stress response [80]. It indicated that danofloxacin was effective against MG and killed many other bacteria in the chicken respiratory tract.
A variety of physiological processes related to bacterial survivability and colonization ability could be decreased under the stress response, leading to the competitive exclusion by other commensal bacteria during the treatment period [81,82]. These genera may have significant potential targets for fluoroquinolone antimicrobial. Moreover, in the previous studies, the diminishing of taxa in response to antimicrobial treatment was also reported [83]. The results show that the respiratory tract’s richness and diversity were generally decreased during the infection and treatment, which is consistent with the previous study [35,77]. Consequently, the rational use of danofloxacin for the treatment of MG infections should consider the antibacterial effect and the influence of danofloxacin on the respiratory microbiota. Few pieces of the research reported the potential health impact of changes in the respiratory microbiota in chicken when treated with danofloxacin. However, there are adverse effects on the health due to disrupting the respiratory flora because of antibiotics.
The respiratory tract flora is in a state of dynamic equilibrium under normal circumstances; once the balance is broken, it is easy to cause an imbalance in the proportion of normal flora, leading to disease in animals, which is called “flora dysregulated”. Some dysregulation is only an abnormal change in quantity and generally has no clinical manifestations or only mild adverse reactions, which can be recovered naturally after drug withdrawal. However, antibiotics that were trialed by oral administration could affect autoimmunity by affecting gut microbiota colonization. Wang et al. [84] studied the correlation between gut microbiota and MG infection by disturbing gut microbiota in chickens with an antibiotic cocktail. The results showed that gut microbiota dysbiosis impairs pulmonary immune response against MG infection. The studies above have shown that antibiotics are a double-edged sword, so more attention should be paid to the rational use of drugs.

5. Conclusions

The present study firstly established the ECV (1 µg/mL) at 95% confidence intervals, COPD in lung (0.5 µg/mL) and COCL (0.25 µg/mL) of danofloxacin against MG. The ECV value was higher than COPD and COCL, indicating that certain MG isolates may resist danofloxacin. The ECV, COPD, and COCL values could be considered preliminary cutoff values. According to the CLSI M37-A3 decision tree (Figure S11), danofloxacin’s final clinical breakpoint (CBP) against MG is 1 µg/mL. These results provide a standard and reference for the use of danofloxacin in the treatment of MG. In addition, the therapeutic regimen obtained from PK–PD model is 16.60 mg/kg b.w. with a 24-h interval oral administered for three days. The research shows that the effect of drug treatment on lung microbiota should be considered when one therapeutic drug is needed.

Supplementary Materials

The following supporting information can be downloaded at: https://www.mdpi.com/article/10.3390/antibiotics11030403/s1, Figure S1. Electropherogram of PCR products of MG; Figure S2. Ex vivo curves of danofloxacin against M19 in the healthy plasma; Figure S3. Ex vivo killing-time curves of danofloxacin against M19 in healthy lung tissue; Figure S4. Probability of danofloxacin against MG in lung at 0.5 μg/mL; Figure S5. The growth of bacteria under different drug regiment by Mlxplore simulation; Figure S6. Dynamic curve and standard curve of recombinant plasmid (Left: amplification curve, Right: standard curve); Figure S7. Logarithmic change of MG copy number during the test; Figure S8. Graphic illustration of the CAR method; Figure S9. The results of the CART model; Figure S10. Non-linear regression simulation of Log2MIC and POC; Figure S11. Susceptibility breakpoint decision tree. Table S1. The virulence test results of MG in embryo; Table S2. Results of Ecoffinder simulation for danofloxacin against MG; Table S3. Drug concentration in chicken plasma and lung tissues at different time points after administration of danofloxacin (5 mg/kg) (n = 5); Table S4. The different dosages for three level of target effects; Table S5. Community metrics (Chao 1, Simpson and Shannon indices) of the four groups.

Author Contributions

Conceived and designed the experiments: S.W., H.H. and Z.Y. Performed the experiments: S.W., A.H. and Y.G. Analyzed the data: S.W., A.H., Y.G. and J.L. Contributed reagents/materials/analysis tools: L.H., X.W., Y.T., Z.L. and C.W. Wrote the paper: S.W., A.H. and Y.G. All authors have read and agreed to the published version of the manuscript.

Funding

This work was funded by grants from the National Key Research and Development Program (2021YFD1800600/2016YFD0501302/2017YFD0501406), National Natural Science Foundation of China (32172914/31772791), cooperative fund between Huazhong Agricultural University and Shenzhen Institute of Agricultural Genomics, Chinese Academy of Agricultural Sciences, Natural Science Foundation of Jiangsu Province (BK20190261).

Institutional Review Board Statement

The use of chickens and all experimental protocols in this study were approved by the Institutional Animal Care and Use Committee at HZAU (approval number HZAUSW-2018-046). All procedures regarding animal care and testing were carried out according to the recommendation for the care and use of laboratory animals of Hubei provincial public service facilities.

Informed Consent Statement

Not applicable.

Data Availability Statement

The data presented in the study are deposited in the National Center for Biotechnology Information (NCBI) repository, the accession number is PRJNA771179.

Conflicts of Interest

The authors declare that the research was conducted in the absence of any commercial or financial relationships that could be construed as a potential conflict of interest.

References

  1. Hawley, D.M.; Moyers, S.C.; Johanel, C.; Courtney, Y.; Adelman, J.S. Characterization of unilateral conjunctival inoculation with Mycoplasma gallisepticum in house finches. Avian Pathol. 2018, 47, 526–530. [Google Scholar] [CrossRef] [PubMed]
  2. Bwala, D.G.; Ponman, S.; Duncan, N.; Wandrag, D.; Abolnik, C. Assessment of Mycoplasma gallisepticum vaccine efficacy in a co-infection challenge model with qx-like infectious bronchitis virus. Avian Pathol. 2018, 47, 261–270. [Google Scholar] [CrossRef] [PubMed] [Green Version]
  3. Kazakiewicz, D.; Karr, J.R.; Langner, K.M.; Plewczynski, D. A combined systems and structural modeling approach repositions antibiotics for Mycoplasma genitalium. Comput. Biol. Chem. 2015, 59, 91–97. [Google Scholar] [CrossRef] [PubMed]
  4. Semashko, T.A.; Arzamasov, A.A.; Fisunov, G.Y.; Govorun, V.M. Transcription profiling data set of different states of Mycoplasma gallisepticum. Genom. Data 2016, 11, 49–54. [Google Scholar] [CrossRef] [PubMed]
  5. Shimada, Y.; Deguchi, T.; Nakane, K.; Yasuda, M.; Yokoi, S.; Ito, S.-I.; Nakano, M.; Ito, S.; Ishiko, H. Macrolide Resistance–associated 23S rRNA Mutation in Mycoplasma genitalium, Japan. Emerg. Infect. Dis. 2011, 17, 1148–1150. [Google Scholar] [CrossRef]
  6. Heleili, N.; Ayachi, A.; Mamache, B.; Chelihi, A. Seroprevalence of Mycoplasma synoviae and Mycoplasma gallisepticum at batna commercial poultry farms in algeria. Vet. World. 2012, 5, 709–712. [Google Scholar] [CrossRef]
  7. Vogl, G.; Plaickner, A.; Szathmary, S.; Stipkovits, L.; Rosengarten, R.; Szostak, M.P. Mycoplasma gallisepticum invades chicken erythrocytes during infection. Infect. Immun. 2008, 76, 71–77. [Google Scholar] [CrossRef] [Green Version]
  8. Gharibi, D.; Ghadimipour, R.; Mayahi, M. Detection of Mycoplasma gallisepticum and Mycoplasma synoviae among Commercial Poultry in Khouzestan Province, Iran. Arch. Razi Inst. 2018, 73, 139–146. [Google Scholar]
  9. Gosal, N.S.; Rampai, S.; Goyal, S.; Chaudhary, R.K. Effect of paracetamol on the pharmacokinetics of danofloxacin in buffalo calves. Indian Vet. J. 2009, 86, 466–468. [Google Scholar]
  10. Mohammadi, G.R.; Ghazvini, K.; Abbaspanah, H. Antimicrobial susceptibility testing of Mannheimia haemolytica and Pasteurella multocida isolated from calves with dairy calf pneumonia. Arch. Razi Inst. 2006, 61, 91–96. [Google Scholar]
  11. Xiao, X.; Pei, L.; Jiang, L.J.; Lan, W.X.; Zhang, Z.Q. In vivo pharmacokinetic/pharmacodynamic profiles of danofloxacin in rabbits infected with Salmonella typhimurium after oral administration. Front. Pharmacol. 2018, 9, 391. [Google Scholar] [CrossRef] [PubMed] [Green Version]
  12. Zhang, L.; Kang, Z.; Yao, L.; Gu, X.; Huang, Z.; Cai, Q.; Shen, X.; Ding, H. Pharmacokinetic/pharmacodynamic integration to evaluate the changes in susceptibility of Actinobacillus pleuropneumoniae after repeated administration of danofloxacin. Front. Microbiol. 2018, 9, 2445. [Google Scholar] [CrossRef]
  13. Xu, Z.H.; Huang, A.X.; Luo, X.; Zhang, P.; Huang, L.L.; Wang, X.; Mi, K.; Fang, S.W.; Huang, X.; Li, J.; et al. Exploration of Clinical Breakpoint of Danofloxacin for Glaesserella parasuis in Plasma and in PELF. Antibiotics 2021, 10, 808. [Google Scholar] [CrossRef] [PubMed]
  14. Zhang, N.; Wu, Y.; Huang, Z.; Zhang, C.; Zhang, L.; Cai, Q.; Shen, X.; Jiang, H.; Ding, H.; Browning, G.F. Relationship between danofloxacin pk/pd parameters and emergence and mechanism of resistance of Mycoplasma gallisepticum in In Vitro model. PLoS ONE 2018, 13, e0202070. [Google Scholar] [CrossRef] [PubMed]
  15. Migaki, T.T.; Avakian, A.P.; Barnes, H.J.; Ley, D.H.; Tanner, A.C.; Magonigle, R.A. Efficacy of danofloxacin and tylosin in the control of Mycoplasmosis in chicks infected with tylosin-susceptible or tylosin-resistant field isolates of Mycoplasma gallisepticum. Avian Dis. 1993, 37, 508–514. [Google Scholar] [CrossRef] [PubMed]
  16. Cooper, A.C.; Fuller, J.R.; Fuller, M.K.; Whittlestone, P.; Wise, D.R. In vitro activity of danofloxacin, tylosin and oxytetracycline against Mycoplasmas of veterinary importance. Res. Vet. Sci. 1993, 54, 329–334. [Google Scholar] [CrossRef]
  17. Dong, H.; Xie, J.; Chen, L.; Wang, T.; Sun, J.; Zhao, Y.; Dong, Y. Developments in the pharmacokinetic-pharmacodynamic index of linezolid a step toward dose optimization using Monte Carlo simulation in critically ill patients. Int. J. Infect. Dis. 2014, 22, 35–40. [Google Scholar] [CrossRef] [PubMed] [Green Version]
  18. Zhou, Y.F.; Peng, H.M.; Bu, M.X. Pharmacodynamic evaluation and pk/pd-based dose prediction of tulathromycin: A potential new indication for Streptococcus suis infection. Front. Pharmacol. 2017, 8, 684. [Google Scholar] [CrossRef]
  19. Mouton, J.W.; Theuretzbacher, U.; Craig, W.A.; Tulkens, P.M.; Derendorf, H.; Cars, O. Tissue concentrations: Do we ever learn? J. Antimicrob. Chemother. 2008, 61, 235–237. [Google Scholar] [CrossRef] [Green Version]
  20. Foster, D.M.; Martin, L.G.; Papich, M.G.; Torrelles, J.B. Comparison of active drug concentrations in the pulmonary epithelial lining fluid and interstitial fluid of calves injected with enrofloxacin, florfenicol, ceftiofur, or tulathromycin. PLoS ONE 2016, 11, e0149100. [Google Scholar] [CrossRef]
  21. Messenger, K.M.; Papich, M.G.; Blikslager, A.T. Distribution of enrofloxacin and its active metabolite, using an in vivo ultrafiltration sampling technique after the injection of enrofloxacin to pigs. J. Vet. Pharmacol. Ther. 2012, 35, 452–459. [Google Scholar] [CrossRef] [PubMed]
  22. Menge, M.; Rose, M.; Bohland, C.; Zschiesche, E.; Nürnberger, M. Pharmacokinetics of tildipirosin in bovine plasma, lung tissue, and bronchial fluid (from live, nonanesthetized cattle). J. Vet. Pharmacol. Ther. 2011, 35, 550–559. [Google Scholar] [CrossRef] [PubMed]
  23. Davis, J.L.; Foster, D.M.; Papich, M.G. Pharmacokinetics and tissue distribution of enrofloxacin and its active metabolite ciprofloxacin in calves. J. Vet. Pharmacol. Ther. 2010, 30, 564–571. [Google Scholar] [CrossRef] [PubMed]
  24. Toutain, P.L.; Sidhu, P.K.; Lees, P.; Rassouli, A.; Pelligand, L. VetCAST Method for determination of the pharmacokinetic-pharmacodynamic cut-off values of a long-acting formulation of florfenicol to support clinical breakpoints for florfenicol antimicrobial susceptibility testing in cattle. Front. Microbiol. 2019, 10, 1310. [Google Scholar] [CrossRef] [Green Version]
  25. Clinical and Laboratory Standards Institute. Development of In Vitro Susceptibility Testing Criteria and Quality Control Parameters for Veterinary Antimicrobial Agents; Approved Standard, 3rd ed.; CLSI Document M37-A3 Wayne; Clinical and Laboratory Standards Institute: Pittsburgh, PA, USA, 2007; p. M37-A3. [Google Scholar]
  26. Toutain, P.L.; Bousquet-Mélou, A.; Damborg, P.; Ferran, A.A.; Mevius, D.; Pelligand, L.; Veldman, K.T.; Lees, P. En Route towards European Clinical Breakpoints for Veterinary Antimicrobial Susceptibility Testing: A Position Paper Explaining the VetCAST Approach. Front. Microbiol. 2017, 8, 2344. [Google Scholar] [CrossRef] [Green Version]
  27. Turnidge, J.D.; Martinez, M.N. Proposed method for estimating clinical cut-off (COCL) values: An attempt to address challenges encountered when setting clinical breakpoints for veterinary antimicrobial agents. Vet. J. 2017, 228, 33–37. [Google Scholar] [CrossRef]
  28. Turnidge, J.; Kahlmeter, G.; Kronvall, G. Statistical characterisation of bacterial wild-type MIC value distributions and the determination of epidemiological cut-off values. Clin. Microbiol. Infect. 2006, 12, 418–425. [Google Scholar] [CrossRef]
  29. European Medicines Agency. Guideline on the Use of Pharmacokinetics and Pharmacodynamics in the Development of Antimicrobial Medicinal Products; EMA: Amsterdam, The Netherlands, 2015.
  30. Zhou, H.; Zhao, X.; Sun, L.; Liu, Y.; Lv, Y.; Gang, X. Gut Microbiota Profile in Patients with Type 1 Diabetes Based on 16S rRNA Gene Sequencing: A Systematic Review. Dis. Markers 2020, 27, 3936247. [Google Scholar] [CrossRef]
  31. Taylor, J.D.; Doyle, D.J.; Blackall, P.J.; Confer, A.W. Use of REP-PCR and 16S rRNA gene sequencing for comparison of Mannheimia haemolytica isolates obtained from fatal cases of bovine respiratory disease in the USA and Australia. Aust. Vet. J. 2014, 92, 15–23. [Google Scholar] [CrossRef]
  32. Kinoshita, Y.; Niwa, H.; Katayama, Y.; Hariu, K. Dominant obligate anaerobes revealed in lower respiratory tract infection in horses by 16S rRNA gene sequencing. J. Vet. Med. Sci. 2014, 76, 587–591. [Google Scholar] [CrossRef] [Green Version]
  33. Allali, I.; Arnold, J.W.; Roach, J.; Cadenas, M.B.; Butz, N.; Hassan, H.M.; Koci, M.; Ballou, A.; Mendoza, M.; Ali, R.; et al. A comparison of sequencing platforms and bioinformatics pipelines for compositional analysis of the gut microbiome. BMC Microbiol. 2017, 17, 194. [Google Scholar] [CrossRef] [PubMed]
  34. Shabbir, M.Z.; Malys, T.; Ivanov, Y.V.; Park, J.; Shabbir, M.A.; Rabbani, M.; Yaqub, T.; Harvill, E.T. Microbial communities present in the lower respiratory tract of clinically healthy birds in Pakistan. Poult. Sci. 2015, 94, 612–620. [Google Scholar] [CrossRef] [PubMed]
  35. Glendinning, L.; McLachlan, G.; Vervelde, L. Age-related differences in the respiratory microbiota of chickens. PLoS ONE 2017, 12, e0188455. [Google Scholar] [CrossRef] [PubMed] [Green Version]
  36. Zhou, Y.; Zhang, M.; Liu, Q.; Feng, J. The alterations of tracheal microbiota and inflammation caused by different levels of ammonia exposure in broiler chickens. Poult. Sci. 2020, 100, 685–696. [Google Scholar] [CrossRef]
  37. Khatoon, H.; Afzal, F.; Tahir, M.F.; Hussain, M.; Khan, S.U. Prevalence of mycoplasmosis and antibiotic susceptibility of Mycoplasma gallisepticum in commercial chicken flocks of Rawalpindi division, Pakistan. Pak. Vet. J. 2018, 38, 446–448. [Google Scholar] [CrossRef]
  38. Xiao, X.; Sun, J.; Chen, Y.; Zou, M.; Zhao, D.H.; Liu, Y.H. Ex vivo pharmacokinetic and pharmacodynamic analysis of valnemulin against Mycoplasma gallisepticum s6 in Mycoplasma gallisepticum and Escherichia coli co-infected chickens. Vet. J. 2015, 204, 54–59. [Google Scholar] [CrossRef]
  39. Kronvall, G. Normalized Resistance Interpretation as a Tool for Establishing Epidemiological MIC Susceptibility Breakpoints. J. Clin. Microbiol. 2010, 48, 4445–4452. [Google Scholar] [CrossRef] [Green Version]
  40. Canton, E.; Peman, J.; Hervas, D.; Iniguez, C.; Navarro, D.; Echeverria, J.; Martinez-Alarcon, J.; Fontanals, D.; Gomila-Sard, B.; Buendia, B. Comparison of Three Statistical Methods for Establishing Tentative Wild-Type Population and Epidemiological Cutoff Values for Echinocandins, Amphotericin B, Flucytosine, and Six Candida Species as Determined by the Colorimetric Sensititre YeastOne Method. J. Clin. Microbiol. 2012, 50, 3921–3926. [Google Scholar] [CrossRef] [Green Version]
  41. Zhang, P.; Zhang, C.; Aragon, V.; Zhou, X.; Zou, M.; Wu, C.; Shen, Z. Investigation of Haemophilus parasuis from healthy pigs in China. Vet. Microbiol. 2019, 231, 40–44. [Google Scholar] [CrossRef] [Green Version]
  42. Zain, Z.M.; Bradbury, J.M. The influence of type of swab and laboratory method on the recovery of Mycoplasma gallisepticum and Mycoplasma synoviae in broth medium. Avian Pathol. 1995, 24, 707–716. [Google Scholar] [CrossRef]
  43. Tian, E.; Chen, C.; Hu, W.; Miao, Y.; Muhammad, I.; Zhang, Q.; Liu, Y.; Xu, L.; Bao, J.; Ding, L.; et al. Population pharmacokinetics for danofloxacin in the intestinal contents of healthy and infected chickens. J. Vet. Pharmacol. Ther. 2019, 42, 556–563. [Google Scholar] [CrossRef] [PubMed]
  44. Geornaras, I.; von-Holy, A. Antimicrobial susceptibilities of isolates of Staphylococcus aureus, Listeria species and Salmonella serotypes associated with poultry processing. Int. J. Food Microbiol. 2001, 70, 29–35. [Google Scholar] [CrossRef]
  45. Yadav, J.P.; Tomar, P.; Singh, Y.; Khurana, S.K. Insights on Mycoplasma gallisepticum and Mycoplasma synoviae infection in poultry: A systematic review. Anim. Biotechnol. 2021, 10, 1–10. [Google Scholar] [CrossRef] [PubMed]
  46. Marouf, S.; Khalf, M.A.; Alorabi, M.; El-Shehawi, A.M.; El-Tahan, A.M.; El-Hack, M.E.A.; El-Saadony, M.T.; Salem, H.M. Mycoplasma gallisepticum: A devastating organism for the poultry industry in Egypt. Poult. Sci. 2022, 101, 101658. [Google Scholar] [CrossRef] [PubMed]
  47. Feberwee, A.; de-Wit, S.; Dijkman, R. Clinical expression, epidemiology, and monitoring of Mycoplasma gallisepticum and Mycoplasma synoviae: An update. Avian Pathol. 2022, 51, 2–18. [Google Scholar] [CrossRef]
  48. De-Jong, A.; Youala, M.; Klein, U.; El-Garch, F.; Simjee, S.; Moyaert, H.; Rose, M.; Gautier-Bouchardon, A.V.; Catania, S.; Ganapathy, K.; et al. Minimal inhibitory concentration of seven antimicrobials to Mycoplasma gallisepticum and Mycoplasma synoviae isolates from six European countries. Avian Pathol. 2021, 50, 161–173. [Google Scholar] [CrossRef]
  49. Rodriguez-Tudela, J.L.; Alcazar-Fuoli, L.; Mellado, E.; Alastruey-Izquierdo, A.; Monzon, A.; Cuenca-Estrella, M. Epidemiological cutoffs and cross-resistance to azole drugs in Aspergillus fumigatus. Antimicrob. Agents Chemother. 2008, 52, 2468–2472. [Google Scholar] [CrossRef] [Green Version]
  50. Arendrup, M.C.; Garcia-Effron, G.; Lass-Florl, C.; Lopez, A.G.; Rodriguez-Tudela, J.L.; Cuenca-Estrella, M.; Perlin, D.S. Echinocandin susceptibility testing of Candida species: Comparison of EUCAST EDef 7.1, CLSI M27-A3, Etest, disk diffusion, and agar dilution methods with RPMI and isosensitest media. Antimicrob. Agents Chemother. 2010, 54, 426–439. [Google Scholar] [CrossRef] [Green Version]
  51. Turnidge, J.; Paterson, D.L. Setting and revising antibacterial susceptibility breakpoints. Clin. Microbiol. Rev. 2007, 20, 391–408. [Google Scholar] [CrossRef] [Green Version]
  52. Hannan, P. Guidelines and recommendations for antimicrobial minimum inhibitory concentration (MIC) testing against veterinary Mycoplasma species. Vet. Res. 2000, 31, 373–395. [Google Scholar] [CrossRef] [Green Version]
  53. Ramadan, R.A.; Gebriel, M.G.; Kadry, H.M.; Ahmed, M. Carbapenem-resistant Acinetobacter baumannii and Pseudomonas aeruginosa: Characterization of carbapenemase genes and E-test evaluation of colistin-based combinations. Infect. Drug. Resist. 2018, 11, 1261–1269. [Google Scholar] [CrossRef] [PubMed] [Green Version]
  54. Kohner, P.C.; Patel, R.; Uhl, J.R.; Garin, K.M.; Hopkins, M.K.; Wegener, L.T.; Cockerill, F.R. Comparison of agar dilution, broth microdilution, e-test, disk diffusion, and automated vitek methods for testing susceptibilities of Enterococcus spp. to vancomycin. J. Clin. Microbiol. 1997, 35, 3258–3263. [Google Scholar] [CrossRef] [Green Version]
  55. Zhang, N.; Ye, X.; Wu, Y.; Huang, Z.; Gu, X.; Cai, Q.; Shen, Q.; Jiang, H.; Ding, H.; Balish, M.F. Determination of the mutant selection window and evaluation of the killing of Mycoplasma gallisepticum by danofloxacin, doxycycline, tilmicosin, tylvalosin and valnemulin. PLoS ONE 2017, 12, e0169134. [Google Scholar] [CrossRef] [PubMed]
  56. Tatay-Dualde, J.; Prats-van der Ham, M.; de la Fe, C.; Paterna, A.; Sánchez, A.; Corrales, J.C.; Contreras, A.; Tola, S.; Gómez-Martin, Á. Antimicrobial susceptibility and multilocus sequence typing of Mycoplasma capricolum subsp. capricolum. PLoS ONE 2017, 12, e0174700. [Google Scholar] [CrossRef] [PubMed] [Green Version]
  57. Jelinski, M.; Kinnear, A.; Gesy, K.; Andrés-Lasheras, S.; Zaheer, R.; Weese, S.; McAllister, T.A. Antimicrobial Sensitivity Testing of Mycoplasma bovis Isolates Derived from Western Canadian Feedlot Cattle. Microorganisms 2020, 8, 124. [Google Scholar] [CrossRef] [PubMed] [Green Version]
  58. Zhao, F.; Li, J.; Liu, J.; Guan, X.; Gong, J.; Liu, L.; He, L.; Meng, F.; Zhang, J. Antimicrobial susceptibility and molecular characteristics of Mycoplasma pneumoniae isolates across different regions of China. Antimicrob. Resist. Infect. Control 2019, 8, 143. [Google Scholar] [CrossRef] [PubMed] [Green Version]
  59. Cantón, R. Aspectos microbiológicos actuales de la infección respiratoria comunitaria más allá de la COVID-19 [Current microbiological aspects of community respiratory infection beyond COVID-19]. Rev. Esp. Quimioter. 2021, 34, 81–92. [Google Scholar] [CrossRef]
  60. Huang, Z.; Wu, Y.; Zhou, Z.; Xia, X.; Gu, X.; Cai, Q.; Shen, X.; Yang, H.; Ding, H. Pharmacokinetic and Pharmacodynamic Integration and Resistance Analysis of Tilmicosin against Mycoplasma gallisepticum in an In Vitro Dynamic Model. Front. Pharmacol. 2019, 10, 670. [Google Scholar] [CrossRef] [PubMed]
  61. Zhang, N.; Gu, X.; Ye, X.; Wu, X.; Zhang, B.; Zhang, L. The PK/PD Interactions of Doxycycline against Mycoplasma gallisepticum. Front. Microbiol. 2016, 7, 653. [Google Scholar] [CrossRef] [Green Version]
  62. Xiao, X.; Sun, J.; Yang, T.; Fang, X.; Wu, D.; Xiong, Y.Q.; Cheng, J.; Chen, Y.; Shi, W.; Liu, Y.H. In vivo pharmacokinetic/pharmacodynamic profiles of valnemulin in an experimental intratracheal Mycoplasma gallisepticum infection model. Antimicrob. Agents Chemother. 2015, 59, 3754–3760. [Google Scholar] [CrossRef] [Green Version]
  63. Xiao, X.; Sun, J.; Yang, T.; Fang, X.; Cheng, J.; Xiong, Y.Q.; Liu, Y.H. Pharmacokinetic/Pharmacodynamic Profiles of Tiamulin in an Experimental Intratracheal Infection Model of Mycoplasma gallisepticum. Front. Vet. Sci. 2016, 3, 75. [Google Scholar] [CrossRef] [Green Version]
  64. Arzey, G.G.; Arzey, K.E. Successful treatment of mycoplasmosis in layer chickens with single dose therapy. Aust. Vet. J. 1992, 69, 126–128. [Google Scholar] [CrossRef] [PubMed]
  65. Barbour, A.; Scaglione, F.; Derendorf, H. Class-dependent relevance of tissue distribution in the interpretation of anti-infective pharmacokinetic/pharmacodynamic indices. Int. J. Antimicrob. Agents 2010, 35, 431–438. [Google Scholar] [CrossRef]
  66. Huang, A.X.; Wang, S.G.; Guo, J.L.; Gu, Y.F.; Li, J.; Huang, L.L.; Wang, X.; Tao, Y.F.; Liu, Z.L.; Yuan, Z.H.; et al. Prudent Use of Tylosin for Treatment of Mycoplasma gallisepticum Based on Its Clinical Breakpoint and Lung Microbiota Shift. Front. Microbiol. 2021, 12, 712473. [Google Scholar] [CrossRef] [PubMed]
  67. Yang, Y.; Cheng, P.; Xiao, T.; Ulzikhutag, J.; Zhang, X. Pharmacokinetics and pharmacodynamics integration of danofloxacin against Eschrichia coli in piglet ileum ultrafiltration probe model. Sci. Rep. 2021, 11, 681. [Google Scholar] [CrossRef]
  68. Bonassa, K.P.D.; Miragliotta, M.Y.; Simas, R.C.; Eberlin, M.N.; Anadón, A.; Moreno, R.A.; Reyes, F.G.R. Pharmacokinetics, Pharmacodynamic Efficacy Prediction Indexes and Monte Carlo Simulations of Enrofloxacin Hydrochloride against Bacterial Strains That Induce Common Clinical Diseases in Broiler Chickens. Front. Vet. Sci. 2021, 7, 606872. [Google Scholar] [CrossRef] [PubMed]
  69. Fernández-Varón, E.; García-Romero, E.; Serrano-Rodríguez, J.M.; Cárceles, C.M.; García-Galán, A.; Cárceles-García, C.; Fernández, R.; Muñoz, C.; de-la-Fe, C. PK/PD Analysis of Marbofloxacin by Monte Carlo Simulation against Mycoplasma agalactiae in Plasma and Milk of Lactating Goats after IV, SC and SC-Long Acting Formulations Administration. Animals 2021, 11, 1104. [Google Scholar] [CrossRef]
  70. Zhang, N.; Wu, Y.; Huang, Z.; Yao, L.; Zhang, L.; Cai, Q.; Shen, X.; Jiang, H.; Ding, H. The PK-PD Relationship and Resistance Development of Danofloxacin against Mycoplasma gallisepticum in an In Vivo Infection Model. Front. Microbiol. 2017, 8, 926. [Google Scholar] [CrossRef] [Green Version]
  71. Kum, C.; Gokbulut, C.; Sekkin, S.; Boyacioglu, M. Pharmacokinetics of danofloxacin following intravenous and intramuscular administration in donkeys. J. Vet. Pharmacol.Ther. 2009, 32, 105–108. [Google Scholar] [CrossRef]
  72. Ehtisham-Ul-Haque, S.; Rahman, S.U.; Khan, M.I.; Younus, M.; Nasir, A. A simplified duplex real-time pcr incorporating taqman minor groove binder (mgb) probes and an exogenous internal positive control for the simultaneous detection of Mycoplasma gallisepticum and Mycoplasma synoviae cultures. Vet. Med. 2015, 60, 268–273. [Google Scholar] [CrossRef] [Green Version]
  73. Toutain, P.L. Setting Clinical Breakpoint Methodological Aspects; European Committee on Antimicrobial Susceptibility Testing: Toulouse, France, 2015. [Google Scholar]
  74. Cuesta, I.; Bielza, C.; Cuenca-Estrella, M.; Larranaga, P.; Rodriguez-Tudela, J.L. Evaluation by data mining techniques of fluconazole breakpoints established by the Clinical and Laboratory Standards Institute (CLSI) and comparison with those of the European Committee on Antimicrobial Susceptibility Testing (EUCAST). Antimicrob. Agents Chemother. 2010, 54, 1541–1546. [Google Scholar] [CrossRef] [PubMed] [Green Version]
  75. Bhat, S.V.; Peleg, A.Y.; Lodise, T.P., Jr.; Shutt, K.A.; Capitano, B.; Potoski, B.A.; Paterson, D.L. Failure of current cefepime breakpoints to predict clinical outcomes of bacteremia caused by gram-negative organisms. Antimicrob. Agents Chemother. 2007, 51, 4390–4395. [Google Scholar] [CrossRef] [PubMed] [Green Version]
  76. Abundo, M.E.C.; Ngunjiri, J.M.; Taylor, K.J.M.; Ji, H.; Ghorbani, A.; Kc, M.; Elaish, M.; Jang, H.; Weber, B.; Johnson, T.J.; et al. Evaluation of Sampling Methods for the Study of Avian Respiratory Microbiota. Avian Dis. 2020, 64, 277–285. [Google Scholar] [CrossRef] [PubMed]
  77. Wang, J.; Ishfaq, M.; Fan, Q.; Chen, C.; Li, J. A respiratory commensal bacterium acts as a risk factor for Mycoplasma gallisepticum infection in chickens. Vet. Immunol. Immunopathol. 2020, 230, 110127. [Google Scholar] [CrossRef] [PubMed]
  78. Abundo, M.E.C.; Ngunjiri, J.M.; Taylor, K.J.M.; Ji, H.; Ghorbani, A.; Mahesh, K.C.; Weber, B.P.; Johnson, T.J.; Lee, C.W. Assessment of two DNA extraction kits for profiling poultry respiratory microbiota from multiple sample types. PLoS ONE 2021, 16, e0241732. [Google Scholar] [CrossRef]
  79. Budden, K.F.; Shukla, S.D.; Rehman, S.F.; Bowerman, K.L.; Keely, S.; Hugenholtz, P.; Armstrong-James, D.P.H.; Adcock, I.M.; Chotirmall, S.H.; Chung, K.F.; et al. Functional effects of the microbiota in chronic respiratory disease. Lancet Respir. Med. 2019, 7, 907–920. [Google Scholar] [CrossRef]
  80. Mazel, D.; Mobashery, S. Antibiotics as physiological stress inducers and bacterial response to the challenge. Curr. Opin. Microbiol. 2012, 15, 553–554. [Google Scholar] [CrossRef] [Green Version]
  81. Martínez, J.L.; Rojo, F. Metabolic regulation of antibiotic resistance. FEMS Microbiol. Rev. 2011, 35, 768–789. [Google Scholar] [CrossRef]
  82. Poole, K. Bacterial stress responses as determinants of antimicrobial resistance. J. Antimicrob. Chemother. 2012, 67, 2069–2089. [Google Scholar] [CrossRef] [Green Version]
  83. Hill, D.A.; Hoffmann, C.; Abt, M.C.; Du, Y.; Kobuley, D.; Kirn, T.J.; Bushman, F.D.; Artis, D. Metagenomic analyses reveal antibiotic-induced temporal and spatial changes in intestinal microbiota with associated alterations in immune cell homeostasis. Mucosal. Immunol. 2010, 3, 148–158. [Google Scholar] [CrossRef] [Green Version]
  84. Wang, J.; Chen, X.P.; Li, J.C.; Ishfaq, M. Gut Microbiota Dysbiosis Aggravates Mycoplasma gallisepticum Colonization in the Chicken Lung. Front. Vet. Sci. 2021, 8, 788811. [Google Scholar] [CrossRef] [PubMed]
Figure 1. Nonlinear regression of MIC distribution of danofloxacin against MG (n = 111). Note: “Raw Count” was the measured MICs of danofloxacin; “Fitted” was the simulated MICs of danofloxacin.
Antibiotics 11 00403 g001
Figure 2. The killing-time curves of danofloxacin against M19 in FM-4 broth (in vitro). Note: M19 is a highly pathogenic strain as determined by the chicken embryo virulence test. FM-4 is a medium for the culture of MG. MIC (2 μg/mL) is the minimum inhibitory concentration of danofloxacin against M19.
Antibiotics 11 00403 g002
Figure 3. Ex vivo killing-time curves in infected lung tissue.
Antibiotics 11 00403 g003
Figure 4. Mean concentration versus time for danofloxacin in healthy and diseased lung ((A): healthy lung (B): diseased lung).
Antibiotics 11 00403 g004
Figure 5. Taxonomic classification of the 16S rRNA sequences at phylum. Note: HWK represents the control group; GW represents the infection group; ZW represents the treatment group, and ZHW represents the post-treatment group.
Antibiotics 11 00403 g005
Figure 6. Venn diagrams of the common and unique OTUs of the four groups. Note: HWK represents the control group; GW represents the infection group; ZW represents the treatment group, and ZHW represents the post-treatment group. The numbers in the Venn diagram indicate the common (overlapping part) and unique OTUs of each sample group. The common OTUs represent the overlapping part between two or more groups, and the unique OTUs represent the part where no overlap occurred.
Antibiotics 11 00403 g006
Table 1. Primer sequences for identification of MG.
PrimerSequenceAmplicon Size
MG-13RGAGCTAATCTGTAAAGTTGGTC185 bp
MG-14FGCTTCCTTGCGGTTAGCAAC
Table 2. PK parameters in plasma (left) and lung (right) in healthy (n = 65) and infected (n = 65) broilers after an oral administration of danofloxacin at a dose of 5 mg/kg.
ParameterUnitsPlasmaLung
Healthy GroupInfected GroupHealthy GroupInfected Group
Cmaxμg/mL0.32 ± 0.000.28 ± 0.014.28 ± 0.174.71 ± 0.29
Tmaxh0.82 ± 0.040.99 ± 0.101.28 ± 0.031.30 ± 0.01
α1/h1.80 ± 0.021.32 ± 0.030.75 ± 0.020.76 ± 0.02
β1/h0.05 ± 0.020.03 ± 0.010.05 ± 0.010.07 ± 0.01
T1/2αh0.38 ± 0.020.53 ± 0.130.92 ± 0.030.91 ± 0.03
T1/2βh14.55 ± 0.8325.21 ± 0.7213.77 ± 0.439.77 ± 0.72
CL/F(mg/kg)/(h·μg/mL)0.93 ± 0.080.82 ± 0.060.23 ± 0.020.22 ± 0.05
AUC24h·μg/mL5.40 ± 0.466.12 ± 0.2421.97 ± 2.8023.67 ± 2.24
Note: Cmax is the peak concentration; Tmax is the peak time; α is the distribution rate constant; β is the elimination rate constant; T1/2α is the distribution half-life; T1/2β is the elimination half-life; CL is the clearance rate, F is the bioavailability, CL/F is the body clearance corrected by bioavailability, and AUC is the area under the curve of the drug.
Table 3. The Sigmoid Emax model of danofloxacin in the lung.
ParametersUnitsDiseased Group
EmaxLgCCU/mL1.85
E0LgCCU/mL−6
EC50h31.22
N2.67
Emax − E0LgCCU/mL7.85
(AUC24h/MIC)exE = 0h20.09
(AUC24h/MIC)exE = −3h37.34
(AUC24h/MIC)exE = −4h46.67
Note: (AUC24h/MIC)exE is the difference of antibacterial CCU logarithm of lung tissue samples incubated with danofloxacin; Emax is the maximum difference of antibacterial CCU logarithm of lung tissue samples incubated with danofloxacin; E0 is the difference after 24 h incubation in CCU antibacterial logarithm in control samples; EC50 is considered the PK–PD parameter value ex vivo when producing 50% maximal bactericidal effect in the lung tissue sample; N is the Hill coefficient, which is used to determine the S-shaped curve, describe the effect value E linearization ex vivo and the slope of the PK–PD parameter value.
Table 4. The effect of danofloxacin for the treatment of different MIC of MG.
GroupMIC
(μg/mL)
TotalValidCureEffective Rate
(%)
Cure Rate (%)Average GainAir Sac Average Damage ScoreAir Sac Injury Reduction Rate (%)
Blank group-15----290.00 ± 68.100.00 ± 0.00100
M57 Test group
Control group
41513886.753.3185.10 ± 50.202.57 ± 0.5058
15----100.21 ± 28.202.90 ± 0.800
M19 Test group
Control group
2151298060230.10 ± 25.201.73 ± 0.3062
15----97.10 ± 35.202.87 ± 0.770
M73 Test group
Control group
115111073.366.7255.50 ± 29.220.71 ± 0.7064
15----80.30 ± 19.303.00 ± 0.520
M24 Test group
Control group
0.2515141493.393.3247.20 ± 32.350.56 ± 0.7279
15----59.10 ± 14.002.93 ± 0.690
M2 Test group
Control group
0.01615141593.3100268.10 ± 18.230.53 ± 0.7385
15----80.30 ± 16.393.2 ± 0.930
Table 5. The CAR and MaxDiff results of WindoW analysis for five strains of different MIC.
StrainMIC (μg/mL)Success Treatment%Success ≤ MIC%Success > MICMaxDiffAUCSuccAUCTotalCAR
M20.01615100.00 A68.33 B31.670.120.121
M240.251493.3060.0033.30 C3.513.630.967
M7311066.6756.6710.0012.51314.880.841
M192960.0053.336.6722.01329.880.737
M574853.3353.330.0039.09359.880.653
Note: A is Subset A, B is Subset B, and C is MaxDiff. Subset A = 100 × (15/15); Subset B = 100 × (14 + 10 + 9 + 8)/(15 + 15 + 15 + 15).
Publisher’s Note: MDPI stays neutral with regard to jurisdictional claims in published maps and institutional affiliations.

