
A Novel Network Science and Similarity-Searching-Based Approach for Discovering Potential Tumor-Homing Peptides from Antimicrobials

 ,
,  , ,
, ,  , ,
, ,
Abstract
:1. Introduction
2. Materials and Methods
2.1. StarPep Toolbox Software
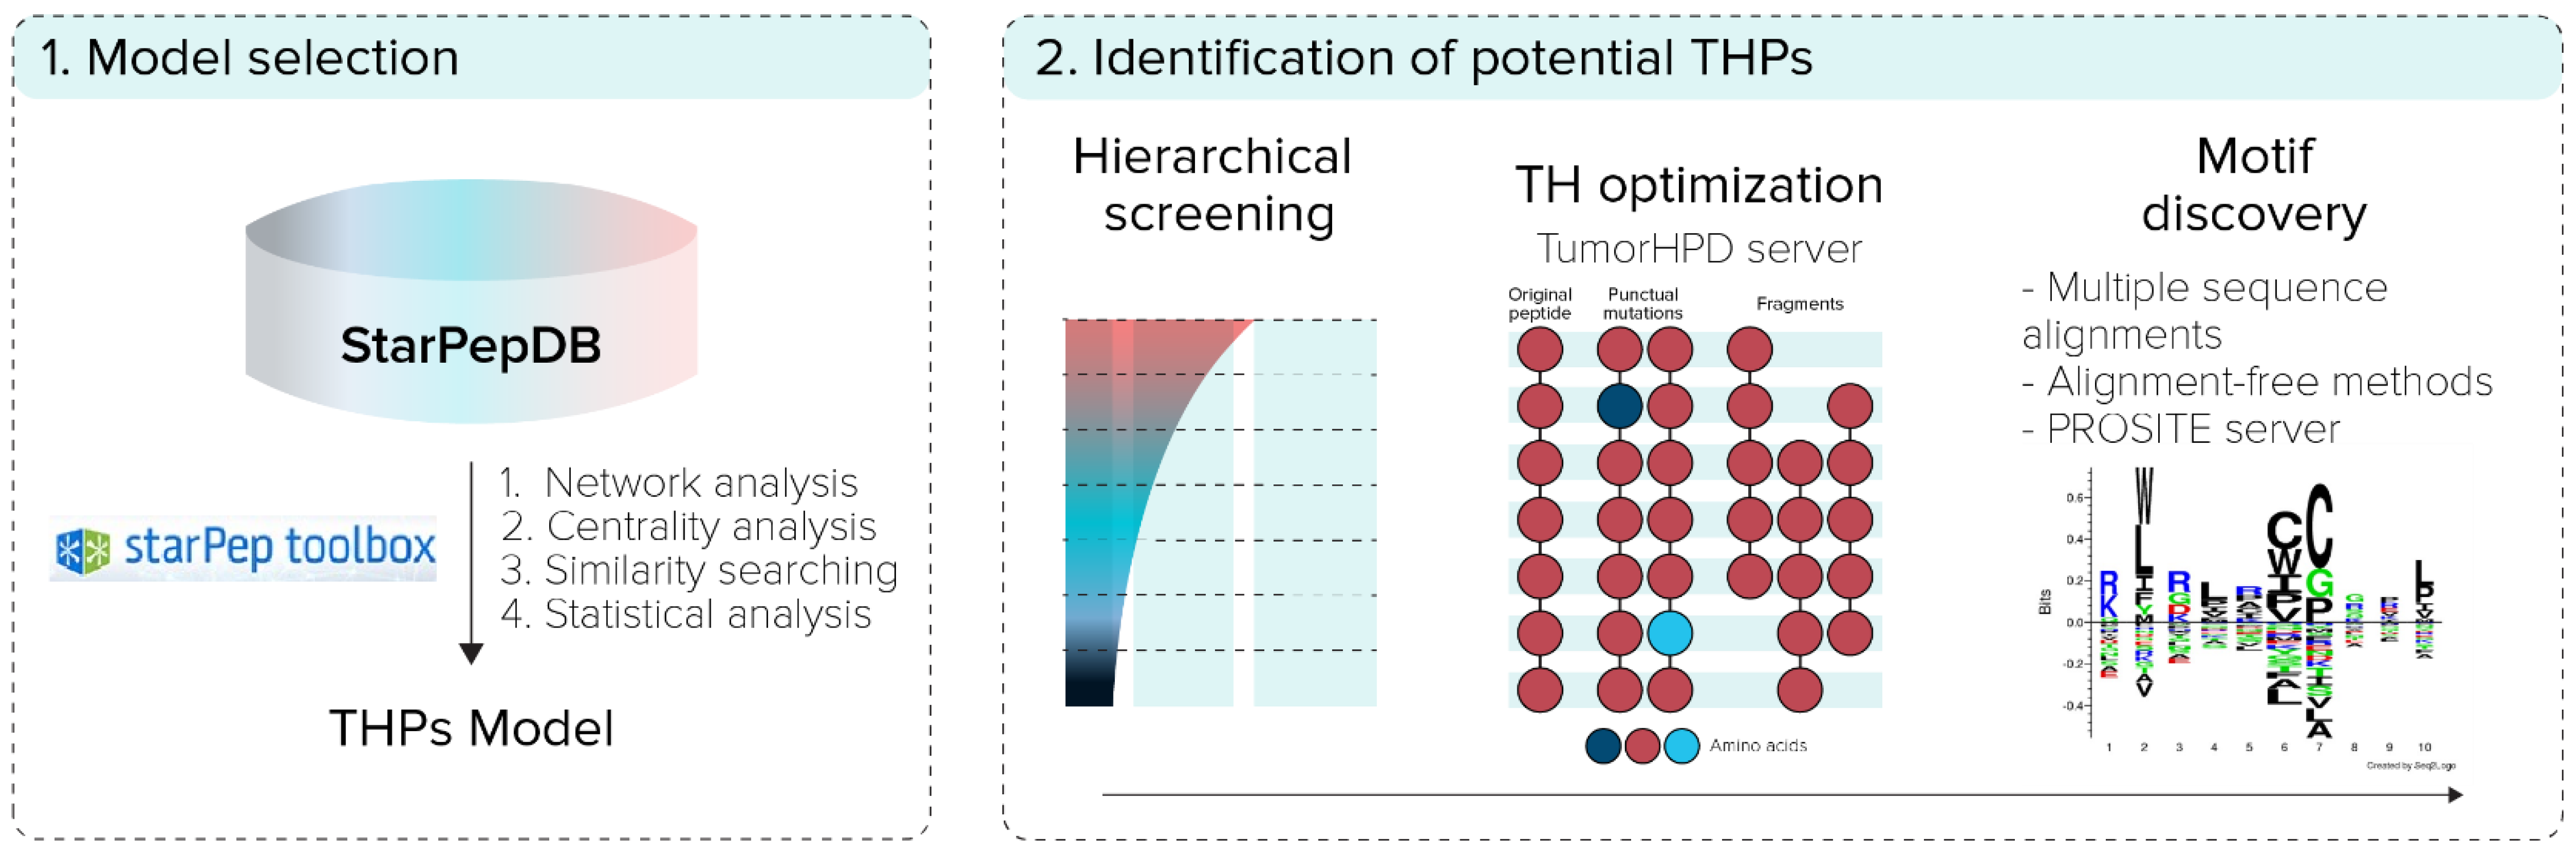
2.2. Model Selection
2.2.1. Network Analysis
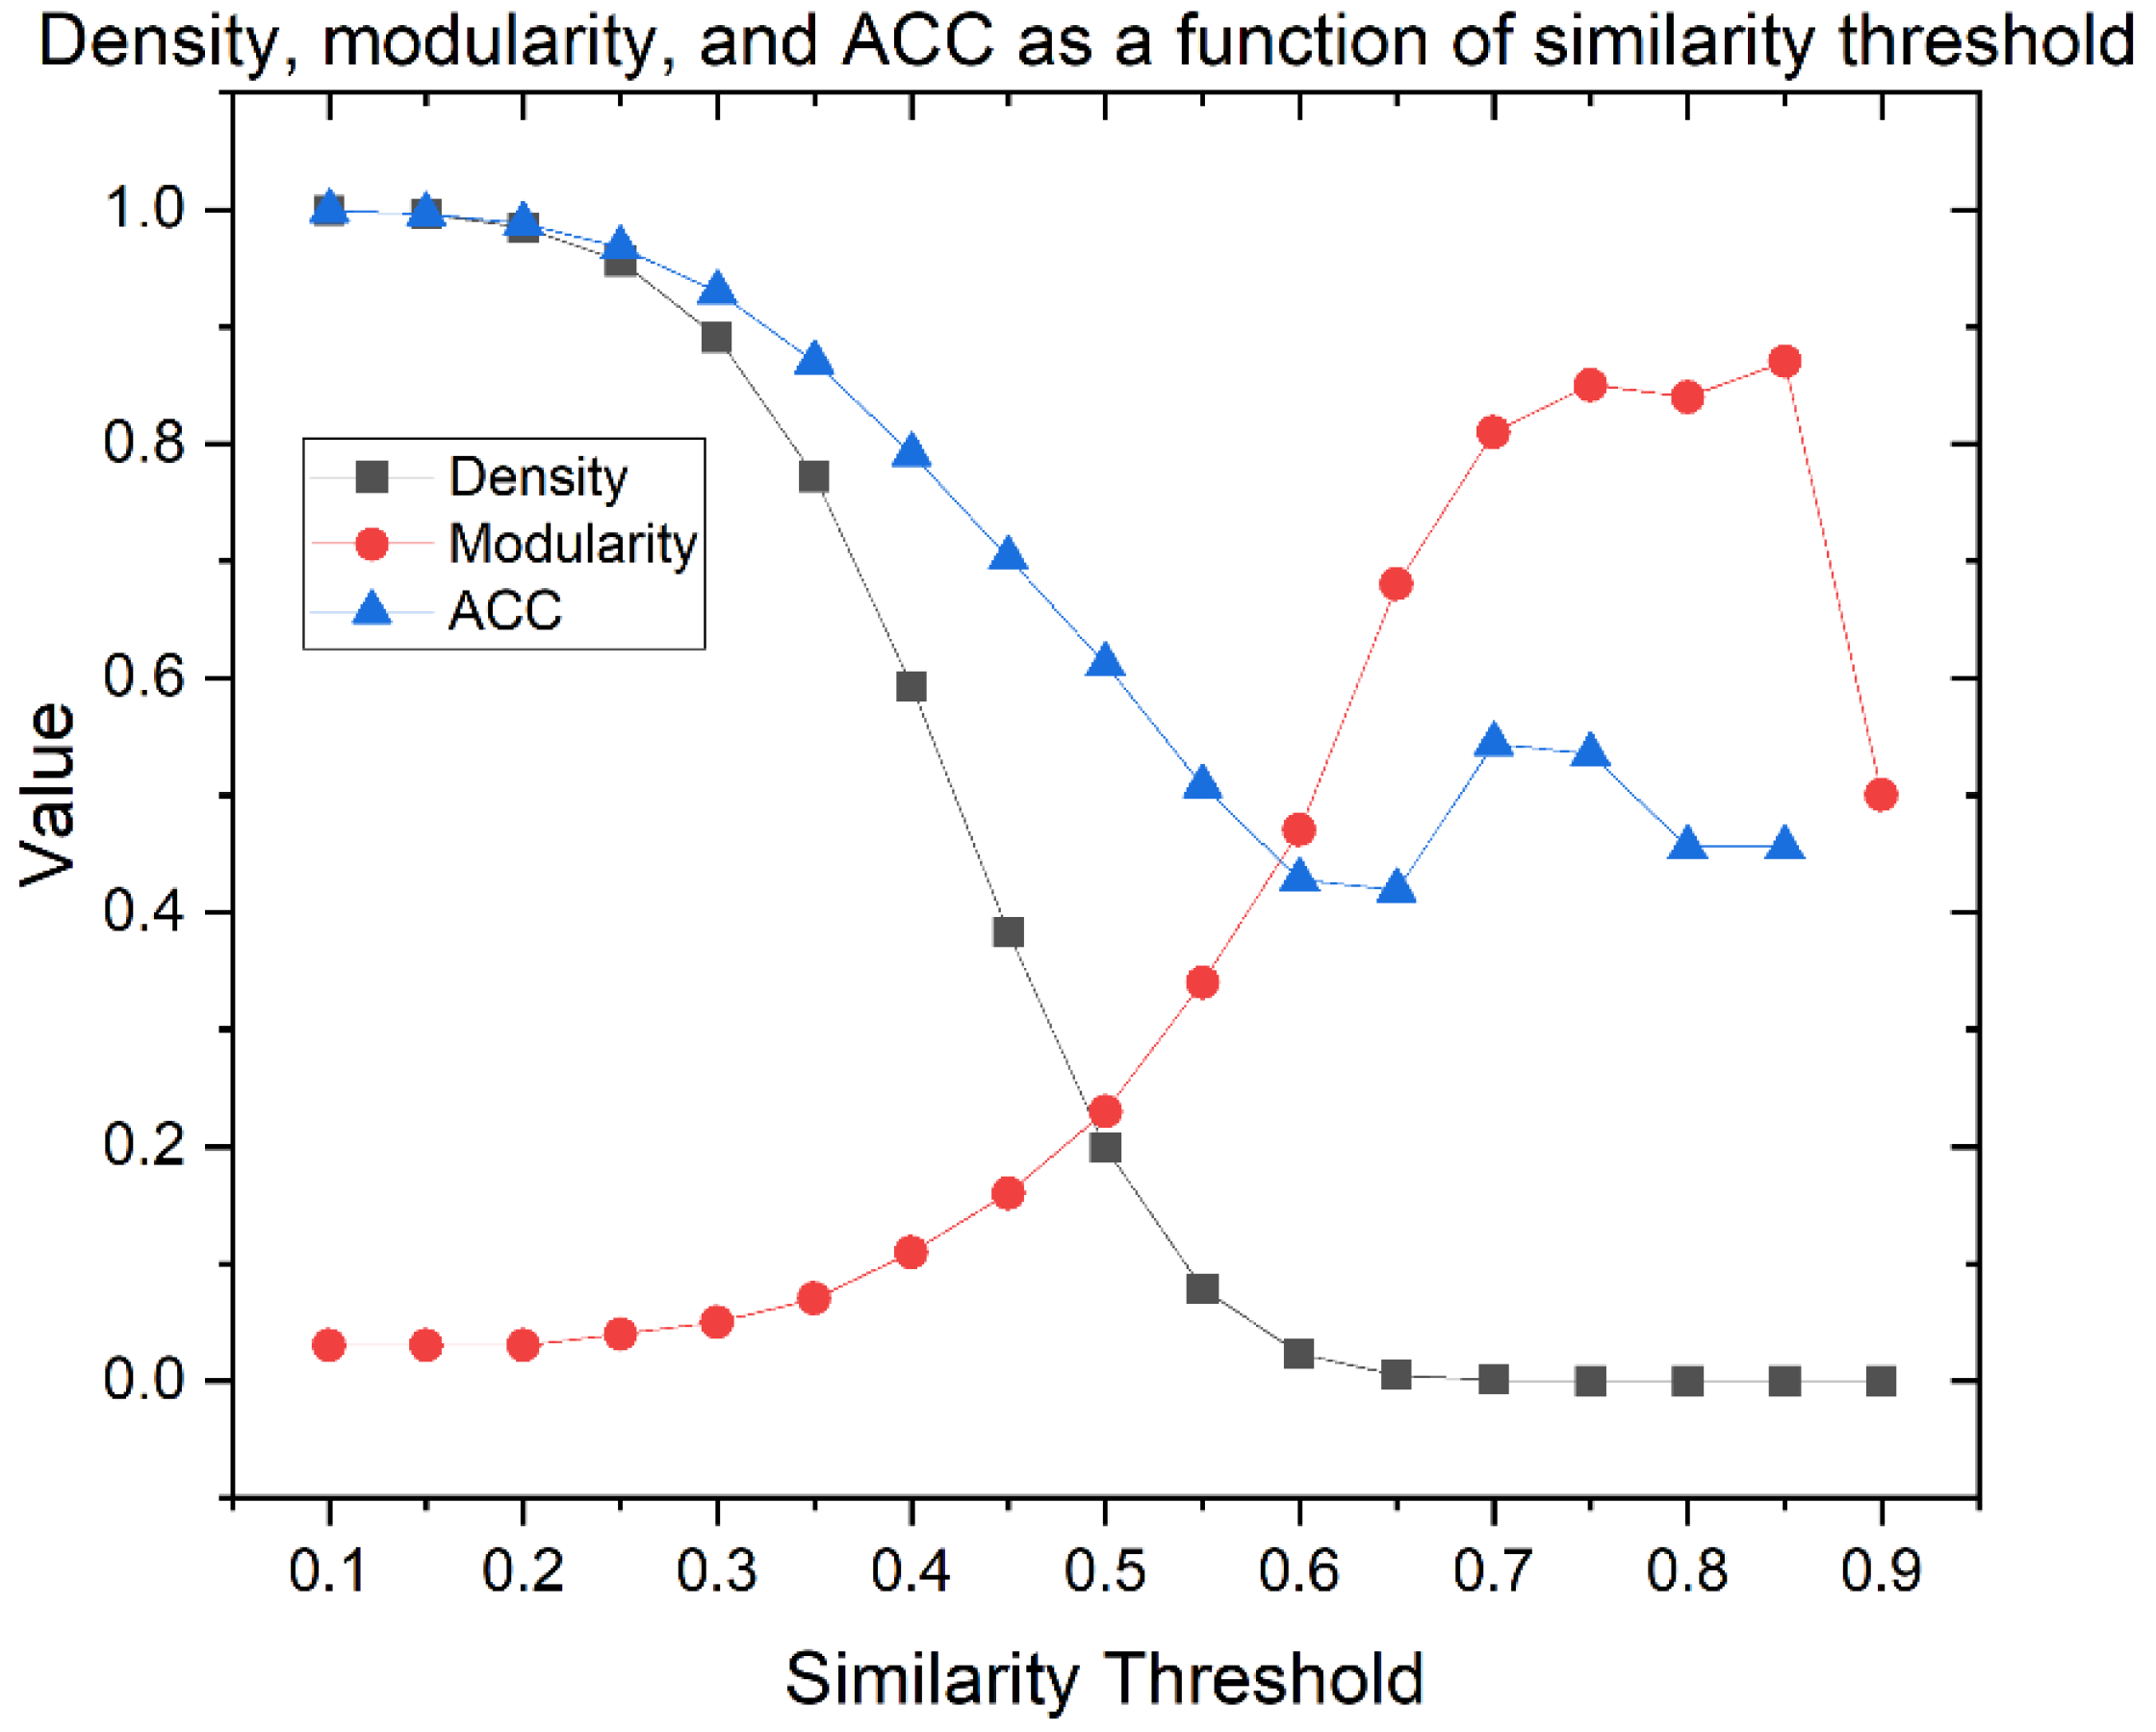
Similarity Threshold Analysis
Network Characterization
2.2.2. Centrality Analysis
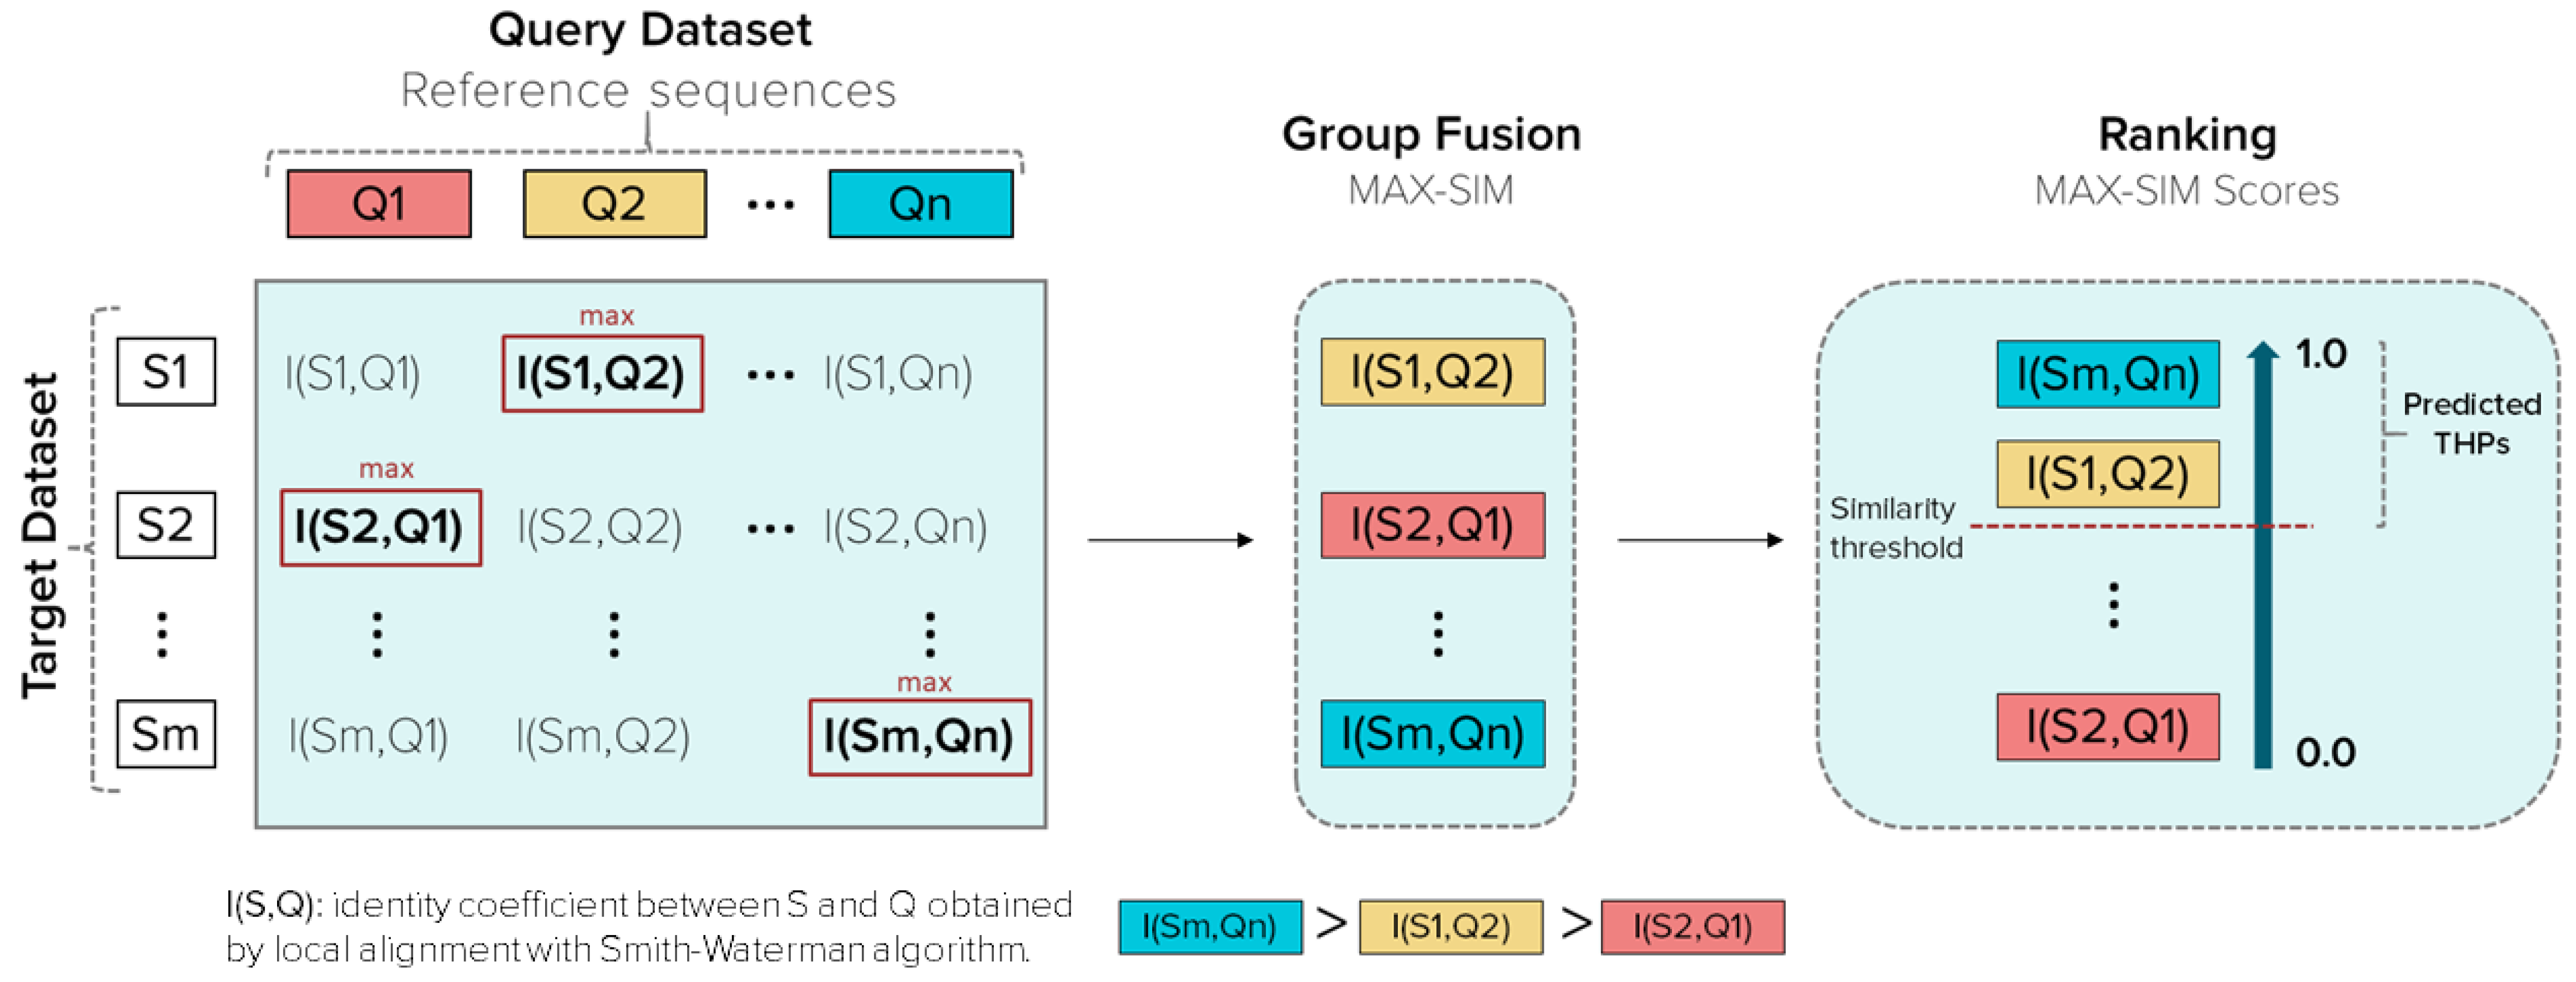
2.2.3. Similarity Searching Model for THPs Prediction
Query Datasets (Reference Sequences)
Target Databases
- Small dataset: 469 experimentally validated THPs and 469 random non-THPs (SI1-C). They are peptides derived from the Main dataset with 4 to 10 aa residues.
- Main90 dataset: 176 THPs and 443 non-THPs (SI1-D). They are peptides from the Main dataset with equal or lower than 90% of sequence similarity.
Group fusion
Retrospective Similarity Searching
2.2.4. Statistical Analysis
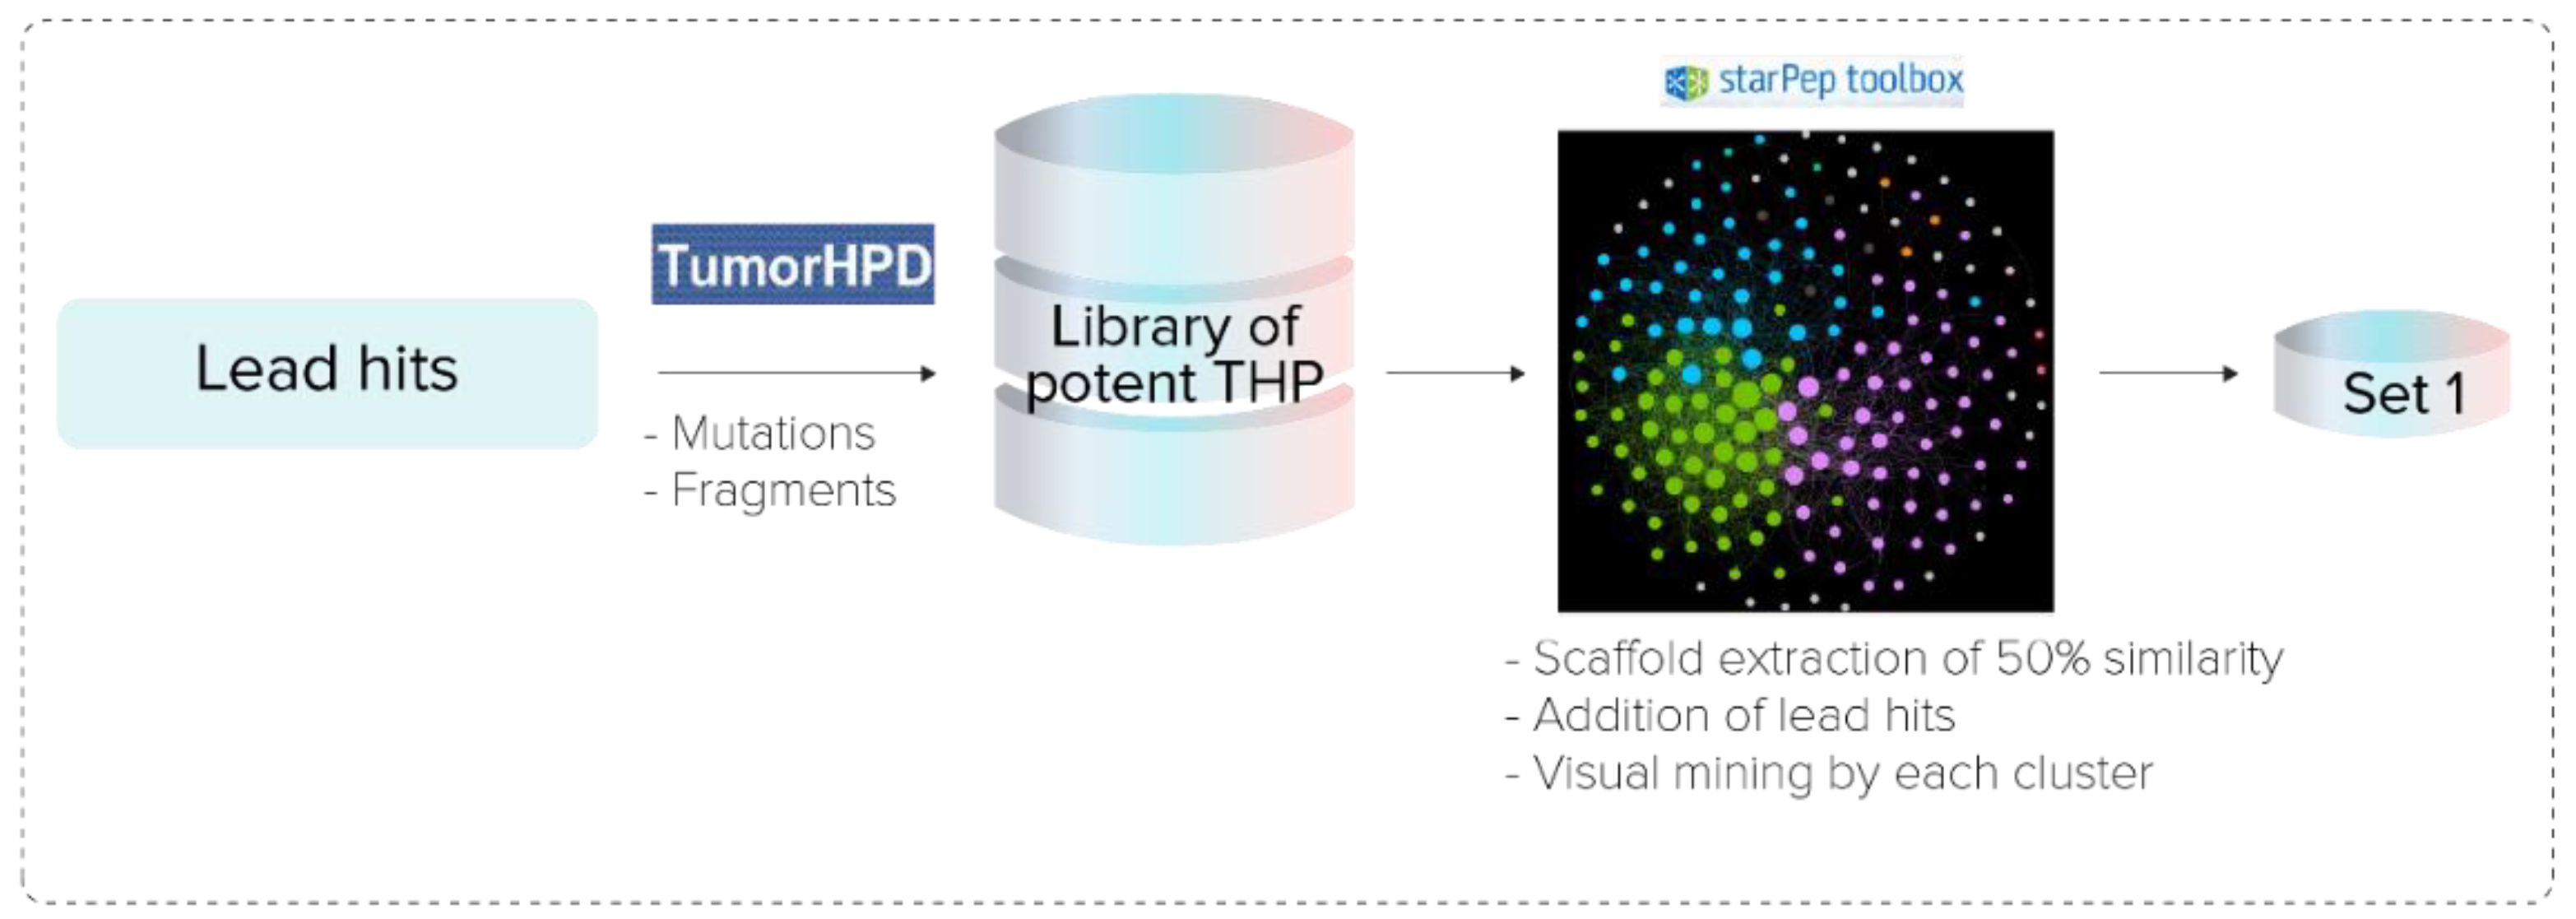
2.3. Identification of Potential THPs
2.3.1. Hierarchical Screening
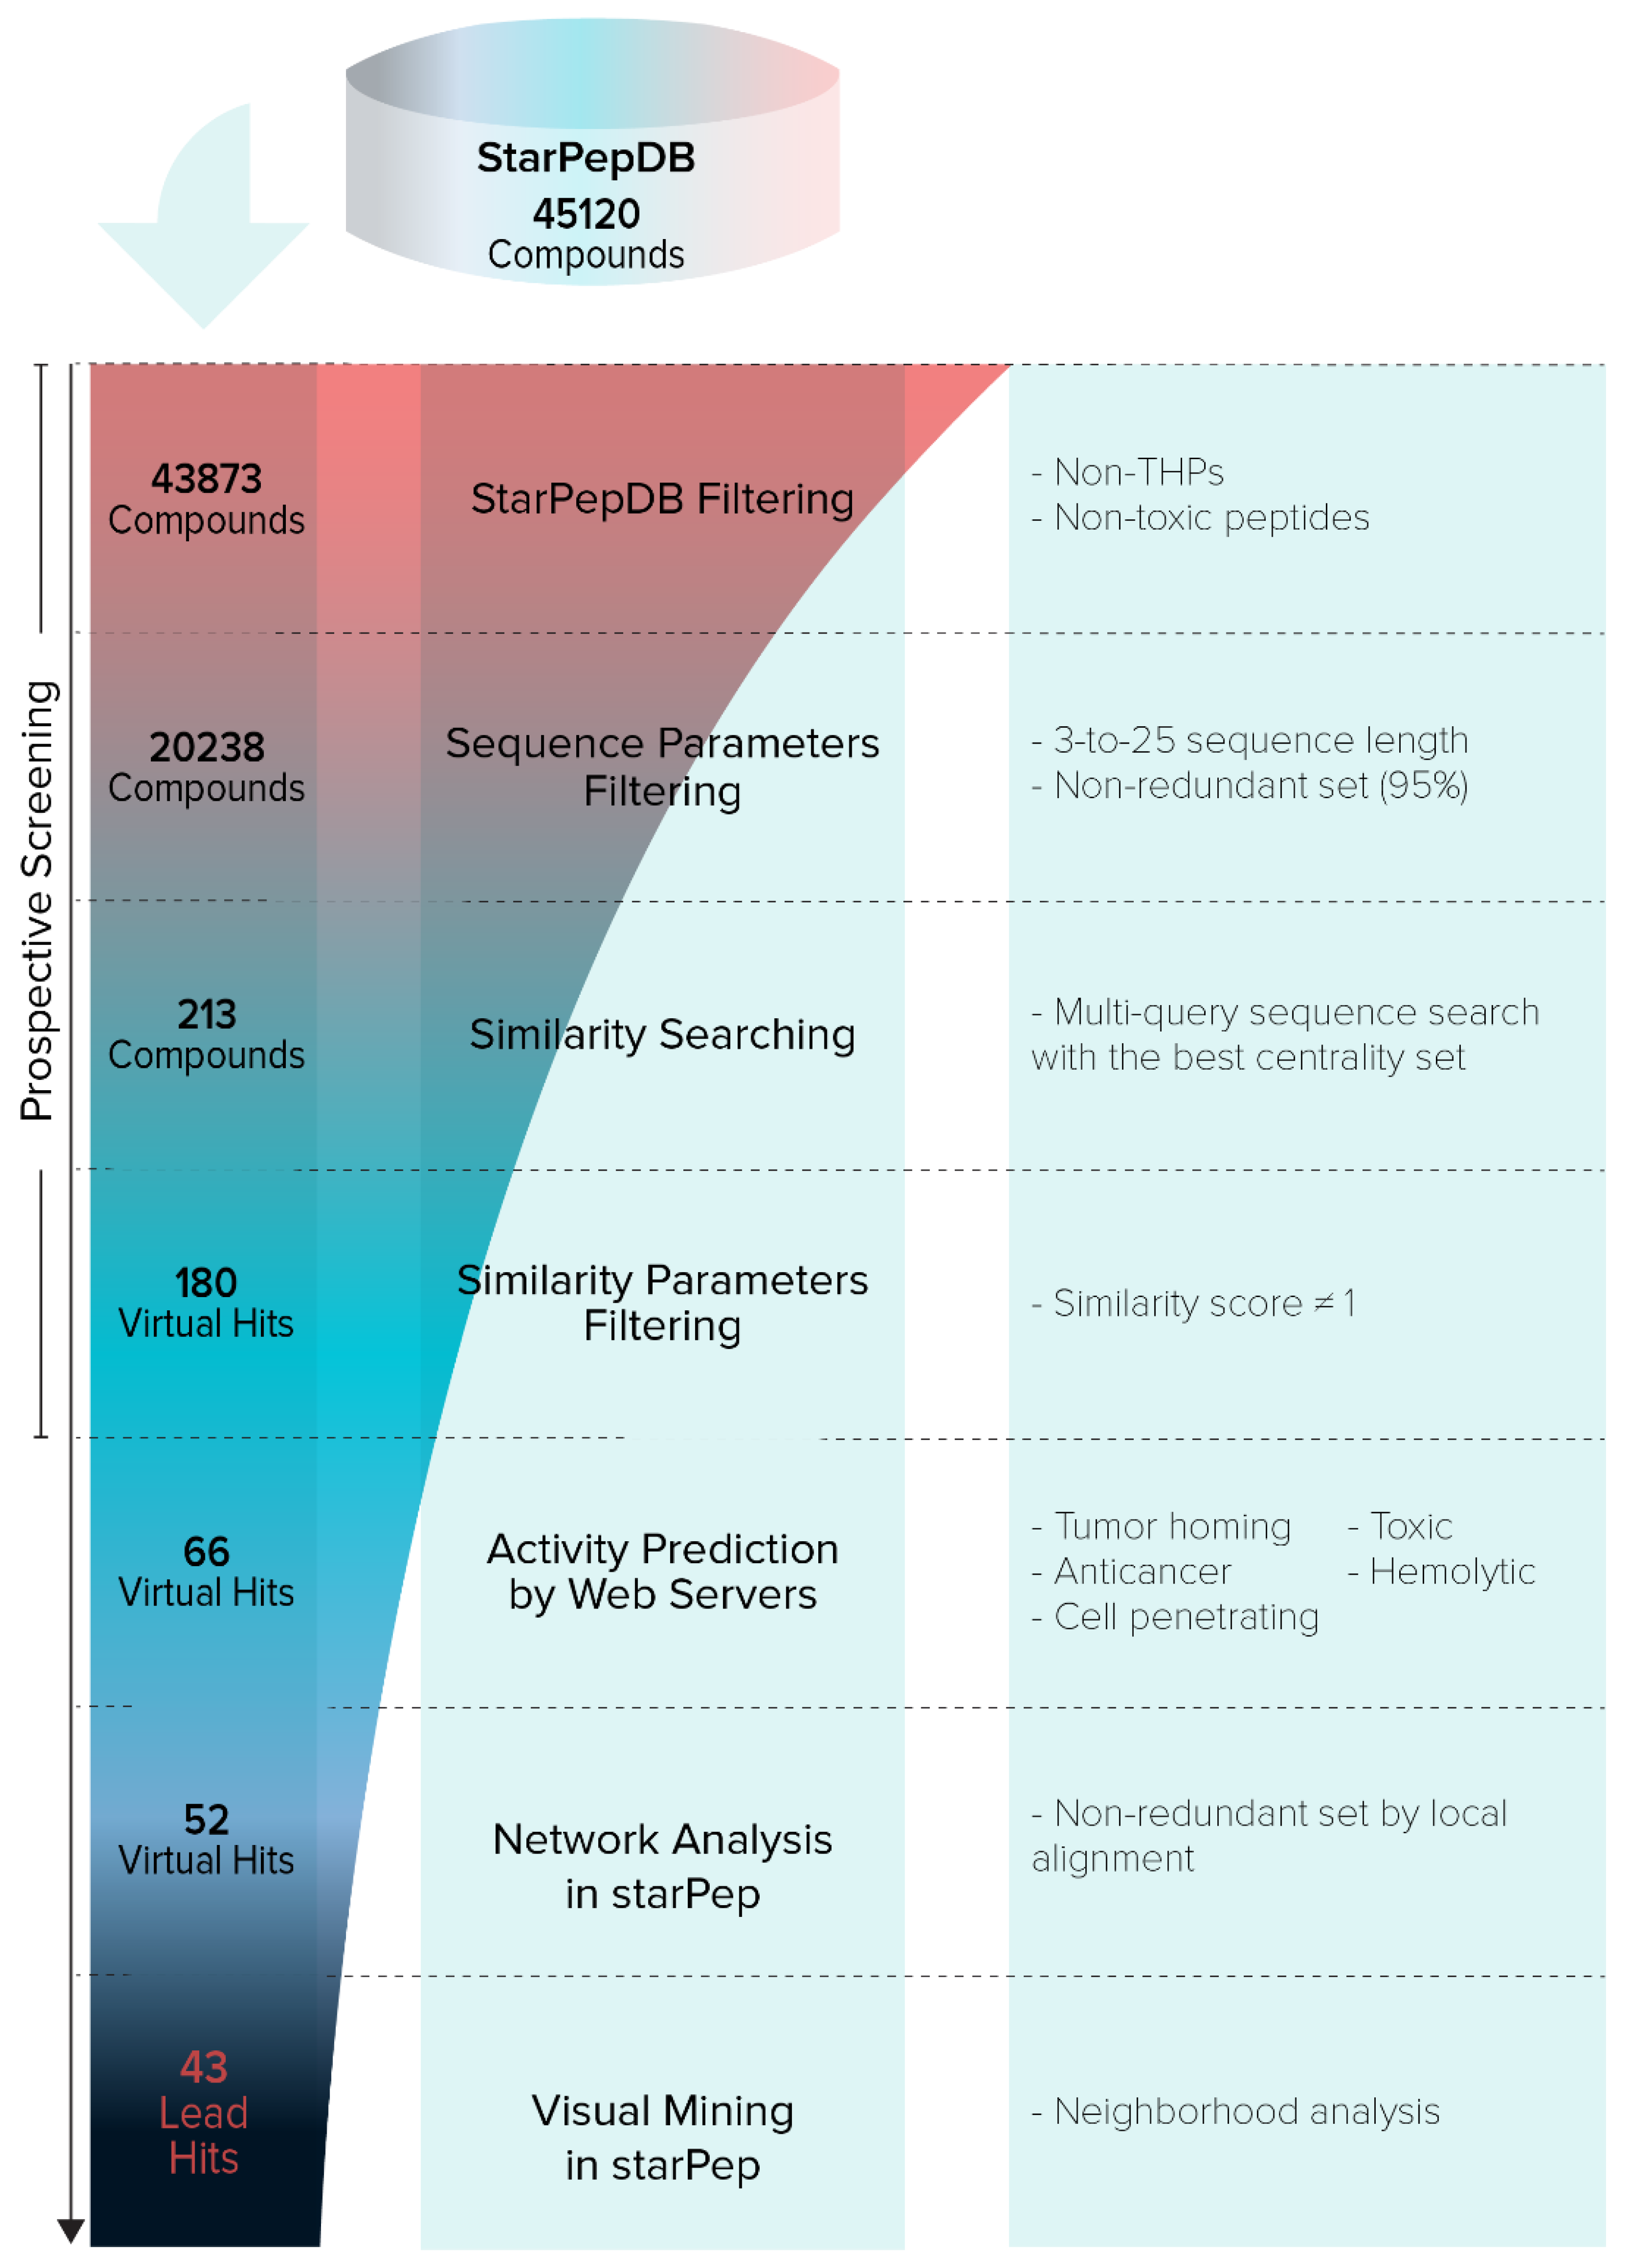
- Pipeline Prospective Screening. First, AMPs without reported TH activity and toxicity with a sequence length between 3 and 25 residues were filtered from the chemical space of starPepDB. Secondly, the “Scaffold extraction” option removed AMPs with higher than 95% sequence similarity by local alignment. Thirdly, multiple query similarity searching was performed using the best SSM (THP1), obtained in the previous section, to explore the chemical space of non-THPs, non-toxic, and non-redundant peptides with a length of 3–25 aa, using 60% as similarity threshold. In the recovered set, peptides with a similarity score of 1 were removed.
- Activity Prediction. Peptides with reported tumor-homing activity in the literature were removed since the main objective of this study was to identify novel THPs. Then, theoretical activities of virtual hits were predicted using webservers TumorHPD [26], THPep [28], AntiCP [48], CellPPD [49], ToxinPred [50], and HemoPI [51], to corroborate their potential as THPs and prioritize those that do not harm healthy cells. The activities of interest were tumor homing, anticancer, cell-penetrating, toxicity, and hemolysis. The SVM thresholds used were 0.30 in servers TumorHPD, AntiCP, and CellPPD, and 0 in server ToxinPred.
- Redundancy Reduction by Network Analysis. CSN of hits was built, clustered, and the modularity was optimized using the Louvain method in the starPep toolbox. Then, harmonic and weighted degree centralities were calculated to perform a scaffold extraction using a 60% identity as the threshold.
- Visual Mining. The neighborhood of well-known THPs of each potential THP was visualized using the starPep toolbox. CSN of 659 THPs in starPepDB was built using 0.60 as cut-off, clustered, and optimized modularity. Hits obtained in the previous step after scaffold extraction were embedded into the CSN of 659 THPs to study the neighborhood of each peptide. Hence, the 3 nearest neighbors from 659 THPs directly attached to each hit were visualized. If 2 peptides shared the same 2 or 3-nearest neighbors, one of them was prioritized, choosing the one with better predicted activities.
2.3.2. Tumor-Homing Activity Optimization
2.3.3. Motif Discovery
Multiple Sequence Alignments
Alignment-Free Method
Motif Search in PROSITE
3. Results and Discussion
3.1. Model Selection
3.1.1. Network Analysis
Similarity Threshold Analysis
Network Characterization
3.1.2. Centrality Analysis and Similarity Searching
3.2. Identification of Potential THPs
3.2.1. Hierarchical Screening
3.2.2. Tumor-Homing Activity Optimization
3.2.3. Motif Discovery
4. Conclusions
Supplementary Materials
Author Contributions
Funding
Institutional Review Board Statement
Informed Consent Statement
Data Availability Statement
Acknowledgments
Conflicts of Interest
References
- World Health Organization. Cancer. Available online: https://www.who.int/health-topics/cancer#tab=tab_1 (accessed on 1 October 2021).
- Hoskin, D.W.; Ramamoorthy, A. Studies on anticancer activities of antimicrobial peptides. Biochim. Biophys. Acta Biomembr. 2008, 1778, 357–375. [Google Scholar] [CrossRef] [Green Version]
- Miller, K.D.; Nogueira, L.; Mariotto, A.B.; Rowland, J.H.; Yabroff, K.R.; Alfano, C.M.; Jemal, A.; Kramer, J.L.; Siegel, R.L. Cancer treatment and survivorship statistics, 2019. CA Cancer J. Clin. 2019, 69, 363–385. [Google Scholar] [CrossRef] [Green Version]
- Gatti, L.; Zunino, F. Overview of Tumor Cell Chemoresistance Mechanisms. In Chemosensitivity; Humana Press: Clifton, NJ, USA, 2005; Volume 111, pp. 127–148. [Google Scholar]
- de la Torre, B.G.; Albericio, F. Peptide therapeutics 2.0. Molecules 2020, 25, 2019–2021. [Google Scholar] [CrossRef]
- Lau, J.L.; Dunn, M.K. Therapeutic peptides: Historical perspectives, current development trends, and future directions. Bioorg. Med. Chem. 2018, 26, 2700–2707. [Google Scholar] [CrossRef]
- Albericio, F.; Kruger, H.G. Therapeutic peptides. Future Med. Chem. 2012, 4, 1527–1531. [Google Scholar] [CrossRef] [Green Version]
- Ladner, R.C.; Sato, A.K.; Gorzelany, J.; De Souza, M. Phage display-derived peptides as therapeutic alternatives to antibodies. Drug Discov. Today 2004, 9, 525–529. [Google Scholar] [CrossRef]
- Vlieghe, P.; Lisowski, V.; Martinez, J.; Khrestchatisky, M. Synthetic therapeutic peptides: Science and market. Drug Discov. Today 2010, 15, 40–56. [Google Scholar] [CrossRef]
- Loffet, A. Peptides as drugs: Is there a market? J. Pept. Sci. 2002, 8, 1–7. [Google Scholar] [CrossRef]
- Segura-Campos, M.; Chel-Guerrero, L.; Betancur-Ancona, D.; Hernandez-Escalante, V.M. Bioavailability of bioactive peptides. Food Rev. Int. 2011, 27, 213–226. [Google Scholar] [CrossRef]
- Wu, D.; Gao, Y.; Qi, Y.; Chen, L.; Ma, Y.; Li, Y. Peptide-based cancer therapy: Opportunity and challenge. Cancer Lett. 2014, 351, 13–22. [Google Scholar] [CrossRef]
- Wei, G.; Wang, Y.; Huang, X.; Hou, H.; Zhou, S. Peptide-Based Nanocarriers for Cancer Therapy. Small Methods 2018, 2, 1–16. [Google Scholar] [CrossRef]
- Tesauro, D.; Accardo, A.; Diaferia, C.; Milano, V.; Guillon, J.; Ronga, L.; Rossi, F. Peptide-Based Drug-Delivery Systems in Biotechnological Applications: Recent Advances and Perspectives. Molecules 2019, 24, 351. [Google Scholar] [CrossRef] [PubMed] [Green Version]
- Ruoslahti, E. Tumor penetrating peptides for improved drug delivery. Adv. Drug Deliv. Rev. 2017, 110–111, 3–12. [Google Scholar] [CrossRef] [PubMed] [Green Version]
- Khandia, R.; Sachan, S.; Munjal, A.K.; Tiwari, R.; Dhama, K. Tumor Homing Peptides: Promising Futuristic Hope for Cancer Therapy. In Topics in Anti-Cancer Research; Bentham Science Publishers: Sharjah, United Arab Emirates, 2016; pp. 43–86. [Google Scholar]
- Laakkonen, P.; Vuorinen, K. Homing peptides as targeted delivery vehicles. Integr. Biol. 2010, 2, 326–337. [Google Scholar] [CrossRef]
- Elsabahy, M.; Shrestha, R.; Clark, C.; Taylor, S.; Leonard, J.; Wooley, K.L. Multifunctional hierarchically assembled nanostructures as complex stage-wise dual-delivery systems for coincidental yet differential trafficking of siRNA and paclitaxel. Nano Lett. 2013, 13, 2172–2181. [Google Scholar] [CrossRef] [Green Version]
- Kolonin, M.G.; Bover, L.; Sun, J.; Zurita, A.J.; Do, K.A.; Lahdenranta, J.; Cardó-Vila, M.; Giordano, R.J.; Jaalouk, D.E.; Ozawa, M.G.; et al. Ligand-directed surface profiling of human cancer cells with combinatorial peptide libraries. Cancer Res. 2006, 66, 34–40. [Google Scholar] [CrossRef] [PubMed] [Green Version]
- Peletskaya, E.N.; Glinsky, V.V.; Glinsky, G.V.; Deutscher, S.L.; Quinn, T.P. Characterization of peptides that bind the tumor-associated Thomsen-Friedenreich antigen selected from bacteriophage display libraries. J. Mol. Biol. 1997, 270, 374–384. [Google Scholar] [CrossRef]
- Wang, F.; Li, Y.; Shen, Y.; Wang, A.; Wang, S.; Xie, T. The functions and applications of RGD in tumor therapy and tissue engineering. Int. J. Mol. Sci. 2013, 14, 13447–13462. [Google Scholar] [CrossRef] [Green Version]
- He, X.; Na, M.; Kim, J.-S.; Lee, G.-Y.; Park, J.Y.; Hoffman, A.S.; Nam, J.; Han, S.; Sim, G.Y.; Oh, Y.; et al. A Novel Peptide Probe for Imaging and Targeted Delivery of Liposomal Doxorubicin to Lung Tumor. Mol. Pharm. 2011, 8, 430–438. [Google Scholar] [CrossRef]
- Nazemian, M.; Hojati, V.; Zavareh, S.; Madanchi, H.; Hashemi-Moghaddam, H. Immobilized Peptide on the Surface of Poly l-DOPA/Silica for Targeted Delivery of 5-Fluorouracil to Breast Tumor. Int. J. Pept. Res. Ther. 2020, 26, 259–269. [Google Scholar] [CrossRef]
- Wu, C.-H.; Liu, I.-J.; Lu, R.-M.; Wu, H.-C. Advancement and applications of peptide phage display technology in biomedical science. J. Biomed. Sci. 2016, 23, 8. [Google Scholar] [CrossRef] [Green Version]
- Cui, W.; Aouidate, A.; Wang, S.; Yu, Q.; Li, Y.; Yuan, S. Discovering Anti-Cancer Drugs via Computational Methods. Front. Pharmacol. 2020, 11, 1–14. [Google Scholar] [CrossRef]
- Sharma, A.; Kapoor, P.; Gautam, A.; Chaudhary, K.; Kumar, R.; Chauhan, J.S.; Tyagi, A.; Raghava, G.P.S. Computational approach for designing tumor homing peptides. Sci. Rep. 2013, 3, 1607. [Google Scholar] [CrossRef]
- Kapoor, P.; Singh, H.; Gautam, A.; Chaudhary, K.; Kumar, R.; Raghava, G.P.S. TumorHoPe: A Database of Tumor Homing Peptides. PLoS ONE 2012, 7, e35187. [Google Scholar] [CrossRef] [Green Version]
- Shoombuatong, W.; Schaduangrat, N.; Pratiwi, R.; Nantasenamat, C. THPep: A machine learning-based approach for predicting tumor homing peptides. Comput. Biol. Chem. 2019, 80, 441–451. [Google Scholar] [CrossRef] [PubMed]
- Aguilera-Mendoza, L.; Marrero-Ponce, Y.; Beltran, J.A.; Tellez Ibarra, R.; Guillen-Ramirez, H.A.; Brizuela, C.A. Graph-based data integration from bioactive peptide databases of pharmaceutical interest: Toward an organized collection enabling visual network analysis. Bioinformatics 2019, 35, 4739–4747. [Google Scholar] [CrossRef]
- Charoenkwan, P.; Chiangjong, W.; Nantasenamat, C.; Moni, M.A.; Lio’, P.; Manavalan, B.; Shoombuatong, W. SCMTHP: A New Approach for Identifying and Characterizing of Tumor-Homing Peptides Using Estimated Propensity Scores of Amino Acids. Pharmaceutics 2022, 14, 122. [Google Scholar] [CrossRef] [PubMed]
- Aguilera-Mendoza, L.; Marrero-Ponce, Y.; García-Jacas, C.R.; Chavez, E.; Beltran, J.A.; Guillen-Ramirez, H.A.; Brizuela, C.A. Automatic construction of molecular similarity networks for visual graph mining in chemical space of bioactive peptides: An unsupervised learning approach. Sci. Rep. 2020, 10, 18074. [Google Scholar] [CrossRef]
- Sievers, F.; Wilm, A.; Dineen, D.; Gibson, T.J.; Karplus, K.; Li, W.; Lopez, R.; McWilliam, H.; Remmert, M.; Söding, J.; et al. Fast, scalable generation of high-quality protein multiple sequence alignments using Clustal Omega. Mol. Syst. Biol. 2011, 7, 539. [Google Scholar] [CrossRef]
- Katoh, K.; Misawa, K.; Kuma, K.I.; Miyata, T. MAFFT: A novel method for rapid multiple sequence alignment based on fast Fourier transform. Nucleic Acids Res. 2002, 30, 3059–3066. [Google Scholar] [CrossRef] [Green Version]
- Edgar, R.C. MUSCLE: Multiple sequence alignment with high accuracy and high throughput. Nucleic Acids Res. 2004, 32, 1792–1797. [Google Scholar] [CrossRef] [Green Version]
- Notredame, C.; Higgins, D.G.; Heringa, J. T-coffee: A novel method for fast and accurate multiple sequence alignment. J. Mol. Biol. 2000, 302, 205–217. [Google Scholar] [CrossRef] [Green Version]
- Bailey, T.L. STREME: Accurate and versatile sequence motif discovery. Bioinformatics 2021, 37, 2834–2840. [Google Scholar] [CrossRef]
- Contreras-Torres, E.; Marrero-Ponce, Y.; Terán, J.E.; R. García-Jacas, C.; Brizuela, C.A.; Carlos Sánchez-Rodríguez, J. MuLiMs-MCoMPAs: A Novel Multiplatform Framework to Compute Tensor Algebra-Based Three-Dimensional Protein Descriptors. J. Chem. Inf. Model. 2020, 60, 1042–1059. [Google Scholar] [CrossRef]
- Fruchterman, T.M.J.; Reingold, E.M. Graph Drawing by Force-Directed Placement. Softw. Pract. Exp. 1991, 21, 1129–1164. [Google Scholar] [CrossRef]
- Blondel, V.D.; Guillaume, J.-L.; Lambiotte, R.; Lefebvre, E. Fast unfolding of communities in large networks. J. Stat. Mech. Theory Exp. 2008, 2008, P10008. [Google Scholar] [CrossRef] [Green Version]
- Reigosa, M.J.; Gonzalez, L.; Sanches-Moreiras, A.; Duran, B.; Puime, D.; Fernadez, D.A.; Bolano, J.C. Comparison of physiological effects of allelochemicals and commercial herbicides. Allelopath. J. 2001, 8, 211–220. [Google Scholar]
- Bastian, M.; Heymann, S.; Jacomy, M. Gephi: An open source software for exploring and manipulating networks. In Proceedings of the Third International Conference on Weblogs and Social Media, ICWSM 2009, San Jose, CA, USA, 17–20 May 2009; pp. 361–362. [Google Scholar]
- Shoombuatong, W.; Schaduangrat, N.; Nantasenamat, C. Unraveling the bioactivity of anticancer peptides as deduced from machine learning. EXCLI J. 2018, 17, 734–752. [Google Scholar] [CrossRef] [PubMed]
- Willett, P. Similarity-based virtual screening using 2D fingerprints. Drug Discov. Today 2006, 11, 1046–1053. [Google Scholar] [CrossRef] [PubMed] [Green Version]
- Triguero, I.; González, S.; Moyano, J.M.; García, S.; Alcalá-Fdez, J.; Luengo, J.; Fernández, A.; del Jesús, M.J.; Sánchez, L.; Herrera, F. KEEL 3.0: An Open Source Software for Multi-Stage Analysis in Data Mining. Int. J. Comput. Intell. Syst. 2017, 10, 1238–1249. [Google Scholar] [CrossRef] [Green Version]
- Iman, R.L.; Davenport, J.M. Approximations of the critical region of the Friedman statistic. Commun. Stat. Theory Methods 1980, 9, 571–595. [Google Scholar] [CrossRef]
- Lee, W.H.; Loo, C.Y.; Ghadiri, M.; Leong, C.R.; Young, P.M.; Traini, D. The potential to treat lung cancer via inhalation of repurposed drugs. Adv. Drug Deliv. Rev. 2018, 133, 107–130. [Google Scholar] [CrossRef] [PubMed]
- Pushpakom, S.; Iorio, F.; Eyers, P.A.; Escott, K.J.; Hopper, S.; Wells, A.; Doig, A.; Guilliams, T.; Latimer, J.; McNamee, C.; et al. Drug repurposing: Progress, challenges and recommendations. Nat. Rev. Drug Discov. 2019, 18, 41–58. [Google Scholar] [CrossRef] [PubMed]
- Tyagi, A.; Kapoor, P.; Kumar, R.; Chaudhary, K.; Gautam, A.; Raghava, G.P.S. In silico models for designing and discovering novel anticancer peptides. Sci. Rep. 2013, 3, 2984. [Google Scholar] [CrossRef] [PubMed]
- Gautam, A.; Chaudhary, K.; Kumar, R.; Sharma, A.; Kapoor, P.; Tyagi, A.; Raghava, G.P.S. In silico approaches for designing highly effective cell penetrating peptides. J. Transl. Med. 2013, 11, 74. [Google Scholar] [CrossRef] [Green Version]
- Gupta, S.; Kapoor, P.; Chaudhary, K.; Gautam, A.; Kumar, R.; Raghava, G.P.S. In Silico Approach for Predicting Toxicity of Peptides and Proteins. PLoS ONE 2013, 8, e73957. [Google Scholar] [CrossRef] [Green Version]
- Chaudhary, K.; Kumar, R.; Singh, S.; Tuknait, A.; Gautam, A.; Mathur, D.; Anand, P.; Varshney, G.C.; Raghava, G.P.S. A Web Server and Mobile App for Computing Hemolytic Potency of Peptides. Sci. Rep. 2016, 6, 22843. [Google Scholar] [CrossRef]
- Xu, J.; Li, F.; Leier, A.; Xiang, D.; Shen, H.-H.; Marquez Lago, T.T.; Li, J.; Yu, D.-J.; Song, J. Comprehensive assessment of machine learning-based methods for predicting antimicrobial peptides. Brief. Bioinform. 2021, 22, bbab083. [Google Scholar] [CrossRef]
- Thomsen, M.C.F.; Nielsen, M. Seq2Logo: A method for construction and visualization of amino acid binding motifs and sequence profiles including sequence weighting, pseudo counts and two-sided representation of amino acid enrichment and depletion. Nucleic Acids Res. 2012, 40, 281–287. [Google Scholar] [CrossRef] [Green Version]
- Zahoránszky-Kohalmi, G.; Bologa, C.G.; Oprea, T.I. Impact of similarity threshold on the topology of molecular similarity networks and clustering outcomes. J. Cheminform. 2016, 8, 16. [Google Scholar] [CrossRef] [Green Version]
- Chicco, D.; Tötsch, N.; Jurman, G. The Matthews correlation coefficient (MCC) is more reliable than balanced accuracy, bookmaker informedness, and markedness in two-class confusion matrix evaluation. BioData Min. 2021, 14, 13. [Google Scholar] [CrossRef] [PubMed]
- Jobin, M.-L.; Blanchet, M.; Henry, S.; Chaignepain, S.; Manigand, C.; Castano, S.; Lecomte, S.; Burlina, F.; Sagan, S.; Alves, I.D. The role of tryptophans on the cellular uptake and membrane interaction of arginine-rich cell penetrating peptides. Biochim. Biophys. Acta Biomembr. 2015, 1848, 593–602. [Google Scholar] [CrossRef] [PubMed]
- Chu, H.L.; Yip, B.S.; Chen, K.H.; Yu, H.Y.; Chih, Y.H.; Cheng, H.T.; Chou, Y.T.; Cheng, J.W. Novel antimicrobial peptides with high anticancer activity and selectivity. PLoS ONE 2015, 10, e0126390. [Google Scholar] [CrossRef] [PubMed] [Green Version]
- Ellerby, H.M.; Arap, W.; Ellerby, L.M.; Kain, R.; Andrusiak, R.; Rio, G. Del; Krajewski, S.; Lombardo, C.R.; Rao, R.; Ruoslahti, E.; et al. Anti-cancer activity of targeted pro-apoptotic peptides. Nat. Med. 1999, 5, 1032–1038. [Google Scholar] [CrossRef] [PubMed]
- Ruoslahti, E.; Pasqualini, R. Tumor Homing Molecules, Conjugates Derived Therefrom, and Methods of Using Same. Int. Pat. Appl. WO 1998/010795, 19 March 1998. [Google Scholar]
- Bayse, C.A.; Pollard, D.B. Conformation dynamics of cyclic disulfides and selenosulfides in CXXC(U) (X = Gly, Ala) tetrapeptide redox motifs. J. Pept. Sci. 2019, 25, 16–22. [Google Scholar] [CrossRef] [PubMed]
- Lee, S.; Kim, S.M.; Lee, R.T. Thioredoxin and thioredoxin target proteins: From molecular mechanisms to functional significance. Antioxid. Redox Signal. 2013, 18, 1165–1207. [Google Scholar] [CrossRef] [Green Version]
- Ohta, T.; Hashida, Y.; Yamashita, F.; Hashida, M. Sustained Release of Mitomycin C from Its Conjugate with Single-Walled Carbon Nanotubes Associated by Pegylated Peptide. Biol. Pharm. Bull. 2016, 39, 1687–1693. [Google Scholar] [CrossRef] [Green Version]
- Bailey, T.L. DREME: Motif discovery in transcription factor ChIP-seq data. Bioinformatics 2011, 27, 1653–1659. [Google Scholar] [CrossRef] [PubMed] [Green Version]
- Heinz, S.; Benner, C.; Spann, N.; Bertolino, E.; Lin, Y.C.; Laslo, P.; Cheng, J.X.; Murre, C.; Singh, H.; Glass, C.K. Simple Combinations of Lineage-Determining Transcription Factors Prime cis-Regulatory Elements Required for Macrophage and B Cell Identities. Mol. Cell 2010, 38, 576–589. [Google Scholar] [CrossRef] [Green Version]
- Bailey, T.L.; Boden, M.; Buske, F.A.; Frith, M.; Grant, C.E.; Clementi, L.; Ren, J.; Li, W.W.; Noble, W.S. MEME Suite: Tools for motif discovery and searching. Nucleic Acids Res. 2009, 37, 202–208. [Google Scholar] [CrossRef]
- Asai, T.; Nagatsuka, M.; Kuromi, K.; Yamakawa, S.; Kurohane, K.; Ogino, K.; Tanaka, M.; Taki, T.; Oku, N. Suppression of tumor growth by novel peptides homing to tumor-derived new blood vessels. FEBS Lett. 2002, 510, 206–210. [Google Scholar] [CrossRef] [Green Version]
- Oku, N.; Asai, T.; Watanabe, K.; Kuromi, K.; Nagatsuka, M.; Kurohane, K.; Kikkawa, H.; Ogino, K.; Tanaka, M.; Ishikawa, D.; et al. Anti-neovascular therapy using novel peptides homing to angiogenic vessels. Oncogene 2002, 21, 2662–2669. [Google Scholar] [CrossRef] [PubMed] [Green Version]
- Jennings, B.H.; Pickles, L.M.; Wainwright, S.M.; Roe, S.M.; Pearl, L.H.; Ish-Horowicz, D. Molecular Recognition of Transcriptional Repressor Motifs by the WD Domain of the Groucho/TLE Corepressor. Mol. Cell 2006, 22, 645–655. [Google Scholar] [CrossRef] [PubMed]
- Castelletto, V.; Edwards-Gayle, C.J.C.; Hamley, I.W.; Pelin, J.N.B.D.; Alves, W.A.; Aguilar, A.M.; Seitsonen, J.; Ruokolainen, J. Self-assembly of a catalytically active lipopeptide and its incorporation into cubosomes. ACS Appl. Bio Mater. 2019, 2, 3639–3647. [Google Scholar] [CrossRef] [PubMed] [Green Version]
- Benjdia, A.; Berteau, O. Radical SAM Enzymes and Ribosomally-Synthesized and Post-translationally Modified Peptides: A Growing Importance in the Microbiomes. Front. Chem. 2021, 9, 678068. [Google Scholar] [CrossRef] [PubMed]
- Yu, F.-H.; Huang, K.-J.; Wang, C.-T. C-Terminal HIV-1 Transframe p6* Tetrapeptide Blocks Enhanced Gag Cleavage Incurred by Leucine Zipper Replacement of a Deleted p6* Domain. J. Virol. 2017, 91, e00103-17. [Google Scholar] [CrossRef] [PubMed] [Green Version]
- Kanehisa, M.; Goto, S.; Kawashima, S.; Nakaya, A. Thed KEGG databases at GenomeNet. Nucleic Acids Res. 2002, 30, 42–46. [Google Scholar] [CrossRef]
- Ohlsson, B. Gonadotropin-releasing hormone and its role in the enteric nervous system. Front. Endocrinol. 2017, 8, 110. [Google Scholar] [CrossRef] [PubMed]
- Spindel, E.R. Chapter 46—Bombesin Peptides. In Handbook of Biologically Active Peptides; Kastin, A.J., Ed.; Academic Press: Cambridge, MA, USA, 2013; pp. 326–330. [Google Scholar]
- Guo, M.; Qu, X.; Qin, X.Q. Bombesin-like peptides and their receptors: Recent findings in pharmacology and physiology. Curr. Opin. Endocrinol. Diabetes Obes. 2015, 22, 3–8. [Google Scholar] [CrossRef]


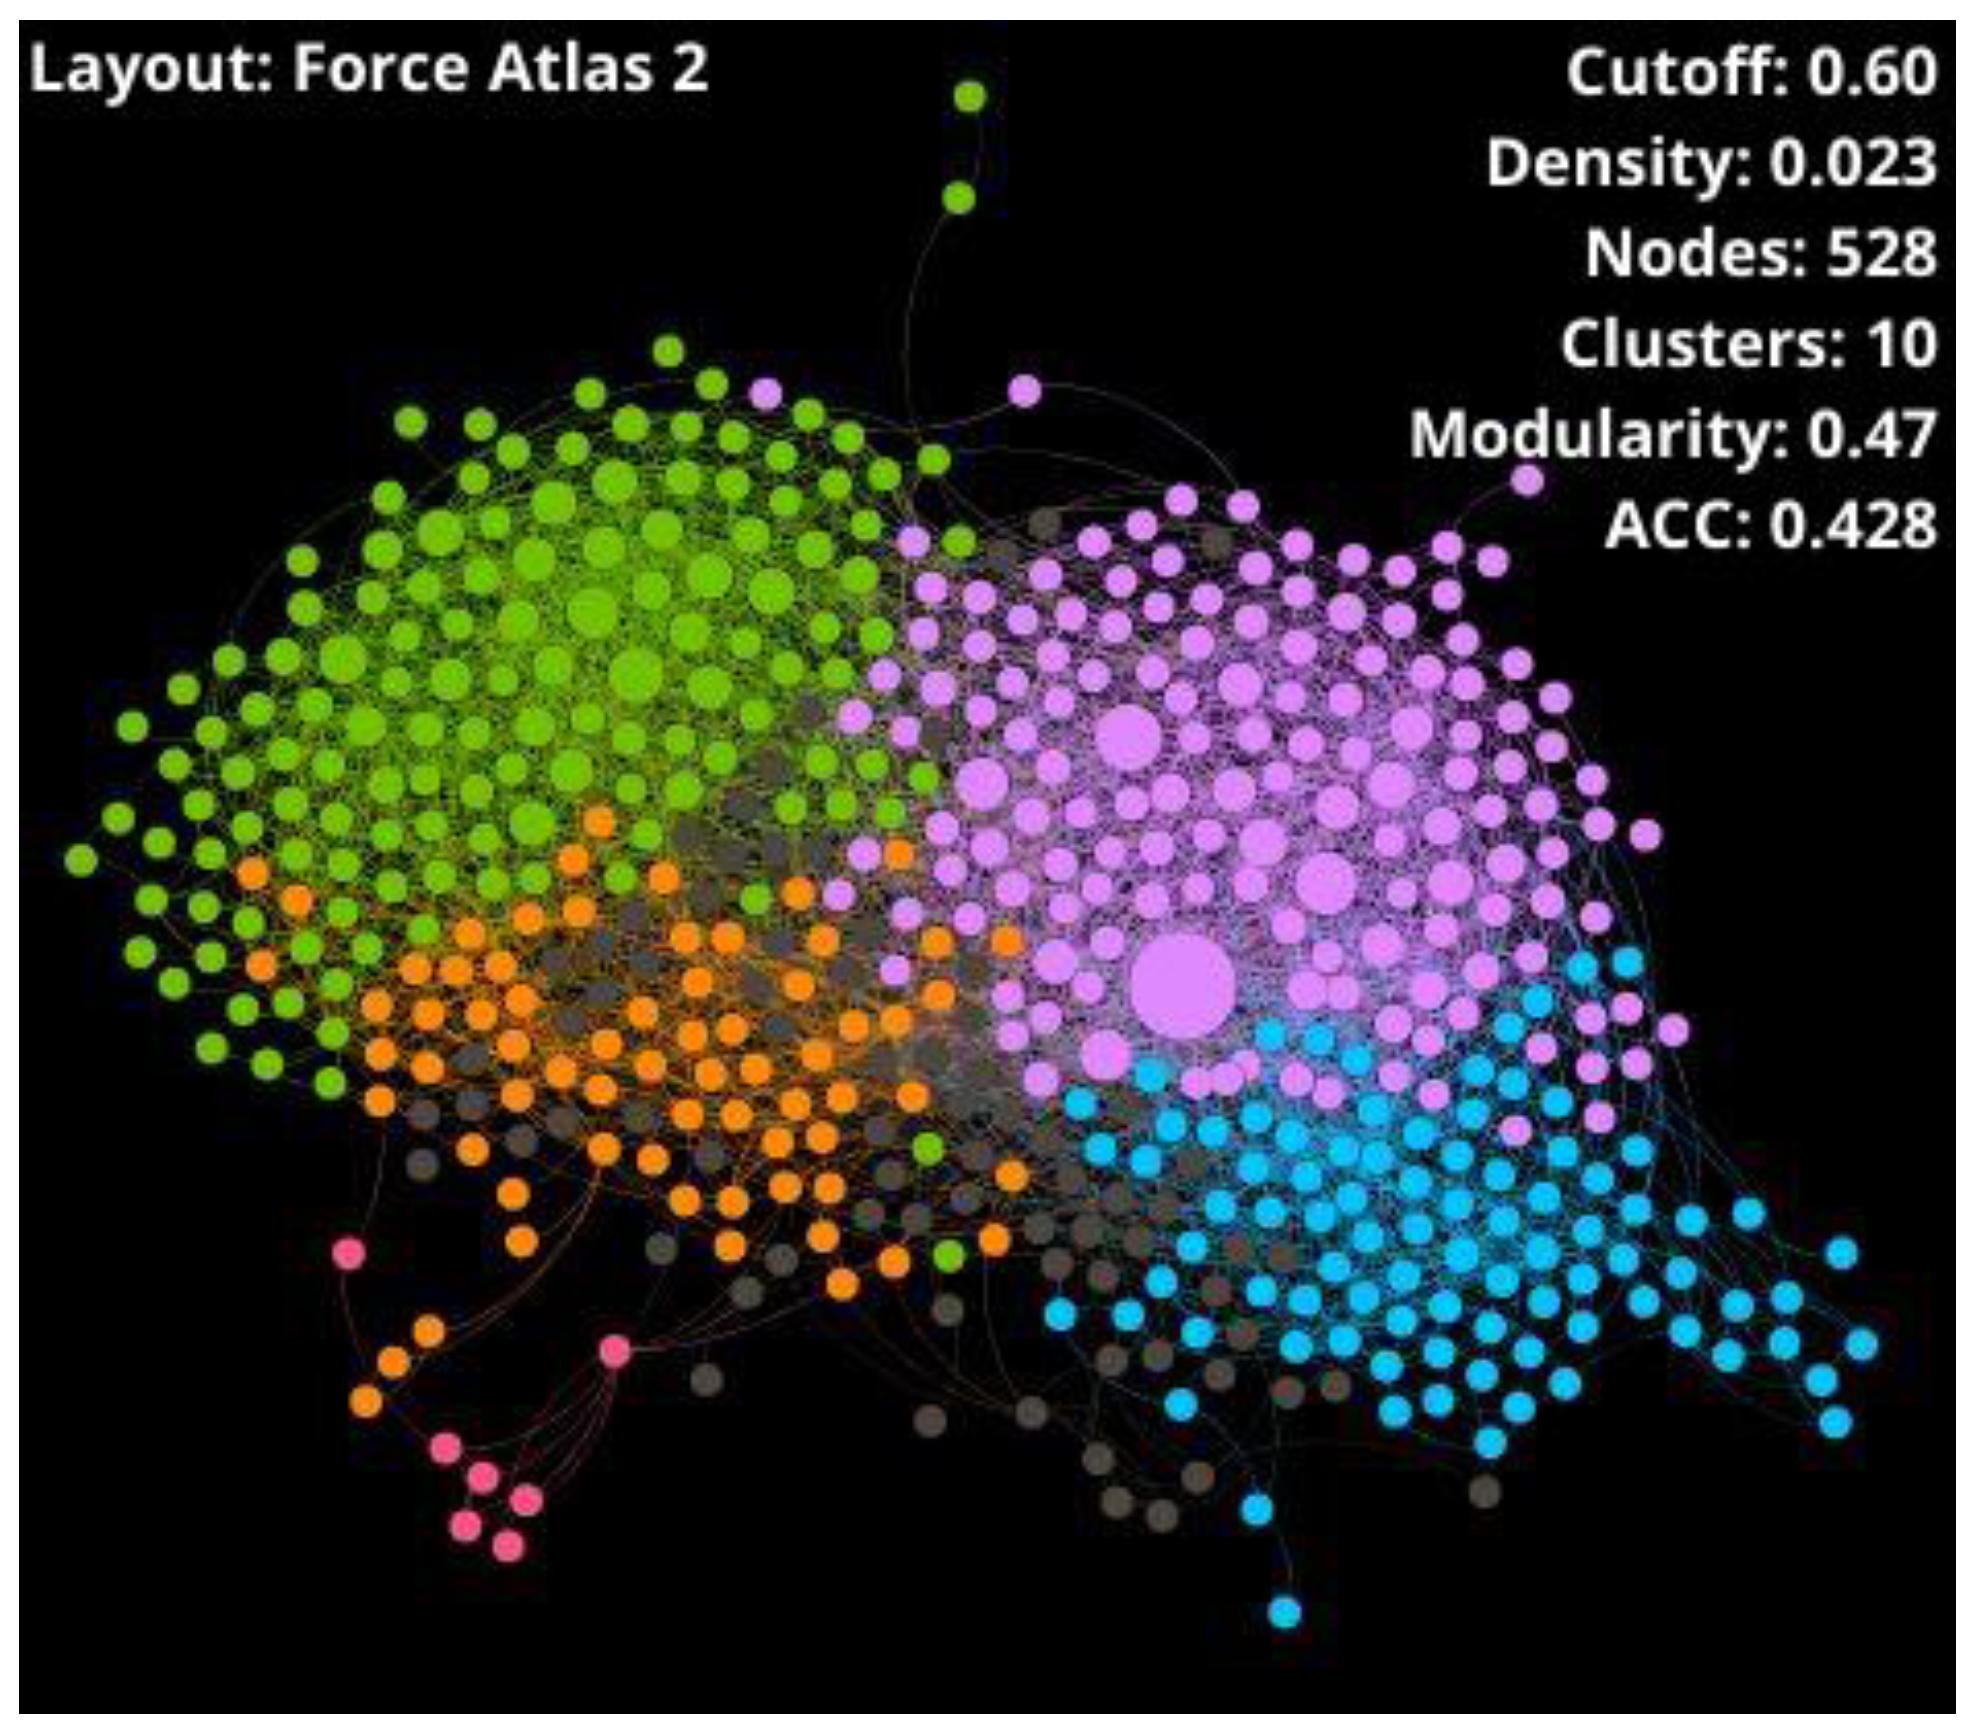
| Set * | Nodes | Edges | Density | Clusters | Modularity | Average Degree | ACC | Diameter | Nodes after Sc. ** | Edges after Sc. ** |
|---|---|---|---|---|---|---|---|---|---|---|
| THPs | 528 | 4452 | 0.023 | 10 | 0.47 | 16.864 | 0.428 | 8 | - | - |
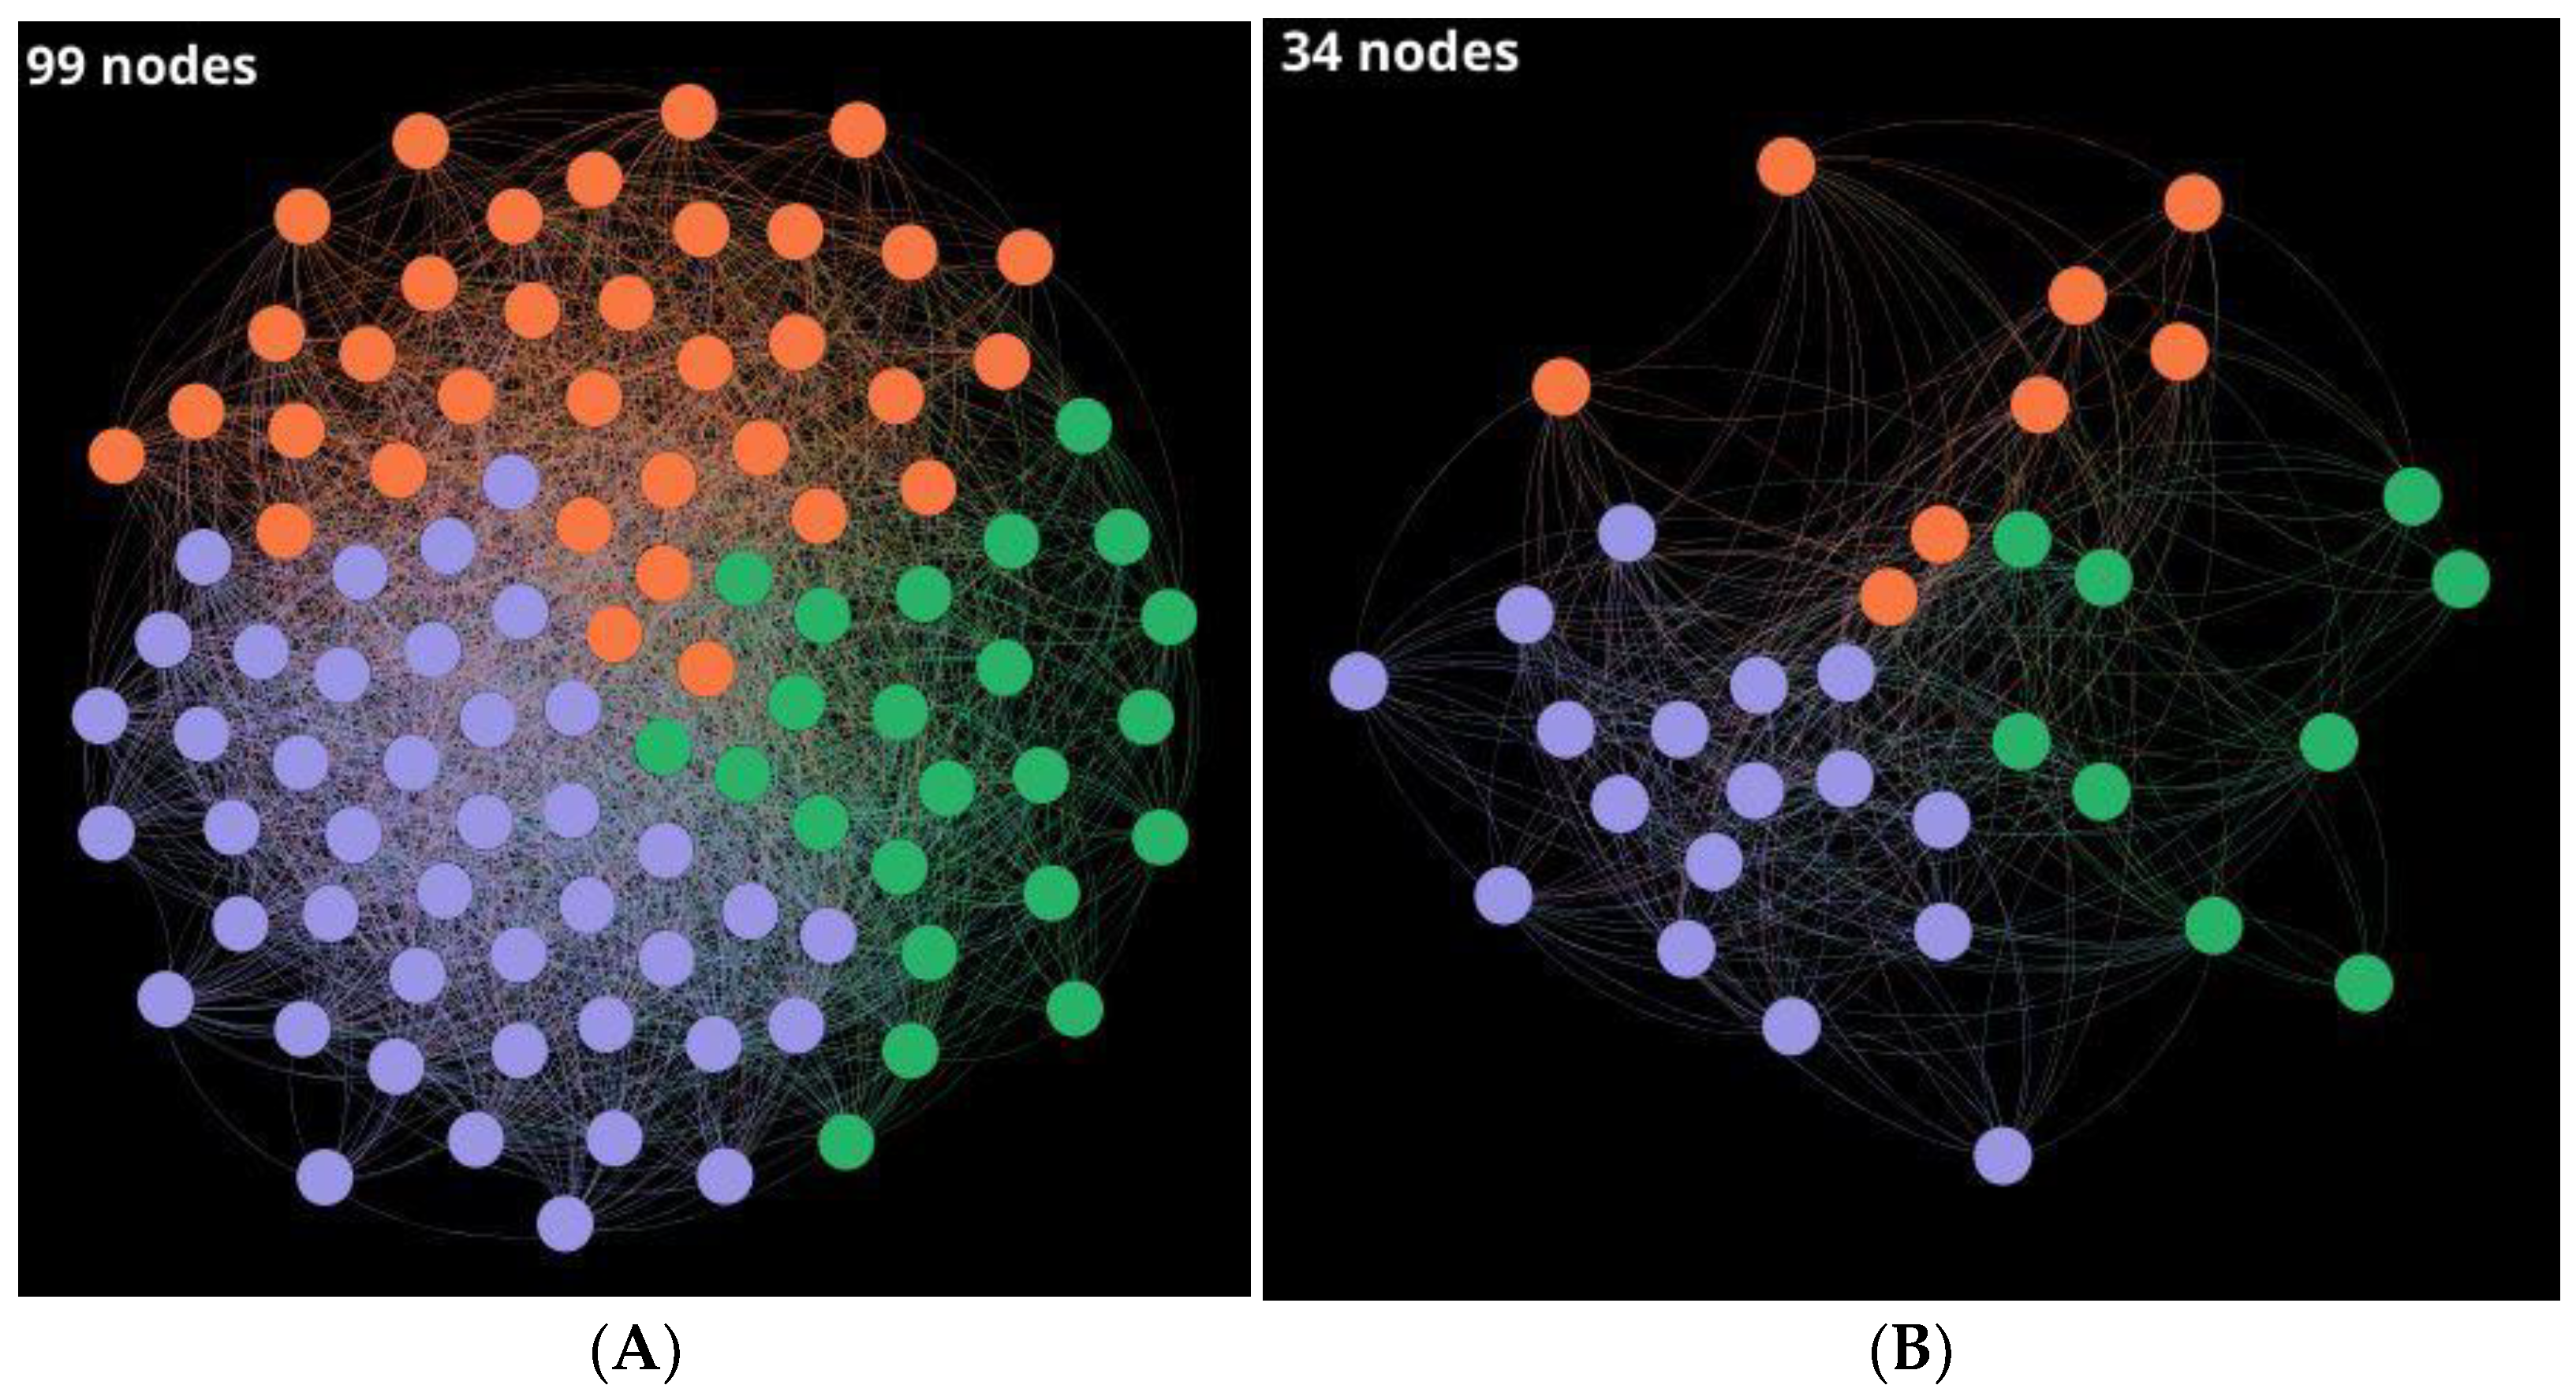
| Outliers | 99 | 2691 | 0.891 | 3 | 0.13 | 54.364 | 0.733 | 3 | 34 | 384 |
| Query Set * | Nodes | % Id | Ac | Correct Class | Incorrect Class | κ | Sn | Sp | Ppos | Pneg |
|---|---|---|---|---|---|---|---|---|---|---|
| H + sing | 467 | 40 | 0.933 | 1215 | 87 | 0.866 | 0.877 | 0.989 | 0.988 | 0.89 |
| 50 | 0.935 | 1218 | 84 | 0.871 | 0.877 | 0.994 | 0.993 | 0.89 | ||
| 60 | 0.935 | 1218 | 84 | 0.871 | 0.874 | 0.997 | 0.996 | 0.888 | ||
| W + sing | 469 | 40 | 0.934 | 1216 | 86 | 0.868 | 0.879 | 0.989 | 0.988 | 0.891 |
| 50 | 0.936 | 1219 | 83 | 0.873 | 0.879 | 0.994 | 0.993 | 0.891 | ||
| 60 | 0.937 | 1220 | 82 | 0.874 | 0.877 | 0.997 | 0.997 | 0.89 | ||
| H + W + sing | 479 | 40 | 0.942 | 1226 | 76 | 0.883 | 0.894 | 0.989 | 0.988 | 0.903 |
| 50 | 0.944 | 1229 | 73 | 0.888 | 0.894 | 0.994 | 0.993 | 0.904 | ||
| 60 | 0.945 | 1230 | 72 | 0.889 | 0.892 | 0.997 | 0.997 | 0.903 |
| Query Set * | Nodes | % Id | Ac | Correct Class | Incorrect Class | κ | Sn | Sp | Ppos | Pneg |
|---|---|---|---|---|---|---|---|---|---|---|
| H + sing | 467 | 40 | 0.917 | 860 | 78 | 0.834 | 0.838 | 0.996 | 0.995 | 0.86 |
| 50 | 0.916 | 859 | 79 | 0.832 | 0.836 | 0.996 | 0.995 | 0.858 | ||
| 60 | 0.914 | 857 | 81 | 0.827 | 0.832 | 0.996 | 0.995 | 0.855 | ||
| W + sing | 469 | 40 | 0.92 | 863 | 75 | 0.84 | 0.844 | 0.996 | 0.995 | 0.865 |
| 50 | 0.92 | 863 | 75 | 0.84 | 0.844 | 0.996 | 0.995 | 0.865 | ||
| 60 | 0.919 | 862 | 76 | 0.838 | 0.842 | 0.996 | 0.995 | 0.863 | ||
| H + W + sing | 479 | 40 | 0.928 | 870 | 68 | 0.855 | 0.859 | 0.996 | 0.995 | 0.876 |
| 50 | 0.928 | 870 | 68 | 0.855 | 0.859 | 0.996 | 0.995 | 0.876 | ||
| 60 | 0.926 | 869 | 69 | 0.853 | 0.857 | 0.996 | 0.995 | 0.875 |
| Query Set * | Nodes | % Id | Ac | Correct Class | Incorrect Class | κ | Sn | Sp | Ppos | Pneg |
|---|---|---|---|---|---|---|---|---|---|---|
| H + sing | 467 | 40 | 0.985 | 600 | 9 | 0.964 | 0.983 | 0.986 | 0.966 | 0.993 |
| 50 | 0.99 | 603 | 6 | 0.976 | 0.983 | 0.993 | 0.983 | 0.993 | ||
| 60 | 0.992 | 604 | 5 | 0.98 | 0.983 | 0.995 | 0.989 | 0.993 | ||
| W + sing | 469 | 40 | 0.98 | 597 | 12 | 0.952 | 0.966 | 0.986 | 0.966 | 0.986 |
| 50 | 0.984 | 599 | 10 | 0.96 | 0.966 | 0.991 | 0.977 | 0.986 | ||
| 60 | 0.987 | 601 | 8 | 0.968 | 0.966 | 0.995 | 0.988 | 0.986 | ||
| H + W + sing | 479 | 40 | 0.985 | 600 | 9 | 0.964 | 0.983 | 0.986 | 0.966 | 0.993 |
| 50 | 0.989 | 602 | 7 | 0.972 | 0.983 | 0.991 | 0.977 | 0.993 | ||
| 60 | 0.992 | 604 | 5 | 0.98 | 0.983 | 0.995 | 0.989 | 0.993 |
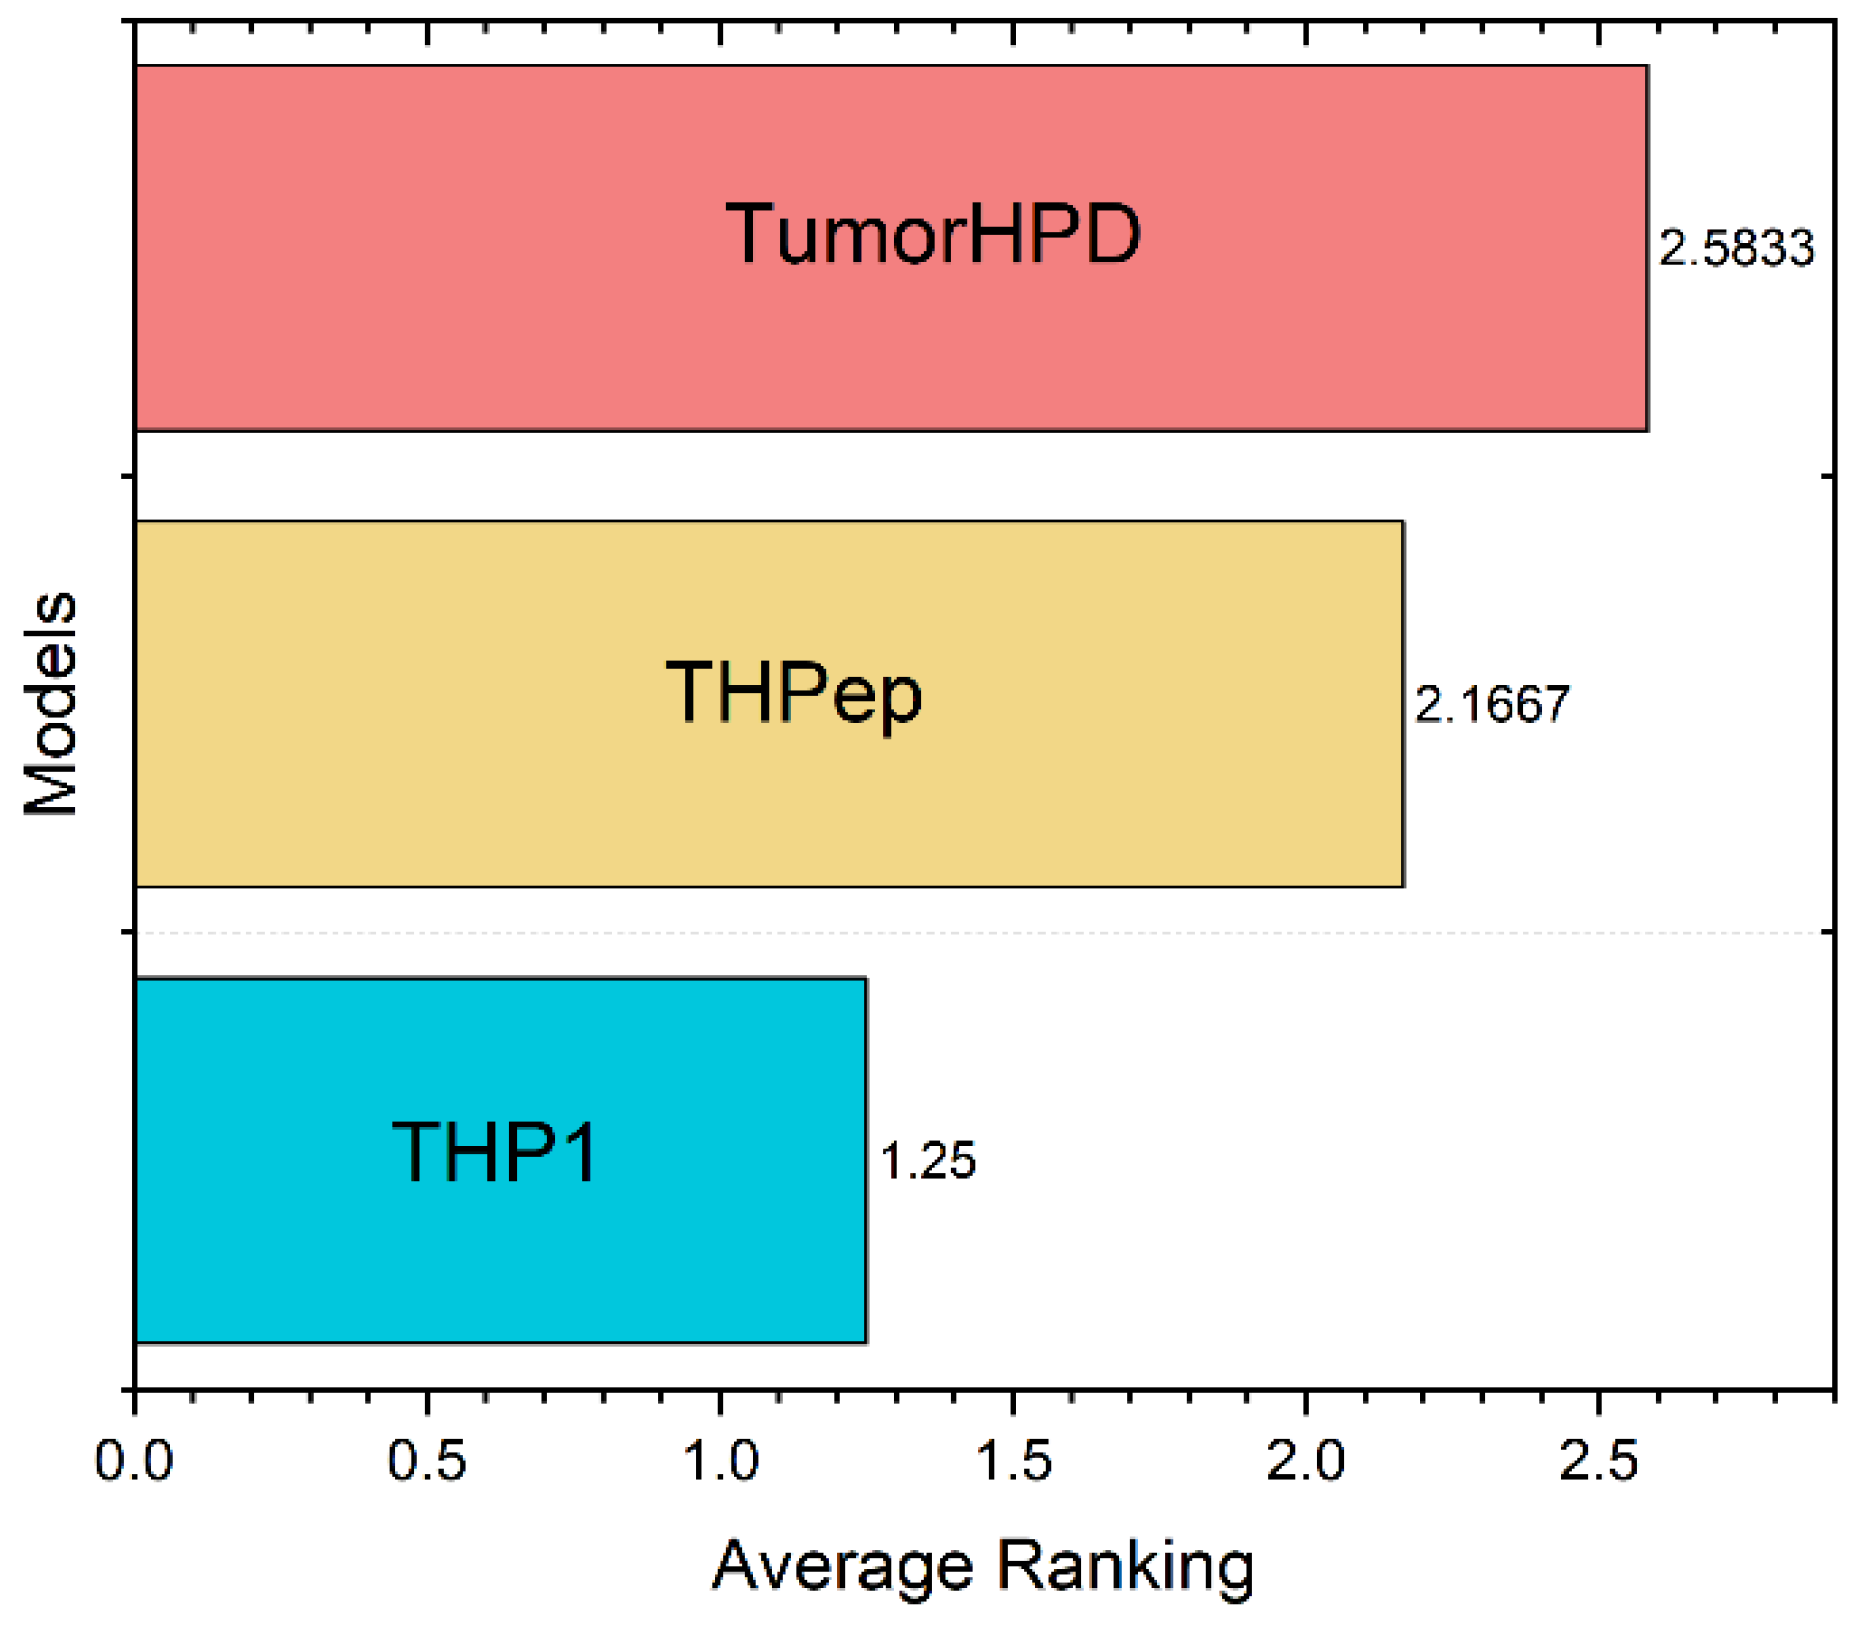
| Dataset | Method | Ac (%) | Sn (%) | Sp (%) | MCC |
|---|---|---|---|---|---|
| Main | TumorHPD | 86.56 | 80.63 | 89.71 | 0.7 |
| THPep | 86.1 | 87.07 | 85.18 | 0.72 | |
| THP1 | 94.47 | 89.25 | 99.66 | 0.894 | |
| Small | TumorHPD | 81.88 | 73.13 | 90.92 | 0.65 |
| THPep | 83.37 | 81.24 | 85.81 | 0.67 | |
| THP1 | 92.64 | 85.71 | 99.5 | 0.861 | |
| Main90 | TumorHPD | 89.66 | 83.64 | 80.68 | 0.74 |
| THPep | 90.8 | 91.8 | 87.97 | 0.77 | |
| THP1 | 99.18 | 98.3 | 99.54 | 0.98 |
| No | Motif | EMBOSS Consensus | Cluster | Cluster Size | Frequency * | MSA Method |
|---|---|---|---|---|---|---|
| 1 | wwW | wwW | 2 | 14 | 1/(1) | CLUSTALW-O |
| xxW | MAFFT | |||||
| 2 | C[fl][rg][vl]rW | CxxxrW | 3 | 10 | 0/(0) | MAFFT |
| 3 | C[gpi][gs]cR | CxxxR | MUSCLE | |||
| 4 | [rkl]GLC | RGlc | 4 | 8 | 0/(0) | CLUSTALW-O |
| kGLC | MAFFT | |||||
| xGLc | MUSCLE | |||||
| 5 | c[wp]kG | cwkG | 1+5 | 4 | 0/(0) 0/(0) 0/(1) | CLUSTALW-O MUSCLE |
| cxkG | T-Coffee | |||||
| 6 | Not Found | Non-consensus | 6 | 10 | 0/(0) | CLUSTALW-O MUSCLE MAFFT T-Coffee |
| 7 | l[rp][cw]c | lxxc | Singletons | 8 | 0/(0) | MUSCLE |
| No | Motif | Cluster | Cluster Size | Matches in Positive Seqs. | Matches in Control Seqs. | Sites (%) | Score | Frequency * |
|---|---|---|---|---|---|---|---|---|
| 1 | WRP | 2 | 14 | 7 | 1 | 50 | 1.6 × 10⁻² | 5/(5) |
| 2 | WVL | 5 | 1 | 35.7 | 8.2 × 10⁻² | 0/(0) | ||
| 3 | WS[YR] | 3 | 0 | 21.4 | 1.1 × 10⁻¹ | 1/(1)Y | ||
| 4 | WWWM | 3 | 0 | 21.4 | 1.1 × 10⁻¹ | 0/(0) | ||
| 5 | CFRV | 3 | 10 | 3 | 0 | 30 | 1.1 × 10⁻¹ | 1/(1) |
| 6 | HWK | 2 | 0 | 20 | 2.4 × 10⁻¹ | 0/(0) | ||
| 7 | PRW | 2 | 0 | 20 | 2.4 × 10⁻¹ | 3/(3) | ||
| 8 | CN[WG] | 4 | 8 | 3 | 0 | 37.5 | 1.0 × 10⁻¹ | 34/(32)G |
| 9 | WARG | 3 | 0 | 37.5 | 1.0 × 10⁻¹ | 0/(0) | ||
| 10 | GIC | 2 | 0 | 25.0 | 2.3 × 10⁻¹ | 5/(4) | ||
| 11 | WKG | 1-5 | 4 | 3 | 1 | 75.0 | 2.4 × 10⁻¹ | 0/(0) |
| 12 | KNKHK | 6 | 10 | 3 | 0 | 30.0 | 1.1 × 10⁻¹ | 0/(0) |
| 13 | PSHL | 3 | 0 | 30.0 | 1.1 × 10⁻¹ | 0/(0) | ||
| 14 | LRLRI | Singletons | 8 | 2 | 0 | 25.0 | 2.3 × 10⁻¹ | 1/(1) |
| 15 | CC[CQ] | 3 | 1 | 37.5 | 2.8 × 10⁻¹ | 0/(0) | ||
| 16 | LSP | All sequences | 54 | 11 | 1 | 20.4 | 3.4 × 10⁻³ | 3/(3) |
| 17 | WSYG | 7 | 0 | 13.0 | 8.2 × 10⁻³ | 0/(0) | ||
| 18 | WRPW | 5 | 0 | 9.3 | 3.2 × 10⁻² | 2/(2) |
| No | Motif Found | Hit Peptide | Accession | Match with | Signature | Related Seqs. | Frequency * |
|---|---|---|---|---|---|---|---|
| 1 | QHWSYGLRPG | starPep_07237 | PS00473 | Q[HY][FYW]Sx(4)PG | Gonadotropin-releasing hormones | 67 | 1/(1)QHWSY |
| 2 | WARGHFM | starPep_10020 | PS00257 | WAxG[SH][LF]M | Bombesin-like peptides | 36 | 0/(0) |
Publisher’s Note: MDPI stays neutral with regard to jurisdictional claims in published maps and institutional affiliations. |
© 2022 by the authors. Licensee MDPI, Basel, Switzerland. This article is an open access article distributed under the terms and conditions of the Creative Commons Attribution (CC BY) license (https://creativecommons.org/licenses/by/4.0/).
Share and Cite
Romero, M.; Marrero-Ponce, Y.; Rodríguez, H.; Agüero-Chapin, G.; Antunes, A.; Aguilera-Mendoza, L.; Martinez-Rios, F. A Novel Network Science and Similarity-Searching-Based Approach for Discovering Potential Tumor-Homing Peptides from Antimicrobials. Antibiotics 2022, 11, 401. https://doi.org/10.3390/antibiotics11030401
Romero M, Marrero-Ponce Y, Rodríguez H, Agüero-Chapin G, Antunes A, Aguilera-Mendoza L, Martinez-Rios F. A Novel Network Science and Similarity-Searching-Based Approach for Discovering Potential Tumor-Homing Peptides from Antimicrobials. Antibiotics. 2022; 11(3):401. https://doi.org/10.3390/antibiotics11030401
Chicago/Turabian StyleRomero, Maylin, Yovani Marrero-Ponce, Hortensia Rodríguez, Guillermin Agüero-Chapin, Agostinho Antunes, Longendri Aguilera-Mendoza, and Felix Martinez-Rios. 2022. "A Novel Network Science and Similarity-Searching-Based Approach for Discovering Potential Tumor-Homing Peptides from Antimicrobials" Antibiotics 11, no. 3: 401. https://doi.org/10.3390/antibiotics11030401