
Quantitative Risk Assessment for the Introduction of Carbapenem-Resistant Enterobacteriaceae (CPE) into Dutch Livestock Farms

 , and
, and
Abstract
:1. Introduction
2. Results
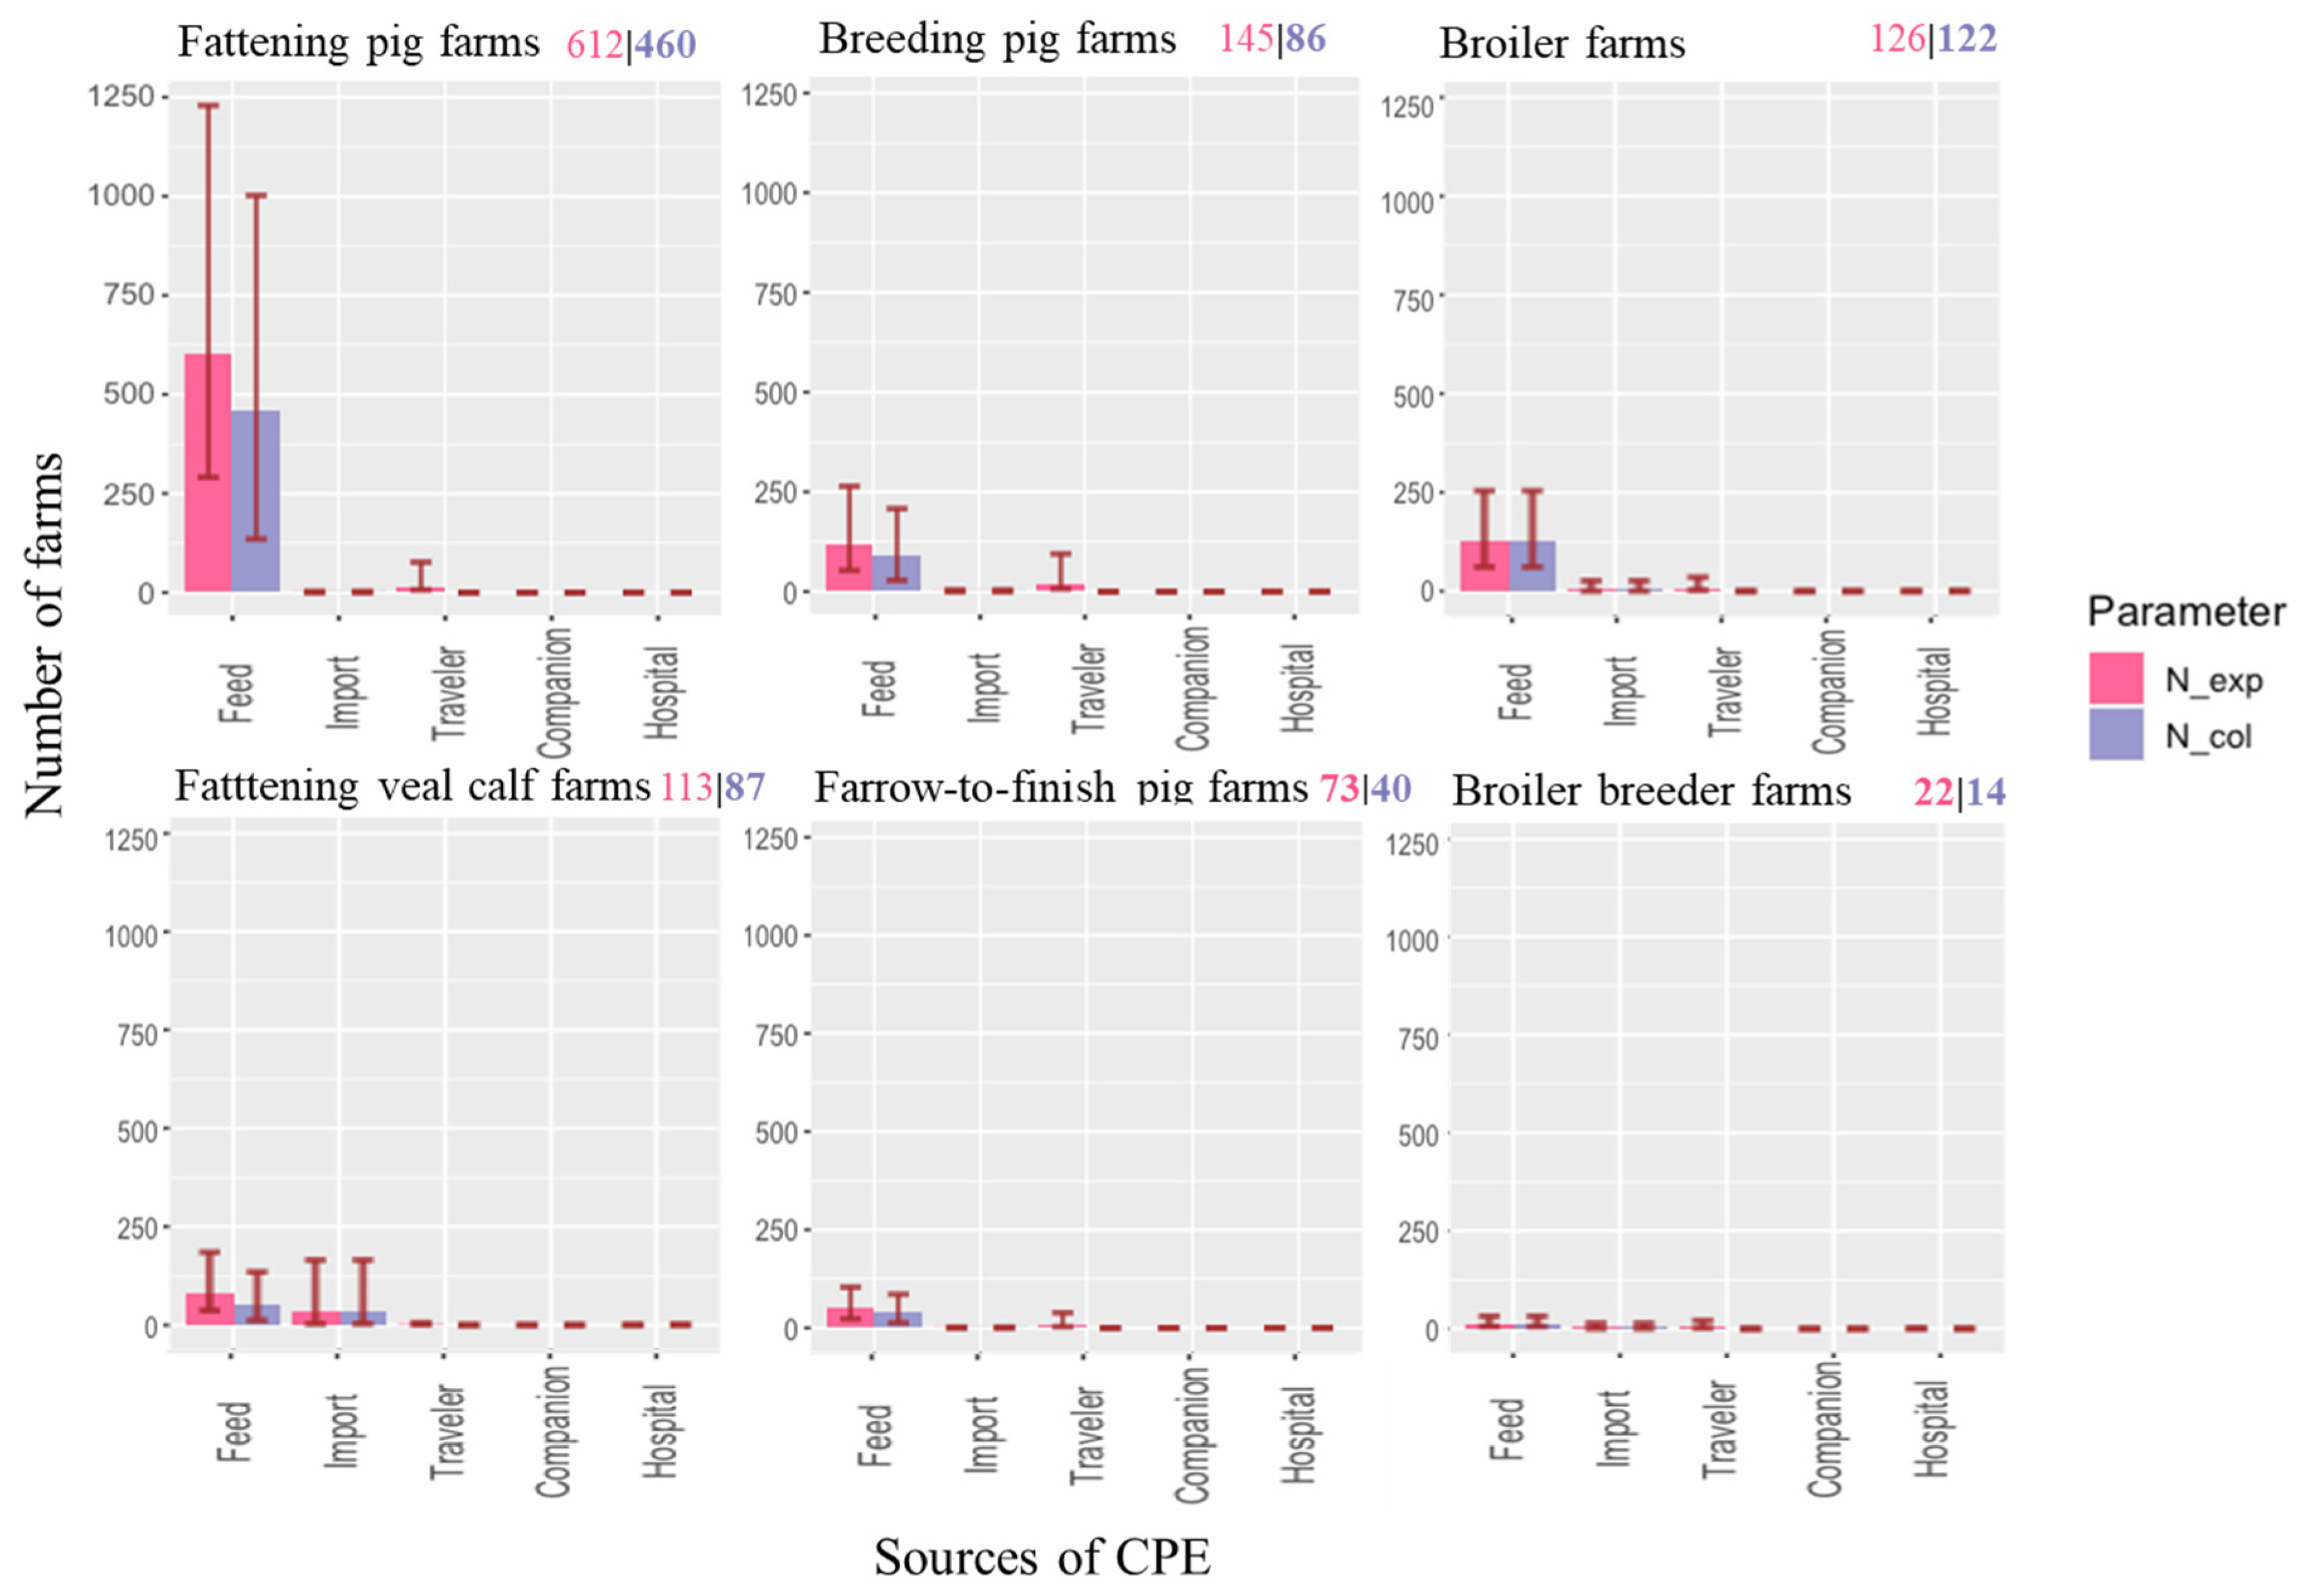
2.1. Number of Farms Exposed to CPE
2.2. Probability of Colonization Given Exposure to CPE
2.3. Ranking the Risk of Introduction: Combining Exposure and Colonization
2.4. Result from Sensitivity Analysis
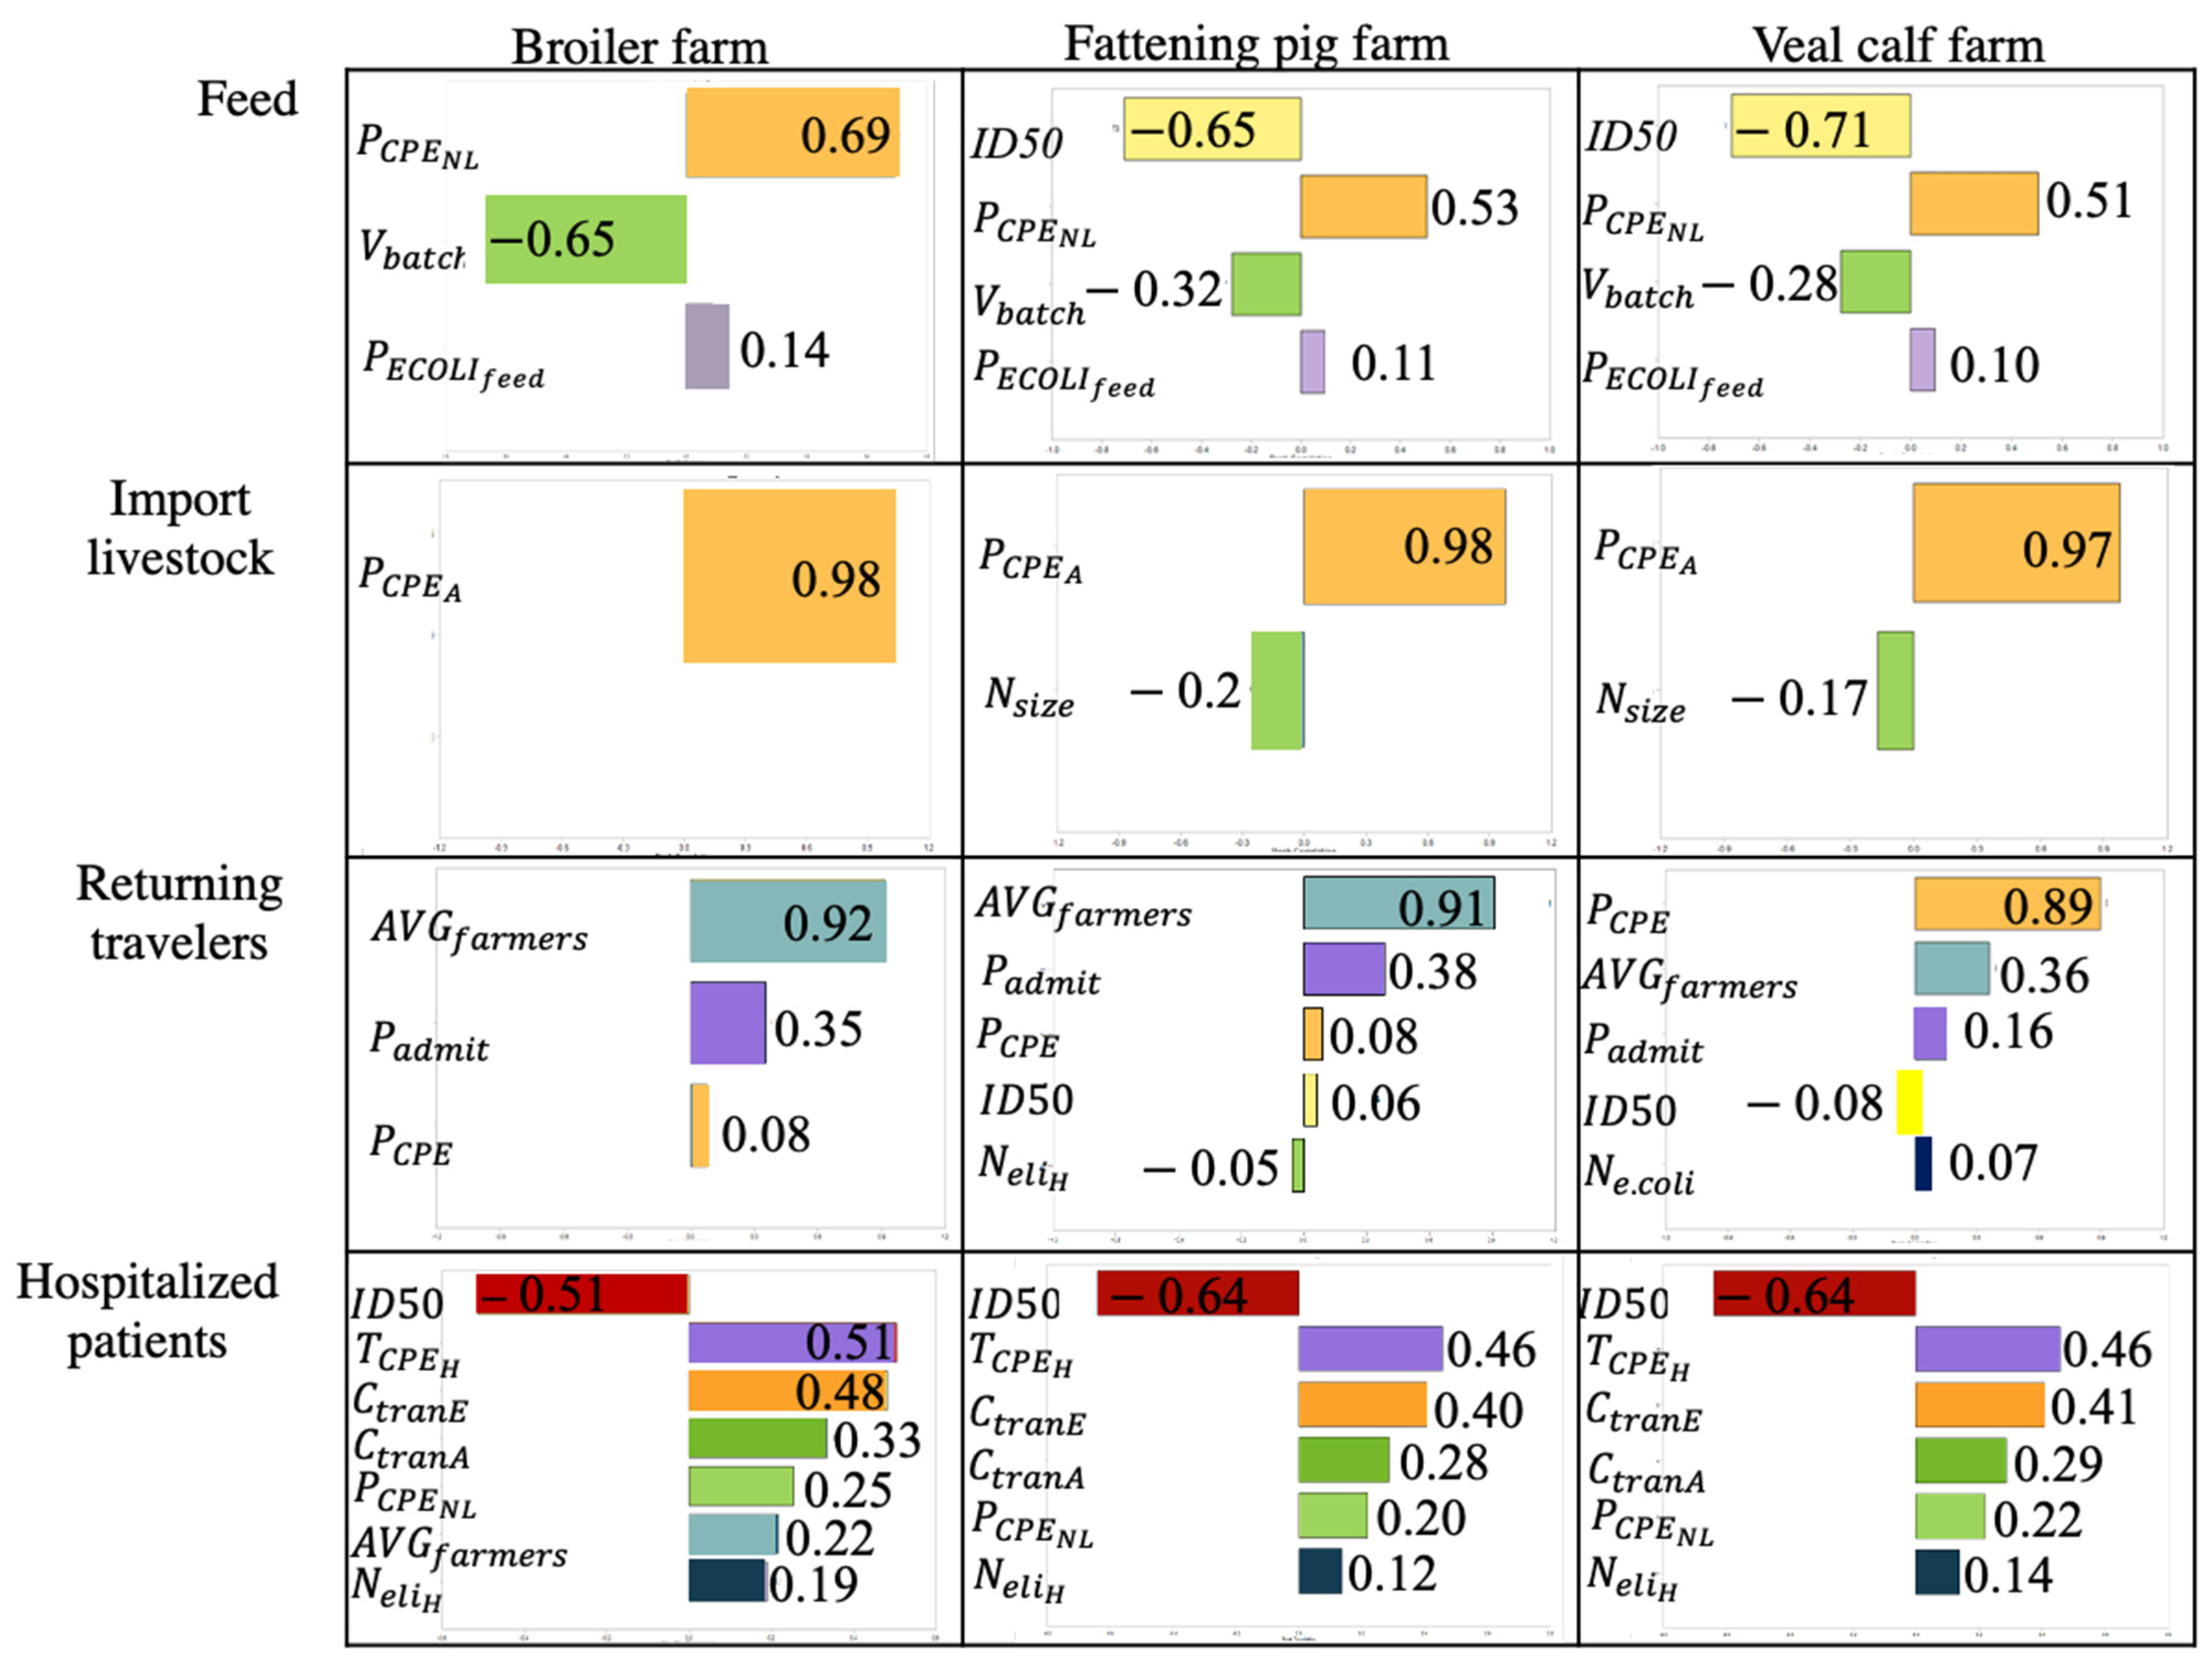
2.4.1. Result from Spearman Rank Correlation
2.4.2. One-at-a-Time Sensitivity Analysis per Source
2.4.3. One-at-a-Time Sensitivity Analysis between Sources
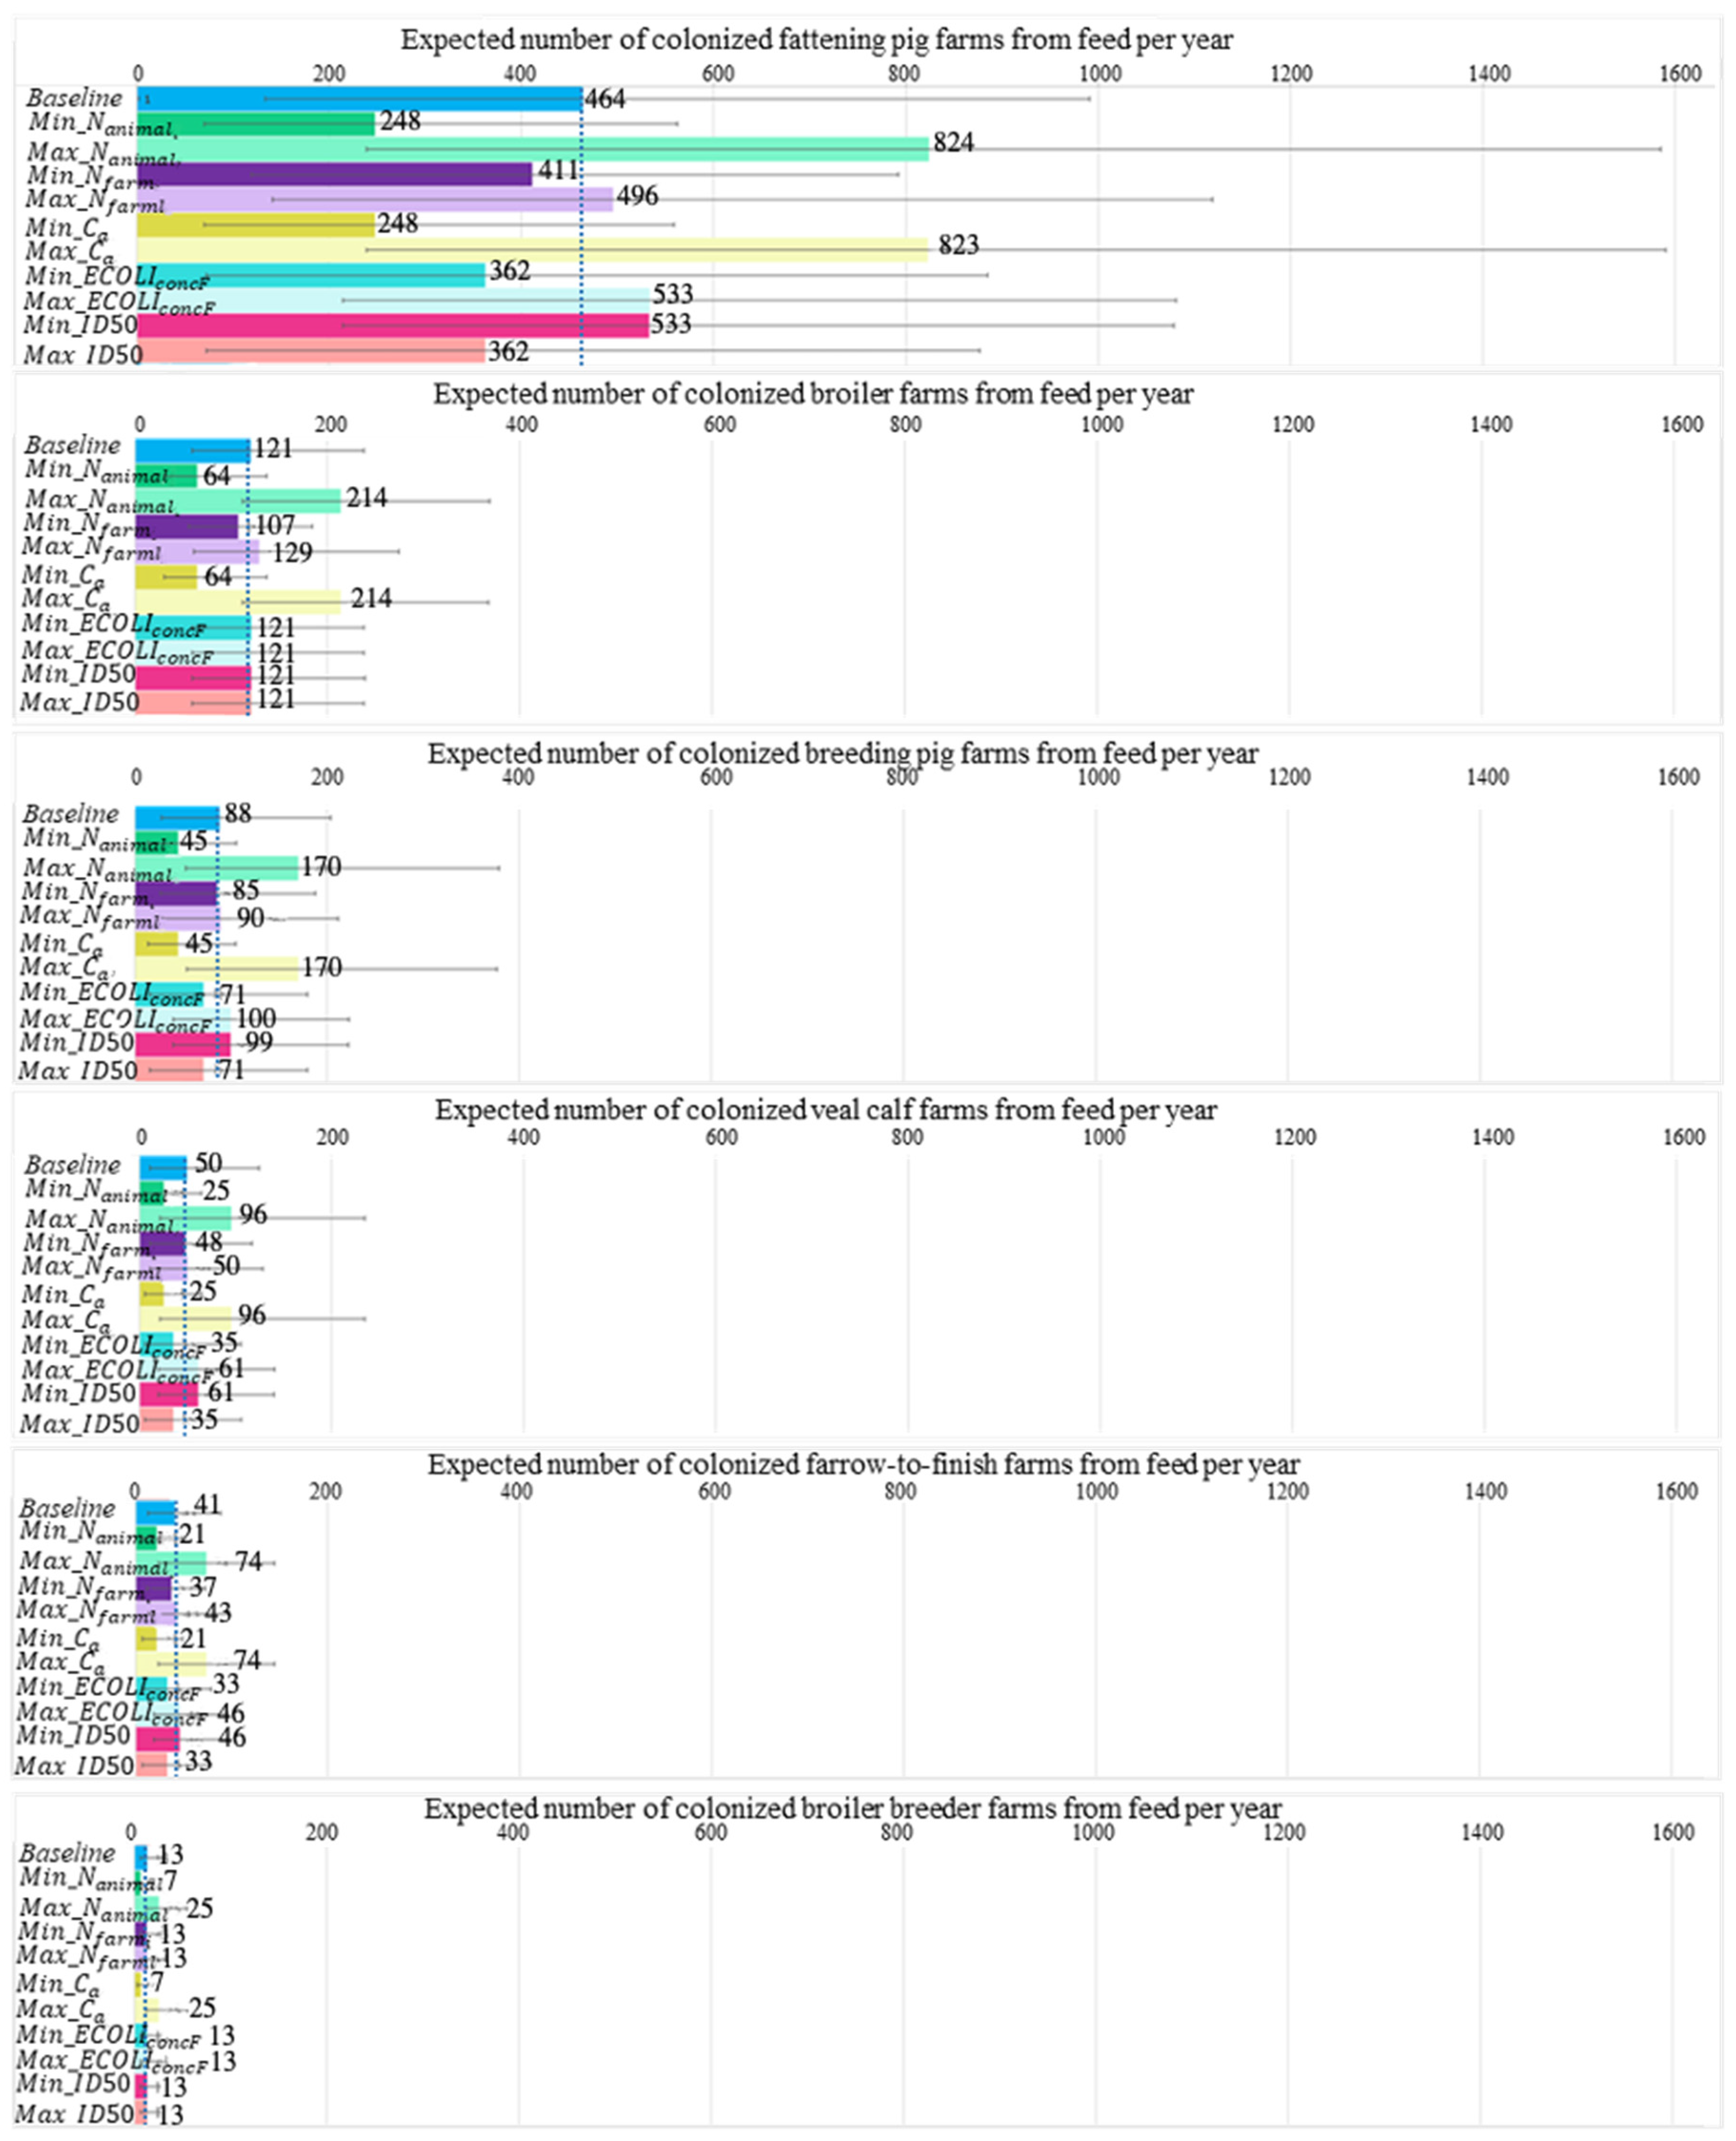
2.5. Result from What-If Analysis
3. Discussion
4. Materials and Methods
4.1. Risk Model
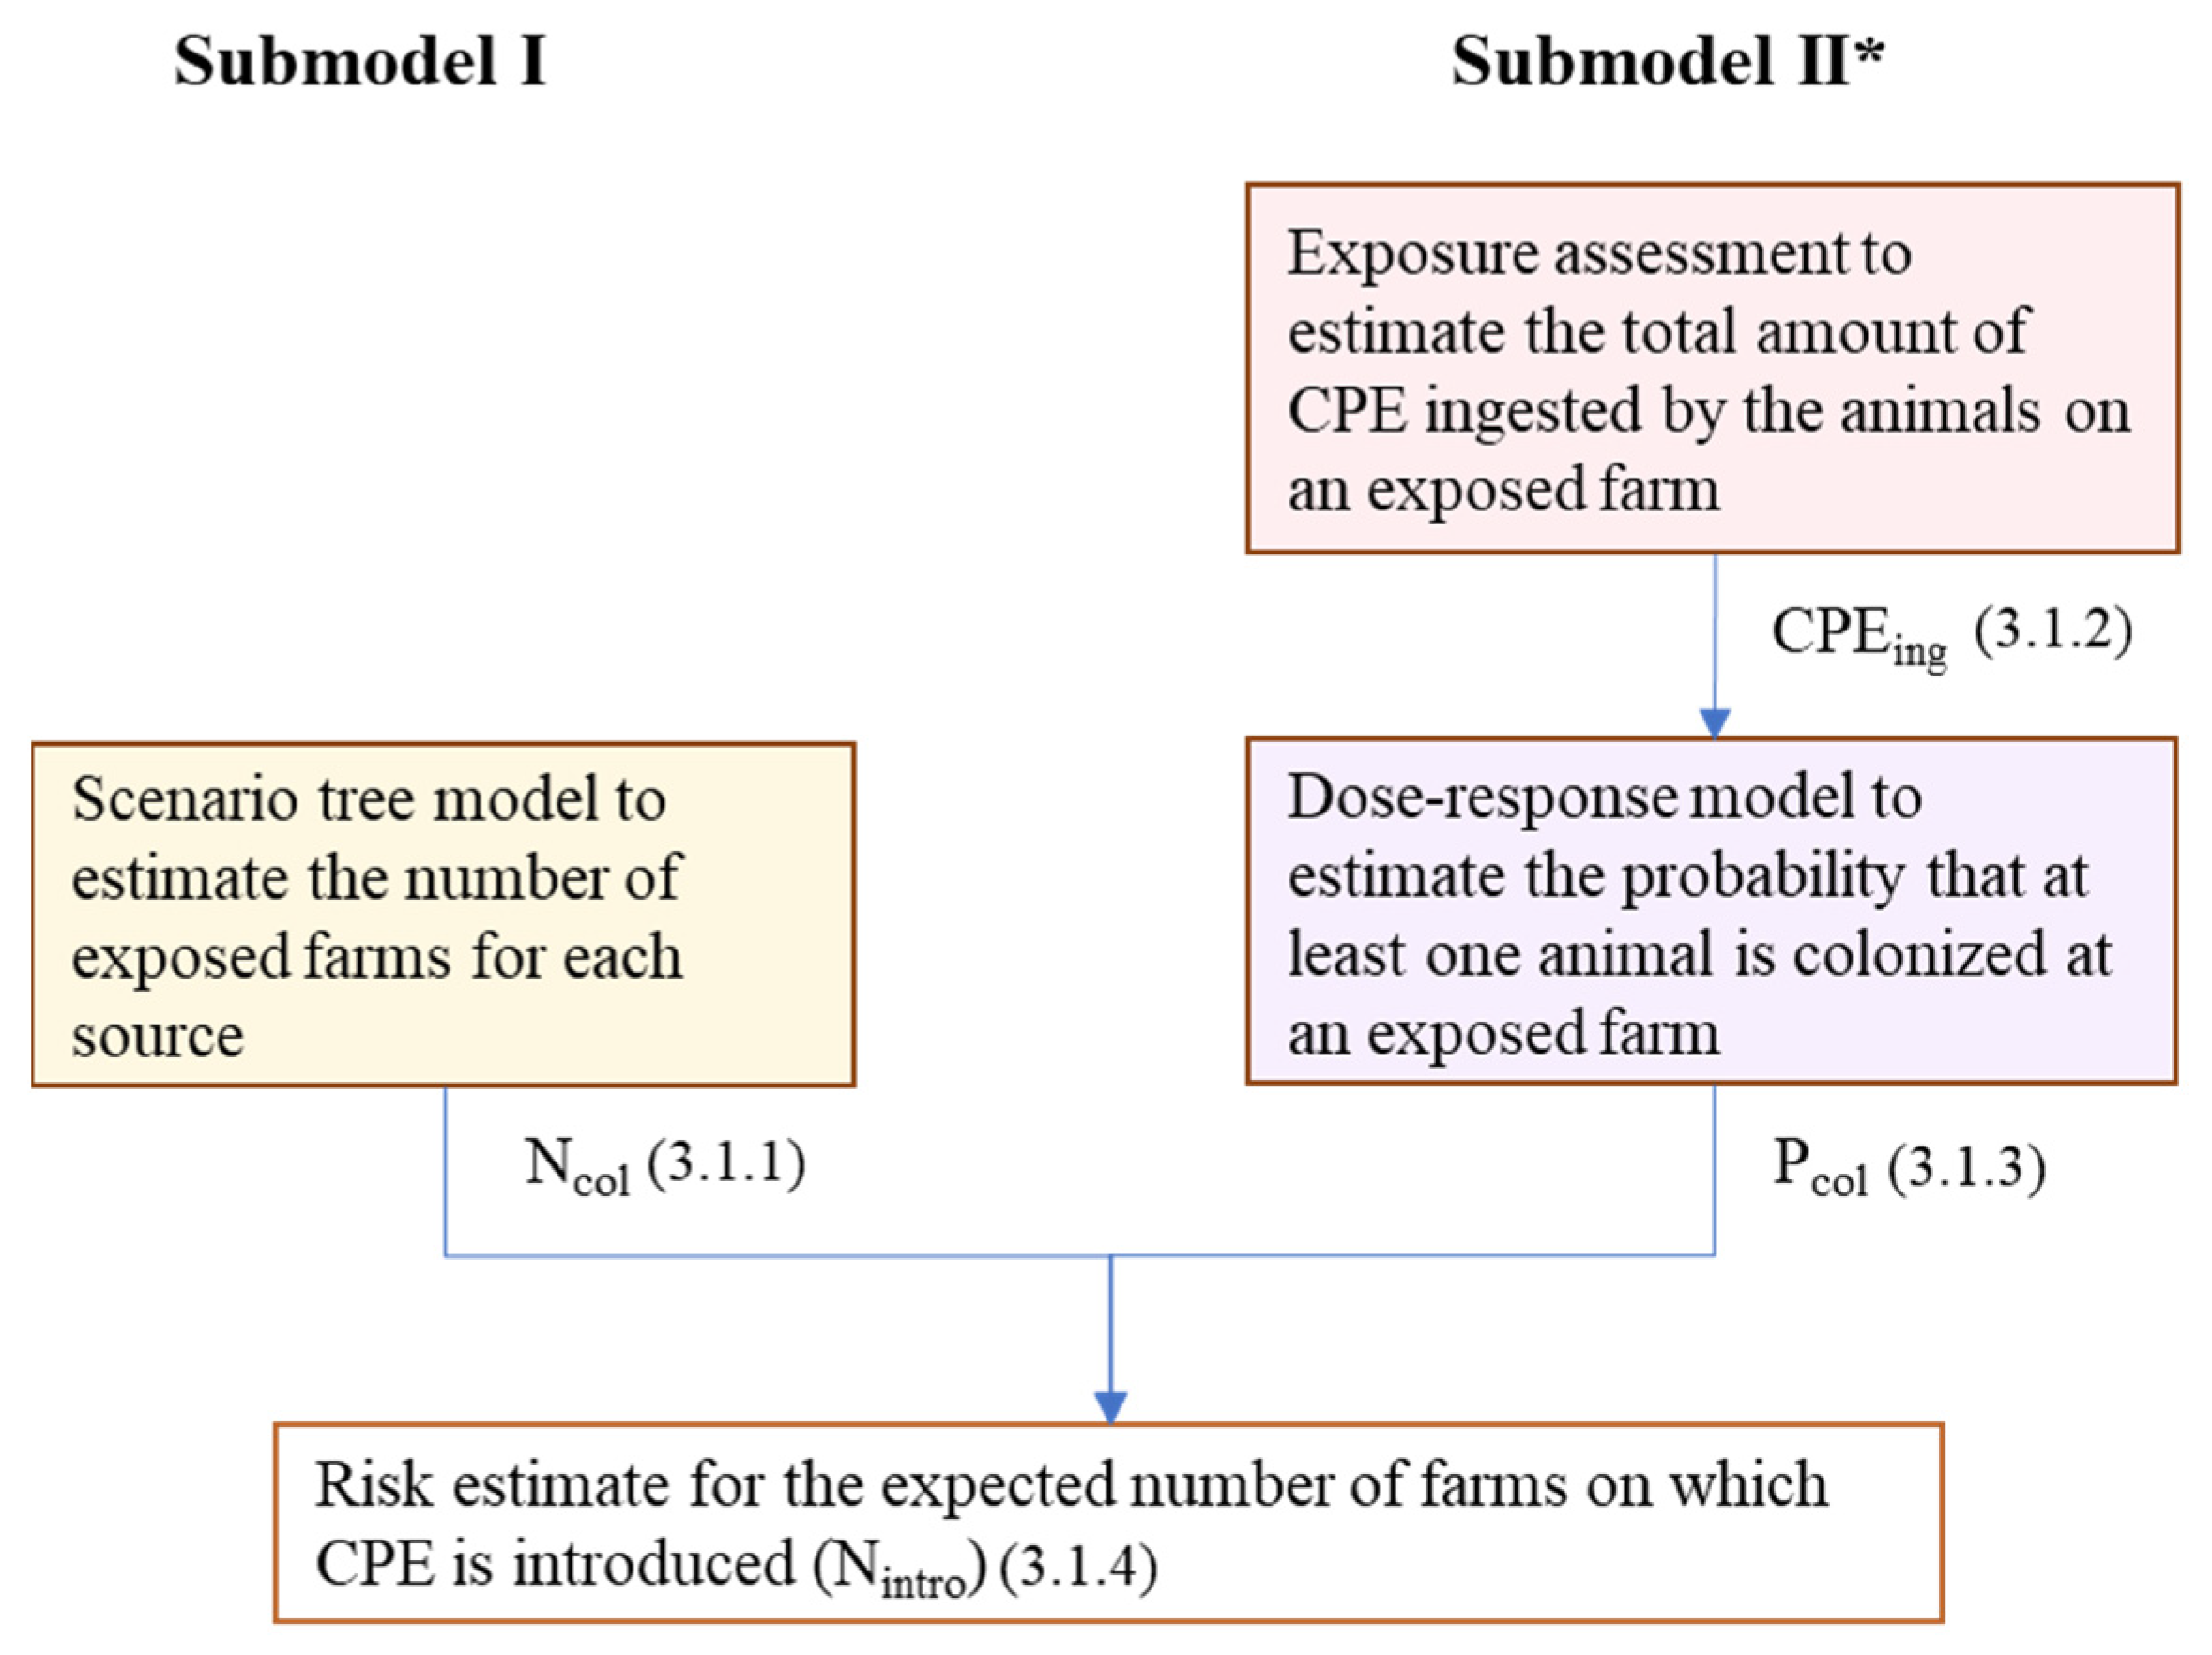
4.1.1. Model Outline
4.1.2. Submodel I: Scenario Tree Model
Imported Livestock
Livestock Feed
Companion Animals
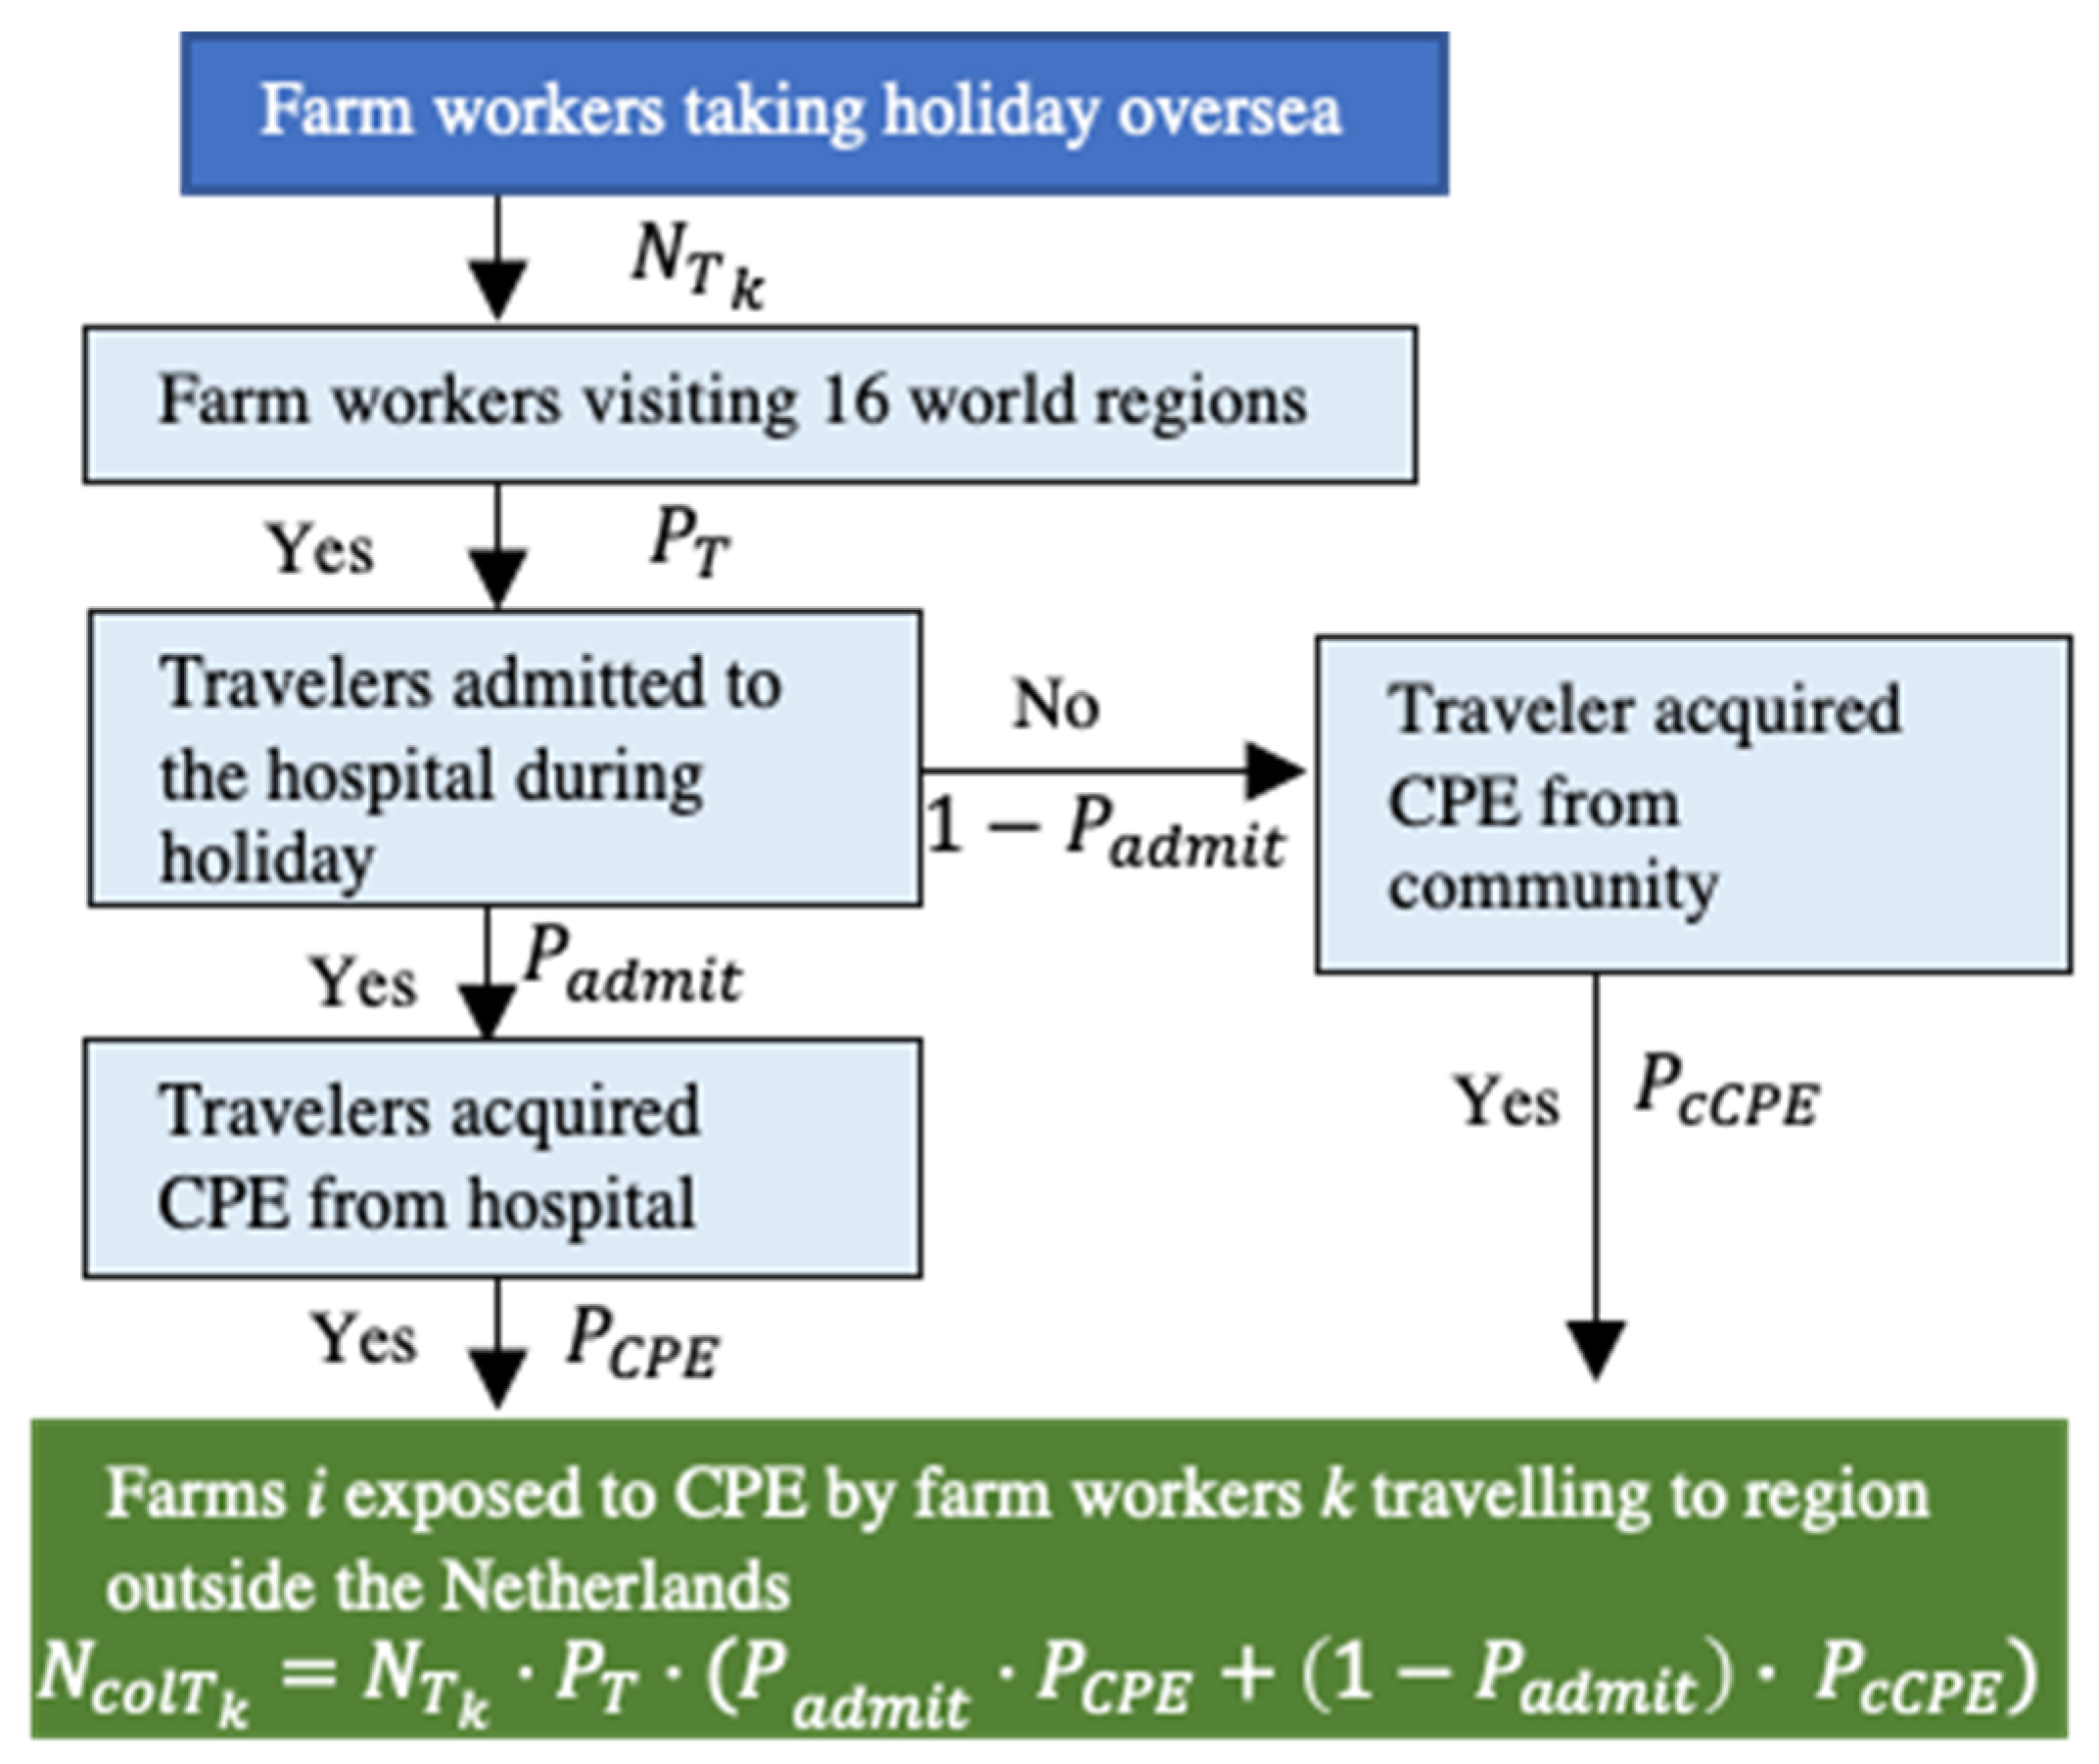
Farm Workers
4.1.3. Submodel II: Exposure Assessment
Animal Feed
Companion Animals
Farm Workers
4.1.4. Submodel II: Dose–Response Model
4.1.5. Risk Estimate Combining Submodel I and Submodel II
4.2. Input Parameters
4.2.1. Imported Livestock
4.2.2. Animal Feed
4.2.3. Companion Animals
4.2.4. Farm Workers
4.2.5. Dose–Response Parameter

| Input * | Description | Value Distribution ** | Value in Sensitivity Analysis | References |
|---|---|---|---|---|
| Expected annual number of farms on which CPE is introduced | ||||
| Number of farms exposed to CPE-colonized sources s (imported livestock (A), livestock feed (F), companion animals (C), farm workers being hospitalized (H), and farm workers traveling abroad (T)) | ||||
| Number of farms in contact with people, import animals, companion animals, and livestock feed | ||||
| Probability of sources exposed to farm are colonized/contaminated with CPE | ||||
| Probability that an individual farm receives at least one batch of feed contaminated with CPE | ||||
| Annual number of feed batches received by a farm | ||||
| Probability that a batch of feed is contaminated with CPE | ||||
| Number of farms with companion animals | ||||
| Number of farm workers/vets hospitalized | ||||
| Number of farm workers/vets returning from abroad | ||||
| Total number of CPE E. coli bacteria ingested by the animals on an exposed farm | ||||
| Total number of CPE E. coli (cfu/g) in contaminated animal feed | ||||
| Total number of CPE E. coli (cfu/g) in companion animal feces | ||||
| Total number of CPE E. coli (cfu) remaining on a farm worker’s hands after hand washing | ||||
| Probability of a single CPE bacterium colonizing an animal’s gut | ||||
| Annual number of imported broilers, parent broilers, piglets, breeding pigs, and veal calves from EU member states j to farm type i in The Netherlands | Supplementary File S7 | Yes | [41,48] | |
| CPE surveillance sensitivity | 0.85 | Yes | [14] | |
| CPE prevalence in livestock i in country j CPE prevalence in hospitalized patients in The Netherlands | Beta (α/se, β) (values of beta distribution in EFSA reference) Beta (8/se, 6676) | Yes | [9,10,24] | |
| CPE prevalence in hospital patients in region m | Beta (α/se, β) (values of beta distribution are in Table S5) | Yes | [63,64,65,66,67,68,69,70,71,72,73,74,75,76,77,78,79,80,81,82,83] | |
| Ratio of ESBL in the community versus ESBL in a clinical setting | 0.79 | N | Table S3 | |
| Prevalence of E. coli-contaminated feed in compound cattle feed | Beta (59, 46) | Yes | [23] | |
| Prevalence of E. coli in Dutch residents | Beta (159,620, 280,677) | Yes | [55] | |
| : broiler : piglet : breeding pig : veal calf | Number of livestock i per shipment | Pert (45,00,47,000, 55,000) Pert (100, 260,300) Pert (65, 80, 95) Pert (30, 150, 200) | Yes | [29] |
| Total number of farm types i and total number of animals i in The Netherlands | Table S5 | Yes | [41] | |
| Total number of farm workers and veterinarians in The Netherlands | Table S5 | Yes | [41] | |
| The average grams of feed consumed by livestock i per day | Table S5 | Yes | [84,85,86] | |
| The average grams of feed delivered to a farm derived from the volume of a standard transport truck | Pert (3 × 10⁶, 16 × 106, 3 × 10⁷) | Yes | [29] | |
| broiler : fattening pig : breeding pig : veal calf | Concentrations of E. coli in feed components following minimum rejection limit by GMP+ (cfu/g) | 11.8 11.8 14.3 7.3 | Yes | [54] |
| The amount of E. coli remaining on a farm worker’s hands after toilet use and subsequent hand washing (cfu) | Log-normal (63, 5.02) | Yes | [28] | |
| (cfu/g) | Number of E. coli (cfu) in a gram of healthy companion animal’s feces | Normal (70, 35) | Yes | [87] |
| Proportion of E. coli carrying CPE genes and proportion of ESBL E. coli carrying CPE genes | 0.00004 0.00424 | N | [37] | |
| : broiler : pig and veal calf | Infectious dose of ESBL E. coli at which, on average, 50% of livestock species i are colonized (cfu) | Log-normal (5, 5) Log-normal (4695, 9187) | Yes | [56,88,89] |
| Proportion of farms that have companion animals | Beta (298, 148) | Yes | [56] | |
| (grams) | Grams of feces defecated by a companion animal in one defecation | Normal (70, 35) | Yes | [58] |
| The average number of defecations by companion animals and humans per day | Pert (1, 2, 5) Uniform (1,3) | Yes | [57] Assumption | |
| Colonization duration of CPE in companion animals and humans (days) | Pert (0, 120, 180) Pert (1, 30, 365) | Yes | [60,90] | |
: farm worker : veterinarian | Proportion of day a companion animal, farm worker, and veterinarian spent in the barns | 0 0.33 0.005 | Yes | Assumption |
| Proportion of Acinobacter transferred from fomite to finger (A) and from finger to fomite (E) | Log-normal (0.24, 0.14) Log-normal (0.06, 0.06) | Yes | [59] | |
| The probability of Dutch travelers visiting 16 world regions in 2013 | Table S5 | Yes | [41] | |
| : broiler and pig farm worker : veal calf farm worker : veterinarian | Probability of farm worker on farm i taking holiday abroad annually | 0.53 0.33 0.64 | Yes | [41,61,91] |
| The average number of farm workers in all farm types | Pert (1, 2, 4) | Yes | Assumption | |
| Probability of hospital admission while traveling overseas and in The Netherlands | 0.04 0.054 | Yes | [41,90,92] |
4.3. Sensitivity Analysis
4.3.1. Spearman Rank Correlation on Baseline Simulations
4.3.2. One-at-a-Time Sensitivity Analysis
4.4. What-If Analysis
5. Conclusions
Supplementary Materials
Author Contributions
Funding
Informed Consent Statement
Data Availability Statement
Acknowledgments
Conflicts of Interest
References
- Davies, J.; Davies, D. Origins and Evolution of Antibiotic Resistance. Microbiol. Mol. Biol. Rev. 2010, 74, 417–433. [Google Scholar] [CrossRef] [PubMed] [Green Version]
- EFSA. Scientific Opinion on Carbapenem Resistance in Food Animal Ecosystems; EFSA: Parma, Italy, 2013; p. 18314732.
- Jacob, J.; Klein, E.; Laxminarayan, R.; Lynfield, R.; Kallen, A.; Ricks, P.; Edwards, J.; Srinivasan, A.; Fridkin, S.; Rasheed, J.K.; et al. Vital Signs: Carbapenem-Resistant Enterobacteriaceae. Cent. Dis. Control. Prev. 2013, 62, 165. [Google Scholar]
- Albiger, B.; Glasner, C.; Struelens, M.J.; Grundmann, H.; Monnet, D.L.; European Survey of Carbapenemase-Producing Enterobacteriaceae (EuSCAPE) Working Group. Carbapenemase-producing Enterobacteriaceae in Europe: Assessment by national experts from 38 countries, May 2015. Eurosurveillance 2015, 20, 30062. [Google Scholar] [CrossRef] [PubMed] [Green Version]
- Kelly, A.M.; Mathema, B.; Larson, E.L. Carbapenem-resistant Enterobacteriaceae in the community: A scoping review. Int. J. Antimicrob. Agents 2017, 50, 127–134. [Google Scholar] [CrossRef]
- Nordmann, P.; Naas, T.; Poirel, L. Global Spread of Carbapenemase-producingEnterobacteriaceae. Emerg. Infect. Dis. 2011, 17, 1791–1798. [Google Scholar] [CrossRef]
- Köck, R.; Daniels-Haardt, I.; Becker, K.; Mellmann, A.; Friedrich, A.W.; Mevius, D.; Schwarz, S.; Jurke, A. Carbapenem-resistant Enterobacteriaceae in wildlife, food-producing, and companion animals: A systematic review. Clin. Microbiol. Infect. 2018, 24, 1241–1250. [Google Scholar] [CrossRef] [Green Version]
- Mughini-Gras, L.; Barrucci, F.; Smid, J.H.; Graziani, C.; Luzzi, I.; Ricci, A.; Barco, L.; Rosmini, R.; Havelaar, A.H.; van Pelt, W.; et al. Attribution of human Salmonella infections to animal and food sources in Italy (2002–2010): Adaptations of the Dutch and modified Hald source attribution models. Epidemiol. Infect. 2014, 142, 1070–1082. [Google Scholar] [CrossRef]
- Authority, E.F.S. The European Union summary report on antimicrobial resistance in zoonotic and indicator bacteria from humans, animals and food in 2017. EFSA J. 2019, 17, e05598. [Google Scholar]
- ECDC. Annual Report of The European Antimicrobial Resistance Surveillance Network (EARS-Net); Surveillance Report; ECDC: Stockholm, Sweeden, 2017.
- Veldman, K.; Mevius, D.; Pelt, W.; Heederik, D.; Geijlswijk, M.; Wagenaar, J.; Mouton, W.; Jacobs, J.; Sanders, P.; Veldman, K.T.; et al. Monitoring of Antimicrobial Resistance and Antibiotic Usage in Animals in The Netherlands in 2016; MARAN: Amsterdam, The Netherlands, 2017. [Google Scholar]
- Blaak, H.; de Kruijf, P.; Hamidjaja, R.A.; van Hoek, A.H.A.M.; de Roda Husman, A.M.; Schets, F.M. Prevalence and characteristics of ESBL-producing E. coli in Dutch recreational waters influenced by wastewater treatment plants. Vet. Microbiol. 2014, 171, 448–459. [Google Scholar] [CrossRef]
- Blaak, H.; van Rooijen, S.; Schuijt, M.; van Leeuwen, D.; van den Berg, L.; Lodder-Verschoor, F.; Schets, F.; de Roda Husman, A. Prevalence of Antibiotic Resistant Bacteria in the Rivers Meuse, Rhine, and New Meus; RIVM Report; National Institute for Public Health and the Environment: Amsterdam, The Netherlands, 2011. [Google Scholar]
- Wit, B.; Veldman, K.; Hordijk, J.; Wagnaar, J.; Heuvelink, A.; Vellema, P.; Dierikx, C.M.; Backer, J.A.; Takumi, K.; van Duijkeren, E. Inventarisatie Screening Carbapenemase-Producerende Bacteriën In Dieren En Dierlijke Producten: Is De Huidige Screening Toereikend? RIVM Briefrappor; National Institute for Public Health and the Environment: Amsterdam, The Netherlands, 2017. [Google Scholar]
- Biedenbach, D.J.; Bouchillon, S.K.; Hoban, D.J.; Hackel, M.; Phuong, D.M.; Nga, T.T.T.; Phuong, N.T.M.; Phuong, T.T.L.; Badal, R.E. Antimicrobial susceptibility and extended-spectrum beta-lactamase rates in aerobic gram-negative bacteria causing intra-abdominal infections in Vietnam: Report from the Study for Monitoring Antimicrobial Resistance Trends (SMART 2009–2011). Diagn. Microbiol. Infect. Dis. 2014, 79, 463–467. [Google Scholar] [CrossRef]
- Cameron, S.; Baldock, F. Two-stage sampling in surveys to substantiate freedom from disease. Prev. Vet. Med. 1998, 34, 19–30. [Google Scholar] [CrossRef]
- Dodd, C.C.; Sanderson, M.W.; Sargeant, J.M.; Nagaraja, T.G.; Oberst, R.D.; Smith, R.A.; Griffin, D.D. Prevalence of Escherichia coli O157 in Cattle Feeds in Midwestern Feedlots. Appl. Environ. Microbiol. 2003, 69, 5243–5247. [Google Scholar] [CrossRef] [PubMed] [Green Version]
- Sargeant, J.M.; Sanderson, M.W.; Griffin, D.D.; Smith, R.A. Factors associated with the presence of Escherichia coli O157 in feedlot–cattle water and feed in the Midwestern USA. Prev. Vet. Med. 2004, 66, 207–237. [Google Scholar] [CrossRef]
- Dargatz, D.; Strohmeyer, R.M.P.; Hyatt, D.; Salman, M. Characterization of Escherichia coli and Salmonella enterica from Cattle Feed Ingredients. Foodborne Pathog. Dis. 2005, 2, 341–347. [Google Scholar] [CrossRef] [PubMed] [Green Version]
- Hancock, D.R.D.; Thomas, L.; Dargatz, D.; Besser, T. Epidemiology of Escherichia coli 0157 in Feedlot Cattle. J. Food Prot. 1997, 60, 462–465. [Google Scholar] [CrossRef] [PubMed]
- Andreoletti, O.B.; Buncic, S.; Colin, P.; Collins, J.D.; De Koeijer, A.; Griffin, J.; Havelaar, A.; Hope, J.; Klein, G.; Kruse, H.; et al. Microbiological Risk Assessment in Feedingstuffs for Food-Producing Animals; European Food Safety Authority: Parma, Italy, 2008. [Google Scholar]
- Ge, B.; Lafon, P.C.; Carter, P.J.; McDermott, S.D.; Abbott, J.; Glenn, A.; Ayers, S.L.; Friedman, S.L.; Paige, J.C.; Wagner, D.D.; et al. Retrospective Analysis of Salmonella, Campylobacter, Escherichia coli, and Enterococcus in Animal Feed Ingredients. Foodborne Pathog. Dis. 2013, 10, 684–691. [Google Scholar] [CrossRef]
- da Costa, P.M.; Oliveira, M.; Bica, A.; Vaz-Pires, P.; Bernardo, F. Antimicrobial resistance in Enterococcus spp. and Escherichia coli isolated from poultry feed and feed ingredients. Vet. Microbiol. 2007, 120, 122–131. [Google Scholar] [CrossRef]
- European Food Safety Authority; European Centre for Disease Prevention and Control. The European Union summary report on antimicrobial resistance in zoonotic and indicator bacteria from humans, animals and food in 2016. EFSA J. 2018, 16, e05182. [Google Scholar]
- EFSA. Scientific Opinion on the Public Health Risks of Bacterial Strains Producing Extended-Spectrum Β-Lactamases and/or Ampc Β-Lactamases in Food and Food-Producing Animals; EFSA: Parma, Italy, 2011; p. 18314732.
- Ibrahim, D.R.; Dodd, C.E.; Stekel, D.J.; Ramsden, S.J.; Hobman, J.L. Multidrug resistant, extended spectrum beta-lactamase (ESBL)-producing Escherichia coli isolated from a dairy farm. FEMS Microbiol. Ecol. 2016, 92, fiw013. [Google Scholar] [CrossRef] [Green Version]
- Pickering, A.J.; Davis, J.; Walters, S.P.; Horak, H.M.; Keymer, D.P.; Mushi, D.; Strickfaden, R.; Chynoweth, J.; Liu, J.; Blum, A.; et al. Hands, Water, and Health: Fecal Contamination in Tanzanian Communities with Improved, Non-Networked Water Supplies. Environ. Sci. Technol. 2010, 44, 3267–3272. [Google Scholar] [CrossRef]
- de Aceituno, A.F.; Bartz, F.E.; Hodge, D.W.; Shumaker, D.J.; Grubb, J.E.; Arbogast, J.W.; Dávila-Aviña, J.; Venegas, F.; Heredia, N.; García, S.; et al. Ability of Hand Hygiene Interventions Using Alcohol-Based Hand Sanitizers and Soap to Reduce Microbial Load on Farmworker Hands Soiled during Harvest. J. Food Prot. 2015, 78, 2024–2032. [Google Scholar] [CrossRef] [PubMed] [Green Version]
- Van Dijk, A. Programmamanager Diervoeder En Sectoren; De Nederlandse Vereniging Diervoederindustrie: Rijswijk, The Netherlands, 2020. [Google Scholar]
- Edmonds, S.L.; McCormack, R.R.; Zhou, S.S.; Macinga, D.R.; Fricker, C.M. Hand Hygiene Regimens for the Reduction of Risk in Food Service Environments. J. Food Prot. 2012, 75, 1303–1309. [Google Scholar] [CrossRef] [PubMed]
- WIN/Gallup International Association. One in Three across the World Don’t Always Wash Their Hands Properly after Going to the Toilet; WIN/Gallup International Association: Washington, DC, USA, 2015. [Google Scholar]
- World Organization for Animal Health (OIE). Terrestrial Animal Health Code. 2021, Chapter 6.7 to 6.11. Available online: https://www.oie.int/en/what-we-do/standards/codes-and-manuals/terrestrial-code-online-access/ (accessed on 1 January 2022).
- OIE. Handbook on Import Risk Analysis for Animals and Animal Products; The World Organisation for Animal Health (OIE): Paris, France, 2010. [Google Scholar]
- De Vos, C.J.; Saatkamp, H.W.; Nielen, M.; Huirne, R.B.M. Scenario Tree Modeling to Analyze the Probability of Classical Swine Fever Virus Introduction into Member States of the European Union. Risk Anal. 2004, 24, 237–253. [Google Scholar] [CrossRef] [PubMed]
- Haas, C.N.; Rose, J.B.; Gerba, C.P. Quantitative Microbial Risk Assessment, 2nd ed.; John Wiley & Sons: New York, NY, USA, 2014. [Google Scholar]
- WHO. Principles and Guidelines for The Conduct of Microbiological Risk Assessment Cac/Gl 30-1999; CODEX Alimentarius; WHO: Geneva, Switzerland, 2014. [Google Scholar]
- Schmitt, H.B.; Kemper, M.; van Passel, H.; Leuken, J.; Husman, A.M.R.; Grinten, E.M.; Rutgers, J.S.; Man, H.; Hoeksma, P.; Zuidema, T. Sources of Antibiotic Resistance in the Environment and Possible Measures; RIVM Report; RIVM: Utrecht, The Netherlands, 2017. [Google Scholar]
- Smeets, P.W.M.H.; Medema, G.J.; van Dijk, J.C. The Dutch secret: How to provide safe drinking water without chlorine in The Netherlands. Drink. Water Eng. Sci. 2009, 2, 1–14. [Google Scholar] [CrossRef] [Green Version]
- Vemin, A.D. Dutch Drinking Water Statistics 2017; Vemin: Hague, The Netherlands, 2017. [Google Scholar]
- Vose Software. @ModelRISK. 6.1.89.0; Vose Software: Ghent, Belgium, 2022. [Google Scholar]
- Statistiek, C.B. Statline. Available online: https://opendata.cbs.nl/statline#/CBS/nl/ (accessed on 1 May 2019).
- European Union. On the Protection of Animals During Transport and Related Operations and Amending Directives 64/432/EEC and 93/119/EC and Regulation (EC) No 1255/9. Off. J. Eur. Union 2005. Available online: https://www.fao.org/faolex/results/details/en/c/LEX-FAOC186519/ (accessed on 1 January 2022).
- Dame-Korevaar, A.; Fischer, E.A.; van der Goot, J.; Stegeman, A.; Mevius, D. Transmission routes of ESBL/pAmpC producing bacteria in the broiler production pyramid, a literature review. Prev. Vet. Med. 2018, 162, 136–150. [Google Scholar] [CrossRef]
- Robe, C.; Blasse, A.; Merle, R.; Friese, A.; Roesler, U.; Guenther, S. Low Dose Colonization of Broiler Chickens With ESBL-/AmpC- Producing Escherichia coli in a Seeder-Bird Model Independent of Antimicrobial Selection Pressure. Front. Microbiol. 2019, 10, 2124. [Google Scholar] [CrossRef]
- Hansen, K.H.; Damborg, P.; Andreasen, M.; Nielsen, S.S.; Guardabassi, L. Carriage and Fecal Counts of Cefotaxime M-Producing Escherichia coli in Pigs: A Longitudinal Study. Appl. Environ. Microbiol. 2013, 79, 794–798. [Google Scholar] [CrossRef] [Green Version]
- Mir, R.A.; Weppelmann, T.A.; Teng, L.; Kirpich, A.; Elzo, M.A.; Driver, J.D.; Jeong, K.C. Colonization Dynamics of Cefotaxime Resistant Bacteria in Beef Cattle Raised Without Cephalosporin Antibiotics. Front. Microbiol. 2018, 9, 500. [Google Scholar] [CrossRef]
- Nations, U. Standard Country or Area Codes for Statistical Use (M49). Available online: https://unstats.un.org/unsd/methodology/m49/ (accessed on 1 November 2021).
- Nederland, R.O. Statistieken Marktinformatie. Available online: https://www.rvo.nl/onderwerpen/internationaal-ondernemen/handel-planten-dieren-producten/marktinformatie/statistieken (accessed on 2 November 2021).
- Husickova, V.; Cekanova, L.; Chroma, M.; Htoutou-Sedlakova, M.; Hricova, K.; Kolar, M. Carriage of ESBL- and AmpC-positive Enterobacteriaceae in the gastrointestinal tract of community subjects and hospitalized patients in the Czech Republic. Biomed. Pap. Med. Fac. Univ. Palacky Olomouc. Czech. Repub. 2012, 156, 348–353. [Google Scholar] [CrossRef] [Green Version]
- Stapleton, J.P.; O’Kelly, F.; Lundon, J.D.; Lynch, M.; McWade, R.; Scanlon, N.; Hannan, M. Antibiotic resistance patterns of Escherichia coli urinary isolates and comparison with antibiotic consumption data over 10 years, 2005–2014. Ir. J. Med.Sci. 2017, 186, 733–741. [Google Scholar] [CrossRef]
- Smet, A.; Martel, A.; Persoons, D.; Dewulf, J.; Heyndrickx, M.; Claeys, G.; Lontie, M.V.M.B.; Herman, L.; Haesebrouck, F.; Butaye, P. Characterization of Extended-Spectrum b-Lactamases Produced by Escherichia coli Isolated from Hospitalized and Nonhospitalized Patients. Emergence of CTX-M-15-Producing Strains Causing Urinary Tract Infections. Microb. Drug Resist. 2010, 16, 129–134. [Google Scholar] [CrossRef] [PubMed] [Green Version]
- Schoevaerdts, D.; Bogaerts, P.; Grimmelprez, A.; De Saint-Hubert, M.; Delaere, B.; Jamart, J.; Swine, C.; Glupczynski, Y. Clinical profiles of patients colonized or infected with extended-spectrum beta-lactamase producing Enterobacteriaceae isolates: A 20 month retrospective study at a Belgian University Hospital. BMC Infect. Dis. 2011, 11, 12. [Google Scholar] [CrossRef] [PubMed] [Green Version]
- Olesen, B.; Hansen, S.D.; Nilsson, F.; Frimodt-Møller, J.; Leihof, F.; Struve, C.; Scheutz, F.; Johnston, B.; Krogfelt, K.; Johnsond, R.J. Prevalence and Characteristics of the Epidemic Multiresistant Escherichia coli ST131 Clonal Group among Extended-Spectrum BetaLactamase-Producing E. coli Isolates in Copenhagen, Denmark. J. Clin. Microbiol. 2013, 51, 1779–1785. [Google Scholar] [CrossRef] [PubMed] [Green Version]
- GMP+. GMP+ Community Sample; GMP+ International: Rijswijk, The Netherlands, 2019. [Google Scholar]
- Veldman, K.; Mevius, D.; Pelt, W.; Wit, I.; Hordijk, J. Monitoring of Antimicrobial Resistance and Antibiotic Usage in Animals in The Netherlands in 2017. 2018. Available online: https://www.wur.nl/nl/Onderzoek-Resultaten/Onderzoeksinstituten/Bioveterinary-Research/Publicaties/MARAN-Rapporten.htm (accessed on 1 October 2020).
- Moran, N.E.; Ferketich, A.K.; Wittum, T.E.; Stull, J.W. Dogs on livestock farms: A cross-sectional study investigating potential roles in zoonotic pathogen transmission. Zoonoses Public Health 2017, 65, 80–87. [Google Scholar] [CrossRef] [Green Version]
- Scrumbles Healthy Dog Poop Chart: In Search of the Perfect Poop. Available online: https://www.scrumbles.co.uk/healthy-dog-poop-chart/ (accessed on 2 November 2021).
- Wright, M.E.; Solo-Gabriele, H.M.; Elmir, S.; Fleming, L.E. Microbial load from animal feces at a recreational beach. Mar. Pollut. Bull. 2009, 58, 1649–1656. [Google Scholar] [CrossRef] [Green Version]
- Greene, C.; Vadlamudi, G.; Eisenberg, M.; Foxman, B.; Koopman, J.; Xi, C. Fomite-fingerpad transfer efficiency (pick-up and deposit) of Acinetobacter baumannii—with and without a latex glove. Am. J. Infect. Control 2015, 43, 928–934. [Google Scholar] [CrossRef]
- Baede, V.O.; Wagenaar, J.A.; Broens, E.M.; Duim, B.; Dohmen, W.; Nijsse, R.; Timmerman, A.J.; Hordijk, J. Longitudinal study of extended-spectrum-beta-lactamase- and AmpC-producing Enterobacteriaceae in household dogs. Antimicrob. Agents Chemother. 2015, 59, 3117–3124. [Google Scholar] [CrossRef] [Green Version]
- Welink, M. Meeste Boeren Wel Met Zomervakantie. Available online: https://www.boerderij.nl/meeste-boeren-wel-met-zomervakantie (accessed on 1 May 2020).
- WHO. Antimicrobial Resistance Global Report on Surveillance; WHO: Geneva, Switzerland, 2014. [Google Scholar]
- Iregui, A.; Ha, K.; Meleney, K.; Landman, D.; Quale, J. Carbapenemases in New York City: The continued decline of KPC-producing Klebsiella pneumoniae, but a new threat emerges. J. Antimicrob. Chemother. 2018, 73, 2997–3000. [Google Scholar] [CrossRef]
- Patel, G.; Huprikar, S.; Factor, S.H.; Jenkins, S.G.; Calfee, D.P. Outcomes of Carbapenem-Resistant Klebsiella pneumoniae Infection and the Impact of Antimicrobial and Adjunctive Therapies. Infect. Control Hosp. Epidemiol. 2008, 29, 1099–1106. [Google Scholar] [CrossRef]
- Khan, E.; Ejaz, M.; Zafar, A.; Jabeen, K.; Shakoor, S.; Inayat, R.; Hasan, R. Increased isolation of ESBL producing Klebsiella pneumoniae with emergence of carbapenem resistant isolates in Pakistan: Report from a tertiary care hospital. J. Pak. Med. Assoc. 2010, 60, 186–190. [Google Scholar]
- Castanheira, M.; Deshpande, L.M.; Mathai, D.; Bell, J.M.; Jones, R.N.; Mendes, R.E. Early Dissemination of NDM-1- and OXA-181-Producing Enterobacteriaceae in Indian Hospitals: Report from the SENTRY Antimicrobial Surveillance Program, 2006-2007. Antimicrob. Agents Chemother. 2011, 55, 1274–1278. [Google Scholar] [CrossRef] [PubMed] [Green Version]
- Mohanty, S.; Gaind, R.; Ranjan, R.; Deb, M. Prevalence and phenotypic characterisation of carbapenem resistance in Enterobacteriaceae bloodstream isolates in a tertiary care hospital In India. Int. J. Antimicrob. Agents 2011, 37, 273–275. [Google Scholar] [CrossRef] [PubMed]
- Ben-David, D.; Kordevani, R.; Keller, N.; Tal, I.; Marzel, A.; Gal-Mor, O.; Maor, Y.; Rahav, G. Outcome of carbapenem resistant Klebsiella pneumoniae bloodstream infections. Clin. Microbiol. Infect. 2012, 18, 54–60. [Google Scholar] [CrossRef] [PubMed] [Green Version]
- Liu, S.-W.; Chang, H.-J.; Chia, J.-H.; Kuo, A.-J.; Wu, T.-L.; Lee, M.-H. Outcomes and characteristics of ertapenem-nonsusceptible Klebsiella pneumoniae bacteremia at a university hospital in Northern Taiwan: A matched case-control study. J. Microbiol. Immunol. Infect. 2012, 45, 113–119. [Google Scholar] [CrossRef] [Green Version]
- Rimrang, B.; Chanawong, A.; Lulitanond, A.; Wilailuckana, C.; Charoensri, N.; Sribenjalux, P.; Phumsrikaew, W.; Wonglakorn, L.; Kerdsin, A.; Chetchotisakd, P. Emergence of NDM-1- and IMP-14a-producing Enterobacteriaceae in Thailand. J. Antimicrob. Chemother. 2012, 67, 2626–2630. [Google Scholar] [CrossRef]
- Balm, M.N.D.; La, M.-V.; Krishnan, P.; Jureen, R.; Lin, R.T.P.; Teo, J.W.P. Emergence of Klebsiella pneumoniae co-producing NDM-type and OXA-181 carbapenemases. Clin. Microbiol. Infect. 2013, 19, E421–E423. [Google Scholar] [CrossRef] [Green Version]
- Koh, T.H.; Cao, D.; Shan, Q.Y.; Bacon, A.; Hsu, L.-Y.; Ooi, E.E. Acquired carbapenemases in Enterobactericeae in Singapore, 1996–2012. Pathology 2013, 45, 600–603. [Google Scholar] [CrossRef]
- Khajuria, A.; Praharaj, A.K.; Kumar, M.; Grover, N. Emergence of Escherichia coli, Co-Producing NDM-1 and OXA-48 Carbapenemases, in Urinary Isolates, at a Tertiary Care Centre at Central India. J. Clin. Diagn. Res. 2014, 8, DC01–DC04. [Google Scholar] [CrossRef]
- Alagesan, M.; Gopalakrishnan, R.; Panchatcharam, S.N.; Dorairajan, S.; Ananth, T.M.; Venkatasubramanian, R. A decade of change in susceptibility patterns of Gram-negative blood culture isolates: A single center study. Germs 2015, 5, 65–77. [Google Scholar] [CrossRef] [Green Version]
- Tran, H.H.; Ehsani, S.; Shibayama, K.; Matsui, M.; Suzuki, S.; Nguyen, M.B.; Tran, D.N.; Tran, V.P.; Nguyen, H.T.; Dang, D.A.; et al. Common isolation of New Delhi metallo-beta-lactamase 1-producing Enterobacteriaceae in a large surgical hospital in Vietnam. Eur. J. Clin. Microbiol. 2015, 34, 1247–1254. [Google Scholar] [CrossRef] [Green Version]
- Hsu, L.-Y.; Apisarnthanarak, A.; Khan, E.; Suwantarat, N.; Ghafur, A.; Tambyah, P.A. Carbapenem-Resistant Acinetobacter baumannii and Enterobacteriaceae in South and Southeast Asia. Clin. Microbiol. Rev. 2017, 30, 1–22. [Google Scholar] [CrossRef] [PubMed] [Green Version]
- Liu, J.; Yu, J.; Chen, F.; Yu, J.; Simner, P.; Tamma, P.; Liu, Y.; Shen, L. Emergence and establishment of KPC-2-producing ST11 Klebsiella pneumoniae in a general hospital in Shanghai, China. Eur. J. Clin. Microbiol. 2017, 37, 293–299. [Google Scholar] [CrossRef] [PubMed] [Green Version]
- CPE Thailand. Percentage of Susceptible Organisms Isolated from All Specimen, 85 Hospitals; CPE Thailand: Bangkok, Thailand, 2018. [Google Scholar]
- Singh-Moodley, A.; Perovic, O. Antimicrobial susceptibility testing in predicting the presence of carbapenemase genes in Enterobacteriaceae in South Africa. BMC Infect. Dis. 2016, 16, 536. [Google Scholar] [CrossRef] [Green Version]
- Correa, L.; Martino, M.D.V.; Siqueira, I.; Pasternak, J.; Gales, A.C.; Silva, C.V.; Camargo, T.Z.S.; Scherer, P.F.; Marra, A.R. A hospital-based matched case–control study to identify clinical outcome and risk factors associated with carbapenem-resistant Klebsiella pneumoniae infection. BMC Infect. Dis. 2013, 13, 80. [Google Scholar] [CrossRef] [PubMed] [Green Version]
- Schwaber, M.J.; Klarfeld-Lidji, S.; Navon-Venezia, S.; Schwartz, D.; Leavitt, A.; Carmeli, Y. Predictors of Carbapenem-Resistant Klebsiella pneumoniae Acquisition among Hospitalized Adults and Effect of Acquisition on Mortality. Antimicrob. Agents Chemother. 2008, 52, 1028–1033. [Google Scholar] [CrossRef] [PubMed] [Green Version]
- Al Johani, S.M.; Akhter, J.; Balkhy, H.; El-Saed, A.; Younan, M.; Memish, Z. Prevalence of antimicrobial resistance among gram-negative isolates in an adult intensive care unit at a tertiary care center in Saudi Arabia. Ann. Saudi Med. 2010, 30, 364–369. [Google Scholar] [CrossRef] [PubMed] [Green Version]
- Nahid, F.; Khan, A.A.; Rehman, S.; Zahra, R. Prevalence of metallo-beta-lactamase NDM-1-producing multi-drug resistant bacteria at two Pakistani hospitals and implications for public health. J. Infect. Public Health 2013, 6, 487–493. [Google Scholar] [CrossRef] [Green Version]
- Turner, J.; Garcés, L.; Smith, W.; Stevensont, P. The Welfare of Broiler Chickens in The European Union; CWFT: Hampshire, UK, 2005. [Google Scholar]
- Rönnqvist, M.; Välttilä, V.; Heinola, K.; Ranta, J.; Niemi, J.; Tuominen, P. Risk Assessment and Cost–Benefit Analysis of Salmonella in Feed and Animal Production; Ministry of Agriculture and Forestry: Helsinki, Finland, 2018. [Google Scholar]
- Bussel, V. Veal Farm. Available online: https://vanbusselbv.nl/en/veal-farm/ (accessed on 1 January 2022).
- Espinosa-Gongora, C.; Shah, S.Q.; Jessen, L.R.; Bortolaia, V.; Langebaek, R.; Bjornvad, C.R.; Guardabassi, L. Quantitative assessment of faecal shedding of beta-lactam-resistant Escherichia coli and enterococci in dogs. Vet. Microbiol. 2015, 181, 298–302. [Google Scholar] [CrossRef]
- Dame-Korevaar, A.; Fischer, E.A.J.; van der Goot, J.; Velkers, F.; van den Broek, J.; Veldman, K.; Ceccarelli, D.; Mevius, D.; Stegeman, A. Effect of challenge dose of plasmid-mediated extended-spectrum beta-lactamase and AmpC beta-lactamase producing Escherichia coli on time-until-colonization and level of excretion in young broilers. Vet. Microbiol. 2019, 239, 108446. [Google Scholar] [CrossRef]
- Cornick, N.A.; Helgerson, A.F. Transmission and Infectious Dose of Escherichia coli O157:H7 in Swine. Appl. Environ. Microbiol. 2004, 70, 5331–5335. [Google Scholar] [CrossRef] [Green Version]
- Arcilla, M.S.; van Hattem, J.M.; Haverkate, M.R.; Bootsma, M.C.J.; van Genderen, P.J.J.; Goorhuis, A.; Grobusch, M.P.; Lashof, A.M.O.; Molhoek, N.; Schultsz, C.; et al. Import and spread of extended-spectrum β-lactamase-producing Enterobacteriaceae by international travellers (COMBAT study): A prospective, multicentre cohort study. Lancet Infect. Dis. 2017, 17, 78–85. [Google Scholar] [CrossRef]
- Molder, P. Pathways for Import of Veal Calves; Denkavit: Voorthuizen, The Netherlands, 2019. [Google Scholar]
- Ministerie van Volksgezondheid, W.S. Indicatie Zorg Zonder En Met Verblijf. Available online: https://www.monitorlangdurigezorg.nl/kerncijfers/indicatie/indicatie-zorg-zonder-en-met-verblijf (accessed on 1 January 2022).
- Lien, L.T.Q.; Lan, P.T.; Chuc, N.T.K.; Hoa, N.Q.; Nhung, P.H.; Thoa, N.T.M.; Diwan, V.; Tamhankar, A.J.; Lundborg, C.S. Antibiotic Resistance and Antibiotic Resistance Genes in Escherichia coli Isolates from Hospital Wastewater in Vietnam. Int. J. Environ. Res. Public Heal. 2017, 14, 699. [Google Scholar] [CrossRef] [Green Version]
- Kleinkauf, N.; Hausemann, A.; Kempf, V.A.; Gottschalk, R.; Heudorf, U. Burden of carbapenem-resistant organisms in the Frankfurt/Main Metropolitan Area in Germany 2012/2013—First results and experiences after the introduction of legally mandated reporting. BMC Infect. Dis. 2014, 14, 1471–2334. [Google Scholar] [CrossRef] [PubMed] [Green Version]
- Lamba, M.; Gupta, S.; Shukla, R.; Graham, D.W.; Sreekrishnan, T.R.; Ahammad, S.Z. Carbapenem resistance exposures via wastewaters across New Delhi. Environ. Int. 2018, 119, 302–308. [Google Scholar] [CrossRef]
- Poirel, L.; Nordmann, P. Carbapenem resistance in Acinetobacter baumannii: Mechanisms and epidemiology. Clin. Microbiol. Infect. 2006, 12, 826–836. [Google Scholar] [CrossRef] [PubMed] [Green Version]
- Djenadi, K.; Zhang, L.; Murray, A.K.; Gaze, W.H. Carbapenem resistance in bacteria isolated from soil and water environments in Algeria. J. Glob. Antimicrob. Resist. 2018, 15, 262–267. [Google Scholar] [CrossRef]
- Morrison, B.J.; Rubin, J.E. Carbapenemase Producing Bacteria in the Food Supply Escaping Detection. PLoS ONE 2015, 10, e0126717. [Google Scholar] [CrossRef] [PubMed] [Green Version]
- Poirel, L.; Bercot, B.; Millemann, Y.; Bonnin, R.A.; Pannaux, G.; Nordmann, P. Carbapenemase-producing Acinetobacter spp. In Cattle, France. Emerg. Infect. Dis. 2012, 18, 523–525. [Google Scholar] [CrossRef] [PubMed]
- Woodford, N.; Wareham, D.W.; Guerra, B.; Teale, C. Carbapenemase-producing Enterobacteriaceae and non-Enterobacteriaceae from animals and the environment: An emerging public health risk of our own making? J. Antimicrob. Chemother. 2014, 69, 287–291. [Google Scholar] [CrossRef] [PubMed] [Green Version]
- White, L.; Hopkins, K.; Meunier, D.; Perry, C.; Pike, R.; Wilkinson, P.; Pickup, R.W.; Cheesbrough, J.; Woodford, N. Carbapenemase-producing Enterobacteriaceae in hospital wastewater: A reservoir that may be unrelated to clinical isolates. J. Hosp. Infect. 2016, 93, 145–151. [Google Scholar] [CrossRef] [Green Version]
- Oteo, J.; Saez, D.; Bautista, V.; Fernandez-Romero, S.; Hernandez-Molina, J.M.; Perez-Vazquez, M.; Aracil, B.; Campos, J. Spanish Collaborating Group for the Antibiotic Resistance Surveillance, P. Carbapenemase-producing enterobacteriaceae in Spain in 2012. Antimicrob. Agents Chemother. 2013, 57, 6344–6347. [Google Scholar] [CrossRef] [PubMed] [Green Version]
- Ceccarelli, D.; van Essen-Zandbergen, A.; Veldman, K.T.; Tafro, N.; Haenen, O.; Mevius, D.J. Chromosome-Based blaOXA-48-Like Variants in Shewanella Species Isolates from Food-Producing Animals, Fish, and the Aquatic Environment. Antimicrob. Agents Chemother. 2017, 61. [Google Scholar] [CrossRef] [PubMed] [Green Version]
- Yousfi, M.; Touati, A.; Muggeo, A.; Mira, B.; Asma, B.; Brasme, L.; Guillard, T.; de Champs, C. Clonal dissemination of OXA-48-producing Enterobacter cloacae isolates from companion animals in Algeria. J. Glob. Antimicrob. Resist. 2018, 12, 187–191. [Google Scholar] [CrossRef]
- Falgenhauer, L.; Ghosh, H.; Guerra, B.; Yao, Y.; Fritzenwanker, M.; Fischer, J.; Helmuth, R.; Imirzalioglu, C.; Chakraborty, T. Comparative genome analysis of IncHI2 VIM-1 carbapenemase-encoding plasmids of Escherichia coli and Salmonella enterica isolated from a livestock farm in Germany. Vet. Microbiol. 2015, 200, 114–117. [Google Scholar] [CrossRef] [PubMed]
- Nadimpalli, M.; Fabre, L.; Yith, V.; Sem, N.; Gouali, M.; Delarocque-Astagneau, E.; Sreng, N.; Le Hello, S. CTX-M-55-type ESBL-producing Salmonella enterica are emerging among retail meats in Phnom Penh, Cambodia. J. Antimicrob. Chemother. 2019, 74, 342–348. [Google Scholar] [CrossRef]
- Szczepanowski, R.; Linke, B.; Krahn, I.; Gartemann, K.-H.; Gützkow, T.; Eichler, W.; Pühler, A.; Schlüter, A. Detection of 140 clinically relevant antibiotic-resistance genes in the plasmid metagenome of wastewater treatment plant bacteria showing reduced susceptibility to selected antibiotics. Microbiology 2009, 155, 2306–2319. [Google Scholar] [CrossRef] [Green Version]
- Furlan, J.P.R.; Stehling, E.G. Detection of beta-lactamase encoding genes in feces, soil and water from a Brazilian pig farm. Environ. Monit. Assess. 2018, 190, 76. [Google Scholar] [CrossRef]
- Walsh, T.R.; Weeks, J.; Livermore, D.M.; Toleman, M.A. Dissemination of NDM-1 positive bacteria in the New Delhi environment and its implications for human health: An environmental point prevalence study. Lancet Infect. Dis. 2011, 11, 355–362. [Google Scholar] [CrossRef]
- Stolle, I.; Prenger-Berninghoff, E.; Stamm, I.; Scheufen, S.; Hassdenteufel, E.; Guenther, S.; Bethe, A.; Pfeifer, Y.; Ewers, C. Emergence of OXA-48 carbapenemase-producing Escherichia coli and Klebsiella pneumoniae in dogs. J. Antimicrob. Chemother. 2013, 68, 2802–2808. [Google Scholar] [CrossRef] [Green Version]
- Guerra, B.; Fischer, J.; Helmuth, R. An emerging public health problem: Acquired carbapenemase-producing microorganisms are present in food-producing animals, their environment, companion animals and wild birds. Vet. Microbiol. 2014, 171, 290–297. [Google Scholar] [CrossRef]
- Poirel, L.; Barbosa-Vasconcelos, A.; Simões, R.R.; Da Costa, P.M.; Liu, W.; Nordmann, P. Environmental KPC-Producing Escherichia coli Isolates in Portugal. Antimicrob. Agents Chemother. 2011, 56, 1662–1663. [Google Scholar] [CrossRef] [PubMed] [Green Version]
- Fischer, J.; Rodríguez, I.; Schmoger, S.; Friese, A.; Roesler, U.; Helmuth, R.; Guerra, B. Escherichia coli producing VIM-1 carbapenemase isolated on a pig farm. J. Antimicrob. Chemother. 2012, 67, 1793–1795. [Google Scholar] [CrossRef] [PubMed]
- Rubin, J.E.; Pitout, J.D. Extended-spectrum β-lactamase, carbapenemase and AmpC producing Enterobacteriaceae in companion animals. Vet. Microbiol. 2014, 170, 10–18. [Google Scholar] [CrossRef]
- Schijven, J.F.; Blaak, H.; Schets, F.M.; de Roda Husman, A.M. Fate of Extended-Spectrum beta-Lactamase-Producing Escherichia coli from Faecal Sources in Surface Water and Probability of Human Exposure through Swimming. Environ. Sci. Technol. 2015, 49, 11825–11833. [Google Scholar] [CrossRef]
- Pulss, S.; Semmler, T.; Prenger-Berninghoff, E.; Bauerfeind, R.; Ewers, C. First report of an Escherichia coli strain from swine carrying an OXA-181 carbapenemase and the colistin resistance determinant MCR-1. Int. J. Antimicrob. Agents 2017, 50, 232–236. [Google Scholar] [CrossRef] [PubMed]
- Yousfi, M.; Mairi, A.; Bakour, S.; Touati, A.; Hassissen, L.; Hadjadj, L.; Rolain, J.-M. First report of NDM-5-producing Escherichia coli ST1284 isolated from dog in Bejaia, Algeria. New Microbes New Infect. 2015, 8, 17–18. [Google Scholar] [CrossRef] [Green Version]
- Manges, A.R.; Johnson, J.R. Food-Borne Origins of Escherichia coli Causing Extraintestinal Infections. Clin. Infect. Dis. 2012, 55, 712–719. [Google Scholar] [CrossRef] [PubMed] [Green Version]
- Pantel, A.; on behalf of the CARB-LR group; Boutet-Dubois, A.; Jean-Pierre, H.; Marchandin, H.; Sotto, A.; Lavigne, J.-P. French regional surveillance program of carbapenemase-producing Gram-negative bacilli: Results from a 2-year period. Eur. J. Clin. Microbiol. 2014, 33, 2285–2292. [Google Scholar] [CrossRef]
- Davido, B.; Moussiegt, A.; Dinh, A.; Bouchand, F.; Matt, M.; Senard, O.; Deconinck, L.; Espinasse, F.; Lawrence, C.; Fortineau, N.; et al. Germs of thrones—Spontaneous decolonization of Carbapenem-Resistant Enterobacteriaceae (CRE) and Vancomycin-Resistant Enterococci (VRE) in Western Europe: Is this myth or reality? Antimicrob. Resist. Infect. Control. 2018, 7, 100. [Google Scholar] [CrossRef]
- Seiffert, S.N.; Carattoli, A.; Tinguely, R.; Lupo, A.; Perreten, V.; Endimiani, A. High prevalence of extended-spectrum beta-lactamase, plasmid-mediated AmpC, and carbapenemase genes in pet food. Antimicrob. Agents Chemother. 2014, 58, 6320–6323. [Google Scholar] [CrossRef] [Green Version]
- Gentilini, F.; Turba, M.E.; Pasquali, F.; Mion, D.; Romagnoli, N.; Zambon, E.; Terni, D.; Peirano, G.; Pitout, J.D.D.; Parisi, A.; et al. Hospitalized Pets as a Source of Carbapenem-Resistance. Front. Microbiol. 2018, 9, 2872. [Google Scholar] [CrossRef]
- Ahammad, Z.S.; Sreekrishnan, T.R.; Hands, C.L.; Knapp, C.W.; Graham, D.W. Increased Waterborne blaNDM-1 Resistance Gene Abundances Associated with Seasonal Human Pilgrimages to the Upper Ganges River. Environ. Sci. Technol. 2014, 48, 3014–3020. [Google Scholar] [CrossRef] [Green Version]
- Huang, T.D.; Bogaerts, P.; Berhin, C.; Hoebeke, M.; Bauraing, C.; Glupczynski, Y.; on behalf of a multicentre study group. Increasing proportion of carbapenemase-producing Enterobacteriaceae and emergence of a MCR-1 producer through a multicentric study among hospital-based and private laboratories in Belgium from September to November 2015. Eurosurveillance 2017, 22. [Google Scholar] [CrossRef] [PubMed] [Green Version]
- Milanović, V.; Osimani, A.; Roncolini, A.; Garofalo, C.; Aquilanti, L.; Pasquini, M.; Tavoletti, S.; Vignaroli, C.; Canonico, L.; Ciani, M.; et al. Investigation of the Dominant Microbiota in Ready-to-Eat Grasshoppers and Mealworms and Quantification of Carbapenem Resistance Genes by qPCR. Front. Microbiol. 2018, 9, 3036. [Google Scholar] [CrossRef]
- Abraham, S.; O’Dea, M.; Trott, D.J.; Abraham, R.J.; Hughes, D.; Pang, S.; McKew, G.; Cheong, E.Y.L.; Merlino, J.; Saputra, S. Isolation and plasmid characterization of carbapenemase (IMP-4) producing Salmonella enterica Typhimurium from cats. Sci. Rep. 2016, 6, 1–7. [Google Scholar] [CrossRef] [PubMed]
- Buelow, E.; Bayjanov, J.R.; Majoor, E.; Willems, R.; Bonten, M.J.M.; Schmitt, H.; van Schaik, W. Limited influence of hospital wastewater on the microbiome and resistome of wastewater in a community sewerage system. FEMS Microbiol. Ecol. 2018, 94. [Google Scholar] [CrossRef] [PubMed]
- El Garch, F.; Sauget, M.; Hocquet, D.; LeChaudee, D.; Woehrle, F.; Bertrand, X. mcr-1 is borne by highly diverse Escherichia coli isolates since 2004 in food-producing animals in Europe. Clin. Microbiol. Infect. 2017, 23, 51.e1–51.e4. [Google Scholar] [CrossRef] [Green Version]
- Grøntvedt, C.A.; Elstrøm, P.; Stegger, M.; Skov, R.L.; Andersen, P.S.; Larssen, K.W.; Urdahl, A.M.; Angen, Ø.; Larsen, J.; Åmdal, S.; et al. Methicillin-ResistantStaphylococcus aureusCC398 in Humans and Pigs in Norway: A “One Health” Perspective on Introduction and Transmission. Clin. Infect. Dis. 2016, 63, 1431–1438. [Google Scholar] [CrossRef] [Green Version]
- Pulss, S.; Stolle, I.; Stamm, I.; Leidner, U.; Heydel, C.; Semmler, T.; Prenger-Berninghoff, E.; Ewers, C. Multispecies and Clonal Dissemination of OXA-48 Carbapenemase in Enterobacteriaceae From Companion Animals in Germany, 2009—2016. Front. Microbiol. 2018, 9, 1265. [Google Scholar] [CrossRef]
- Fischer, J.; Schmoger, S.; Jahn, S.; Helmuth, R.; Guerra, B. NDM-1 carbapenemase-producing Salmonella enterica subsp. enterica serovar Corvallis isolated from a wild bird in Germany. J. Antimicrob. Chemother. 2013, 68, 2954–2956. [Google Scholar] [CrossRef] [Green Version]
- Girlich, D.; Poirel, L.; Nordmann, P. Novel ambler class A carbapenem-hydrolyzing beta-lactamase from a Pseudomonas fluorescens isolate from the Seine River, Paris, France. Antimicrob. Agents Chemother. 2010, 54, 328–332. [Google Scholar] [CrossRef] [PubMed] [Green Version]
- Haller, L.; Chen, H.; Ng, C.; Le, T.H.; Koh, T.H.; Barkham, T.; Sobsey, M.; Gin, K.Y. Occurrence and characteristics of extended-spectrum beta-lactamase- and carbapenemase- producing bacteria from hospital effluents in Singapore. Sci. Total Environ. 2018, 615, 1119–1125. [Google Scholar] [CrossRef] [PubMed]
- Chouchani, C.; Marrakchi, R.; Henriques, I.; Correia, A. Occurrence of IMP-8, IMP-10, and IMP-13 metallo-beta-lactamases located on class 1 integrons and other extended-spectrum beta-lactamases in bacterial isolates from Tunisian rivers. Scand J. Infect. Dis. 2013, 45, 95–103. [Google Scholar] [CrossRef]
- Liu, X.; Thungrat, K.; Boothe, D.M. Occurrence of OXA-48 Carbapenemase and Other beta-Lactamase Genes in ESBL-Producing Multidrug Resistant Escherichia coli from Dogs and Cats in the United States, 2009–2013. Front. Microbiol. 2016, 7, 1057. [Google Scholar] [PubMed] [Green Version]
- Smet, A.; Boyen, F.; Pasmans, F.; Butaye, P.; Martens, A.; Nemec, A.; Deschaght, P.; Vaneechoutte, M.; Haesebrouck, F. OXA-23-producing Acinetobacter species from horses: A public health hazard? J. Antimicrob. Chemother. 2012, 67, 3009–3010. [Google Scholar] [CrossRef] [Green Version]
- Vergara, A.; Pitart, C.; Montalvo, T.; Roca, I.; Sabate, S.; Hurtado, J.C.; Planell, R.; Marco, F.; Ramirez, B.; Peracho, V.; et al. Prevalence of Extended-Spectrum-beta-Lactamase- and/or Carbapenemase-Producing Escherichia coli Isolated from Yellow-Legged Gulls from Barcelona, Spain. Antimicrob. Agents Chemother. 2017, 61, e02071-16. [Google Scholar] [CrossRef] [PubMed] [Green Version]
- Baede, V.O.; Broens, E.M.; Spaninks, M.P.; Timmerman, A.J.; Graveland, H.; Wagenaar, J.A.; Duim, B.; Hordijk, J. Raw pet food as a risk factor for shedding of extended-spectrum beta-lactamase-producing Enterobacteriaceae in household cats. PLoS ONE 2017, 12, e0187239. [Google Scholar] [CrossRef] [Green Version]
- Huijbers, P.M.C.; Blaak, H.; de Jong, M.C.M.; Graat, E.A.M.; Vandenbroucke-Grauls, C.M.J.E.; de Roda Husman, A.M. Role of the Environment in the Transmission of Antimicrobial Resistance to Humans: A Review. Environ. Sci. Technol. 2015, 49, 11993–12004. [Google Scholar] [CrossRef]
- Wang, J.; Ma, Z.-B.; Zeng, Z.-L.; Yang, X.-W.; Huang, Y.; Liu, J.-H. Response to Comment on “The role of wildlife (wild birds) in the global transmission of antimicrobial resistance genes”. Zool. Res. 2017, 38, 212. [Google Scholar] [CrossRef] [Green Version]
- Fischer, J.; Rodríguez, I.; Schmoger, S.; Friese, A.; Roesler, U.; Helmuth, R.; Guerra, B. Salmonella enterica subsp. enterica producing VIM-1 carbapenemase isolated from livestock farms. J. Antimicrob. Chemother. 2012, 68, 478–480. [Google Scholar] [CrossRef] [Green Version]
- Grönthal, T.; Österblad, M.; Eklund, M.; Jalava, J.; Nykäsenoja, S.; Pekkanen, K.; Rantala, M. Sharing more than friendship—Transmission of NDM-5 ST167 and CTX-M-9 ST69 Escherichia coli between dogs and humans in a family, Finland, 2015. Eurosurveillance 2018, 23, 1700497. [Google Scholar] [CrossRef] [PubMed]
- Hellweger, F.L.; Ruan, X.; Sanchez, S. A Simple Model of Tetracycline Antibiotic Resistance in the Aquatic Environment (with Application to the Poudre River). Int. J. Environ. Res. Public Heal. 2011, 8, 480–497. [Google Scholar] [CrossRef] [PubMed] [Green Version]
- Van Doremalen, N.; Bushmaker, T.; Karesh, W.; Munster, V.J. Stability of Middle East Respiratory Syndrome Coronavirus in Milk. Emerg. Infect. Dis. 2014, 20, 1263–1264. [Google Scholar] [CrossRef] [PubMed]
- Summary ESBL-Attribution-Analysis (ESBLAT). 2018. Available online: https://www.uu.nl/sites/default/files/summary_esbl_attribution_en.pdf (accessed on 1 January 2022).
- Rhomberg, P.; Jones, R.N. Summary trends for the Meropenem Yearly Susceptibility Test Information Collection Program: A 10-year experience in the United States (1999–2008). Diagn. Microbiol. Infect. Dis. 2009, 65, 414–426. [Google Scholar] [CrossRef]
- González-Torralba, A.; Oteo, J.; Asenjo, A.; Bautista, V.; Fuentes, E.; Alós, J.-I. Survey of Carbapenemase-Producing Enterobacteriaceae in Companion Dogs in Madrid, Spain. Antimicrob. Agents Chemother. 2016, 60, 2499–2501. [Google Scholar] [CrossRef] [Green Version]
- Levast, M.; Deiber, M.; Decroisette, E.; Mallaval, F.-O.; LeComte, C.; Poirel, L.; Carrër, A.; Nordmann, P. Transfer of OXA-48-positive carbapenem-resistant Klebsiella pneumoniae from Turkey to France. J. Antimicrob. Chemother. 2011, 66, 944–945. [Google Scholar] [CrossRef]
- Høg, B.B.; Ellis-Iversen, J.; Sönksen, U.W. Use of Antimicrobial Agents and Occurrence of Antimicrobial Resistance in Bacteria from Food Animals, Food and Humans in Denma. DANMAP 2017. Available online: https://backend.orbit.dtu.dk/ws/files/161713656/Rapport_DANMAP_2017.pdf (accessed on 1 January 2022).
- Vittecoq, M.; Laurens, C.; Brazier, L.; Durand, P.; Elguero, E.; Arnal, A.; Thomas, F.; Aberkane, S.; Renaud, N.; Prugnolle, F.; et al. VIM-1 carbapenemase-producing Escherichia coli in gulls from southern France. Ecol. Evol. 2017, 7, 1224–1232. [Google Scholar] [CrossRef]
- Zurfluh, K.; Bagutti, C.; Brodmann, P.; Alt, M.; Schulze, J.; Fanning, S.; Stephan, R.; Nüesch-Inderbinen, M. Wastewater is a reservoir for clinically relevant carbapenemase- and 16s rRNA methylase-producing Enterobacteriaceae. Int. J. Antimicrob. Agents 2017, 50, 436–440. [Google Scholar] [CrossRef] [Green Version]
- Fernandes, M.R.; Sellera, F.P.; Moura, Q.; Carvalho, M.P.N.; Rosato, P.N.; Cerdeira, L.; Lincopan, N. Zooanthroponotic Transmission of Drug-Resistant Pseudomonas aeruginosa, Brazil. Emerg. Infect. Dis. 2018, 24, 1160–1162. [Google Scholar] [CrossRef] [Green Version]
- The European Coalition for Farm Animals. The Welfare of Broiler Chickens in the European Union. 2005. Available online: https://www.ciwf.org.uk/research/species-meat-chickens/the-welfare-of-broiler-chickens-in-the-european-union (accessed on 1 January 2022).


| Farms at Risk | Median Probability of at Least One Animal Being Colonized Given Exposure by a Specific CPE Source (5th and 95th Percentiles) | ||
|---|---|---|---|
| Farm Types | Feed | Farm Workers Returning from Travel and Hospital | |
| Farm Workers | Veterinarians | ||
| Broiler | 1.00 (1.00, 1.00) | 1 × 10⁻⁴ (1 × 10⁻⁵, 8 × 10⁻⁴) | 2 × 10⁻⁶ (2 × 10⁻⁷, 2 × 10⁻⁵) |
| Broiler breeder | 1.00 (1.00, 1.00) | 1 × 10⁻⁴ (1 × 10⁻⁵, 8 × 10⁻⁴) | 2 × 10⁻⁶ (2 × 10⁻⁷, 2 × 10⁻⁵) |
| Fattening pig | 0.88 (0.22, 1.00) | 2 × 10⁻⁷ (1 × 10⁻⁸, 5 × 10⁻⁶) | 4 × 10⁻⁹ (2 × 10⁻¹⁰, 9 × 10⁻⁸) |
| Breeding pig | 0.92 (0.26, 1.00) | 2 × 10⁻⁷ (1 × 10⁻⁸, 5 × 10⁻⁶) | 4 × 10⁻⁹ (2 × 10⁻¹⁰, 9 × 10⁻⁸) |
| Farrow-to-finish | 0.92 (0.26, 1.00) | 2 × 10⁻⁷ (1 × 10⁻⁸, 5 × 10⁻⁶) | 4 × 10⁻⁹ (2 × 10⁻¹⁰, 9 × 10⁻⁸) |
| Veal calf | 0.73 (0.15, 1.00) | 2 × 10⁻⁷ (1 × 10⁻⁸, 5 × 10⁻⁶) | 4 × 10⁻⁹ (2 × 10⁻¹⁰, 9 × 10⁻⁸) |
| Broiler | Fattening Pig | Farrow-to-Finish | Veal Calf | Broiler Breeder | Breeding Pig | Total | |||
|---|---|---|---|---|---|---|---|---|---|
| Total number of farms in The Netherlands | 524 | 2652 | 260 | 1298 | 255 | 1601 | 6590 | ||
| Expected number | Farms exposed | 126 | 612 | 73 | 113 | 22 | 145 | 1091 | |
| Farms colonized | 122 | 460 | 40 | 87 | 14 | 86 | 810 | ||
| Probability per individual farm | Exposure | 0.24 | 0.23 | 0.28 | 0.09 | 0.09 | 0.09 | 0.17 | |
| Colonization | 0.23 | 0.17 | 0.16 | 0.07 | 0.05 | 0.05 | 0.13 | ||
| Probability of exposure due to | Feed | 0.229 | 0.228 | 0.196 | 0.059 | 0.051 | 0.067 | 0.148 | |
| Imported livestock | 0.004 | 3 × 10⁻⁴ | 0.002 | 0.025 | 0.004 | 0.001 | 0.007 | ||
| Returning traveler | 0.008 | 0.006 | 0.040 | 0.006 | 0.015 | 0.069 | 0.143 | ||
| Companion animal | 0.001 | 0.004 | 3 × 10⁻⁴ | 0.002 | 3 × 10⁻⁴ | 0.002 | 0.009 | ||
| Hospital patient | 1.8 × 10⁻⁴ | 0.001 | 2 × 10⁻⁴ | 4 × 10⁻⁴ | 8 × 10⁻⁵ | 5 × 10⁻⁴ | 0.003 |
| Scenario | CPE Source Affected | Parameter Changed | Baseline Number of Introductions from Affected Source (95% Range) | Changed Number of Introductions from Affected Source (95% Range) |
|---|---|---|---|---|
| Contamination of E. coli in feed reaches concentration of maximum rejection limit according to GMP+ | Feed | 767 (244, 1679) | 775 (246, 1668) | |
| The Netherlands only allows import of livestock from EU member states that sample ≥100 animals in CPE surveillance | Imported livestock | 48 (4, 214) | 14 (0, 58) | |
| Lower biosecurity: companion animals have full access to livestock areas in broiler, pig, and veal calf farms | Companion animals | 0 (0, 0) | 2 (1, 7) | |
| Lower biosecurity: non-compliance with hand hygiene | Travelers and hospitalized patients | 1 × 10⁻⁴ (9 × 10⁻⁶, 8 × 10⁻⁴) | 4 × 10⁻³ (3 × 10⁻⁴, 3 × 10⁻²) |
Publisher’s Note: MDPI stays neutral with regard to jurisdictional claims in published maps and institutional affiliations. |
© 2022 by the authors. Licensee MDPI, Basel, Switzerland. This article is an open access article distributed under the terms and conditions of the Creative Commons Attribution (CC BY) license (https://creativecommons.org/licenses/by/4.0/).
Share and Cite
Dankittipong, N.; Fischer, E.A.J.; Swanenburg, M.; Wagenaar, J.A.; Stegeman, A.J.; de Vos, C.J. Quantitative Risk Assessment for the Introduction of Carbapenem-Resistant Enterobacteriaceae (CPE) into Dutch Livestock Farms. Antibiotics 2022, 11, 281. https://doi.org/10.3390/antibiotics11020281
Dankittipong N, Fischer EAJ, Swanenburg M, Wagenaar JA, Stegeman AJ, de Vos CJ. Quantitative Risk Assessment for the Introduction of Carbapenem-Resistant Enterobacteriaceae (CPE) into Dutch Livestock Farms. Antibiotics. 2022; 11(2):281. https://doi.org/10.3390/antibiotics11020281
Chicago/Turabian StyleDankittipong, Natcha, Egil A. J. Fischer, Manon Swanenburg, Jaap A. Wagenaar, Arjan J. Stegeman, and Clazien J. de Vos. 2022. "Quantitative Risk Assessment for the Introduction of Carbapenem-Resistant Enterobacteriaceae (CPE) into Dutch Livestock Farms" Antibiotics 11, no. 2: 281. https://doi.org/10.3390/antibiotics11020281