Article

Potential Anticancer Lipoxygenase Inhibitors from the Red Sea-Derived Brown Algae Sargassum cinereum: An In-Silico-Supported In-Vitro Study

by
Sami I. Alzarea
1,†,
Abeer H. Elmaidomy
2,†,
Hani Saber
3,
Arafa Musa
4,5,
Mohammad M. Al-Sanea
6,
Ehab M. Mostafa
4,5,
Omnia Magdy Hendawy
1,7,
Khayrya A. Youssif
8,
Abdullah S. Alanazi
9,14,
Metab Alharbi
10,
Ahmed M. Sayed
11,* and
Usama Ramadan Abdelmohsen
12,13,*
1
Department of Pharmacology, College of Pharmacy, Jouf University, Sakaka 72341, Aljouf, Saudi Arabia
2
Department of Pharmacognosy, Faculty of Pharmacy, Beni-Suef University, Beni-Suef 62511, Egypt
3
Department of Botany and Microbiology, Faculty of Science, South Valley University, Qena 83523, Egypt
4
Department of Pharmacognosy, College of Pharmacy, Jouf University, Sakaka 72341, Saudi Arabia
5
Department of Pharmacognosy, Faculty of Pharmacy, Al-Azhar University, Cairo 11371, Egypt
6
Department of Pharmaceutical Chemistry, College of Pharmacy, Jouf University, Sakaka 72341, Saudi Arabia
7
Clinical Pharmacology Department, Faculty of Medicine, Beni-Suef University, Beni-Suef 62511, Egypt
8
Department of Pharmacognosy, Faculty of Pharmacy, Modern University for Technology and Information, Cairo 11371, Egypt
9
Department of Clinical Pharmacy, College of Pharmacy, Jouf University, Sakaka 72341, Aljouf, Saudi Arabia
10
Department of Pharmacology and Toxicology, College of Pharmacy, King Saud University, P.O. Box 2457, Riyadh 11451, Saudi Arabia
11
Department of Pharmacognosy, Faculty of Pharmacy, Nahda University, Beni-Suef 62513, Egypt
12
Department of Pharmacognosy, Faculty of Pharmacy, Minia University, Minia 61519, Egypt
13
Department of Pharmacognosy, Faculty of Pharmacy, Deraya University, 7 Universities Zone, New Minia 61111, Egypt
14
Health Sciences Research Unit, Jouf university, Sakaka 72341, Aljouf, Saudi Arabia
*
Authors to whom correspondence should be addressed.
These authors contributed equally to this work.
Antibiotics 2021, 10(4), 416; https://doi.org/10.3390/antibiotics10040416
Submission received: 27 March 2021 / Revised: 6 April 2021 / Accepted: 7 April 2021 / Published: 10 April 2021

Abstract

:
LC-MS-assisted metabolomic profiling of the Red Sea-derived brown algae Sargassum cinereum “Sargassaceae” dereplicated eleven compounds 111. Further phytochemical investigation afforded two new aryl cresol 1213, along with eight known compounds 1421. Both new metabolites, along with 19, showed moderate in vitro antiproliferative activity against HepG2, MCF-7, and Caco-2. Pharmacophore-based virtual screening suggested both 5-LOX and 15-LOX as the most probable target linked to their observed antiproliferative activity. The in vitro enzyme assays revealed 12 and 13 were able to inhibit 5-LOX more preferentially than 15-LOX, while 19 showed a convergent inhibitory activity toward both enzymes. Further in-depth in silico investigation revealed the molecular interactions inside both enzymes’ active sites and explained the varying inhibitory activity for 12 and 13 toward 5-LOX and 15-LOX.

1. Introduction

Worldwide, the macroalgal genus Sargassum C. Agardh (1820) includes over 537 species, as well as 426 infra-specific names [1]. At present, 361 of the species names have been flagged as accepted taxonomically based on the recorded literature under the species name [1]. Sargassum is a cosmopolitan brown algal genus inhabiting temperate subtropical and tropical marine environments, which is identified by non-filamentous thallus with a holdfast that arms to form many central axes [2]. They have specific leaves, receptacles, and vesicles, which are located on the axes near the leaves hold the algal structure upright when submerged [3].
Sargassum species are a nutritious and valuable source of bioactive compounds like vitamins, carotenoids, dietary fibers, proteins, and minerals [4]. Additionally, many biologically active compounds, such as terpenoids, flavonoids, sterols, sulfated polysaccharides, polyphenols, sargaquinoic acids, sargachromenol, pheophytin, were separated from different Sargassum species [4]. These isolated compounds exhibit distinct biological activities like analgesic, anti-inflammatory, antioxidant, neuroprotective, antimicrobial, antitumor, fibrinolytic, immune-modulatory, anti-coagulant, hepatoprotective, antiviral activity. Therefore, Sargassum species have considerable potential to be utilized in pharmaceutical and nutraceutical industries [4,5].
According to the literature, eicosanoids were formed from arachidonic acid (AA) oxidation cascade, which has been linked to pathogenesis for a number of human diseases, including cancer. Nowadays, there is enough evidence supporting their significant role in tumorigenesis and metastases [6,7,8,9].
Although most consideration has focused on prostaglandins (PGs) and another cyclooxygenase (COX)-derived metabolites. There is a growing evidence suggests that lipoxygenases (LOXs)-catalyzed products, such as leukotrienes (LTs), also have profound biological effects on the progression of human cancers [6,7,8,9].
LOXs are a family of non-heme iron-containing enzymes; that catalyze the oxygenation of polyunsaturated fatty acids [9]. Several previous reports on the relationship between LOXs and cancer development support a critical role for 5-lipoxygenase (5-LOX) and 15-lipoxygenase (15-LOX) during the initial stages of prostate breast, colorectal, liver and pancreatic carcinogenesis [6,7,8]. Consequently, using LOXs inhibitors has been shown a vital effect on suppressing the growth of these tumor cells [6,7,8].
In the present study, metabolomic profiling and phytochemical investigation of S. cinereum were carried out using liquid chromatography high-resolution mass spectrometry (LC–HRESIMS). Subsequently, unreported hits were isolated along with other major components. The antiproliferative activity of the isolated compounds was tested in vitro against breast Michigan Cancer Foundation-7 (MCF-7), hepatic G2 (HepG2), and colorectal adenocarcinoma-2 (Caco-2) cancer cell lines. Since LOXs have a role in the viability of tumor cells [6,8], A number of isolated compounds were assayed for their 5-LOX and 15-LOX inhibitory activities depending on a prior pharmacophore-based virtual screening. Docking and dynamic studies were conducted to determine the interactions of these compounds inside the enzymes’ active sites.

2. Results and Discussion

2.1. Chemical Dereplication of S. cinereum

Metabolomic profiling of S. cinereum alcoholic crude extract, dereplicated eleven compounds, using LC–HRESIMS. The identified metabolites 111 belonged to different chemical classes, including tetrahydrofuran, hydroquinone, plastoquinone, sterols, meroditerpenoids, and sulfoglycolipid ( Figure 1, Table S1, Figures S1 and S2).
Analysis of S. cinereum crude extract led to a putative identification of several hits (Figure 1). The molecular ion mass peaks at m/z 215.1283 and 277.2162 [M − H]+, for the predicted molecular formulas C11H20O4 and C18H30O2 gave hits of (5R,7S,8S)-communiol A 1, and hedaol A 2, respectively, that were previously isolated from Sargassum spp [10,11]. The mass ion peaks at m/z 307.2624 and 343.2276 correspond to the suggested molecular formulas C20H34O2, and C22H30O3 [M+H]+ fit a fatty acid, and hydroquinone anti-inflammatory derivative compound arachidonic acid 3, and sargachromanol A 4, that was previously isolated from Sargassum pallidum, and Sargassum siliquastrum, respectively [12,13]. The ion mass peaks at m/z 395.2950, 425.3420, 427.3576, and 487.3060 [M + H]+ for the predicted molecular formulas C27H38O2, C29H44O2, C29H46O2, and C29H42O6 gave hits of the antiviral plastoquinones 2-geranylgeranyl-6-methylbenzoquinone 5, which was isolated from Sargassum micracanthum [14], the anticancer steroidal nucleus of 24-ethylcholesta-4,24(28)-dien-3,6-dione 6, saringosterone 7, which were isolated from Sargassum carpophyllum, and Sargassum asperfolium, respectively [15,16], and the antioxidant meroditerpenoids of nahocol A 8, which were isolated from Sargassum siliquastrum [17]. Two major ion peaks with the m/z values of 445.3682 and 459.2749 [M + H]+ with molecular formulas C29H48O3 and C27H38O6 were detected and dereplicated as 24xi-hydroperoxy-24-vinylcholesterol 9 and sargathunbergol A 10, respectively, which were isolated earlier from Sargassum carpophyllum, and Sargassum thunbergii, respectively [15,18].
In addition, the mass ion peaks at m/z 553.2681 [M − H]+, for the predicted molecular formula C25H46O11S was dereplicated sulfoglycolipid derivative 1-O-(11-Hexadecenoyl)-3-O-(6′-sulfo-α-d-quinovopyranosyl) glycerol 11, which was previously detected in Sargassum hemiphyllum (Figure 1) [19].

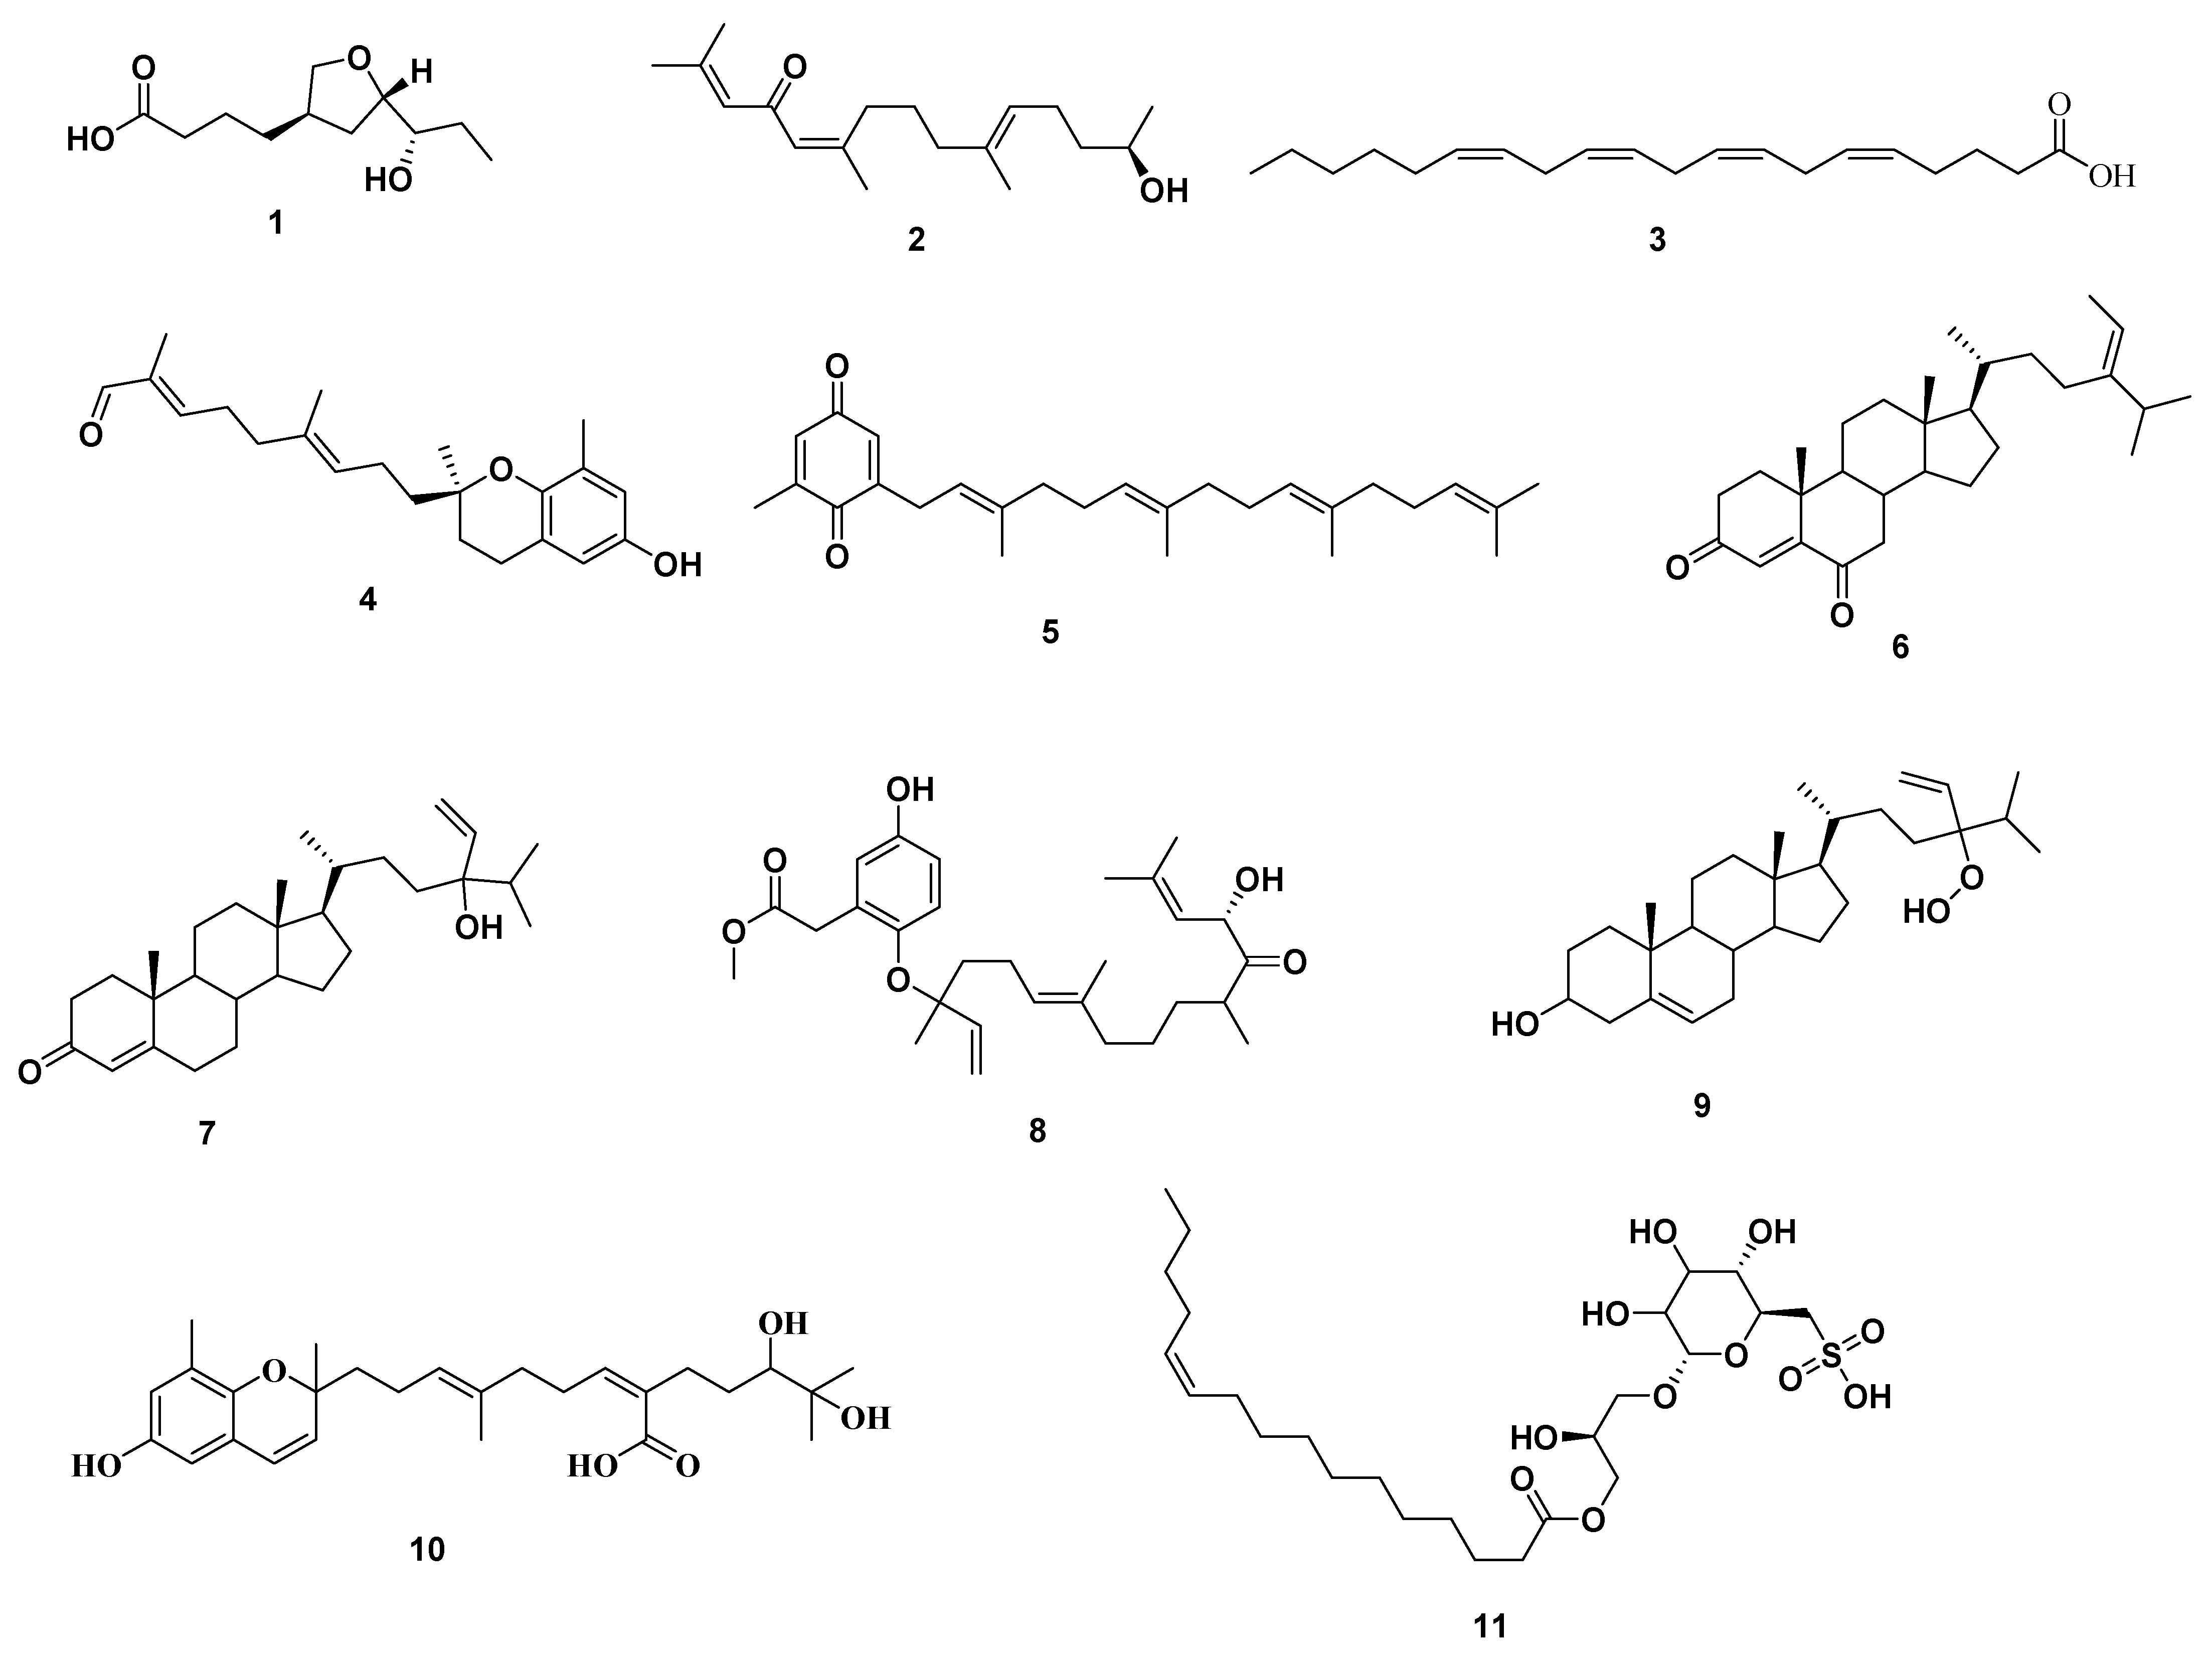
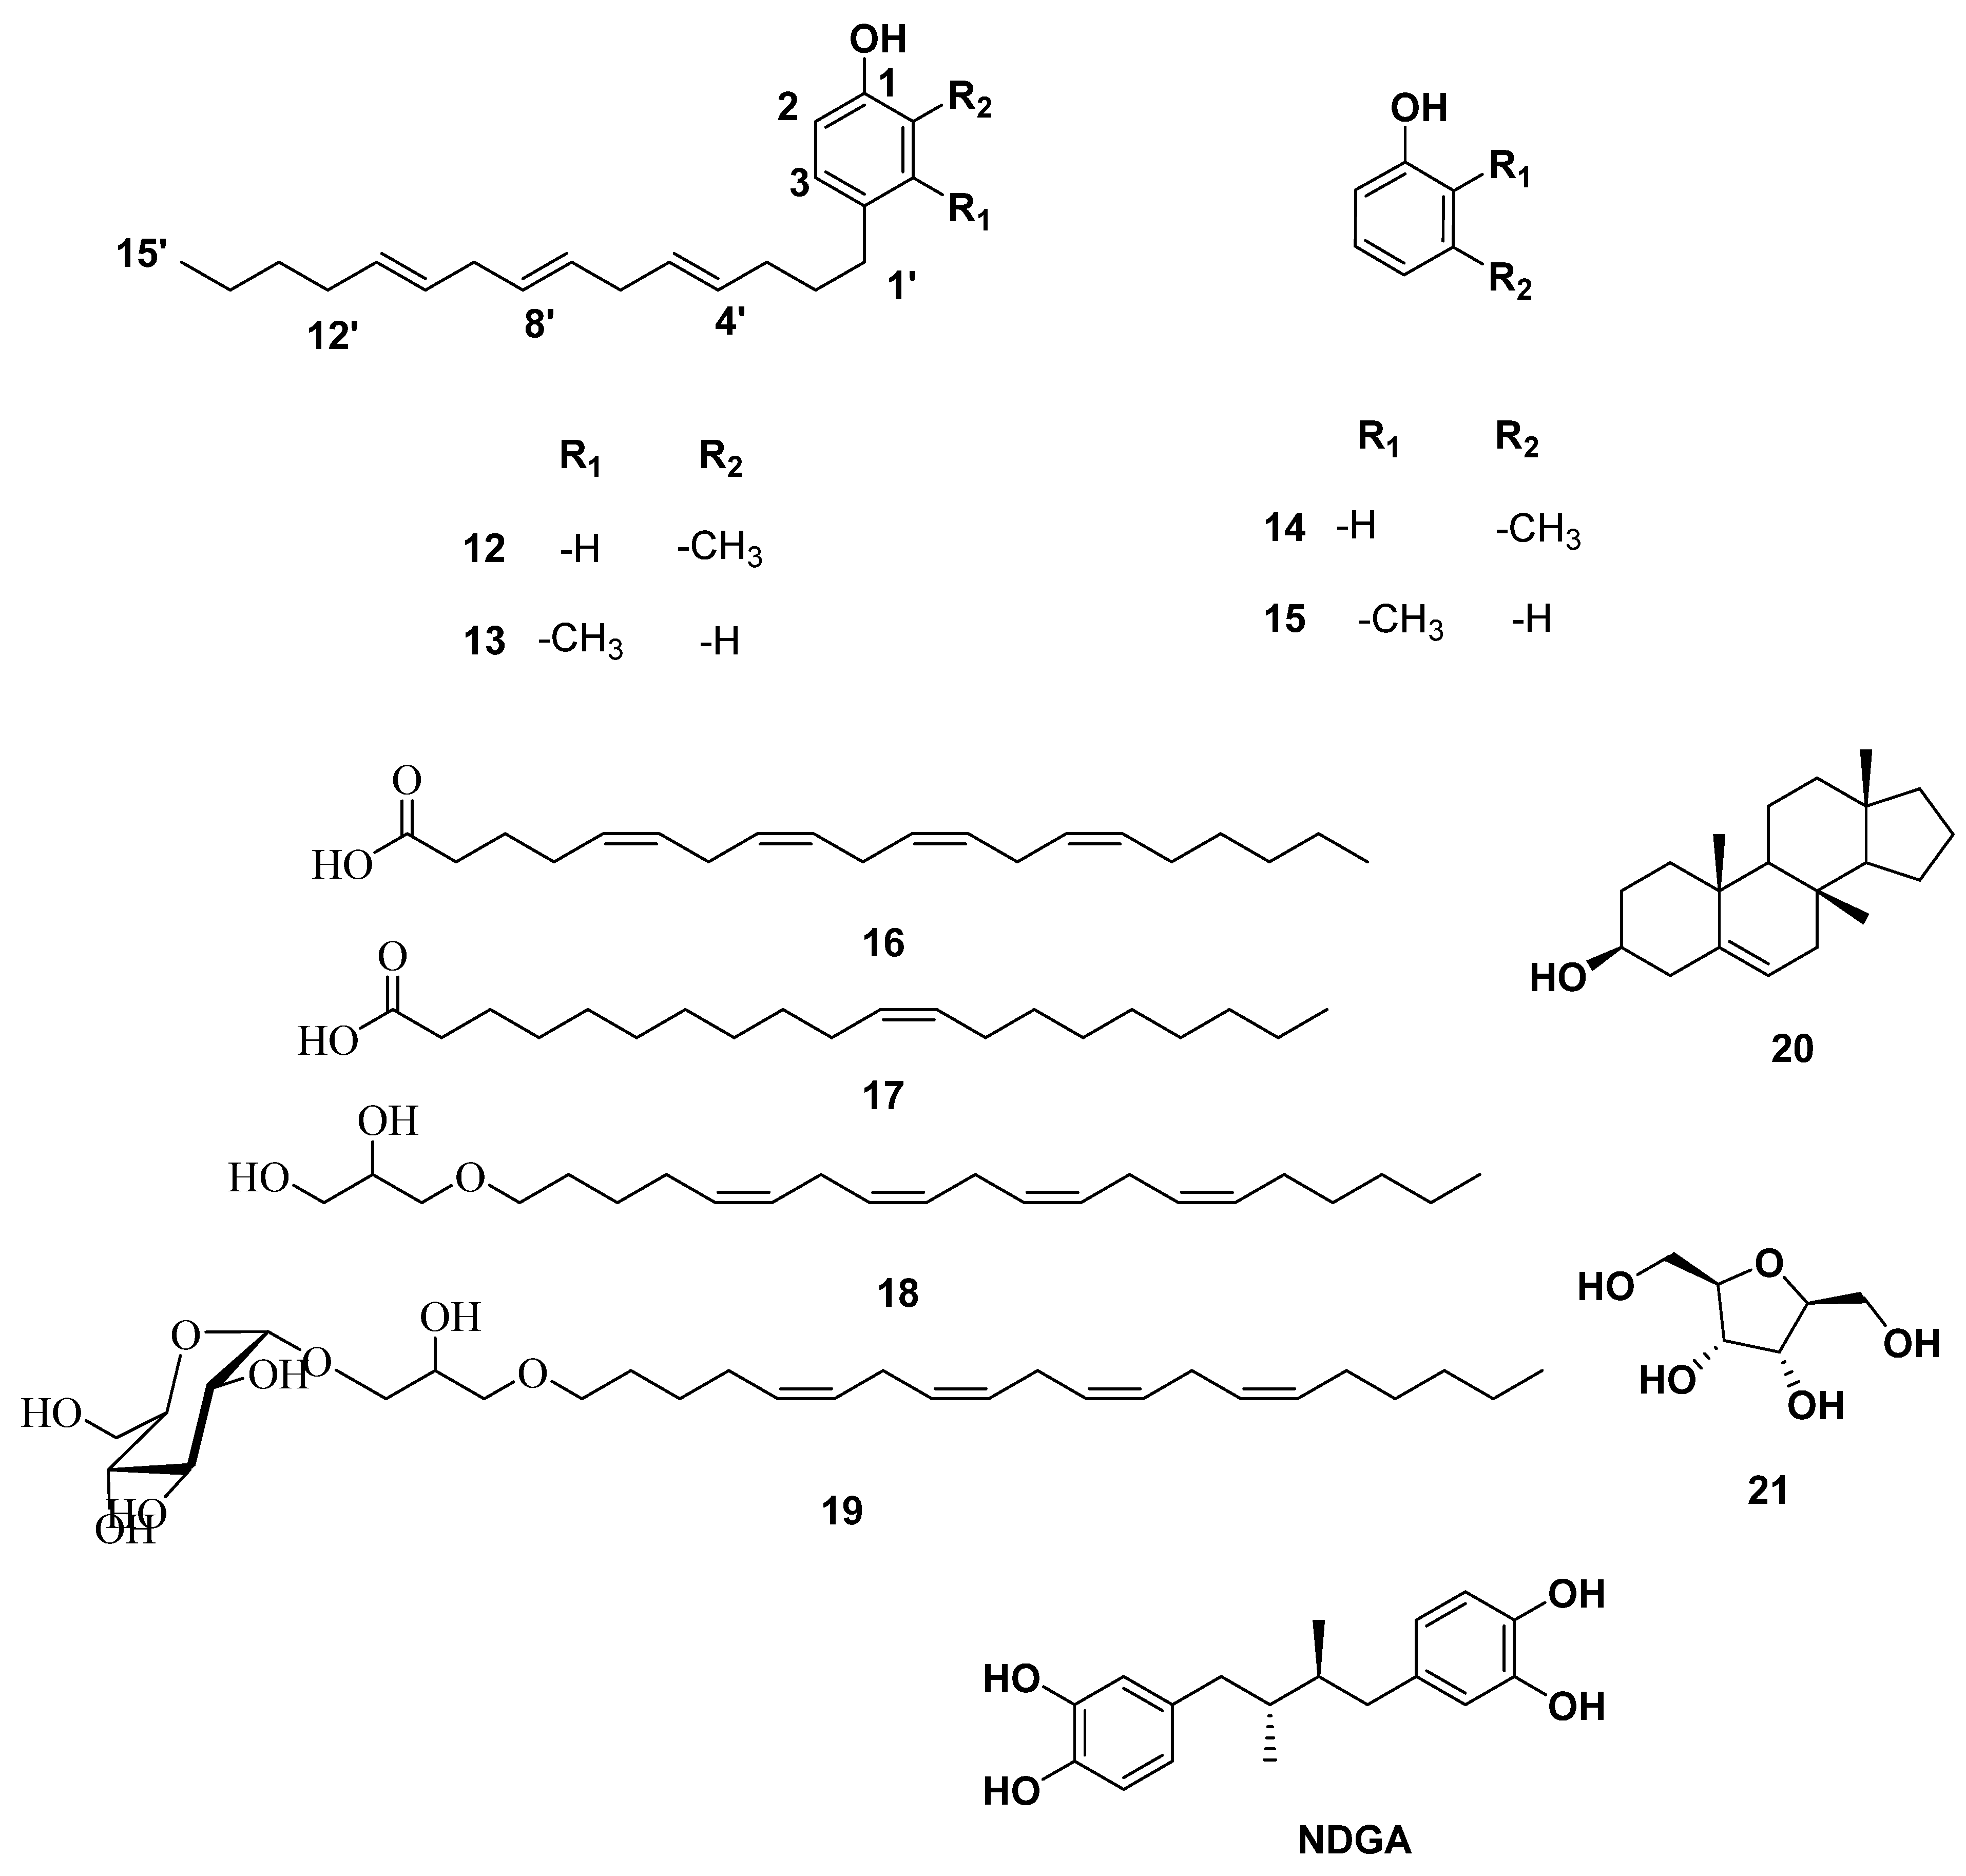
2.2. Phytochemical Investigation of S. cinereum

Based on the physicochemical and chromatographic properties, the spectral analyses from UV, 1H, and DEPT-Q NMR, as well as comparisons with the literature and some authentic samples, the crude alcoholic extract of S. cinereum afforded the new aryl cresol 1213, along with the known O-cresol 14 [20], m-cresol 15 [21]. Additionally, arachidonic acid 16 [22], eicosenoic acid 17 [22], 1-O-arachidonyl-glycerol 18 [23], 1-O-arachidonyl-3-O-(α-d-glucopyranosyl) glycerol 19 [23], 7-β-methyl androstenol 20 [24], and 1-deoxy-β-d-psicosofuranose 21 [25], were identified (Figure 2). All characterized compounds 14 and 15 were isolated herein for the first time from the genus Sargassum (Figure 2, Figures S3–S28).
Analysis of the HRESIMS, 1D and 2D NMR data of compounds 1213 suggested a possible plastoquinones core scaffold [11]. The HRESIMS data for compound 12 showed an adduct pseudo molecular ion peak at m/z 314.2607 [M + H]+ (calc. for C22H34O, 314.2604), suggesting 7 degrees of unsaturation. The 1H and DEPT-Q 13C NMR data (Table 1 and Figures S3 and S4), along with the heteronuclear single quantum correlation experiment (HSQC) data (Figure S5), suggested six characteristic resonances appeared: three aromatic methine groups at δH 6.68 (1H, s) δC 116.0, δH 6.98 (1H, d, J = 8.0 δC 123.6, δH 7.13 (1H,d, J = 8.0) δC 123.1, three quaternary carbons at δC 153.8, 140.6, and 134.5, and one methyl group at δH 1.34 (1H, s) δC 29.8, suggesting the characteristic core structure for a tri-substituted benzene unit [11].
NMR data also showed eight aliphatic methylene groups at δH 1.20–2.8 δC 20.5–33.7 (Table 1), three olefinic methine groups at δH 5.31–5.35 (6H, m) δC 127.9–129.4. These signals are suggestive characteristics for 4,7,11-pentadecenyl moiety, where the heteronuclear multiple-bond correlation (HMBC) experiment of 12 (Figure 3) confirmed the position of the three olefinic methine groups at 4,7,11 of the alkene side-chain. Moreover, the HMBC experiment showed the 3 J-HMBC correlation of the proton H-1′ δH 2.26 (δC 33.4) with the quaternary carbonyl carbon C-4′ (δC 134.5). Accordingly, compound 12 was identified as 4-(1-(4,7,11-pentadecenyl)-o-cresol.
The molecular formula of compound 13 was identical to that of 12 based on HRESIMS (C22H34O). The 1H and 13C NMR data was also very close to those of compound 12 for the 4,7,11-pentadecenyl moiety but differed in the resonated chemical shifts of the aromatic attached methyl group of the core tri-substituted benzene unit (Table 1). Comparing the DEPT-Q 13C NMR data of compound 13 with those of 12 showed a downfield shifting of carbons C-7 (ΔδC + 2.1), compared with those of compound 12 (Table 1). This suggested a positional difference of the location of the aromatic attached methyl group in the tri-substituted benzene unit versus 12 (Table 1 and Supplementary File 1(Figure S2 and S8–S12)). The assignment of the location of the aromatic attached methyl group in 13 was aided by the HMBC experiment. A 3 J-HMBC correlation (Figure 4) of compound 13 proton H-7 δH 1.23 (δC 31.9) with the quaternary carbonyl carbon C-4 (δC 134.5) and a 4 J-HMBC correlation of the proton H-7 δH 1.23 (δC 31.9) with the methylene carbon C-1′ (δC 33.7) confirmed the meta-location of an aromatic attached methyl group at the cresol moiety. Accordingly, compound 13 was identified as 4-(1-(4,7,11-pentadecenyl)-m-cresol.

2.3. Antiproliferative Activity of the Isolated Metabolites

The isolated compounds 1221 were in vitro screened for their antiproliferative activity against hepatic, breast, and colorectal carcinoma cell lines (HepG2, MCF-7, and Caco-2, respectively) using the sulforhodamine B (SRB) assay. Results showed that compounds 12, 13, and 19 were able to inhibit the growth of all tested cell lines moderately with IC50 values ranged from 11.2 ± 0.6 to 21.6 ± 1.3 µM (Table 2).

2.4. Virtual Screening-based Target Identification

Characterization of the biological target for a certain molecule is a true challenge. However, the continuous development of in silico tools, including molecular modeling and virtual screening, has significantly improved the success rate of finding suitable molecular targets. Many online target identification platforms are currently available, and their search protocols are either structural-based or ligand-based. PharmMapper is one of these online platforms that can screen and suggest the most probable protein targets of a query molecule based on its pharmacophore model [26]. The basic principle of pharmacophore-based screening is that the binding of certain molecules with their protein targets is mainly determined by key pharmacophore maps (i.e., spatial arrangement of structural features). Thus, molecules that shapes are able to fit with these pharmacophore maps have the highest probability to bind the same protein target. Consequently, PharmMapper was used to propose a proper protein target for compounds 12, 13 and 19. 5-LOX and 15-LOX were found to be the top-scoring hits for these metabolites. As discussed in the introduction, these enzymes have been shown a direct link to the development of many cancers, e.g., breast, colorectal, liver, skin cancers [6,7,8,27,28,29,30]. Herein, compounds 12, 13 and 19 showed considerable inhibitory activity towards the human breast, colorectal, and liver cancer cell lines, and hence, they were selected for further in vitro and in silico validations against 5-LOX and 15-LOX.

2.5. LOX Inhibition Assay

To validate the preliminary virtual screening prediction, compounds 12, 13 and 19 were assayed for their 5-LOX and 15-LOX inhibitory activities. Interestingly the three compounds achieved potent enzyme inhibition toward 5-LOX (IC50 1.3 ± 0.1 to 2.1 ± 0.4 µM, Table 3). However, their activity against 15-LOX was weaker, particularly compounds 12 and 13 (IC50 25.3 ± 0.4 and 23.6 ± 0.3 µM, respectively) that were more selective for 5-LOX (Table 3).
Moreover, they showed inhibitory constants (Ki) ranged from 0.7 ± 0.2 to 17.4 ± 0.2 µM (Table 3), and these values were most agree with the competitive inhibition of both enzymes [31].
The results of enzyme inhibition assay were also correlated with those of the antiproliferative ones for HepG2 and MCF-7, and Caco-2. Overexpression of 5-LOX has been reported in breast, liver and colorectal cancers [27,28,29]. Furthermore, 15-LOX has been reported to be overexpressed in a number of tumors like prostate and breast cancers. Hence, these enzymes can be considered promising targets for cancer therapy.

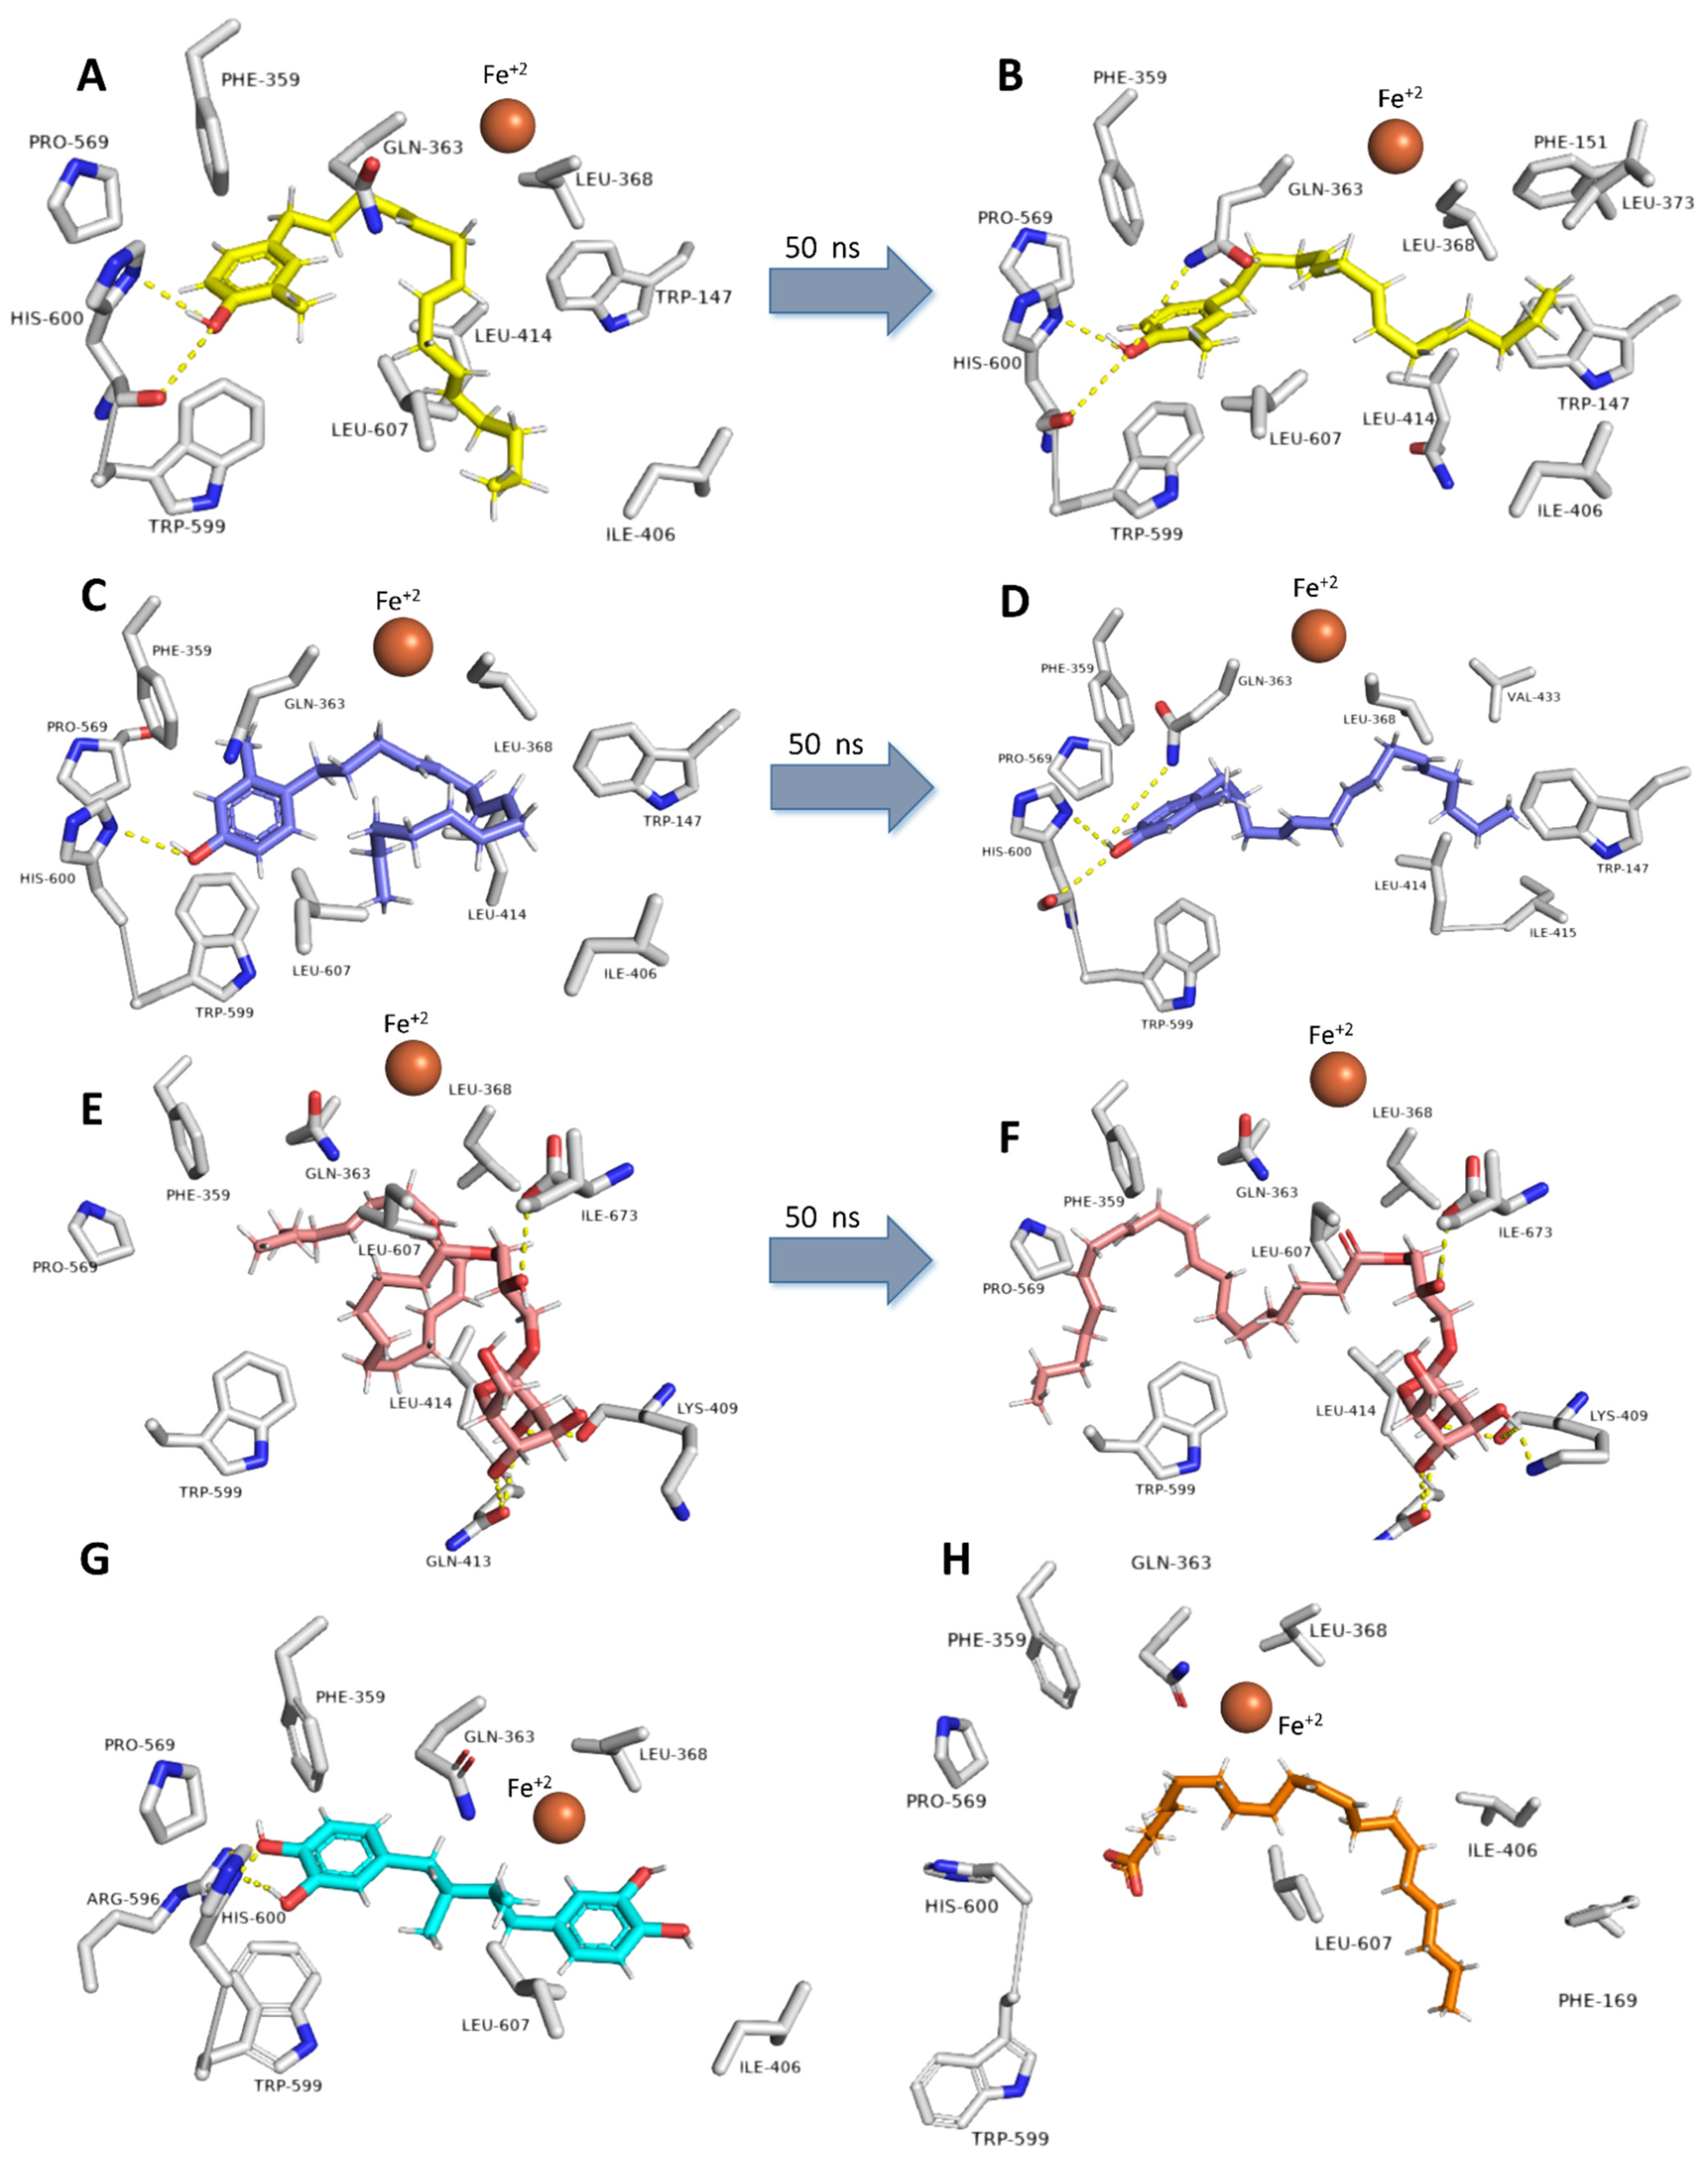
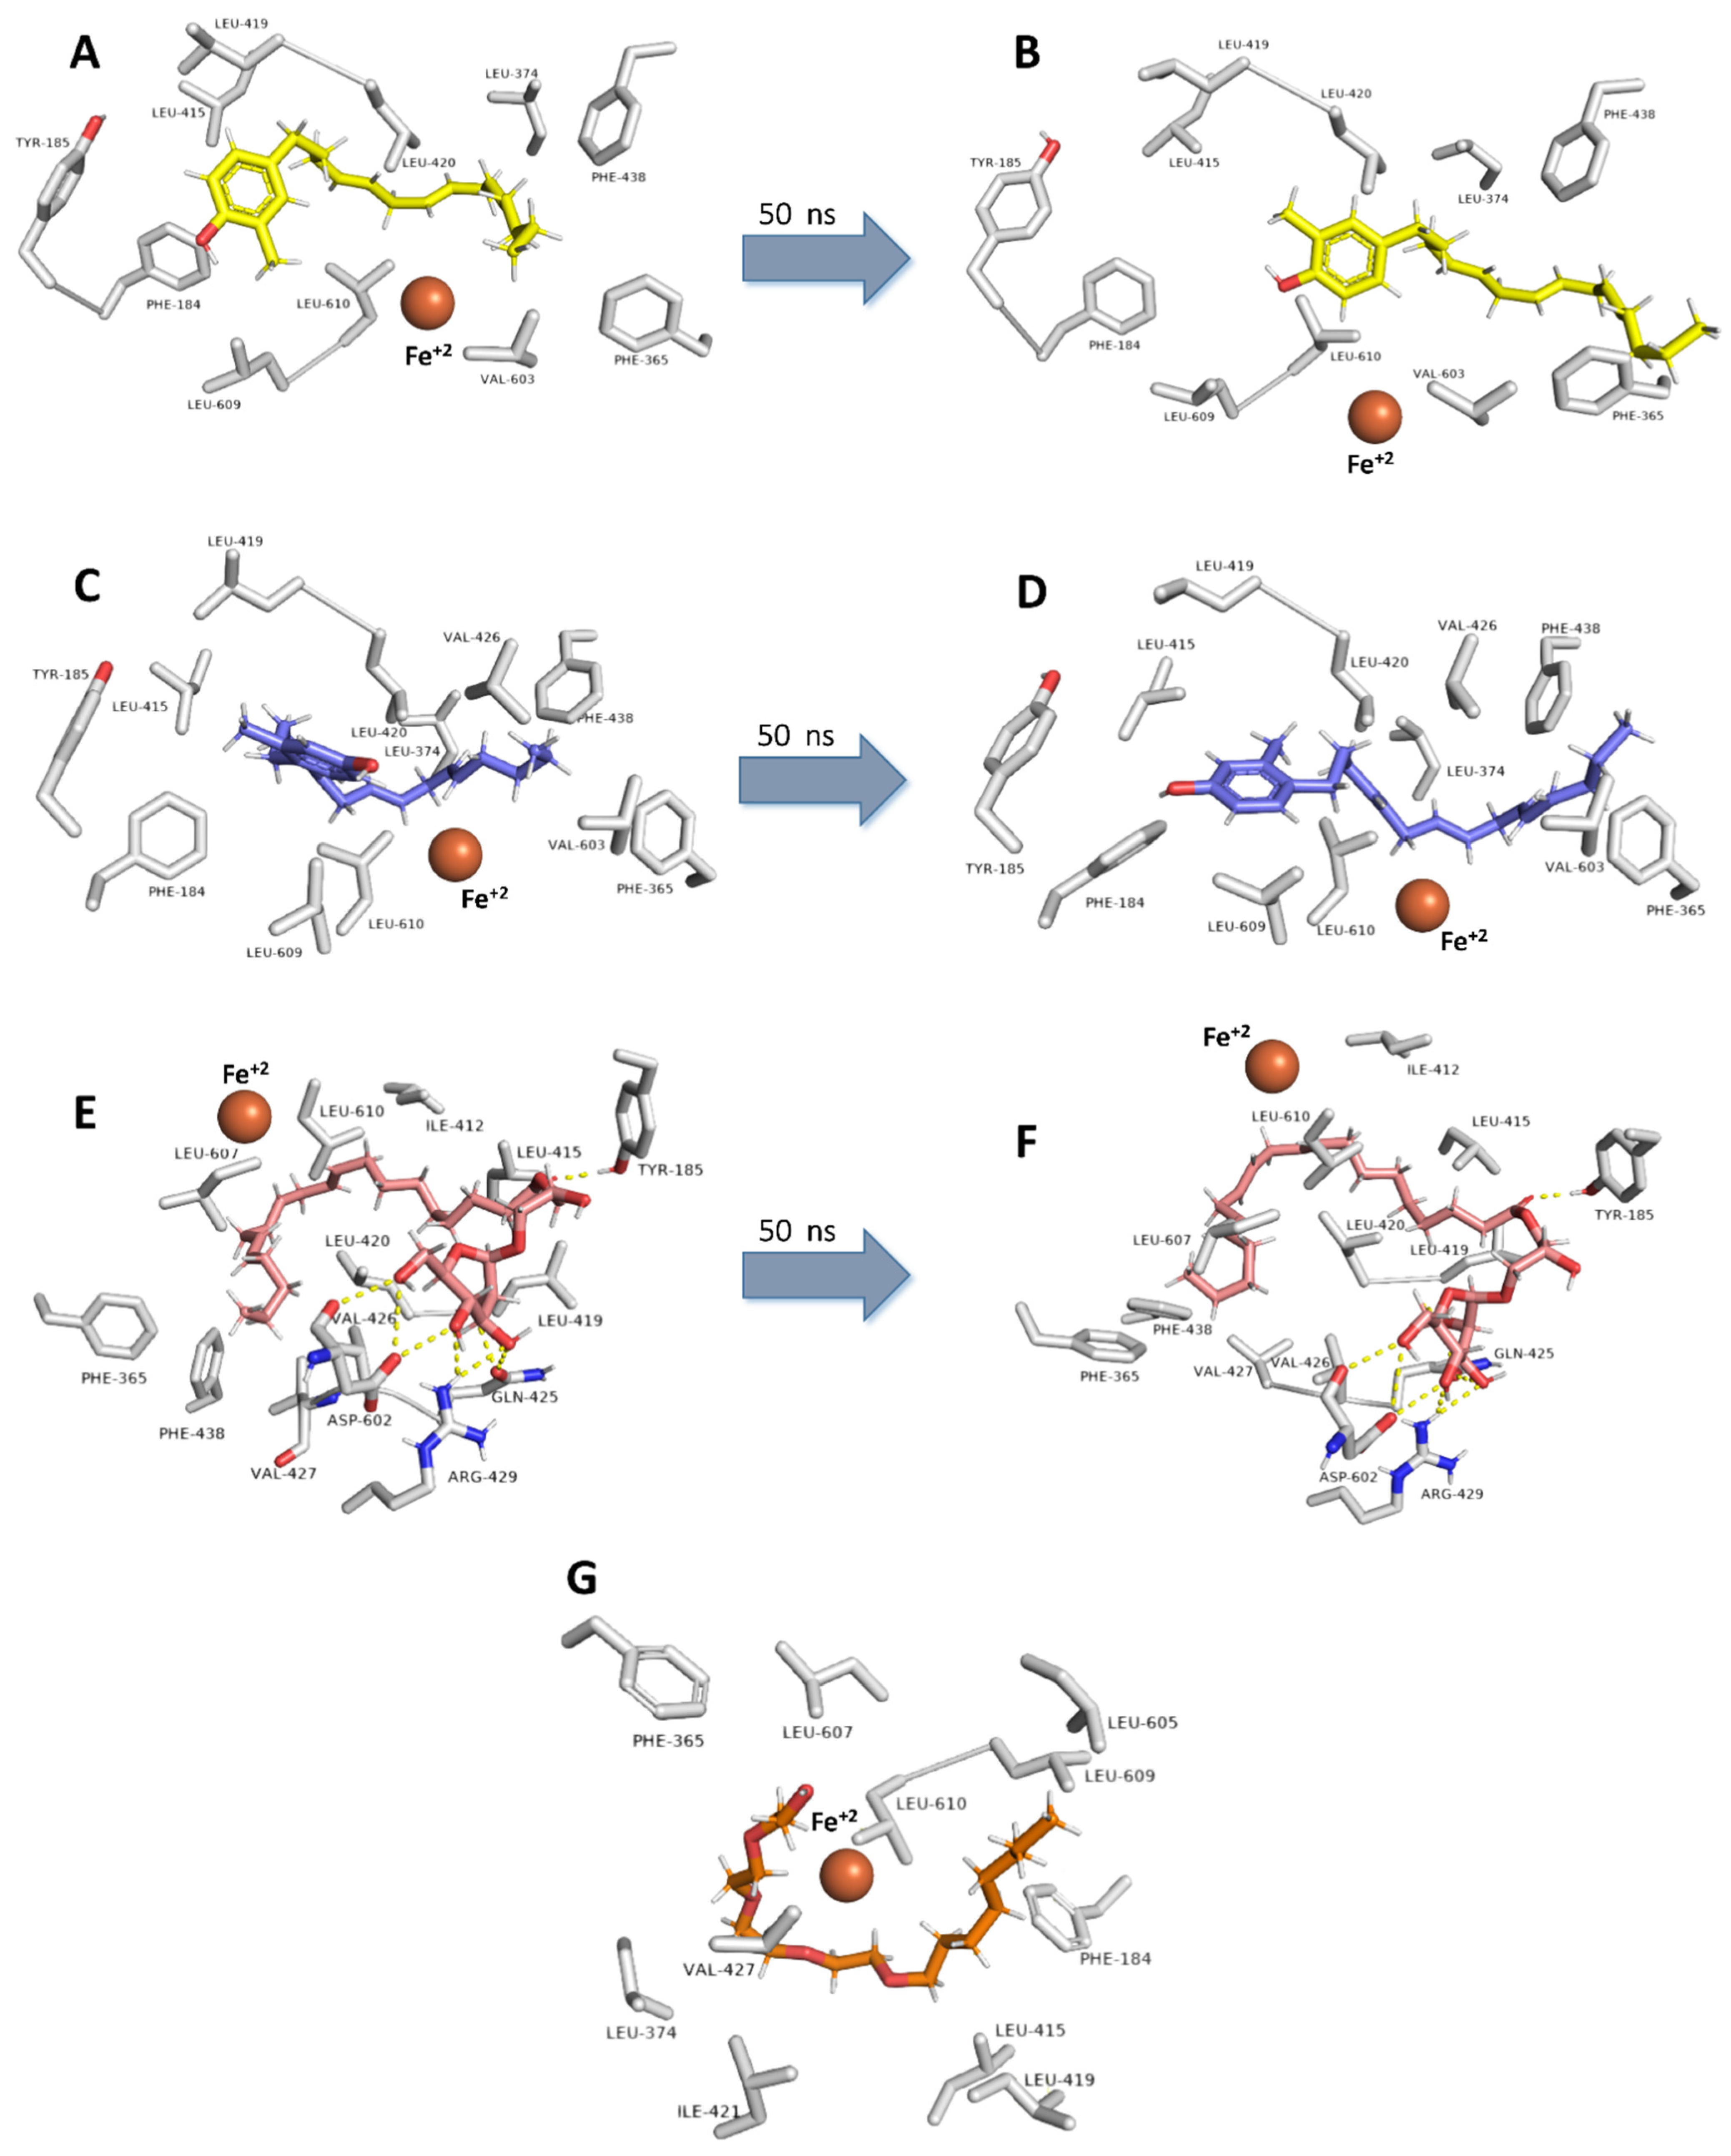
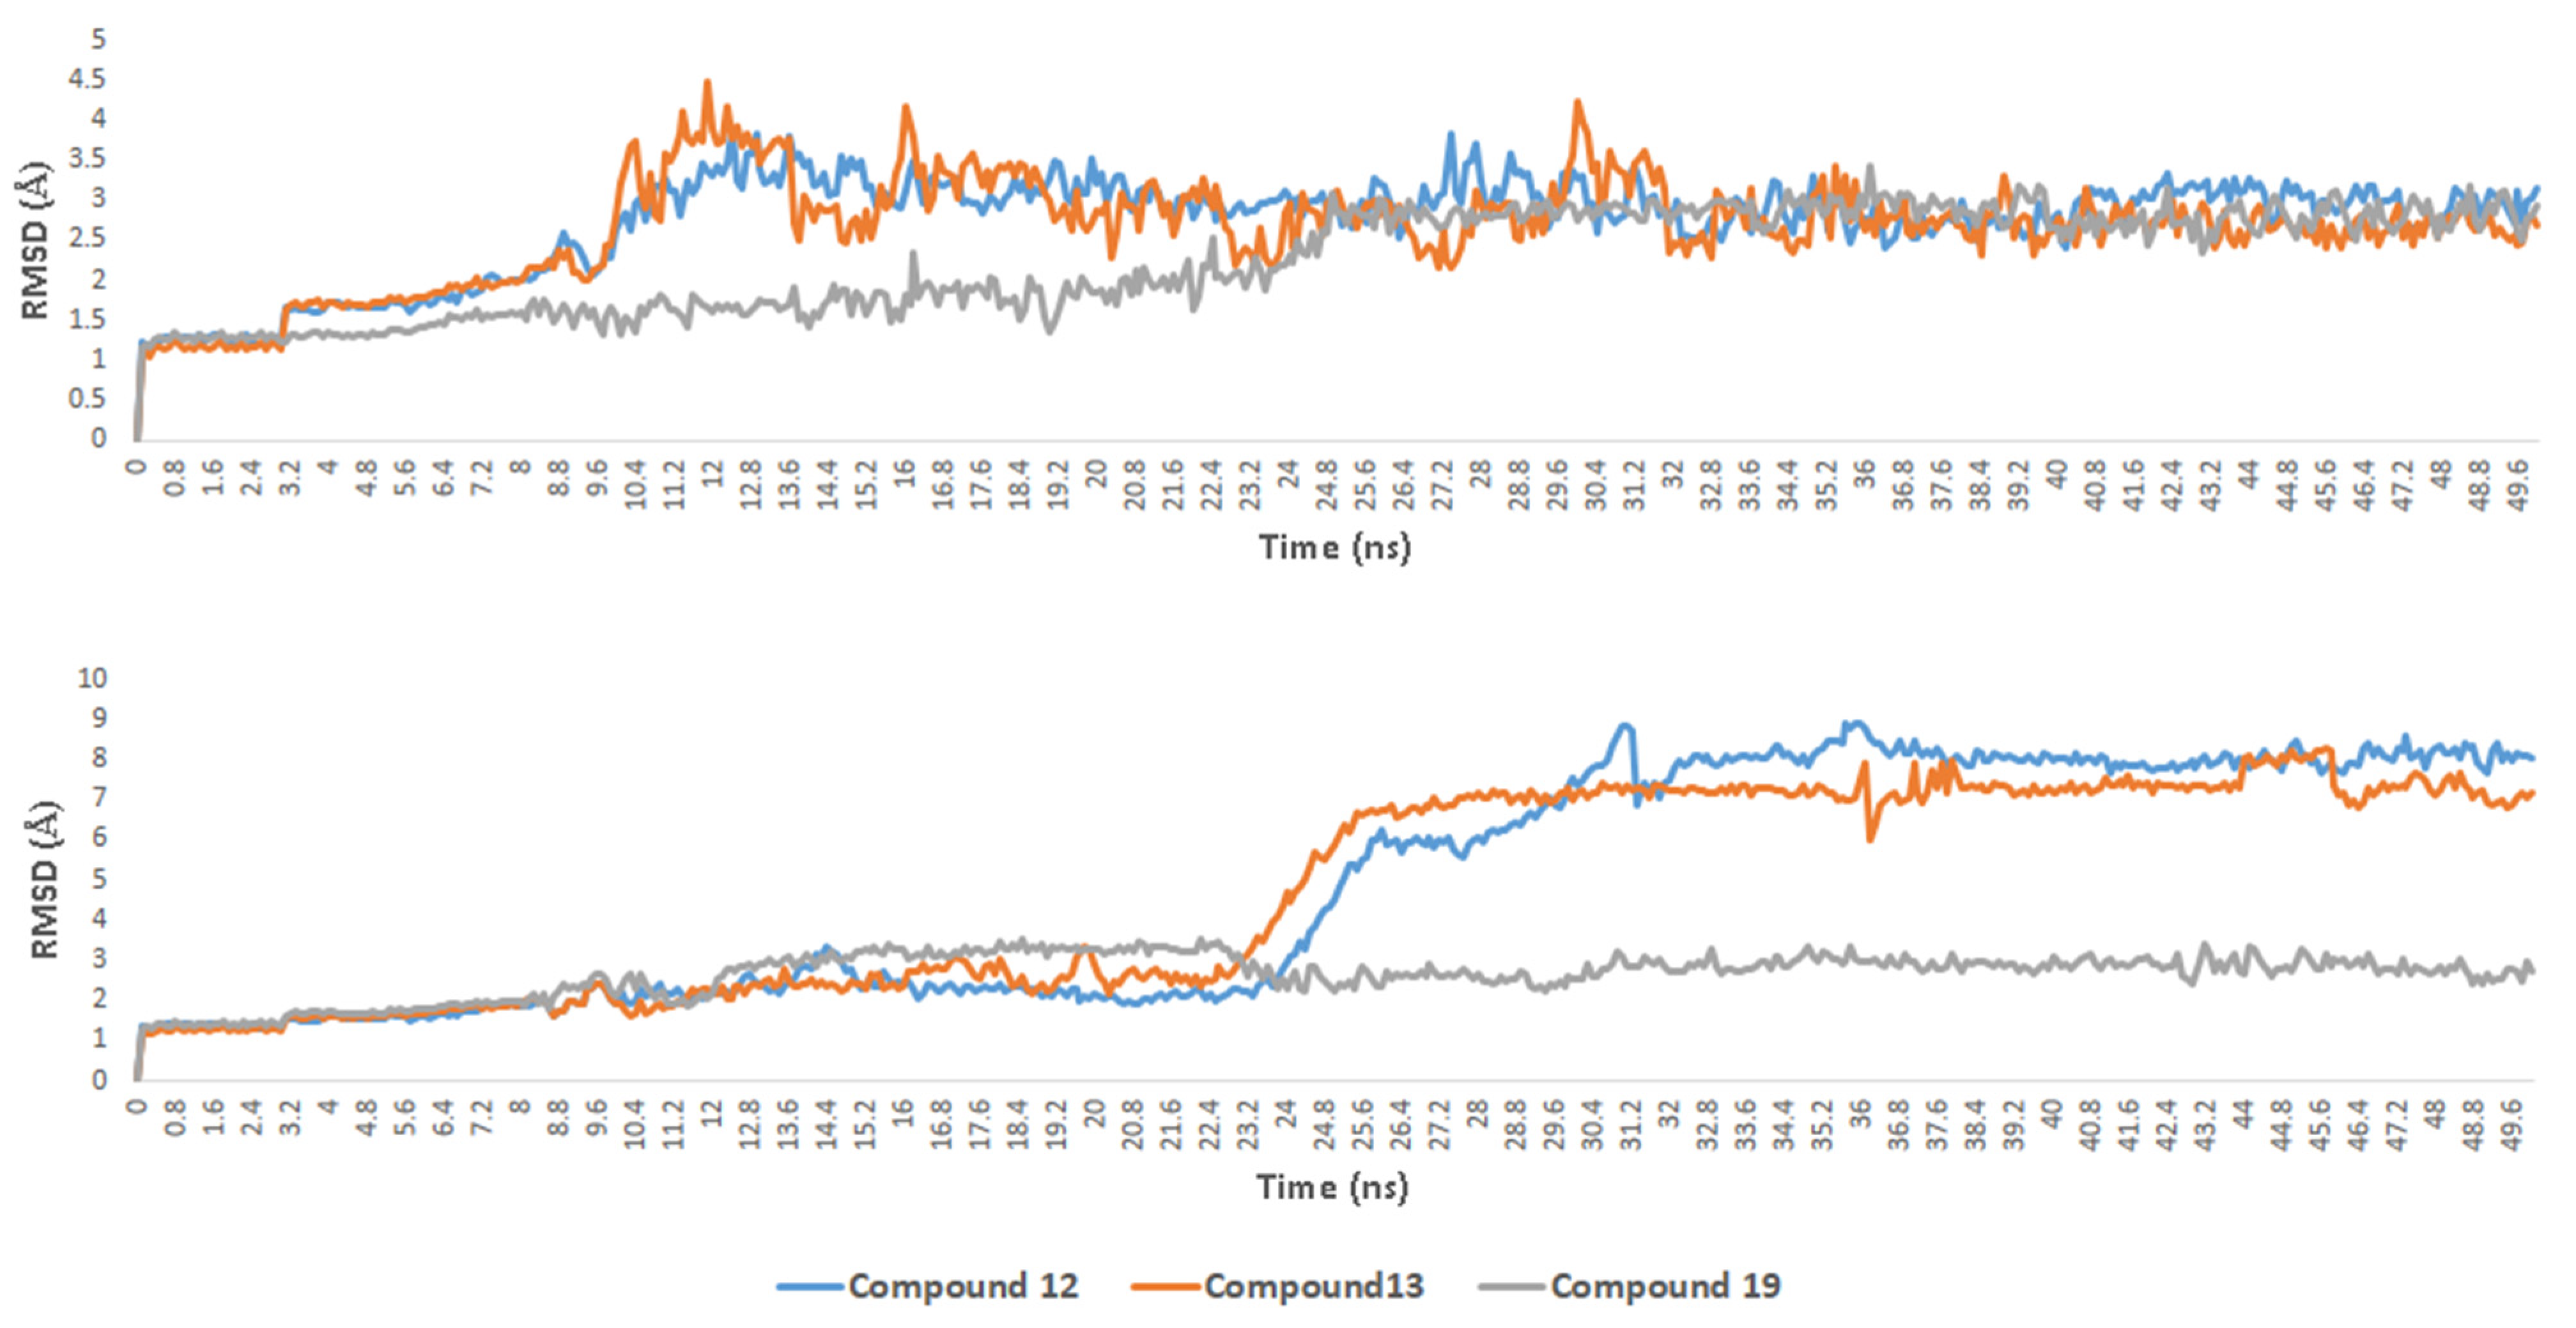
2.6. Molecular Docking and Dynamic Simulation

5-LOX has a hydrophobic active site [9] that harbors a catalytic iron (Fe+2), and such hydrophobicity is essential to allow efficient binding with the hydrophobic substrate arachidonic acid (AA) (Figure 2) [9]. Compounds 12, 13, and 19 have extended unsaturated hydrophobic side chains that resemble AA (Figure 5).
Molecular docking experiments revealed that these compounds could bind with the 5-LOX’s active site efficiently, with binding scores ranged from −8.9 to −9.3 kcal/mol (Figure 5), and their bindings were even better than the co-crystalized ligands (Table 3). Additionally, the phenolic moiety of both compounds was involved in H-bonding with HIS-600, similarly to the co-crystallized redox-type inhibitor, nordihydroguaiaretic acid (NDGA) (Figure 5).
Compounds 12 and 13s hydrophobic side chains were able to adapt themselves inside the hydrophobic U-shaped active site, where they took convergent orientations but slightly different from that of AA (Figure 5). LEU-368, ILE-406, LEU-414, and LEU-607 were the main amino acid residues involved in the hydrophobic interactions with their side chains, while PHE-359, TRP-599, and PRO-569 interacted with their aromatic moieties. The binding mode of compound 19 was quite different, where its polar carbohydrate head interacted with LYS-409, GLN-413, and ILE-673 through four strong hydrogen bonds (<2.5 Å), while it is hydrophobic tail interacted with LEU-368, LEU-414, TRP-599, and LEU-607 (Figure 5). Subsequent molecular dynamic simulation (MDS) experiments (50 ns) revealed that the three compounds 12, 13, and 19 were able to stabilize the enzyme’s active site.
Compounds 12 and 13s positions remained to change over the first 32.4 ns (RMSD~3.4 Å). Afterward, they became stable till the end of the simulation (average RMSD values of 2.67 and 2.59 Å, respectively), where their extended hydrocarbon chains became more relaxed and straight (Figure 6). The H-bonds between their phenolic group and HIS-600 remained unchanged throughout the MDS. Starting from 22.6 ns, GLN-363’s side-chain became also involved in H-bonding with the phenolic group of both compounds (Figure 6). Additionally, compound 12 s tail remained imbedded inside a hydrophobic pocket consists of the side chains of TRP-147, PHE-151, LEU-368, LEU-373, and LEU-414, while compound 13 s tail settled inside another hydrophobic pocket consists of TRP-147, LEU-414, ILE-415, and VAL-433 (Figure 6).
Similarly, the hydrophobic part of compound 19 was compacted at the beginning of MDS and gradually become more extended till stabilization at 25.4ns (RMSD = 2.75 Å), where PHE-359, PRO-569, and TRP-599 became involved in hydrophobic interactions with the molecule’s tail. Furthermore, the side-chain of LYS-409 became involved in an additional H-bonding with the molecule’s hydrophilic carbohydrate part (Figure 6). Further binding free energy calculations (ΔGFEP and ΔGKDEEP) revealed that compounds 12, 13, and 19 got higher binding free energy values than that of the co-crystalized ligands (Figure 7) and were in good accordance with the in vitro enzyme inhibition (Figure 7).
On the other hand, docking scores of the three compounds against 15-LOX were significantly lower, particularly for compounds 12 and 13 (Figure 7) that showed only hydrophobic interactions (with PHE-184, TYR-185, PHE-365, LEU-374, LEU-415, LEU-419, LEU-420, VAL-603, LEU-609, and LEU-610) inside the enzyme’s active site. Upon MDS (Figure 7), both compounds showed unstable positioning inside the 15-LOX active site, where the surrounding hydrophobic amino acid residues were able to keep them in position till ~23.4 ns (RMSD~3.5 Å). Afterward, their position inside the active site began to change dramatically, and their RMSDs reached reach about 7.1 Å and remained to fluctuate till the end of MDS with gross averages of 8.1 and 7.5 Å, respectively, over the 50ns of simulation. This obvious instability of compounds 12 and 13 reflected on their binding free energies and in vitro inhibitory activities that were significantly lower than 5-LOX (Figure 7).
Such instability was not the case with compound 19, where the hydrophilic carbohydrate moiety was able to form a network of H-bonds (7 H-bonds) with TYR-185, GLN-425, ARG-429, and ASP-602. Furthermore, these hydrophilic interactions remained unchanged over the course of MDS, and thus compound 20 s RMSD was at equilibrium (~2.6 Å) to the end of MDS. Such structural and dynamic information can explain the convergent inhibitory activity of compound 19 against both 5-LOX and 15-LOX (Figure 7) and the moderate selective inhibition of 5-LOX by compounds 12 and 13 over 15-LOX.

3. Materials and Methods

3.1. Algae Material

The marine algae S. cinereum was collected during January 2020 along the shore of the Red Sea in Hurghada, Egypt. The samples were collected in sterilized polyethylene bags and kept in an icebox for transportation to the laboratory. Samples were washed thoroughly with sterile distilled water to remove any associated debris. A voucher specimen (2020-BuPD 55) was deposited at the Department of Pharmacognosy, Faculty of Pharmacy, Beni-Suef University, Egypt.

3.2. Chemicals and Reagents

The solvents used in this work included n-hexane (n-hex., boiling point b.p. 60–80 °C), dichloromethane (DCM), ethyl acetate (EtOAc), n-butanol (n-but.), and methanol (MeOH) were purchased from El-Nasr Company for Pharmaceuticals and Chemicals (Egypt). High-performance liquid chromatography (HPLC) and deuterated solvents used for chromatographic and spectroscopic analyses were purchased from Sigma-Aldrich (Saint Louis, MO, USA), including HPLC–methanol, HPLC–water, HPLC–acetonitrile, deuterium oxide (D2O), methanol (CD3OD), and dimethyl sulfoxide (DMSO-d6). Column chromatography (CC) was performed using silica gel 60 (63–200 μm, E. Merck, Sigma-Aldrich), and Sephadex LH-20 (0.25–0.1 mm, GE Healthcare, Sigma-Aldrich, Steinheim, Germany), while silica gel GF254 for thin-layer chromatography (TLC) (El-Nasr Company for Pharmaceuticals and Chemicals, Egypt) was employed for vacuum liquid chromatography (VLC). Thin-layer chromatography (TLC) was carried out using precoated silica gel 60 GF254 plates (E. Merck, Darmstadt, Germany; 20 × 20 cm, 0.25 mm in thickness). Spots were visualized by spraying with para-anisaldehyde (PAA) reagent (85:5:10:0.5 absolute EtOH:sulfuric acid:G.A.A.:para-anisaldehyde), followed by heating at 110 °C [32]. For the biological study, doxorubicin (Sigma-Aldrich, Germany) was used as a positive control, while the HepG2, MCF-7, and Caco-2 cancer cell lines were obtained from the American Type Culture Collection (ATCC, Rockville, MD, USA; HPACC, Salisbury, UK) and were routinely subcultured twice per week.

3.3. Spectral Analyses

Proton 1H and distortionless enhancement by polarization transfer-Q (DEPT-Q) 13C NMR spectra were recorded at 400 and 100 MHz, respectively. Tetramethylsilane (TMS) was used as an internal standard in deuterium oxide (D2O), methanol (CD3OD), and dimethyl sulfoxide (DMSO-d6), using the residual solvent peak (δH = 4.78), (δH = 3.34, 4.78 and δC = 49.9) and (δH = 2.50 and δC = 39.5) as references, respectively. Measurements were performed on a Bruker Advance III 400 MHz with BBFO Smart Probe and a Bruker 400 MHz EON nitrogen-free magnet (Bruker AG, Billerica, MA, USA). Carbon multiplicities were determined using a DEPT-Q experiment. The ultraviolet radiation (UV) spectrum in methanol was obtained using a Shimadzu UV 2401PC spectrophotometer (Shimadzu Corporation—UV-2401PC/UV-2501PC, Kyoto, Japan). Infrared (IR) spectra were measured using a Jasco FTIR 300E infrared spectrophotometer. HRESIMS data were obtained using an Acquity ultra-performance liquid chromatography system coupled to a Synapt G2 HDMS quadrupole time-of-flight hybrid mass spectrometer (Waters, Milford, MA, USA). HPLC chromatographic separations were conducted using an Agilent 1260 Infinity preparative pump (G1361A), Agilent 1260 diode array detector VL (G1315 D), Agilent 1260 Infinity Thermostand column compartment (G1361 A), Agilent 1260 Infinity preparative autosampler (G2260A) and a YMC-Pack ODS-A A-324 column (i.d. 10 × 300 mm, YMC, Kyoto, Japan).

3.4. Extraction and Fractionation of Algae Material

Sargassum cinereum (0.5 kg) was collected and air-dried in the shade for one month. After drying, the brown algae were finely powdered using an OC-60B/60B grinding machine (60–120 mesh, Henan, China). The finely powdered algae extracted by maceration using 70% methanol (3 L, 3×, seven days each) at room temperature, and concentrated under vacuum at 45 °C using a rotary evaporator (Buchi Rotavapor R-300, Cole-Parmer, Vernon Hills, IL, USA) to afford 75 g crude extract. The dry extract was suspended in 100 mL distilled water (H2O) and successively portioned with solvents of different polarities (n-Hex., DCM, EtOAc, and n-but.). The organic phase in each step separately evaporated under reduced pressure to afford the corresponding fractions I (8.0 g), II (1.5 g), III (1.5 g) and IV (3.0 g), respectively, while the remaining mother liquor was then concentrated down to give the aqueous fraction (V). All resulting fractions were kept at 4 °C for biological and phytochemical investigations.

3.5. Metabolomic Analysis Procedure

The crude methanolic extract from S. cinereum was prepared at 1 mg/mL for mass spectrometry analysis. The recovered methanolic extract was subjected to metabolic analysis using LC-HRESIMS according to Abdelmohsen et al. 2014 [33]. An Acquity ultra-performance liquid chromatography system connected to a Synapt G2 HDMS quadrupole time-of-flight hybrid mass spectrometer (Waters, Milford, M.A. USA) was used. Positive and negative ESI ionization modes were utilized to carry out the high-resolution mass spectrometry coupled with a spray voltage at 4.5 kV, the capillary temperature at 320 °C, and mass range from m/z 150–1500. The MS dataset was processed, and data were extracted using MZmine 2.20 based on the established parameters [22]. Mass ion peaks were detected and accompanied by chromatogram builder and chromatogram deconvolution. The local minimum search algorithm was addressed, and isotopes were also distinguished via the isotopic peaks of grouper. Missing peaks were displayed using the gap-filling peak finder. An adduct search along with a complex search was carried out. The processed data set was next subjected to molecular formula prediction and peak identification. The positive and negative ionization mode data sets from the respective extract were dereplicated against the Dictionary of Natural Products (DNP) databases.

3.6. Isolation and Purification of Major Compounds

Fraction I (8 g) was subjected to normal VLC fractionation using silica gel GF254 (column 6 × 30 cm, 50 g). Elution was performed using n-hex.:EtOAc gradient mixtures in order of increasing polarities (0, 5, 10, 15, 20, 25, 30, 35, 40, 45, 50, 60, 80 and 100%, 500 mL each). The effluents from the column were collected in fractions (100 mL each), and each collected fraction was concentrated and monitored by TLC using the system n-hex.:EtOAc 8:2 and PAA reagent. Similar fractions were grouped and concentrated under reduced pressure to provide three subfractions (I1–I3). Subfraction II2 (3.0 g) was further fractionated on silica gel 60 (100 × 1 cm, 50 g). Elution was performed using n-hex.:EtOAc gradient mixtures in the order of increasing polarities (0, 1, 2, 3, 4, 5, 6, 7, 8, 9 and 10%, 1 L each, FR 3 mL min−1), to afford four sub-subfractions (II2-1–II2-4). Sub-subfraction II2-1 (50 mg) was further fractionated on silica gel 60 (100 × 1 cm, 20 g). Elution was performed using n-hex.:EtOAc isocratic mixture (1%, 500 mL, FR 3 mL min−1) to afford compound 17 (20 mg). Sub-subfractions II2-2, and II2-4 (70, 30 mg each) was further fractionated on C-18 RP-HPLC using H2O-CH3CN (10–60%, 30 min, 5 mL/min) to afford compound 12 (20 mg), 13 (10 mg), 14 (10 mg), 15 (7 mg). Sub-subfraction II2-3 (100 mg) was further fractionated on silica gel 60 (100 × 1 cm, 20 g). Elution was performed using n-hex.:EtOAc isocratic mixture (5%, 500 mL, FR 3 mL min−1) to afford compound 16 (50 mg). Finally, subfraction II3 was further fractionated on silica gel 60 (100 × 1 cm, 20 g). Elution was performed using n-hex.:EtOAc isocratic mixture (1%, 500 mL, FR 3 mL min−1) to afford compound 20 (30 mg). Fraction II (1.5 g) was subjected to normal VLC fractionation on a silica gel (column 6 × 30 cm, 50 g). Elution was performed using DCM:MeOH gradient mixtures in the order of increasing polarities (0, 5, 10, 15, 20, 25, 30, 35, 40, 45, 50, 60, 80 and 100%, 1 L each). The effluents were collected in fractions (100 mL each); each fraction was concentrated and monitored by TLC using the system DCM:MeOH 9.5:0.5 and PAA reagent. Similar fractions were grouped and concentrated under reduced pressure to provide two subfractions (II1–II2), which were further purified on a Sephadex LH20 column (0.25–0.1 mm, 100 × 0.5 cm, 100 g), which eluted with MeOH to afford compound 18 (16 mg), and 19 (6 mg), separately.
Crystallization of fractions IV was performed separately using CH2CL2 and afforded compounds 21 (2 g).
4-(1-(4,7,11-pentadecenyl)-o-cresol (12): Yellow oil; [UV (MeOH) λmax (logε) 225 (5.5), 260 (6.0), 300 (4.5) nm; IR υmax (KBr) 3429, 3100, 3000, 1680, 1600, 1475, 1450, 1300, 835, 601 cm−1; NMR data; see Table 1; HRESIMS m/z 314.2607 [M + H]+ (calc. for C22H34O, 314.2604).
4-(1-(4,7,11-pentadecenyl)-m-cresol (13): Yellow oil; UV (MeOH) λmax (logε) 225 (5.5), 260 (6.0), 300 (4.5) nm; IR υmax (KBr) 3429, 3100, 3000, 1680, 1600, 1475, 1450, 1300, 835, 601 cm−1; NMR data; see Table 1; HRESIMS m/z 314.2609 [M + H]+ (calc. for C22H34O, 314.2604).

3.7. Antiproliferative Assay

The antiproliferative activity of the isolated compounds 1221 was measured by the sulforhodamine B (SRB) assay as described by Skehan et al. 1990 [34], and Vichai and Kirtikara 2006 [35], on the breast (MCF-7), liver (HepG2) and colorectal (Caco-2) cancer cell lines. Cells were seeded in 96-well microtiter plates at an initial concentration of 3 × 10³ cell/well in 150 µL, fresh medium and left for 24 h to attach to the plates. Different concentrations 0, 5, 12.5, 25, 50 µg/mL of the respective compound were added. The plates were incubated for 48 h. The cells were fixed with 50μL cold trichloroacetic acid (10% final concentration) for 1 h at 4 °C. The plates were washed with distilled water (automatic washer Tecan, Neustadt, Germany) and stained with 50 μL 0.4% SRB dissolved in 1% acetic acid for 30 min., at room temperature. Then they were washed with 1% acetic acid and air-dried. The dye was solubilized with 100 μL/well of 10 M Tris base (pH 10.5). The optical density of each well was measured spectrophotometrically at 570 nm using an ELISA microplate reader (Sunrise Tecan reader, Neustadt, Germany). Doxorubicin was used as a positive control. The mean background absorbances were automatically subtracted, and the mean values of each drug concentration were calculated. The experiment was repeated three times, and then the IC50 values were calculated.

3.8. Lipoxygenase (LOX) Inhibition Assay

The ability of the isolated compounds 12, 13, and 19 to inhibit 5-LOX and 15-LOX enzymes (IC50 and Ki values, µM) was determined using human recombinant enzyme assay kits (catalog no 60,402 and 10011263, Cayman Chemical, Ann Arbor, MI, USA) following manufacturer’s specifications [36]. Stock solutions were freshly prepared before use, and buffer solution (0.1 M Tris-HCl, PH, 7.4) was used. 10 µL of each compound were prepared, dissolved in the least amount of DMSO and diluted with the stock solution to be in concentrations of (0.001, 0.1, 1, 5, 10 µM) in a final volume of 210 mL. The kinetic parameters for both 5-LOX and 15-LOX were determined by measuring the increase in absorbance at 238 nm in an Agilent 8453 diode array spectrophotometer (Agilent Technologies, Santa Clara, CA, USA). Substrate concentration was ranged from 5 to 50 µM. Substrate concentrations (5, 10, 20, 30, 40, 50 µM) were monitored in triplicate for each sample [37]. Doxorubicin was used as a positive control.

3.9. Docking Study

The crystal structures of both 5-LOX and 15-LOX (PDB: 6N2W and 4NRE) were used for the docking analysis using an AutoDock Vina docking machine [38]. The co-crystallized ligands nordihydroguaiaretic acid (NDGA) and AA were used to determine the binding sites. The ligand to binding site shape matching root means square (RMSD) threshold was set to 2.0 Å. The interaction energies were determined using the Charmm force field (v.1.02) with 10.0 Å as a non-bonded cutoff distance and distance-dependent dielectric. Then, 5.0 Å was set as an energy grid extending from the binding site [39]. The tested compounds were energy minimized inside the selected binding pocket. The editing and visualization of the generated binding poses were performed using Pymol software [40].

3.10. Molecular Dynamic Simulation

Molecular dynamic simulations (MDS) for ligand enzyme complexes were performed according to the previous protocol [41], using the Nanoscale Molecular Dynamics (NAMD) 2.6 software [42], applying the CHARMM27 force field [43]. Hydrogen atoms were added to the protein structures using the psfgen plugin included in the Visual Molecular Dynamic (VMD) 1.9 software [44]. Afterward, the whole system was solvated using TIP3P water particles and 0.15 M NaCl. The energy of the generated systems was first minimized and gradually heated to 300 K and equilibrated for 200/s. Subsequently, the MDS was continued for 20 ns, and the trajectory was stored every 0.1 ns and further analyzed with the VMD 1.9 software. The MDS output was sampled every 0.1 ns to evaluate the conformational changes of the entire system to analyze the root mean square deviation (RMSD) and root mean square fluctuation (RMSF). The topologies and parameters of the tested compounds were prepared using the VMD force field toolkit (ffTK) and the online software ligand reader and modeler (http://www.charmm-gui.org/?doc=input/ligandrm, accessed on 15 January 2021) [45]. MDS-derived binding free energies (ΔG) were calculated using the free energy perturbation (FEP) method through the web-based software Absolute Ligand Binder along with MDS using NAMD software [45,46]. Moreover, ΔG was calculated using another web-based software utilizing neural networking in its calculations, namely KDEEP (https://www.playmolecule.org/Kdeep/, accessed on 16 January 2021) [47].

3.11. Statistical Analysis

All in vitro experiments were performed in triplicate. Pooled data were presented as the mean ± standard error of the mean (SEM) of at least three independent experiments. The differences among various treatment groups were determined by ANOVA, followed by Dunnett’s test using PASW Statistics® version 18 (Quarry Bay, Hong Kong). A difference of p < 0.05 was considered statistically significant and shown by a *symbol. The IC50 values were determined using a nonlinear regression curve fitting analysis using GraphPad Prism software version 6 (La Jolla, CA, USA).

4. Conclusions

Phytochemical investigation of the brown algae S. cinereum with the guidance of LC–HRESIMS dereplication afforded two new phenolic derivatives 12 and 13, along with the known 19, which exhibited moderate in vitro antiproliferative activity against HepG2, MCF-7, and Caco-2 cancer cell lines and considerable selective inhibition toward 5-LOX over 15-LOX. A series of in silico experiments (docking, MDS, and binding free energy calculations) were carried out to explore the mode of interaction of these compounds inside the active site of each enzyme. The present study shows the potential of marine natural products in providing unique metabolites with potent biological activities and highlighted the power of in silico investigations to facilitate drug discovery and development processes.

Supplementary Materials

The following are available online. Table S1: Dereplicated metabolites from LC-HRESIMS analysis of Sarragassum cinnerum; Figure S1: LC-HRESIMS Chromatogram of the dereplicated metabolites of Sarragassum cinnerum (positive); Figure S2: LC-HRESIMS Chromatogram of the dereplicated metabolites of Sarragassum cinnerum (negative); Figure S3: 1H NMR spectrum of compound 12 measured in DMSO-d6 at 400 MHz; Figure S4: DEPT-Q NMR spectrum of compound 12 measured in DMSO-d6 at 100 MHz; Figure S5: HSQC spectrum of compound 12 measured in DMSO-d6; Figure S6: HMBC spectrum of compound 12 measured in DMSO-d6; Figure S7: HRESIMS spectrum of compound 12; Figure S8: 1H NMR spectrum of compound 13 measured in DMSO-d6 at 400 MHz; Figure S9: DEPT-Q NMR spectrum of compound 13 measured in DMSO-d6 at 100 MHz; Figure S10: HSQC spectrum of compound 13 measured in DMSO-d6; Figure S11: HMBC spectrum of compound 13 measured in DMSO-d6; Figure S12: HRESIMS spectrum of compound 13; Figure S13: 1H NMR spectrum of compound 14 measured in DMSO-d6 at 400 MHz; Figure S14: DEPT-Q NMR spectrum of compound 14 measured in DMSO-d6 at 100 MHz; Figure S15: 1H NMR spectrum of compound 15 measured in DMSO-d6 at 400 MHz; Figure S16: DEPT-Q NMR spectrum of compound 15 measured in DMSO-d6 at 100 MHz; Figure S17: 1H NMR spectrum of compound 16 measured in DMSO-d6 at 400 MHz; Figure S18: DEPT-Q NMR spectrum of compound 16 measured in DMSO-d6 at 100 MHz; Figure S19: 1H NMR spectrum of compound 17 measured in DMSO-d6 at 400 MHz; Figure S20: DEPT-Q NMR spectrum of compound 17 measured in DMSO-d6 at 100 MHz; Figure S21: 1H NMR spectrum of compound 18 measured in CD3OD-d4 at 400 MHz; Figure S22: DEPT-Q NMR spectrum of compound 18 measured in CD3OD-d6 at 100 MHz; Figure S23: 1H NMR spectrum of compound 19 measured in CD3OD-d4 at 400 MHz; Figure S24: DEPT-Q NMR spectrum of compound 19 measured in CD3OD-d6 at 100 MHz; Figure S25: 1H NMR spectrum of compound 20 measured in DMSO-d6 at 400 MHz; Figure S26: DEPT-Q NMR spectrum of compound 20 measured in DMSO-d6 at 100 MHz; Figure S27: 1H NMR spectrum of compound 21 measured in D2O at 400 MHz; Figure S28: DEPT-Q NMR spectrum of compound 21 measured in D2O at 100 MHz.

Author Contributions

Conceptualization: U.R.A., A.H.E., A.M.S.; methodology: A.H.E., U.R.A., S.I.A., A.M.S.; software: A.H.E., U.R.A., A.M.S., S.I.A., O.M.H., A.M.; formal analysis: A.H.E., U.R.A., S.I.A., A.M.S., MA, E.M.M., O.M.H.; investigation: A.H.E., U.R.A., S.I.A., A.M.S., H.S., K.A.Y.; resources: A.H.E., U.R.A., S.I.A., A.M.S., A.S.A.; data curation: A.H.E., U.R.A., S.I.A., A.M.S., A.M.S.; writing—original draft: A.H.E., A.M.S., U.R.A.; writing—review and editing: U.R.A., A.H.E., S.I.A., A.M.S., H.S., A.M., M.A., M.M.A.-S., E.M.M., O.M.H., K.A.Y., A.S.A., M.A., A.M.S.; supervision: U.R.A., S.I.A.; project administration: S.I.A.; funding acquisition: S.I.A. All authors have read and agreed to the published version of the manuscript.

Funding

The authors extend their appreciation to the Deputyship for Research and Innovation, Ministry of Education in Saudi Arabia, for funding this work through project number 375213500.

Institutional Review Board Statement

Not applicable.

Informed Consent Statement

Not applicable.

Data Availability Statement

Not applicable.

Acknowledgments

The authors would like to extend their sincere appreciation to the central laboratory at Jouf University for support this study.

Conflicts of Interest

The authors declare no conflict of interest.

References

  1. Guiry, M. AlgaeBase. World-Wide Electronic Publication, National University of Ireland, Galway. 2010. Available online: https://ci.nii.ac.jp/naid/10028197296/ (accessed on 4 December 2020).
  2. Yip, Z.T.; Quek, R.Z.; Huang, D. Historical biogeography of the widespread macroalga Sargassum (Fucales, Phaeophyceae). J. Phycol. 2020, 56, 300–309. [Google Scholar] [CrossRef] [Green Version]
  3. Yip, Z.T.; Quek, R.Z.; Low, J.K.; Wilson, B.; Bauman, A.G.; Chou, L.M.; Todd, P.A.; Huang, D. Diversity and phylogeny of Sargassum (Fucales, Phaeophyceae) in Singapore. Phytotaxa 2018, 369, 200–210. [Google Scholar] [CrossRef]
  4. Rushdi, M.I.; Abdel-Rahman, I.A.; Saber, H.; Attia, E.Z.; Abdelraheem, W.M.; Madkour, H.A.; Hassan, H.M.; Elmaidomy, A.H.; Abdelmohsen, U.R. Pharmacological and natural products diversity of the brown algae genus Sargassum. RSC Adv. 2020, 10, 24951–24972. [Google Scholar] [CrossRef]
  5. Yende, S.R.; Harle, U.N.; Chaugule, B.B. Therapeutic potential and health benefits of Sargassum species. Pharmacogn. Rev. 2014, 8, 1. [Google Scholar] [CrossRef] [PubMed] [Green Version]
  6. Ma, J.; Zhang, L.; Zhang, J.; Liu, M.; Wei, L.; Shen, T.; Ma, C.; Wang, Y.; Chen, Y.; Zhu, D. 15-Lipoxygenase-1/15-hydroxyeicosatetraenoic acid promotes hepatocellular cancer cells growth through protein kinase B and heat shock protein 90 complex activation. Int. J. Biochem. Cell Biol. 2013, 45, 1031–1041. [Google Scholar] [CrossRef]
  7. Steele, V.E.; Holmes, C.A.; Hawk, E.T.; Kopelovich, L.; Lubet, R.A.; Crowell, J.A.; Sigman, C.C.; Kelloff, G.J. Lipoxygenase inhibitors as potential cancer chemopreventives. Cancer Epidemiol. Prev. Biomark. 1999, 8, 467–483. [Google Scholar]
  8. Orafaie, A.; Matin, M.M.; Sadeghian, H. The importance of 15-lipoxygenase inhibitors in cancer treatment. Cancer Metastasis Rev. 2018, 37, 397–408. [Google Scholar] [CrossRef]
  9. Gilbert, N.C.; Gerstmeier, J.; Schexnaydre, E.E.; Börner, F.; Garscha, U.; Neau, D.B.; Werz, O.; Newcomer, M.E. Structural and mechanistic insights into 5-lipoxygenase inhibition by natural products. Nat. Chem. Biol. 2020, 16, 783–790. [Google Scholar] [CrossRef]
  10. Enomoto, M.; Kuwahara, S. Enantioselective Synthesis and Stereochemical Revision of Communiols A–C, Antibacterial 2, 4-Disubstituted Tetrahydrofurans from the Coprophilous Fungus Podospora communis. Biosci. Biotechnol. Biochem. 2008, 72, 1921–1928. [Google Scholar] [CrossRef] [PubMed]
  11. Takada, N.; Watanabe, R.; Suenaga, K.; Yamada, K.; Uemura, D. Isolation and structures of hedaols A, B, and C, new bisnorditerpenes from a Japanese brown alga. J. Nat. Prod. 2001, 64, 653–655. [Google Scholar] [CrossRef]
  12. Yoon, W.-J.; Heo, S.-J.; Han, S.-C.; Lee, H.-J.; Kang, G.-J.; Kang, H.-K.; Hyun, J.-W.; Koh, Y.-S.; Yoo, E.-S. Anti-inflammatory effect of sargachromanol G isolated from Sargassum siliquastrum in RAW 264.7 cells. Arch. Pharmacal. Res. 2012, 35, 1421–1430. [Google Scholar] [CrossRef]
  13. Gerasimenko, N.; Logvinov, S. Seasonal composition of lipids, fatty acids pigments in the brown alga Sargassum pallidum: The potential for health. Open J. Mar. Sci. 2016, 6, 498. [Google Scholar] [CrossRef]
  14. Iwashima, M.; Mori, J.; Ting, X.; Matsunaga, T.; Hayashi, K.; Shinoda, D.; Saito, H.; Sankawa, U.; Hayashi, T. Antioxidant and antiviral activities of plastoquinones from the brown alga Sargassum micracanthum, and a new chromene derivative converted from the plastoquinones. Biol. Pharm. Bull. 2005, 28, 374–377. [Google Scholar] [CrossRef] [Green Version]
  15. Tang, H.-F.; Yi, Y.-H.; Yao, X.-S.; Xu, Q.-Z.; Zhang, S.-Y.; Lin, H.-W. Bioactive steroids from the brown alga Sargassum carpophyllum. J. Asian Nat. Prod. Res. 2002, 4, 95–101. [Google Scholar] [CrossRef]
  16. Ayyad, S.-E.N.; Sowellim, S.Z.; El-Hosini, M.S.; Abo-Atia, A. The structural determination of a new steroidal metabolite from the brown alga Sargassum asperifolium. Zeitschrift Naturforschung C 2003, 58, 333–336. [Google Scholar] [CrossRef]
  17. Jung, M.; Jang, K.H.; Kim, B.; Lee, B.H.; Choi, B.W.; Oh, K.-B.; Shin, J. Meroditerpenoids from the brown alga Sargassum siliquastrum. J. Nat. Prod. 2008, 71, 1714–1719. [Google Scholar] [CrossRef] [PubMed]
  18. Seo, Y.; Park, K.E.; Nam, T.J. Isolation of a new chromene from the brown alga Sargassum thunbergii. Bull. Korean Chem. Soc. 2007, 28, 1831. [Google Scholar]
  19. Cui, Z.; Li, Y.-S.; Liu, H.-B.; Yuan, D.; Lu, B.-R. Sulfoglycolipid from the marine brown alga Sargassum Hemiphyllum. J. Asian Nat. Prod. Res. 2001, 3, 117–122. [Google Scholar] [CrossRef] [PubMed]
  20. Ahamad, P.; Kunhi, A.; Divakar, S. New metabolic pathway for o-cresol degradation by Pseudomonas sp. CP4 as evidenced by 1H NMR spectroscopic studies. World J. Microbiol. Biotechnol. 2001, 17, 371–377. [Google Scholar] [CrossRef]
  21. Bogan, L.E., Jr.; Wolk, S.K. Synthesis of and assignment of carbon-13 NMR resonances to m-cresol novolak dimers. Macromolecules 1992, 25, 161–165. [Google Scholar] [CrossRef]
  22. Tawfike, A.; Attia, E.Z.; Desoukey, S.Y.; Hajjar, D.; Makki, A.A.; Schupp, P.J.; Edrada-Ebel, R.; Abdelmohsen, U.R. New bioactive metabolites from the elicited marine sponge-derived bacterium Actinokineospora spheciospongiae sp. nov. AMB Express 2019, 9, 12. [Google Scholar] [CrossRef]
  23. Wu, W.; Hasumi, K.; Peng, H.; Hu, X.; Wang, X.; Bao, B. Fibrinolytic compounds isolated from a brown alga, Sargassum fulvellum. Mar. Drugs 2009, 7, 85–94. [Google Scholar] [CrossRef] [PubMed] [Green Version]
  24. Stappen, I.; Höfinghoff, J.; Buchbauer, G.; Wolschann, P. Structure-activity relationships of sandalwood odorants: Synthesis of a new campholene derivative. Nat. Prod. Commun. 2010, 5, 1934578×1000500902. [Google Scholar] [CrossRef] [Green Version]
  25. Francesconi, K.A.; Edmonds, J.S.; Stick, R.V.; Skelton, B.W.; White, A.H. Arsenic-containing ribosides from the brown alga Sargassum lacerifolium: X-ray molecular structure of 2-amino-3-[5′-deoxy-5′-(dimethylarsinoyl) ribosyloxy] propane-1-sulphonic acid. J. Chem. Soc. Perkin Trans. 1 1991, 2707–2716. [Google Scholar] [CrossRef]
  26. Wang, X.; Shen, Y.; Wang, S.; Li, S.; Zhang, W.; Liu, X.; Lai, L.; Pei, J.; Li, H. PharmMapper 2017 update: A web server for potential drug target identification with a comprehensive target pharmacophore database. Nucleic Acids Res. 2017, 45, W356–W360. [Google Scholar] [CrossRef] [Green Version]
  27. Xu, X.-M.; Deng, J.-J.; Yuan, G.-J.; Yang, F.; Guo, H.-T.; Xiang, M.; Ge, W.; Wu, Y.-G. 5-Lipoxygenase contributes to the progression of hepatocellular carcinoma. Mol. Med. Rep. 2011, 4, 1195–1200. [Google Scholar] [CrossRef] [Green Version]
  28. Hussey, H.; Tisdale, M. Inhibition of tumour growth by lipoxygenase inhibitors. Br. J. Cancer 1996, 74, 683–687. [Google Scholar] [CrossRef] [PubMed] [Green Version]
  29. Avis, I.; Hong, S.H.; Martínez, A.; Moody, T.; Choi, Y.H.; Trepel, J.; Das, R.; Jett, M.; Mulshine, J.L. Five-lipoxygenase inhibitors can mediate apoptosis in human breast cancer cell lines through complex eicosanoid interactions. FASEB J. 2001, 15, 2007–2009. [Google Scholar] [CrossRef] [PubMed] [Green Version]
  30. Bishayee, K.; Khuda-Bukhsh, A.R. 5-lipoxygenase antagonist therapy: A new approach towards targeted cancer chemotherapy. Acta Biochim. Biophys. Sin. 2013, 45, 709–719. [Google Scholar] [CrossRef] [PubMed] [Green Version]
  31. Cer, R.Z.; Mudunuri, U.; Stephens, R.; Lebeda, F.J. IC 50-to-K i: A web-based tool for converting IC 50 to K i values for inhibitors of enzyme activity and ligand binding. Nucleic Acids Res. 2009, 37, W441–W445. [Google Scholar] [CrossRef] [Green Version]
  32. Ashworth, M.R.F.; Stahl, E. Thin-Layer Chromatography: A Laboratory Handbook; Springer Science and Business Media: Berlin/Heidelberg, Germany, 2013; Available online: https://books.google.com.eg/books?hl=en&lr=&id=06v7CAAAQBAJ&oi=fnd&pg=PA1&dq=32.%09Ashworth,+M.R.F.%3B+Stahl,+E.+Thin-layer+chromatography:+a+laboratory+handbook%3B+Springer+Science+and+Business+Media:+2013&ots=UUi3D7RewN&sig=bkWmSFTqhRRmJ5lXwXr0rm7YcQA&redir_esc=y#v=onepage&q=32.%09Ashworth%2C%20M.R.F.%3B%20Stahl%2C%20E.%20Thin-layer%20chromatography%3A%20a%20laboratory%20handbook%3B%20Springer%20Science%20and%20Business%20Media%3A%202013&f=false (accessed on 9 November 2020).
  33. Abdelmohsen, U.R.; Cheng, C.; Viegelmann, C.; Zhang, T.; Grkovic, T.; Ahmed, S.; Quinn, R.J.; Hentschel, U.; Edrada-Ebel, R. Dereplication strategies for targeted isolation of new antitrypanosomal actinosporins A and B from a marine sponge associated-Actinokineospora sp. EG49. Mar. Drugs 2014, 12, 1220–1244. [Google Scholar] [CrossRef] [Green Version]
  34. Skehan, P.; Storeng, R.; Scudiero, D.; Monks, A.; McMahon, J.; Vistica, D.; Warren, J.T.; Bokesch, H.; Kenney, S.; Boyd, M.R. New colorimetric cytotoxicity assay for anticancer-drug screening. JNCI J. Natl. Cancer Inst. 1990, 82, 1107–1112. [Google Scholar] [CrossRef] [PubMed]
  35. Vichai, V.; Kirtikara, K. Sulforhodamine B colorimetric assay for cytotoxicity screening. Nat. Protoc. 2006, 1, 1112–1116. [Google Scholar] [CrossRef]
  36. Yamamoto, S. Mammalian lipoxygenases: Molecular structures and functions. Biochim. Biophys. Acta Lipids Lipid Metab. 1992, 1128, 117–131. [Google Scholar] [CrossRef]
  37. Mitra, S.; Bartlett, S.G.; Newcomer, M.E. Identification of the substrate access portal of 5-lipoxygenase. Biochemistry 2015, 54, 6333–6342. [Google Scholar] [CrossRef] [PubMed] [Green Version]
  38. Trott, O.; Olson, A.J. AutoDock Vina: Improving the speed and accuracy of docking with a new scoring function, efficient optimization, and multithreading. J. Comput. Chem. 2010, 31, 455–461. [Google Scholar] [CrossRef] [Green Version]
  39. Sayed, A.M.; Alhadrami, H.A.; El-Gendy, A.O.; Shamikh, Y.I.; Belbahri, L.; Hassan, H.M.; Abdelmohsen, U.R.; Rateb, M.E. Microbial natural products as potential inhibitors of SARS-CoV-2 main protease (Mpro). Microorganisms 2020, 8, 970. [Google Scholar] [CrossRef]
  40. Lill, M.A.; Danielson, M.L. Computer-aided drug design platform using PyMOL. J. Comput. Aided Mol. Des. 2011, 25, 13–19. [Google Scholar] [CrossRef]
  41. Alhadrami, H.A.; Hamed, A.A.; Hassan, H.M.; Belbahri, L.; Rateb, M.E.; Sayed, A.M. Flavonoids as Potential anti-MRSA Agents through Modulation of PBP2a: A Computational and Experimental Study. Antibiotics 2020, 9, 562. [Google Scholar] [CrossRef]
  42. Phillips, J.C.; Braun, R.; Wang, W.; Gumbart, J.; Tajkhorshid, E.; Villa, E.; Chipot, C.; Skeel, R.D.; Kale, L.; Schulten, K. Scalable molecular dynamics with NAMD. J. Comput. Chem. 2005, 26, 1781–1802. [Google Scholar] [CrossRef] [PubMed] [Green Version]
  43. MacKerell, A.D., Jr.; Bashford, D.; Bellott, M.; Dunbrack, R.L., Jr.; Evanseck, J.D.; Field, M.J.; Fischer, S.; Gao, J.; Guo, H.; Ha, S. All-atom empirical potential for molecular modeling and dynamics studies of proteins. J. Phys. Chem. B 1998, 102, 3586–3616. [Google Scholar] [CrossRef]
  44. Humphrey, W.; Dalke, A.; Schulten, K. VMD: Visual molecular dynamics. J. Mol. Graph. 1996, 14, 33–38. Available online: https://www.csb.pitt.edu/BBSI/2007/lectures/VMD.pdf (accessed on 15 January 2021). [CrossRef]
  45. Jo, S.; Kim, T.; Iyer, V.G.; Im, W. CHARMM-GUI: A web-based graphical user interface for CHARMM. J. Comput. Chem. 2008, 29, 1859–1865. [Google Scholar] [CrossRef] [PubMed]
  46. Jo, S.; Jiang, W.; Lee, H.S.; Roux, B.t.; Im, W. CHARMM-GUI Ligand Binder for Absolute Binding Free Energy Calculations and Its Application. J. Chem. Inf. Model. 2013, 53, 267–277. [Google Scholar] [CrossRef] [PubMed] [Green Version]
  47. Jiménez, J.; Skalic, M.; Martinez-Rosell, G.; De Fabritiis, G. K deep: Protein–ligand absolute binding affinity prediction via 3d-convolutional neural networks. J. Chem. Inf. Model. 2018, 58, 287–296. [Google Scholar] [CrossRef] [PubMed]
Figure 1. Dereplicated metabolites from liquid chromatography-high resolution electrospray ionization mass spectrometry (LC-HRESIMS) analysis of S. cinereum.
Antibiotics 10 00416 g001
Figure 2. Structures of compounds isolated from S. cinereum 1221 together with 5-lipoxygenase (5-LOX) and 15-LOX’s co-crystallized ligands AA 16 and nordihydroguaiaretic acid (NDGA).
Antibiotics 10 00416 g002
Figure 3. Selected heteronuclear multiple-bond correlation (HMBC) ( Antibiotics 10 00416 i001
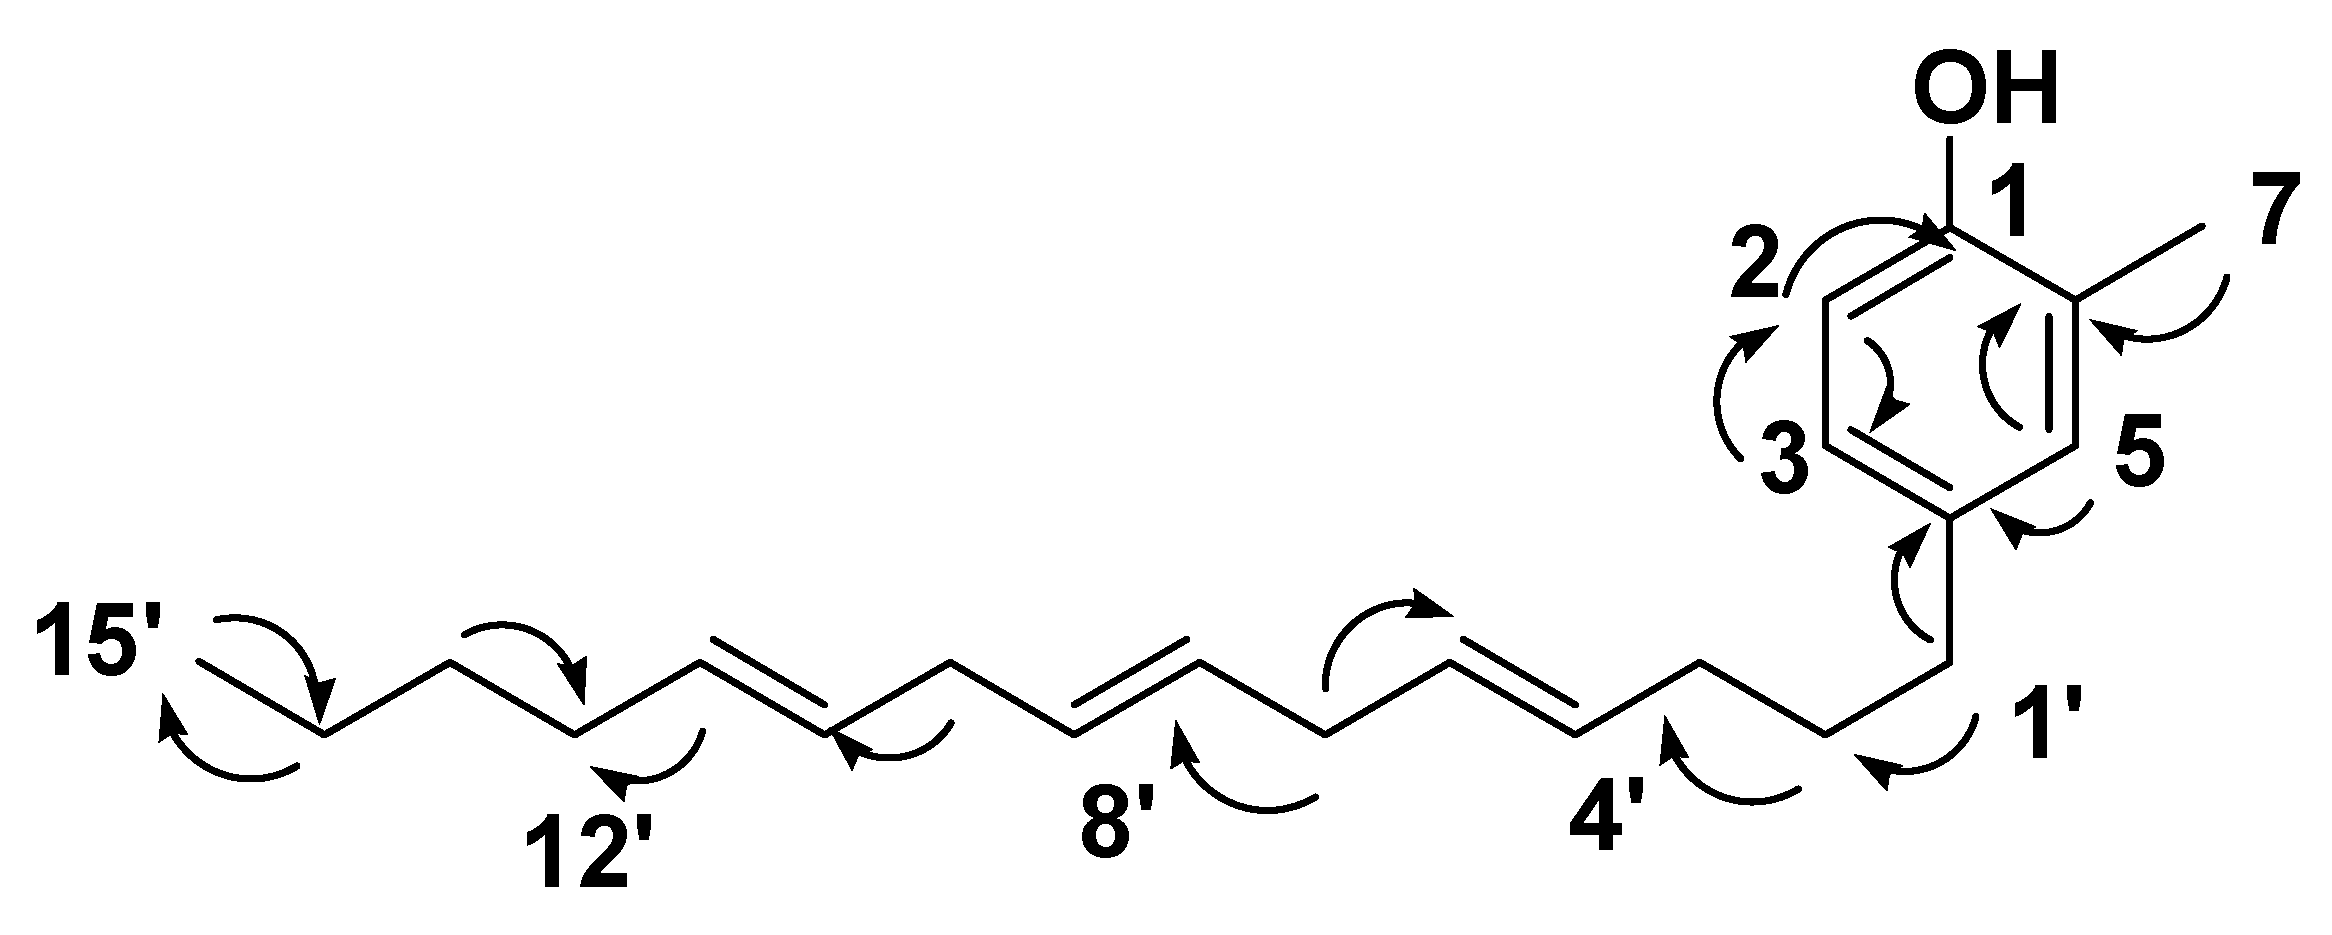
) correlations of compound 12.
Antibiotics 10 00416 g003
Figure 4. Selected HMBC ( Antibiotics 10 00416 i001
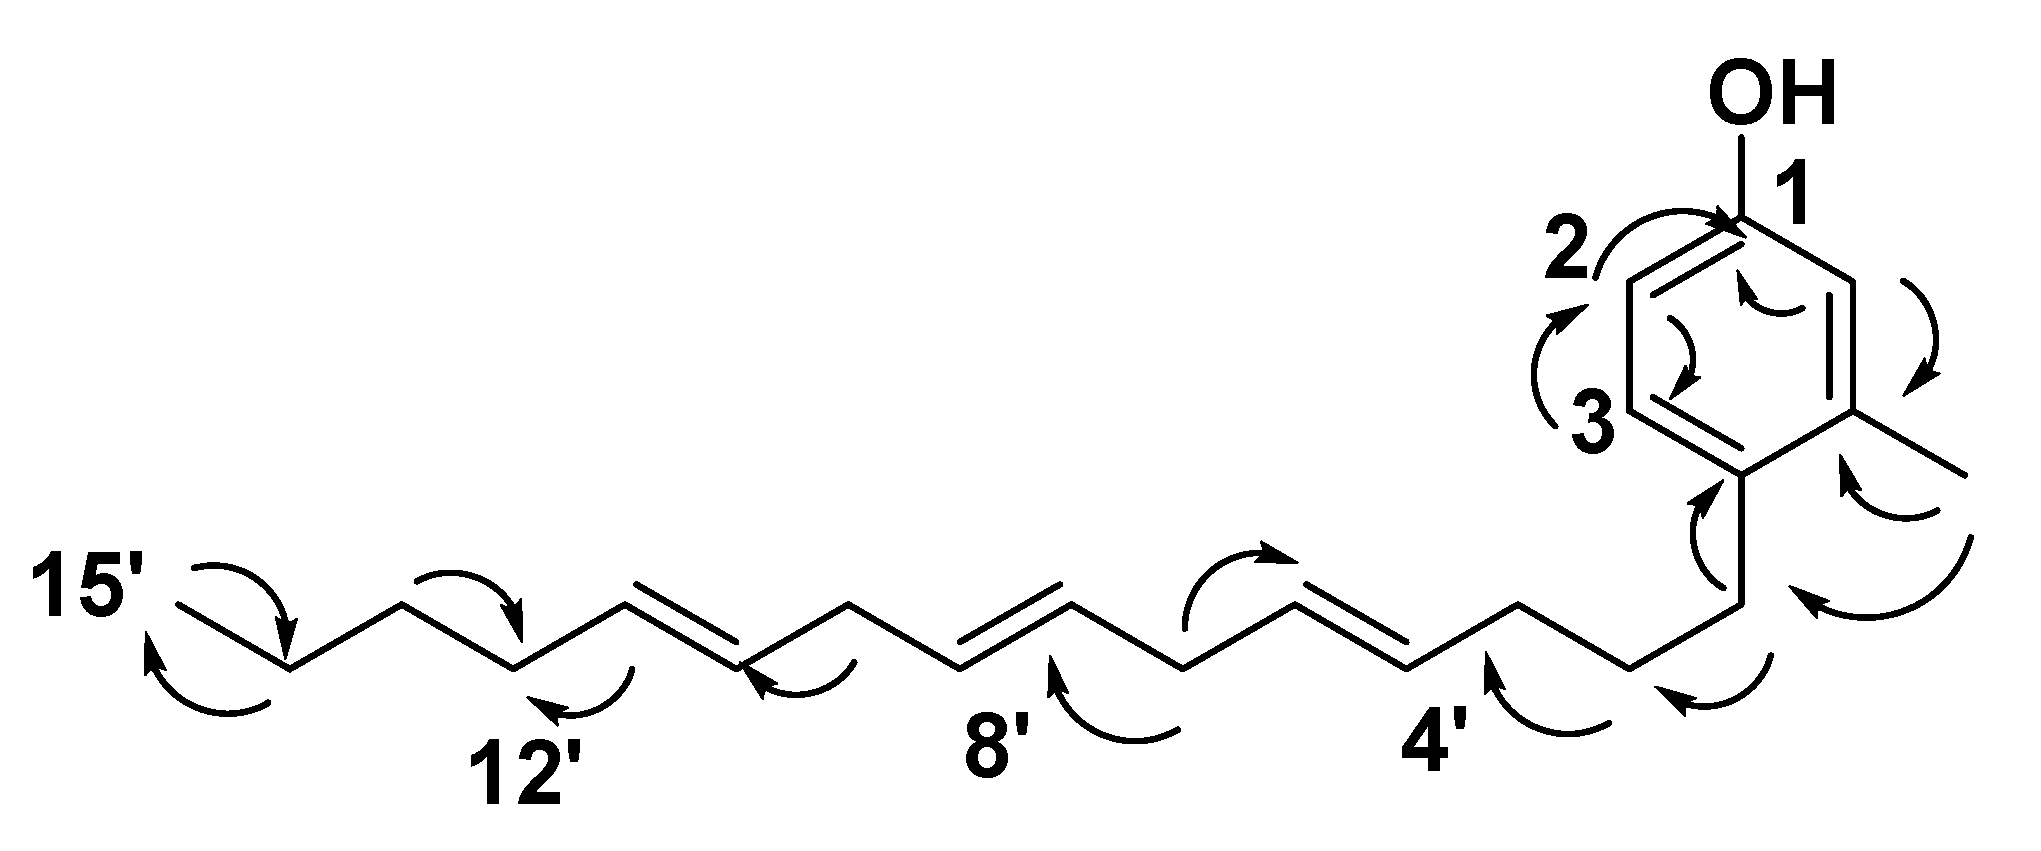
) correlations of compound 13.
Antibiotics 10 00416 g004
Figure 5. Binding modes of compounds 12, 13, and 19 inside 5-LOX’s active site. (A,C,E) Their binding modes upon docking. (B,D,F) Their binding modes over 50 ns MDS. (G,H) Binding modes of the co-crystalized ligands AA and NDGA.
Antibiotics 10 00416 g005
Figure 6. Binding modes of compounds 12, 13, and 19 inside 15-LOX’s active site. (A,C,E) Their binding modes upon docking. (B,D,F) Their binding modes over 50 ns MDS. (G) Binding mode of the co-crystalized ligands AA.
Antibiotics 10 00416 g006
Figure 7. RMSDs of compounds 12, 13 and 19 inside 5-LOX and 15-LOX’s active sites over 50 ns of molecular dynamic simulations (MDS).
Antibiotics 10 00416 g007
Table 1. Distortionless enhancement by polarization transfer-Q (DEPT-Q) (400 MHz) and 1H (100 MHz) NMR data of compounds 12, 13 in DMSO-d6; carbon multiplicities were determined by the DEPT-Q experiments.
Position1213
δCδH (J in Hz)δCδH (J in Hz)
1153.8, qC 153.8, qC
2123.1, CH7.13, d (8.0)123.1, CH7.13, d (8.0)
3123.6, CH6.98, d (8.0)123.6, CH6.98, d (8.0)
4134.5, qC 134.5, qC
5116.0, CH6.68, s140.6, qC
6140.6, qC 116.0, CH6.68, s
729.8, CH31.34, s31.9, CH31.23, s
1′33.4, CH22.26, m33.7, CH22.26, m
2′20.3, CH22.03, overlapped20.5, CH22.03, overlapped
3′27.1, CH22.01, overlapped27.1, CH22.01, overlapped
4′127.9, CH5.31–5.35, m127.9, CH5.31–5.35, m
5′128.8, CH5.31–5.35, m128.8, CH5.31–5.35, m
6′25.5, CH22.78, overlapped25.5, CH22.78, overlapped
7′128.0, CH5.31–5.35, m128.1, CH5.31–5.35, m
8′128.3, CH5.31–5.35, m128.4, CH5.31–5.35, m
925.6, CH22.78, overlapped25.6, CH22.78, overlapped
10128.2, CH5.31–5.35, m128.3, CH5.31–5.35, m
11129.4, CH5.31–5.35, m129.4, CH5.31–5.35, m
1224.9, CH21.52, overlapped24.9, CH21.52, overlapped
1328.9, CH21.24, overlapped28.9, CH21.24, overlapped
1422.4, CH21.25, overlapped22.4, CH21.25, overlapped
1514.5, CH30.89, t (6.6)14.3, CH30.85, t (6.6)
qC, quaternary, CH, methine, CH2, methylene, CH3, methyl carbons.
Table 2. In vitro antiproliferative activity of the isolated compounds, 1221 expressed as IC50 ± (SSEM) µM.
IC50 (µM)
CodeHepG2MCF-7Caco-2
1214.5 ± 0.8 *17.6 ± 0.9 *18.2 ± 0.7 *
1313.1 ± 1.1 *12.7 ± 1.3 *11.2 ± 0.6 *
14>50>50>50
15>50>50>50
16>50>50>50
17>50>50>50
18>50>50>50
1918.5 ± 1.4 *21.6 ± 1.3*15.7 ± 0.9 *
20>50>50>50
21>50>50>50
Doxorubicin4.2 ± 0.33.8 ± 0.23.4 ± 0.1
The IC50 value of compounds against each cancer cell line, which was defined as the concentration (µM) that caused a 50% inhibition of cell growth in vitro, data were expressed as mean ± SEM (n = 3). One-way analysis of variance (ANOVA) followed by Dunnett’s test using PASW Statistics® version 18 (Quarry Bay, Hong Kong) was applied. GraphPad Prism software version 6 (La Jolla, CA, USA) was used for statistical calculations. * Statistically significant at p < 0.05. Doxorubicin is a positive control.
Table 3. Docking scores, binding free energies, Ki and IC50 values of compounds 12, 13, and 19 together with the co-crystallized inhibitors NDGA and AA.
CompoundΔGVina *ΔGFEP **ΔGKDEEP ***Ki#IC50 #
5-LOX15-LOX5-LOX15-LOX5-LOX15-LOX5-LOX15-LOX5-LOX15-LOX
12−9.3−5.1−8.1−4.4−7.7−4.60.9 ± 0.117.4 ± 0.21.6 ± 0.325.3 ± 0.4
13−8.9−5.5−8.0−4.7−7.5−4.50.7 ± 0.214.3 ± 0.41.3 ± 0.123.6 ± 0.3
19−9.1−7.7−7.9−7.1−7.6−7.21.4 ± 0.24.2 ± 0.12.1 ± 0.46.7 ± 0.3
NDGA ##−7.2−6.9−7.0−6.5−6.8−6.56.9 ± 0.16.1 ± 0.28.8 ± 0.39.5 ± 0.5
AA ##−7.6−7.0−6.2−6.4−7.1−6.3----
Lipoxygenase (LOX), nordihydroguaiaretic acid (NDGA), arachidonic acid (AA); * Vina docking scores calculated in kcal/mol; ** MDS-derived binding free energies calculated in kcal/mol by FEP method; *** neural networking-derived binding free energies calculated in kcal/mol by KDEEP software; # in vitro inhibition constant (Ki) and inhibition concentration 50 (IC50) expressed as µM; ## the reported co-crystalized ligands.
Publisher’s Note: MDPI stays neutral with regard to jurisdictional claims in published maps and institutional affiliations.

