Communication

Sensing Characteristics of SARS-CoV-2 Spike Protein Using Aptamer-Functionalized Si-Based Electrolyte-Gated Field-Effect Transistor (EGT)

1
Department of Electrical Engineering, Pohang University of Science and Technology (POSTECH), Pohang 37673, Republic of Korea
2
Department of Life Sciences, Pohang University of Science and Technology (POSTECH), Pohang 37673, Republic of Korea
3
Division of Electronics Engineering, Jeonbuk National University, Jeonju 54896, Republic of Korea
*
Author to whom correspondence should be addressed.
Biosensors 2024, 14(3), 124; https://doi.org/10.3390/bios14030124
Submission received: 26 December 2023 / Revised: 17 February 2024 / Accepted: 22 February 2024 / Published: 26 February 2024
(This article belongs to the Special Issue Biosensors Based on Transistors)

Abstract

:
The sensing responses of SARS-CoV-2 spike protein using top-down-fabricated Si-based electrolyte-gated transistors (EGTs) have been investigated. An aptamer was employed as a receptor for the SARS-CoV-2 spike protein. The EGT demonstrated excellent intrinsic characteristics and higher sensitivity in the subthreshold regime compared to the linear regime. The limit of detection (LOD) was achieved as low as 0.94 pg/mL and 20 pg/mL for the current and voltage sensitivity, respectively. To analyze the sensing responses of EGT in detecting the aptamer–SARS-CoV-2 spike protein conjugate, a lumped-capacitive model with the presence of an effective dipole potential and an effective capacitance of the functionalized layer component was employed. The aptamer-functionalized EGT showed high sensitivity even in 10 mM phosphate-buffered saline (PBS) solution. These results suggest that Si-based EGTs are a highly promising method for detecting SARS-CoV-2 spike proteins.

1. Introduction

Severe Acute Respiratory Syndrome Coronavirus 2 (SARS-CoV-2) represents a virulent human infectious disease that can cause profound respiratory distress. The World Health Organization (WHO) declared the SARS-CoV-2 outbreak a pandemic and global health emergency on 11 March 2020 [1]. SARS-CoV-2 has a positive-stranded RNA genome that encodes four structural proteins: a spike surface glycoprotein (S), an envelope protein (E), a matrix protein (M), and a nucleocapsid protein (N) [2]. Among these structural proteins, the spike protein is the most reliable biomarker [3,4]. The spike protein is expressed as a trimer on the virus surface, consisting of two subunits, S1 and S2, and plays a crucial role in receptor recognition and cell membrane fusion [5]. The S1 subunit contains a receptor-binding domain (RBD) that recognizes and attaches to the Angiotensin-Converting Enzyme 2 (ACE2) receptor, while the S2 subunit mediates viral cell membrane fusion. The SARS-CoV-2 spike trimer (S1 + S2) protein offers an enhanced biological model compared to the monomeric spike RBD protein or the single S1 subunit.
Real-time polymerase chain reaction (RT-PCR) is recognized as a gold standard for diagnosing SARS-CoV-2 [6,7]. However, this approach is unsuitable for point-of-care testing because it requires specialized laboratories, sophisticated and expensive equipment, and trained personnel. Alternatively, several other methods, including electrochemical techniques [8,9], fluorescence [10,11], and impedance [12,13], have been demonstrated. Among these, biosensor field-effect transistors (BioFETs) have emerged as a promising approach due to their low cost, ultra-sensitivity, and label-free detection [14,15,16]. In conventional BioFETs, the receptor is attached to the channel surface and combined with the target [17,18]. The output drain current of these BioFETs varies with the potential generated by the receptor–target conjugates.
Recently, electrolyte-gated transistors (EGTs) have been fabricated and analyzed using conducting polymer films as their channel materials to detect SARS-CoV-2 [19,20]. The utilization of a significant gate area as a functionalized surface increases the probability of binding events. However, for commercialization, organic EGTs should overcome some disadvantages compared to Si-based EGTs, such as environmental susceptibility, high-voltage operation, and difficulties integrating into existing Si-based devices in complex signal processing systems [21,22].
Aptamers, which are artificially produced single-stranded molecules of DNA or RNA, have high affinity and specificity for binding to target molecules such as proteins or small molecules [23,24]. Due to their smaller size, aptamers are less susceptible to interference from charged molecules in an electrolyte, resulting in a decreased Debye screening effect. It allows aptamers to maintain their binding affinity even in high salt concentrations or complex sample matrices, making them a promising tool for biosensing applications in real-world settings.
Here, we demonstrate the highly sensitive detection of SARS-CoV-2 spike protein (SC2) using aptamer-functionalized Si-EGT. The sensing behaviors under different operating regimes are investigated to achieve higher sensitivity. Furthermore, a lump-capacitive model is applied to analyze the characteristics of the aptamer–SC2 in EGT devices. The influence of buffer concentration and the non-specific binding test are also evaluated.

2. Materials and Methods

2.1. Fabrication of Si-Based EGT

Here, we demonstrate the ultrasensitive detection of SARS-CoV-2 spike protein (SC2) using aptamer-functionalized EGT. The sensing behaviors under different operating regimes are investigated to achieve higher sensitivity. Furthermore, a lump-capacitive model is applied to analyze the characteristics of the aptamer–SC2 in EGT sensors. The influence of buffer concentration and the non-specific binding test are also evaluated.
Figure 1a shows the fabrication flow of a Si-based EGT using a top-down process. An 8-inch silicon-on-insulator (SOI) wafer (p-type, 10 Ω·cm, (100)), (Soitech, Isere, France) with a 100 nm top-Si and 400 nm buried oxide (BOX) was used. The active region was formed using I-line stepper lithography and an inductively coupled plasma reactive ion etching (ICP-RIE) process (DMS, Taiwan). Then, the channel region was formed using electron beam lithography (E-beam lithography) (Elionix, Tokyo, Japan) and the ICP-RIE process. The ion implantation (As, 5 × 1015 cm−2) was conducted onto the substrate, followed by rapid thermal annealing (RTA) (Mattson, Fremont, CA, USA) at 1000 °C for 20 s. Then, 5 nm SiO2, a gate dielectric, was grown using a high-temperature pyro furnace (Centrotherm, Blaubeuren, Germany) at 800 °C 5 min. Next, the contact pads and transmission lines were formed by depositing Ag/Ti (500 nm/50 nm) using an electron beam evaporator (KVT, Seoul, Republic of Korea) and a conventional lift-off process. Finally, an SU-8 photoresist (Kayaku Advanced Materials Inc., Tokyo, Japan) was passivated on the device to prevent any leakage current flow, excluding the gate (1550 μm × 300 μm) and a channel region (10 μm × 10 μm). Figure 1b shows an optical image of the fabricated device.

2.2. Preparation of SARS-CoV-2 Spike Protein and Aptamer

The SARS-CoV-2 spike protein with S1 and S2 subunits was used, which is more similar to the real spike protein than using only the receptor-binding domain (RBD) or S1 subunit. Cells were cultured to produce protein, where Sf9 (Spodoptera frugiperda) cells were cultured in Sf 900 II SFM medium (Gibco, Waltham, MA, USA) with 0.1% penicillin/streptomycin mix and 0.2% amphotericin B (Sigma-Aldrich, St. Louis, MO, USA) in a shaking incubator at 27 °C. A baculovirus expression system was used to produce the spike protein. Baculovirus was generated by transfecting the recombinant baculovirus DNA into SF9 cells. Three days after infection, the medium was centrifuged at 6000 rpm and 10 min conditions to collect supernatant and purified by the Ni-affinity column purification method and size-exclusion chromatography. The aptamer was developed by VIRO-SELEX [25,26]. Several cycles of VIRO-SELEX were performed, and a pool of 11 cycles was chosen to analyze the sequence [27].

2.3. Immobilization of Aptamer on EGT

Firstly, devices were rinsed with ethanol and distilled water (DIW), followed by N2 blowing. Then, to remove residual contaminants and increase the density of the hydroxyl group, UV/ozone treatment was conducted for 1.5 min. Next, the devices were exposed to 1% 3-aminopropyltriethoxysilane (APTES) (Sigma-Aldrich, St. Louis, MO, USA) vapors for 1 min at 50 °C to cover the surface with an amine group (-NH2). After removing the residual APTES by immediate dipping in anhydrous ethanol followed by N2 blowing, the devices were immersed in 1 × PBS solution with 2.5% glutaraldehyde (GA) (Sigma-Aldrich, St. Louis, MO, USA) to form an aldehyde group on the surface [28,29,30]. Then, the devices were rinsed with 1 × PBS and DIW followed by N2 blowing. Next, to immobilize the aptamer, the devices were exposed to 2.5 μL of 1 × PBS solution containing aptamers for 12 h at room temperature. Finally, the devices were exposed to 0.1% bovine serum albumin (BSA) (Sigma-Aldrich, St. Louis, MO, USA) in 1 × PBS for 90 min at room temperature to block the unreacted active sites to prevent non-specific binding.

2.4. Electrical Measurement Set-Up

A semiconductor analyzer (Keithley 4200-SCS, Tektronics, Beaverton, OR, USA) was utilized to characterize the drain current (ID) and gate voltage (VG) modulation generated by SARS-CoV-2 responses. All measurements were conducted with a source voltage (VS) of 0 V, drain voltage (VD) of 0.1 V, and VG ranging from 0 V to 1 V with a 0.05 V step. A wide concentration range of SARS-CoV-2 (SC2) from 33 pg/mL to 3.3 μg/mL was prepared in 1 × PBS solution. The measurement sequence was as follows: Initially, the ID-VG curve of the aptamer-functionalized devices was characterized in a 0.01 × PBS solution. Next, the device was exposed to an SC2 spike protein solution (1 × PBS, 2.5 μL) for 90 min at room temperature, followed by a rinse. Finally, the ID-VG characterization was performed again in 0.01 × PBS solution.

3. Results

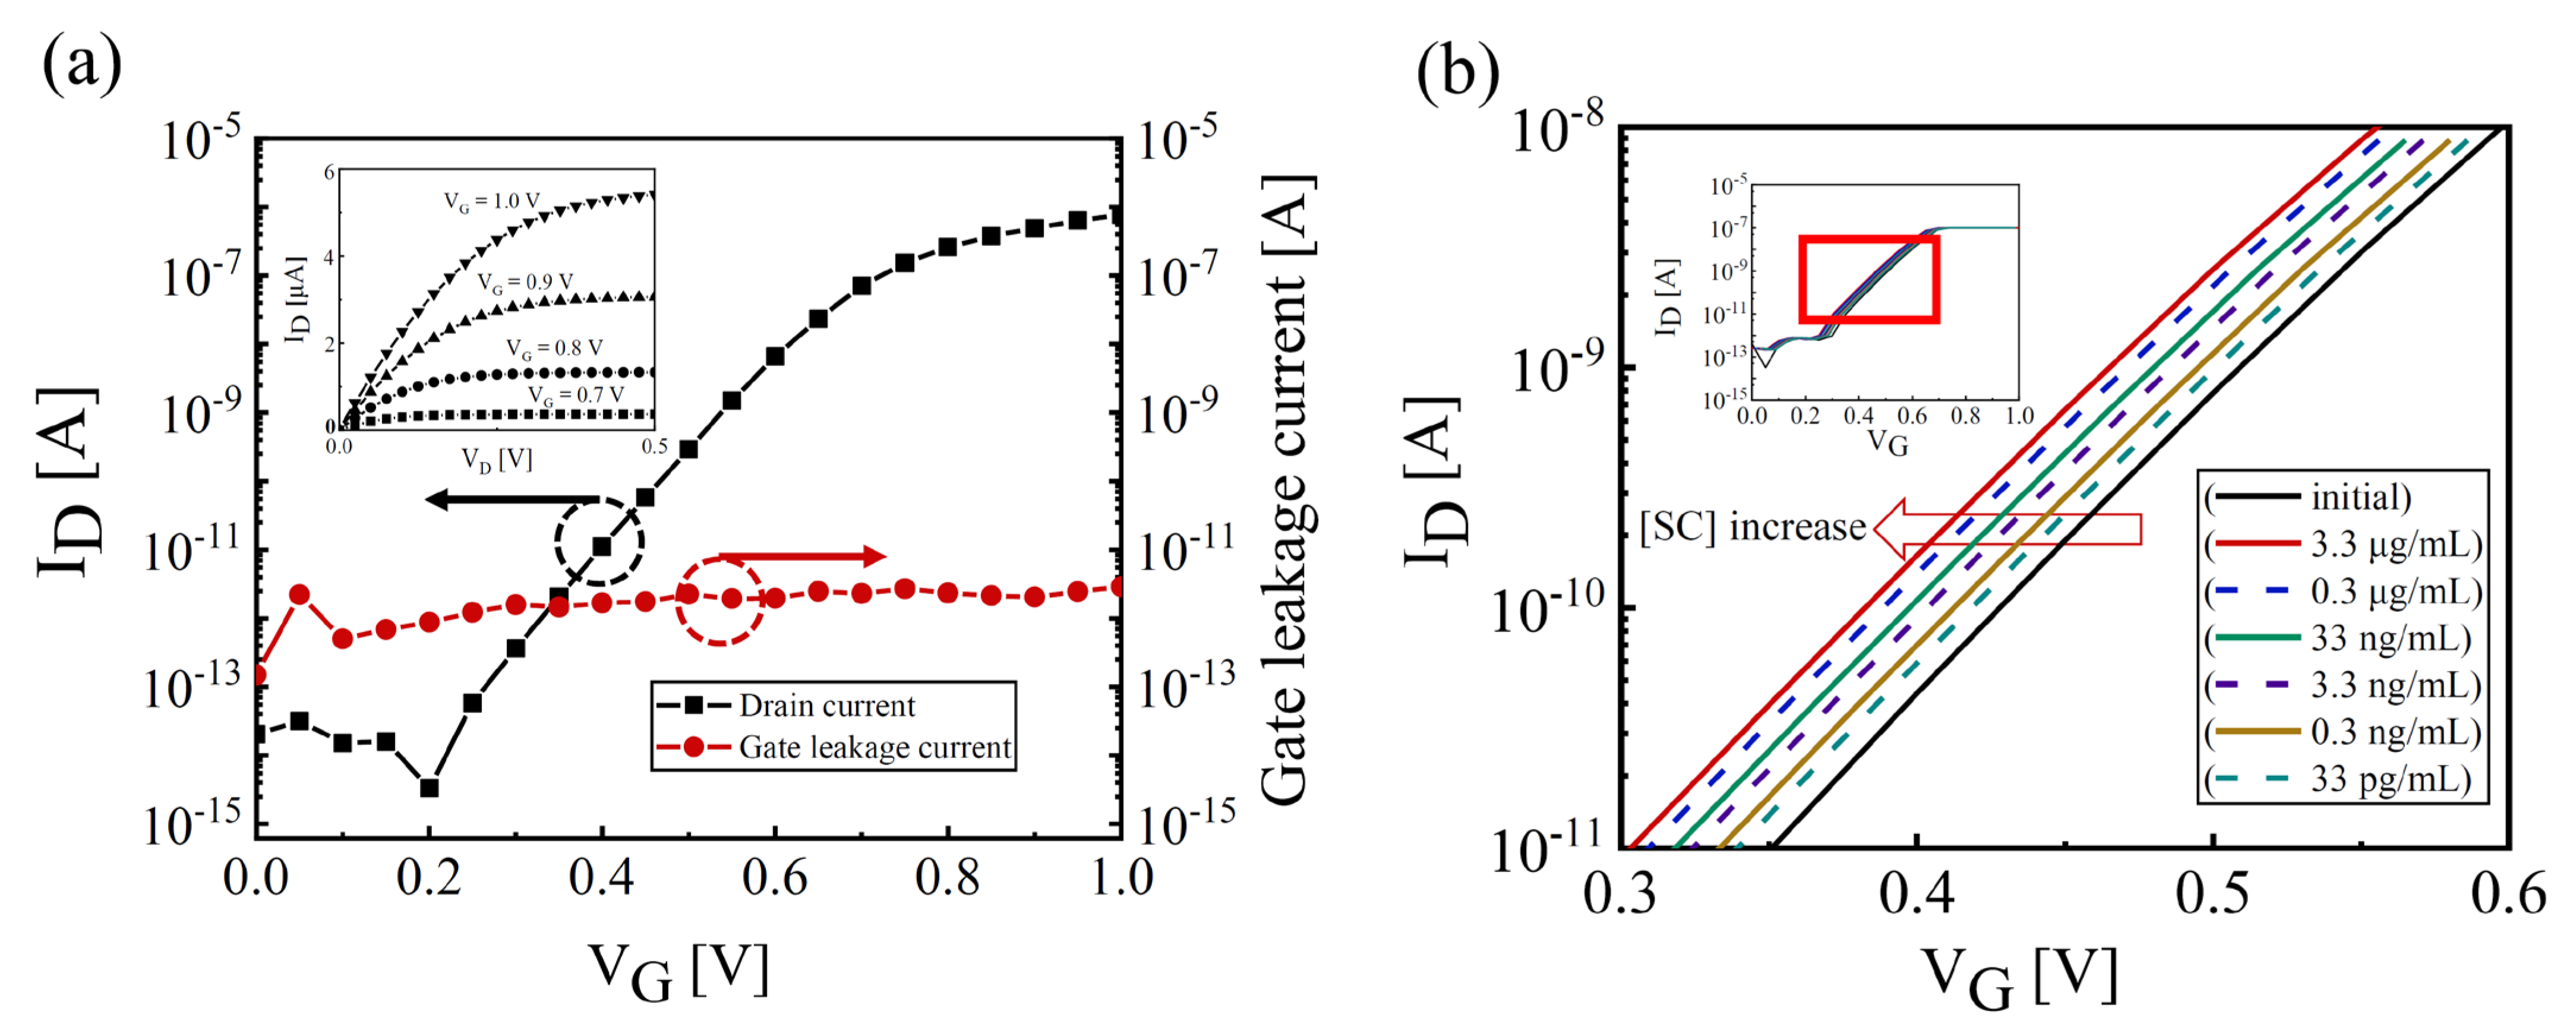
3.1. Electrical Characteristics of Fabricated Si-Based EGT

Figure 2a shows a transfer curve (log-scale ID-VG) and output curve (ID-VD, inset) of the fabricated Si-EGT, demonstrating excellent intrinsic characteristics, including a subthreshold swing (SS ≡ dVG/dlog (ID)) of ~80 mV/dec, threshold voltage (VTH) of 0.65 V, an on–off current ratio of ~107, and a gate leakage current (IG) of ~10−12 A. Figure 2b shows a representative transfer curve of the EGT with various concentrations of [SC2], ranging from the initial amount (no [SC2]) up to 3.3 μg/mL. The increase in [SC2] causes a negative shift in the transfer curves.

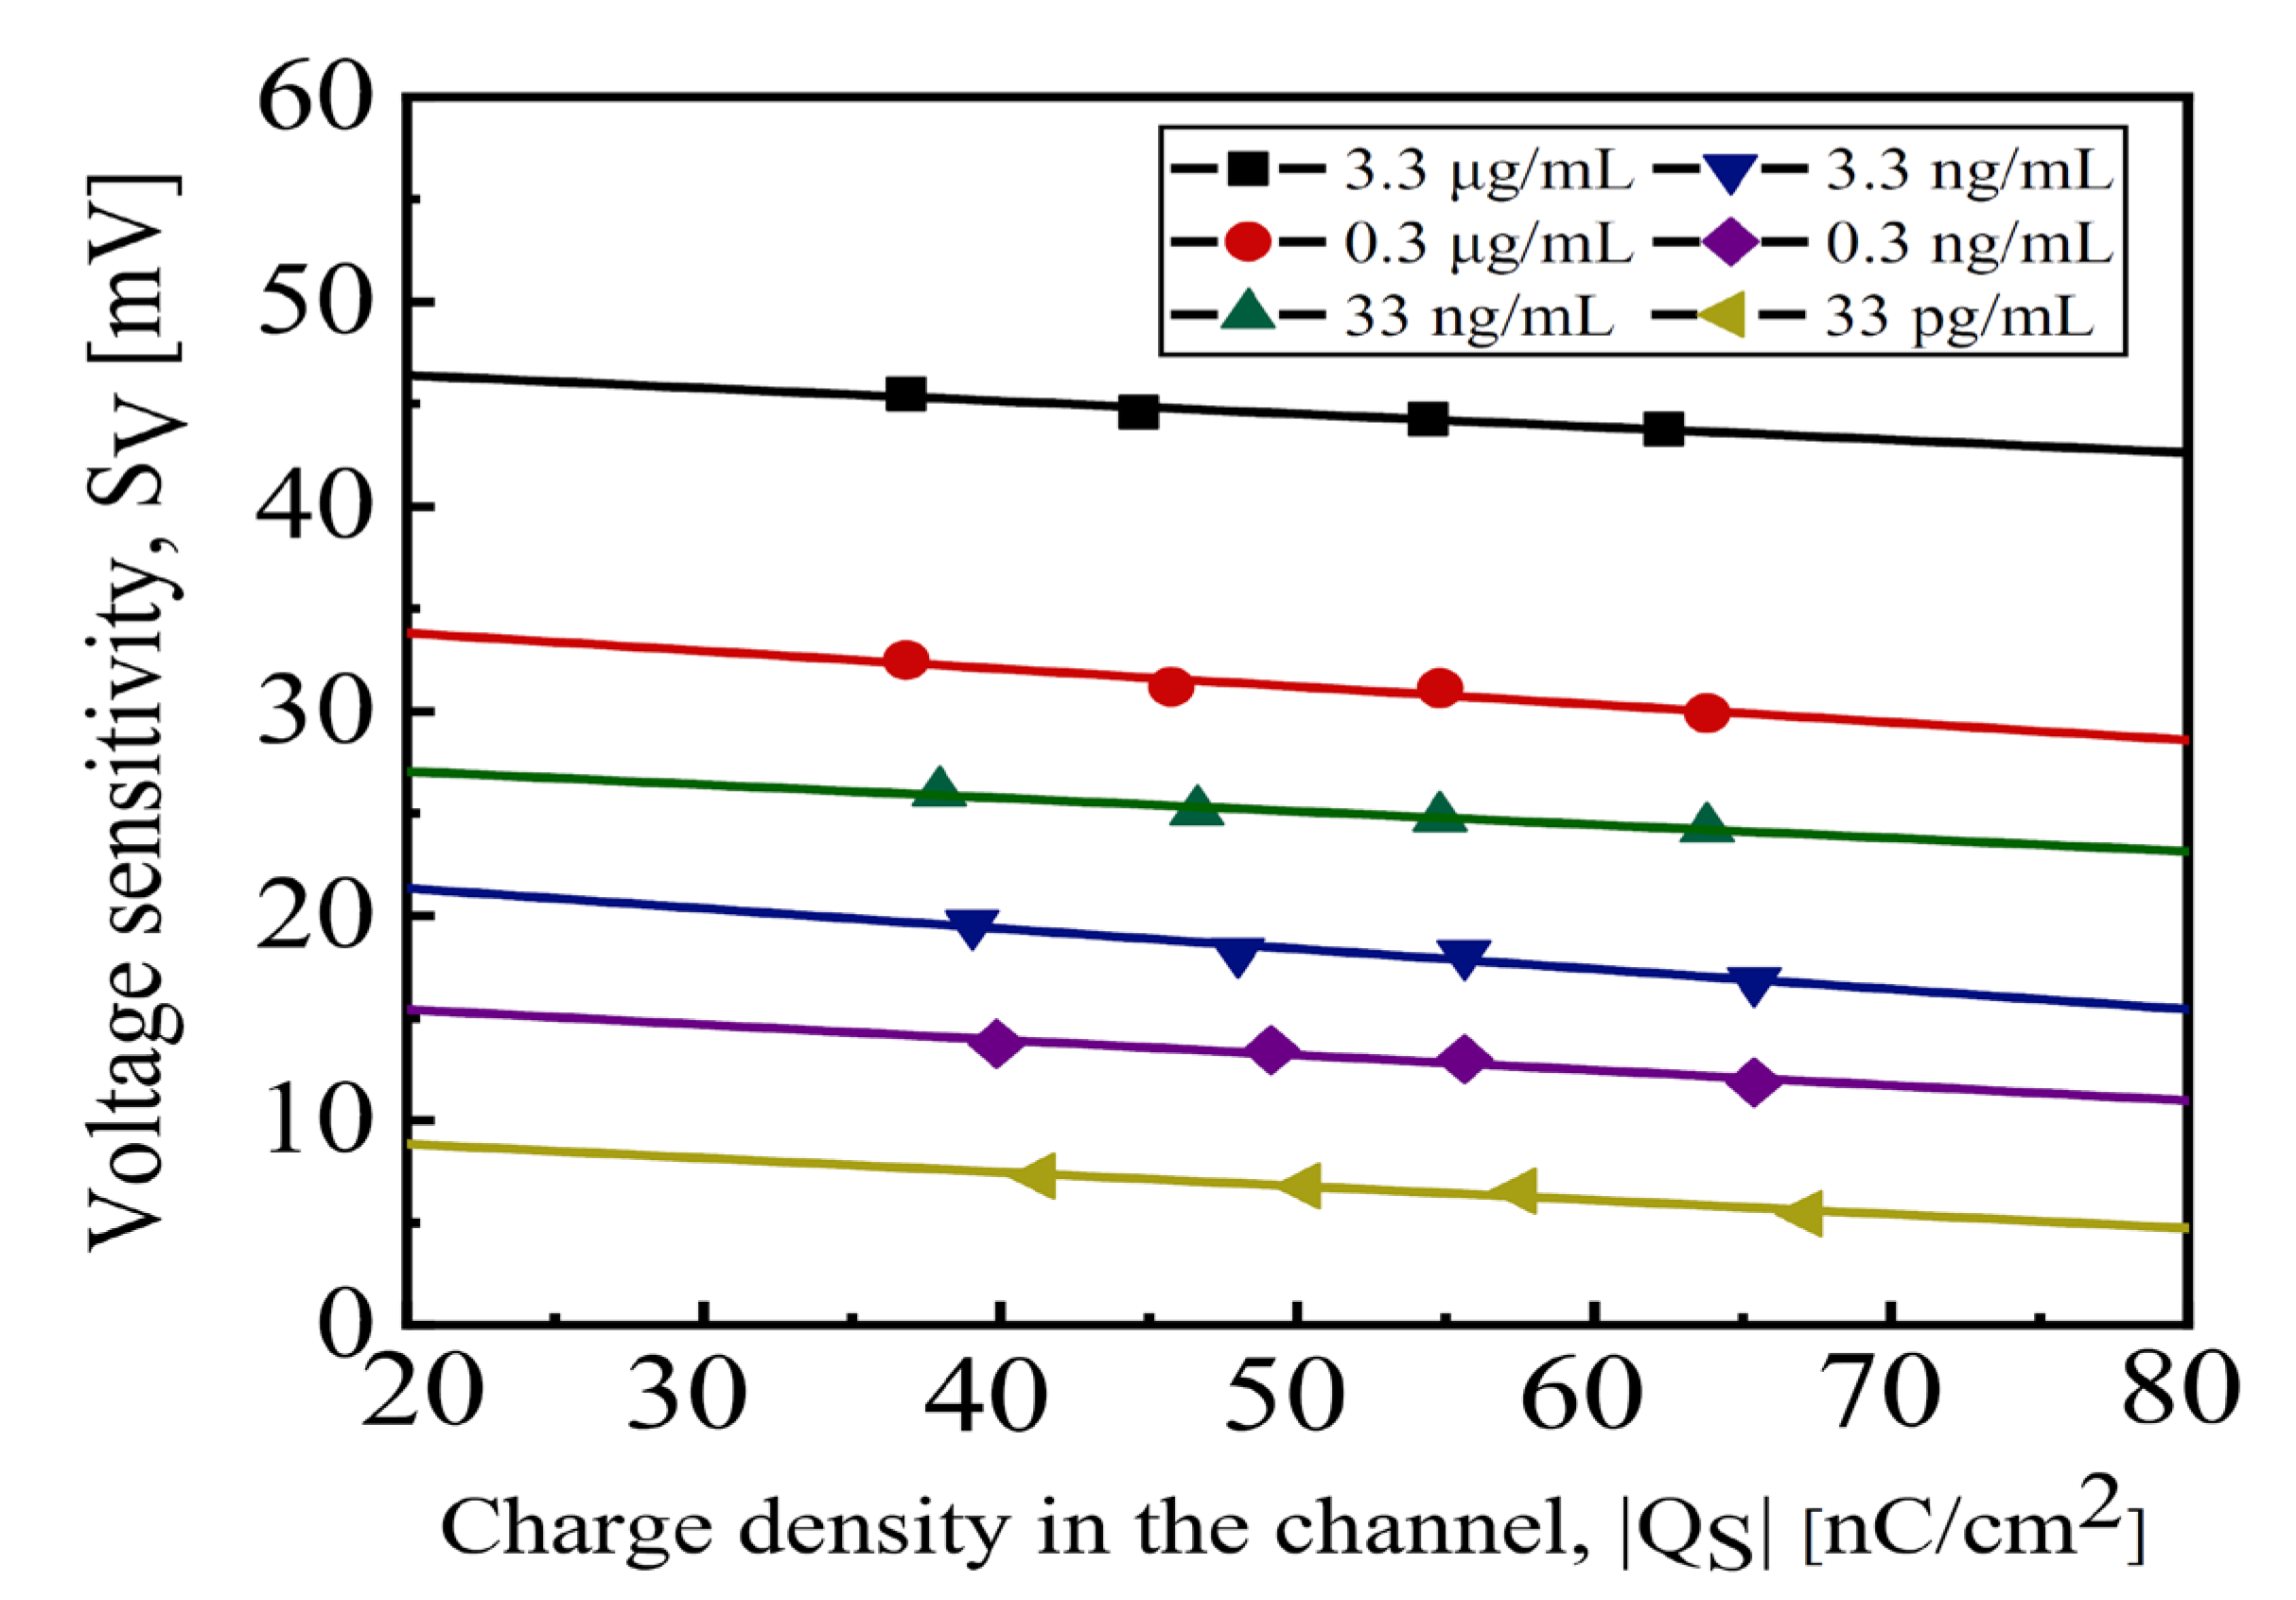
3.2. Sensing Responses of the EGTs for the SC2 Detection

The current sensitivity (SI) and voltage sensitivity (SV) are typically defined as follows [31,32]:
S I = I D _ S C 2 I D _ A P I D _ A P
S V = V G A P V G S C 2
where ID_AP and ID_SC2 are the drain currents at a fixed VG_AP after aptamer immobilization and after SC2 exposure, respectively, and VG_AP and VG_SC2 are the gate voltages at a fixed ID_AP after aptamer immobilization and after SC2 exposure, respectively.
Figure 3 shows the dependence of SI and SV on ID_AP. Both SI and SV show different behaviors as the operation shifts from the subthreshold regime (ID < 10 nA) to the linear regime (ID > 10 nA) through an increase in VG. At a given SC2 exposure, SI shows a constant behavior as ID_AP decreases in the subthreshold regime, while it radically reduces in the linear regime, as shown in Figure 3a. In contrast, the SV has a constant behavior independent of ID_AP values. It suggests that the exposure to SC2 causes little degradation to the devices with a lateral shift in the transfer curve from subthreshold to linear regimes. Thus, the Si-based EGTs should be operated in the subthreshold regime to achieve high sensitivity and low power consumption.
Figure 4 shows SI and SV as a function of [SC2]. The logistic calibration curves were SI = 376.2 × [SC2]0.26/(0.03 + [SC2]0.26) and SV = 72.1 × [SC2]0.2/(0.06 + [SC2]0.2) [33,34]. The dynamic range was about four orders of magnitude from 33 pg/mL to 3.3 μg/mL of [SC2]. The LOD was determined using the three-sigma method with the fitting sensitivity equation and blank replicate data (1 × PBS without [SC2]) [31,35]. The average of the blank replicate was as low as −9.3% for SI and −1.84 mV for SV, respectively, while the standard deviation of the blank replicate was as low as 10.4% for SI and 3.47 mV for SV, respectively. The extracted LOD was achieved as low as 945 fg/mL and 20 pg/mL for SI and SV, respectively. From the slope of the logistic fitted line in Figure 4, the SC2 sensitivities of 50.8%/log [SC2] for SI and 7.9 mV/log [SC2] for SV are extracted, respectively. These values are more than two times higher than the previous results (Table 1).
To further understand the sensing responses of EGT in detecting the aptamer–SC2 conjugate, a lumped-capacitive model with the presence of a dipole layer and a capacitive component was employed [19,36,37]. The binding factor α, defined as the ratio of the aptamer sites bound with the SC2 molecules to the total aptamer sites, can be expressed as [33,36,38]
α = N A P _ S C 2 N A P = S C 2 n ( K + S C 2 n )
where NAP_SC2 is the density of the aptamer–SC2 conjugates, NAP is the density of total immobilized aptamers, K is related to the dissociation constant of the aptamer–SC2 binding, and n is a slope factor that indicates the cooperativity of SC2 binding.
After introducing SC2 to the aptamer-functionalized surface, it generates an effective dipole moment (VDP_EFF) and an effective capacitance (CFN_EFF). VDP_EFF can be expressed as follows [20,36,37]:
V D P _ E F F = α · N A P · P D P ε D P V D P _ G T
where PDP is the perpendicular component of the dipole moment, εDP is the permittivity of the dipole layer, and VDP_GT is the dipole potentials at the gate electrode. VDP_EFF is mainly determined from the gate electrode since the gate area is ~5000 times larger than the channel area in the fabricated EGT device. The established VDP_EFF changes the flatband voltage, causing a shift in the ID vs. VG curve. The positive VDP_EFF reduces VTH and shifts the transfer curve toward the negative VG direction.
CFN_EFF is related to the biomaterials on the channel and can be expressed as follows [36]:
C F N _ E F F = C S C 2 _ C H + ( C S C 2 _ C H + C A P _ C H ) K S C 2 n
where CSC2_CH and CAP_CH are the SC2 and aptamer capacitances per unit area at the channel.
Then, SV is calculated using VDP_EFF and CFN_EFF as follows:
S V = V D P _ E F F + Q S C F N _ E F F
where QS is the total charge density in the channel.
Figure 5 shows the |QS| versus SV characteristics for different [SC2] values. For an n-type channel, the negative QS can be determined by summing the depletion charge, inversion charge, and interface trap charge in the channel [39,40]. VDP_EFF and CFN_EFF are obtained from the y-intercept and reciprocal slope of the curves, respectively.
Figure 6a shows the relationship between VDP_EFF and [SC2]. The positive VDP_EFF is clearly proportional to [SC2], and the logistics calibration curve of VDP_EFF is obtained as VDP_EFF = 72.7 × [SC2]0.2/(0.047 + [SC2]0.2). By utilizing equations (3), the binding factor α can be calculated as α = [SC2]0.2/(4.7 × 10−2 + [SC2]0.2) with K = 4.7 × 10⁻² and n = 0.2. A lower K value of the aptamer reaction, compared to the previous protein detection (K = 1.84 × 10⁻³), indicates that the aptamer conjugate is more prone to dissociation than the peanut protein conjugates [36]. In Figure 6b, the extracted CFN_EFF is fitted as CFN_EFF = 1.37 × 10⁻⁸ − 9.4 × 10⁻¹² × [SC2]−0.2 ≈ 1.37 × 10⁻⁸ using the extracted K and n values. The [SC2] capacitance generates a constant CFN_EFF for various [SC2]. Thus, compared to previous protein detection [36], the binding characteristics in the channel are negligibly involved in the overall aptamer detection.
Debye screening is another crucial factor that can affect the sensing performance of BioFETs. It refers to the phenomenon in which charged ions in an electrolyte shield the electric charge of the conjugates [41,42,43]. The Debye length is the characteristic length scale over which the electrical potential of a charged molecule decays exponentially due to the surrounding ions in an electrolyte. When the Debye length is comparable to the distance between the channel surface and the conjugates, the electrostatic interaction is significantly weakened due to the shielding effect of the charged ions in the solution [44].
To assess the impact of Debye screening on the responses to SC2, three different PBS solutions (0.01 ×, 0.1 ×, and 1 × PBS) were prepared by diluting 1 × PBS with DI water. Figure 7 shows the measured SI and SV at different PBS concentrations using an exposure of 33 ng/mL SC2. Both sensitivities increased as the PBS concentration decreased. The SI and SV values were approximately 80% higher in 0.01 × PBS buffer than in 1 × PBS solution. Interestingly, our devices were capable of detecting [SC2] even in 1 × PBS solution, despite the larger [SC2] used compared to other SARS-CoV-2 spike proteins that typically consist of only a smaller S1 subunit and RBD [14,45].
Figure 8 presents non-specific control experiments to confirm the selectivity to SC2. Various test samples, such as influenza B virus HA (hemagglutinin) protein and human coronavirus (HCoV-HKU1) spike protein, were exposed to high enough concentrations to confirm the specificity of the SARS-Cov-2 spike protein. The SI and SV values obtained from these biomolecules were sufficiently low and below 33 pg/mL of SC2, indicating that the sensitivity is specific to SC2 binding. In addition, when exposed to 3.3 μg/mL of SC2, the unmodified EGT exhibited negligible SI and SV, indicating that the SC2 aptamers were successfully immobilized and could be used to evaluate the surface functionalization process.
Table 1 compares the sensing performance of the EGT with previously reported sensors for detecting SC2. The Si-based EGT shows a significant improvement in both dynamic range and sensitivity.
Table 1. Comparison between various SC2 sensors.
Sensor TypeBiomarkerDynamic RangeSensitivity from SI (%/log [SC2])Limit of DetectionRef.
Paper-based electrochemical sensorRBD103 (1 ng/mL to 1 μg/mL)10.71 ng/mL[46]
CNT-FET sensorS15 × 104 (0.1 fg/m to 5 pg/mL)3.84.12 fg/mL[47]
Graphene-FET sensorS1104 (1 fg/mL to 10 pg/mL161 fg/mL[14]
Electrical-double-layer (EDL)-gated FET sensorN protein103 (0.4 ng/mL to 400 ng/mL4.60.34 ng/mL[48]
Organic electrochemical transistor immuno-sensorRBD106 (1.4 pg/mL to 1.4 μg/mL)1.61.4 pg/mL[49]
Si-based EGTS1 + S2105 (33 pg/mL to 3.3 μg/mL)50.8945 fg/mLThis work

4. Conclusions

We have successfully demonstrated the highly sensitive detection of SARS-CoV-2 spike protein using aptamer-functionalized Si-based EGTs. A lumped-capacitive model was utilized to analyze the aptamer–SC2 conjugates on the sensing performances in terms of dipole moments and capacitive components. The fabricated EGT showed higher sensitivities in the subthreshold regime, achieving LODs of 0.94 pg/mL and 20 pg/mL for current and voltage sensitivity, respectively. In addition, the EGT showed high sensitivity even in 1 × PBS solution. These results suggest that the Si-based EGTs using advanced microfabrication technology are promising in detecting SARS-CoV-2 spike proteins.

Author Contributions

Conceptualization, S.S.; methodology, S.S., S.K. and S.J.; validation, S.S. and J.-S.L.; investigation, S.S., W.C. and S.J.; data curation, J.D. and J.S.; writing—original draft preparation, S.S., K.K., J.S. and J.-S.L.; writing—review and editing, S.S. and J.-S.L.; supervision, J.-S.L. All authors have read and agreed to the published version of the manuscript.

Funding

This research was supported by National R&D Program through the National Research Foundation of Korea (NRF) funded by the Ministry of Science and ICT (2020M3H2A107804514).

Institutional Review Board Statement

Not applicable.

Informed Consent Statement

Not applicable.

Data Availability Statement

Data are contained within the article.

Conflicts of Interest

The authors declare no conflicts of interest.

References

  1. WHO. Novel Coronavirus (2019-nCoV) Situation Report; WHO: Geneva, Switzerland, 2020. [Google Scholar]
  2. Wang, H.; Li, X.; Li, T.; Zhang, S.; Wang, L.; Wu, X.; Liu, J. The genetic sequence, origin, and diagnosis of SARS-CoV-2. Eur. J. Clin. Microbiol. Infect. Dis. 2020, 39, 1629–1635. [Google Scholar] [CrossRef] [PubMed]
  3. Yao, H.; Song, Y.; Chen, Y.; Wu, N.; Xu, J.; Sun, C.; Zhang, J.; Weng, T.; Zhang, Z.; Wu, Z.; et al. Molecular Architecture of the SARS-CoV-2 Virus. Cell 2020, 183, 730–738.e713. [Google Scholar] [CrossRef] [PubMed]
  4. Zhao, P.; Praissman, J.L.; Grant, O.C.; Cai, Y.; Xiao, T.; Rosenbalm, K.E.; Aoki, K.; Kellman, B.P.; Bridger, R.; Barouch, D.H.; et al. Virus-Receptor Interactions of Glycosylated SARS-CoV-2 Spike and Human ACE2 Receptor. Cell Host Microbe 2020, 28, 586–601.e6. [Google Scholar] [CrossRef] [PubMed]
  5. Xiaojie, S.; Yu, L.; Lei, Y.; Guang, Y.; Min, Q. Neutralizing antibodies targeting SARS-CoV-2 spike protein. Stem Cell Res. 2020, 50, 102125. [Google Scholar] [CrossRef] [PubMed]
  6. Vasudevan, H.N.; Xu, P.; Servellita, V.; Miller, S.; Liu, L.; Gopez, A.; Chiu, C.Y.; Abate, A.R. Digital droplet PCR accurately quantifies SARS-CoV-2 viral load from crude lysate without nucleic acid purification. Sci. Rep. 2021, 11, 780. [Google Scholar] [CrossRef] [PubMed]
  7. Carter, L.J.; Garner, L.V.; Smoot, J.W.; Li, Y.; Zhou, Q.; Saveson, C.J.; Sasso, J.M.; Gregg, A.C.; Soares, D.J.; Beskid, T.R.; et al. Assay Techniques and Test Development for COVID-19 Diagnosis. ACS Cent. Sci. 2020, 6, 591–605. [Google Scholar] [CrossRef]
  8. Kaushik, A.K.; Dhau, J.S.; Gohel, H.; Mishra, Y.K.; Kateb, B.; Kim, N.Y.; Goswami, D.Y. Electrochemical SARS-CoV-2 Sensing at Point-of-Care and Artificial Intelligence for Intelligent COVID-19 Management. ACS Appl. Bio Mater. 2020, 3, 7306–7325. [Google Scholar] [CrossRef] [PubMed]
  9. Idili, A.; Parolo, C.; Alvarez-Diduk, R.; Merkoci, A. Rapid and Efficient Detection of the SARS-CoV-2 Spike Protein Using an Electrochemical Aptamer-Based Sensor. ACS Sens. 2021, 6, 3093–3101. [Google Scholar] [CrossRef]
  10. Zhou, C.; Lin, C.; Hu, Y.; Zan, H.; Xu, X.; Sun, C.; Zou, H.; Li, Y. Sensitive fluorescence biosensor for SARS-CoV-2 nucleocapsid protein detection in cold-chain food products based on DNA circuit and g-CNQDs@Zn-MOF. Lebensm. Wiss. Technol. 2022, 169, 114032. [Google Scholar] [CrossRef]
  11. Li, D.; Zhou, Z.; Sun, J.; Mei, X. Prospects of NIR fluorescent nanosensors for green detection of SARS-CoV-2. Sens. Actuators B Chem. 2022, 362, 131764. [Google Scholar] [CrossRef]
  12. Amouzadeh Tabrizi, M.; Acedo, P. An Electrochemical Impedance Spectroscopy-Based Aptasensor for the Determination of SARS-CoV-2-RBD Using a Carbon Nanofiber-Gold Nanocomposite Modified Screen-Printed Electrode. Biosensors 2022, 12, 142. [Google Scholar] [CrossRef]
  13. Cho, H.; Shim, S.; Cho, W.W.; Cho, S.; Baek, H.; Lee, S.M.; Shin, D.S. Electrochemical Impedance-Based Biosensors for the Label-Free Detection of the Nucleocapsid Protein from SARS-CoV-2. ACS Sens. 2022, 7, 1676–1684. [Google Scholar] [CrossRef] [PubMed]
  14. Seo, G.; Lee, G.; Kim, M.J.; Baek, S.H.; Choi, M.; Ku, K.B.; Lee, C.S.; Jun, S.; Park, D.; Kim, H.G.; et al. Rapid Detection of COVID-19 Causative Virus (SARS-CoV-2) in Human Nasopharyngeal Swab Specimens Using Field-Effect Transistor-Based Biosensor. ACS Nano 2020, 14, 5135–5142. [Google Scholar] [CrossRef] [PubMed]
  15. Shahdeo, D.; Chauhan, N.; Majumdar, A.; Ghosh, A.; Gandhi, S. Graphene-Based Field-Effect Transistor for Ultrasensitive Immunosensing of SARS-CoV-2 Spike S1 Antigen. ACS Appl. Bio Mater. 2022, 5, 3563–3572. [Google Scholar] [CrossRef] [PubMed]
  16. Chen, M.; Cui, D.; Zhao, Z.; Kang, D.; Li, Z.; Albawardi, S.; Alsageer, S.; Alamri, F.; Alhazmi, A.; Amer, M.R.; et al. Highly sensitive, scalable, and rapid SARS-CoV-2 biosensor based on In(2)O(3) nanoribbon transistors and phosphatase. Nano Res. 2022, 15, 5510–5516. [Google Scholar] [CrossRef] [PubMed]
  17. Kim, K.; Park, C.; Kwon, D.; Kim, D.; Meyyappan, M.; Jeon, S.; Lee, J.S. Silicon nanowire biosensors for detection of cardiac troponin I (cTnI) with high sensitivity. Biosens. Bioelectron. 2016, 77, 695–701. [Google Scholar] [CrossRef] [PubMed]
  18. Hideshima, S.; Sato, R.; Inoue, S.; Kuroiwa, S.; Osaka, T. Detection of tumor marker in blood serum using antibody-modified field effect transistor with optimized BSA blocking. Sens. Actuators B Chem. 2012, 161, 146–150. [Google Scholar] [CrossRef]
  19. Nguyen, T.T.K.; Nguyen, T.N.; Anquetin, G.; Reisberg, S.; Noel, V.; Mattana, G.; Touzeau, J.; Barbault, F.; Pham, M.C.; Piro, B. Triggering the Electrolyte-Gated Organic Field-Effect Transistor output characteristics through gate functionalization using diazonium chemistry: Application to biodetection of 2,4-dichlorophenoxyacetic acid. Biosens. Bioelectron. 2018, 113, 32–38. [Google Scholar] [CrossRef] [PubMed]
  20. Lin, P.; Luo, X.; Hsing, I.M.; Yan, F. Organic electrochemical transistors integrated in flexible microfluidic systems and used for label-free DNA sensing. Adv. Mater. 2011, 23, 4035–4040. [Google Scholar] [CrossRef]
  21. Bobbert, P.A.; Sharma, A.; Mathijssen, S.G.; Kemerink, M.; de Leeuw, D.M. Operational stability of organic field-effect transistors. Adv. Mater. 2012, 24, 1146–1158. [Google Scholar] [CrossRef]
  22. Sirringhaus, H. Reliability of Organic Field-Effect Transistors. Adv. Mater. 2009, 21, 3859–3873. [Google Scholar] [CrossRef]
  23. Shukoor, M.I.; Altman, M.O.; Han, D.; Bayrac, A.T.; Ocsoy, I.; Zhu, Z.; Tan, W. Aptamer-nanoparticle assembly for logic-based detection. ACS Appl. Mater. Interfaces 2012, 4, 3007–3011. [Google Scholar] [CrossRef] [PubMed]
  24. Hong, K.L.; Sooter, L.J. Single-Stranded DNA Aptamers against Pathogens and Toxins: Identification and Biosensing Applications. Biomed. Res. Int. 2015, 2015, 419318. [Google Scholar] [CrossRef] [PubMed]
  25. Kwon, J.; Narayan, C.; Kim, C.; Han, M.J.; Kim, M.; Jang, S.K. Development of a Subtype-Specific Diagnostic System for Influenza Virus H3N2 Using a Novel Virus-Based Systematic Evolution of Ligands by Exponential Enrichment (Viro-SELEX). J. Biomed. Nanotechnol. 2019, 15, 1609–1621. [Google Scholar] [CrossRef] [PubMed]
  26. Narayan, C.; Kwon, J.; Kim, C.; Kim, S.J.; Jang, S.K. Virus-based SELEX (viro-SELEX) allows development of aptamers targeting knotty proteins. Analyst 2020, 145, 1473–1482. [Google Scholar] [CrossRef] [PubMed]
  27. Rahman, M.S.; Han, M.J.; Kim, S.W.; Kang, S.M.; Kim, B.R.; Kim, H.; Lee, C.J.; Noh, J.E.; Kim, H.; Lee, J.O.; et al. Structure-Guided Development of Bivalent Aptamers Blocking SARS-CoV-2 Infection. Molecules 2023, 28, 4645. [Google Scholar] [CrossRef] [PubMed]
  28. Farrow, T.; Laumier, S.; Sandall, I.; van Zalinge, H. An Aptamer-Functionalised Schottky-Field Effect Transistor for the Detection of Proteins. Biosensors 2022, 12, 137. [Google Scholar] [CrossRef]
  29. Gunda, N.S.K.; Singh, M.; Norman, L.; Kaur, K.; Mitra, S.K. Optimization and characterization of biomolecule immobilization on silicon substrates using (3-aminopropyl)triethoxysilane (APTES) and glutaraldehyde linker. Appl. Surf. Sci. 2014, 305, 522–530. [Google Scholar] [CrossRef]
  30. Honnali, S.K.; Srinivasa Raghavan, V.; Ashwath, R.; Saravanavel, G.; Gunasekhar, K.R.; Sambandan, S.; Gorthi, S.S.; O’Driscoll, B.; Jenkins, D. Aptamer Functionalized ZnO Thin-Film Transistor Based Multiplexed Detection of Pb and E. coli in Water. IEEE Sens. J. 2022, 22, 21209–21217. [Google Scholar] [CrossRef]
  31. Gao, A.; Lu, N.; Wang, Y.; Li, T. Robust ultrasensitive tunneling-FET biosensor for point-of-care diagnostics. Sci. Rep. 2016, 6, 22554. [Google Scholar] [CrossRef]
  32. Shoorideh, K.; Chui, C.O. Optimization of the Sensitivity of FET-Based Biosensors via Biasing and Surface Charge Engineering. IEEE Trans. Electron. Devices 2012, 59, 3104–3110. [Google Scholar] [CrossRef]
  33. Tajima, N.; Takai, M.; Ishihara, K. Significance of antibody orientation unraveled: Well-oriented antibodies recorded high binding affinity. Anal. Chem. 2011, 83, 1969–1976. [Google Scholar] [CrossRef] [PubMed]
  34. Tschmelak, J.; Kumpf, M.; Kappel, N.; Proll, G.; Gauglitz, G. Total internal reflectance fluorescence (TIRF) biosensor for environmental monitoring of testosterone with commercially available immunochemistry: Antibody characterization, assay development and real sample measurements. Talanta 2006, 69, 343–350. [Google Scholar] [CrossRef] [PubMed]
  35. Armbruster, D.; Pry, T. Limit of blank, limit of detection and limit of quantitation. Clin. BioChem. 2008, 29, S49–S52. [Google Scholar]
  36. Kim, D.; Choi, W.; Shin, S.; Park, J.; Kim, K.; Jin, B.; Lee, J.-S. Lumped-Capacitive Modeling and Sensing Characteristics of an Electrolyte-Gated FET Biosensor for the Detection of the Peanut Allergen. IEEE Access 2021, 9, 168922–168929. [Google Scholar] [CrossRef]
  37. Macchia, E.; Manoli, K.; Holzer, B.; Di Franco, C.; Ghittorelli, M.; Torricelli, F.; Alberga, D.; Mangiatordi, G.F.; Palazzo, G.; Scamarcio, G.; et al. Single-molecule detection with a millimetre-sized transistor. Nat. Commun. 2018, 9, 3223. [Google Scholar] [CrossRef] [PubMed]
  38. Kurganov, B.I.; Lobanov, A.V.; Borisov, I.A.; Reshetilov, A.N. Criterion for Hill equation validity for description of biosensor calibration curves. Anal. Chem. Acta 2001, 19, 11–19. [Google Scholar] [CrossRef]
  39. He, J.; Liu, F.; Bian, W.; Feng, J.; Zhang, J.; Zhang, X. An approximate carrier-based compact model for fully depleted surrounding-gate MOSFETs with a finite doping body. Semicond. Sci. Technol. 2007, 22, 671–677. [Google Scholar] [CrossRef]
  40. Lee, S. Bias-dependent subthreshold characteristics and interface states in disordered semiconductor thin-film transistors. Semicond. Sci. Technol. 2019, 34, 11LT01. [Google Scholar] [CrossRef]
  41. Gao, A.; Lu, N.; Wang, Y.; Dai, P.; Li, T.; Gao, X.; Wang, Y.; Fan, C. Enhanced sensing of nucleic acids with silicon nanowire field effect transistor biosensors. Nano Lett. 2012, 12, 5262–5268. [Google Scholar] [CrossRef]
  42. Bhattacharyya, I.M.; Ron, I.; Chauhan, A.; Pikhay, E.; Greental, D.; Mizrahi, N.; Roizin, Y.; Shalev, G. A new approach towards the Debye length challenge for specific and label-free biological sensing based on field-effect transistors. Nanoscale 2022, 14, 2837–2847. [Google Scholar] [CrossRef] [PubMed]
  43. Palazzo, G.; De Tullio, D.; Magliulo, M.; Mallardi, A.; Intranuovo, F.; Mulla, M.Y.; Favia, P.; Vikholm-Lundin, I.; Torsi, L. Detection beyond Debye’s length with an electrolyte-gated organic field-effect transistor. Adv. Mater. 2015, 27, 911–916. [Google Scholar] [CrossRef] [PubMed]
  44. Garrote, B.L.; Fernandes, F.C.B.; Cilli, E.M.; Bueno, P.R. Field effect in molecule-gated switches and the role of target-to-receptor size ratio in biosensor sensitivity. Biosens. Bioelectron. 2019, 127, 215–220. [Google Scholar] [CrossRef]
  45. Shao, W.; Shurin, M.R.; Wheeler, S.E.; He, X.; Star, A. Rapid Detection of SARS-CoV-2 Antigens Using High-Purity Semiconducting Single-Walled Carbon Nanotube-Based Field-Effect Transistors. ACS Appl. Mater. Interfaces 2021, 13, 10321–10327. [Google Scholar] [CrossRef] [PubMed]
  46. Yakoh, A.; Pimpitak, U.; Rengpipat, S.; Hirankarn, N.; Chailapakul, O.; Chaiyo, S. Paper-based electrochemical biosensor for diagnosing COVID-19: Detection of SARS-CoV-2 antibodies and antigen. Biosens. Bioelectron. 2021, 176, 112912. [Google Scholar] [CrossRef]
  47. Zamzami, M.A.; Rabbani, G.; Ahmad, A.; Basalah, A.A.; Al-Sabban, W.H.; Nate Ahn, S.; Choudhry, H. Carbon nanotube field-effect transistor (CNT-FET)-based biosensor for rapid detection of SARS-CoV-2 (COVID-19) surface spike protein S1. Bioelectrochemistry 2022, 143, 107982. [Google Scholar] [CrossRef] [PubMed]
  48. Chen, P.H.; Huang, C.C.; Wu, C.C.; Chen, P.H.; Tripathi, A.; Wang, Y.L. Saliva-based COVID-19 detection: A rapid antigen test of SARS-CoV-2 nucleocapsid protein using an electrical-double-layer gated field-effect transistor-based biosensing system. Sens. Actuators B Chem. 2022, 357, 131415. [Google Scholar] [CrossRef]
  49. Barra, M.; Tomaiuolo, G.; Villella, V.R.; Esposito, S.; Liboa, A.; D’Angelo, P.; Marasso, S.L.; Cocuzza, M.; Bertana, V.; Camilli, E.; et al. Organic Electrochemical Transistor Immuno-Sensors for Spike Protein Early Detection. Biosensors 2023, 13, 739. [Google Scholar] [CrossRef]
Figure 1. (a) Optical microscope image of fabricated Si-based EGT. Inset: SEM image of nanonet channel. (b) A schematic of fabrication flow.
Biosensors 14 00124 g001
Figure 2. (a) A representative intrinsic transfer characteristics (Log (ID) vs. VG) and gate leakage characteristic of the fabricated EGT at VD = 0.1 V. The device was characterized in 0.01 × PBS solution. Inset: an output characteristic (ID vs. VD) at fixed VG ranging from 0.7 V~1.0 V. (b) A shift in the transfer curve with various [SC2] values. The inset shows the overall transfer curve. A compliance ID of 100 nA was applied to ensure reproducibility and avoid degradation.
Biosensors 14 00124 g002
Figure 3. Dependence of sensitivities on the operation regimes: (a) average SI vs. ID_AP and (b) average SV vs. ID_AP.
Biosensors 14 00124 g003
Figure 4. (a) SI and (b) SV vs. [SC2] at ID_AP = 1 nA. The red dashed lines represent the logistic fitted curves. The inset shows the SI and SV values obtained from blank samples without SC2 to calculate the LOD using the three-sigma method.
Biosensors 14 00124 g004
Figure 5. |Qs| vs. SV with various values of [SC2].
Biosensors 14 00124 g005
Figure 6. (a) The extracted effective dipole potential VDP_EFF and (b) effective capacitance CFN_EFF with various [SC2].
Biosensors 14 00124 g006
Figure 7. Dependence of (a) SI and (b) SV on the PBS concentrations. SI was extracted at ID_AP = 1 nA and [SC2] = 33 ng/mL.
Biosensors 14 00124 g007
Figure 8. Selectivity tests of (a) SI and (b) SV with 4 μg/mL influenza B virus, 15 μg/mL HCoV-HKU1, and unmodified EGTs.
Biosensors 14 00124 g008
Disclaimer/Publisher’s Note: The statements, opinions and data contained in all publications are solely those of the individual author(s) and contributor(s) and not of MDPI and/or the editor(s). MDPI and/or the editor(s) disclaim responsibility for any injury to people or property resulting from any ideas, methods, instructions or products referred to in the content.

