Article

Development and Evaluation of a Low-Cost Triglyceride Quantification Enzymatic Biosensor Using an Arduino-Based Microfluidic System

by
Jorge E. Pliego-Sandoval
1,*,
Arturo Díaz-Barbosa
1,
Luis A. Reyes-Nava
1,
María Angeles Camacho-Ruiz
2,
Laura Elena Iñiguez-Muñoz
1 and
Osmar Pinto-Pérez
1
1
Centro Universitario del Sur, Departamento de Ciencias Computacionales e Innovación Tecnológica, Universidad de Guadalajara, Av. Enrique Arreola Silva No. 883, Colón, Cd Guzmán 49000, Jalisco, Mexico
2
Centro Universitario del Norte, Laboratorio de Investigación en Biotecnología, Universidad de Guadalajara, Colotlán 46200, Jalisco, Mexico
*
Author to whom correspondence should be addressed.
Biosensors 2023, 13(8), 826; https://doi.org/10.3390/bios13080826
Submission received: 30 June 2023 / Revised: 10 August 2023 / Accepted: 12 August 2023 / Published: 17 August 2023
(This article belongs to the Special Issue Advances in Biosensors for Health-Care and Diagnostics)

Abstract

:
Overweight and obesity promote diabetes and heart disease onset. Triglycerides are key biomarkers for cardiovascular disease, strokes, and other health issues. Scientists have devised methods and instruments for the detection of these molecules in liquid samples. In this study, an enzymatic biosensor was developed using an Arduino-based microfluidic platform, wherein a lipolytic enzyme was immobilized on an ethylene-vinyl acetate polymer through physical adsorption. This low-cost optical biosensor employed a spectrophotometric transducer and was assessed in liquid samples to indirectly detect triglycerides and fatty acids using p-nitrophenol as an indicator. The average triglyceride level detected in the conducted experiments was 47.727 mg/dL. The biosensor exhibited a percentage of recovery of 81.12% and a variation coefficient of 0.791%. Furthermore, the biosensor demonstrated the ability to detect triglyceride levels without the need for sample dilution, ranging from 7.6741 mg/dL to 58.835 mg/dL. This study successfully developed an efficient and affordable enzymatic biosensor prototype for triglyceride and fatty acid detection. The lipolytic enzyme immobilization on the polymer substrate provided a stable and reproducible detection system, rendering this biosensor an exciting option for the detection of these molecules.

1. Introduction

Triacylglycerols, commonly known as triglycerides (TGs), are composed of a glycerol backbone esterified with three fatty acids [1]. TG concentration measurement of samples has gained increased importance due to its essential role in cellular metabolism, as an energy source, and for lipoprotein formation for the transport of dietary lipids. Determining triglyceride concentration can also provide information about potential health risks associated with various diseases [2,3].
Typical TG blood levels range between 40 and 150 mg/dL; however, it is considered borderline high if the level falls between 151 and 199 mg/dL. On the other hand, a level of 200 to 499 mg/dL is classified as very high [4]. Individuals with high levels of fatty acids and TGs tend to present conditions such as obesity, lipid disorders, and insulin resistance, leading to various diseases, such as heart attacks, strokes, pancreas inflammation, and atherosclerosis [5,6,7,8]. When the level of TGs in serum exceeds 500 mg/dL, it is used as a biomarker for cardiovascular disease [9].
An alternative for measuring triglyceride levels is through the use of biosensors. This is a tool that can help in the diagnosis, monitoring, and control of diseases related to triglyceride levels in the blood, especially cardiovascular diseases [9]. Biosensors rely on several detection systems, including amperometric [10], titrimetric [11], colorimetric [12], and spectrophotometric [13] systems. However, not all detection systems are feasible to implement in constructing a biosensor due to the high cost of the materials or reagents required [14,15].
Electrochemical transducers are highly preferred for biosensor construction due to their accuracy, rapidity, and sensitivity [16]. Based on their respective designs, there are some drawbacks associated with these transducers. These include potential issues when switching sample types, a limited number of usage cycles, a relatively short half-life [7], and possible interference in the ion sample [17].
Optical transducers are an advantageous option as they exhibit remarkable applicability in the field of healthcare. They feature high sensitivity, mechanical stability, low construction costs, easy integration, and real-time detection, and they can be integrated into lab-on-a-chip systems. These characteristics make them a valuable alternative to be considered [18].
Recently, there has been a growing trend toward employing various methods to incorporate an optical transducer and collect information conveniently and efficiently. As a result, the concept of the lab-on-a-chip device has emerged, enabling easy sample injection [19]. The on-chip laboratories possess multiple features that make them ideal for triglyceride analysis. They allow for sample injection, on-chip deposition, droplet formation structures, fluidic pathways, and detection sites through reactions on the same substrate. Additionally, they reduce sample and reagent volumes, minimize waste production, lower costs, increase energy efficiency, and minimize analysis time. Immobilized metabolites are also utilized, providing a comprehensive solution [20,21,22].
Various carriers have been investigated for immobilizing enzymes to detect TGs. These carriers include pectin [13] and polyvinyl chloride [23]. Polymers, as highlighted in the studies by Reddy and Narang [23,24], are particularly useful due to their adsorption capacity, thermal stability, environmental feasibility [13], and enabling the detection of various biomolecules [22].
Lipase is a versatile enzyme widely used in various fields such as clinical, environmental, industrial, process control, and development [24]. It catalyzes the hydrolysis of carboxylic ester bonds of TGs, resulting in the production of fatty acids, acylglycerides, and glycerol. It is applied and extends to the detection of TGs [7]. Additionally, studies reveal that multienzyme extracts containing lipases, glycerol kinase, and glycerol-3-phosphate oxidase are useful for triglyceride detection [25,26].
Therefore, this work proposes the development of a new microfluidic-based system capable of integrating a biosensing system for TG quantification using a lipolytic enzyme, an optical transducer, and an Arduino data acquisition board.
Several applications have been developed concerning optical transducers and the use of Arduino boards. One of the most representative examples is the work by Nandiyanto et al. [27], where a BH1750 sensor was utilized to construct a spectrophotometer using a white LED and an Arduino electronic card as an acquisition system for analyzing curcumin concentration.
Another noteworthy application is the work by Mitra et al. [28], who developed a portable device for colorimetric quantification of ketones and glucose levels in human urine. This device also utilized the same type of sensor along with an Arduino board.
For more specific applications, Hassanah et al. [13] manufactured an optical biosensor for detecting TGs using a combination of pectin hydrogel, a pH indicator, and a lipase enzyme. Iyer and Chattopadhyay [29] developed a biosensor to detect triglyceride contaminants with a colorimetric detection and a porcine pancreatic lipase immobilized nanocomposite.
Furthermore, Weston et al. [30,31] created a colorimetric biosensor for food quality detection. Weston’s biosensor identified free fatty acids as a quality marker in almond milk, allowing for the distinction between TGs and free fatty acids. The biosensor, made of polydiacetylenes and agarose, changes color from blue to red when exposed to spoiled almond milk.

2. Materials and Methods

2.1. Reagents and Materials

Chemicals used in this research include recombinant lipase B from Candida sp., expressed in Aspergillus niger, trioctanoin, p-nitrophenol (p-NP), p-nitrophenyl butyrate (p-NPB), Bradford Reagent, and bovine serum albumin, all of which were obtained from Sigma-Aldrich® (St. Louis, MI, USA).
In addition, the experimental setup included the utilization of various materials. For instance, the Ethylene-vinyl acetate (EVA) polymer or XP500 sourced from PromaPlast was employed. In addition, solvents and reagents encompassed ethanol, isopropyl alcohol (2-propanol), 3-(N-morpholino) propane sulfonic acid (MOPS), Triton X100, and phosphate buffer (50 mM, pH 7.2). All other chemicals and solvents used were of analytical reagent grade and spectroscopic grade, respectively. Furthermore, the equipment configuration featured a violet LED (light-emitting diode), a transduced BH1750 sensor, a 1.3 OLED display using I2C communication, PLA filament for 3D printing, and an Arduino micro board.

2.2. Instruments Used

An LED and optical transducer BH1750 were used to measure absorbance in the biosensor. The absorbance signal from the reaction mixture in the biosensor was compared with a Thermo Scientific™ Multiskan SkyHigh spectrophotometer. Additionally, essential laboratory equipment, such as an AREC magnetic stirrer and a BIORAD UltraRocker lateral stirrer, were utilized. The microfluidic device was fabricated using Ultimaker s3.

2.3. Enzyme Activity and Triglyceride Quantification

In order to determine enzymatic and triglyceride quantification, two different methods were employed. The first methodology was developed by Kordel et al. [32] and uses a chromogenic substrate; this method has a high level of sensitivity to confirm enzyme immobilization and transducer applicability.
However, the Kordel method does not involve the use of TGs; for that reason, the methodology of Mateos et al. [33] was implemented, which allows for the use of a triglyceride and p-nitrophenol as a chromophore to establish the level of fatty acids. To determine the concentrations of TGs, Glasser et al. [34] devised a method that takes into account three fatty acids released to calculate the activity. In the case of the CalB enzyme, it releases a fatty acid at the sn-1 position of the triglyceride structure [35,36], generating a diacylglycerol [37].
Furthermore, the protein concentration in the enzymatic extract was quantified using the procedure described by Bradford, which involves the use of bovine serum albumin as a standard [38]. This allowed for the estimation of the specific activity of the lipase, expressed in U/mg.

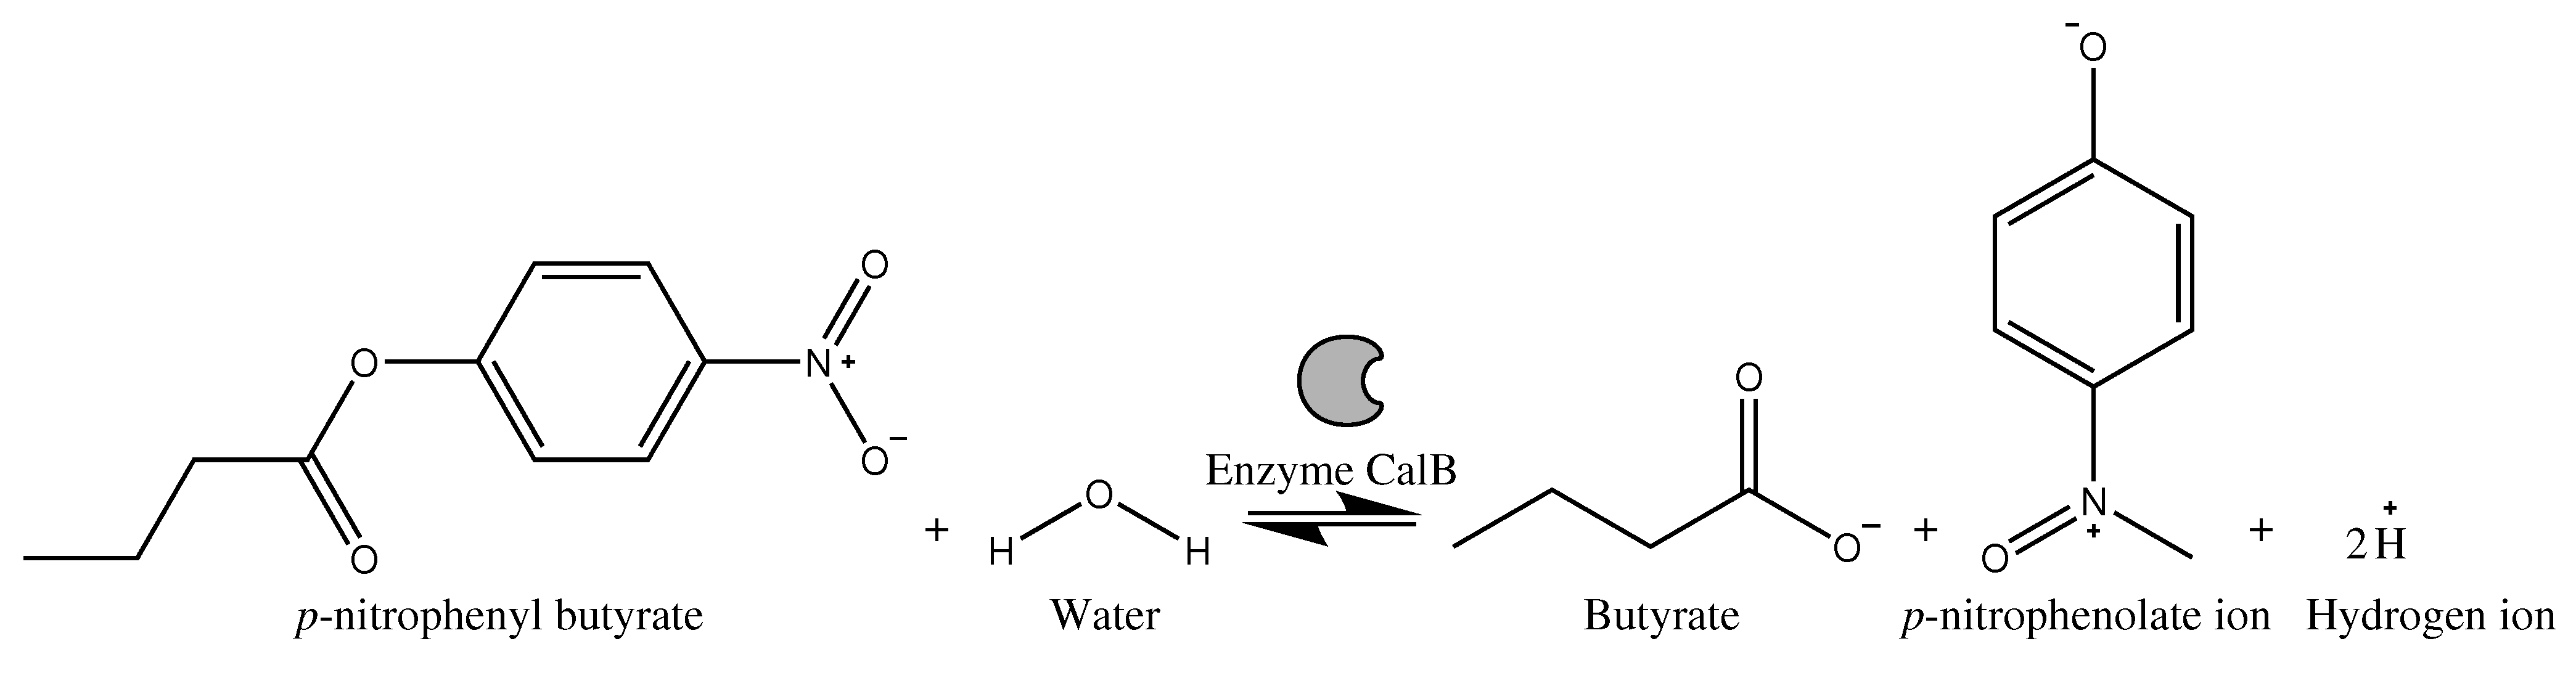
2.3.1. Enzyme Activity Using p-NPB as a Substrate

To determine enzymatic activity, the methodology of Kordel et al. [32] was used with some modifications. The Kordel method utilized p-nitrophenyl butyrate as a chromogenic substrate due to its exceptional sensitivity, quickness, and user-friendliness. For further details, please refer to Figure 1.
Initially, a stock solution of p−nitrophenyl butyrate (p-NPB) at 10 mM in 2−propanol was prepared and kept frozen until use. Additionally, a phosphate buffer solution at 50 mM, pH 7.0, was prepared.
For each well of the microplate, 180 μ L of buffer (18 parts), 10 μ L of substrate (one part), and 10 μ L of enzyme extract or immobilized enzyme (3 mg) were mixed. The reaction was carried out at a temperature of 30 ° C for 9 min, with 30 s intervals between each reading at a wavelength of 415 nm. Immediately afterward, the molar extinction coefficient of the released p−nitrophenol p−NP ( ϵ ) was measured spectrophotometrically at 415 nm using a standard curve of p−NP, with concentrations ranging from 0 to 500 μ M. One unit (U) of activity is defined as the amount of enzyme that will convert one μ mol of substrate (p−NP) in one minute ( μ mol/min) [39,40,41]. Equation (1) shows how the enzymatic activity was calculated [42]:
U m L = | Δ A | ϵ α β γ
where:
  • Δ A = kinetic slope (Abs/min);
  • α = reaction volume ( μ L);
  • β = sample volume ( μ L);
  • ϵ = molar extinction coefficient (min/ μ mol);
  • γ = appropriate sample dilution.

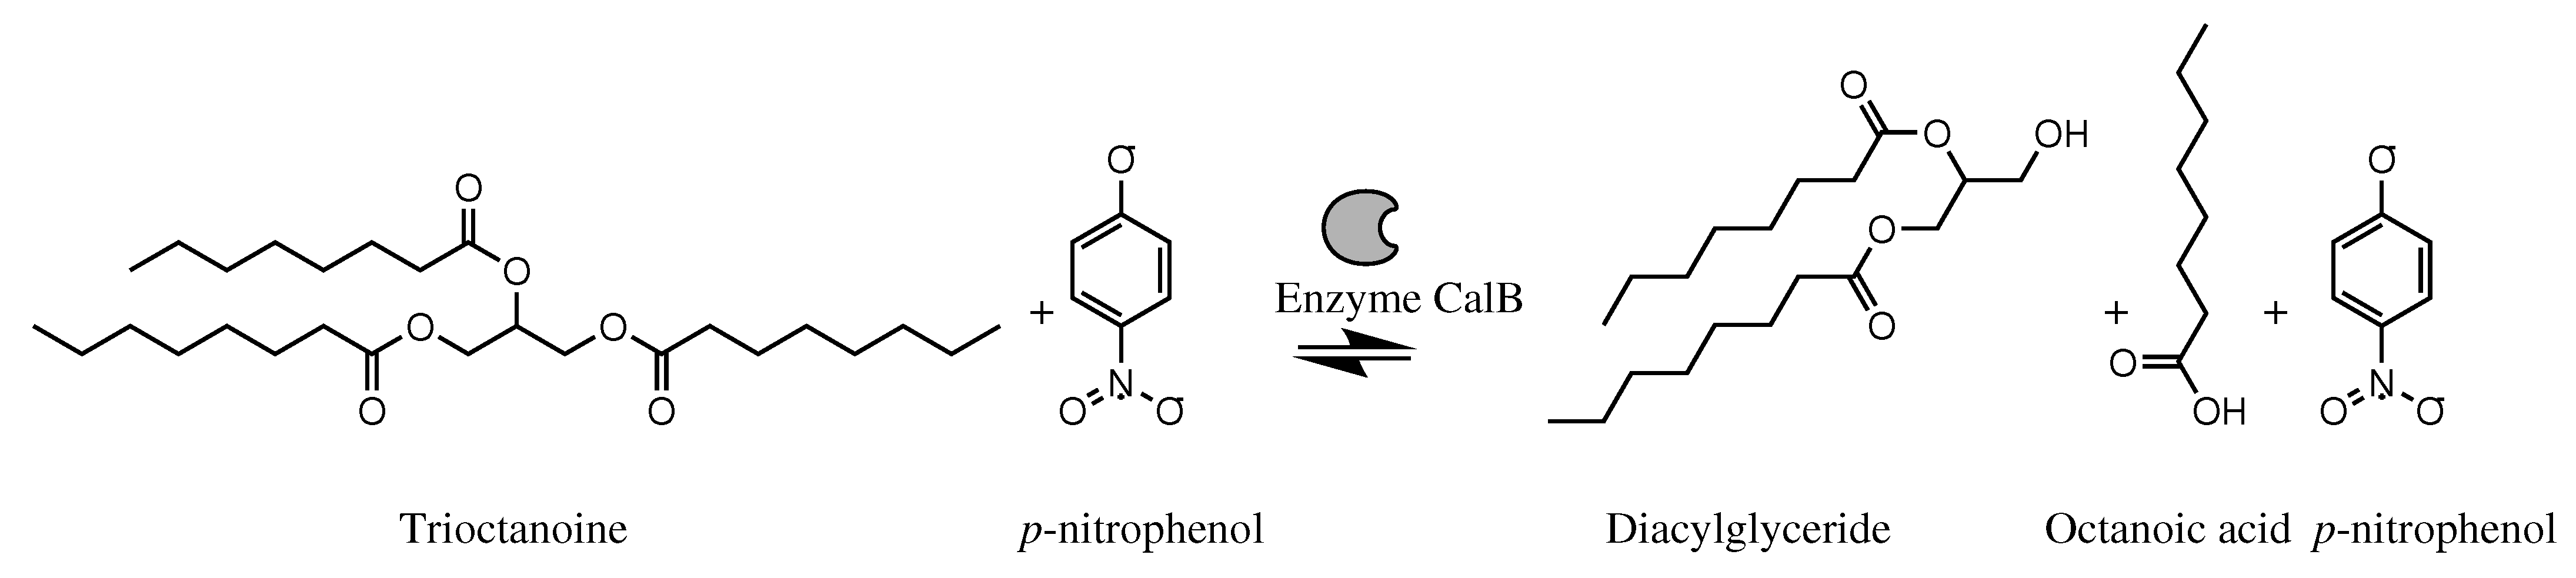
2.3.2. Enzymatic Activity Using TGs and p-Nitrophenol as a Reaction Indicator and Calculation Process of TG Quantification

The methodology of Mateos-Díaz et al. [33] was employed, with certain modifications; see Figure 2. A stock solution of trioctanoin at 25 mM in 2-propanol and a solution of p-NP 2.5 mM in 2-propanol were prepared. The buffer used was MOPS 2.5 mM pH 7.2, supplemented with 0.5% (w/v) Triton X100. The reaction mixture consisted of an emulsion containing 0.5 parts (5 μ L) of triglyceride solution, 0.5 parts (5 μ L) of p-NP solution, nine parts (90 μ L) of buffer, and two parts of either enzyme extract or immobilized enzyme. A standard curve of different concentrations of octanoic acid from 0 to 10 mM in the presence of p-NP was measured spectrophotometrically at 415 nm under the same conditions as the reaction. One unit (U) of activity is defined as the amount of enzyme that will convert one μ mol of substrate (octanoic acid) in one minute ( μ mol/min); see Equation (1).
After calculating the enzyme activity, it was multiplied by the duration of triglyceride hydrolysis to determine the number of moles released. Similar to the calculation of TGs, the conversion to mg/dL was carried out [43]. For the validation of the biosensor, the release of octanoic/caprylic acid was used as a standard to determine the total amount of TGs (trioctanoin) [44].
This is based on the moles of fatty acids obtained from enzymatic activity in triglyceride calculations [34,45]. According to the literature, the CalB enzyme has a preference for the sn-1 bond in the triglyceride structure [35,36], resulting in the release of a single chain of fatty acids and 2-monoacylglycerol molecules [37]. Therefore, the calculation for releasing one mole of fatty acid is based on this specificity and multiplied by three to estimate the level of TGs.
Based on the described methodology, the final TG levels in the sample can be estimated using Equation (2), where the enzyme activity reported in μ mol/min is multiplied by the reaction time, the three fatty acid chains, the molecular weight of the trioctanoin, and a conversion factor to convert from ( μ moles, mL, g) to (mol, dL, mg) to obtain mg/dL of the TGs in the sample.
T G = E A R t F a c M w t F c
where:
  • T G = triglyceride concentration ( mg dL );
  • E A = enzyme activity (U);
  • F a c = fatty acid chains in the triglycerides (3);
  • M w t = molecular weight of triglyceride (470.68 g mol );
  • R t = reaction time (10 min);
  • F c = conversion factor (0.1 mL mg mol dL g μ mol ).

2.4. Enzyme Immobilization with Ethylene-Vinyl Acetate (EVA) Polymer by Physical Adsorption

The methodology of Manoel et al. [46] was used as a base with some modifications, using the physical adsorption method. The EVA pellets were cut to <1 mm, and 0.5 g of the input was weighed. Subsequently, the polymer was washed with 5 mL of ethanol for 30 min under constant agitation. After that, 10 mL of water was added, and agitation was continued for 30 min. The mixture was then filtered and dried at room temperature. Following the activation of the support, 0.1 g of pellets were placed in Eppendorf tubes.
For immobilization, eight different concentrations of the lipase enzyme and phosphate buffer were used, resulting in a final volume of 1000 μ L in each Eppendorf tube (Table 1). The software Statgraphics Centurion XV® was utilized to improve the enzyme and polymer concentrations.
The ideal conditions for immobilization were determined through a two-way ANOVA analysis, taking into account the size of the polymer (cut or whole) and the concentration of the enzyme (ranging from 10 μ L to 700 μ L; see Table 1) as factors. Before conducting the ANOVA analysis, a Box–Cox transformation was executed by using the square root of the enzyme activity to obtain a normal data distribution.

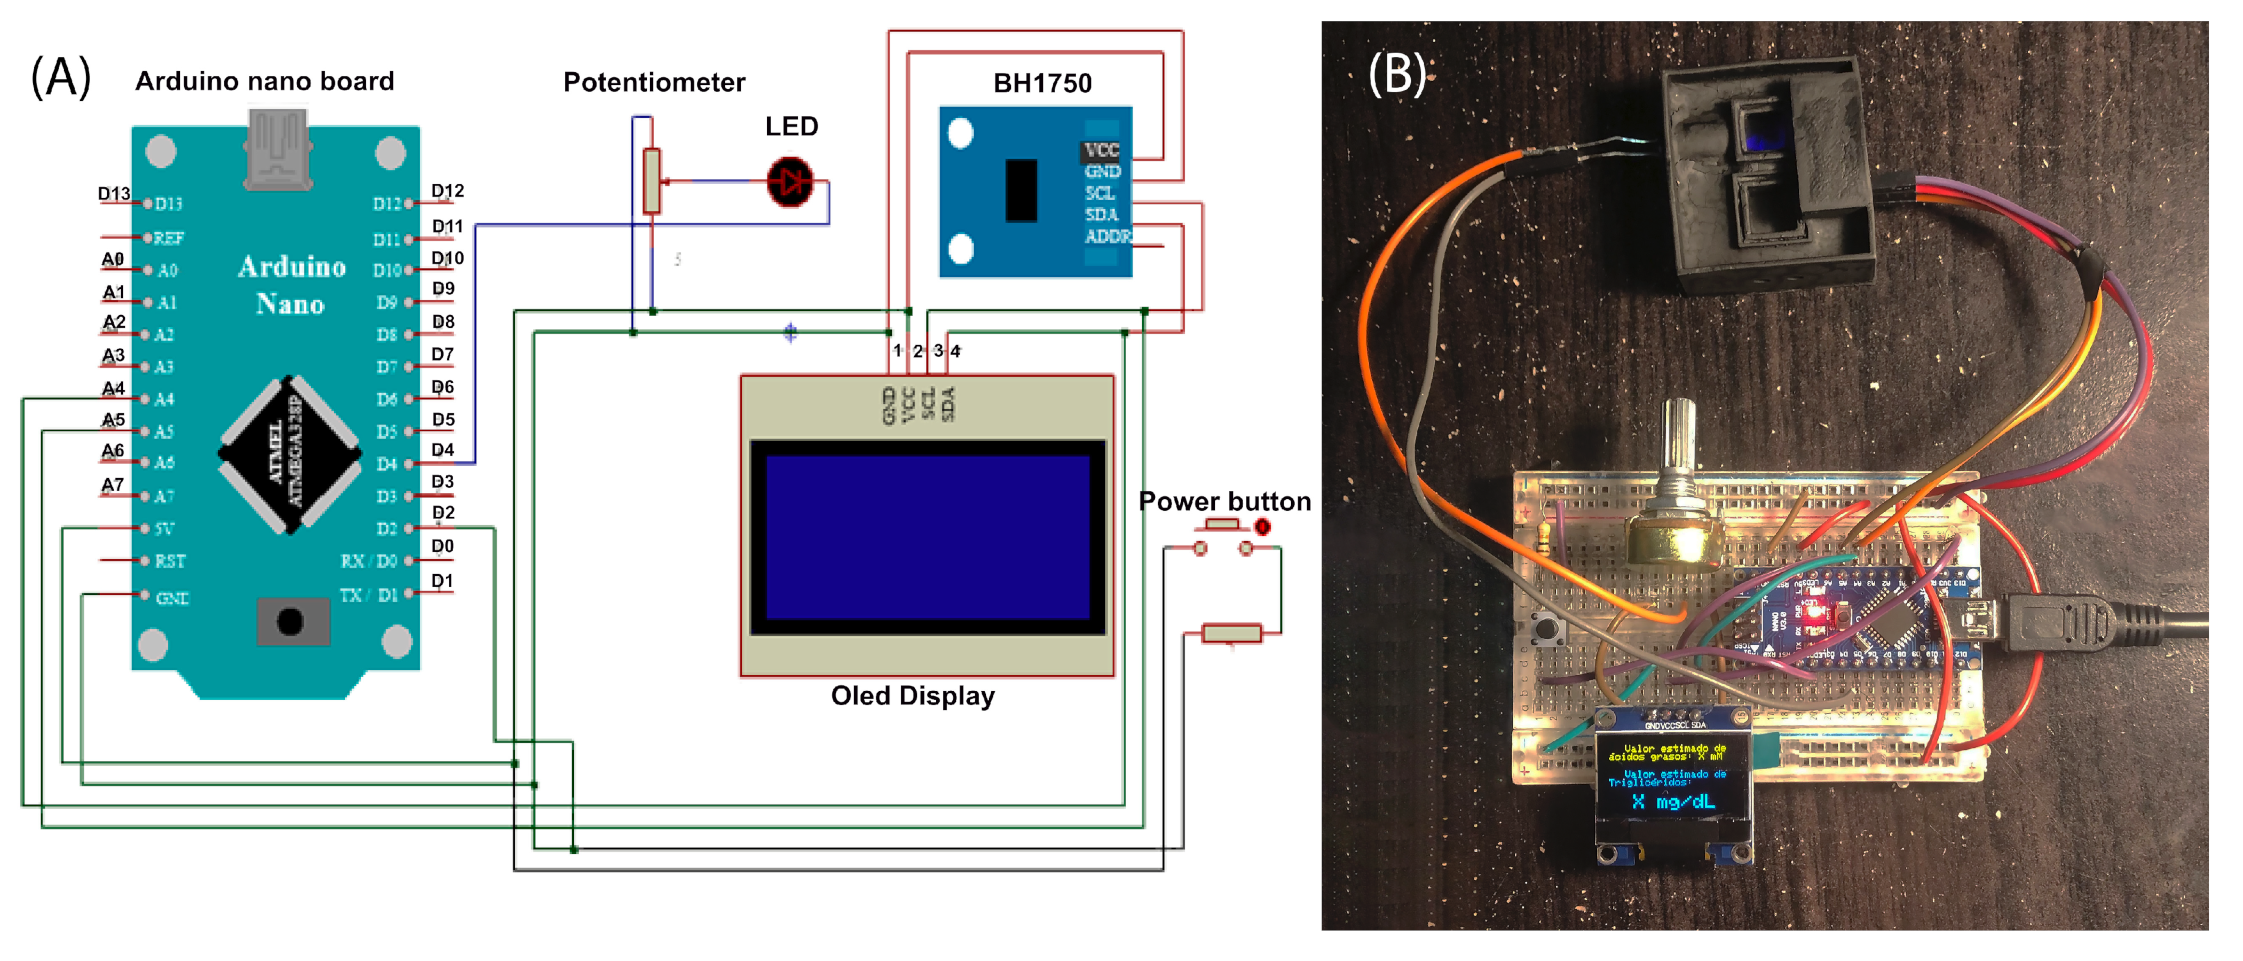
2.5. Construction of Optical TG Biosensor and Response Measurement

Regarding the transducer, optical sensor BH1750 was used as a receiver, coupled with a violet LED and an Arduino micro board equipped with a 1.3 OLED display I2C module with a resolution of 128 × 64 and an SH1106 driver as output construction, similar to the setup described by Nandiyanto et al. [27].
Arduino code was developed, along with the corresponding electrical circuit, to trigger the emission of a light beam from the LED upon pressing a button. The sensor captures the signal transmitted through the camera and automatically calculates the necessary data for determining the concentration of TGs. To minimize light reflection, the device was coated with a dark-colored material. Prior to sampling, the device and the light intensity were calibrated using distilled water.

3. Results and Discussion

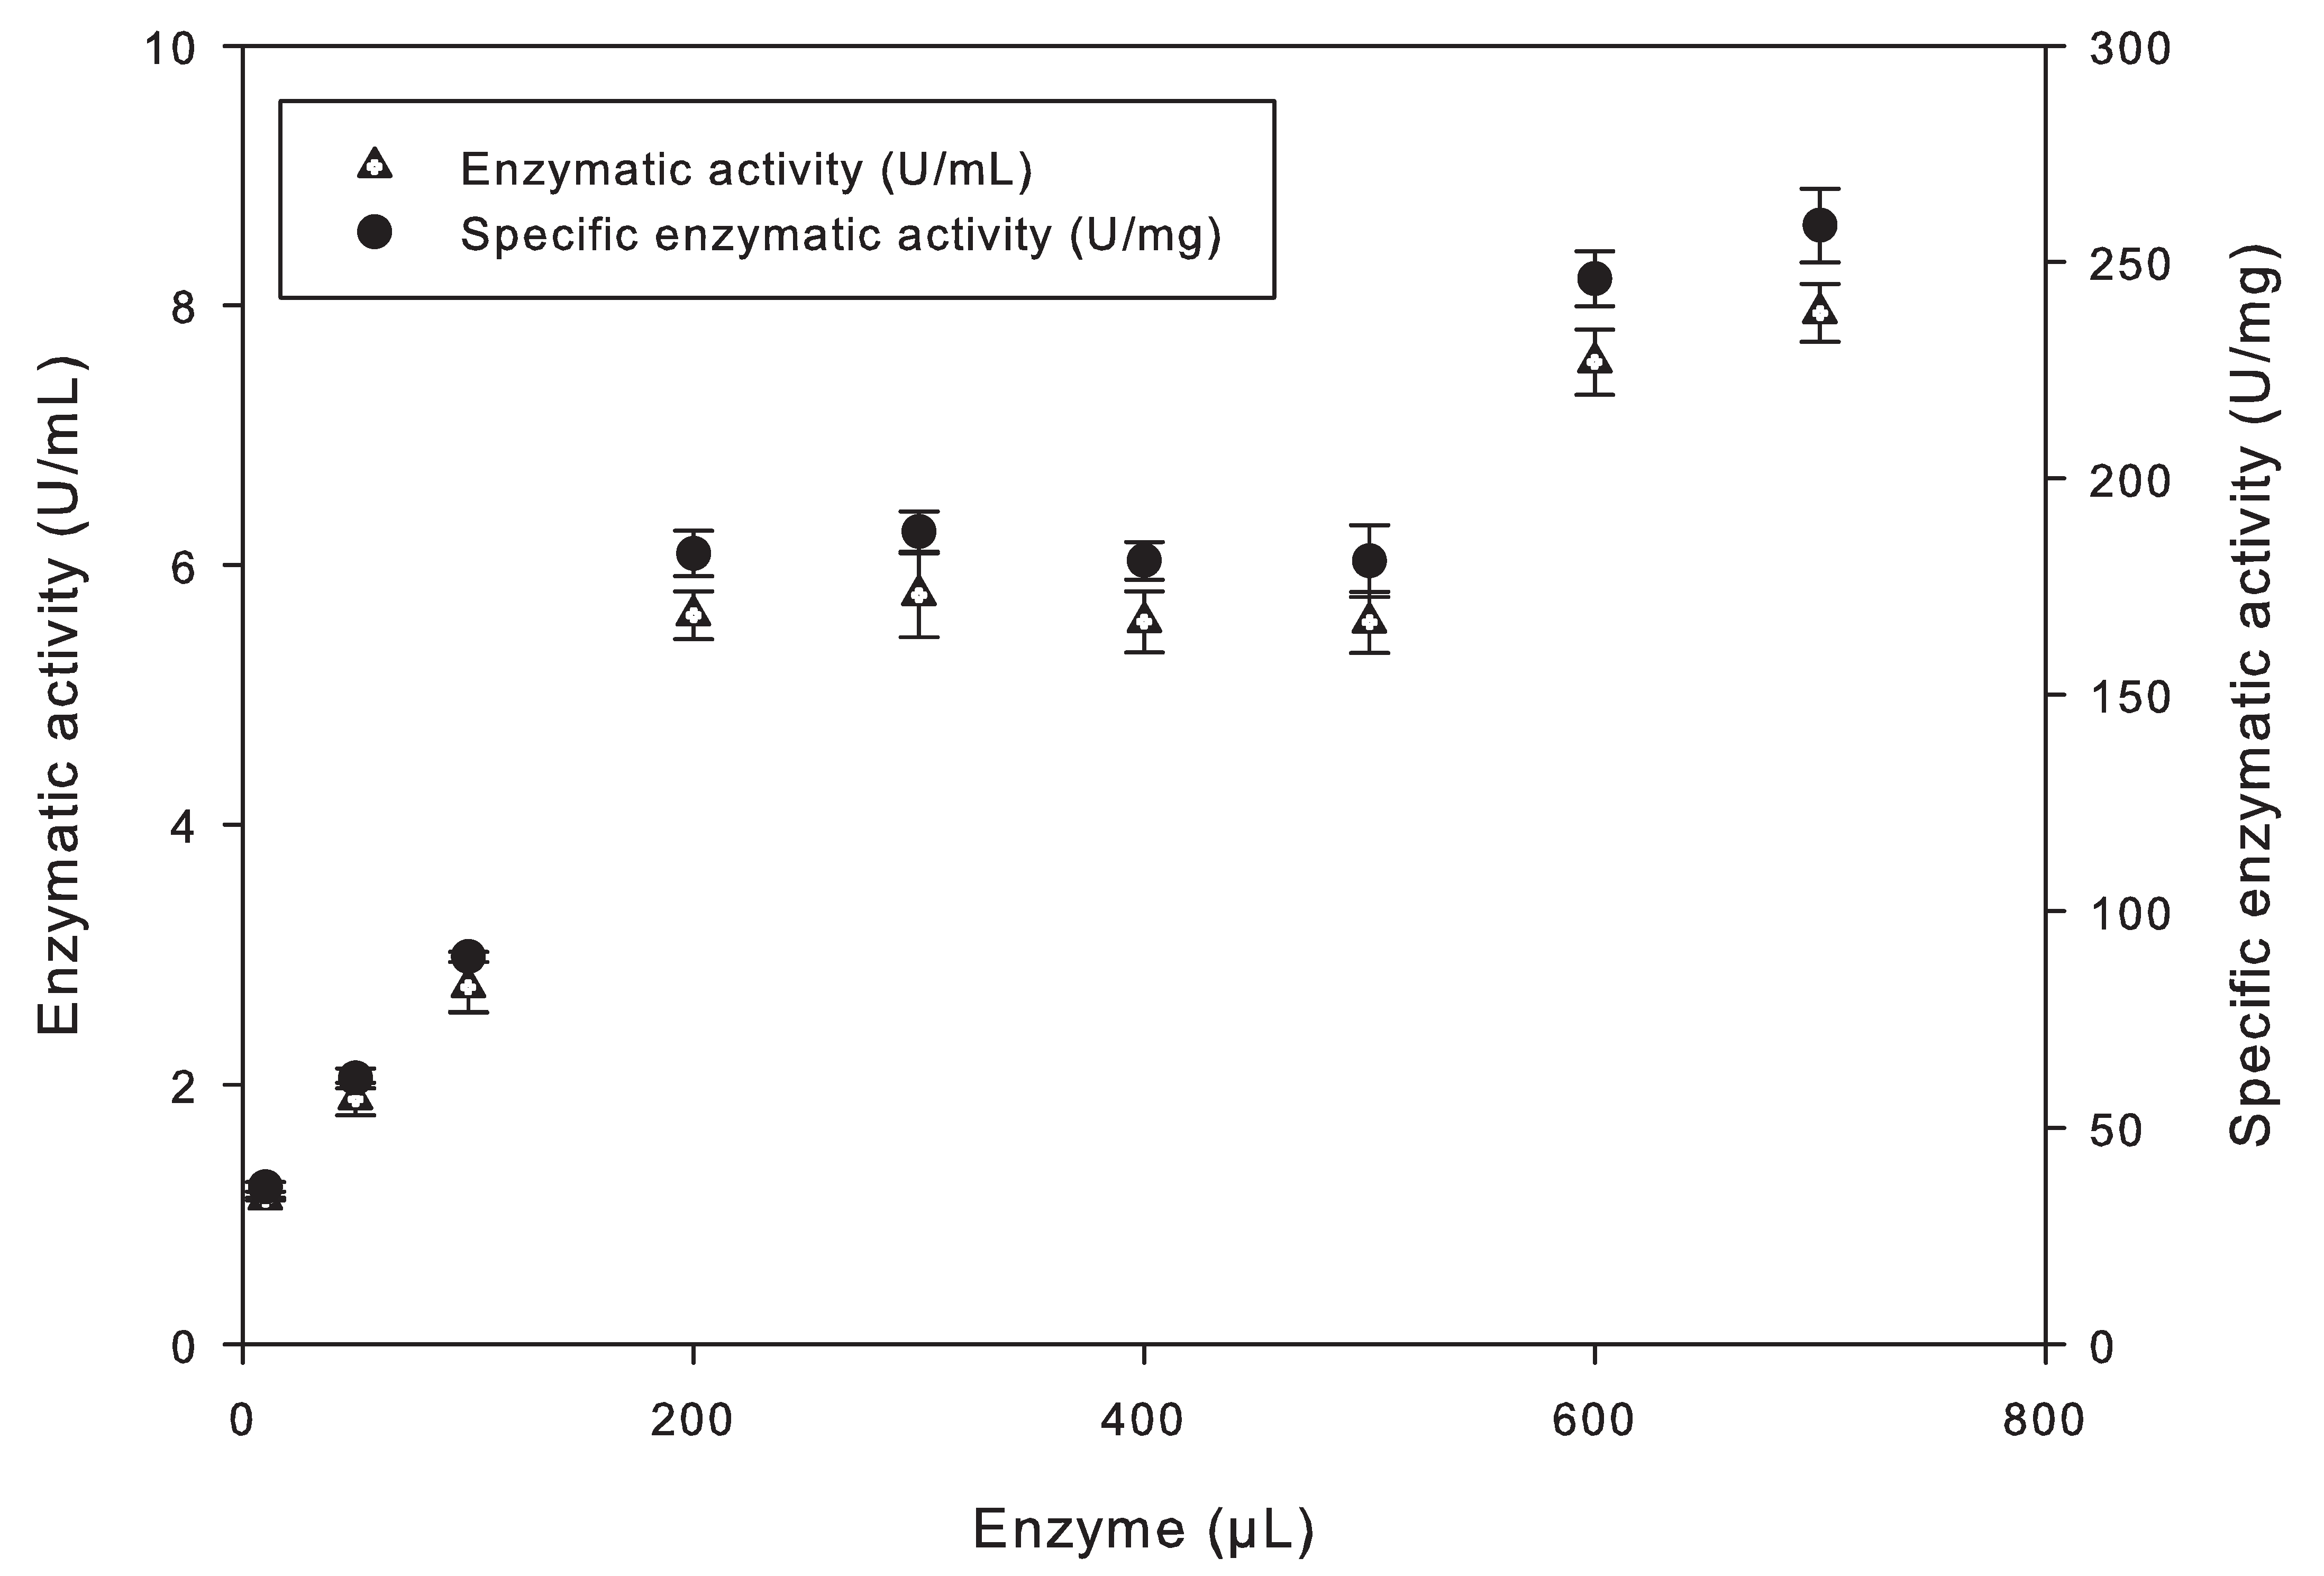
3.1. Characterization Immobilization of the CalB Lipase in EVA by Physic Adsorption

The ANOVA analysis, conducted at a 95% confidence level, did not reveal any statistically significant difference in the tested polymer sizes (p-value = 0.2324 > 0.05). Additionally, there was no interaction between polymer size and enzyme concentration (p-value = 0.7839 > 0.05), indicating that the effects of enzyme concentrations are independent of polymer size.
On the other hand, the enzyme concentration had a statistically significant effect on the enzyme activity in the immobilized samples (p-value = 0.0369 < 0.05). Different amounts of the enzyme were added to the immobilized solution to enhance the process (Table 1). The graph in Figure 3 shows the correlation between the enzyme volume in the polymer and its enzyme activity (U/ml) and specific enzyme activity (U/mg). The lipase activity escalated exponentially in the initial four samples (10 μ L, 50 μ L, 100 μ L, and 200 μ L), reaching its maximum at 200 μ L of the CalB enzyme, with an activity of 5.6118 U/mL.
Enzymatic activity remains within the range of 5 to 6 U/mL when the enzyme quantity ranged from 200 μ L to 500 μ L. Therefore, the immobilized product was selected with 200 μ L of the CalB enzyme, as higher concentrations would result in unnecessary enzyme waste. It is essential to mention that, according to this immobilization optimization, 200 μ L of the enzyme was used for each 100 mg of EVA, and only 9 mg to 54 mg of immobilized enzyme were placed in the biosensor.
The physicochemical properties of EVA (melting temperature, crystallinity, flexibility, adhesion, among others) vary depending on the vinyl acetate (VA) content, expanding the uses for this copolymer [47,48,49,50].
Pedersen and Eigtved [51] mentioned that the support should have a reduced pore size of no less than 100 Å. According to Cai et al. [52], the immobilization of the CalB enzyme was evaluated using different pore diameters (6.6, 8.1, and 12.5 nm), finding the highest enzymatic activity with a pore size of 12.5 nm (125 Å). Therefore, the EVA polymer, with a variable pore size ranging from 5 μ m to 9 μ m (depending on the %VA) [53], is considered a suitable support for the immobilization of the CalB enzyme.

3.2. TG Biosensor Fabrication

The device has a final dimension of 35 × 36 × 17 mm in width, height, and depth (W × H × D), respectively. It consists of two interconnected sections for sample transport and analysis through channels. Figure 4A shows the 3D printed microfluidic device with a cross-section providing a view of the internal parts with detailed sections.
Figure 4B shows two sections. The first section includes a first chamber with dimensions of 8.5 × 8.5 × 5.75 mm (W × H × D) for the initial process involving the immobilized enzyme. The second section incorporates an LED light source, Gy-302 BH1750 light intensity sensor for spectrophotometric measurements, and a second chamber measuring 9 × 9 × 4.55 mm (W × H × D) to analyze the sample in a manner similar to the “stopped flow” methodology in a sequential injection analysis system [42].
The channels used for fluid transportation have a diameter of 1 mm. In the second section, two compartments are specifically designed for the light emitter and receiver. The location for the LED is cylindrical, with a radius of 3.25 mm and a width of 12 mm. Additionally, there is a circular opening of 2 mm for the passage of light into the chamber where the sample is placed. On the other hand, the BH1750 sensor section has dimensions of 11 × 19.5 × 1.5 mm (W × H × D) and includes a cylindrical opening of 2 mm positioned near the receiving sensor area.
A potentiometer was used to regulate the intensity of emitted light in the spectrophotometer. Additionally, a violet-hued light-emitting diode (LED) was employed; this is the color absorbed in the wavelength range of 390–435 nm, reflecting the greenish yellow color observed in the enzymatic reaction [54].
A BH1750 light sensor was used to measure transmitted light. The biosensor was controlled using an Arduino Nano V3 board, programmed with Arduino software version 1.8.16. The OLED display I2C was connected as the output. Refer to the connection diagram in Figure 5A for more details. Moreover, in Figure 5B, the 3D printed device integrated with the electronic components on a breadboard can be observed.
To prevent light reflection, the device was painted in a dark color. Prior to sampling, the device and light intensity were calibrated using water as a reference substance.
It is important to acknowledge that using a low-cost sensor like the BH1750 and an LED light source may result in reduced sensitivity compared to commercial laboratory spectrophotometers, where it is possible to select a specific wavelength. The present transducer cost less than USD 1 (code 840,ISO 3166-1), and the Arduino Nano board cost less than USD 6 (code 840,ISO 3166-1), which makes this technology easily accessible for developing countries. The biosensor also has integrated microfluidic technology built on an easily accessible 3D printer and cost-effective electronics. The transducer and Arduino board have been validated in both chemical and biomedical contexts [27,28].
Commercial laboratory spectrophotometers, which were used for validation in this study, employ a xenon light source and a temperature control system, enabling measurements with high accuracy and precision, but at higher costs. In contrast, the device implemented in this work lacks a temperature control system and utilizes an LED light source, enabling measurements in a wavelength range of 390–435 nm approximately. Nonetheless, it offers the advantages of small size, portability, lower cost, and in situ monitoring.

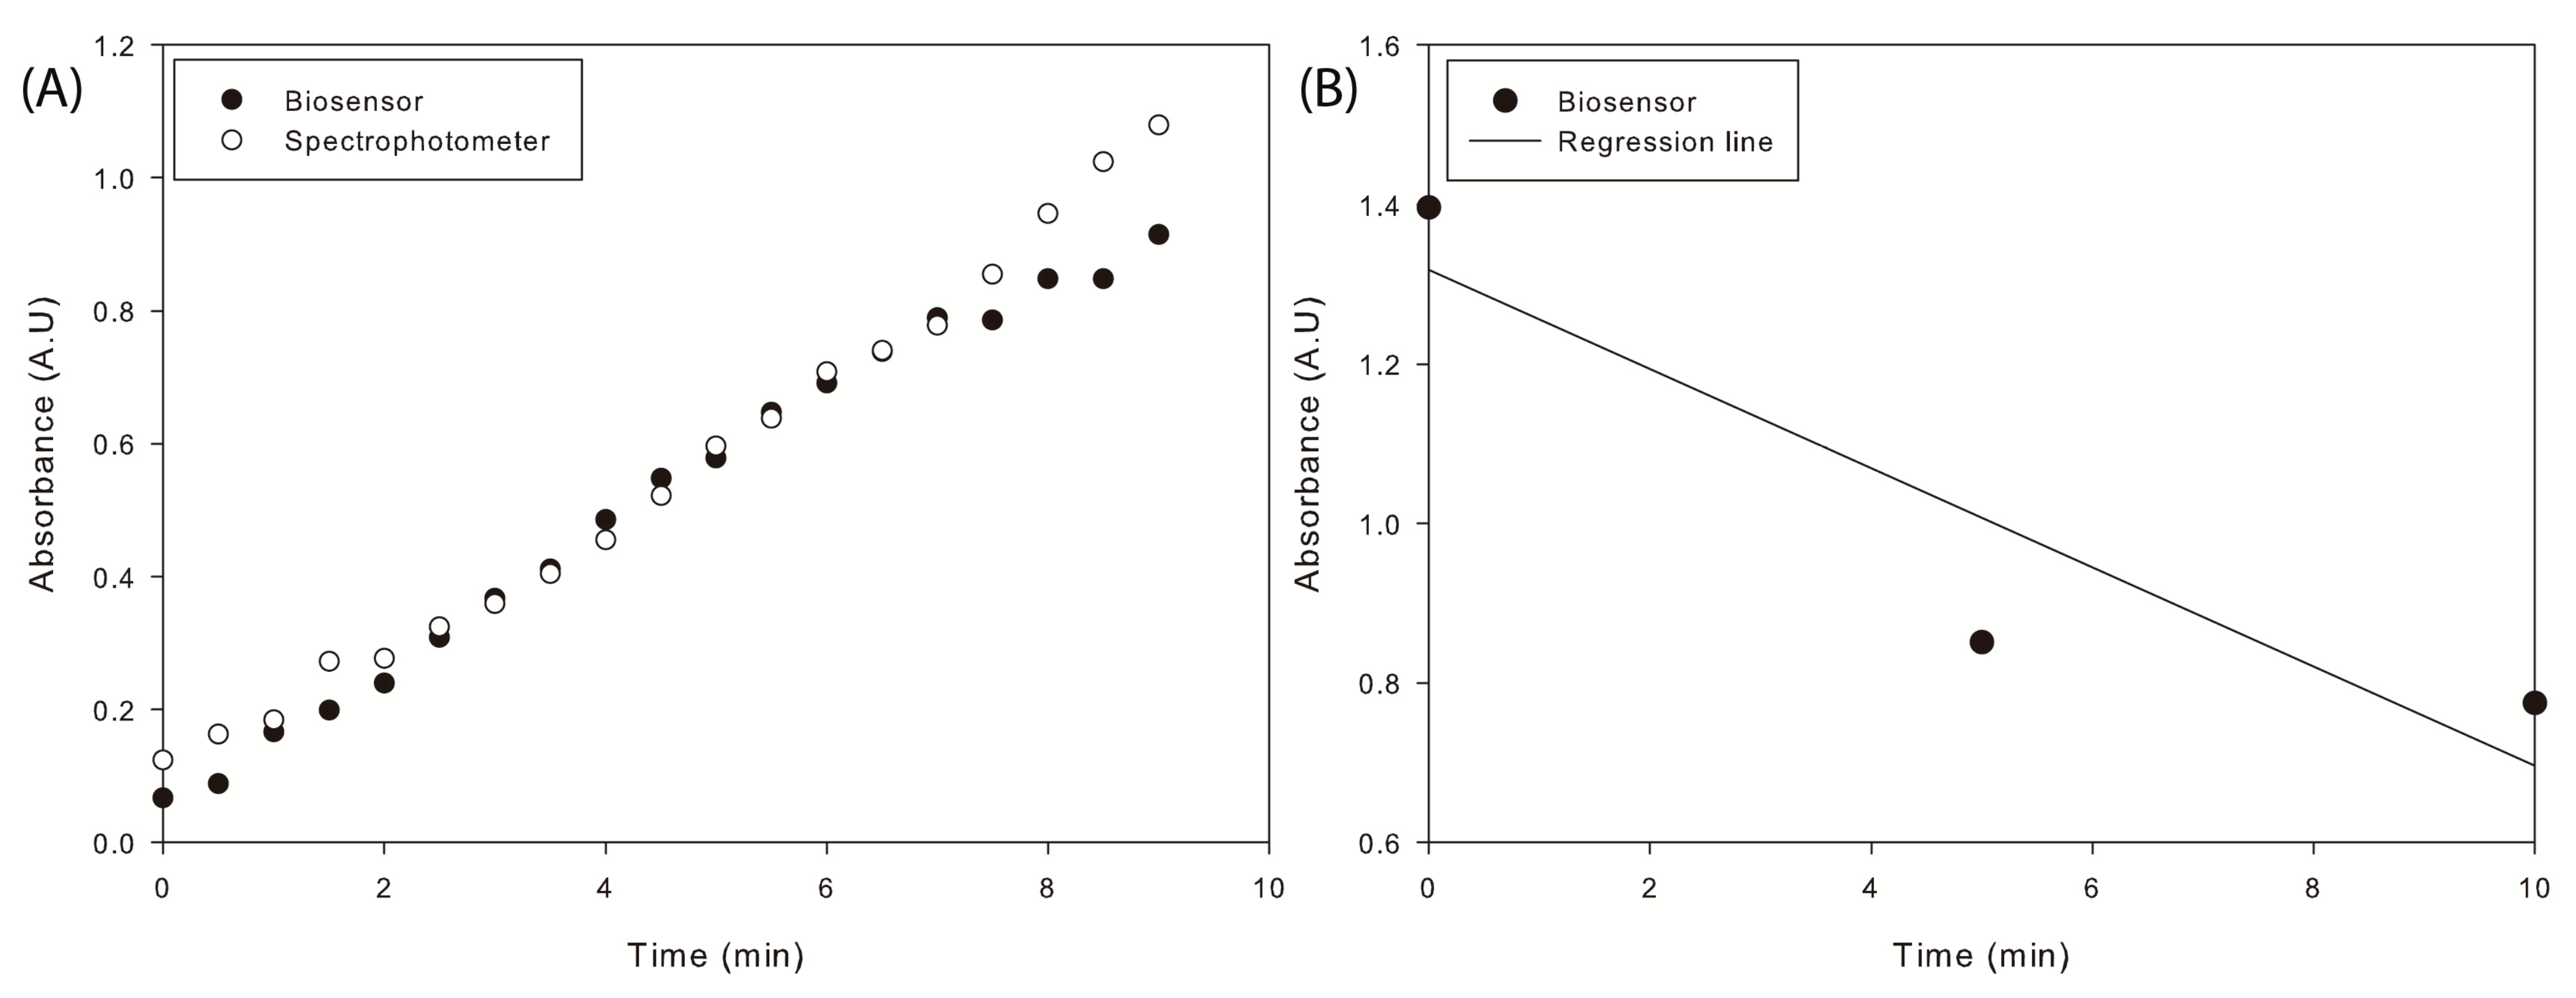
3.3. Response of the TG Optical Biosensor

Once the biological and electronic components of the device were integrated, tests were carried out using the immobilized material, to compare the kinetics in the spectrophotometer with the kinetics in the biosensor.
According to the results, the biosensor exhibited an enzyme activity of 5.4176 U/mL, while the spectrophotometer measured a slightly higher activity of 6.3647 U/mL. This difference in measurements can be attributed to the sensitivity of the BH1750 sensor, which may be slightly affected at low levels of received light [55]. Additionally, the lack of a temperature control system in the device can lead to a decrease in the enzymatic kinetic reaction rate.
Based on the data provided, the Kordel method adapted to the biosensor demonstrated an accuracy rate of 85.12%, with a coefficient of variation of 1.51%.
In this study, trioctanoin was used as stock solution, with a concentration of 25 mM or 58.835 mg/dL to estimate the concentration of TGs. Dilutions were performed to avoid saturation, and the absorbance was adjusted to 1.4 at the beginning of the reaction. The enzyme’s reaction rate was measured from this point.
Based on the described methodology, the measurement of trioctanoin was performed using 54 mg of immobilized enzyme, as shown in Figure 6B. The resulting slope was calculated as 0.0622. The enzyme CalB exhibited an enzymatic activity of 0.0338 U/mL over a reaction time of 10 min. After calculating the enzyme activity, it was multiplied by the duration of triglyceride hydrolysis to determine the number of moles released. These results can be used to estimate the final TG levels in the sample based on Equation (2). Therefore, the amount of triglyceride calculated is 47.7270 mg/dL. Comparing this result with the TG standard concentration of 25 mM (1.25 μ mol/mL or 58.835 mg/dL), the obtained percentage of recovery of added trioctanoin in the sample was 81.12%.
Table 2 provides a summary that compares the analytical attributes of different TG biosensors. This comparison encompasses optical, amperometric, potentiometric, impedimetric, and deoxymetric biosensors, detailing the enzyme type, immobilization method, optimal temperature, optimal pH, minimum detection limit, recovery, precision, response time, and accuracy.
Detection Limit. According to the analysis of enzyme kinetics, the maximum achievable concentration of TGs is 58.835 mg/dL without dilution. The minimum enzymatic activity is 0.005435 U/mL, which corresponds to 2.3512 mg/dL of fatty acids and 7.6741 mg/dL or 0.1630 mM of trioctanoin. The minimum detection limit is lower than that of the hydrogel pectin-based triglyceride optical biosensor (1.2387 mM; [13]) and higher than the nanocomposite biosensor (0.0113 mM; [29]). The minimum detection limit reported in some biosensors falls within the range of amperometric biosensors (10 7 mM to 14 mM), potentiometric biosensors (9 × 10 5 mM to 5 mM), and DO metric biosensors (0.0005 mM) [9].
Recovery. The percentage of recovery of added trioctanoin in samples (25 mM) in the present biosensor was 81.12% ± 0.6480% (mean ± SD; n = 5), which is comparable to the PVC membrane biosensor and the Prussian blue modified screen-printed amperometric biosensor (85.2–89.01% and 81%; [23] and [56], respectively).
Precision and response time. The within-batch coefficients of variation (CV) for TG determination in samples by the present sensor were 0.79% (n = 5), which is comparable to some colorimetric-based biosensors (2.5% and 0.0089% in [13] and [29], respectively) and lower than other electrochemical transducer biosensors (4.14% in [25]). The response time in this biosensor is 600 s, allowing for comparison with the behavior of the enzyme and the triglyceride with some colorimetric-based biosensors (300 s and 360–420 s in [13] and [29], respectively). On the other hand, certain amperometric, potentiometric, and DO metric biosensors show response times in the range or 2.5–1200 s, 30–2700 s, and 2.0–300 s, respectively; [9].
Accuracy. To study the accuracy of the present transducer, p-nitrophenol was measured by the Kordel method over 10 min with 30 s intervals, and the release of p-nitrophenolate ions by the spectrophotometer method was compared with the present biosensor. The values obtained by both methods showed a good correlation, with r 2 = 0.9635 (Figure 6A), which is superior to the PVC membrane biosensor and the CA membrane-bound enzyme biosensor (r 2 = 0.83 [23,57]) and comparable with the OD metric biosensor, EISCAP sensor, impedimetric/conductometric technique-based TG biosensor, and amperometric TG on pencil graphite electrode biosensor (r 2 = 0.9409 [60], r 2 = 0.9584 [58], r 2 =0.9801 [59], and r 2 = 0.99 [10], respectively).
While various types of triglyceride biosensors have been developed, a novel biosensor that uses an unreported polymer to immobilize CalB enzymes was implemented, and the immobilized enzymes were tested. The present biosensor offers an economical, affordable, and accessible option for monitoring TG levels.
In this context, trioctanoin is used in medicine and research as an alternative energy source for the body and was used as a standard in the determination of TGs in this work. The consumption of trioctanoin is an alternative to moderately increasing ketones without radically altering food intake or restricting carbohydrates. The diet with these TGs has been used for many years to treat refractory childhood epilepsy [61].
It is important to measure octanoic acid, since studies have identified it as a biomarker linked to the development of colorectal cancer [62].

4. Conclusions

An optical biosensor for TGs was established based on the immobilized CalB enzyme and a microfluidic device. All necessary parameters for constructing this biosensor have been determined, resulting in a detection limit and a response toward TG concentration.
This biosensor is excellent for detecting TGs with acceptable accuracy and precision. The experiments demonstrate the potential of this biosensor to detect TGs. Moreover, there are plans to further develop and enhance this specific TG biosensor to optimize its performance and customize it for use in natural blood serum. The objective is to improve its functionality and ensure its compatibility for practical applications in clinical settings.

Author Contributions

Conceptualization, A.D.-B.; Data curation, A.D.-B.; Formal analysis, J.E.P.-S. and A.D.-B.; Funding acquisition, J.E.P.-S., L.A.R.-N. and L.E.I.-M.; Investigation, J.E.P.-S. and A.D.-B.; Methodology, J.E.P.-S., L.A.R.-N., M.A.C.-R., L.E.I.-M. and A.D.-B.; Project administration, J.E.P.-S.; Resources, J.E.P.-S.; Software, A.D.-B.; Supervision, J.E.P.-S.; Validation, J.E.P.-S., A.D.-B. and M.A.C.-R.; Visualization, J.E.P.-S.; Writing—original draft, J.E.P.-S., M.A.C.-R. and O.P.-P.; Writing—review & editing, J.E.P.-S., L.A.R.-N., M.A.C.-R. and L.E.I.-M. All authors have read and agreed to the published version of the manuscript.

Funding

This research was funded by Guadalajara University (UdeG), Centro Universitario del Sur (CuSur), grant number: SAC/CIP/D/10/22.

Data Availability Statement

Not applicable.

Acknowledgments

This work would not have been possible without the financial support of Guadalajara University and the Division of Natural and Technological Sciences.

Conflicts of Interest

The authors declare no conflict of interest.

Abbreviations

The following abbreviations are used in this manuscript:
TGstriglycerides
TGtriglyceride
EVAethylene-vinyl acetate
PLApolylactic acid
CalBCandida antarctica lipase B
p-NPBp-nitrophenol butyrate
p-NPp-nitrophenol
MOPS3-(N-morpholino) propane sulfonic acid
ANOVAanalysis of variance
VAvinyl acetate
LEDlight-emitting diode

References

  1. Bayly, G.R. Lipids and disorders of lipoprotein metabolism. In Clinical Biochemistry: Metabolic and Clinical Aspects, 3rd ed.; Elsevier: Amsterdam, The Netherlands, 2014; pp. 702–736. [Google Scholar] [CrossRef]
  2. Banerjee, Y.; Taranikanti, V.; Bayoumi, R. Triglyceride-mediated pathways and coronary heart disease. Lancet 2010, 376, 956. [Google Scholar] [CrossRef]
  3. Mondal, K.; Ali, M.A.; Singh, C.; Sumana, G.; Malhotra, B.D.; Sharma, A. Highly sensitive porous carbon and metal/carbon conducting nanofiber based enzymatic biosensors for triglyceride detection. Sens. Actuators B Chem. 2017, 246, 202–214. [Google Scholar] [CrossRef]
  4. Pundir, C.S.; Sandeep, B.; Narang, J. Construction of an amperometric triglyceride biosensor using PVA membrane bound enzymes. Clin. Biochem. 2010, 43, 467–472. [Google Scholar] [CrossRef]
  5. Ponte, C.I. Redescubriendo los triglicéridos como factor de riesgo cardiovascular. Av. Cardiol 2009, 29, 367–376. [Google Scholar]
  6. Cascio, G.; Schiera, G.; Di Liegro, I. Dietary Fatty Acids in Metabolic Syndrome, Diabetes and Cardiovascular Diseases. Curr. Diabetes Rev. 2012, 8, 2–17. [Google Scholar] [CrossRef]
  7. Perez, A.K.; Iliná, A.; Sandoval, J.; Zon, M.A.; Arévalo, F.J.; Segura, E.P.; José, L. Biosensores Electroquímicos para la Detección de Triglicéridos Basados en el Uso de la Enzima Lipasa. Rev. Cient. De La Univ. Autónoma De Coahuila 2015, 7, 1–13. [Google Scholar]
  8. González-Becerra, K.; Ramos-Lopez, O.; Barrón-Cabrera, E.; Riezu-Boj, J.; Milagro, F.; Martínez-López, E.; Martínez, J. Fatty acids, epigenetic mechanisms and chronic diseases: A systematic review. Lipids Health Dis. 2019, 18, 178. [Google Scholar] [CrossRef]
  9. Pundir, C.S.; Narwal, V. Biosensing methods for determination of triglycerides: A review. Biosens. Bioelectron. 2018, 100, 214–227. [Google Scholar] [CrossRef] [PubMed]
  10. Narwal, V.; Pundir, C.S. An improved amperometric triglyceride biosensor based on co-immobilization of nanoparticles of lipase, glycerol kinase and glycerol 3-phosphate oxidase onto pencil graphite electrode. Enzym. Microb. Technol. 2017, 100, 11–16. [Google Scholar] [CrossRef]
  11. Ibadullaeva, S.Z.; Appazov, N.O.; Tarahovsky, Y.S.; Zamyatina, E.A.; Fomkina, M.G.; Kim, Y.A. Amperometric Multi-Enzyme Biosensors: Development and Application, a Short Review. Biophys. Russ. Fed. 2019, 64, 696–707. [Google Scholar] [CrossRef]
  12. Alawsi, T.; Mattia, G.P.; Al-Bawi, Z.; Beraldi, R. Smartphone-based colorimetric sensor application for measuring biochemical material concentration. Sens. Bio-Sens. Res. 2021, 32, 100404. [Google Scholar] [CrossRef]
  13. Hasanah, U.; Md Sani, N.D.; Heng, L.Y.; Idroes, R.; Safitri, E. Construction of a hydrogel pectin-based triglyceride optical biosensor with immobilized lipase enzymes. Biosensors 2019, 9, 135. [Google Scholar] [CrossRef]
  14. Cano, J.B.; Buonasera, K.; Pezzotti, G. Transduction methods used on biosensors: Amperometry and fluorescence. Rev. Fac. De Ing. 2014, 2198558, 104–115. [Google Scholar]
  15. Polat, E.O.; Cetin, M.M.; Tabak, A.F.; Güven, E.B.; Uysal, B.Ö.; Arsan, T.; Kabbani, A.; Hamed, H.; Gül, S.B. Transducer Technologies for Biosensors and Their Wearable Applications. Biosensors 2022, 12, 385. [Google Scholar] [CrossRef] [PubMed]
  16. Di Tocco, A.; Robledo, S.N.; Osuna, Y.; Sandoval-Cortez, J.; Granero, A.M.; Vettorazzi, N.R.; Martínez, J.L.; Segura, E.P.; Iliná, A.; Zon, M.A.; et al. Development of an electrochemical biosensor for the determination of triglycerides in serum samples based on a lipase/magnetite-chitosan/copper oxide nanoparticles/multiwalled carbon nanotubes/pectin composite. Talanta 2018, 190, 30–37. [Google Scholar] [CrossRef]
  17. Fernandez, R.E.; Hareesh, V.; Bhattacharya, E.; Chadha, A. Comparison of a potentiometric and a micromechanical triglyceride biosensor. Biosens. Bioelectron. 2009, 24, 1276–1280. [Google Scholar] [CrossRef]
  18. Damborský, P.; Švitel, J.; Katrlík, J. Optical biosensors. Essays Biochem. 2016, 60, 91–100. [Google Scholar] [CrossRef]
  19. Gao, R.; Wu, Y.; Huang, J.; Song, L.; Qian, H.; Song, X.; Cheng, L.; Wang, R.; bao Luo, L.; Zhao, G.; et al. Development of a portable and sensitive blood serum test system using LED-based absorption photometry and pump-free microfluidic technology. Sens. Actuators B Chem. 2019, 286, 86–93. [Google Scholar] [CrossRef]
  20. Srinivasan, V.; Pamula, V.K.; Fair, R.B. An integrated digital microfluidic lab-on-a-chip for clinical diagnostics on human physiological fluids. Lab A Chip 2004, 4, 310–315. [Google Scholar] [CrossRef] [PubMed]
  21. Husser, M.C.; Vo, P.Q.; Sinha, H.; Ahmadi, F.; Shih, S.C. An Automated Induction Microfluidics System for Synthetic Biology. ACS Synth. Biol. 2018, 7, 933–944. [Google Scholar] [CrossRef]
  22. Yamaguchi, H.; Miyazaki, M. Enzyme-immobilized microfluidic devices for biomolecule detection. TrAC Trends Anal. Chem. 2023, 159, 116908. [Google Scholar] [CrossRef]
  23. Narang, J.; Minakshi; Bhambi, M.; Pundir, C.S. Fabrication of an amperometric triglyceride biosensor based on PVC membrane. Anal. Lett. 2010, 43, 1–11. [Google Scholar] [CrossRef]
  24. Reddy, R.R.K.; Chadha, A.; Bhattacharya, E. Porous silicon based potentiometric triglyceride biosensor. Biosens. Bioelectron. 2001, 16, 313–317. [Google Scholar] [CrossRef] [PubMed]
  25. Narang, J.; Chauhan, N.; Rani, P.; Pundir, C.S. Construction of an amperometric TG biosensor based on AuPPy nanocomposite and poly (indole-5-carboxylic acid) modified Au electrode. Bioprocess Biosyst. Eng. 2012, 36, 425–432. [Google Scholar] [CrossRef]
  26. Pundir, C.S.; Narang, J. Determination of triglycerides with special emphasis on biosensors: A review. Int. J. Biol. Macromol. 2013, 61, 379–389. [Google Scholar] [CrossRef]
  27. Nandiyanto, A.B.D.; Zaen, R.; Oktiani, R.; Abdullah, A.G.; Riza, L.S. A simple, rapid analysis, portable, low-cost, and Arduino-based spectrophotometer with white LED as a light source for analyzing solution concentration. Telkomnika Telecommun. Comput. Electron. Control. 2018, 16, 580–585. [Google Scholar] [CrossRef]
  28. Mitra, S.; Basak, M.; Biswas, S.; Gooh Pattader, P.S. Digital electronic based portable device for colorimetric quantification of ketones and glucose level in human urine. Measurement 2023, 214, 112848. [Google Scholar] [CrossRef]
  29. Iyer, M.B.; Chattopadhyay, S. Colourimetric detection of triglycerides using porcine pancreatic lipase immobilized nanocomposite biosensor. Biomass Conv. Bioref. 2023. [Google Scholar] [CrossRef]
  30. Weston, M.; Kuchel, R.P.; Chandrawati, R. A Polydiacetylene-Based Colorimetric Sensor as an Active Use-By Date for Plant-Based Milk Alternatives. Macromol. Rapid Commun. 2020, 41, 1–7. [Google Scholar] [CrossRef]
  31. Weston, M. Colourimetric Sensors for Rapid Detection of Contaminants and Food Quality. Ph.D. Thesis, UNSW, Sydney, Australia, 2022. Available online: https://unsworks.unsw.edu.au/entities/publication/bc6d7c05-e180-4562-af7b-83b2dcb263bd/full (accessed on 7 August 2023).
  32. Kordel, M.; Hofmann, B.; Schomburg, D.; Schmid, R.D. Extracellular lipase of Pseudomonas sp. strain ATCC 21808: Purification, characterization, crystallization, and preliminary X-ray diffraction data. J. Bacteriol. 1991, 173, 4836–4841. [Google Scholar] [CrossRef]
  33. Mateos-Díaz, E.; Rodríguez, J.A.; Ángeles Camacho-Ruiz, M.; Mateos-Díaz, J.C. High-Throughput Screening Method for Lipases/Esterases. Lipases Phospholipases 2012, 861, 89–100. [Google Scholar] [CrossRef]
  34. Glasser, F.; Doreau, M.; Ferlay, A.; Chilliard, Y. Technical Note: Estimation of Milk Fatty Acid Yield from Milk Fat Data. J. Dairy Sci. 2007, 90, 2302–2304. [Google Scholar] [CrossRef]
  35. Torres-Sáez, R. Modificacion Quimica en Fase Solida de Lipasa B de Candida antarctica para mejorar sus propiedades de actividad, estabilidad y enantioselectividad. In Revista de la Academia Colombiana de Ciencias Exactas, Fisicas y Naturales; Academia Colombiana de Ciencias Exactas, Fisicas y Naturales: Bogota, Colombia, 2014; Volume 38, pp. 181–204. Available online: https://link.gale.com/apps/doc/A540902122/IFME?u=googlescholar&sid=bookmark-IFME&xid=3a77766f (accessed on 7 August 2023).
  36. Casas-Godoy, L.; Duquesne, S.; Bordes, F.; Sandoval, G.; Marty, A. Lipases: An Overview BT-Lipases and Phospholipases: Methods and Protocols; Humana Press: Totowa, NJ, USA, 2012; pp. 3–30. [Google Scholar] [CrossRef]
  37. Sinkūnienė, D.; Adlercreutz, P. Effects of Regioselectivity and Lipid Class Specificity of Lipases on Transesterification, Exemplified by Biodiesel Production. J. Am. Oil Chem. Soc. 2014, 91, 1283–1290. [Google Scholar] [CrossRef]
  38. Bradford, M.M. A rapid and sensitive method for the quantitation of microgram quantities of protein utilizing the principle of protein-dye binding. Anal. Biochem. 1976, 72, 248–254. [Google Scholar] [CrossRef] [PubMed]
  39. Funabashi, H.; Kawaguchi, A.; Tomoda, H.; Omura, S.; Okuda, S.; Iwasaki, S. Binding site of cerulenin in fatty acid synthetase. J. Biochem. 1989, 105, 751–755. [Google Scholar] [CrossRef]
  40. Huynh, F.K.; Green, M.F.; Koves, T.R.; Hirschey, M.D. Measurement of fatty acid oxidation rates in animal tissues and cell lines. Methods Enzymol. 2014, 542, 391–405. [Google Scholar] [CrossRef] [PubMed]
  41. Pellis, A.; Acero, E.H.; Weber, H.; Obersriebnig, M.; Breinbauer, R.; Srebotnik, E.; Guebitz, G.M. Biocatalyzed approach for the surface functionalization of poly(L-lactic acid) films using hydrolytic enzymes. Biotechnol. J. 2015, 10, 1739–1749. [Google Scholar] [CrossRef]
  42. Pliego, J.; Mateos, J.C.; Rodriguez, J.; Valero, F.; Baeza, M.; Femat, R.; Camacho, R.; Sandoval, G.; Herrera-López, E.J. Monitoring lipase/esterase activity by stopped flow in a sequential injection analysis system using p-nitrophenyl butyrate. Sensors 2015, 15, 2798–2811. [Google Scholar] [CrossRef]
  43. Castaño, M.; Paredes, F.; Díaz, J. La patología a Través del Laboratorio de Análisis Clínicos: Algunos Aspectos Experimentales; Universidad de Cádiz, Servicio de Publicaciones: Cádiz, Spain, 2014; p. 1262. [Google Scholar]
  44. Li, S.; Madan, P.; Lin, S. Application of Capmul MCM and caprylic acid for the development of danazol-loaded SEDDS. Pharm. Dev. Technol. 2015, 20, 886–896. [Google Scholar] [CrossRef] [PubMed]
  45. Miyoshi, H.; Shulman, G.I.; Peters, E.J.; Wolfe, M.H.; Elahi, D.; Wolfe, R.R. Hormonal control of substrate cycling in humans. J. Clin. Investig. 1988, 81, 1545–1555. [Google Scholar] [CrossRef]
  46. Manoel, E.A.; Ribeiro, M.F.P.; dos Santos, J.C.S.; Coelho, M.A.Z.; Simas, A.B.C.; Fernandez-Lafuente, R.; Freire, D.M.G. Accurel MP 1000 as a support for the immobilization of lipase from Burkholderia cepacia: Application to the kinetic resolution of myo-inositol derivatives. Process Biochem. 2015, 50, 1557–1564. [Google Scholar] [CrossRef]
  47. Zhang, Q.; Lin, W.; Yang, G.; Chen, Q. Studies on the phase structure of ethylene-vinyl acetate copolymers by solid-state 1H and 13C NMR. J. Polym. Sci. Part B Polym. Phys. 2002, 40, 2199–2207. [Google Scholar] [CrossRef]
  48. Jin, J.; Chen, S.; Zhang, J. UV aging behaviour of ethylene-vinyl acetate copolymers (EVA) with different vinyl acetate contents. Polym. Degrad. Stab. 2010, 95, 725–732. [Google Scholar] [CrossRef]
  49. Feng, C.; Liang, M.; Chen, W.; Huang, J.; Liu, H. Flame retardancy and thermal degradation of intumescent flame retardant EVA composite with efficient charring agent. J. Anal. Appl. Pyrolysis 2015, 113, 266–273. [Google Scholar] [CrossRef]
  50. Schneider, C.; Langer, R.; Loveday, D.; Hair, D. Applications of ethylene vinyl acetate copolymers (EVA) in drug delivery systems. J. Control. Release Off. J. Control. Release Soc. 2017, 262, 284–295. [Google Scholar] [CrossRef] [PubMed]
  51. Sven Pedersen, P.E. Immobilized lipase preparation and use thereof for ester synthesis. PCT Int. Appl. 1990, 90, 15868. [Google Scholar]
  52. Cai, C.; Gao, Y.; Liu, Y.; Zhong, N.; Liu, N. Immobilization of Candida antarctica lipase B onto SBA-15 and their application in glycerolysis for diacylglycerols synthesis. Food Chem. 2016, 212, 205–212. [Google Scholar] [CrossRef]
  53. Almeida, A.; Possemiers, S.; Boone, M.N.; De Beer, T.; Quinten, T.; Van Hoorebeke, L.; Remon, J.P.; Vervaet, C. Ethylene vinyl acetate as matrix for oral sustained release dosage forms produced via hot-melt extrusion. Eur. J. Pharm. Biopharm. 2011, 77, 297–305. [Google Scholar] [CrossRef] [PubMed]
  54. Azeemi, S.; Raza, S.; Yasinzai, M. Colors as Catalysts in Enzymatic Reactions. J. Acupunct. Meridian Stud. 2008, 1, 139–142. [Google Scholar] [CrossRef]
  55. Semiconductor, R. Digital 16bit Serial Output Type Ambient Light Sensor IC. 2011. Available online: chrome-extension://efaidnbmnnnibpcajpcglclefindmkaj/https://www.mouser.com/datasheet/2/348/bh1750fvi-e-186247.pdf (accessed on 14 October 2022).
  56. Ben Rejeb, I.; Arduini, F.; Amine, A.; Gargouri, M.; Palleschi, G. Amperometric biosensor based on Prussian Blue-modified screen-printed electrode for lipase activity and triacylglycerol determination. Anal. Chim. Acta 2007, 594, 1–8. [Google Scholar] [CrossRef]
  57. Minakshi; Pundir, C.S. Construction of an amperometric enzymic sensor for triglyceride determination. Sens. Actuators B Chem. 2008, 133, 251–255. [Google Scholar] [CrossRef]
  58. Preetha, R.; Rani, K.; Veeramani, M.S.S.; Fernandez, R.E.; Vemulachedu, H.; Sugan, M.; Bhattacharya, E.; Chadha, A. Potentiometric estimation of blood analytes—triglycerides and urea: Comparison with clinical data and estimation of urea in milk using an electrolyte–insulator–semiconductor–capacitor (EISCAP). Sens. Actuators B Chem. 2011, 160, 1439–1443. [Google Scholar] [CrossRef]
  59. Dhand, C.; Solanki, P.R.; Sood, K.N.; Datta, M.; Malhotra, B.D. Polyaniline nanotubes for impedimetric triglyceride detection. Electrochem. Commun. 2009, 11, 1482–1486. [Google Scholar] [CrossRef]
  60. Bhambi, M.; Pundir, C. Preparation of Oxygen Meter Based Biosensor for Determination of Triglyceride in Serum. Sens. Trans. 2006, 67, 561–567. [Google Scholar]
  61. Vandenberghe, C.; St-Pierre, V.; Pierotti, T.; Fortier, M.; Castellano, C.A.; Cunnane, S.C. Tricaprylin alone increases plasma ketone response more than coconut oil or other medium-chain triglycerides: An acute crossover study in healthy adults. Curr. Dev. Nutr. 2017, 1, 6–9. [Google Scholar] [CrossRef]
  62. Iemoto, T.; Nishiumi, S.; Kobayashi, T.; Fujigaki, S.; Hamaguchi, T.; Kato, K.; Shoji, H.; Matsumura, Y.; Honda, K.; Yoshida, M. Serum level of octanoic acid predicts the efficacy of chemotherapy for colorectal cancer. Oncol. Lett. 2019, 17, 831–842. [Google Scholar] [CrossRef]
Figure 1. Hydrolysis reaction of the substrate p-NPB catalyzed by the enzyme lipase.
Biosensors 13 00826 g001
Figure 2. Hydrolysis reaction of trioctanoin using p-nitrophenol as an indicator catalyzed by the enzyme lipase.
Biosensors 13 00826 g002
Figure 3. Enzymatic activities of the enzyme immobilized with EVA polymer.
Biosensors 13 00826 g003
Figure 4. Structure of the microfluidic device for measuring the concentration of TGs. (A) Internal cross-section, (B) diagram of the structure of the biosensor.
Biosensors 13 00826 g004
Figure 5. Setup and integration of enzymatic biosensor for TG quantification. (A) Wiring diagram of the TG biosensor device. (B) Enzymatic biosensor for triglyceride quantification.
Biosensors 13 00826 g005
Figure 6. Response of substrate hydrolysis with the CalB enzyme immobilized. (A) Hydrolysis of p-nitrophenyl butyrate in a spectrophotometer and on the biosensor. (B) Hydrolysis of trioctanoin on the biosensor.
Biosensors 13 00826 g006
Table 1. The CalB enzyme and buffer concentrations for immobilization in EVA.
Sample123456789
Enzyme ( μ L)1050100200300400500600700
Buffer ( μ L)990950900800700600500400300
Table 2. Comparison of analytic characteristics of various TG biosensors.
Type of
Biosensor
Biosensor
Characteristics
EnzymeMethod of
Immobilization
Optimum
Temp ( ° C)
Optimum
pH
Detection
Limit (mM)
Recovery
(%)
Precision (%)Response
Time (s)
AccuracyReference
OpticalPresent biosensorCalBAdsorption307.20.163081.120.7916000.9635
OpticalHydrogel pectinLipEntrapment and AdsorptionNR71.2387NR2.53000.9807[13]
OpticalColorimetric Lip immobilized nanocompositePLipAdsorption25–556–90.011370–500.0089360–420NR[29]
AmperometricPrussian blue modified screen-printedGd, No, and LipCross-linking25–657.4NR81–99NR300-18000.9988[56]
AmperometricPVC membrane biosensorLip, Gk, and G-3-POAdsorption3570.2885.2–89.01NR100.83[23]
AmperometricLip/Nanoporous gold/Glassy carbon electrodeLip, Gk. and G-3-POCovalent Binding356.50.2391–954.14 and 5.8540.9801[25]
AmperometricCellulose acetate membrane biosensorLip, Gk, and G-3-POAdsorption256.50.289<8400.83[57]
AmperometricPencil graphite electrode biosensorLip, Gk, and  G-3-POAdsorption35710 7 98.010.052.50.99[10]
PotentiometricEISCAP sensorLipNR257.40.1NRNR18000.9584[58]
ImpedimetricImpedimetric/
conductometric
LipCovalent BindingNRNR0.28NRNR200.9801[59]
DeoxymetricMembrane-bound lipase, Gk, and G-3-POLip, Gk, and G-3-PONR39.57.50.35NR<2.1810–150.9409[60]
Lipase (Lip); Glycerol kinase (Gk); Glycerol-3-phosphate oxidase (G-3-PO); Glycerol dehydrogenase (Gd); NADH oxidase (No); Porcine pancreatic lipase (PLip); Candida antarctica lipase B (CalB).; Not reported (NR).
Disclaimer/Publisher’s Note: The statements, opinions and data contained in all publications are solely those of the individual author(s) and contributor(s) and not of MDPI and/or the editor(s). MDPI and/or the editor(s) disclaim responsibility for any injury to people or property resulting from any ideas, methods, instructions or products referred to in the content.

