Morphic Sensors for Respiratory Parameters Estimation: Validation against Overnight Polysomnography

 , and
, and
Abstract
:1. Introduction
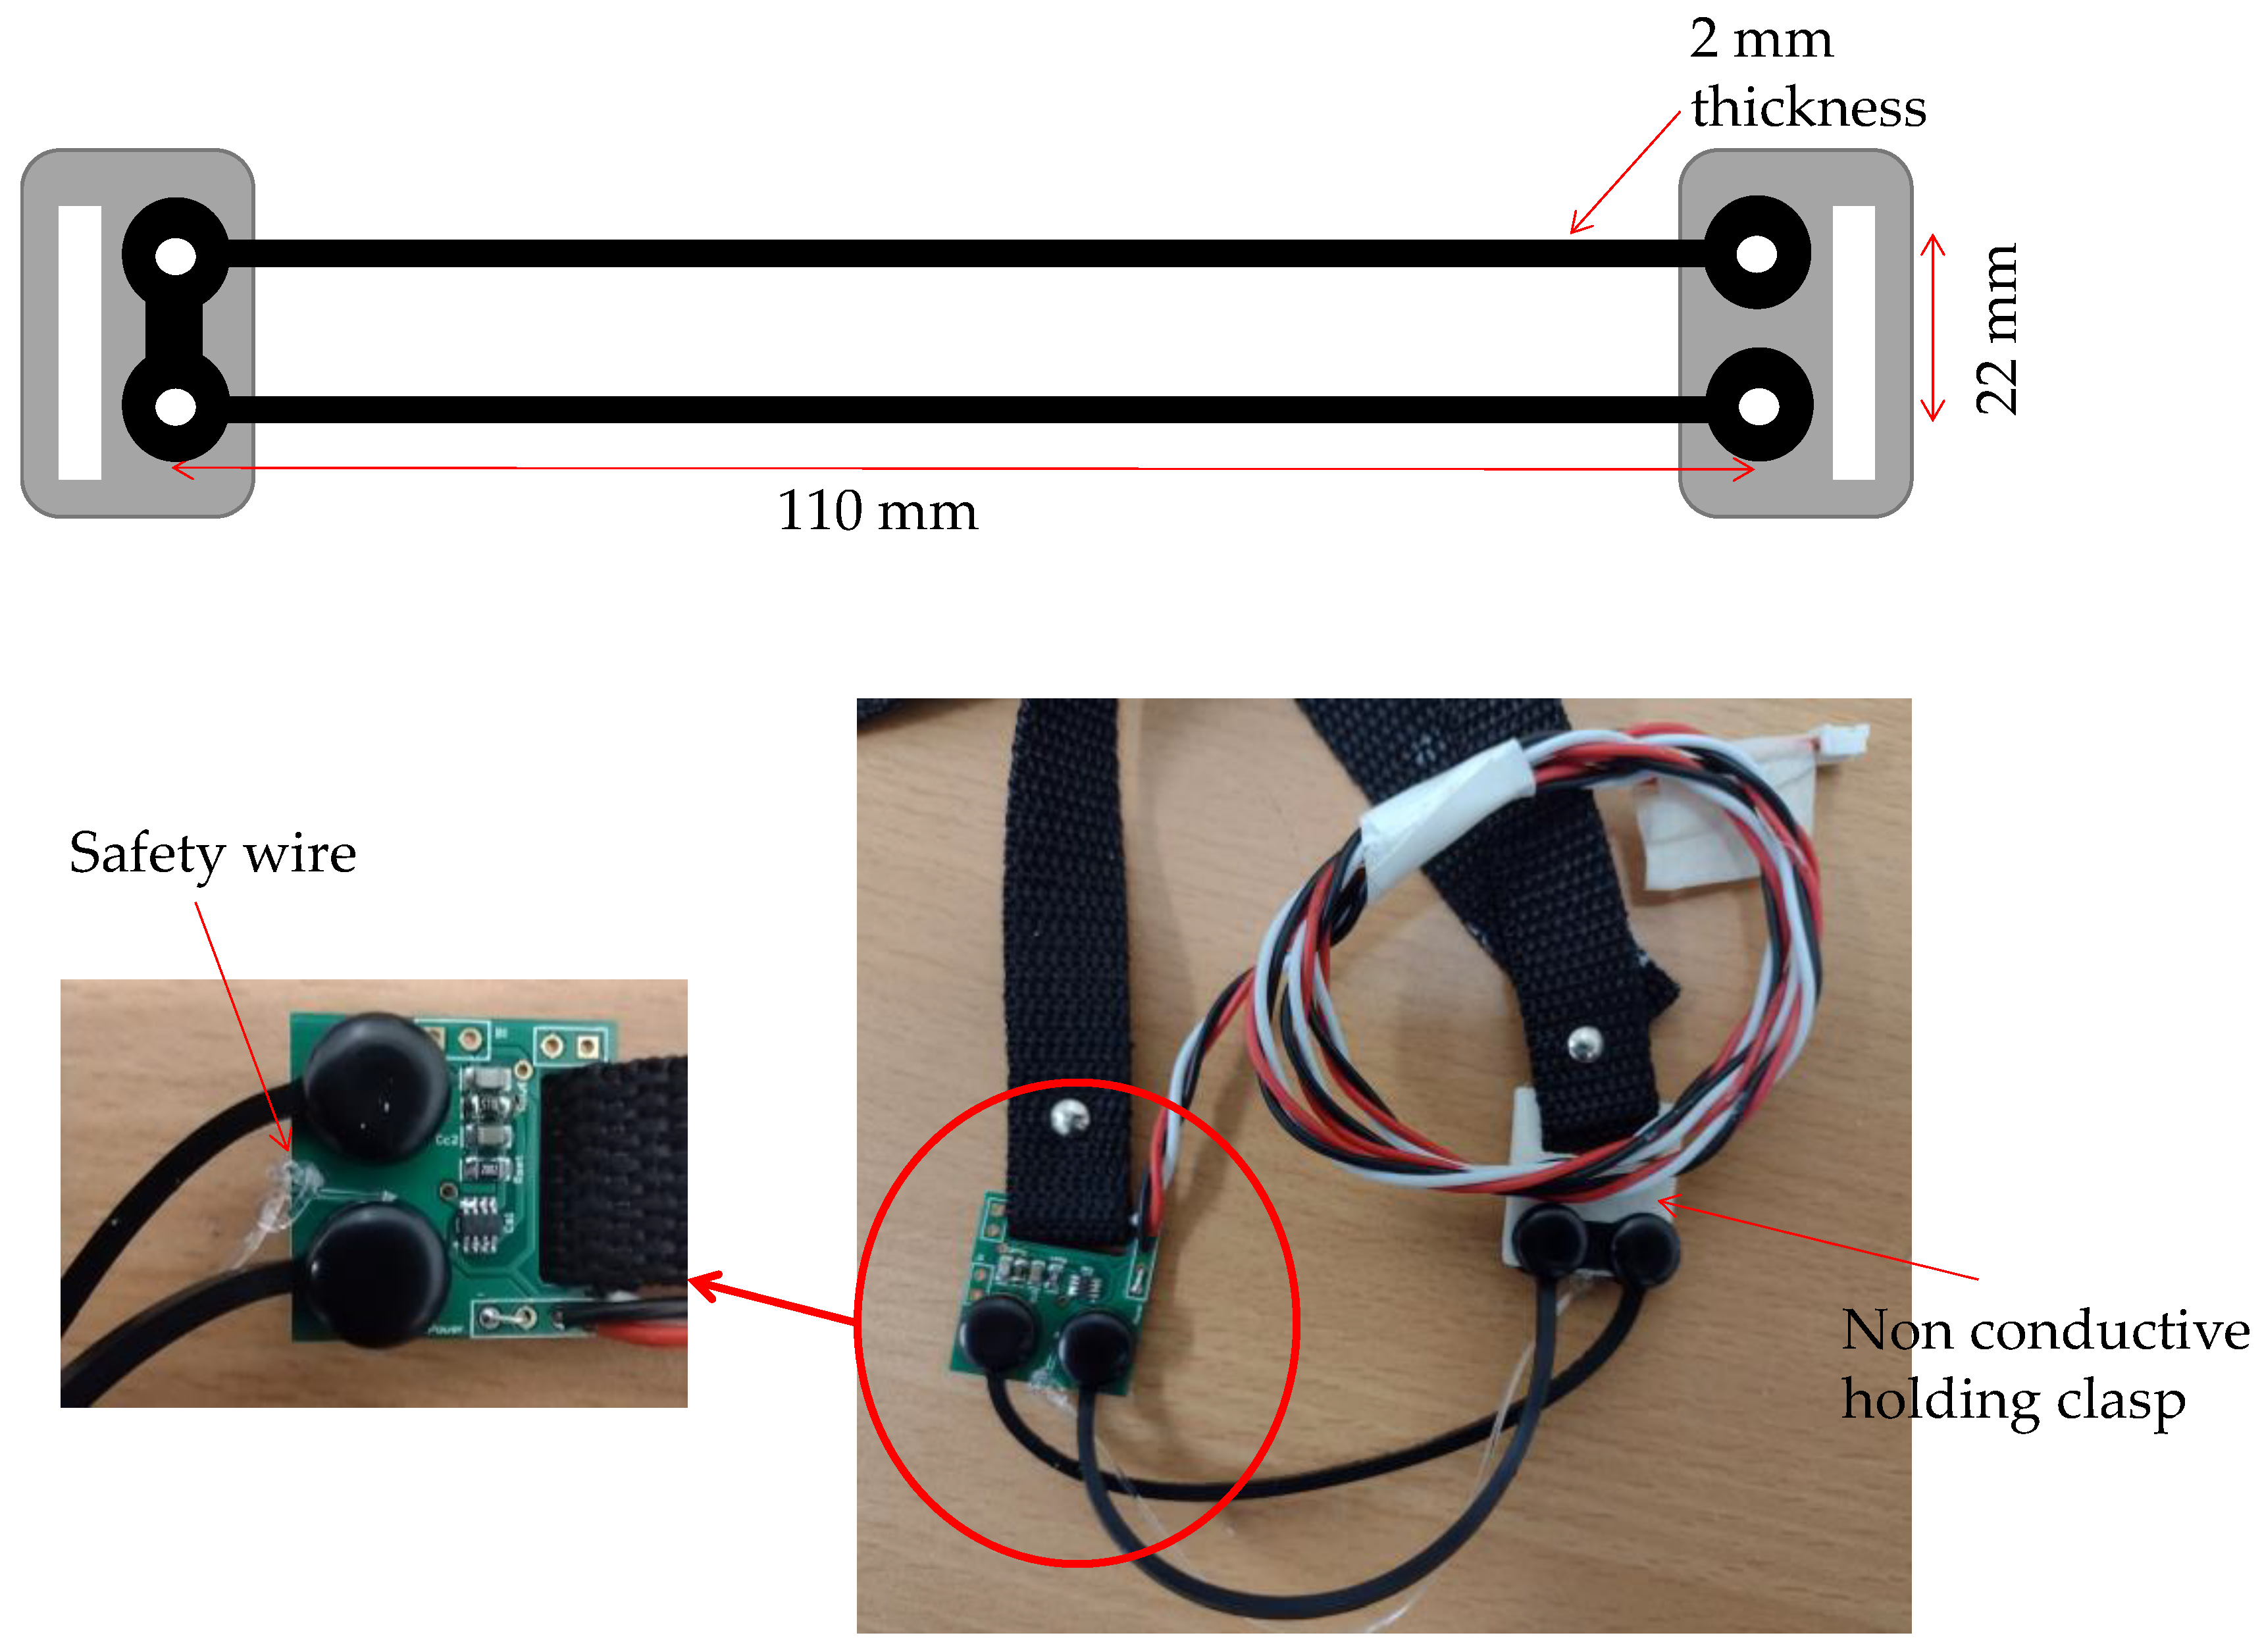
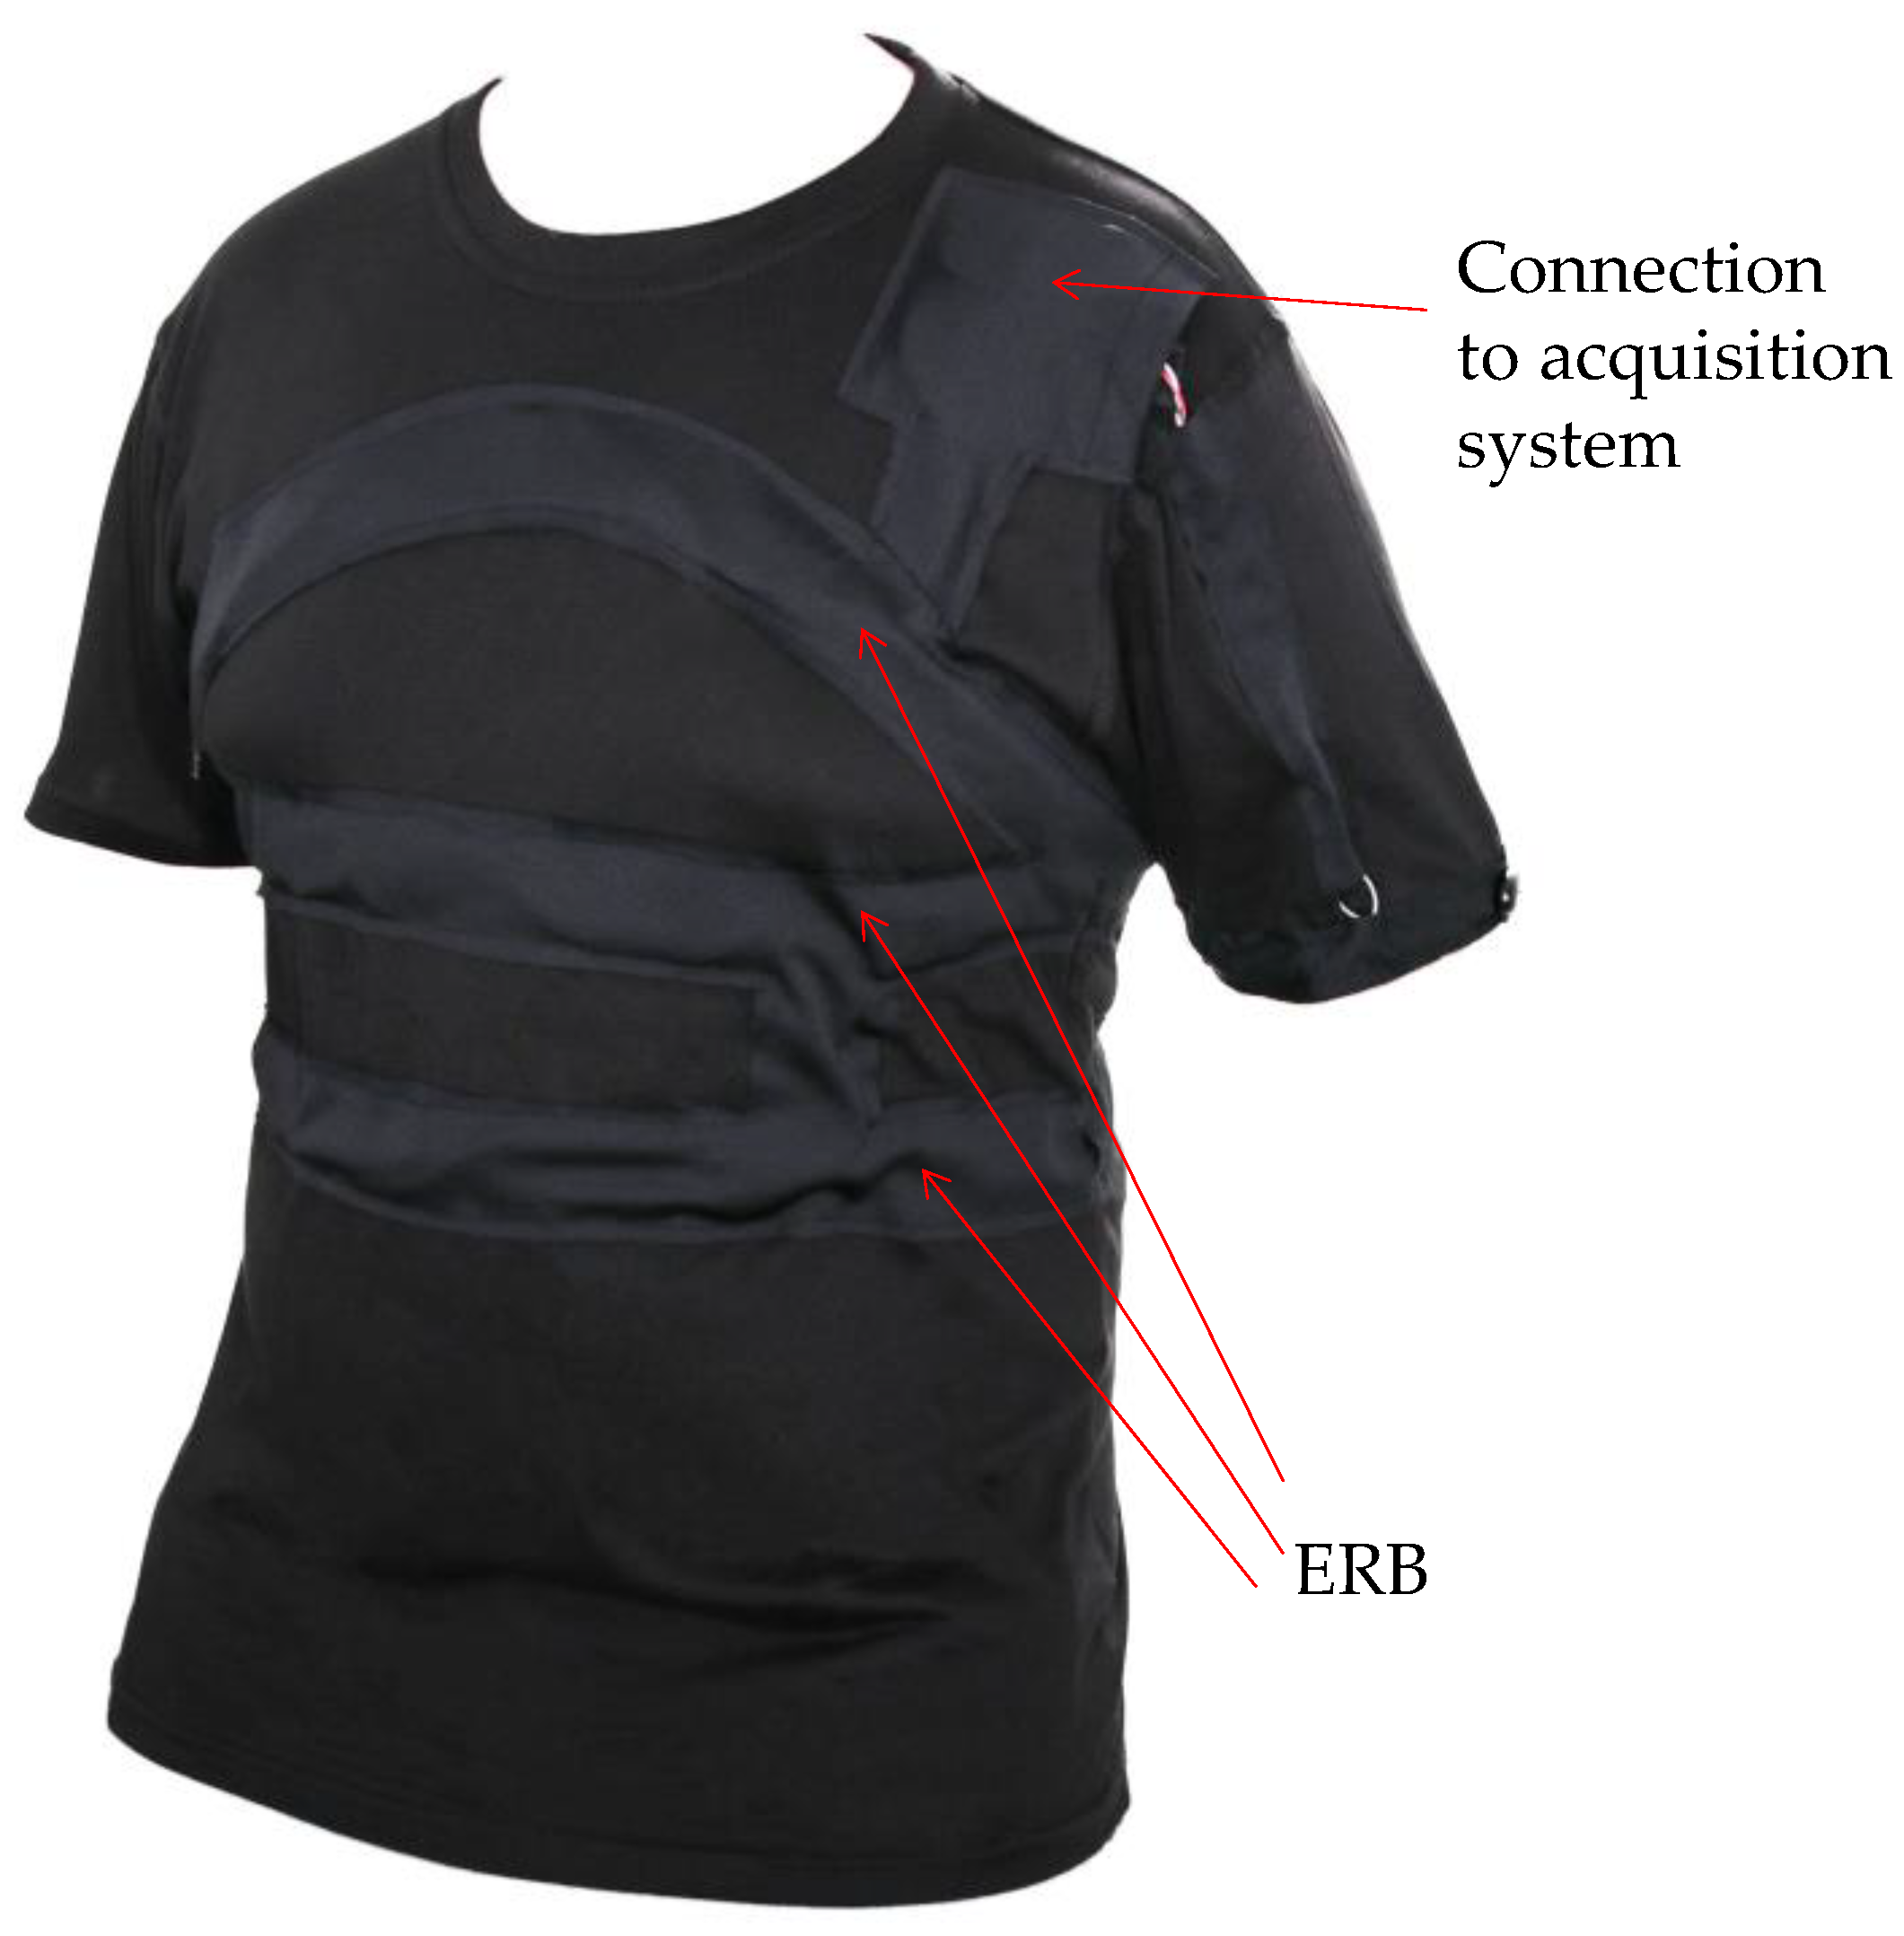
2. Morphic Sensors
3. Methods
3.1. Participants
3.2. Data Collection
4. Data Analysis
4.1. Pre-Processing, Artifact Removal (Groundtruth GUI)
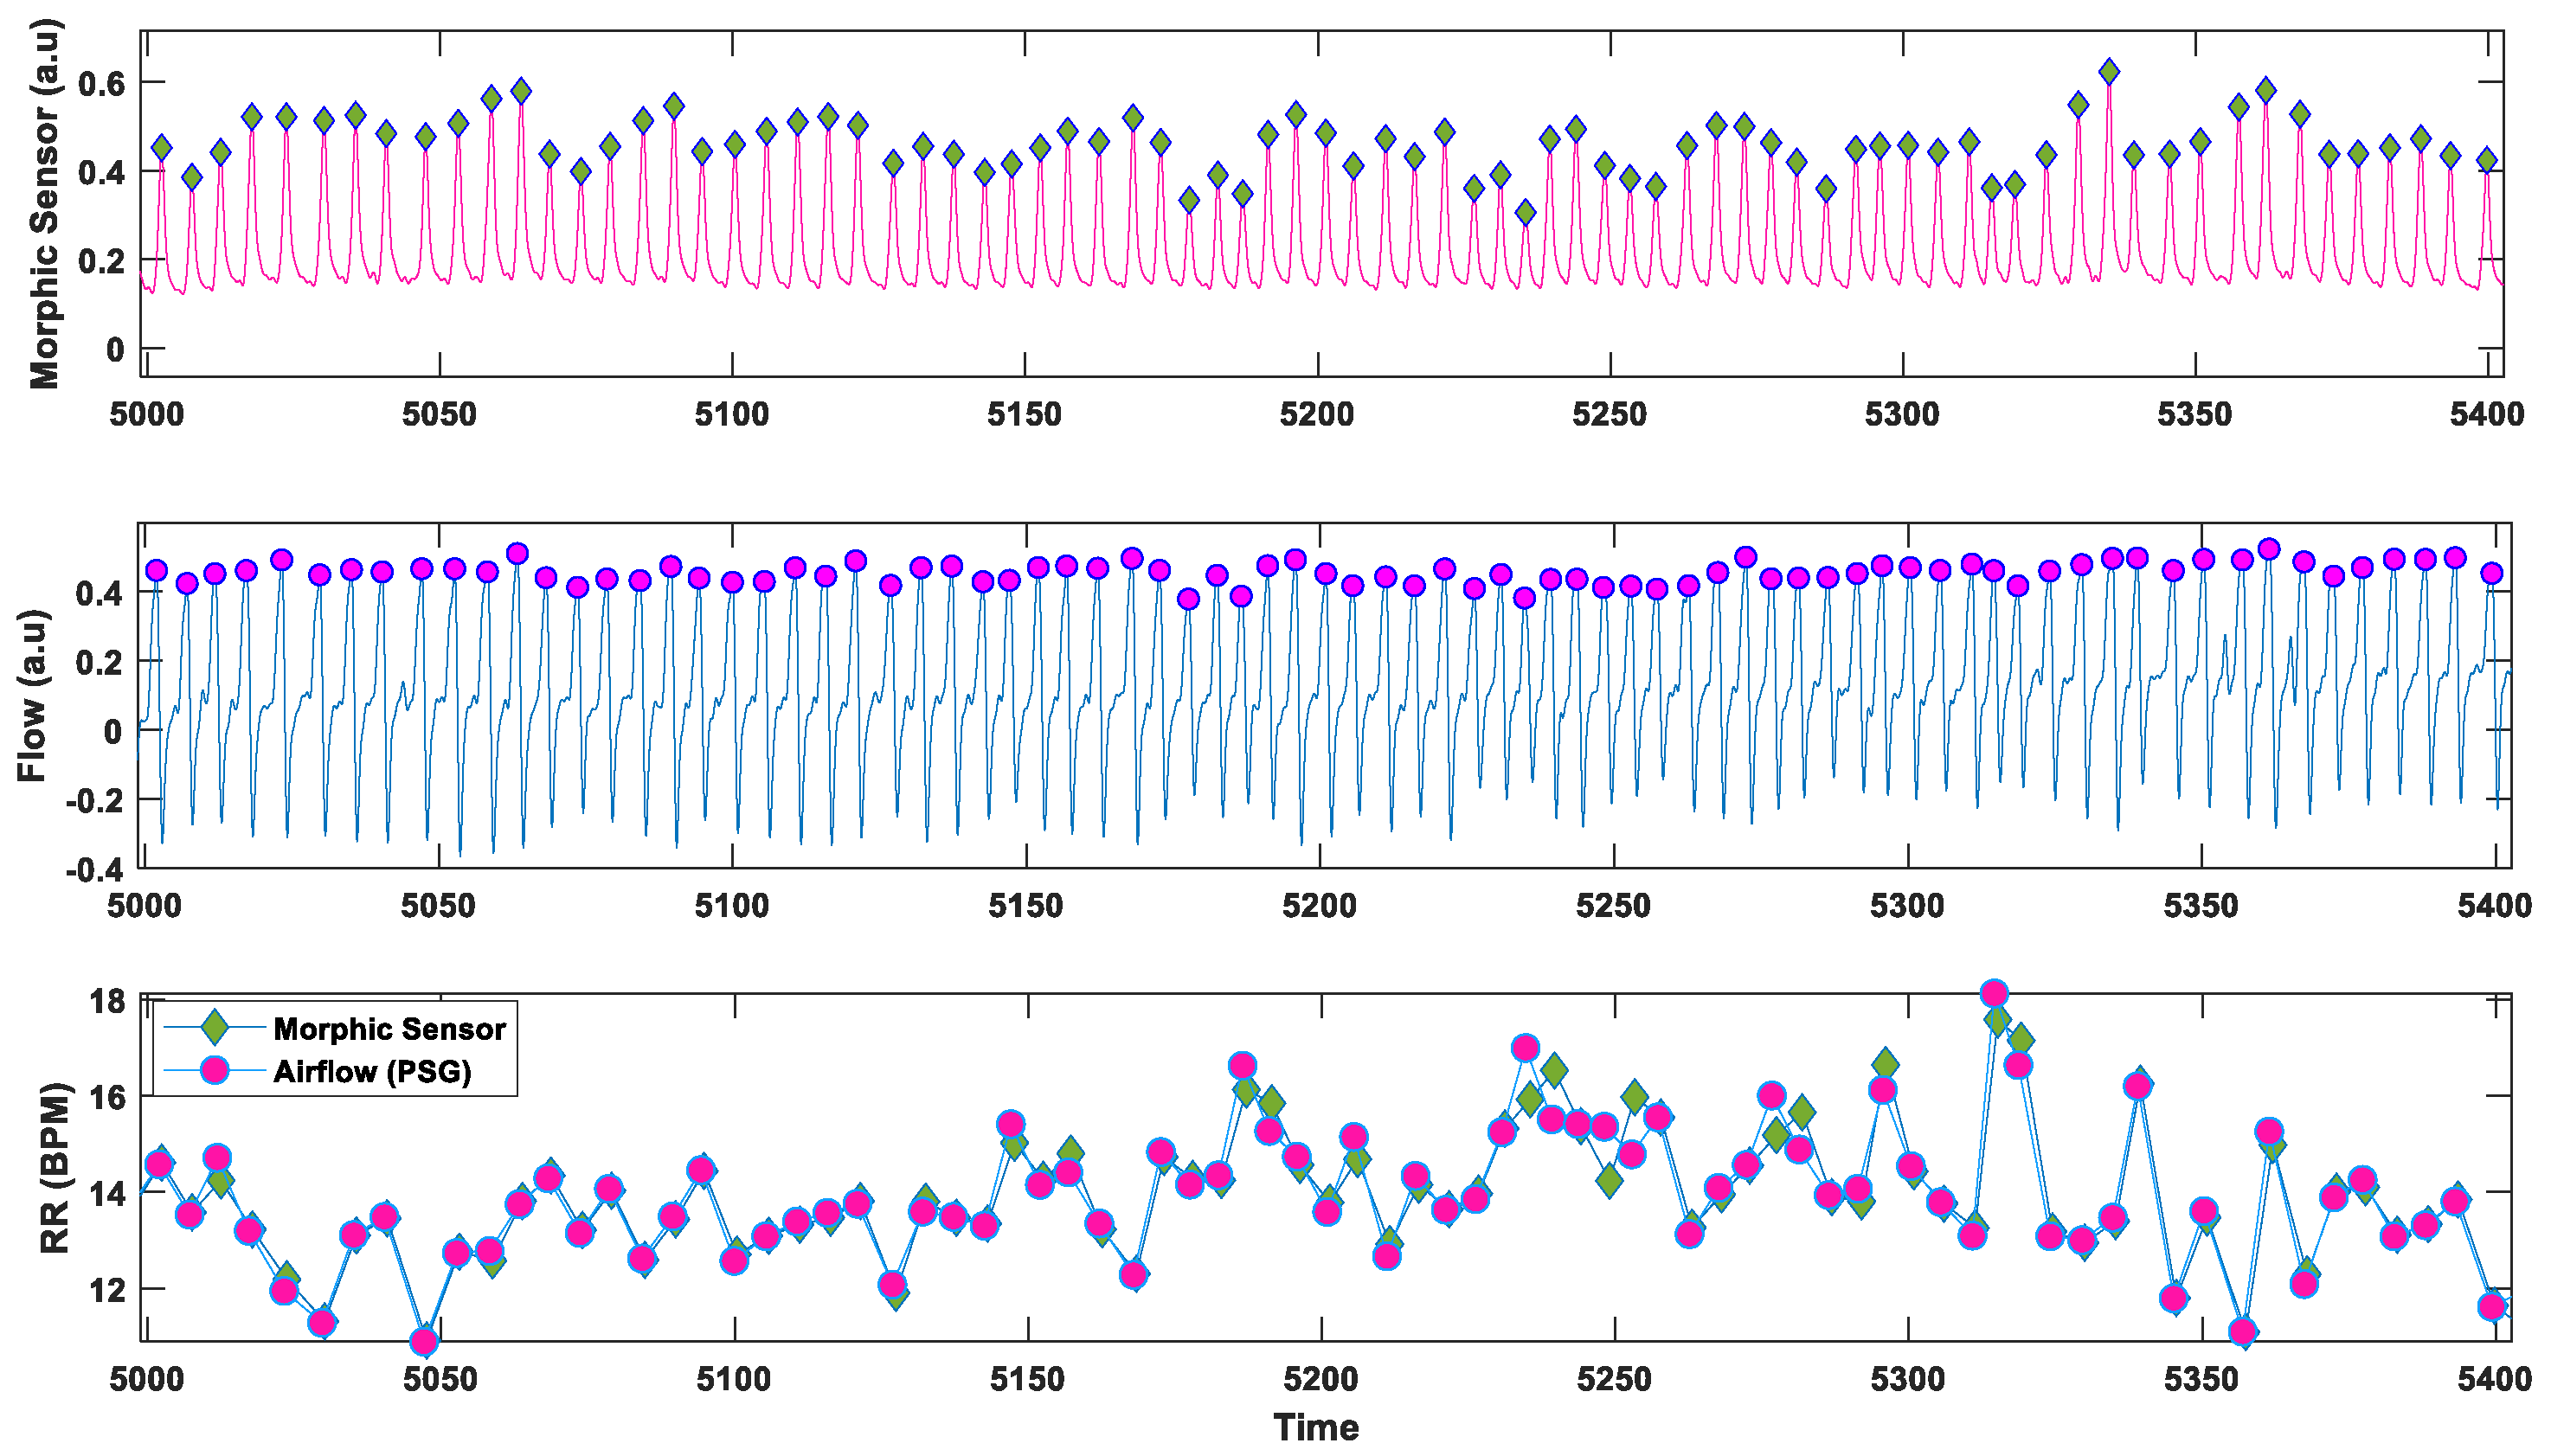
4.2. Respiratory Rate
4.3. Inter-breath Interval Variability
5. Results
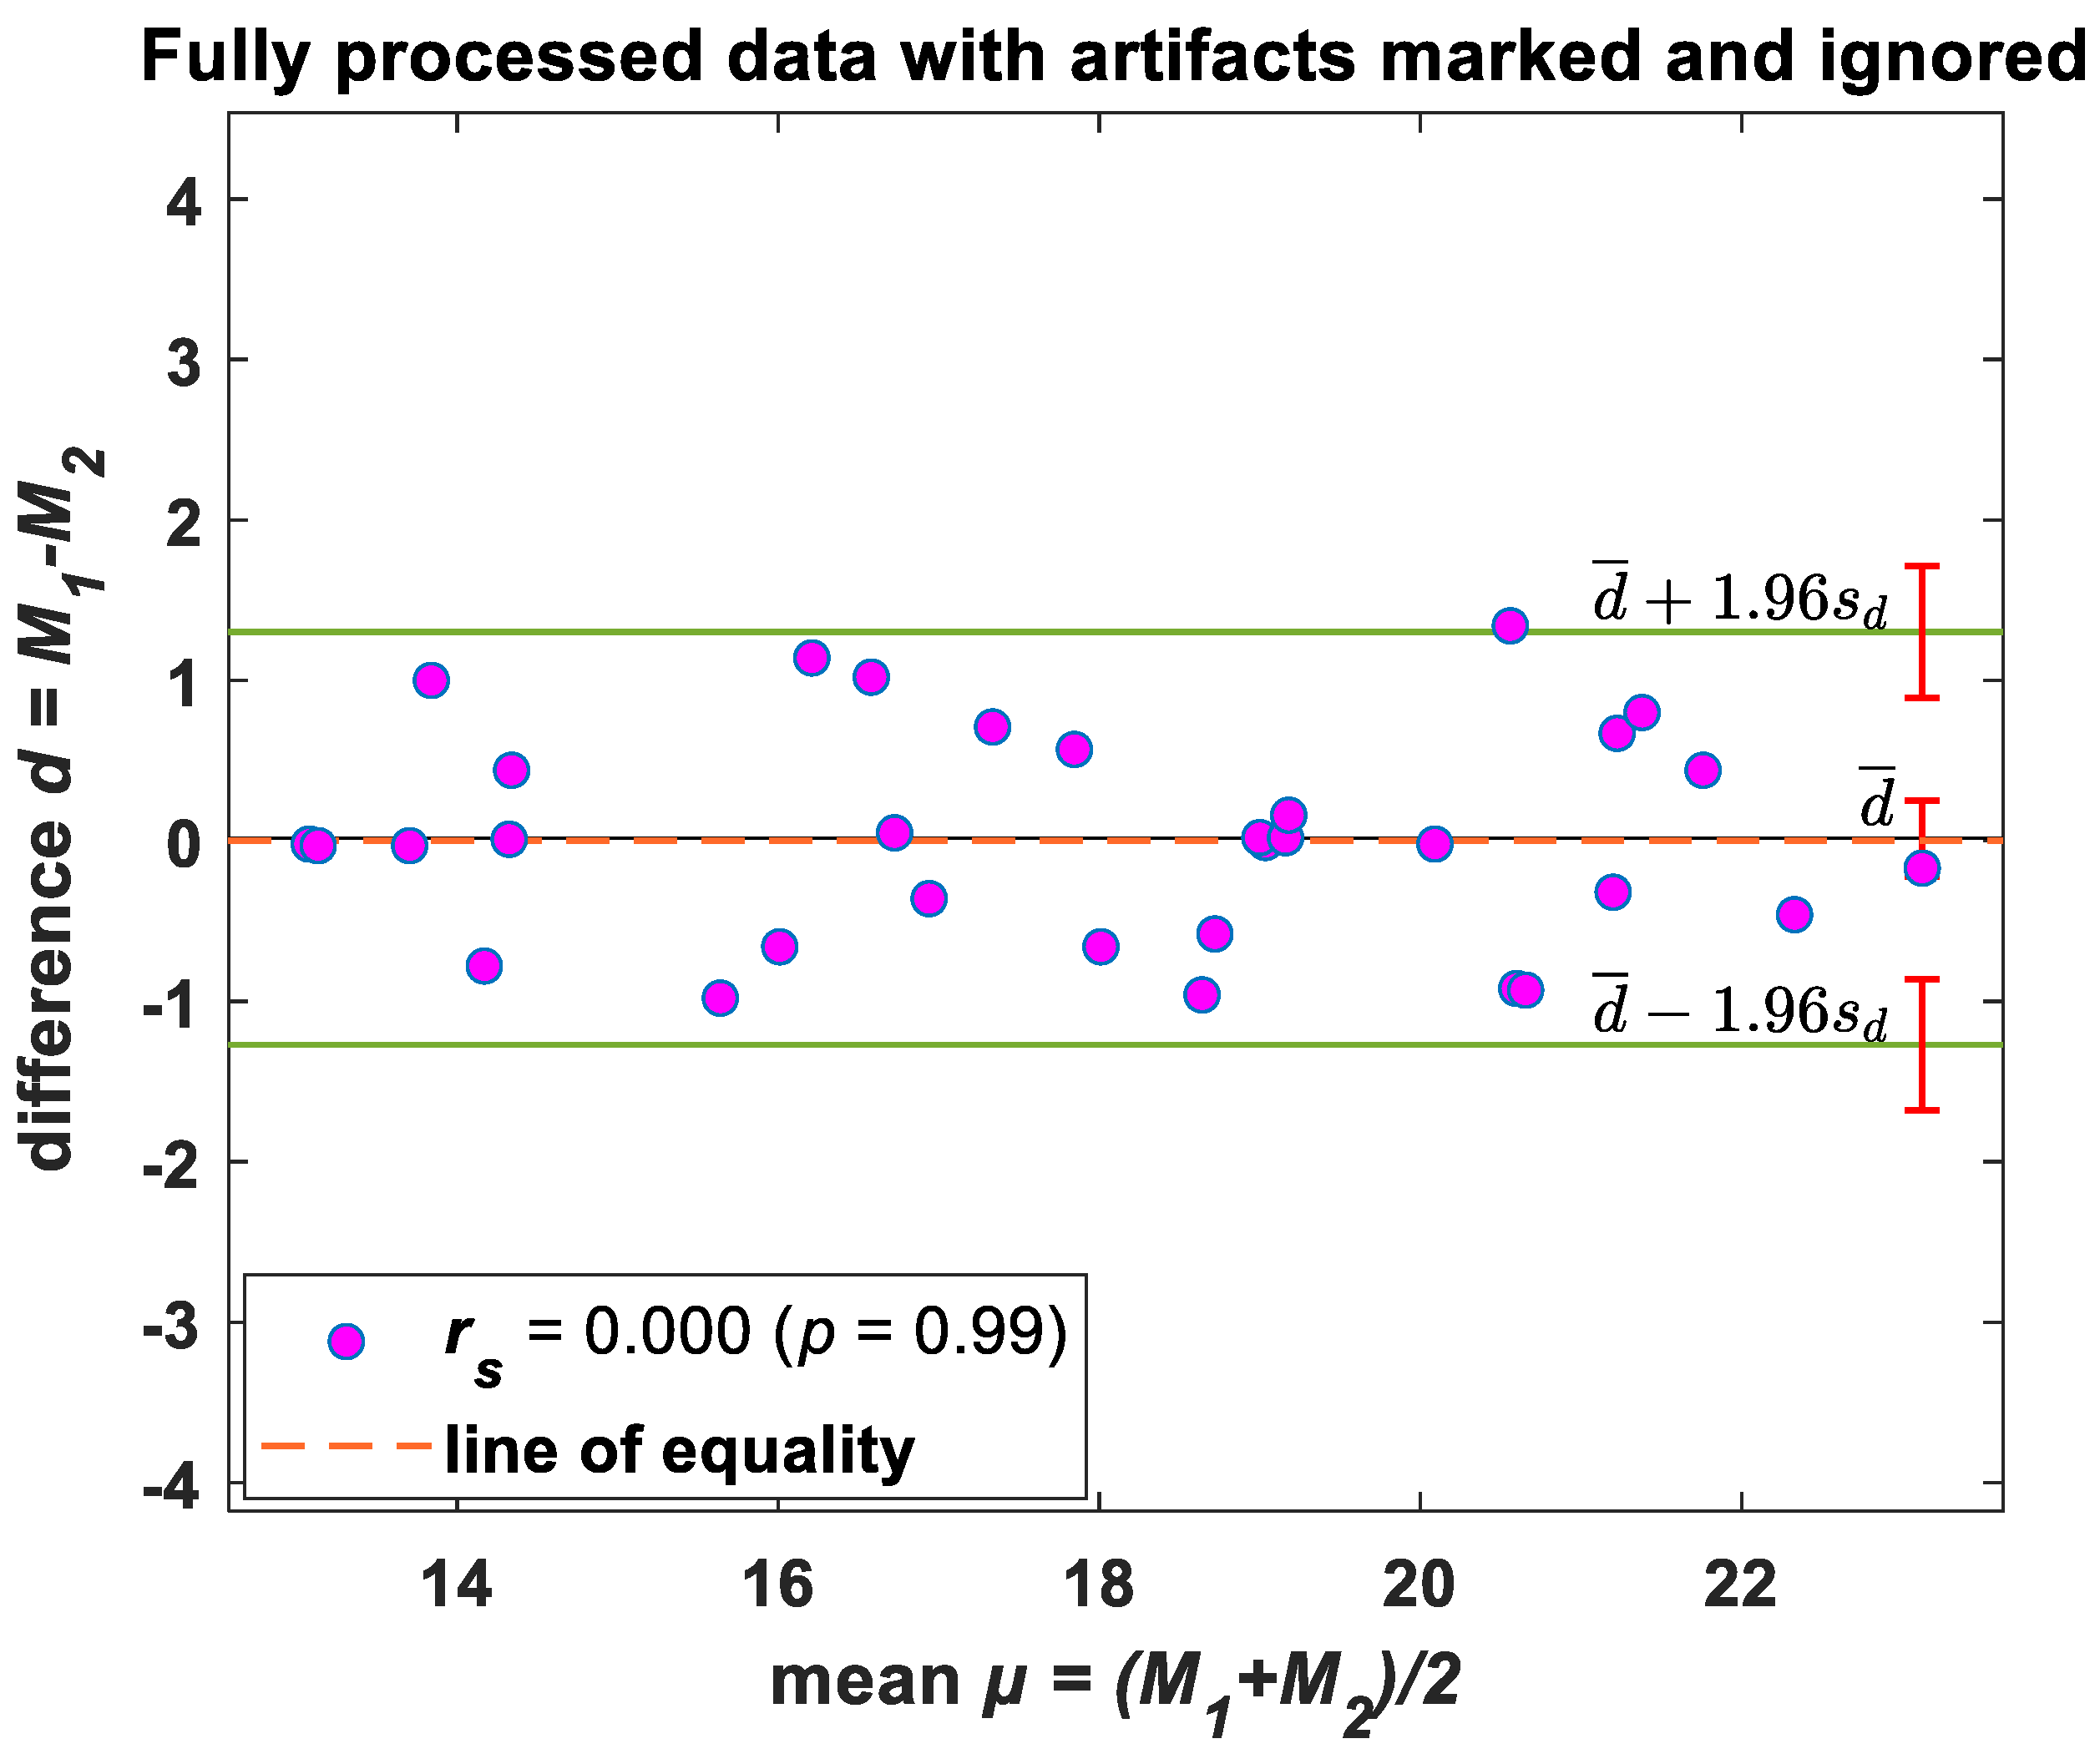
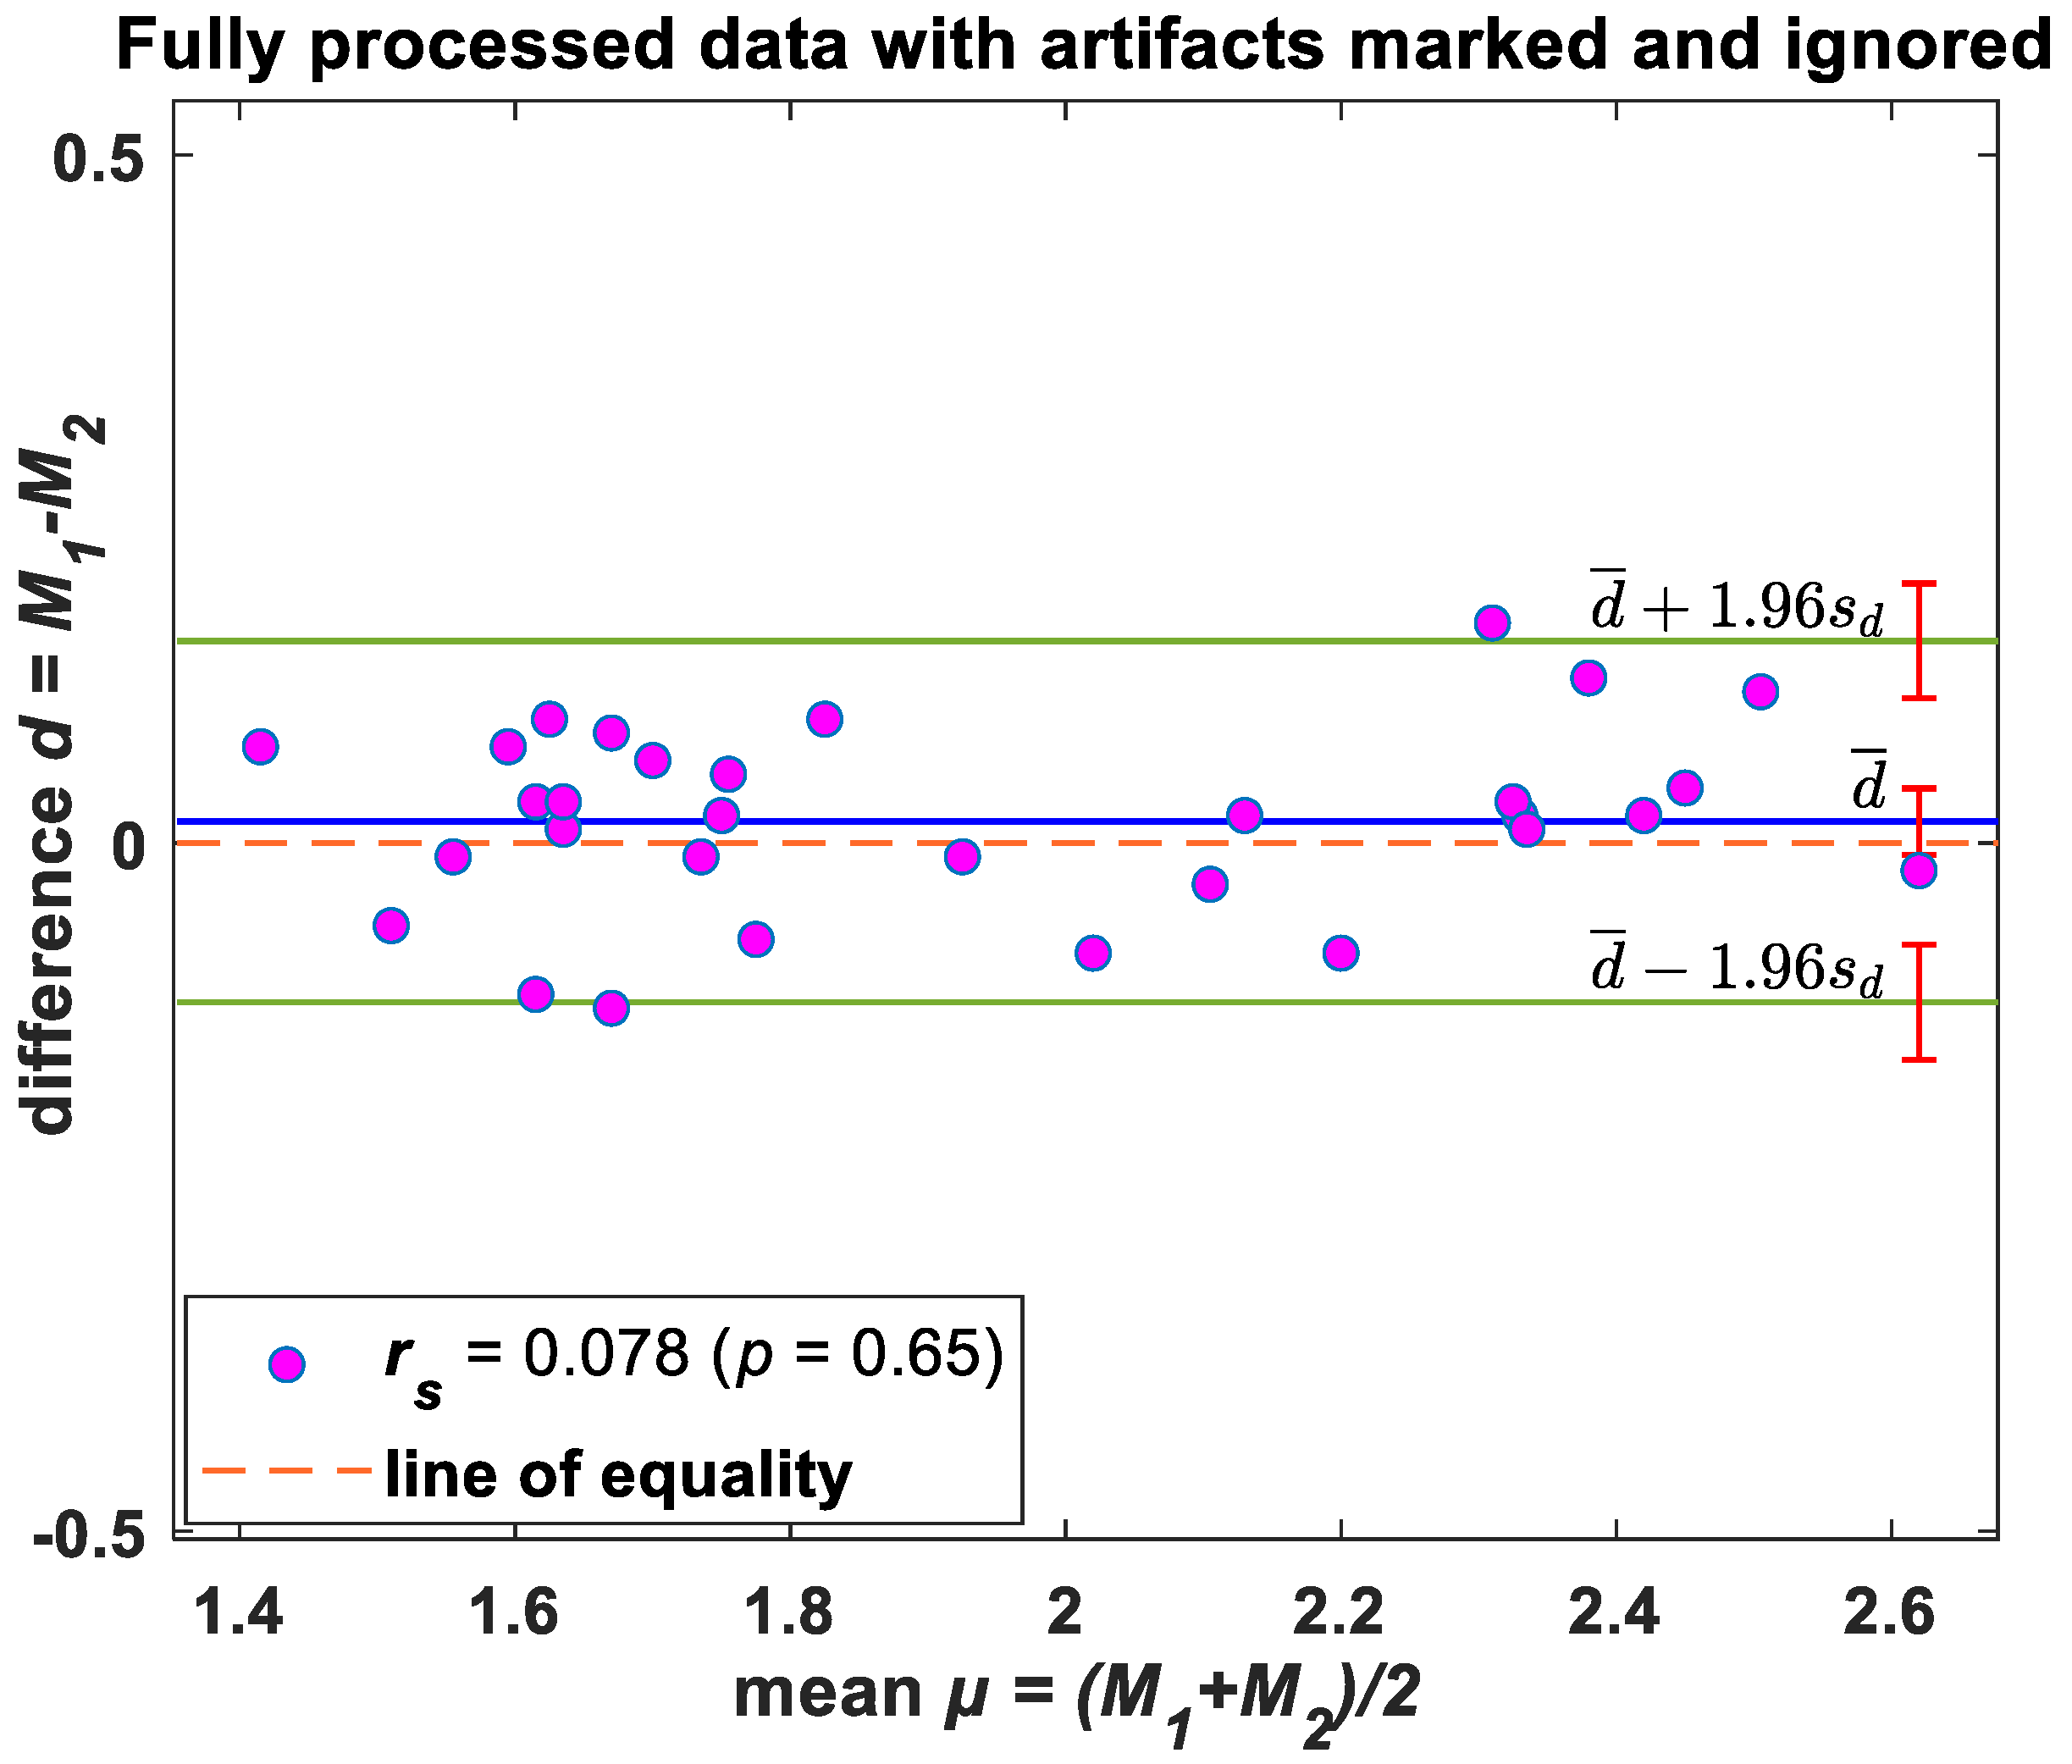
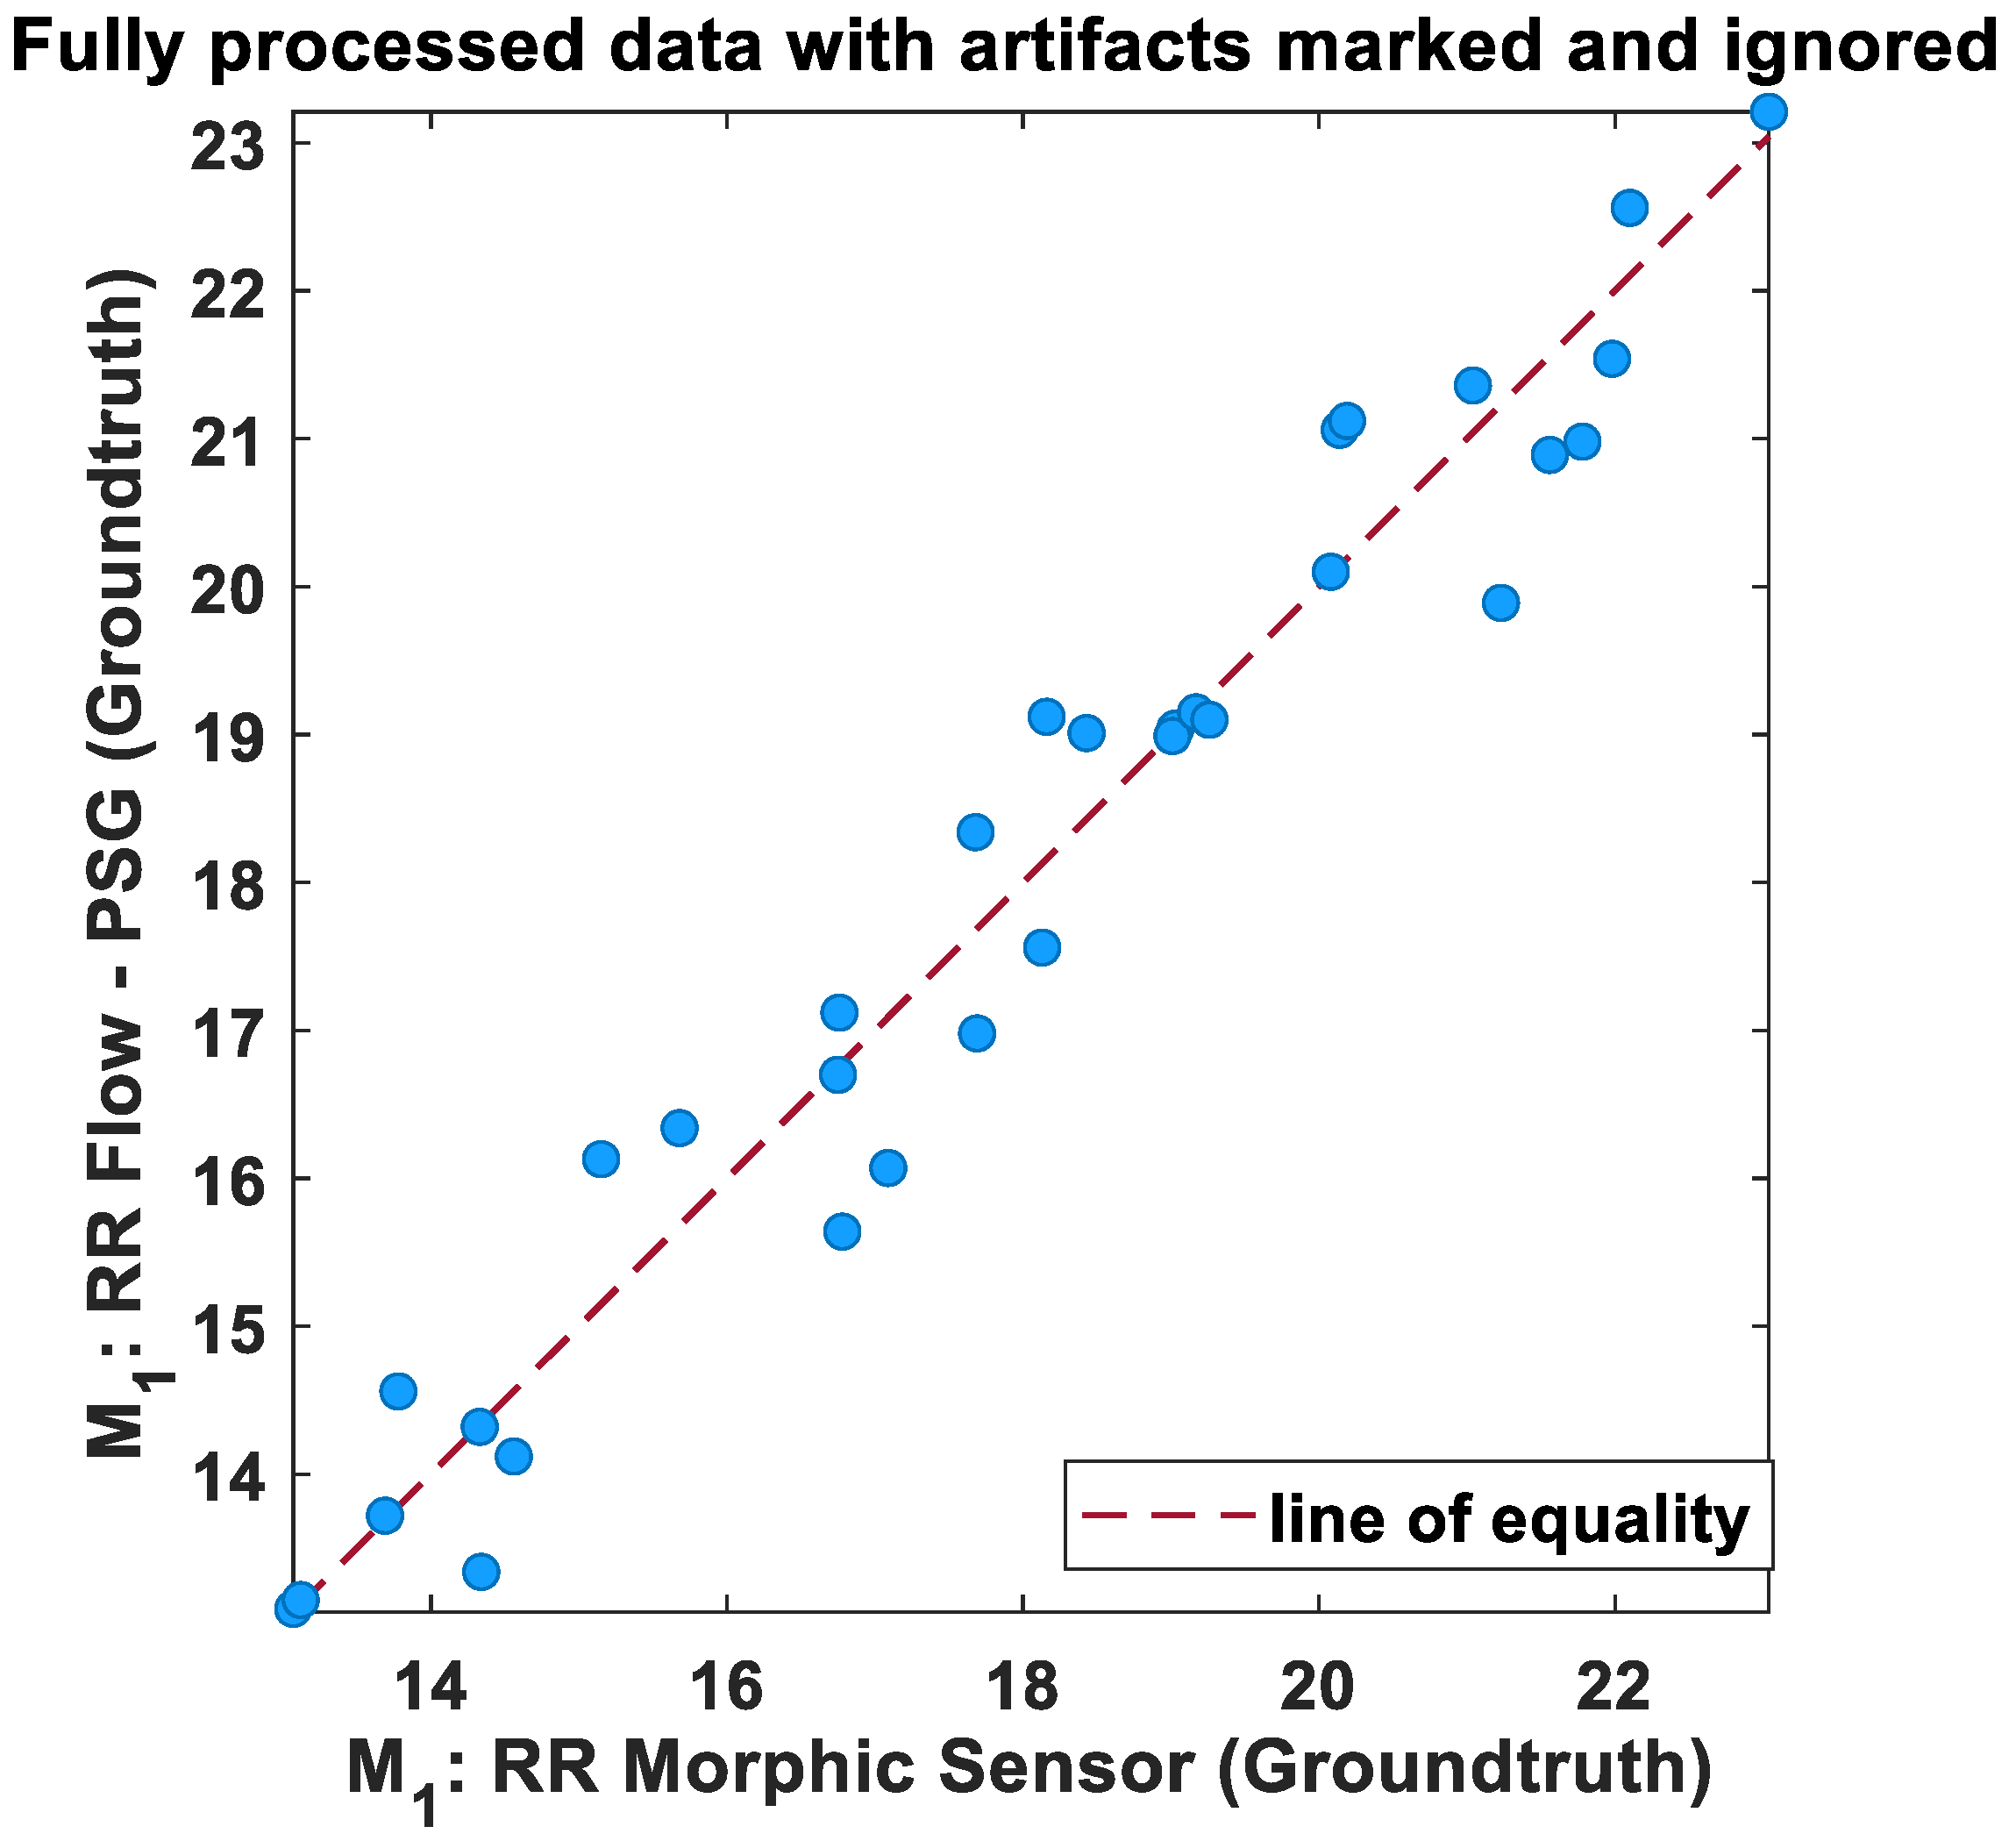
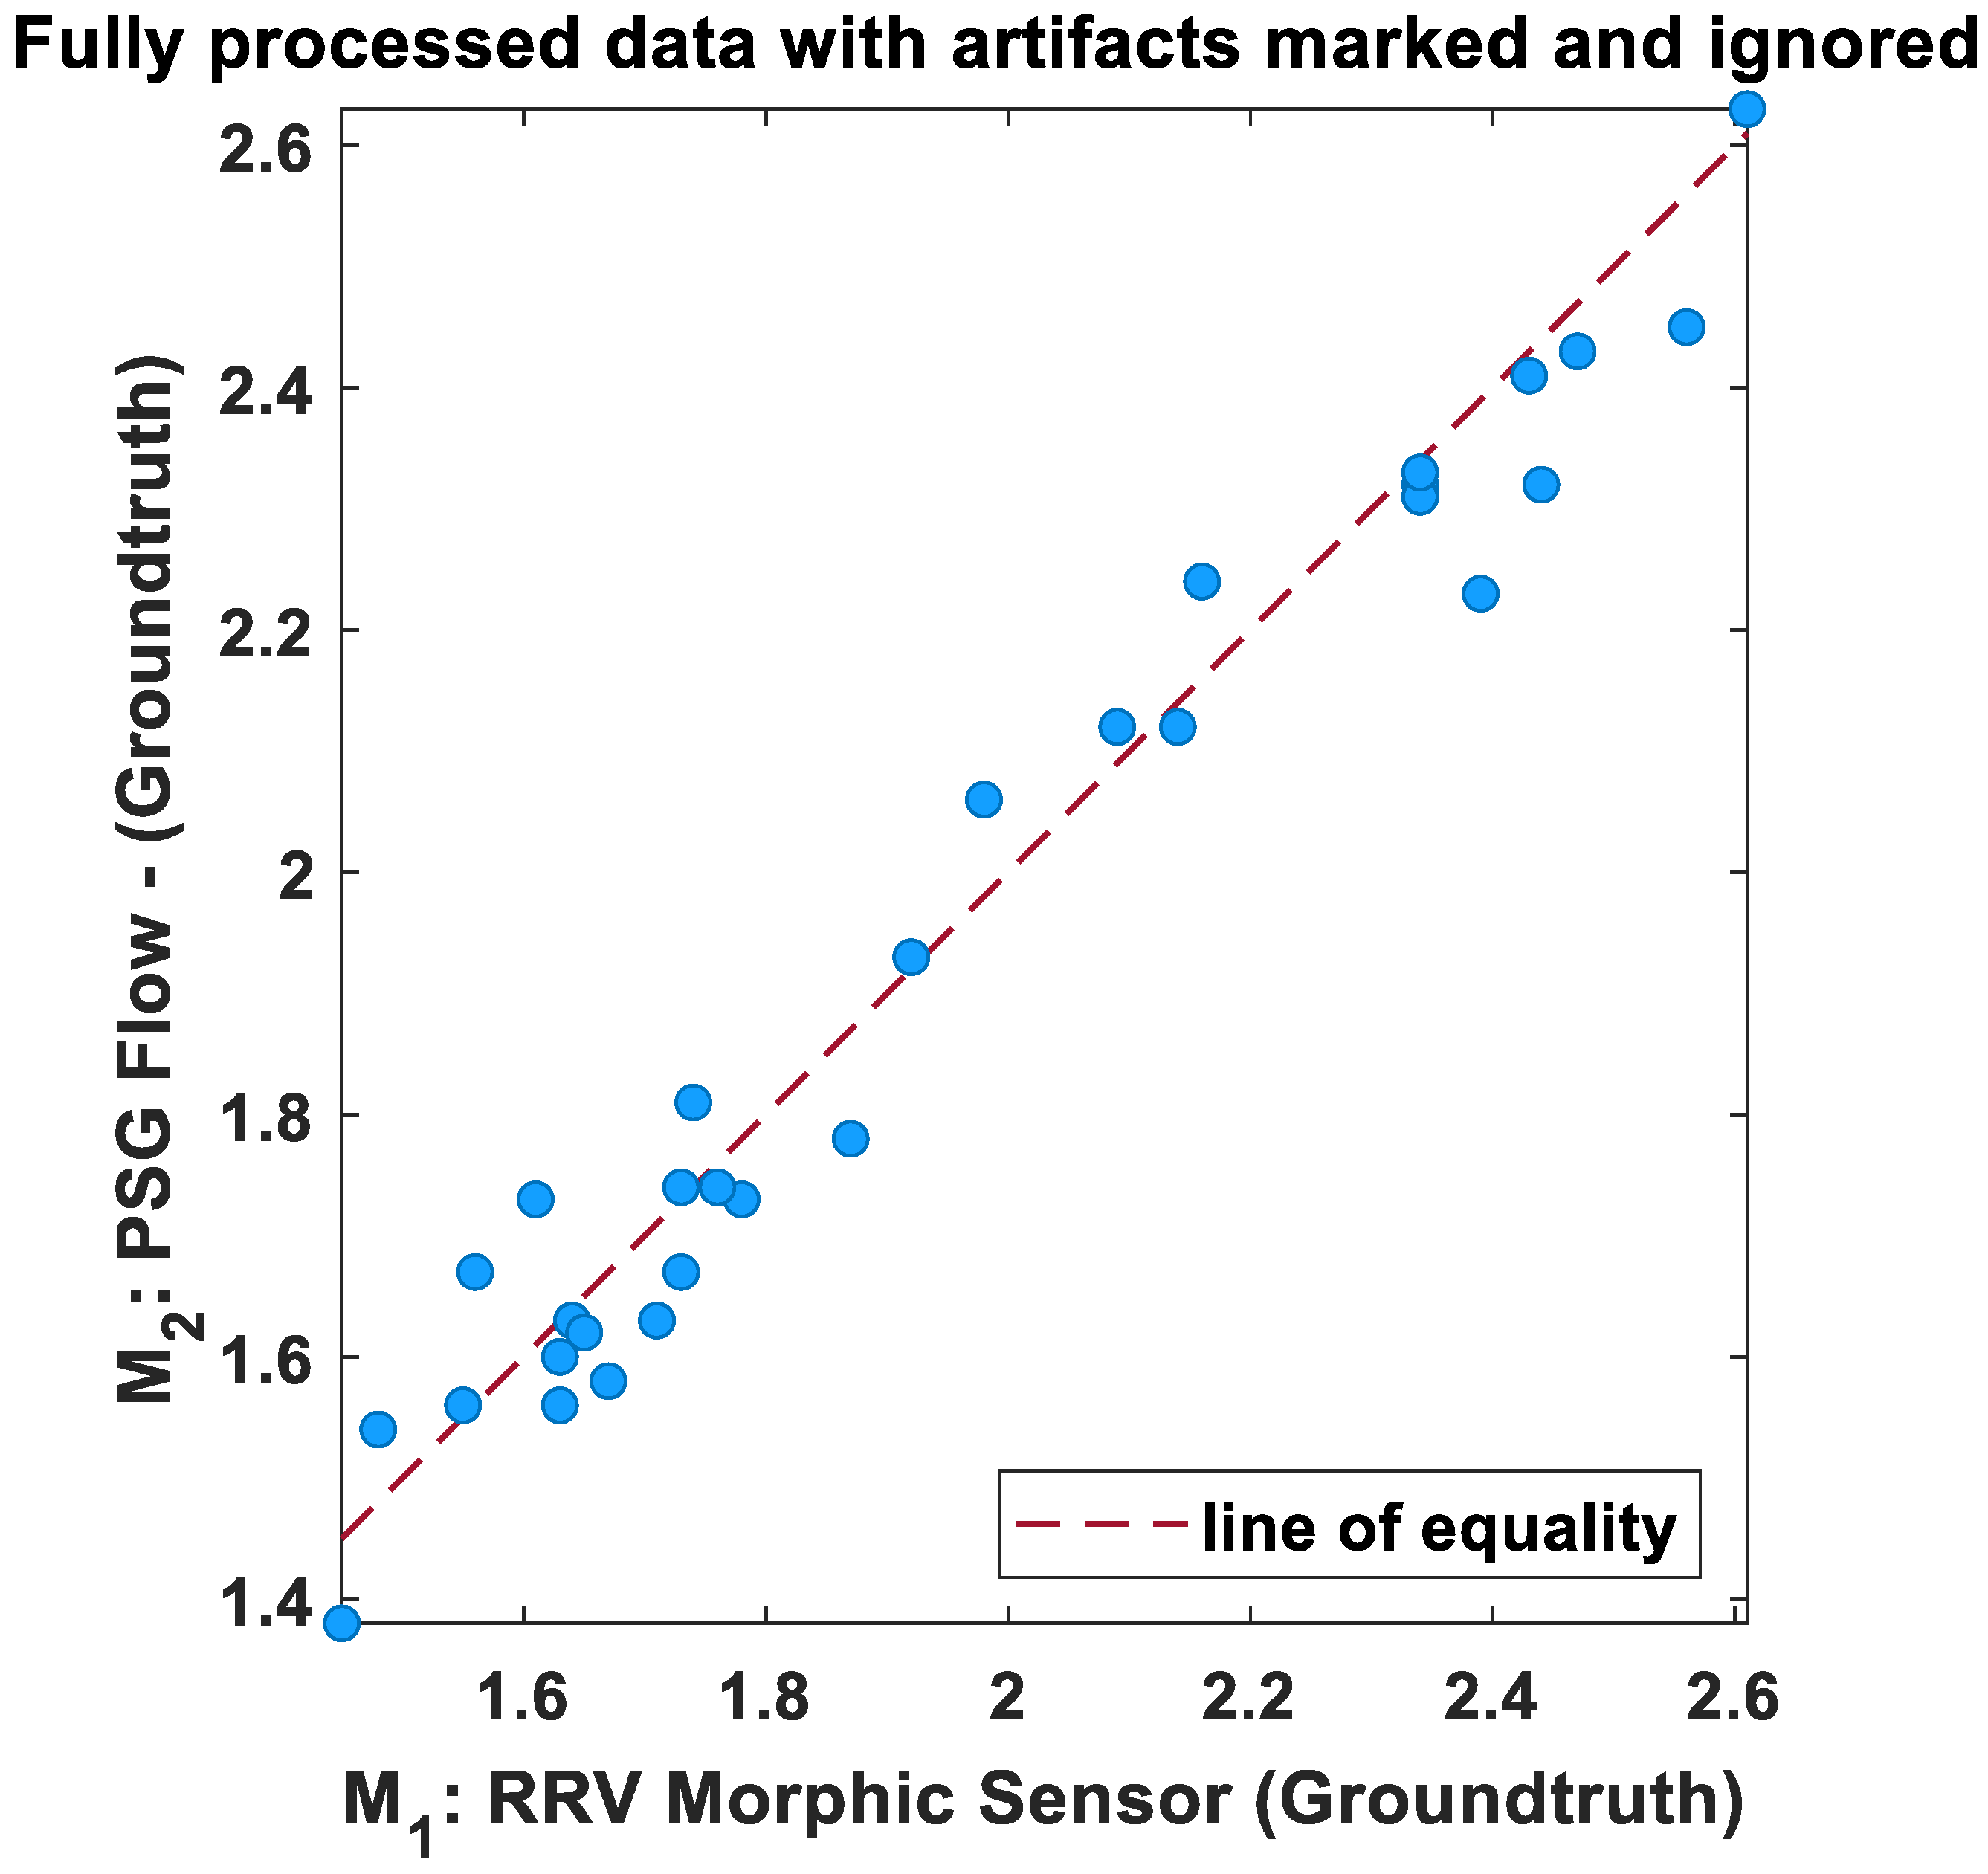
Statistical Analysis—Bland–Altman Evaluation
6. Discussion
7. Conclusions
Supplementary Materials
Author Contributions
Funding
Institutional Review Board Statement
Informed Consent Statement
Data Availability Statement
Acknowledgments
Conflicts of Interest
References
- Huynh, T.P.; Haick, H. Autonomous flexible sensors for health monitoring. Adv. Mater. 2018, 30, 1802337. [Google Scholar] [CrossRef] [PubMed]
- Cheng, M.; Zhu, G.; Zhang, F.; Tang, W.-L.; Jianping, S.; Yang, J.-Q.; Zhu, L.-Y. A review of flexible force sensors for human health monitoring. J. Adv. Res. 2020, 26, 53–68. [Google Scholar] [CrossRef]
- Zazoum, B.; Batoo, K.M.; Khan, M.A.A. Recent advances in flexible sensors and their applications. Sensors 2022, 22, 4653. [Google Scholar] [CrossRef] [PubMed]
- Huhn, S.; Axt, M.; Gunga, H.-C.; Maggioni, M.A.; Munga, S.; Obor, D.; Sié, A.; Boudo, V.; Bunker, A.; Sauerborn, R. The impact of wearable technologies in health research: Scoping review. JMIR Mhealth Uhealth 2022, 10, e34384. [Google Scholar] [CrossRef]
- Guay, P.; Gorgutsa, S.; LaRochelle, S.; Messaddeq, Y. Wearable Contactless Respiration Sensor Based on Multi-Material Fibers Integrated into Textile. Sensors 2017, 17, 1050. [Google Scholar] [CrossRef]
- MacKinnon, G.E.; Brittain, E.L. Mobile Health Technologies in Cardiopulmonary Disease. Chest 2020, 157, 654–664. [Google Scholar] [CrossRef] [PubMed]
- Sivaranjani, S.; Vinoth Kumar, P.; Palanivel Rajan, S. Health Monitoring and Integrated Wearables. In Augmented Intelligence in Healthcare: A Pragmatic and Integrated Analysis; Springer: Berlin/Heidelberg, Germany, 2022; pp. 41–61. [Google Scholar]
- van den Bosch, O.F.C.; Alvarez-Jimenez, R.; de Grooth, H.-J.; Girbes, A.R.J.; Loer, S.A. Breathing variability—Implications for anaesthesiology and intensive care. Crit. Care 2021, 25, 280. [Google Scholar] [CrossRef]
- Alam, R.; Peden, D.B.; Lach, J.C. Wearable Respiration Monitoring: Interpretable Inference With Context and Sensor Biomarkers. IEEE J. Biomed. Health Inf. 2021, 25, 1938–1948. [Google Scholar] [CrossRef]
- Jakkaew, P.; Onoye, T. Non-Contact Respiration Monitoring and Body Movements Detection for Sleep Using Thermal Imaging. Sensors 2020, 20, 6307. [Google Scholar] [CrossRef]
- Anderson, D.E.; McNeely, J.D.; Chesney, M.A.; Windham, B.G. Breathing Variability at Rest is Positively Associated With 24-h Blood Pressure Level. Am. J. Hypertens. 2008, 21, 1324–1329. [Google Scholar] [CrossRef] [Green Version]
- Riha, R.L. Diagnostic approaches to respiratory sleep disorders. J. Thorac. Dis. 2015, 7, 1373–1384. [Google Scholar] [CrossRef] [PubMed]
- Harris, R.S.; Winkler, T.; Musch, G.; Vidal Melo, M.F.; Schroeder, T.; Tgavalekos, N.; Venegas, J.G. The prone position results in smaller ventilation defects during bronchoconstriction in asthma. J. Appl. Physiol. 2009, 107, 266–274. [Google Scholar] [CrossRef] [PubMed] [Green Version]
- Nandakumar, R.; Gollakota, S.; Watson, N. Contactless sleep apnea detection on smartphones. In Proceedings of the 13th Annual International Conference on Mobile Systems, Applications, and Services, Florence, Italy, 18–22 May 2015; pp. 45–57. [Google Scholar]
- Mochizuki, K.; Shintani, R.; Mori, K.; Sato, T.; Sakaguchi, O.; Takeshige, K.; Nitta, K.; Imamura, H. Importance of respiratory rate for the prediction of clinical deterioration after emergency department discharge: A single-center, case-control study. Acute Med. Surg. 2017, 4, 172–178. [Google Scholar] [CrossRef] [PubMed]
- Seddon, P.; Sobowiec-Kouman, S.; Wertheim, D. Infant home respiratory monitoring using pulse oximetry. Arch. Dis. Child. 2018, 103, 603–605. [Google Scholar] [CrossRef] [PubMed] [Green Version]
- Sharma, H.; Sharma, K.K. ECG-derived respiration based on iterated Hilbert transform and Hilbert vibration decomposition. Australas. Phys. Eng. Sci. Med. 2018, 41, 429–443. [Google Scholar] [CrossRef]
- Abdelnasser, H.; Harras, K.A.; Youssef, M. UbiBreathe: A ubiquitous non-invasive WiFi-based breathing estimator. In Proceedings of the 16th ACM International Symposium on Mobile Ad Hoc Networking and Computing, Hangzhou, China, 22–25 June 2015; pp. 277–286. [Google Scholar]
- Adib, F.; Mao, H.; Kabelac, Z.; Katabi, D.; Miller, R.C. Smart homes that monitor breathing and heart rate. In Proceedings of the 33rd Annual ACM Conference on Human Factors in Computing Systems, Seoul, Republic of Korea, 18–23 April 2015; pp. 837–846. [Google Scholar]
- Liu, J.; Wang, Y.; Chen, Y.; Yang, J.; Chen, X.; Cheng, J. Tracking vital signs during sleep leveraging off-the-shelf wifi. In Proceedings of the 16th ACM International Symposium on Mobile Ad Hoc Networking and Computing, Hangzhou, China, 22–25 June 2015; pp. 267–276. [Google Scholar]
- Ravichandran, R.; Saba, E.; Chen, K.-Y.; Goel, M.; Gupta, S.; Patel, S.N. WiBreathe: Estimating respiration rate using wireless signals in natural settings in the home. In Proceedings of the 2015 IEEE International Conference on Pervasive Computing and Communications (PerCom), St. Louis, MO, USA, 23–27 March 2015; pp. 131–139. [Google Scholar]
- Littner, M.; Hirshkowitz, M.; Kramer, M.; Kapen, S.; Anderson, W.M.; Bailey, D.; Berry, R.B.; Davila, D.; Johnson, S.; Kushida, C. Practice parameters for using polysomnography to evaluate insomnia: An update. Sleep 2003, 26, 754–760. [Google Scholar] [CrossRef] [Green Version]
- Lechat, B.; Scott, H.; Naik, G.; Hansen, K.; Nguyen, D.P.; Vakulin, A.; Catcheside, P.; Eckert, D.J. New and Emerging Approaches to Better Define Sleep Disruption and Its Consequences. Front. Neurosci. 2021, 15, 751730. [Google Scholar] [CrossRef] [PubMed]
- Watanabe, T.; Watanabe, K. Noncontact method for sleep stage estimation. IEEE Trans. Biomed. Eng. 2004, 51, 1735–1748. [Google Scholar] [CrossRef]
- Walsh, L.; McLoone, S.; Ronda, J.; Duffy, J.F.; Czeisler, C.A. Noncontact Pressure-Based Sleep/Wake Discrimination. IEEE Trans. Biomed. Eng. 2017, 64, 1750–1760. [Google Scholar] [CrossRef] [Green Version]
- Sanchez-Ortuno, M.; Edinger, J.D. Internight sleep variability: Its clinical significance and responsiveness to treatment in primary and comorbid insomnia. J. Sleep Res. 2012, 21, 527–534. [Google Scholar] [CrossRef]
- Gargiulo, G.D.; O’Loughlin, A.; Breen, P.P. Electro-resistive bands for non-invasive cardiac and respiration monitoring, a feasibility study. Physiol. Meas. 2015, 36, N35. [Google Scholar] [CrossRef] [PubMed]
- Gargiulo, G.D.; Gunawardana, U.; O’Loughlin, A.; Sadozai, M.; Varaki, E.S.; Breen, P.P. A Wearable Contactless Sensor Suitable for Continuous Simultaneous Monitoring of Respiration and Cardiac Activity. J. Sens. 2015, 2015, 151859. [Google Scholar] [CrossRef] [Green Version]
- Arja, S.E.; Jayarathna, T.; Naik, G.; Breen, P.; Gargiulo, G. Characterisation of Morphic Sensors for Body Volume and Shape Applications. Sensors 2019, 20, 90. [Google Scholar] [CrossRef] [Green Version]
- Shabani Varaki, E.; Breen, P.P.; Gargiulo, G.D. Quantification of a low-cost stretchable conductive sensor using an expansion/contraction simulator machine: A step towards validation of a noninvasive cardiac and respiration monitoring prototype. Machines 2017, 5, 22. [Google Scholar] [CrossRef] [Green Version]
- Naik, G.R.; Gargiulo, G.D.; Serrador, J.M.; Breen, P.P. Groundtruth: A Matlab GUI for Artifact and Feature Identification in Physiological Signals. Front. Physiol. 2019, 10, 850. [Google Scholar] [CrossRef] [PubMed] [Green Version]
- Garrido, D.; Assioun, J.J.; Keshishyan, A.; Sanchez-Gonzalez, M.A.; Goubran, B. Respiratory Rate Variability as a Prognostic Factor in Hospitalized Patients Transferred to the Intensive Care Unit. Cureus 2018, 10, e2100. [Google Scholar] [CrossRef] [Green Version]
- Buchan, C.A.; Bravi, A.; Seely, A.J. Variability analysis and the diagnosis, management, and treatment of sepsis. Curr. Infect. Dis. Rep. 2012, 14, 512–521. [Google Scholar] [CrossRef]
- Seely, A.J.; Bravi, A.; Herry, C.; Green, G.; Longtin, A.; Ramsay, T.; Fergusson, D.; McIntyre, L.; Kubelik, D.; Maziak, D.E.; et al. Do heart and respiratory rate variability improve prediction of extubation outcomes in critically ill patients? Crit. Care 2014, 18, R65. [Google Scholar] [CrossRef] [Green Version]
- Huang, C.-C.; Lin, W.-Y.; Lee, M.-Y. Development and verification of an accelerometer-based respiratory detection algorithm with wearable instrumented smart clothes. In Proceedings of the 2017 IEEE International Conference on Systems, Man, and Cybernetics (SMC), Banff, Canada, 5–8 October 2017; pp. 578–581. [Google Scholar]
- Antony Raj, A.; Preejith, S.P.; Raja, V.S.; Joseph, J.; Sivaprakasam, M. Clinical Validation of a Wearable Respiratory Rate Device for Neonatal Monitoring. Annu. Int. Conf. IEEE Eng. Med. Biol. Soc. 2018, 2018, 1628–1631. [Google Scholar] [CrossRef]
- Jarchi, D.; Rodgers, S.J.; Tarassenko, L.; Clifton, D.A. Accelerometry-based estimation of respiratory rate for post-intensive care patient monitoring. IEEE Sens. J. 2018, 18, 4981–4989. [Google Scholar] [CrossRef] [Green Version]
- Dan, G.; Zhao, J.; Chen, Z.; Yang, H.; Zhu, Z. A novel signal acquisition system for wearable respiratory monitoring. IEEE Access 2018, 6, 34365–34371. [Google Scholar] [CrossRef]
- Manoni, A.; Loreti, F.; Radicioni, V.; Pellegrino, D.; Della Torre, L.; Gumiero, A.; Halicki, D.; Palange, P.; Irrera, F. A New Wearable System for Home Sleep Apnea Testing, Screening, and Classification. Sensors 2020, 20, 7014. [Google Scholar] [CrossRef] [PubMed]
- Wang, S.; Liu, M.; Pang, B.; Li, P.; Yao, Z.; Zhang, X.; Chen, H. A new physiological signal acquisition patch designed with advanced respiration monitoring algorithm based on 3-axis accelerator and gyroscope. In Proceedings of the 2018 40th Annual International Conference of the IEEE Engineering in Medicine and Biology Society (EMBC), Honolulu, HI, USA, 17–21 July 2018; pp. 441–444. [Google Scholar]
- Jafari Tadi, M.; Koivisto, T.; Pänkäälä, M.; Paasio, A. Accelerometer-Based Method for Extracting Respiratory and Cardiac Gating Information for Dual Gating during Nuclear Medicine Imaging. Int. J. Biomed. Imaging 2014, 2014, 690124. [Google Scholar] [CrossRef] [PubMed] [Green Version]
- Doheny, E.P.; Lowery, M.M.; Russell, A.; Ryan, S. Estimation of respiration rate and sleeping position using a wearable accelerometer. In Proceedings of the 2020 42nd Annual International Conference of the IEEE Engineering in Medicine & Biology Society (EMBC), Virtual, 20–24 July 2020; pp. 4668–4671. [Google Scholar]
- Hadiyoso, S.; Dewi, E.; Mengko, T.; Zakaria, H. Respiratory rate extraction based on plethysmographic wave analysis. In Proceedings of the IOP Conference Series: Materials Science and Engineering; IOP Science: Bristol, UK, 2020; p. 032050. [Google Scholar]
- Madhav, K.V.; Ram, M.R.; Krishna, E.H.; Reddy, K.N.; Reddy, K.A. Estimation of respiratory rate from principal components of photoplethysmographic signals. In Proceedings of the 2010 IEEE EMBS Conference on Biomedical Engineering and Sciences (IECBES), Kuala Lumpur, Malaysia, 30 November–2 December 2010; pp. 311–314. [Google Scholar]
- Mabrouk, M.; Rajan, S.; Bolic, M.; Forouzanfar, M.; Dajani, H.R.; Batkin, I. Human breathing rate estimation from radar returns using harmonically related filters. J. Sens. 2016, 2016, 9891852. [Google Scholar] [CrossRef] [Green Version]


| Component Type | ERB Front-End Mark I [28] | ERB Front-End Mark II [27] | ERB Front-End Mark III |
|---|---|---|---|
| Instrumentation amplifier | 4 (INA118) | 1 (INA116) | none |
| Current bias generator | 2 (REF200) | 1 (REF200) | 3 (LT3092) |
| Operational amplifier | 4 (OPA129) | none | 3 (OPA140) |
| Power supply | 1 (DHC10512D) | 1 (DHC10512D) | none |
| Passive resistors | 12 (several different values) | 1 (5 kΩ) | 12 (several different values) |
| Capacitors | 1 (2.2 µF); 2 (10 µF); 16 (100 nF) | 1 (2.2 µF); 2 (10 µF); 2 (100 nF) | 18: 9 (100 nF) 3 × 3 (several different values) |
| ERB | 4 (1 m) | 1 (1 m) | 3 (bespoke) |
| Anthropometric Variables | Values |
|---|---|
| Age (years) | 42.2 ± 12.5 |
| Height (cm) | 162.3 ± 15.7 |
| Weight (kg) | 87.3 ± 16.5 |
| BMI (kg m−2) | 32.9 ± 1 |
| Subject Number | Morphic Sensor Respiration Rate (Breaths/Min) | Airflow (PSG) Respiration Rate (Breaths/Min) | Subject Number | Morphic Sensor Respiration Rate (Breaths/Min) | Airflow (PSG) Respiration Rate (Breaths/Min) |
|---|---|---|---|---|---|
| 1 | 13.07 ± 0.08 | 13.09 ± 0.07 | 17 | 14.56 ± 0.09 | 14.12 ± 0.08 |
| 2 | 16.75 ± 0.12 | 16.70 ± 0.10 | 18 | 15.68 ± 0.10 | 16.34 ± 0.07 |
| 3 | 13.12 ± 0.21 | 13.15 ± 0.18 | 19 | 14.34 ± 0.12 | 13.34 ± 0.10 |
| 4 | 14.33 ± 0.06 | 14.32 ± 0.08 | 20 | 13.78 ± 0.10 | 14.56 ± 0.09 |
| 5 | 13.69 ± 0.09 | 13.72 ± 0.08 | 21 | 17.69 ± 0.07 | 16.98 ± 0.06 |
| 6 | 19.03 ± 0.03 | 19.04 ± 0.04 | 22 | 21.98 ± 0.02 | 21.54 ± 0.04 |
| 7 | 20.08 ± 0.04 | 20.10 ± 0.05 | 23 | 23.04 ± 0.03 | 23.21 ± 0.05 |
| 8 | 21.23 ± 0.08 | 19.89 ± 0.09 | 24 | 15.15 ± 0.14 | 16.13 ± 0.10 |
| 9 | 20.14 ± 0.02 | 21.06 ± 0.04 | 25 | 16.76 ± 0.10 | 17.12 ± 0.09 |
| 10 | 21.56 ± 0.08 | 20.89 ± 0.06 | 26 | 18.13 ± 0.04 | 17.56 ± 0.06 |
| 11 | 16.78 ± 0.18 | 15.64 ± 0.10 | 27 | 19.17 ± 0.04 | 19.15 ± 0.02 |
| 12 | 17.09 ± 0.12 | 16.07 ± 0.08 | 28 | 19.26 ± 0.09 | 19.10 ± 0.08 |
| 13 | 18.43 ± 0.10 | 19.01 ± 0.05 | 29 | 20.19 ± 0.03 | 21.12 ± 0.05 |
| 14 | 19.01 ± 0.07 | 18.99 ± 0.08 | 30 | 22.10 ± 0.01 | 22.56 ± 0.03 |
| 15 | 21.04 ± 0.03 | 21.36 ± 0.05 | 31 | 18.16 ± 0.07 | 19.12 ± 0.08 |
| 16 | 21.78 ± 0.02 | 20.98 ± 0.04 | 32 | 17.68 ± 0.11 | 18.34 ± 0.10 |
| Subject Number | Morphic Sensor IBI Variability | Airflow (PSG) IBI Variability | Subject Number | Morphic Sensor IBI Variability | Airflow (PSG) IBI Variability |
|---|---|---|---|---|---|
| 1 | 1.87 ± 0.01 | 1.78 ± 0.02 | 17 | 2.09 ± 0.01 | 2.12 ± 0.01 |
| 2 | 1.73 ± 0.02 | 1.67 ± 0.03 | 18 | 2.39 ± 0.01 | 2.23 ± 0.01 |
| 3 | 1.92 ± 0.01 | 1.93 ± 0.02 | 19 | 2.44 ± 0.01 | 2.32 ± 0.01 |
| 4 | 1.45 ± 0.03 | 1.38 ± 0.04 | 20 | 2.56 ± 0.01 | 2.45 ± 0.01 |
| 5 | 1.56 ± 0.03 | 1.67 ± 0.02 | 21 | 1.98 ± 0.02 | 2.06 ± 0.03 |
| 6 | 1.63 ± 0.01 | 1.60 ± 0.02 | 22 | 1.76 ± 0.02 | 1.74 ± 0.02 |
| 7 | 1.71 ± 0.01 | 1.63 ± 0.04 | 23 | 1.55 ± 0.04 | 1.56 ± 0.02 |
| 8 | 1.67 ± 0.02 | 1.58 ± 0.03 | 24 | 2.34 ± 0.01 | 2.32 ± 0.01 |
| 9 | 1.78 ± 0.01 | 1.73 ± 0.02 | 25 | 2.43 ± 0.01 | 2.41 ± 0.01 |
| 10 | 1.64 ± 0.03 | 1.63 ± 0.03 | 26 | 2.61 ± 0.01 | 2.63 ± 0.02 |
| 11 | 1.73 ± 0.01 | 1.74 ± 0.01 | 27 | 2.47 ± 0.02 | 2.43 ± 0.03 |
| 12 | 1.74 ± 0.01 | 1.81 ± 0.01 | 28 | 2.34 ± 0.02 | 2.31 ± 0.02 |
| 13 | 1.63 ± 0.02 | 1.56 ± 0.04 | 29 | 2.14 ± 0.03 | 2.12 ± 0.02 |
| 14 | 1.61 ± 0.04 | 1.73 ± 0.03 | 30 | 2.16 ± 0.02 | 2.24 ± 0.01 |
| 15 | 1.48 ± 0.04 | 1.54 ± 0.03 | 31 | 2.09 ± 0.03 | 2.12 ± 0.02 |
| 16 | 1.65 ± 0.01 | 1.62 ± 0.03 | 32 | 2.34 ± 0.02 | 2.33 ± 0.02 |
| Sensor Type | Signal Processing Method | Respiratory Parameter Computed | Accuracy | |
|---|---|---|---|---|
| Our proposed method | Morphic sensor | Groundtruth (artefact removal) and Peak detection | RR and IBI | 95% |
| Huang et al. [35]. | Accelerometer | Peak detection | RR | 95% |
| Antony Raj et al. [36] | Accelerometer | Peak detection | RR | 97.4% |
| Jarchi et al. [37] | Accelerometer | Singular Spectral Analysis (SSA) and Fast Fourier Transform (FFT) | RR | NA |
| Dan et al. [38] | CO2 | Peak detection | RR | 99.8% |
| Manoni et al. [39] | Photoplethysmography (PPG) | Power Spectral Density (PSD), Periodic Waveform Analysis (PWA) | RR | 93% |
| Wang et al. [40] | Accelerometer and gyroscope | Variance Characterisation Series (VCS), Kalman Filter | RR | NA |
| Jafari Tadi et al. [41] | Seismocardiogram (SCG) | Peak detection, FFT | RR | 99% |
Disclaimer/Publisher’s Note: The statements, opinions and data contained in all publications are solely those of the individual author(s) and contributor(s) and not of MDPI and/or the editor(s). MDPI and/or the editor(s) disclaim responsibility for any injury to people or property resulting from any ideas, methods, instructions or products referred to in the content. |
© 2023 by the authors. Licensee MDPI, Basel, Switzerland. This article is an open access article distributed under the terms and conditions of the Creative Commons Attribution (CC BY) license (https://creativecommons.org/licenses/by/4.0/).
Share and Cite
Naik, G.R.; Breen, P.P.; Jayarathna, T.; Tong, B.K.; Eckert, D.J.; Gargiulo, G.D. Morphic Sensors for Respiratory Parameters Estimation: Validation against Overnight Polysomnography. Biosensors 2023, 13, 703. https://doi.org/10.3390/bios13070703
Naik GR, Breen PP, Jayarathna T, Tong BK, Eckert DJ, Gargiulo GD. Morphic Sensors for Respiratory Parameters Estimation: Validation against Overnight Polysomnography. Biosensors. 2023; 13(7):703. https://doi.org/10.3390/bios13070703
Chicago/Turabian StyleNaik, Ganesh R., Paul P. Breen, Titus Jayarathna, Benjamin K. Tong, Danny J. Eckert, and Gaetano D. Gargiulo. 2023. "Morphic Sensors for Respiratory Parameters Estimation: Validation against Overnight Polysomnography" Biosensors 13, no. 7: 703. https://doi.org/10.3390/bios13070703