Article

Electrospun Nanofibers including Organic/Inorganic Nanohybrids: Polystyrene- and Clay-Based Architectures in Immunosensor Preparation for Serum Amyloid A

1
Department of Biochemistry, Faculty of Science, Ege University, Bornova, Izmir 35100, Turkey
2
Department of Chemistry, Faculty of Science, Ege University, Bornova, Izmir 35100, Turkey
3
Department of Engineering Sciences, Izmir Katip Celebi University, Cigli, Izmir 35620, Turkey
*
Author to whom correspondence should be addressed.
Biosensors 2023, 13(7), 673; https://doi.org/10.3390/bios13070673
Submission received: 24 April 2023 / Revised: 14 June 2023 / Accepted: 19 June 2023 / Published: 23 June 2023
(This article belongs to the Special Issue Nanomaterial-Based Biosensors and Their Applications)

Abstract

:
Diagnostic techniques based on biomolecules have application potential that can be realized in many fields, such as disease diagnosis, bioprocess imaging, food/beverage industries, and environmental pollutant imaging. Successful surface immobilization of biomolecules is critical to increasing the stabilization, sensitivity, and selectivity of biomolecules used in bioassay systems. Nanofibers are good candidates for the immobilization of biomolecules owing to many advantages such as morphology and pore size. In this study, montmorillonite (MMT) clay is modified with poly(amidoamine) (PAMAM) generation 3 (PAMAMG3) and added to polystyrene (PS) solutions, following which PS/MMT-PAMAMG3 nanofibers are obtained using the electrospinning method. The nanofibers are obtained by testing PS% (wt%) and MMT-PAMAMG3% (wt%) ratios and characterized with scanning electron microscopy. Antiserum amyloid A antibody (Anti-SAA) is then conjugated to the nanofibers on the electrode surface via covalent bonds using a zero-length cross linker. Finally, the obtained selective surface is used for electrochemical determination of serum amyloid A (SAA) levels. The linear range of PS/MMT-PAMAM/Anti-SAA is between 1 and 200 ng/mL SAA, and the detection limit is 0.57 ng/mL SAA. The applicability of PS/MMT-PAMAMG3/Anti-SAA is investigated by taking measurements in synthetic saliva and serum both containing SAA.

1. Introduction

The acute-phase response (APR) is a nonspecific innate reaction of the body to local or systemic disturbances in homeostasis that occurs due to infections, inflammations, stresses, or immunological disorders [1]. During APR, besides fever and hormonal changes, serum protein levels might change. Among serum proteins, serum amyloid A (SAA) and C-reactive protein (CRP), mainly secreted from the liver, are important biomarkers in predicting certain diseases [2]. SAA, a family of apolipoproteins defined as acute-phase proteins, has a precursor relationship with the main components of amyloid A fibril in reactive amyloidosis. It performs various roles, including the transport of cholesterol to the liver for secretion into the bile, recruitment of immune cells to inflammatory areas, chemotaxis of leukocytes, immunomodulatory activity, opsonization, and induction of enzymes that degrade the extracellular matrix [3,4]. SAA has also been reported to be a better biomarker than CRP for diseases except for inflammatory bowel disease [5]. Many comparative studies have been reported, such as those on monitoring the course of coronavirus disease 2019 [6,7] and inflammatory rheumatic diseases [8] and predicting mucosal healing in patients with ulcerative colitis in clinical remission [9]. Therefore, we must develop a rapid and sensitive method for the detection of SAA in human serum. A variety of means based on the surface plasmon resonance method [10], enzyme-linked immunosorbent assay (ELISA) [11], mass spectrometry [12], latex particle-enhanced immunoturbidimetry [13], immunonephelometry [14], and electrochemical immunosensors [15] has been applied for SAA detection. However, ELISA is complicated, expensive, and labor-intensive, and therefore, common detection methods based on ELISA are time-consuming. Electrochemical immunosensors are potential alternatives for highly sensitive, cost-effective, and straightforward detection of target molecules while overcoming the abovementioned limitations [16,17,18,19,20]. For example, Xia et al. developed a highly sensitive electrochemical immunological biosensor for SAA by modifying glassy carbon electrodes (GCEs) using carboxy-end-capped polypyrrole (PPy-α-COOH), multiwalled carbon nanotubes (MWCNTS), ionic liquid, and chitosan (Chit). On the one hand, PPy-α-COOH provides binding sites for covalent immobilization of Anti-SAA; on the other hand, MWCNTS/IL/Chit nanocomposites provide satisfactory electrical conductivity as well as high stability [15]. Ultralow amounts of analytes might be detected with electrochemical biosensors by means of signal amplification based on bioelectrocatalytic reactions, nanomaterial labeling, molecular biological strategies, etc. [21,22]. Moreover, the surface of the electrodes is a key point affecting the response of electrochemical immunosensors [23]. Conducting polymers [24], natural polymers [25], inorganic materials [26], and nanostructures [27] are used for surface modification to prepare immunosensors. Among them, electrospun nanofibers have attracted considerable attention because of their large surface area, controllable film thickness, and ease of forming functional groups on their surface.
The large surface area of electrospun nanofibers are combined with clay, an ideal inorganic structure that can be used as an immobilization matrix for biomolecules owing to its high absorption and cation-exchange capacity (CEC) and well-dispersive nature. Polymer/inorganic hybrid electrospun nanofibers can be fabricated using different types of modified clays and polymers [28,29,30]. Montmorillonite (MMT), the most preferred clay in analytical applications, has been modified using dendrimers [28,29,30], folic acid [31], hexadecyl trimethyl ammonium chloride [32], and sodium dodecyl sulfonate [33], and transformed into nanofibers with poly(vinyl) alcohol (PVA), poly(caprolacton) (PCL), and Chit, among others [28,29,30]. In our previous study, electrospun PVA nanofibers, including poly(amidoamine) generation 2 (PAMAMG2)-modified MMTs, were fabricated for the covalent immobilization of pyranose oxidase to prepare stable enzymatic glucose biosensors [29]. In other studies, electrospun polycaprolacton-Chit nanofibers, including PAMAM generation 0 (PAMAMG0) and PAMAM generation 1 (PAMAMG1)-modified MMTs, were coated with arginylglycylaspartic acid peptide and glutamate oxidase to prepare cell adhesion platforms and monosodium glutamate biosensors, respectively [28,30]. Herein, the surface of polystyrene (PS) nanofibers, as well as PAMAMG3-modified MMT, is considered to be an alternative to the routinely used ELISA platforms for the detection of SAA. Not only is the cost reduced but also the detection limit is improved. The sensor system is promising for the analysis of clinical serum samples owing to the ease of nanofiber fabrication and the advantages of electrochemical systems.

2. Materials and Methods

2.1. Materials

Polystyrene (PS), PAMAM dendrimer, ethylenediamine core, generation 3.0 solution ([NH2(CH2)2NH2]:(G = 3); dendriPAMAM(NH2)32) (ethylenediamine core, 20 wt.% in methanol; formula weight 6908.84 g/mol), potassium hexacyanoferrate (III) (K3[Fe(CN)6]), N-(3-dimethylaminopropyl)-N′-ethylcarbodiimide hydrochloride (EDC), and N-hydroxysuccinimide (NHS; 98%) were purchased from Sigma-Aldrich (St. Louis, MO, USA). N, N-Dimethylformamide (DMF; 99.8%), and serum amyloid A (SAA) were obtained from (Merck, Germany). Antiserum amyloid A (Anti-SAA) from OriGene (Rockville, MD, USA) and MMT from Southern Clay Products (Austin, TX, USA) were used. Synthetic serum and synthetic saliva were prepared for sample application experiments according to the literature. Briefly, the synthetic serum included KCl (4.5 mM), MgCl2 (1.6 mM), CaCl2 (5.0 mM), NaCl (145.0 mM), urea (2.5 mM), D(+)-glucose (4.7 mM), and albumin (0.1 mM) [34]. The synthetic saliva included KCl (13.0 mM), KSCN (20.0 mM), CaCl2.H2O (1.5 mM), NaCl (2.2 mM), NH4Cl (1.82 mM), KH2PO4 (48.0 mM), NaHCO3 (67.5 mM), Na2SO4.10H2O (2.4 mM), and urea (33.0 mM) [35].

2.2. Apparatus

Electrospun nanofibers were obtained on indium tin oxide glasses (Teknoma, IzmirTurkey) using the electrospinning unit NanoWeb Electrospin 103 (MaviTech, Mersin-Turkey). Notably, the samples had been sonicated for 1 h in an ultrasonic mixer device (Medisson Ultrasonic Clenar, Istanbul-Turkey) before obtaining the nanofibers in the electrospinning device. The contact angles of the nanofibers were measured using an Attention Theta goniometer. Cyclic voltammetry (CV), differential pulse voltammetry (DPV), and electrochemical impedance spectroscopy (EIS) measurements were performed using a PalmSens4 potentiostat (PalmSens Instruments, Houten, The Netherlands) at room temperature. The structures of neat MMT and MMT-PAMAMG3 were analyzed with Fourier-transform infrared spectroscopy using the Perkin Elmer Pyris 1 spectrometer (USA) in the 400–4000 cm−1 range. Pellets were prepared by dispersing the samples into KBr for the Fouirer Transform Infrared Spektrofotometric (FTIR) analysis of the clay samples. Additionally, an attenuated total reflectance apparatus was used for the FTIR analysis of the nanofiber samples. The thermal behavior of the clay and organoclay samples was investigated using thermogravimetric analysis/differential thermogravimetry (TGA/DTG). The mass losses of the samples were detected at a heating rate of 10 °C/min and nitrogen gas flow rate of 75 mL/min in the temperature range of 25–800 °C. X-ray diffraction (XRD) patterns of the clay and organoclay samples were recorded on an XRD spectrometer (Philips E’xpert Pro, UK) equipped with a graphite monochromator using a Cu Kα radiation source (λ = 0.154 nm). The samples were scanned with a diffraction angle 2θ in the range of 4°–80° in 1° increments. The interlayer distances of the homogenized powder clay and organoclay samples were determined from the diffraction peaks using the Bragg equation (nλ = 2dsinθ). The zeta potential of the MMT particles was measured using a Zeta-Meter 3.0+ with Zeiss DR microscope, GT-2 type quartz cell, molybdenum cylinder anode, and platinum rod cathode electrode. Energy-dispersive X-ray (EDX) spectra and SEM micrographs were obtained on a Carl Zeiss 300 VP SEM at an accelerating voltage of 7 kV. X-ray photoelectron spectroscopy (XPS) analysis was performed on each of the nanofibers using Thermo Scientific K-Alpha.

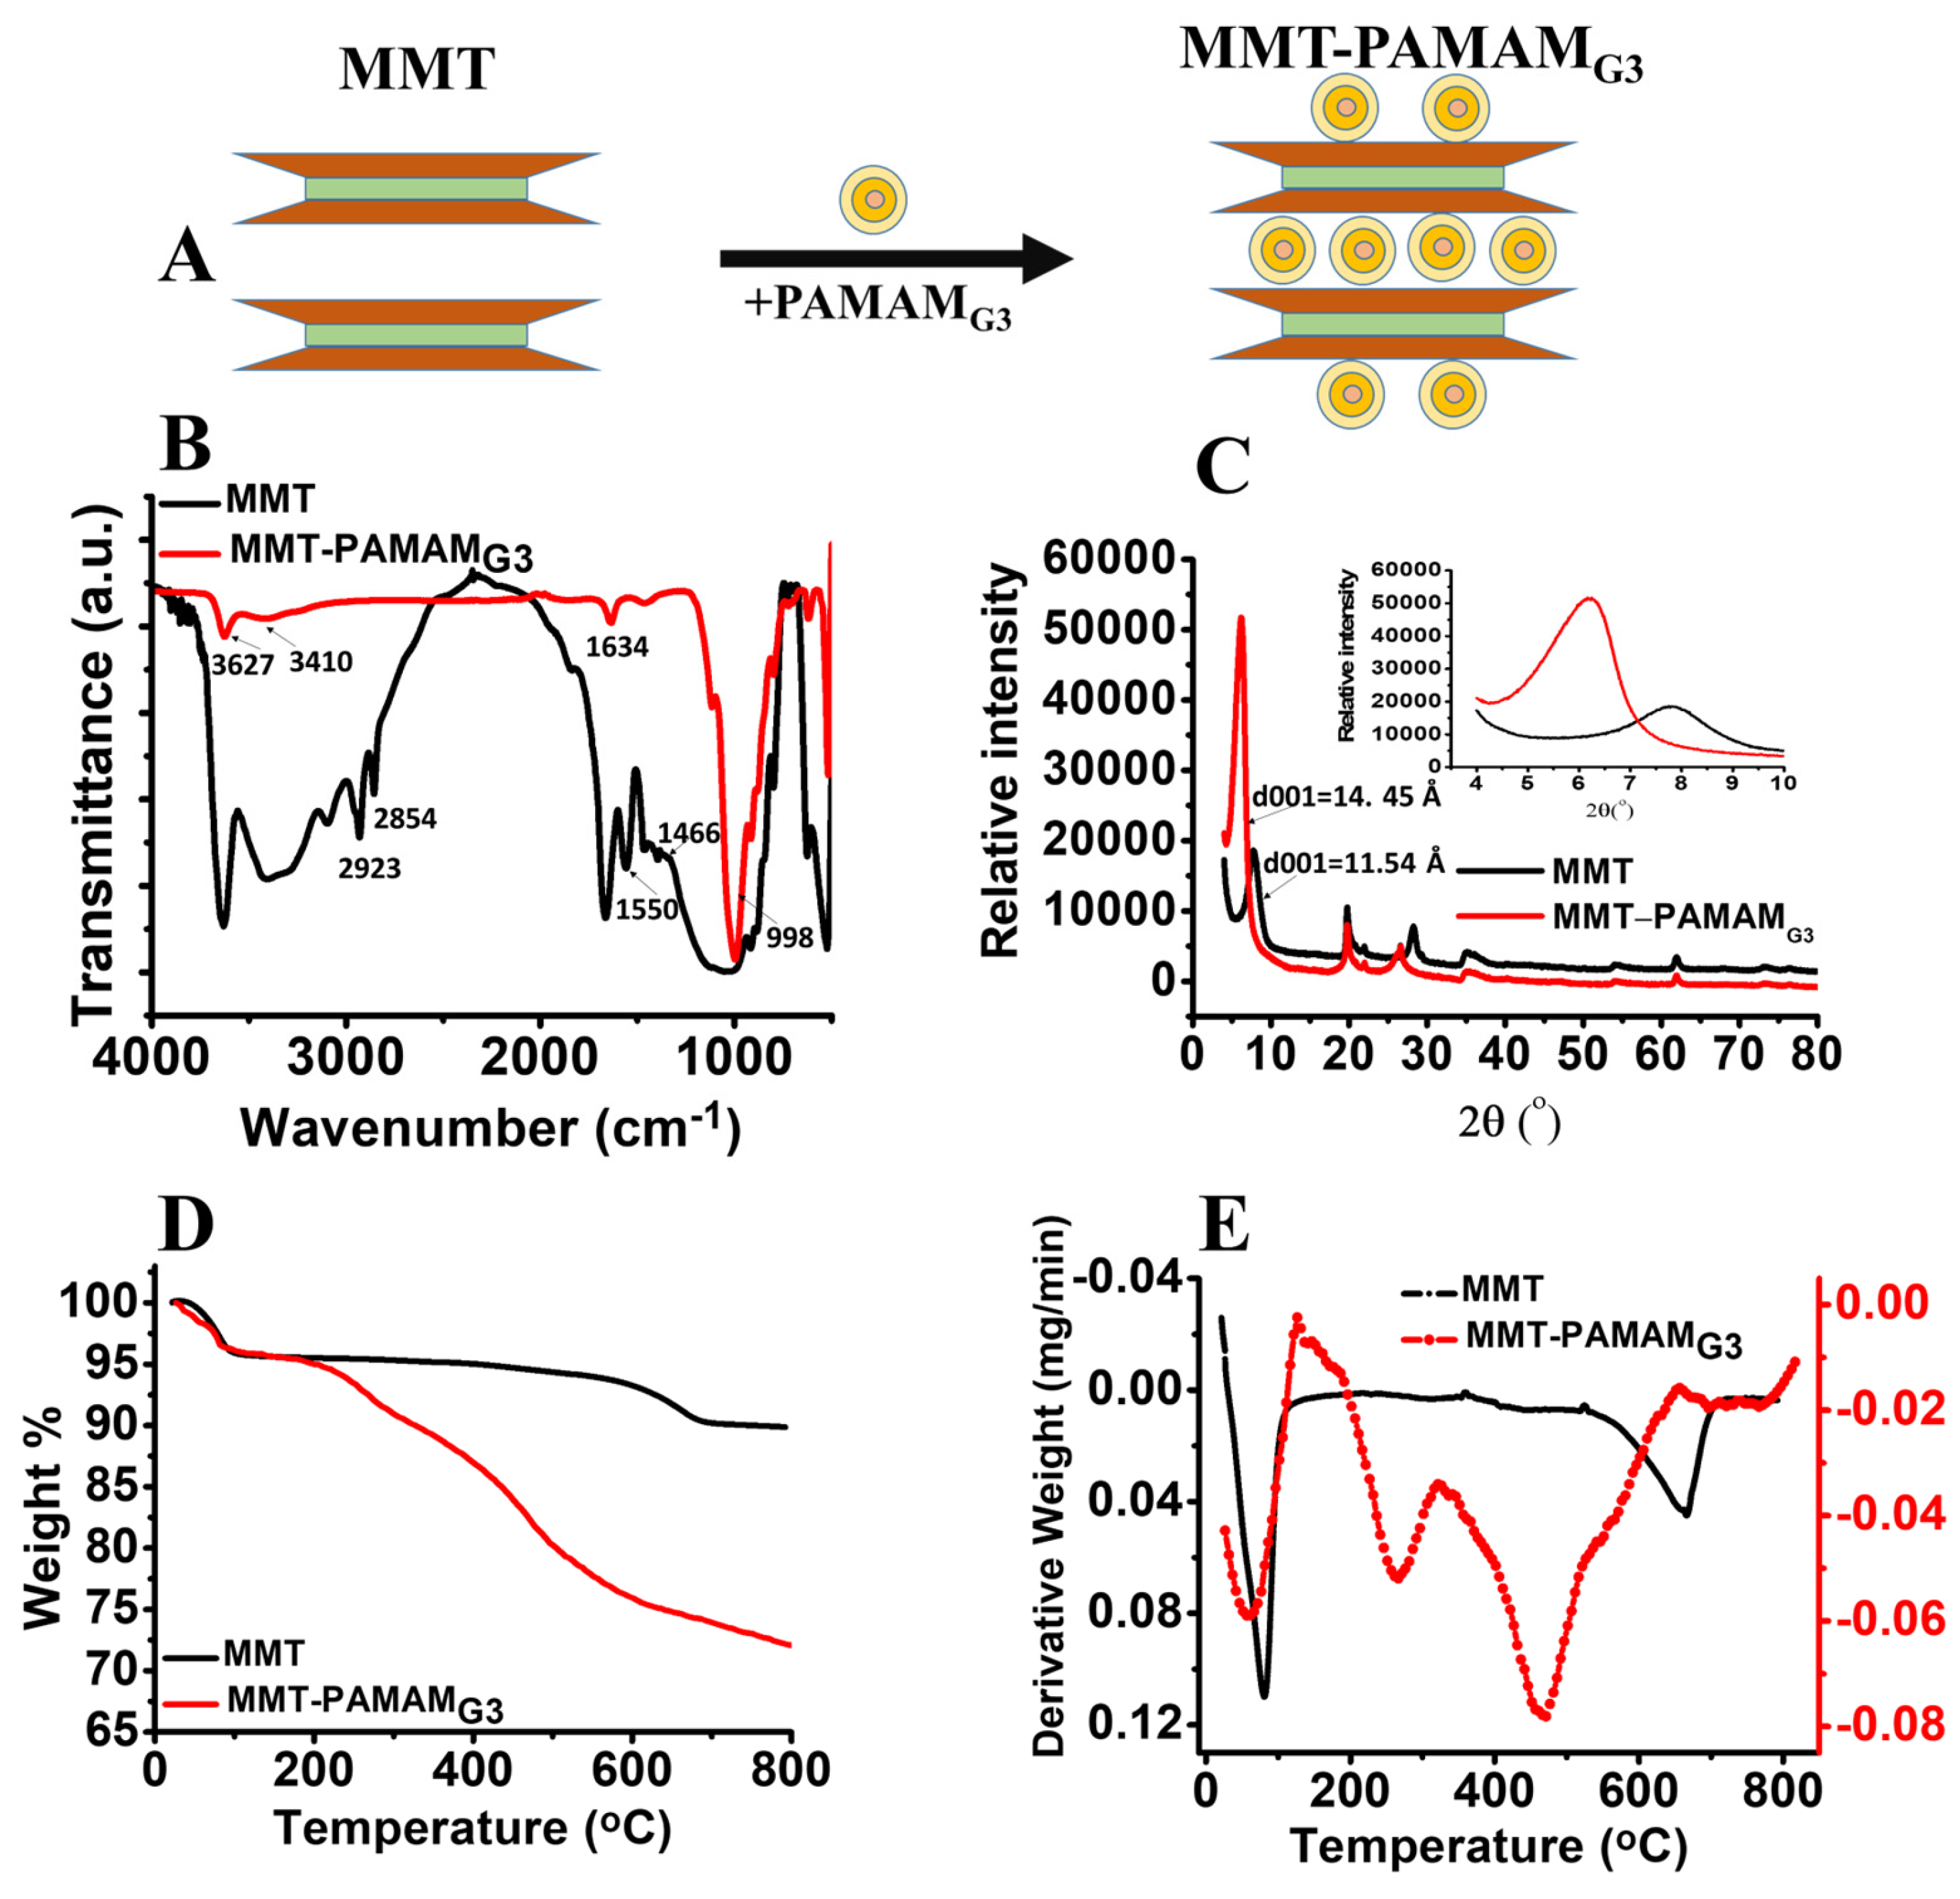
2.3. Preparation of MMT-PAMAMG3

MMT with an organic molecule, PAMAMG3, was modified according to a cation-exchange process [28,29,30]. This process is based on the replacement of hydrated Na+ ions in the interlayers of clay minerals with PAMAMG3 containing quaternary alkyl ammonium ions. According to this process, 1.0 g of MMT was dispersed in deionized water at room temperature using a mechanical stirrer. Meanwhile, PAMAMG3 equivalent to approximately twice the CEC of MMT was dissolved in deionized water. Subsequently, PAMAMG3 was treated with 1.0 M aqueous HCL solution to obtain an alkyl ammonium salt. This PAMAMG3 solution was gradually added to the dispersion containing clay particles, and a displacement reaction was performed at room temperature for 24 h using a magnetic stirrer. The obtained organoclay (MMT-PAMAMG3) was precipitated using centrifugation (18,000 rpm, 15 min) and repeatedly washed with deionized water and ether until no halide ions were detected upon adding 0.1 M aqueous AgNO3 solution. The final product was dried in a vacuum oven for 2 days at 45 °C.

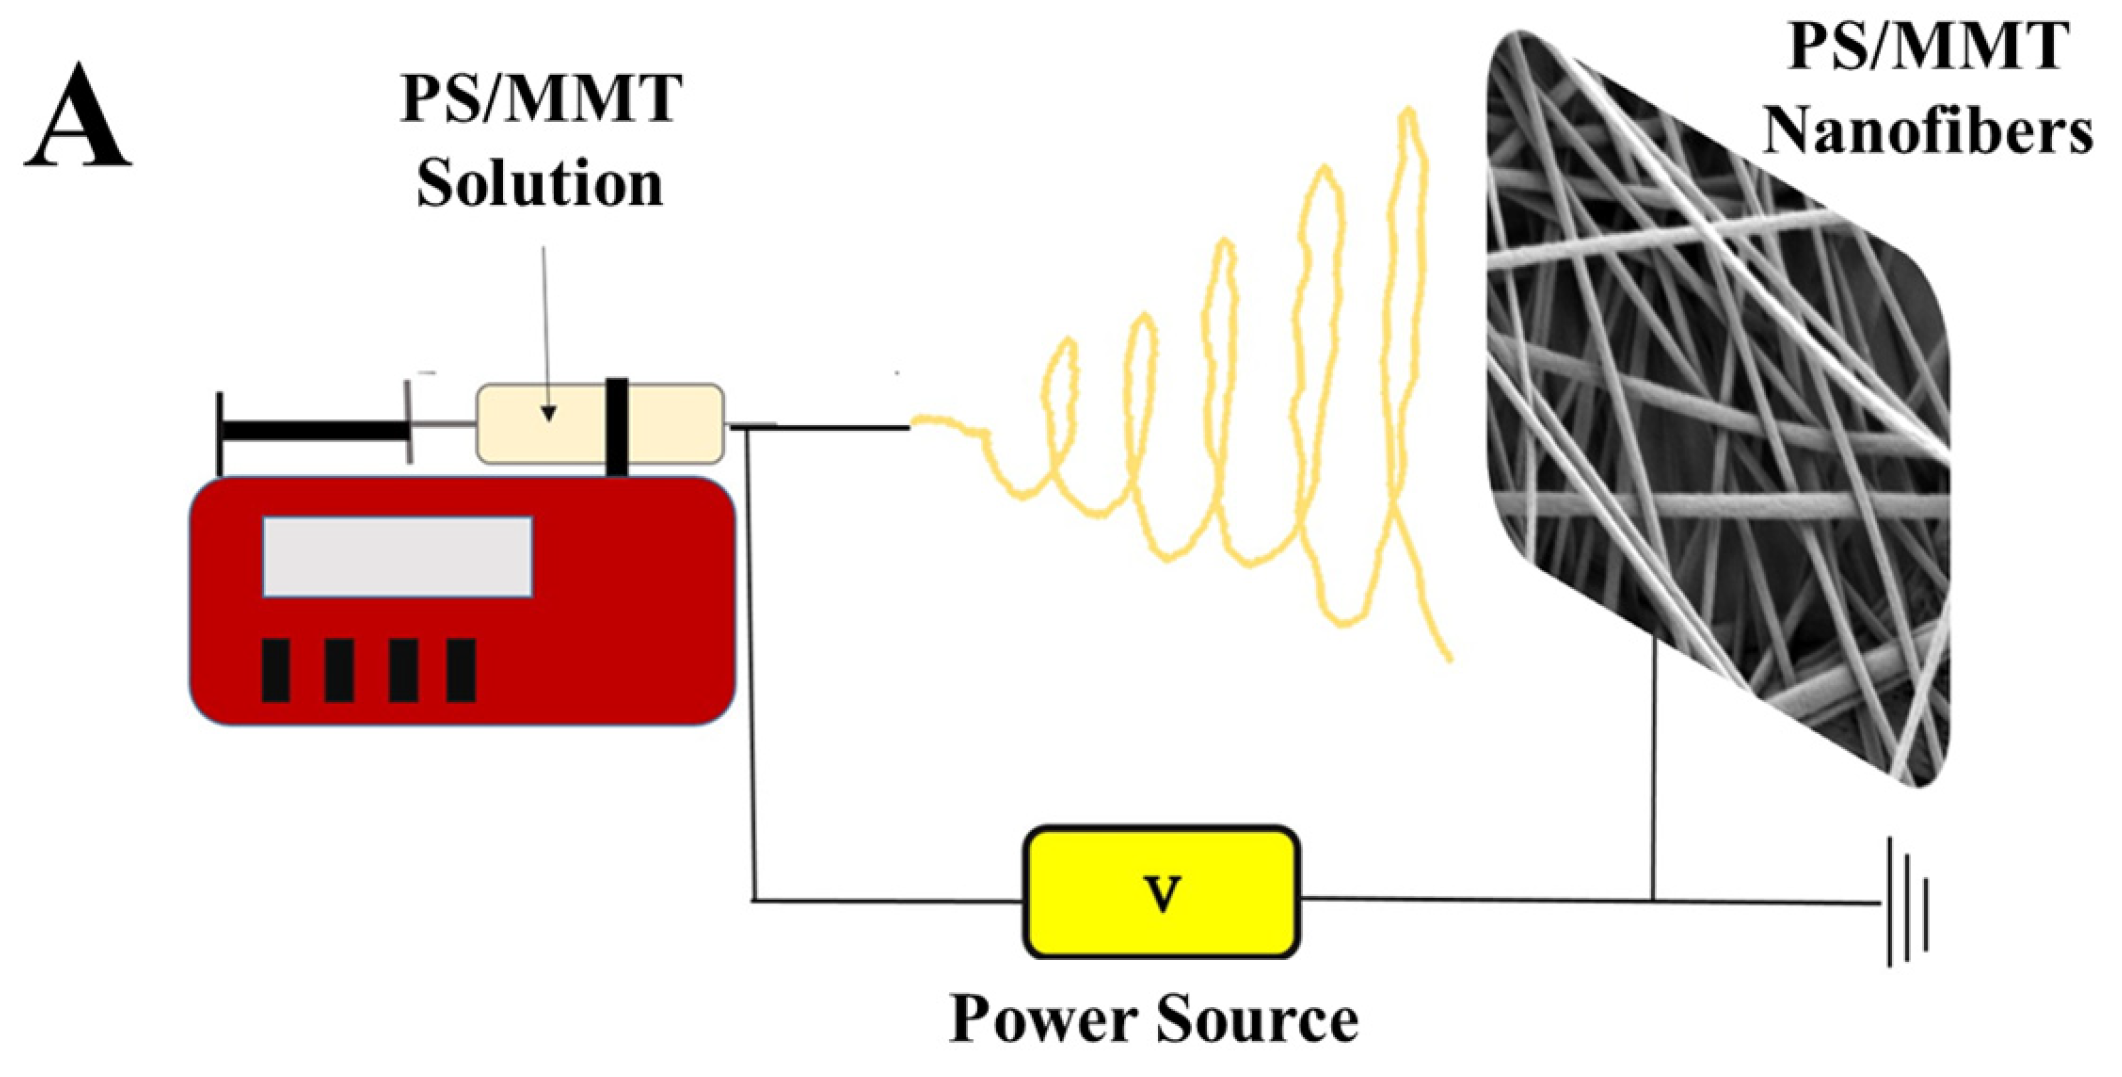
2.4. Fabrication of PS/MMT-PAMAMG3 Electrospun Nanofibers

Electrospinning solutions were prepared by dissolving 20 wt% PS beads in DMF at 50 °C. Subsequently, MMT-PAMAMG3 (0.5 wt%) and Triton X100 (2.5 wt%) were added to this solution. After stirring overnight and applying ultrasonication for 4 h, the polymer solution was filled into a 2 mL syringe with 0.8 mm diameter and placed in a microinfusion pump. The working conditions were optimized as follows: an applied voltage of 8–15 kV, a distance between the needle and metal collector of 10–15 cm, and a flow rate of 0.8–2 mL/h. The PS/MMT-PAMAMG3 nanofibers were collected on the GCEs after 45–60 s. The electrodes were left overnight at room temperature to dry their surfaces. During the fabrication of the nanofibers, the temperature was 20–25 °C and the humidity between 60% and 65%.

2.5. Preparation of PS/MMT-PAMAMG3/Anti-SAA Immonusensor

Total amounts of 0.2 M EDC and 0.4 M NHS were dissolved in phosphate-buffered saline (PBS) to conjugate Anti-SAA on an electrode surface covered with the PS/MMT-PAMAMG3 nanofibers. Anti-SAA:EDC:NHS (1:1:2; v:v:v) was mixed in PBS and incubated at 1200 rpm for 15 min. The mixture was added onto the PS/MMT-PAMAMG3 nanofiber-covered electrode surface and incubated for 4h. Following this, the PS/MMT-PAMAMG3/Anti-SAA was rinsed with buffer. EIS, CV, and DPV were performed to confirm that the GCE surface had been modified with PS/MMT-PAMAMG3 and PS/MMT-PAMAMG3/Anti-SAA. A 0.164 g mass of hexacyanoferrate (III) (K3[Fe(CN)6]) (HCF) was dissolved in 1.0 mL of PBS, and KCl (3.73 g) was dissolved in 50 mL of distilled water. HCF (100 μL, 5 mM) and KCl (1 mL, 0.1 M) were added to 8.9 mL of PBS buffer in the chamber. Mixing was achieved with the help of a magnetic bar. Protein determination was performed with Bradford to calculate the amount of antibody bound to the surface of the PS/MMT-PAMAMG3 nanofibers [36]. First, the protein standard graph was plotted. Then the amount of free antibody and unbound antibody was calculated; hence, the amount of antibody on the surface of the PS/MMT-PAMAMG3/Anti-SAA nanofibers was calculated. Then, the molecular weight of the antibody was kept constant as 12 kDa and the number of antibodies on the surface was calculated according to the literature [37,38].

2.6. Electrochemical Measurements

PalmSens4 was used as a potentiostat. A triple-electrode system consisting of Ag/AgCl as the reference electrode, Pt counter electrode as the auxiliary electrode, and GCE as the working electrode was used. The measurement was performed in a nonmixing environment. CV and DPV measurements were taken in a potential range of −0.4 Volts (V) and +0.8 Volts (V). EIS measurements were taken with 0.18 V as the excitation voltage, 0.21 × 10⁻⁴–100 kHz frequency, and 10 mV dc potential.

3. Results

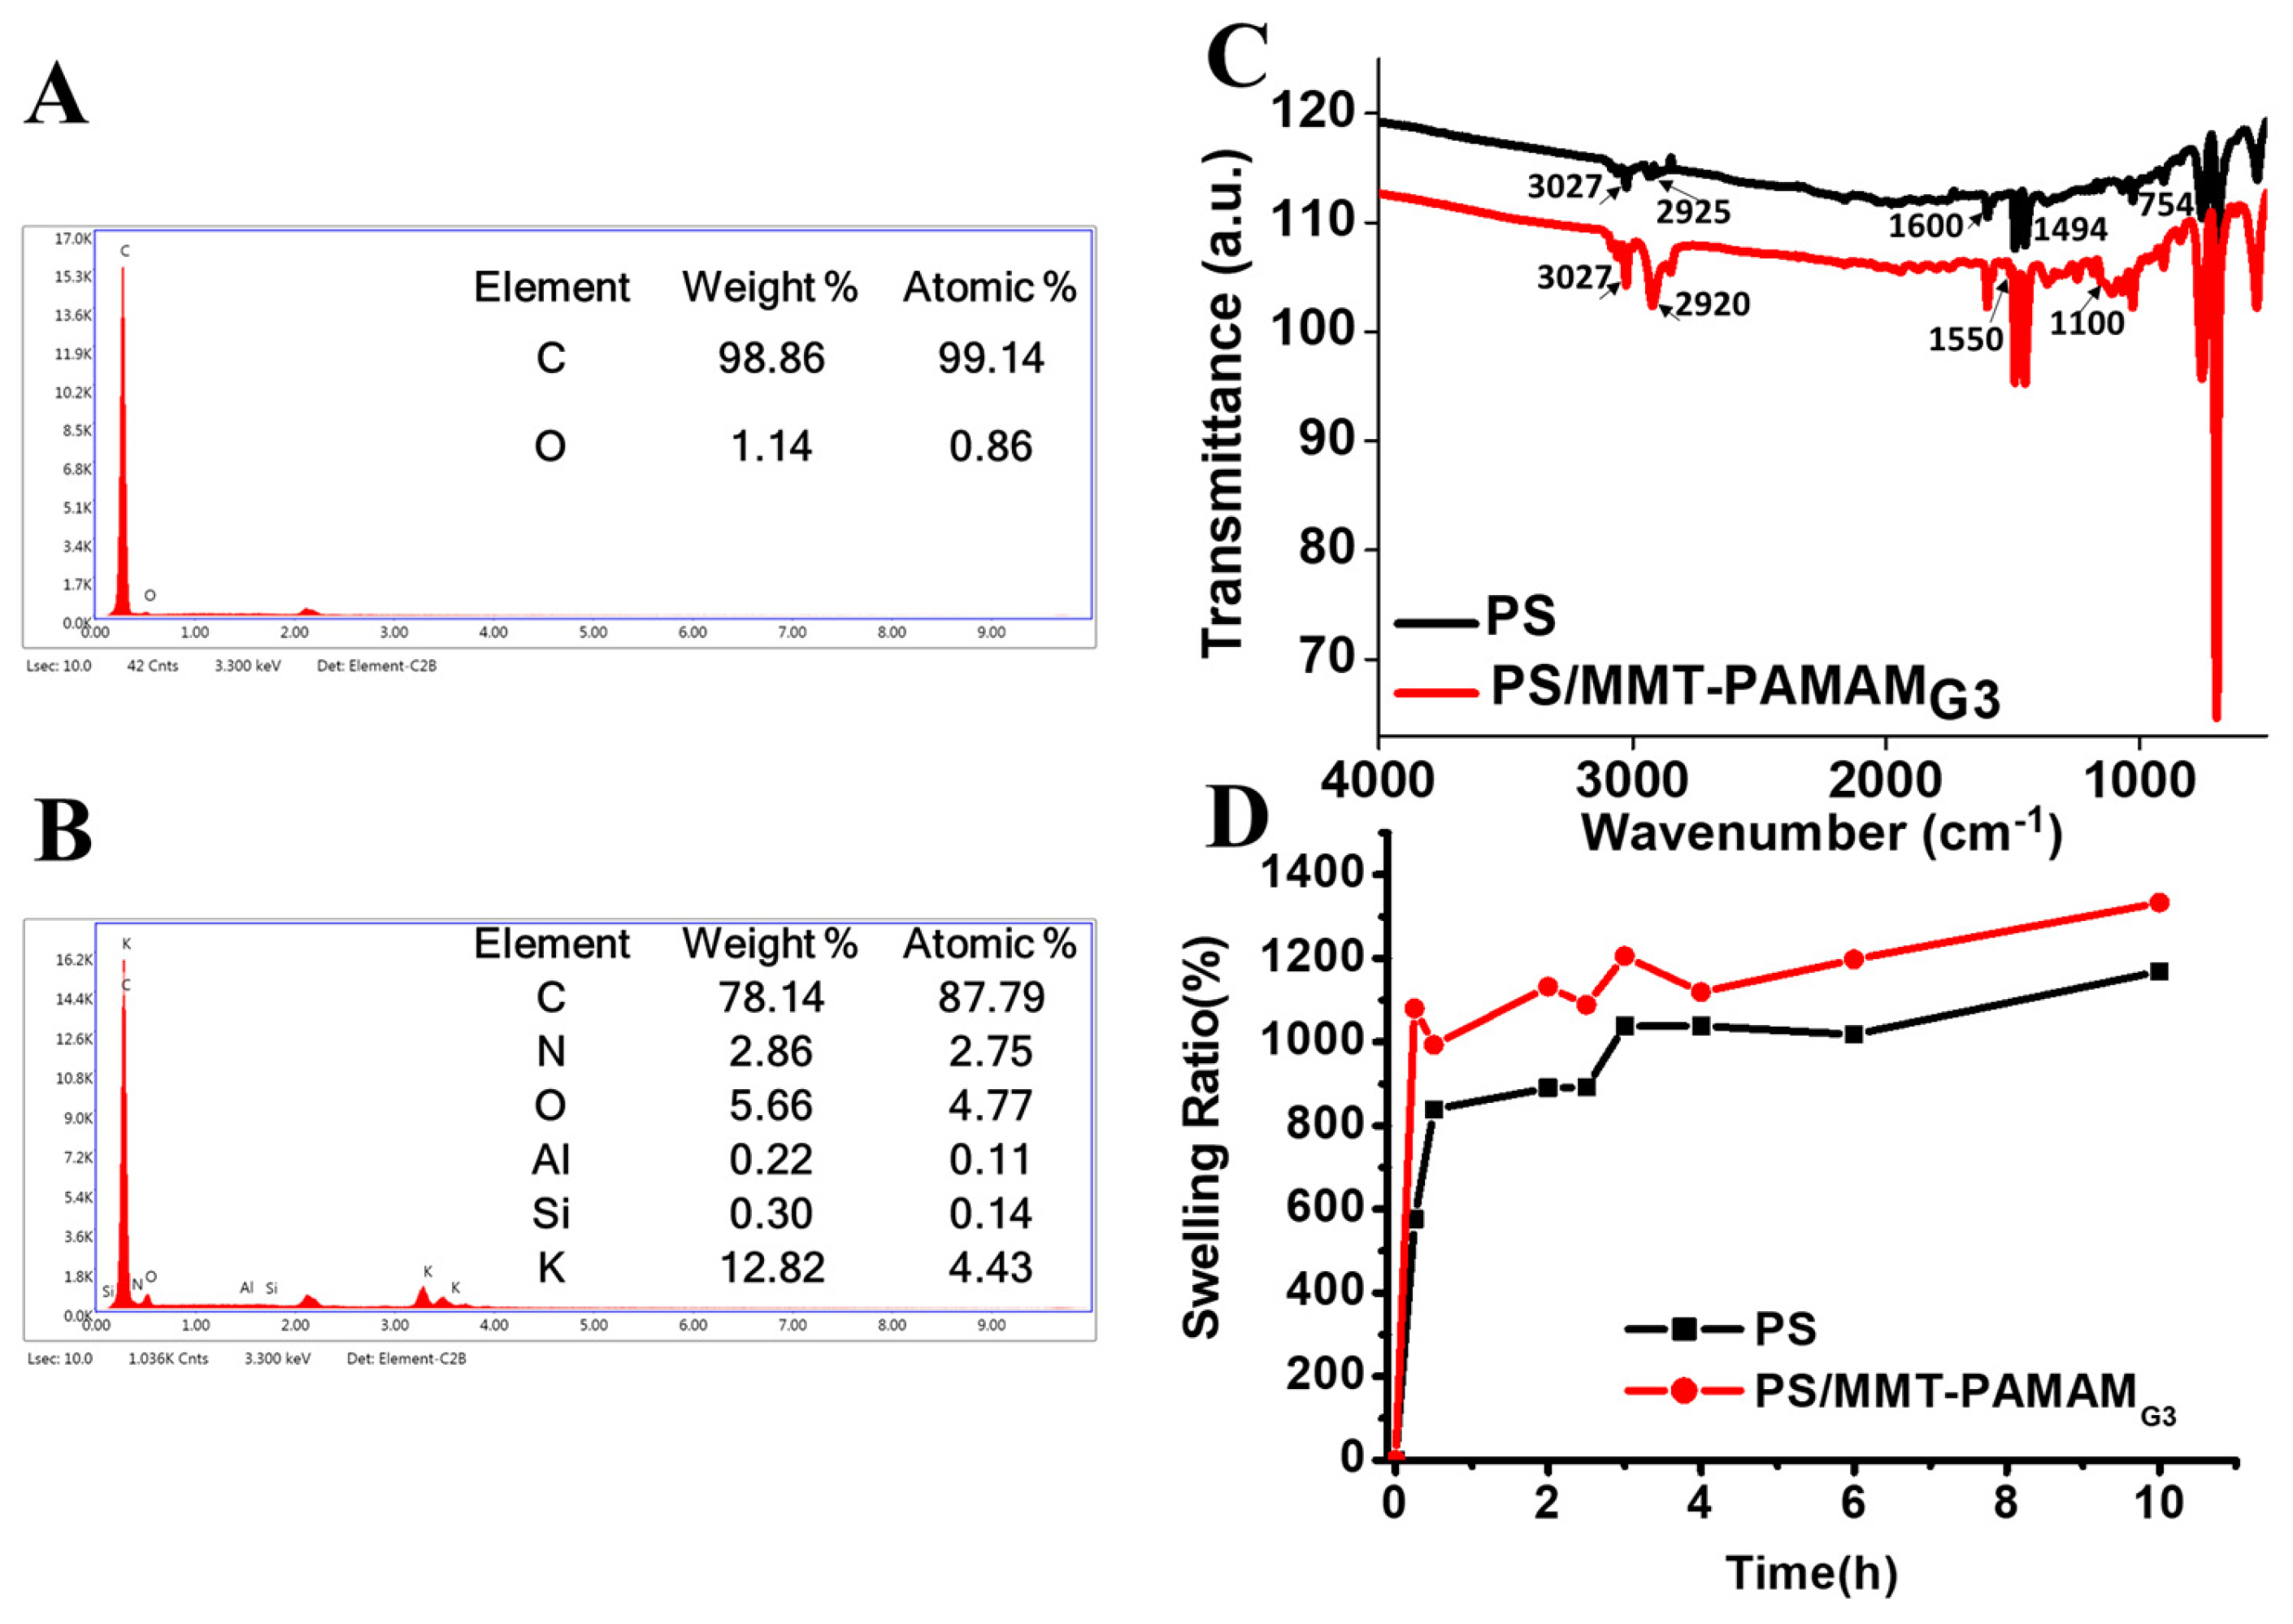
3.1. Characterization of MMT-PAMAMG3

PAMAM is a class of hyperbranched polymers with functional groups and appropriate for the covalent conjugation of biological molecules [39]. MMT was modified with PAMAMG3 dendrimers to obtain organoclay. For this purpose, PAMAMG3 was treated in an acidic medium to form an alkyl ammonium salt and intercalated into the layers of the clay minerals. Figure 1A shows the preparation of MMT-PAMAMG3. The MMT and MMT-PAMAMG3 samples were structurally characterized with FTIR and XRD analyses. Additionally, the thermal stability of the samples was determined using TGA/DTG. The eta potentials were measured for the charge changes of pure clay and organoclay samples. The FTIR spectra of neat MMT and organomodified MMT are shown in Figure 1B. In the FTIR spectrum of pure MMT pellets, the characteristic O–H stretching vibration of H2O owing to hydration in the structure shows a strong band at 3410 cm−1. Additionally, the O-H vibration band due to the relative humidity in the building is seen at 3627 cm−1. Another strong band is observed at approximately 1634 cm−1 due to O-H bending vibrations of hydrated water molecules. A characteristic strong band at approximately 998 cm−1 was attributed to the Si–O–Si and Si–O–Al stretching. Besides the peaks of pure MMT, some new clear bands were observed in the FTIR spectrum after modification of MMT with PAMAMG3, owing to the existence of dendrimers. Significant bands of–CH stretching vibrations were observed at 2923 and 2854 cm−1, and those of–CH2 and–CH bending vibrations were observed at 1466 and 1400 cm−1, respectively [40]. The band of the PAMAMG3 N-H amine group was clearly designated at approximately 1550 cm−1. These new organic bands supported that alkyl ammonium ions were intercalated between the layers and also adsorbed on the surface. The XRD technique is frequently used to determine the distance between layers of clay minerals composed of a layered structure. Information regarding the crystal planes of the clay particles is given by measuring the gallery height and basal spacing (d001) of the stacked clay layers. Upon modification, organic molecules were replaced by Na+ ions between the layers. Consequently, the peak of the diffraction angle shifted toward lower angles with increasing interlayer distance. The XRD patterns for pure MMT and MMT-PAMAMG3 are shown in Figure 1C. For pure MMT, characteristic diffraction peaks are seen at 2θ = 7.73°, which corresponds to the basal interval as d001 = 11.42 Å using the Bragg equation. The d-spacing of the (d001) basal plane represents the sum of the thickness of MMT layers and the heights of the galleries. This value depends on the size of the cations and the presence of interlaminar water. The replaceable cations in the clay mineral were replaced with alkylammonium cations (PAMAMG3 ammonium cations) to prepare the organoclays, increasing the d001 value. From the XRD pattern of MMT-PAMAMG3, a maximum diffraction peak can be seen at 2θ = 6.01°. The basal spacing value (d001) was calculated to be 14.71 Å from the Bragg equation. The increment in the d range (3.29 Å) indicates that the alkylammonium cations were intercalated between the silicate layers. This result is compatible with that of our previous study on PAMAM with variable molecular weights [28,29,30]. The basal spacing value of interlayers increases with the chain length and also the molecular weight of PAMAM.
The thermal behaviors of the samples were compared using TGA/DTG analysis. The TG/DTG curves for MMT and organomodified MMT (MMT-PAMAMG3) are shown in Figure 1D,E; the weight losses in the TGA curve correspond to the temperature range from room temperature to 800 °C. For pure MMT, a 9.9% weight loss is observed in this temperature range owing to the thermal degradation of the structure. Further examination is obtained from the DTG thermogram (see Figure 1E). The weight losses were observed in two main temperature zones: below 200 °C and above 600 °C. The first step, observed at 90 °C, is attributed to the dehydration of the water physically adsorbed, and the second step, observed at 667 °C, is attributed to the dehydroxylation of water molecules retained by the exchangeable cations in MMT. The weight loss of MMT-PAMAMG3 increased to 27.8% in the same temperature range after the exchange with alkylammonium ions. This increase in weight loss demonstrated that the PAMAMG3 organic molecules were both adsorbed on the clay surface and bonded between layers. The results from the detailed analysis of the DTG thermogram of MMT-PAMAMG3 showed that the degradation peak of PAMAMG3 as an organic molecule was observed at approximately 265 °C. The thermal decomposition of MMT-PAMAMG3 occurred in three steps. The first zone was located below 150 °C due to the removal of adsorbed water and gaseous species. The second zone was between 200 °C and 300 °C, and the third zone corresponded to the temperature range of 400–500 °C, which is attributed to the dehydroxylation of structural –OH units from organoclay [41]. This degradation peak was shifted to a lower temperature according to pure MMT (667 °C for MMT; 460 °C for MMT-PAMAMG3). This shifted degradation peak confirmed the bonding between the organic molecule (PAMAMG3) and clay mineral (MMT). The zeta potential is an impressive index of the magnitude of interaction between colloidal particles such as clay minerals. The magnitude of zeta potential indicates the potential stability of a colloidal system and is also a sign of the surface charge. MMT clay mineral has a negative charge and, thus, possesses a negative zeta potential. The zeta potentials of MMT and MMT-PAMAMG3 were measured to confirm the changes in surface properties. The zeta potential of pure MMT was measured to be −41 ± 2 mV [42]. After the modification step, the zeta potential of MMT-PAMAMG3 was a less-negative value of −25 ± 1 mV due to the absorption of the positively charged PAMAMG3 salt at the surface or in the interlayers of the mineral. The difference in zeta potential is compatible with our previous studies on different PAMAM dendrimers [28,29,30]. As expected, the zeta potential had fewer negative values with increasing surface functional groups and branching structure (−30 mV for the G0 dendrimer; −28 mV for the G2 dendrimer).

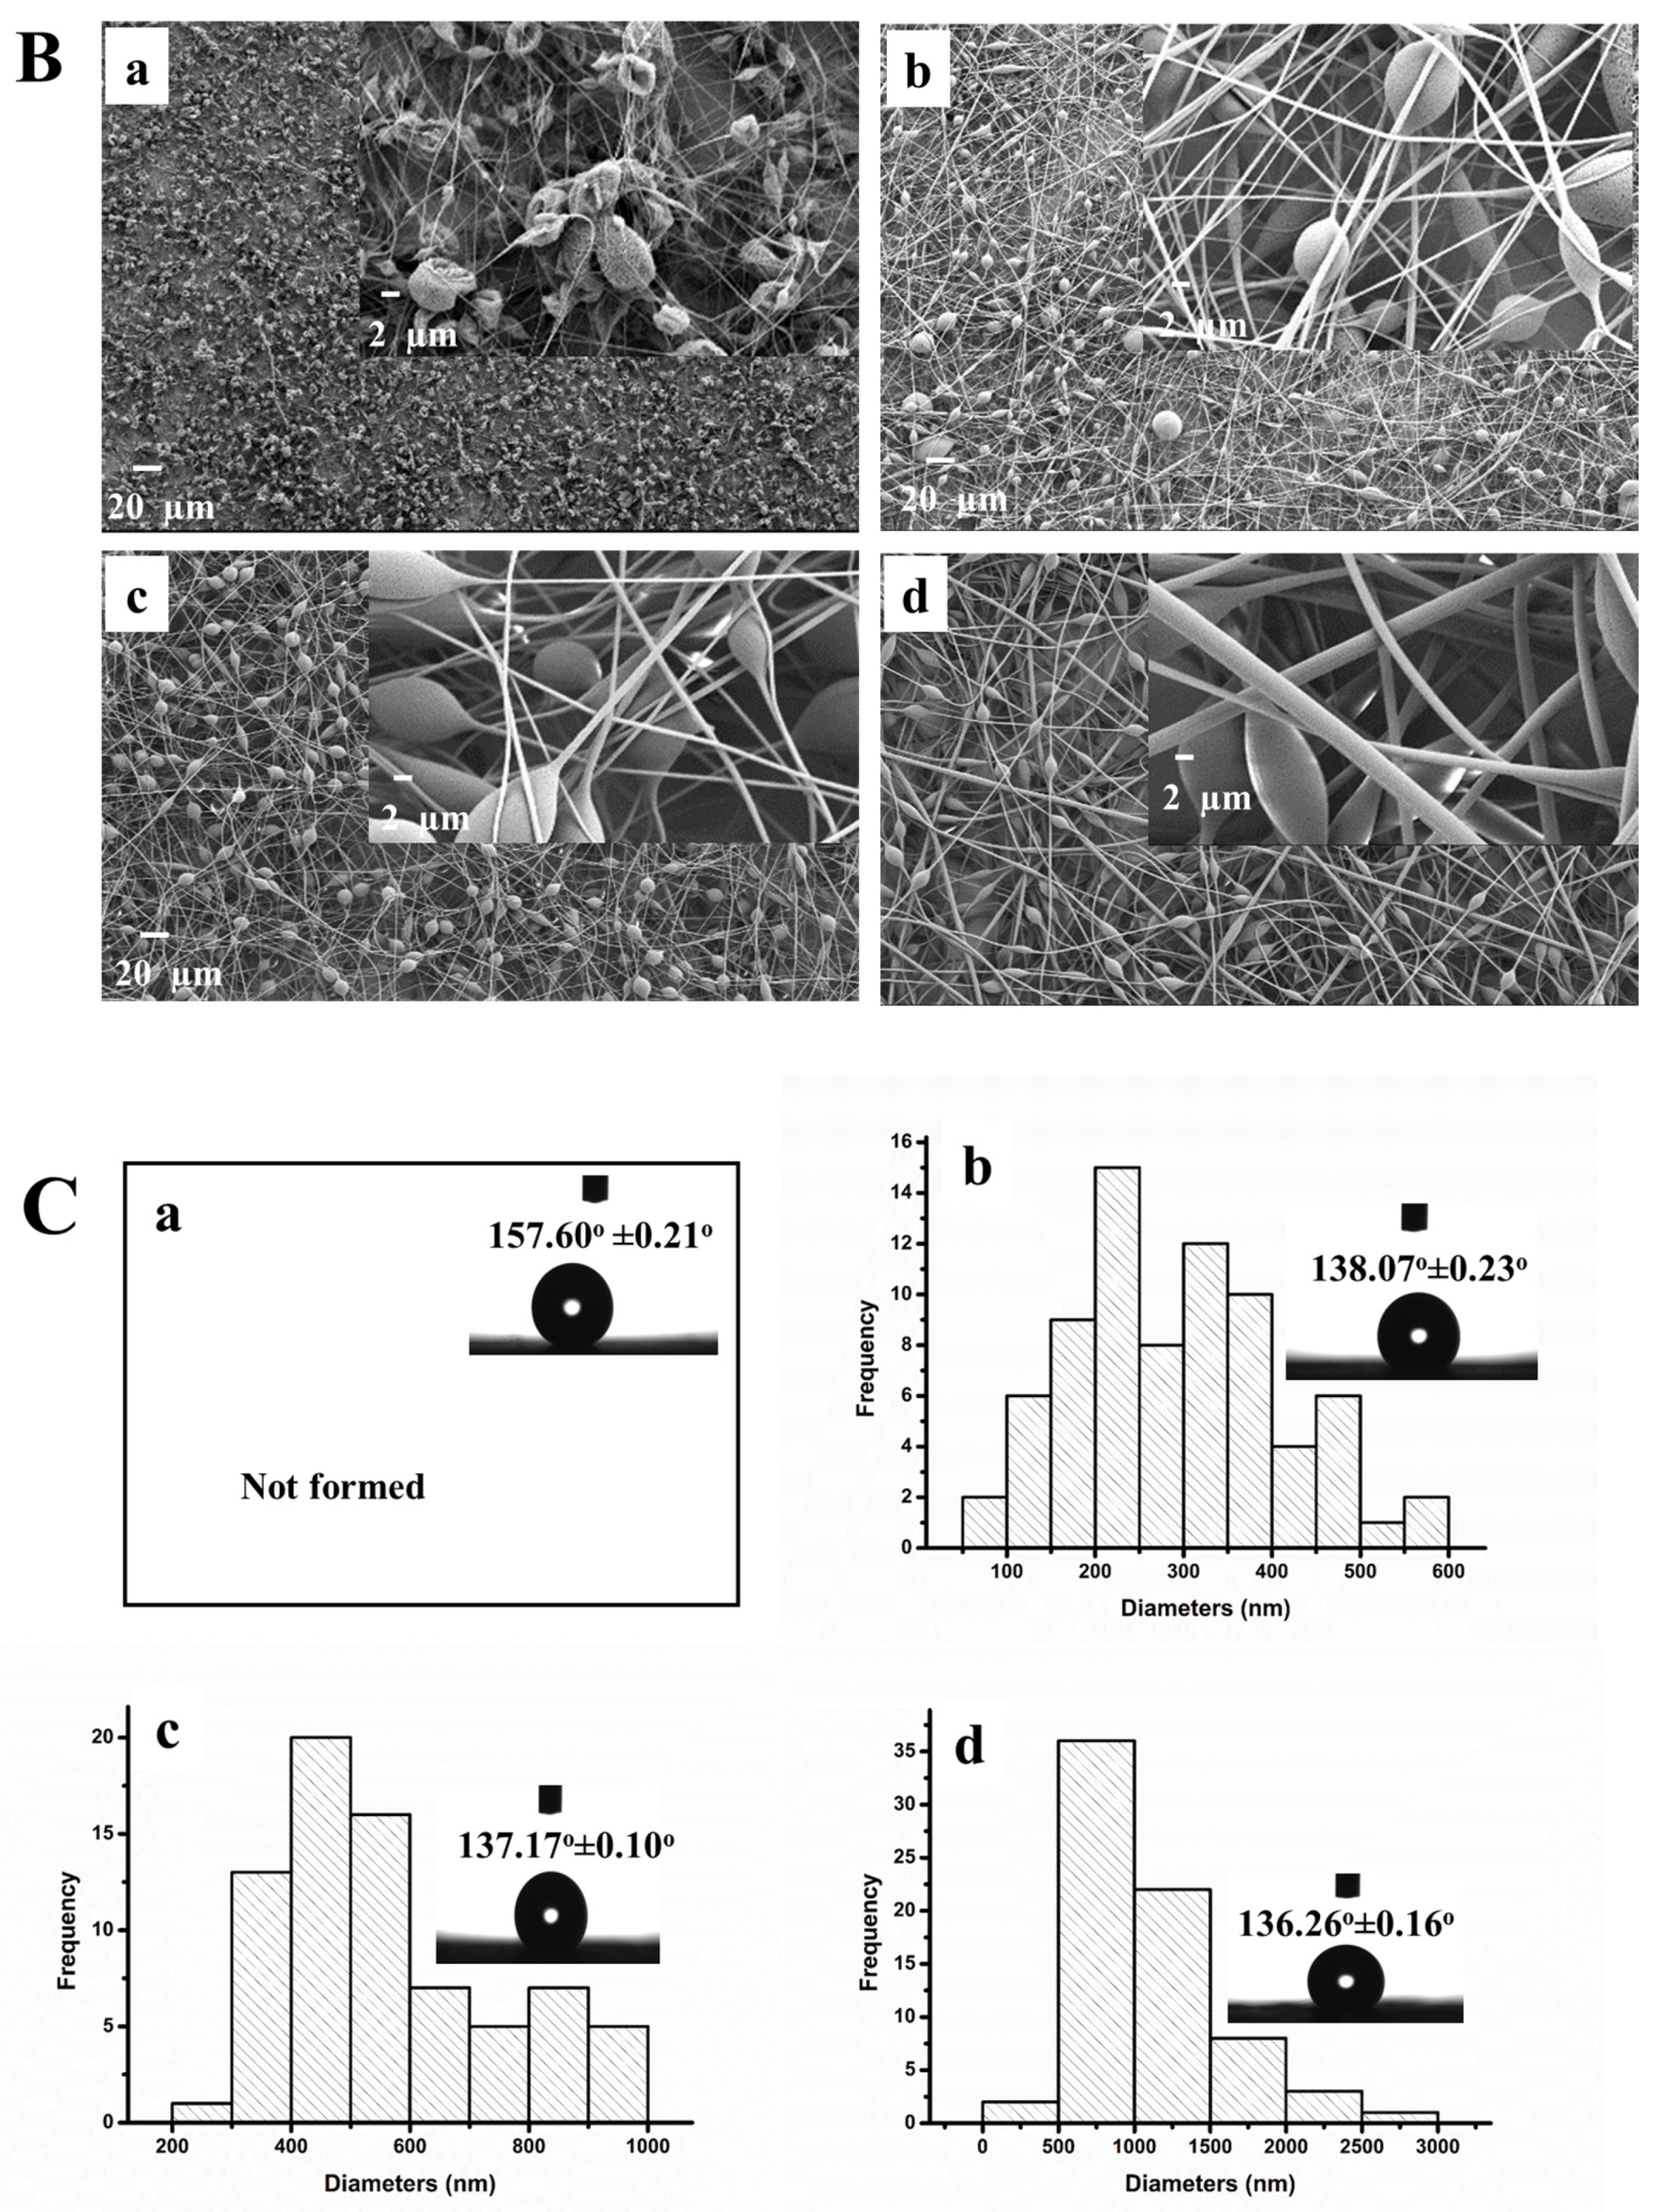
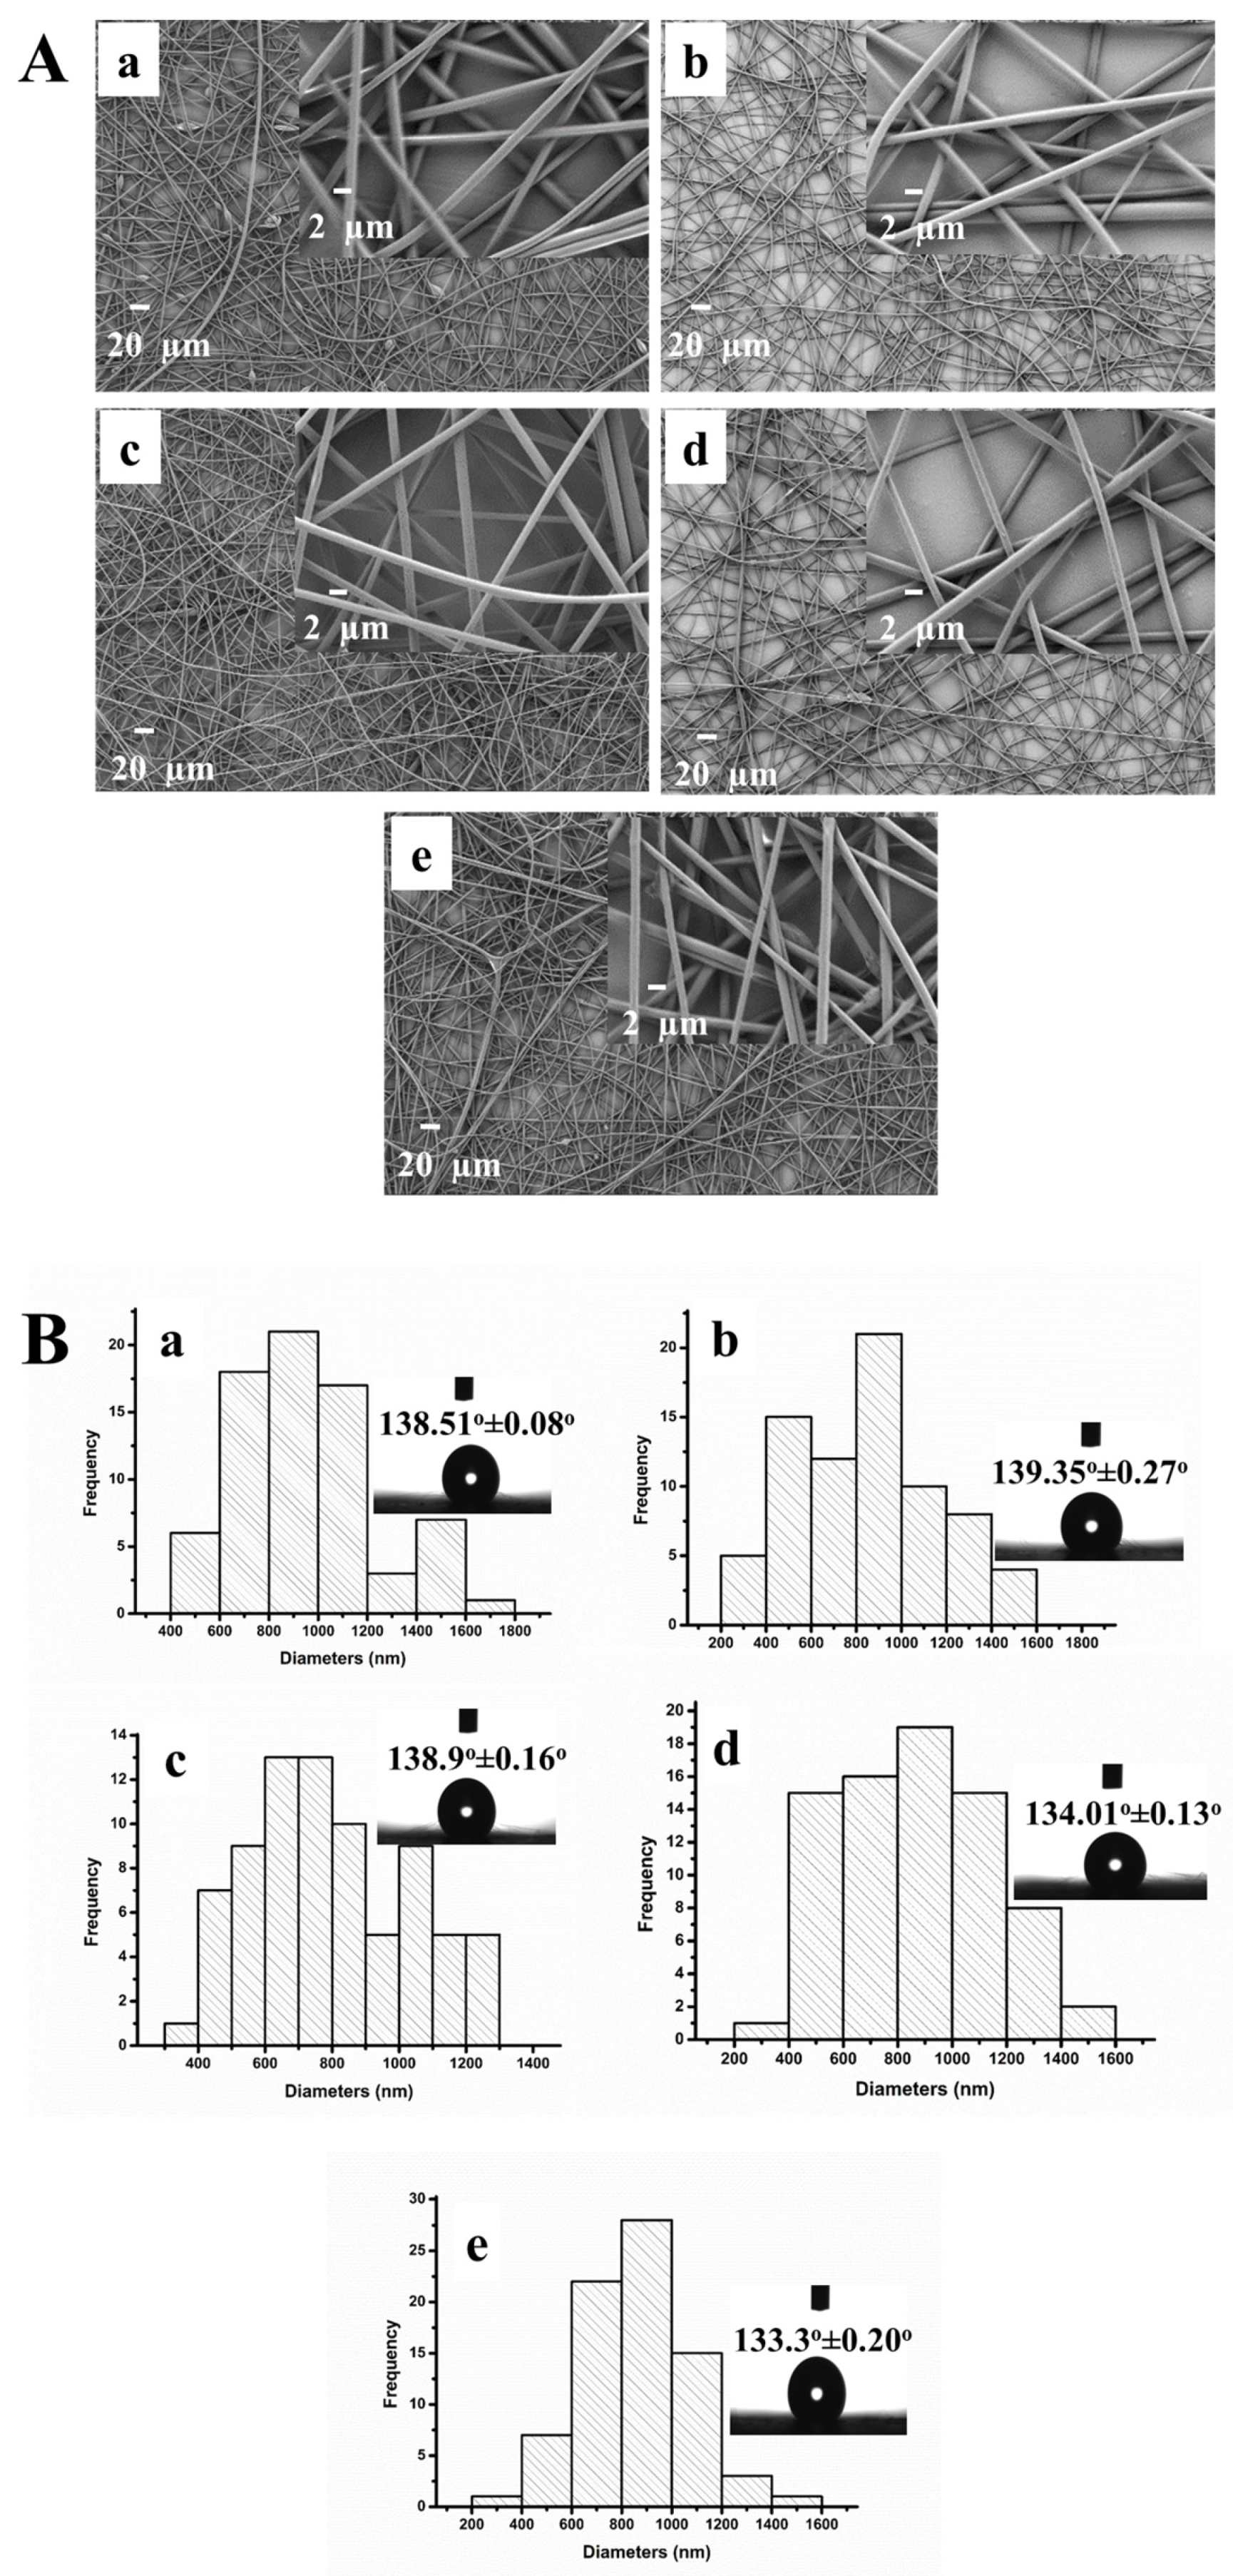
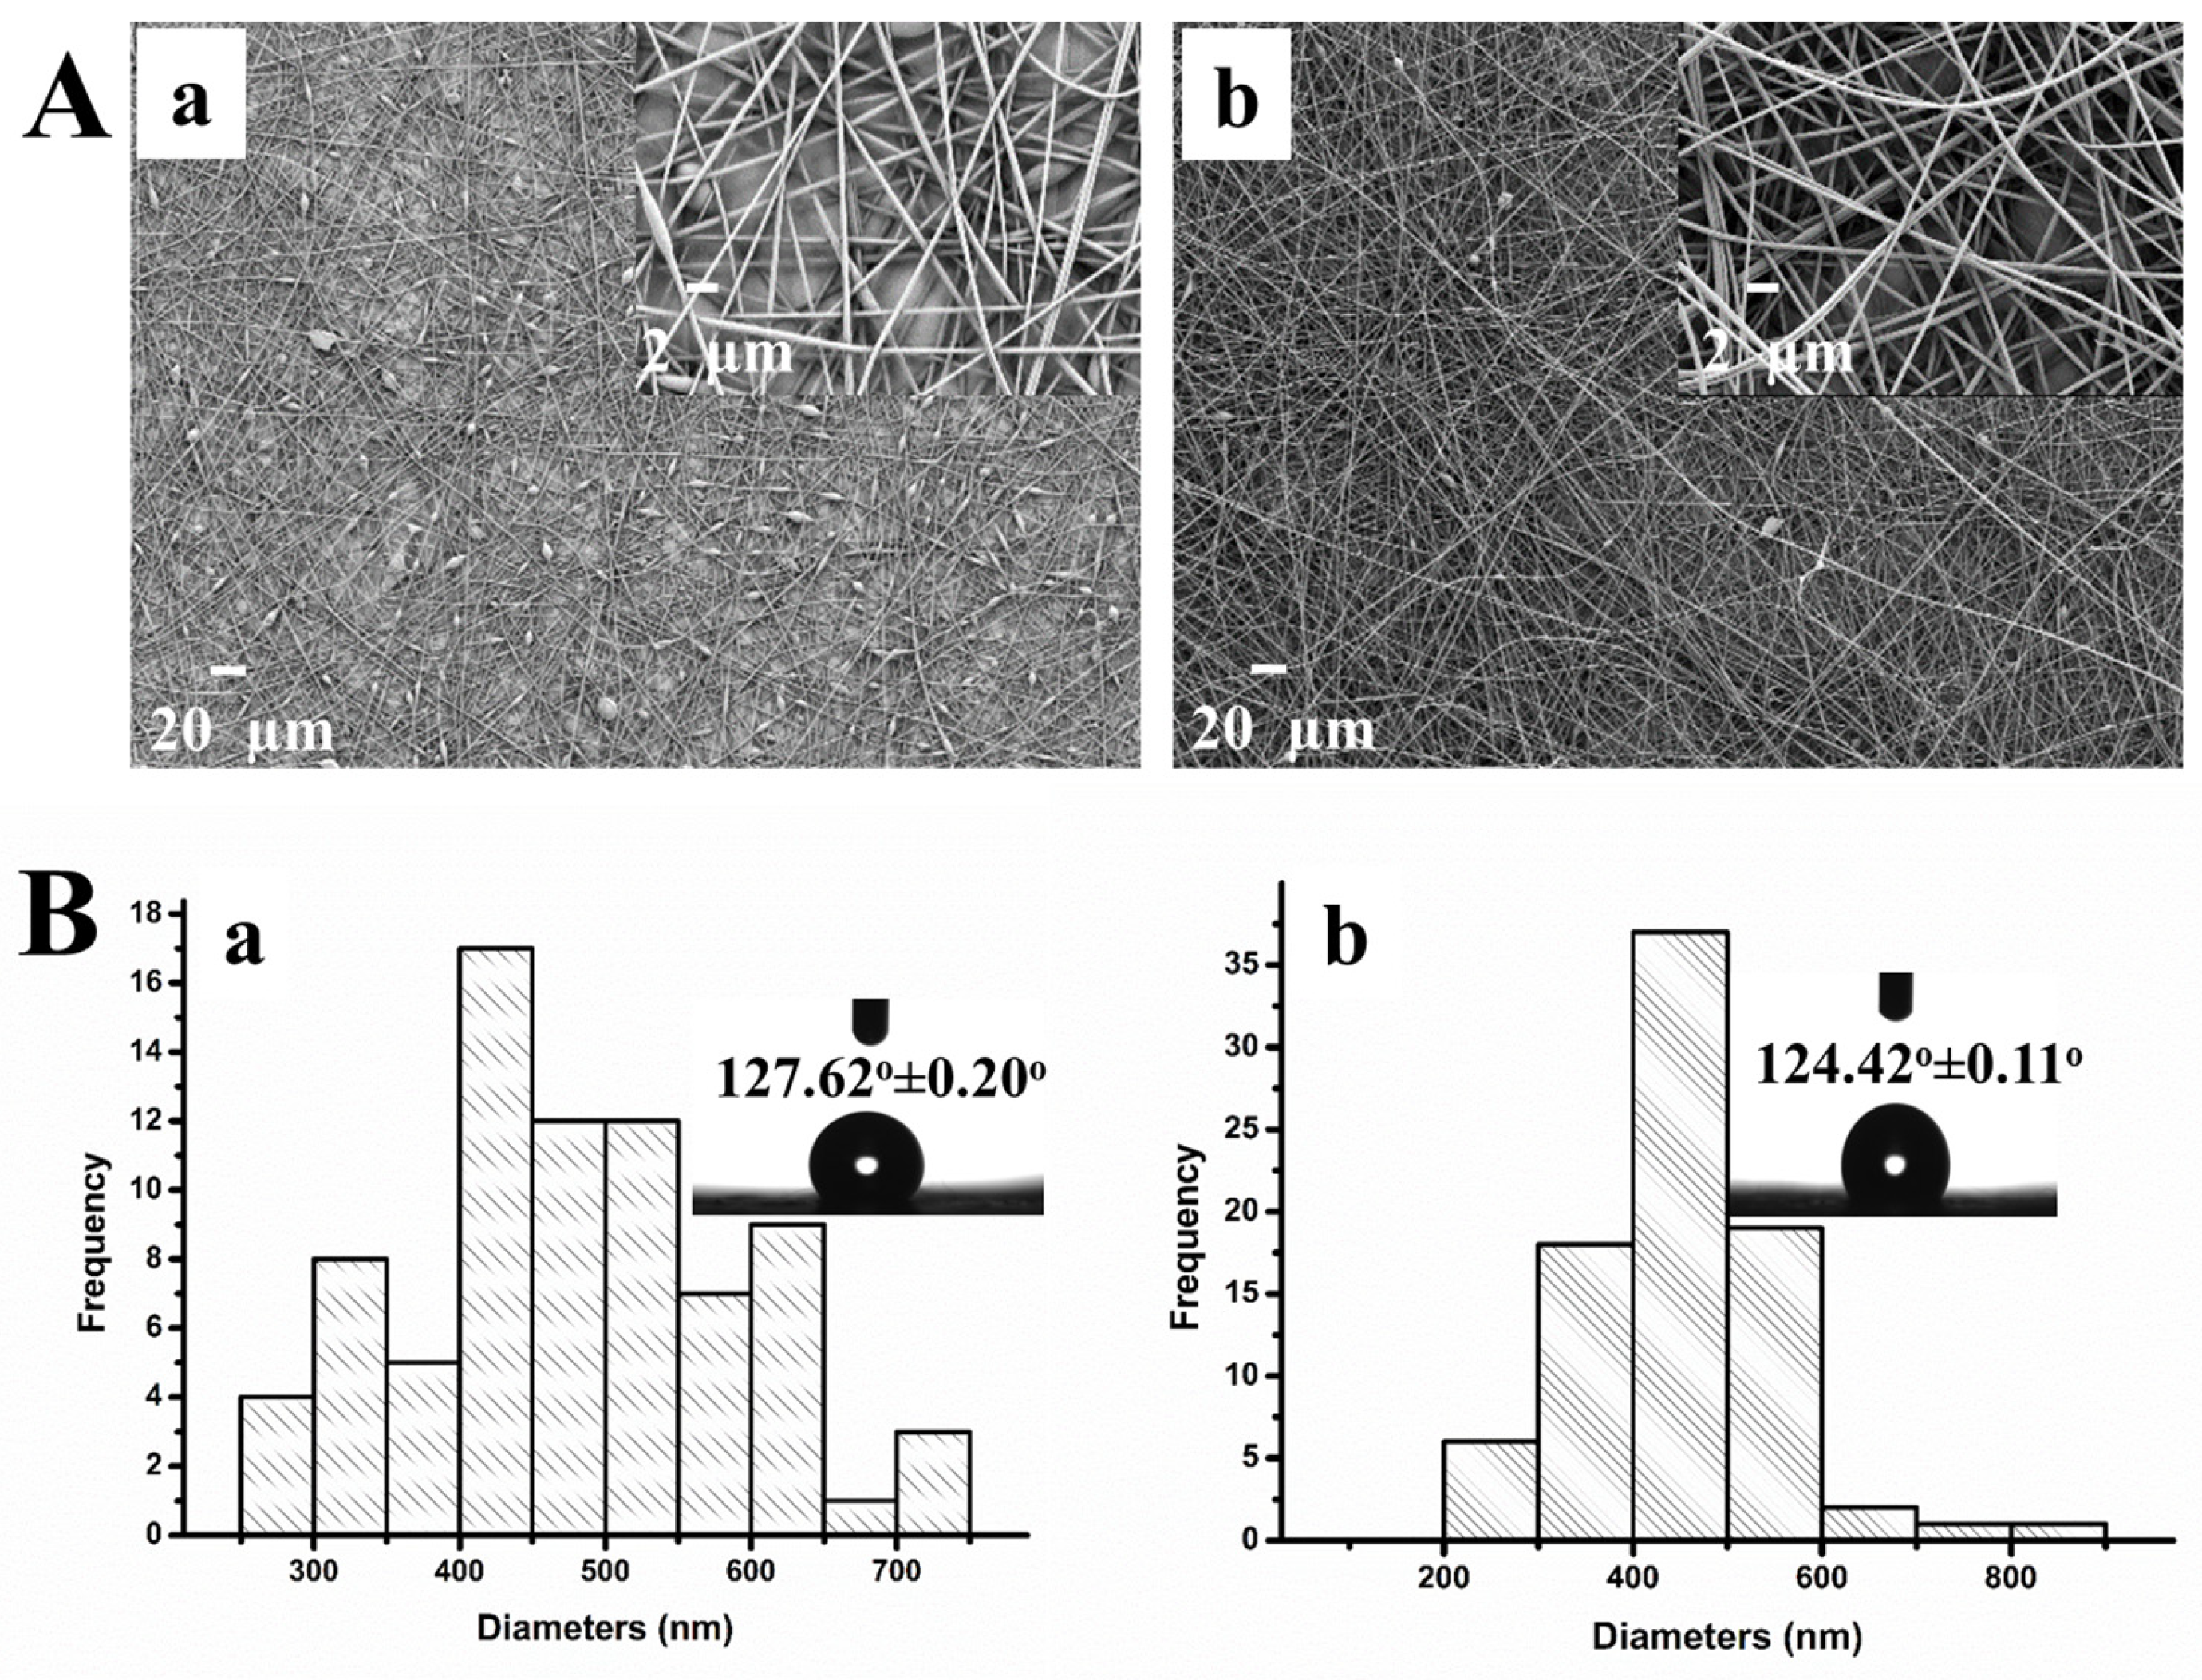
3.2. Characterization of the PS/MMT-PAMAMG3 Electrospun Nanofibers

The flow rate of the polymer solution, voltage, and distance between the syringe and collector must be optimized to obtain smooth nanofibers in the electrospinning technology. The impact on solvent-type PS nanofibers is considerable. Consequently, numerous solvents, including 1,2-dichloroethane, N,N-DMF, ethyl acetate, methyl ethyl ketone, tetrahydrofuran (THF), and even limonene, were studied for the electrospinning of PS [43,44,45]. Because of its higher boiling point, conductivity, and dielectric constant compared with other solvents, the widely used DMF was the most favored solvent for the synthesis of homogenous PS nanofibers with a smooth surface [46,47,48]. The concentration of the prepared solution is also one of the factors affecting the formation of smooth and bead-free nanofibers. Solutions containing PS at different concentrations were prepared and used to obtain PS nanofibers; this was to determine the appropriate polymer concentration in a bid to obtain bead-free nanofibers. A schematic representation of the design of PS-based nanofiber matrices is shown in Figure 2A. Morphological studies of the PS electrospun nanofibers, which were obtained using various PS concentrations, were conducted using an SEM. As shown in Figure 2B(a–d), the nanofiber morphology is not smooth and uniform for PS concentrations varying from 5% to 20%. Furthermore, nanofibers could not be obtained when a PS concentration of 25% and above was used. This is because the increase in PS concentration caused a higher viscosity and limited the flow of polymer solution from the syringe [49]. We thus decided to continue with 20% PS to form nanofibers because the nanofiber morphology tremendously changed as the PS concentration increased. The diameter distribution of the PS nanofibers is shown in Figure 2C(a–d). The diameter of the nanofibers prepared with 5% PS could not be measured because a considerable portion of them were beaded (Figure 2C(a)). The diameter of the nanofibers prepared in parallel with increasing PS concentration increased. The results obtained are consistent with those in the literature [50,51]. No major alteration was observed in the contact angles of the prepared nanofibers with increasing PS concentration, as shown in the insets of Figure 2C(a–d). We observed that the PS nanofibers prepared using different concentrations had highly hydrophobic properties. THF and DMF solvents were used in a study to obtain nanofibers (average diameter 400 nm) from 15% PS [52]. PS solutions of 5–35% were prepared with DMF solvent for electrospinning in another study [53]. Upon examining the results, while nanofibers could not be obtained from 5% PS, fibers could be synthesized in increasing PS concentrations. The diameter of the nanofibers also increased with increasing concentration.
Upon deciding on a PS concentration of 20% (wt%), trials were performed to determine the concentration of clay to be used for preparing bead-free PS/MMT nanofibers. For this purpose, electrospun nanofibers were fabricated using a 20% (wt%) PS solution containing different MMT concentrations ranging from 0.1% to 2.0% (wt%). SEM micrographs of the PS/MMT nanofibers containing various amounts of MMT are shown in Figure 3A(a–e). The PS/MMT nanofibers prepared using PS solutions containing 0.25% (wt%) and 0.5% (wt%) MMT were considered suitable because they were more regular, thinner, and uniform. Histograms of the diameter distribution of the PS/MMT nanofibers are shown in Figure 3B(a–e). We observed no major differences in diameter among the PS/MMT nanofibers fabricated using different MMT concentrations. Adding MMT to the structure of the PS nanofibers did not change their contact angles and hydrophobicity, as shown in the insets of Figure 3B(a–e).
Because PS/MMT nanofibers containing 0.25% and 0.5% (wt%) MMT were smaller in diameter and easier to form, the same concentrations of MMT-PAMAMG3 were added to PS solutions. MMT-PAMAMG3 was synthesized and PS/MMT-PAMAMG3 nanofibers prepared to test the PAMAMG3 effect. Figure 4A(a,b) show the SEM micrographs of the PS/MMT-PAMAMG3 electrospun nanofibers prepared using PS solutions containing both concentrations of MMT-PAMAMG3 (i.e., 0.25% and 0.5% (wt%)). Histograms for diameter distributions of the PS/MMT-PAMAMG3 nanofibers are shown in Figure 4B(a,b). Evidently, PS/MMT-PAMAMG3 containing 0.5% (wt%) MMT-PAMAMG3 had the most homogeneous diameter distribution. However, the contact angles (insets of Figure 4B) and hydrophobicity of the PS/MMT-PAMAMG3 nanofibers did not change for either MMT-PAMAMG3 concentration. The optimum MMT-PAMAMG3 concentration in PS solution was selected to be 0.5% (wt%). This is because the resultant PS/MMT-PAMAMG3 nanofibers were bead-free, the diameter distribution of the nanofibers was better, and also the nanofiber diameters were smaller. The diameter of the PS, PS/MMT, and PS/MMT-PAMAMG3 nanofibers were 1115.54, 793.77, and 446.49 nm, respectively. The contact angles were (136.26 ± 0.16)°, (138.90 ± 0.16)°, and (124.42 ± 0.11)°, respectively. We can say that the addition of MMT and MMT-PAMAMG3 to the PS nanofiber structure decreased the diameter of the electrospun nanofibers. The addition of MMT did not affect the hydrophobicity of the PS nanofibers but the contact angles of PS/MMT-PAMAMG3 decreased after the addition of MMT-PAMAMG3 to the PS solution. The decrease can be explained by the NH2 dendrimer groups from the PAMAMG3 molecule intercalated into the MMT layers. In a study comparing the contact angles of PCL and PCL/PAMAMG2 nanofibers, the hydrophilic property was attributed to the NH2 terminal groups of the dendrimers and the OH groups generated upon aminolysis [54].
Figure 5A,B show the EDX spectra of the PS and PS/MMT-PAMAMG3 nanofibers. The elemental compositions of the nanofibers confirmed the presence of dendrimer (N) and MMT (Al, Si, and K). We structurally characterized neat PS and PS/MMT-PAMAMG3 nanofibers with FTIR analysis (Figure 5C). In the FTIR spectrum of neat PS, absorption bands at 3027 and 2925 cm−1 corresponded to aromatic and aliphatic C-H stretching, respectively. The characteristic absorption bands of PS at 1600 and 1494 cm−1 can be attributed to C=C stretching of benzene rings. Additionally, the C-H deformation vibration band of benzene ring hydrogen appeared at 750 and 700 cm−1 [55]. The FTIR spectra of the PS/MMT-PAMAMG3 nanofibers were also investigated. In addition to characteristic PS bands, the increasing intensity of C-H stretching (3027 and 2920 cm−1) and a small new band at 1550 cm−1 (N-H stretching) can be attributed to the presence of PAMAMG3. Again, the new band at approximately 1100 cm−1 corresponds to the Si–O–Si and Si–O–Al stretching in MMT. Figure 5D shows the swelling characteristics (C) of the PS and PS/MMT-PAMAMG3 nanofibers. The swelling ratio results for 10 h showed a lower water uptake of the PS nanofibers compared with the PS/MMT-PAMAMG3 ones. The swelling ratio tended to increase with time and MMT-PAMAMG3 addition. PS nanofibers containing dendrimer-modified MMT had a high water uptake due to a higher amount of absorption groups on the surface. Simultaneously, with the addition of dendrimer-modified MMT, the decrease in the diameter of the nanofibers cause an increasing surface area of PS/MMT-PAMAMG3 (50 m2/g) compared to the PS nanofiber (45 m2/g). The presence of PAMAM also increases the water adsorption of PS/MMT-PAMAMG3 nanofibers. The water uptake of PS is connected with absorption in the amorphous regions and the porosity on/between the nanofibers, while the time-dependent increase can be explained by more time available for water penetration [54].
Figure 6A,B show the XPS survey spectra and surface chemical compositions, respectively, for PS, PS/MMT-PAMAMG3, and PS/MMT-PAMAMG3/Anti-SAA, indicating the presence of the antibody on the surface of the nanofibers. The C1s, N1s, and Si2p spectra of PS/MMT-PAMAMG3 are shown in Figure 6C–E, respectively. On the one hand, the characteristic peaks for PS/MMT-PAMAMG3 are observed from deconvoluted C1s spectra at 284.15 eV (C–C sp2), 285.24 eV (C–C sp3), 287.25 (C–N), and 291.93 eV (C–O) (Figure 6C). On the other hand, predominantly 287.25 (C–N) and 290.25 eV (C–O) peaks appeared for PS/MMT-PAMAMG3/Anti-SAA (Figure 6F). The fact that the carbon source is visible only from C–N and C–O indicates that the surface is completely covered with antibodies, because of which the PS/MMT-PAMAMG3 depth could not be reached and determined. The C–O peak shifted from 291.93 to 290.25 eV, C–N from 399.22 to 401.01 eV, and Si–O from 102.15 to 103.78 eV. The N1s and Si2p spectra show that PAMAM dendrons enable covalent linkage with biomolecules. PAMAM modified MMT, which provided free amine groups used for the covalent immobilization of Anti-SAA.

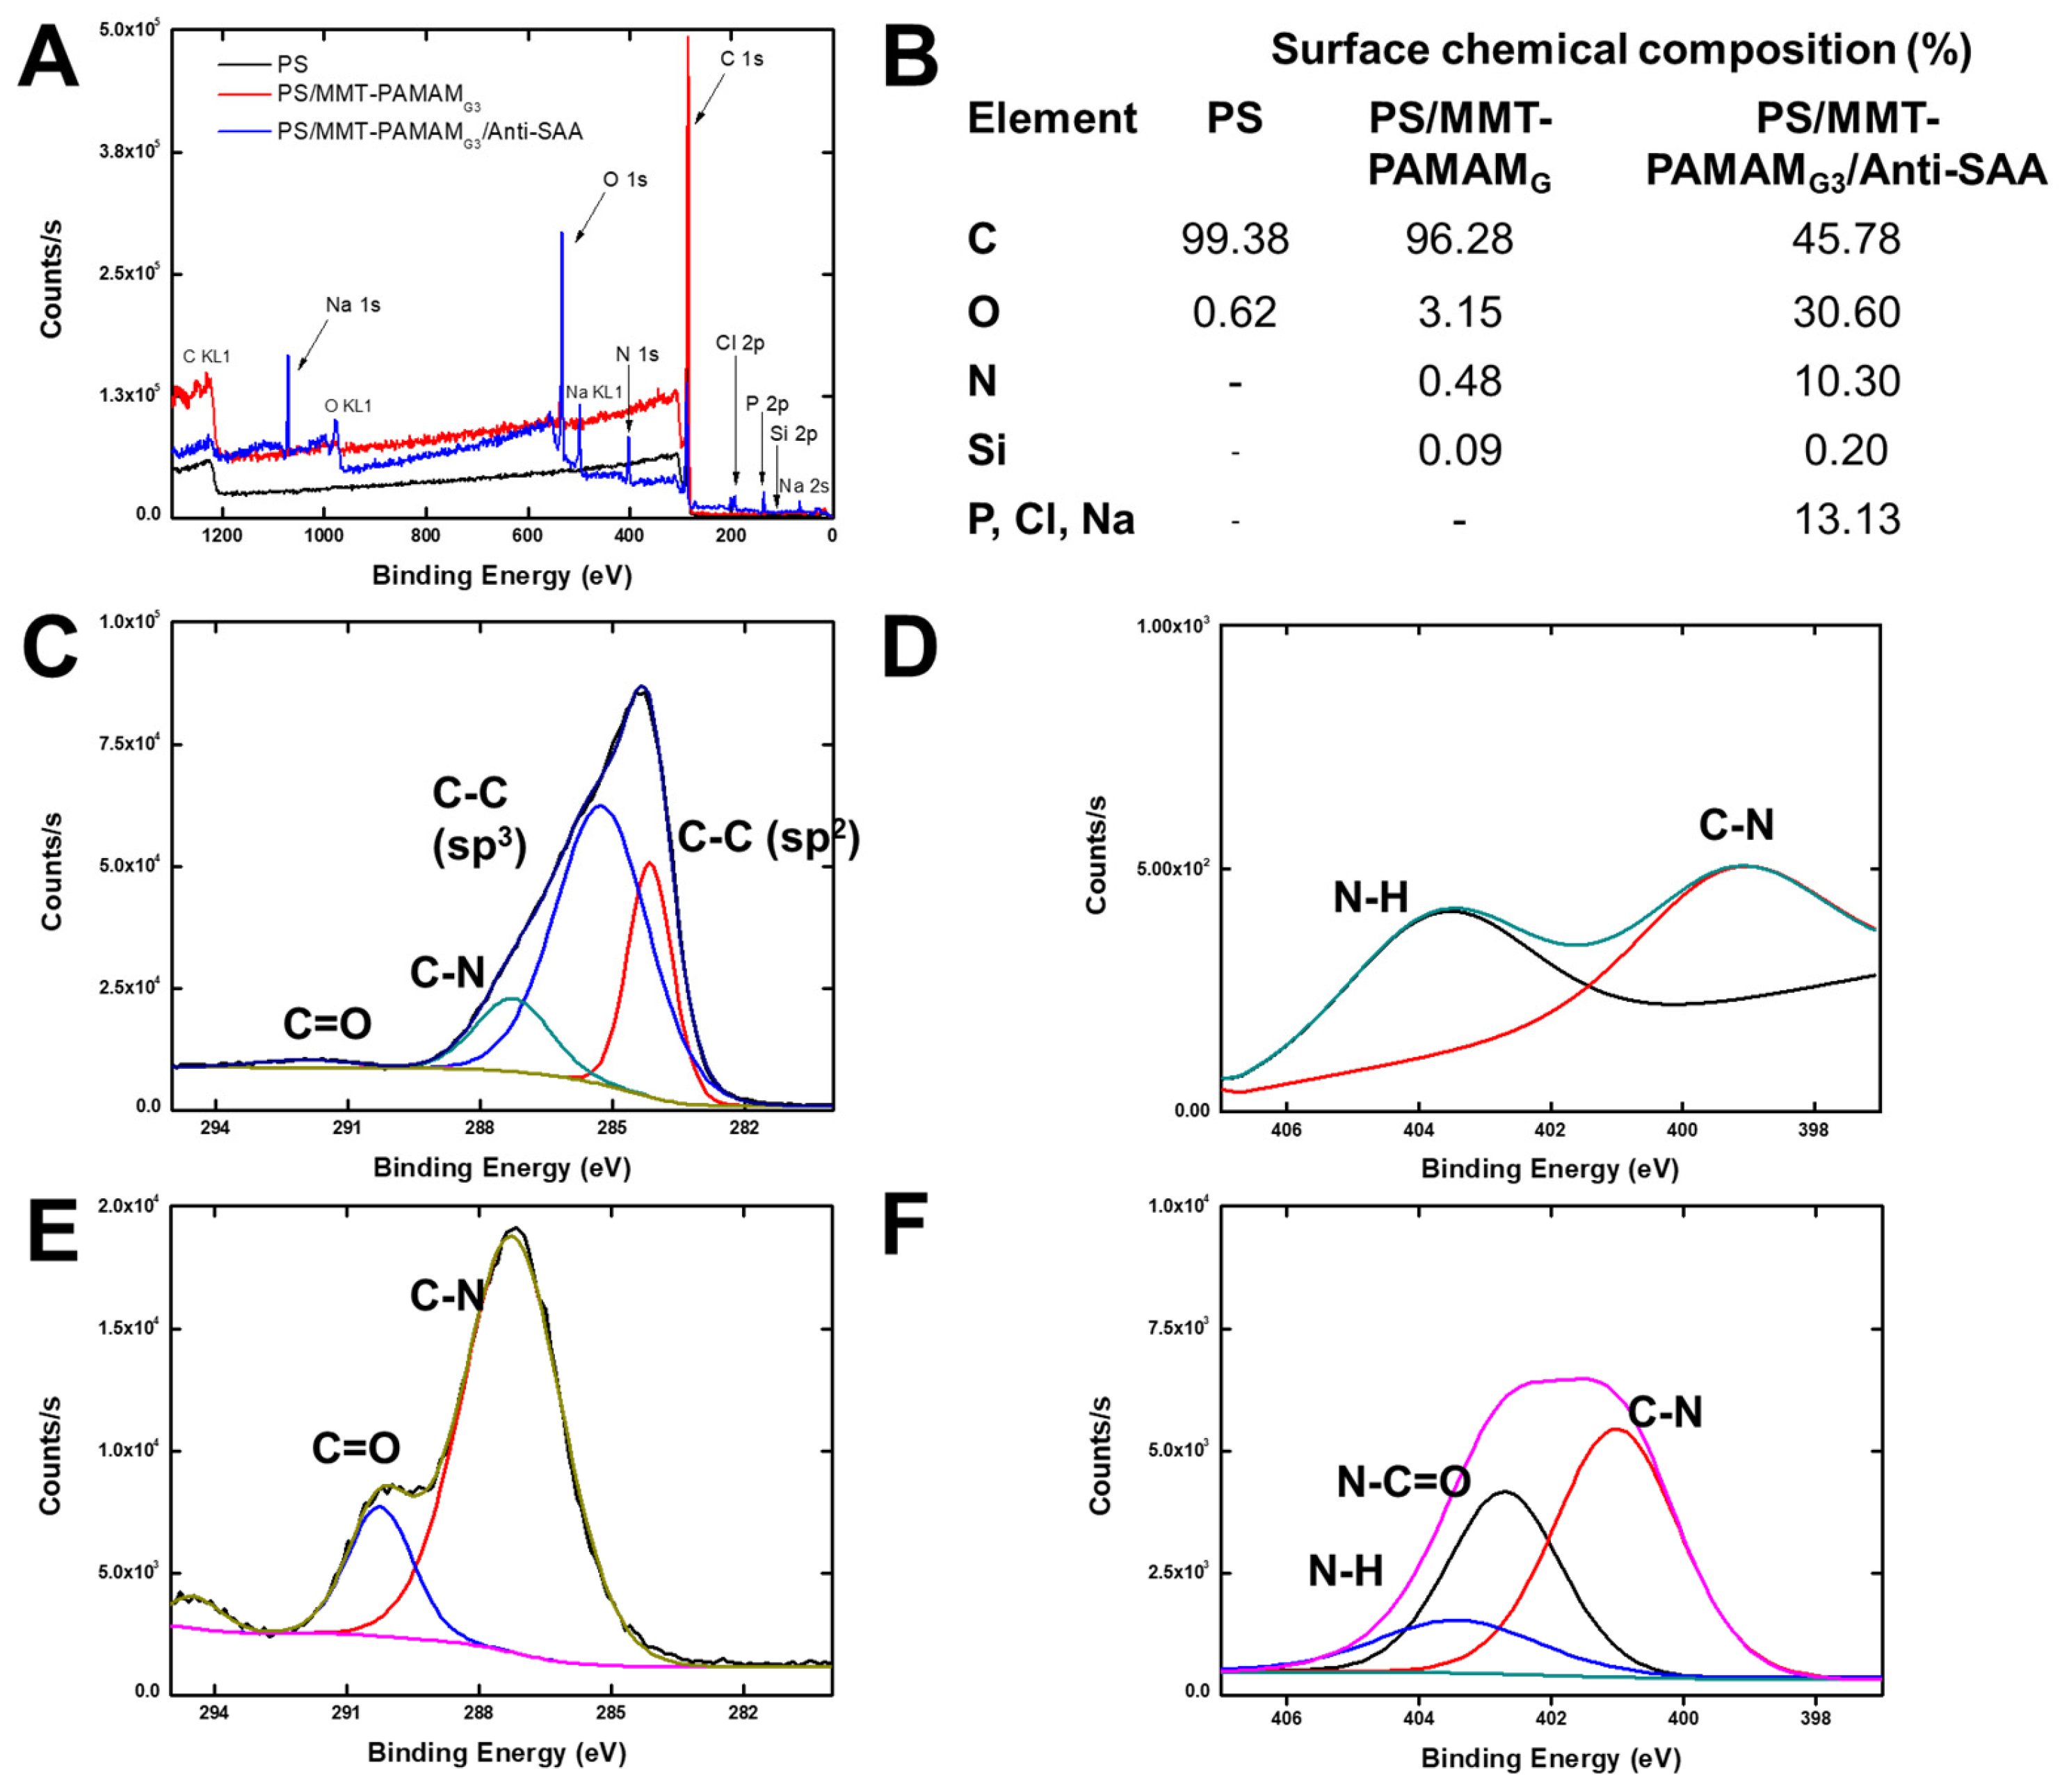
3.3. Characterization of the PS/MMT-PAMAMG3/Anti-SAA Immunosensor

After having confirmed the success of the modification of MMT by PAMAMG3 and formation of nonbeaded, homogenous PS/MMT-PAMAMG3 electrospun nanofibers, Anti-SAA was immobilized on the PS/MMT-PAMAMG3 electrospun-nanofiber-modified GCE. Electrochemical characterization of PS/MMT-PAMAMG3/Anti-SAA immunosensor was performed using K3[Fe(CN)6] as a probe. Figure 7A shows the step-by-step modification of GCE surfaces. To characterize PS/MMT-PAMAMG3/Anti-SAA, the CV, DPV, and EIS techniques were applied to confirm the surface-modification steps of GCE by PS/MMT-PAMAMG3 and PS/MMT-PAMAMG3/Anti-SAA and then affinity-based binding of SAA on PS/MMT-PAMAMG3/Anti-SAA. According to the CV profiles (see Figure 7B), oxidation and reduction peaks of hexacyanoferrate(III) were detected and the Ianodic values were 34.58, 35.49, 38.23, and 32.01 µA for bare, PS/MMT-PAMAMG3-, PS/MMT-PAMAMG3/Anti-SAA-, and PS/MMT-PAMAMG3/Anti-SAA/SAA-modified GCE, respectively. The peak currents changed with the modification of the bare electrode with PS/MMT-PAMAMG3, PS/MMT-PAMAMG3/Anti-SAA, and PS/MMT-PAMAMG3/Anti-SAA/SAA. The calculated redox peak potential separations for bare, PS/MMT-PAMAMG3, PS/MMT-PAMAMG3/Anti-SAA-, and PS/MMT-PAMAMG3/Anti-SAA/SAA-modified GCE were 100, 212, 190, and 282 mV, respectively. The peak currents were obtained to be 62, 27, 31, and 16 µA, for the bare electrode, PS/MMT-PAMAMG3, PS/MMT-PAMAMG3/Anti-SAA, and PS/MMT-PAMAMG3/Anti-SAA/SAA, respectively, in the DPV trials (see Figure 7C). According to the DPV profile, the electrochemical oxidation peaks of hexacyanoferrate(III) decreased after the coating of GCE with PS/MMT-PAMAMG3 owing to the increased diffusion limitations of K3[Fe(CN)6] to the electrode surfaces. The current increased after the covalent immobilization of Anti-SAA on PS/MMT-PAMAMG3. Because antigen-binding fragments (Fab)2 are generally positively charged in the PBS medium at pH 7.4, electrostatic attraction occurred between K3[Fe(CN)6] and the PS/MMT-PAMAMG3/Anti-SAA-modified GCE, which caused an increased electron-transfer rate resulting in a higher electrochemical current [43]. The decrease in current was observed with the binding of SAA to the PS/MMT-PAMAMG3/Anti-SAA-modified GCE surface. This can be attributed to the increased diffusion limitations of K3[Fe(CN)6] to electrode surfaces. The EIS technique was applied, and the Nyquist semicircles obtained for the bare electrode, PS/MMT-PAMAMG3, PS/MMT-PAMAMG3/Anti-SAA, and PS/MMT-PAMAMG3/Anti-SAA/SAA are shown in Figure 7D. The charge transfer resistance (Rct) values for the bare electrode, PS/MMT-PAMAMG3-, PS/MMT-PAMAMG3/Anti-SAA-, and PS/MMT-PAMAMG3/Anti-SAA/SAA-modified GCE were 1677, 4025, 3541, and 5000 Ω, respectively. The insulator layer made on the GCE surface after successful modification steps resulted in changed Rct values. These results are concomitant with the CV and DPV results.

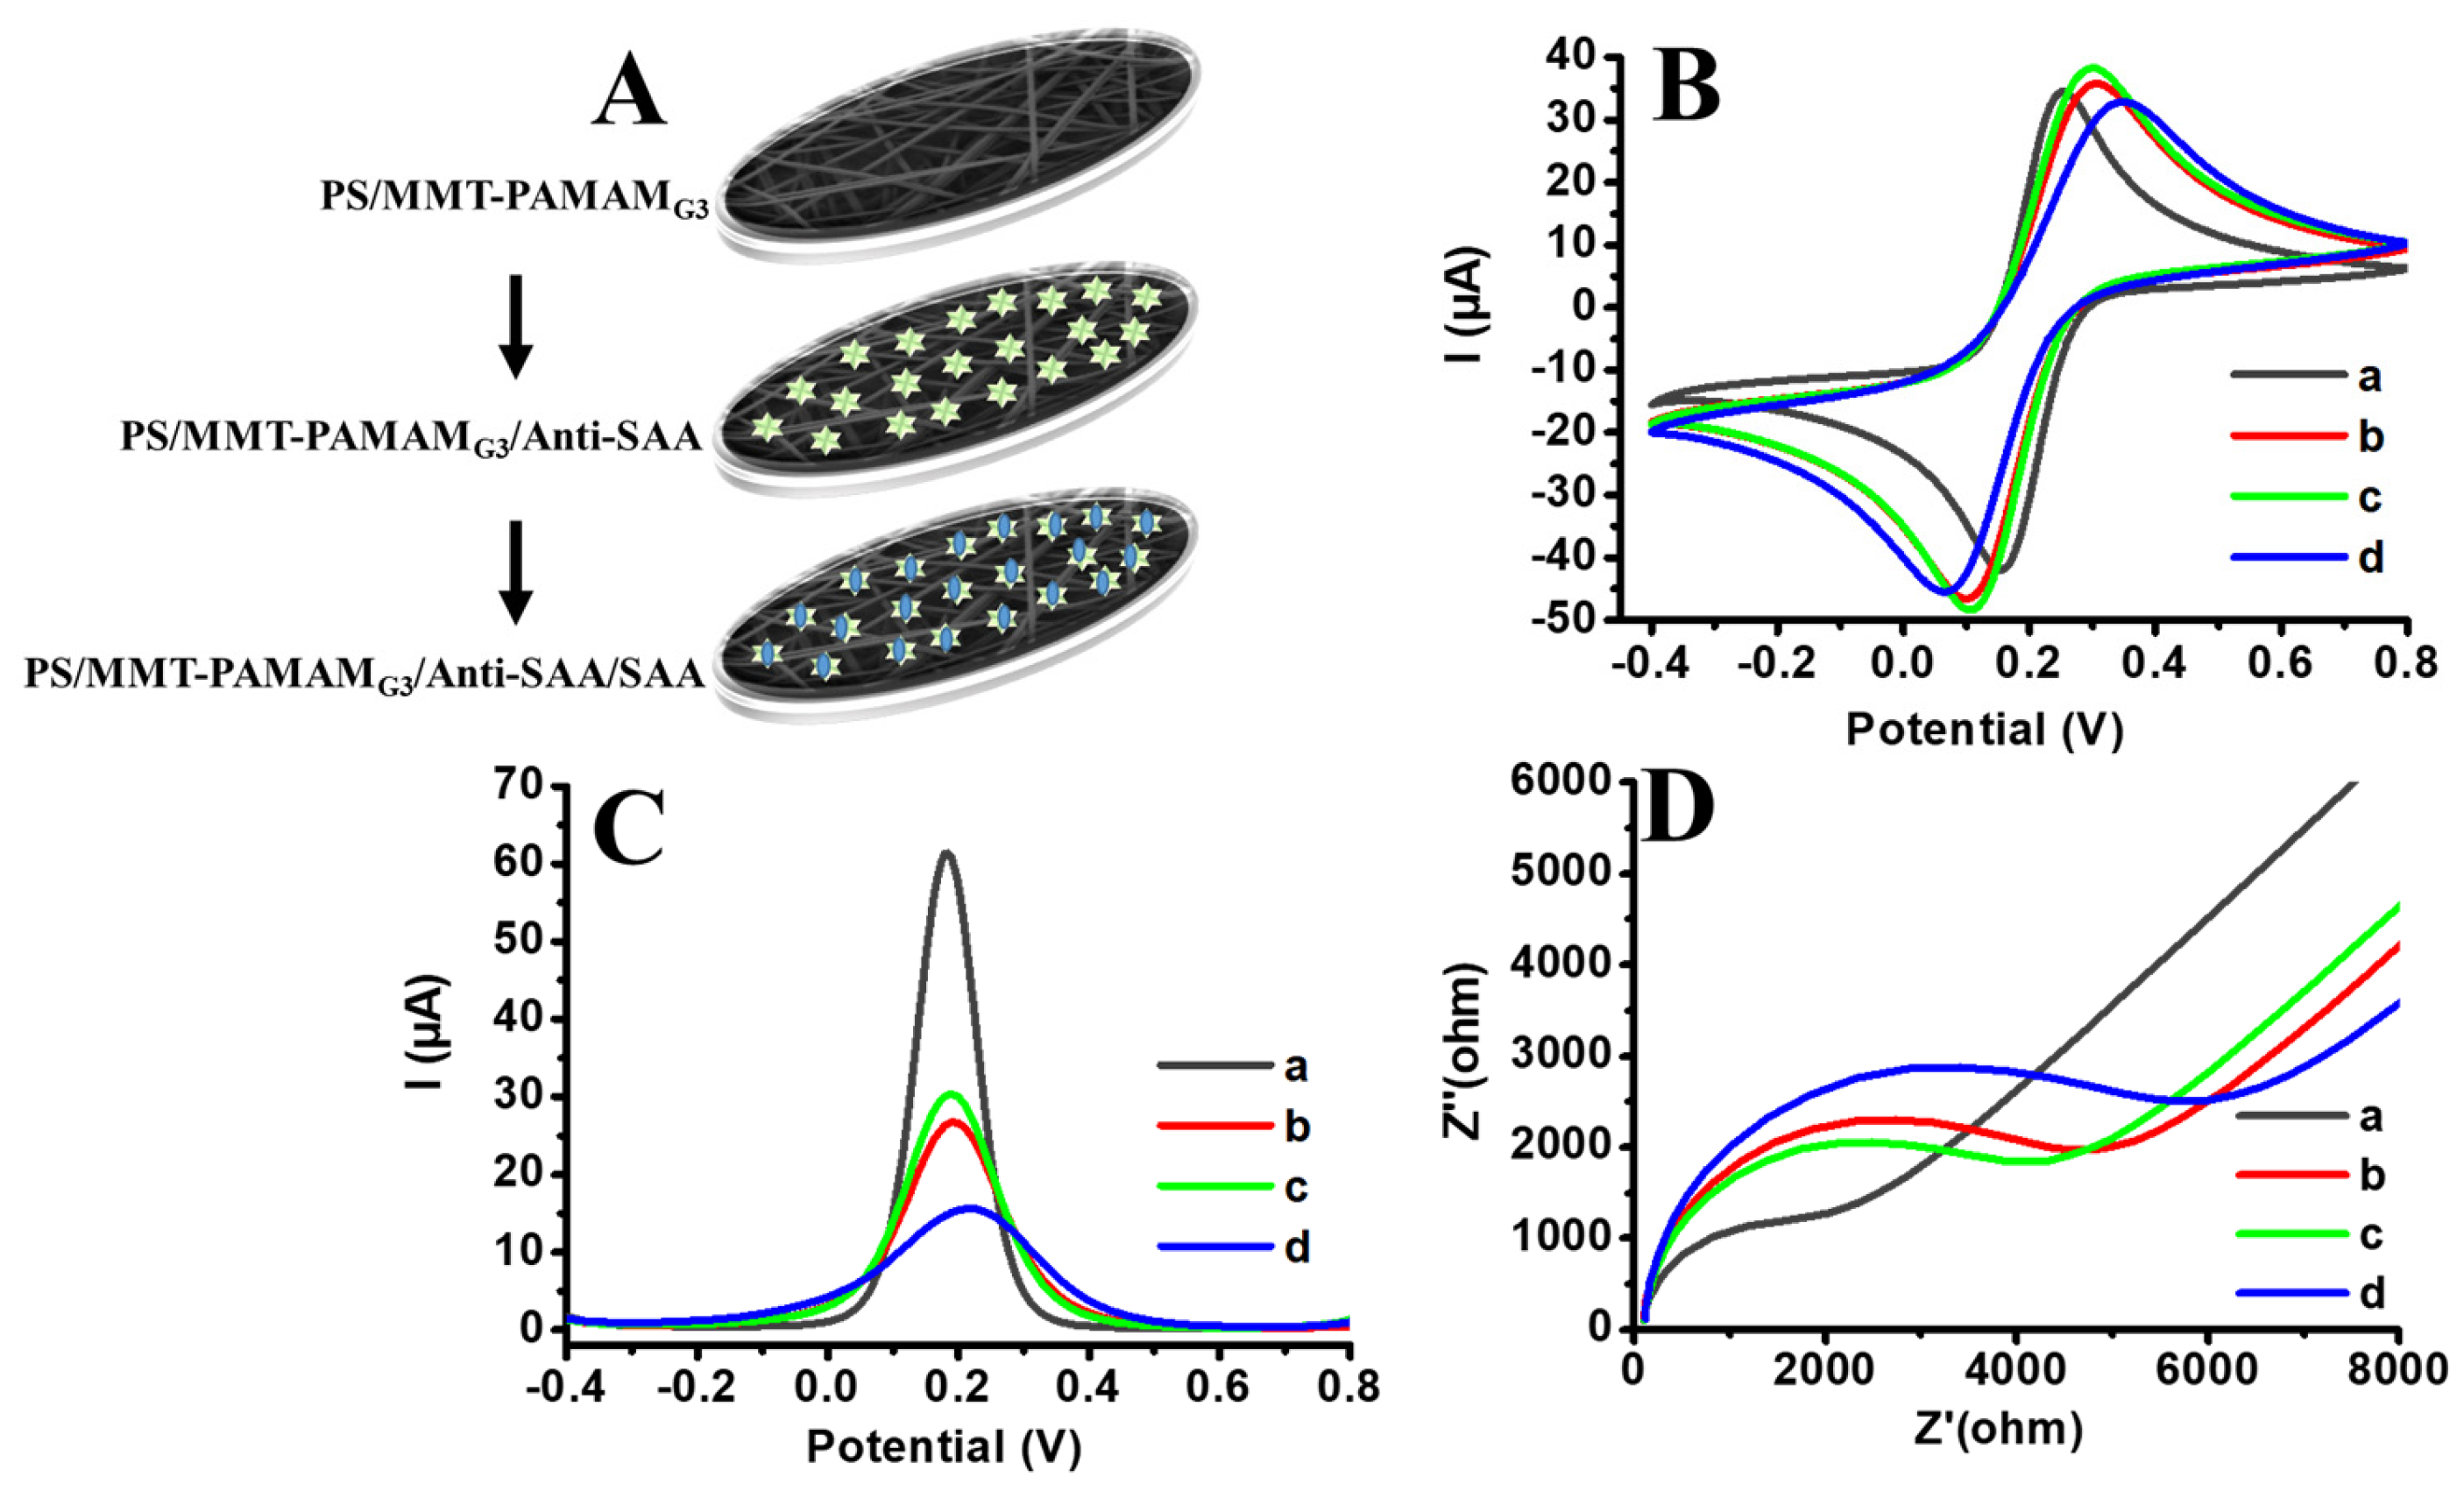
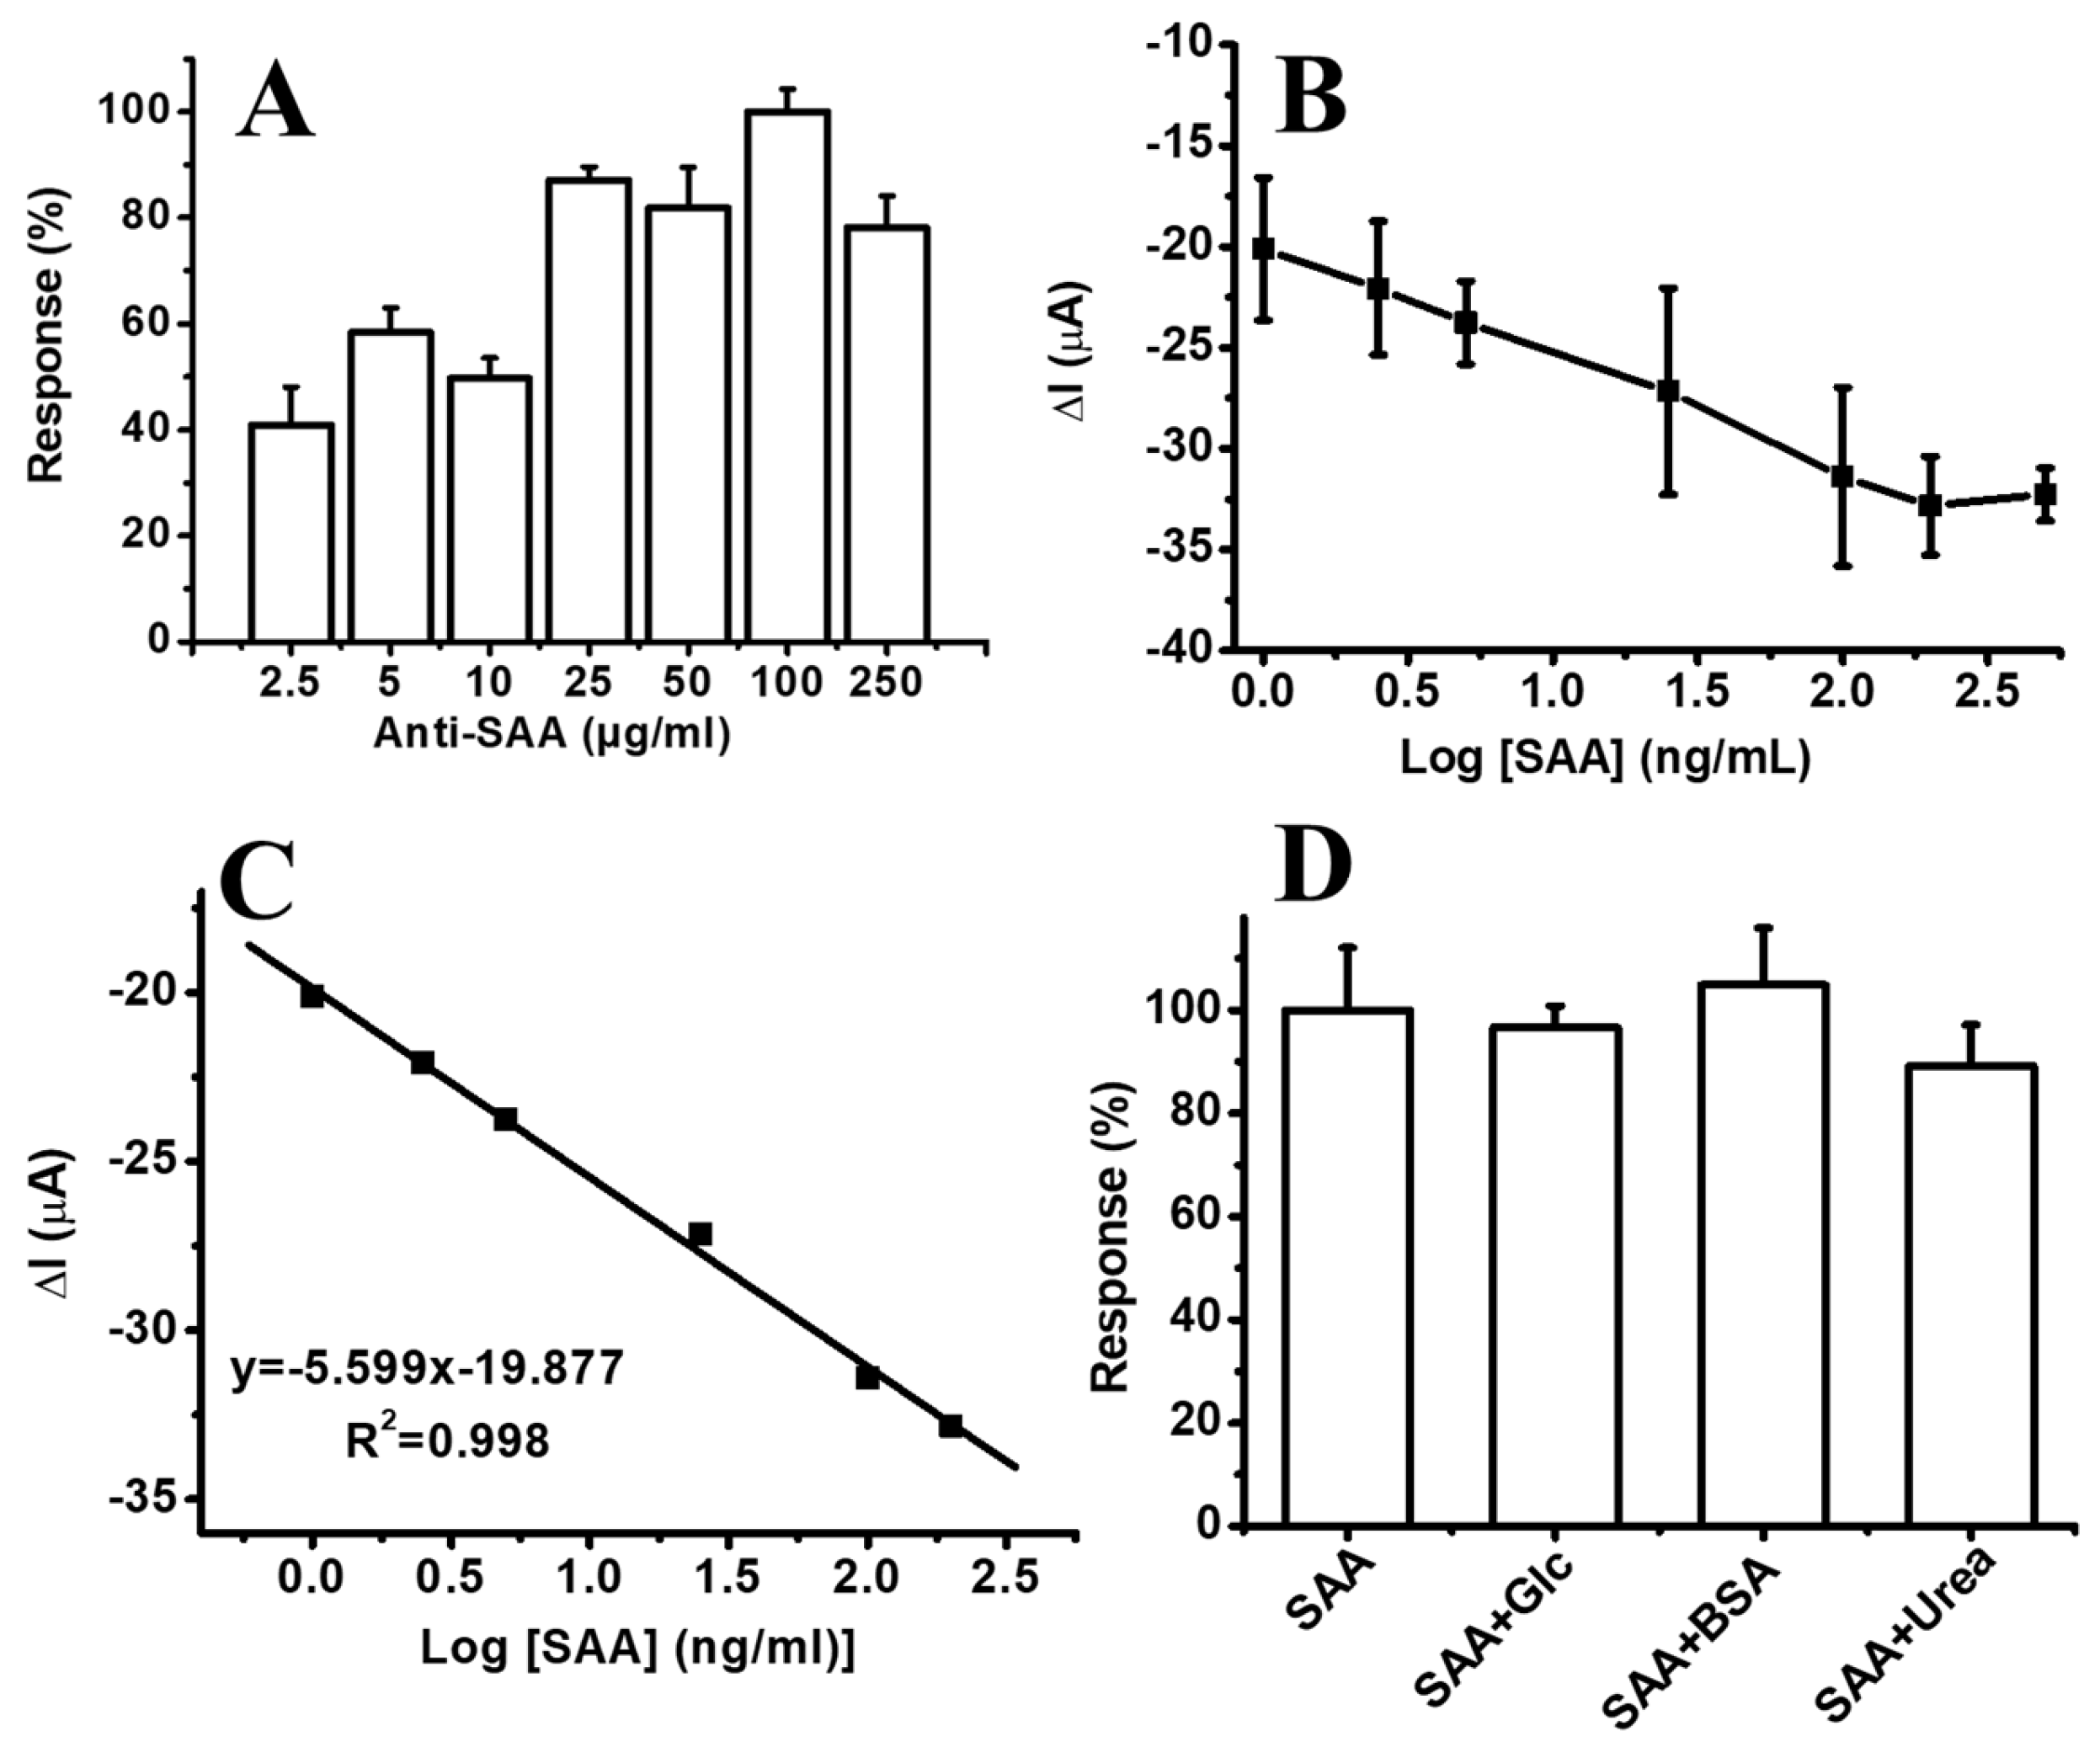
3.4. Electrochemical SAA Detection Based on PS/MMT-PAMAMG3/Anti-SAA

Electrochemical experiments were performed in 50 mM PBS (pH 7.4) with 5.0 mM K3[Fe(CN)6] and 0.1 M KCl using the DPV technique. Trials were conducted to determine the optimum Anti-SAA concentration before SAA detection. For this purpose, the effect of various Anti-SAA concentrations on the sensor current was tested. Biofunctionalized surfaces were prepared using 2.5, 5.0, 10, 25, 50, 100, and 250 µg/mL Anti-SAA on PS/MMT-PAMAMG3. We observed from the results that the highest electrochemical current for the PS/MMT-PAMAMG3/Anti-SAA electrode was obtained using 100 µg/mL Anti-SAA (see Figure 8A). This was due to the full coverage of the PS/MMT-PAMAMG3 surface by Anti-SAA, leading to a higher response for Anti-SAA concentrations above 25 µg/mL. The antibody molecule number on the PS/MMT-PAMAMG3/Anti-SAA nanofiber-modified GCE which fabricated using 100 µg/mL Anti-SAA was calculated as 9.85x10¹¹ Anti-SAA (diameter of GCE is 3.0 mm) and the immobilization yield was calculated as 73.91%. Because the highest current response of PS/MMT-PAMAMG3/Anti-SAA was observed using 100 µg/mL Anti-SAA, this concentration was used for further experiments as well. The effect of SAA on the current is shown in Figure 8B, and a linear range for SAA was obtained from 1.0 to 200 ng/mL with I(µA) = 5.299 [Log SAA] (ng/mL) + 19.877 (R2 = 0.998) (see Figure 8C). Based on the signal-to-noise ratios of eight trials, the limit of detection (LOD) was calculated by taking measurements with a 1.0 ng/mL SAA concentration, the lowest point of the calibration curve [56,57]. The LOD of PS/MMT-PAMAMG3/Anti-SAA was observed to be 0.57 ng/mL SAA. Notably, the SAA concentration should be below 3000 ng/mL in healthy adult individuals [58]. Five repeated measurements were taken with a 25 ng/mL SAA concentration, the midpoint of the calibration curve. The coefficient of variation was calculated to be 4.48%. Furthermore, the interference of other potential biological molecules was studied by testing the selectivity of the development of PS/MMT-PAMAMG3/Anti-SAA. For this purpose, we tested the effect of glucose, bovine serum albumin (BSA), and urea on the current response of PS/MMT-PAMAMG3/Anti-SAA. The designed PS/MMT-PAMAMG3/Anti-SAA exhibited a high response to SAA binding (see Figure 8D). Additionally, we observed no interference effect on the immunosensor response, on account of its high affinity to the Anti-SAA antibody. Table 1 presents the analytical characteristics of various sensors for SAA detection.
The samples were contaminated with 25 ng/mL SAA to feasibly determine PS/MMT-PAMAMG3/Anti-SAA for the detection of SAA in synthetic samples, including serum and saliva. The results obtained are presented in Table 2.

4. Conclusions

A PS/MMT-PAMAMG3/Anti-SAA immunosensor was fabricated and tested for rapid and reliable detection of SAA without any interference in samples. First, MMT was modified with PAMAMG3, following which the synthesized MMT-PAMAMG3 was successfully combined with the PS polymer. Thereafter, the resulting PS/MMT-PAMAMG3 was tested as an alternative immobilization matrix for the binding of Anti-SAA in a bid to fabricate the SAA immunosensor. The implementation of the immunosensors was tested in different samples. The PS/MMT-PAMAMG3/Anti-SAA immunosensor afforded reliable results for the detection of SAA in physiological fluids.

Author Contributions

Conceptualization, G.E., E.E.Y. and D.O. ; methodology, G.E., E.E. and E.E.Y.; validation, G.E. and E.E.; formal analysis, G.E., E.E. and E.E.Y.; writing—original draft preparation, G.E., E.E., E.E.Y. and N.H.; writing—review and editing, E.E.Y., N.H. and D.O.; supervision, D.O.; project administration, G.E. and D.O.; funding acquisition, G.E. and D.O. All authors have read and agreed to the published version of the manuscript.

Funding

This research was supported by the Ege University Scientific Research Projects Coordination Unit, Project number FGA-2019-20482.

Institutional Review Board Statement

Not applicable.

Informed Consent Statement

Not applicable.

Data Availability Statement

Not applicable.

Acknowledgments

G. Evren thanks the Scientific and Technological Research Council of Türkiye (TUBİTAK) 2210/D National Industrial MSc/MA Scholarship Program. We are grateful to the Ege University Planning and Monitoring Coordination of Organizational Development and the Directorate of Library and Documentation for their support in the editing and proofreading of this study.

Conflicts of Interest

The authors declare no conflict of interest.

References

  1. Gruys, E.; Toussaint, M.J.; Niewold, T.A.; Koopmans, S.J. Acute phase reaction and acute phase proteins. J. Zhejiang Univ. Sci. B 2005, 6, 1045–1056. [Google Scholar] [CrossRef] [PubMed] [Green Version]
  2. Sack, G.H. Serum amyloid A—A review. Mol. Med. 2018, 24, 46. [Google Scholar] [CrossRef] [PubMed] [Green Version]
  3. Hatanaka, E.; Monteagudo, P.T.; Martins Marrocos, M.S.; Campa, A. Interaction between serum amyloid A and leukocytes—A possible role in the progression of vascular complications in diabetes. Immunol. Lett. 2007, 108, 160–166. [Google Scholar] [CrossRef] [PubMed]
  4. Vietri, L.; Fui, A.; Bergantini, L.; d’Alessandro, M.; Cameli, P.; Sestini, P.; Rottoli, P.; Bargagli, E. Serum amyloid A: A potential biomarker of lung disorders. Respir. Investig. 2020, 58, 21–27. [Google Scholar] [CrossRef] [PubMed]
  5. Raynes, J.G.; Cooper, E.H. Comparison of serum amyloid a protein and C-reactive protein concentrations in cancer and non-malignant disease. J. Clin. Pathol. 1983, 36, 798–803. [Google Scholar] [PubMed] [Green Version]
  6. Cheng, L.; Yang, J.Z.; Bai, W.H.; Li, Z.Y.; Sun, L.F.; Yan, J.J.; Zhou, C.L.; Tang, B.P. Prognostic value of serum amyloid A in patients with COVID-19. Infection 2020, 48, 715–722. [Google Scholar] [CrossRef]
  7. Pieri, M.; Ciotti, M.; Nuccetelli, M.; Perrone, M.A.; Caliò, M.T.; Lia, M.S.; Minieri, M.; Bernardini, S. Serum Amyloid A Protein as a useful biomarker to predict COVID-19 patients severity and prognosis. Int. Immunopharmacol. 2021, 95, 107512. [Google Scholar] [CrossRef]
  8. Almusalami, E.M.; Lockett, A.; Ferro, A.; Posner, J. Serum amyloid A—A potential therapeutic target for hyper-inflammatory syndrome associated with COVID-19. Front. Med. 2023, 10, 1135695. [Google Scholar] [CrossRef]
  9. Wakai, M.; Hayashi, R.; Tanaka, S.; Naito, T.; Kumada, J.; Nomura, M.; Takigawa, H.; Oka, S.; Ueno, Y.; Ito, M.; et al. Serum amyloid A is a better predictive biomarker of mucosal healing than C-reactive protein in ulcerative colitis in clinical remission. BMC Gastroenterol. 2020, 20, 85. [Google Scholar] [CrossRef] [Green Version]
  10. Shah, V.G.; Ray, S.; Karlsson, R.; Srivastava, S. Calibration-free concentration analysis of protein biomarkers in human serum using surface plasmon resonance. Talanta 2015, 144, 801–808. [Google Scholar] [CrossRef]
  11. Carbone, T.; Pafundi, V.; Schievano, C.; Assunta, D.; Padula, M.C.; Giordano, M.; Canora, G.; Lazzari, C.; Padula, A.A.; D’Angelo, S. Serum amyloid A in healthy subjects: Assessment of reference value using ELISA method. J. Immunoass. Immunochem. 2021, 42, 129–137. [Google Scholar] [CrossRef]
  12. Trenchevska, O.; Yassine, H.N.; Borges, C.R.; Nelson, R.W.; Nedelkov, D. Development of quantitative mass spectrometric immunoassay for serum amyloid A. Biomarkers 2016, 21, 743–751. [Google Scholar] [CrossRef]
  13. Waugh, E.M.; Haining, H.; Harvie, J.; Ridyard, A.E.; Eckersall, P.D. Validation of an automated immunoturbidimetric assay for feline serum amyloid A. BMC Vet. Res. 2022, 18, 359. [Google Scholar] [CrossRef]
  14. Yamada, T.; Nomatal, Y.; Sugita, O.; Okada, M. A rapid method for measuring serum amyloid A protein by latex agglutination nephelometric immunoassay. Ann. Clin. Biochem. 1993, 30, 72–76. [Google Scholar] [CrossRef] [Green Version]
  15. Xia, C.; Li, Y.; Yuan, G.; Guo, Y.; Yu, C. Immunoassay for serum amyloid A using a glassy carbon electrode modified with carboxy-polypyrrole, multiwalled carbon nanotubes, ionic liquid and chitosan. Microchim. Acta 2015, 182, 1395–1402. [Google Scholar] [CrossRef]
  16. Karadag, M.; Geyik, C.; Demirkol, D.O.; Ertas, F.N.; Timur, S. Modified gold surfaces by 6-(ferrocenyl) hexanethiol/dendrimer/gold nanoparticles as a platform for the mediated biosensing applications. Mater. Sci. Eng. C 2013, 33, 634–640. [Google Scholar] [CrossRef]
  17. Çakar, İ.; Özdokur, K.V.; Demir, B.; Yavuz, E.; Demirkol, D.O.; Koçak, S.; Timur, S.; Ertaş, F.N. Molybdenum oxide/platinum modified glassy carbon electrode: A novel electrocatalytic platform for the monitoring of electrochemical reduction of oxygen and its biosensing applications. Sens. Actuators B Chem. 2013, 185, 331–336. [Google Scholar] [CrossRef]
  18. Tuncagil, S.; Odaci, D.; Varis, S.; Timur, S.; Toppare, L. Electrochemical polymerization of 1-(4-nitrophenyl)-2,5-di(2-thienyl)-1H-pyrrole as a novel immobilization platform for microbial sensing. Bioelectrochemistry 2009, 76, 169–174. [Google Scholar] [CrossRef]
  19. Kırgöz, Ü.A.; Odaci, D.; Timur, S.; Merkoçi, A.; Pazarlıoğlu, N.; Telefoncu, A.; Alegret, S. Graphite epoxy composite electrodes modified with bacterial cells. Bioelectrochemistry 2006, 69, 128–131. [Google Scholar] [CrossRef]
  20. Demirkol, D.O.; Yildiz, H.B.; Sayın, S.; Yilmaz, M. Enzyme immobilization in biosensor constructions: Self-assembled monolayers of calixarenes containing thiols. RSC Adv. 2014, 4, 19900–19907. [Google Scholar] [CrossRef]
  21. Xia, N.; Wang, X.; Zhou, B.; Wu, Y.; Mao, W.; Liu, L. Electrochemical detection of amyloid-β oligomers based on the signal amplification of a network of silver nanoparticles. ACS Appl. Mater. Interfaces 2016, 8, 19303–19311. [Google Scholar] [CrossRef]
  22. Zhang, B.; Liu, B.; Zhou, J.; Tang, J.; Tang, D. Additional Molecular Biological Amplification Strategy for Enhanced Sensitivity of Monitoring Low-Abundance Protein with Dual Nanotags. ACS Appl. Mater. Interfaces 2013, 5, 4479–4485. [Google Scholar] [CrossRef] [PubMed]
  23. Popov, A.; Brasiunas, B.; Kausaite-Minkstimiene, A.; Ramanaviciene, A. Metal Nanoparticle and Quantum Dot Tags for Signal Amplification in Electrochemical Immunosensors for Biomarker Detection. Chemosensors 2021, 9, 85. [Google Scholar] [CrossRef]
  24. Lakard, B. Electrochemical Biosensors Based on Conducting Polymers: A Review. Appl. Sci. 2020, 10, 6614. [Google Scholar] [CrossRef]
  25. Yashini, M.; Auddy, I.; Shanmugasundaram, S.; Vidyalakshmi, R.; Sunil, C.K. Characterization of Antibody Immobilization on Chitosan/Gelatin-Modified Electrode and Its Application to Bacillus cereus Detection in Cereal-Based Food. Food Anal. Methods 2022, 15, 2382–2393. [Google Scholar] [CrossRef]
  26. Hartati, Y.W.; Irkham, I.; Zulqaidah, S.; Syafira, R.S.; Kurnia, I.; Noviyanti, A.R.; Topkaya, S.N. Recent advances in hydroxyapatite-based electrochemical biosensors: Applications and future perspectives. Sens. Bio-Sens. Res. 2002, 38, 100542. [Google Scholar] [CrossRef]
  27. Police Patil, A.V.; Chuang, Y.-S.; Li, C.; Wu, C.C. Recent Advances in Electrochemical Immunosensors with Nanomaterial Assistance for Signal Amplification. Biosensors 2023, 13, 125. [Google Scholar] [CrossRef]
  28. Kirbay, F.O.; Yalcinkaya, E.E.; Atik, G.; Evren, G.; Unal, B.; Demirkol, D.O.; Timur, S. Biofunctionalization of PAMAM-montmorillonite decorated poly(ε-caprolactone)-chitosan electrospun nanofibers for cell adhesion and electrochemical cytosensing. Biosens. Bioelectron. 2018, 109, 286–294. [Google Scholar] [CrossRef]
  29. Unal, B.; Yalcinkaya, E.E.; Demirkol, D.O.; Timur, S. An electrospun nanofiber matrix based on organo-clay for biosensors: PVA/PAMAM-Montmorillonite. Appl. Surf. Sci. 2018, 444, 542–551. [Google Scholar] [CrossRef]
  30. Atilgan, H.; Unal, B.; Yalcinkaya, E.E.; Evren, G.; Atik, G.; Ozturk Kirbay, F.; Kilic, N.M.; Odaci, D. Development of an Enzymatic Biosensor Using Glutamate Oxidase on Organic–Inorganic-Structured, Electrospun Nanofiber-Modified Electrodes for Monosodium Glutamate Detection. Biosensors 2023, 13, 430. [Google Scholar] [CrossRef]
  31. Bongartz, R.; Ag, D.; Seleci, M.; Walter, J.G.; Yalcinkaya, E.E.; Demirkol, D.O.; Stahl, F.; Timur, S.; Scheper, T. Folic acid-modified clay: Targeted surface design for cell culture applications. J. Mater. Chem. B 2013, 1, 522–528. [Google Scholar] [CrossRef]
  32. Mushtaq, M.; Saba, H.; Wang, W.; Naeem, M.A.; Wei, Q. Fabrication and characterization of electrospun membranes from Poly(lactic acid) and hexadecyl trimethyl ammonium chloride-modified montmorillonite clay. J. Ind. Text. 2019, 50, 415–424. [Google Scholar] [CrossRef]
  33. Cai, J.; Lei, M.; Zhang, Q.; He, J.R. Electrospun composite nanofiber mats of Cellulose@Organically modified montmorillonite for heavy metal ion removal: Design, characterization, evaluation of absorption performance. Compos. Part A Appl. Sci. Manuf. 2017, 92, 10–16. [Google Scholar] [CrossRef]
  34. Yezer, I.; Demirkol, D.O. Cellulose acetate–chitosan based electrospun nanofibers for bio-functionalized surface design in biosensing. Cellulose 2020, 27, 10183–10197. [Google Scholar] [CrossRef]
  35. Gal, J.Y.; Fovet, Y.; Adib-Yadzi, M. About a synthetic saliva for in vitro studies. Talanta 2001, 53, 1103–1115. [Google Scholar] [CrossRef]
  36. Bradford, M.M. A rapid and sensitive method for the quantitation of microgram quantities of protein utilizing the principle of protein-dye binding. Anal. Biochem. 1976, 72, 248–254. [Google Scholar] [CrossRef]
  37. Tripathi, K.; Driskell, J.D. Quantifying Bound and Active Antibodies Conjugated to Gold Nanoparticles: A Comprehensive and Robust Approach to Evaluate Immobilization Chemistry. ACS Omega 2018, 3, 8253–8259. [Google Scholar] [CrossRef] [Green Version]
  38. Saha, B.; Evers, T.H.; Prins, M.W.J. How Antibody Surface Coverage on Nanoparticles Determines the Activity and Kinetics of Antigen Capturing for Biosensing. Anal. Chem. 2014, 86, 8158–8166. [Google Scholar] [CrossRef] [Green Version]
  39. Damar, K.; Demirkol, D.O. Modified gold surfaces by poly(amidoamine) dendrimers and fructose dehydrogenase for mediated fructose sensing. Talanta 2011, 87, 67–73. [Google Scholar] [CrossRef]
  40. Meng, Z.; Lv, F.; Zhang, Y.; Zhang, Q.; Zhang, Z.; Ai, S. Modified Na-Montmorillonite with Quaternary Ammonium Salts: Application for Removal of Salicylic Acid From Aqueous Solutions. Clean Soil Air Water 2015, 43, 1150–1156. [Google Scholar] [CrossRef]
  41. Vazquez, A.; López, M.; Kortaberria, G.; Martín, L.; Mondragon, I. Modification of montmorillonite with cationic surfactants. Thermal and chemical analysis including CEC determination. Appl. Clay Sci. 2008, 41, 24–36. [Google Scholar] [CrossRef]
  42. Seleci, M.; Ag, D.; Yalcinkaya, E.E.; Demirkol, D.O.; Guler, C.; Timur, S. Amine-intercalated montmorillonite matrices for enzyme immobilization and biosensing applications. RSC Adv. 2012, 2, 2112–2118. [Google Scholar] [CrossRef]
  43. Zeybekler, S.E.; Odaci, D. Carbon Nanotube-Incorporated Nanofibers for Immunosensor Preparation against CD36. ACS Omega 2023, 8, 5776–5786. [Google Scholar] [CrossRef]
  44. Nitanan, T.; Opanasopit, P.; Akkaramongkolporn, P.; Rojanarata, T.; Ngawhirunpat, T.; Supaphol, P. Effects of processing parameters on morphology of electrospun polystyrene nanofibers. Korean J. Chem. Eng. 2012, 29, 173–181. [Google Scholar] [CrossRef]
  45. Shin, C.; Chase, G. Nanofibers from recycle waste expanded polystyrene using natural solvent. Polym. Bull. 2005, 55, 209–215. [Google Scholar] [CrossRef]
  46. Mostafa, M.; Kandile, N.G.; Mahmoud, M.K.; Ibrahim, H.M. Synthesis and characterization of polystyrene with embedded silver nanoparticle nanofibers to utilize as antibacterial and wound healing biomaterial. Heliyon 2022, 8, e08772. [Google Scholar] [CrossRef]
  47. Avossa, J.; Herwig, G.; Toncelli, C.; Itel, F.; Rossi, R.M. Electrospinning based on benign solvents: Current definitions, implications and strategies. Green Chem. 2022, 24, 2347–2375. [Google Scholar] [CrossRef]
  48. El-Newehy, M.H.; Kim, H.Y.; Khattab, T.A.; El-Naggar, M.E. Development of highly photoluminescent electrospun nanofibers for dual-mode secure authentication. Ceram. Int. 2022, 48, 3495–3503. [Google Scholar] [CrossRef]
  49. Lee, K.H.; Kim, H.Y.; Bang, H.J.; Jung, Y.H.; Lee, S.G. The change of bead morphology formed on electrospun polystyrene fibers. Polymer 2003, 44, 4029–4034. [Google Scholar] [CrossRef]
  50. Uyar, T.; Besenbacher, F. Electrospinning of uniform polystyrene fibers: The effect of solvent conductivity. Polymer 2008, 49, 5336–5343. [Google Scholar] [CrossRef]
  51. Demir, M.M. Investigation on glassy skin formation of porous polystyrene fibers electrospun from DMF. Express Polym. Lett. 2010, 4, 2–8. [Google Scholar] [CrossRef]
  52. An, J.; Wang, X.; Li, Y.; Kang, W.; Lian, K. Polystyrene nanofibers as an effective sorbent for the adsorption of clonazepam: Kinetic and thermodynamic studies. RSC Adv. 2022, 12, 3394–3401. [Google Scholar] [CrossRef]
  53. Er, S.; Demirkol, D.O. Graphene oxide incorporated polystyrene electrospun nanofibers for immunosensing of CD36 as a marker of diabetic plasma. Bioelectrochemistry 2022, 145, 108083. [Google Scholar] [CrossRef]
  54. Razmshoar, P.; Bahrami, S.H.; Akbari, S. Functional hydrophilic highly biodegradable PCL nanofibers through direct aminolysis of PAMAM dendrimer. Int. J. Polym. Mater. Polym. Biomater. 2020, 69, 1069–1080. [Google Scholar] [CrossRef]
  55. Wu, H.-D.; Wu, S.-C.; Wu, I.-D.; Chang, F.C. Novel determination of the crystallinity of syndiotactic polystyrene using FTIR spectrum. Polymer 2001, 42, 4719–4725. [Google Scholar] [CrossRef]
  56. Armbruster, D.A.; Tillman, M.D.; Hubbs, L.M. Limit of Detection (LQD)/Limit of Quantitation (LOQ): Comparison of the Empirical and the Statistical Methods Exemplified with GC-MS Assays of Abused Drugs. Clin. Chem. 1994, 40 Pt 1, 1233–1238. [Google Scholar] [CrossRef]
  57. Vashist, S.K.; Luong, J.H. Bioanalytical Requirements and Regulatory Guidelines for Immunoassays. In Handbook of Immunoassay Technologies; Elsevier: Amsterdam, The Netherlands, 2018; pp. 81–95. ISBN 9780128117941. [Google Scholar]
  58. Hosman, I.S.; Kos, I.; Lamot, L. Serum Amyloid A in Inflammatory Rheumatic Diseases: A Compendious Review of a Renowned Biomarker. Front. Immunol. 2021, 11, 631299. [Google Scholar] [CrossRef]
  59. Balayan, S.; Chauhan, N.; Chandra, R.; Jain, U. Molecular imprinting based electrochemical biosensor for identification of serum amyloid A (SAA), a neonatal sepsis biomarker. Int. J. Biol. Macromol. 2022, 195, 589–597. [Google Scholar] [CrossRef]
  60. Liu, X.; Yang, X.; Li, K.; Liu, H.; Xiao, R.; Wang, W.; Wang, C.; Wang, S. Fe3O4@Au SERS tags-based lateral flow assay for simultaneous detection of serum amyloid A and C-reactive protein in unprocessed blood sample. Sens. Actuators B Chem. 2020, 320, 128350. [Google Scholar] [CrossRef]
  61. Gul, O.; Calay, E.; Sezerman, U.; Basaga, H.; Gurbuz, Y. Sandwich-type, antibody microarrays for the detection and quantification of cardiovascular risk markers. Sens. Actuators B Chem. 2007, 125, 581–588. [Google Scholar] [CrossRef]
  62. Lv, Y.; Wang, F.; Li, N.; Wu, R.; Li, J.; Shen, H.; Li, L.S.; Guo, F. Development of dual quantum dots-based fluorescence-linked immunosorbent assay for simultaneous detection on inflammation biomarkers. Sens. Actuators B Chem. 2019, 301, 127118. [Google Scholar] [CrossRef]
Figure 1. (A) Intercalation of poly(amidoamine) generation 3 (PAMAMG3) into the montmorillonite (MMT) sheets. (B) Fouirer transform infrared (FTIR) spectra, (C) X-Ray diffraction (XRD) pattern (inset shows XRD pattern with 2θ = 3–10 scale), (D) Thermogravimetric (TG) thermogram, (E) Differential thermogravimetric (DTG) thermogram of MMT and MMT-PAMAMG3.
Biosensors 13 00673 g001
Figure 2. (A) Design of the polystyrene-based (PS) nanofiber matrix obtained by electrospinning. (B) Scanning electron microscopy (SEM) micrographs and (C) histograms of diameter distribution of the PS nanofibers fabricated from PS solutions with different concentrations (wt%): (a) 5%, (b) 10%, (c) 15%, and (d) 20% (insets of C show drop images of water and contact angles of the PS nanofibers).
Biosensors 13 00673 g002aBiosensors 13 00673 g002b
Figure 3. (A) SEM micrographs and (B) histograms of diameter distribution of the PS/MMT nanofibers containing different MMT concentrations (wt%) in 20% (wt%) PS: (a) 0.1%, (b) 0.25%, (c) 0.5%, (d) 1.0%, and (e) 2.0% (insets of B show drop images of water and contact angles of the PS/MMT nanofibers).
Biosensors 13 00673 g003
Figure 4. (A) SEM micrographs and (B) histograms of diameter distribution of the PS/MMT-PAMAMG3 nanofibers containing (a) 0.25% (wt%) and (b) 0.5% (wt%) MMT-PAMAMG3 in 20% (wt%) PS (insets of B show drop images of water and contact angles of the PS/MMT–PAMAMG3 nanofibers).
Biosensors 13 00673 g004
Figure 5. EDX results for (A) PS and (B) PS/MMT-PAMAMG3. (C) FTIR spectra of PS and PS/MMT-PAMAMG3. (D) Swelling ratios of the PS and PS/MMT-PAMAMG3 nanofibers.
Biosensors 13 00673 g005
Figure 6. (A) XPS survey spectrum. (B) Percentage of surface chemical composition of PS, PS/MMT-PAMAMG3, and PS/MMT-PAMAMG3/Anti-SAA. (C) C1s and (D) N1s spectra of PS/MMT-PAMAMG3. (E) C1s and (F) N1s spectra of PS/MMT-PAMAMG3/Anti-SAA.
Biosensors 13 00673 g006
Figure 7. (A) Step-by-step modification of GCE surfaces. (B) CV, (C) DPV, and (D) Nyquist profile of (a) bare electrode, (b) PS/MMT-PAMAMG3, (c) PS/MMT-PAMAMG3/Anti-SAA, and (d) PS/MMT-PAMAMG3/Anti-SAA/SAA (Anti-SAA: 100 µg/mL and SAA: 2.0 ng/mL; scan rate: 50 mVs−1 (for CV and DPV) in 10 mL PBS (pH 7.4) containing 5.0 mM K3[Fe(CN)6] and 0.1 M KCl).
Biosensors 13 00673 g007
Figure 8. (A) Dependence of current on Anti-SAA concentration (in PBS pH 7.4; [SAA]: 50 ng/mL; n = 3). (B) Effect of SAA concentration on current response of PS/MMT-PAMAMG3/Anti-SAA (in PBS pH 7.4). (C) Linear range of PS/MMT-PAMAMG3/Anti-SAA for SAA detection (in PBS pH 7.4). (D) Effect of some potential interfering compounds on the current response of PS/MMT-PAMAMG3/Anti-SAA for SAA (in PBS pH 7.4; [SAA]: 25 ng/mL, [Glc]: 5.0 mM, [BSA]: 25 ng/mL, [urea]: 10 ng/mL).
Biosensors 13 00673 g008
Table 1. The comparison of sensors for SAA detection.
Sensing ModeMaterialRecognition MoleculeLinear RangeLODApplied SampleRef
ELECMWCNTs MnO2NSs Co3O4NPs MIP0.12 pg/mL–12 μg/mL0.12 pg/mLSerum[59]
LFAFe3O4@Au SERS tagsAnti-SAA0.1–500 ng/mL0.10 ng/mLBlood[60]
FLSandwich-type, antibody microarrays Antibody5.9–478 ng/mL5.90 ng/mL Serum[61]
ELECMWCNTs/IL/Chit/GCEAnti-SAA0.001–900 ng/mL0.30 pg/mLSerum[15]
FLdQDs-FLISAAnti-SAA10–1000 ng/mL2.39 ng/mLSerum[62]
ELECPS/MMT-PAMAMG3Anti-SAA1.0–200 ng/mL0.57 ng/mLSynthetic saliva and serumThis study
ELEC: electrochemistry; MWCNTs: multi-walled carbon nanotubes; MnO2NSs: manganese oxide nanospheres; Co3O4NPs: cobalt oxide nanoparticles; MIP: molecular imprinted polymer; LFA: lateral flow assay; Fe3O4: ferric oxide; Au: gold; SERS: surface-enhanced Raman scattering; FL: fluorescence; IL: ionic liquid; Chit: chitosan; dQDs-FLISA: dual quantum-dots-based fluorescence-linked immunosorbent assay.
Table 2. Application of PS/MMT-PAMAMG3 for the detection of SAA in artificial samples.
Synthetic SampleAdded SAA (ng/mL)* Found SAA (ng/mL)Recovery %
Saliva2524.8299.29
Serum2524.3597.41
* Trials were repeated three times.
Disclaimer/Publisher’s Note: The statements, opinions and data contained in all publications are solely those of the individual author(s) and contributor(s) and not of MDPI and/or the editor(s). MDPI and/or the editor(s) disclaim responsibility for any injury to people or property resulting from any ideas, methods, instructions or products referred to in the content.

