Synthesis of Fe-Doped Peroxidase Mimetic Nanozymes from Natural Hemoglobin for Colorimetric Biosensing and In Vitro Anticancer Effects

 , , and
Abstract
:1. Introduction
2. Materials and Methods
2.1. Synthesis of BDNPs
2.2. Peroxidase Mimetic Property of BDNPs
3. Results and Discussions
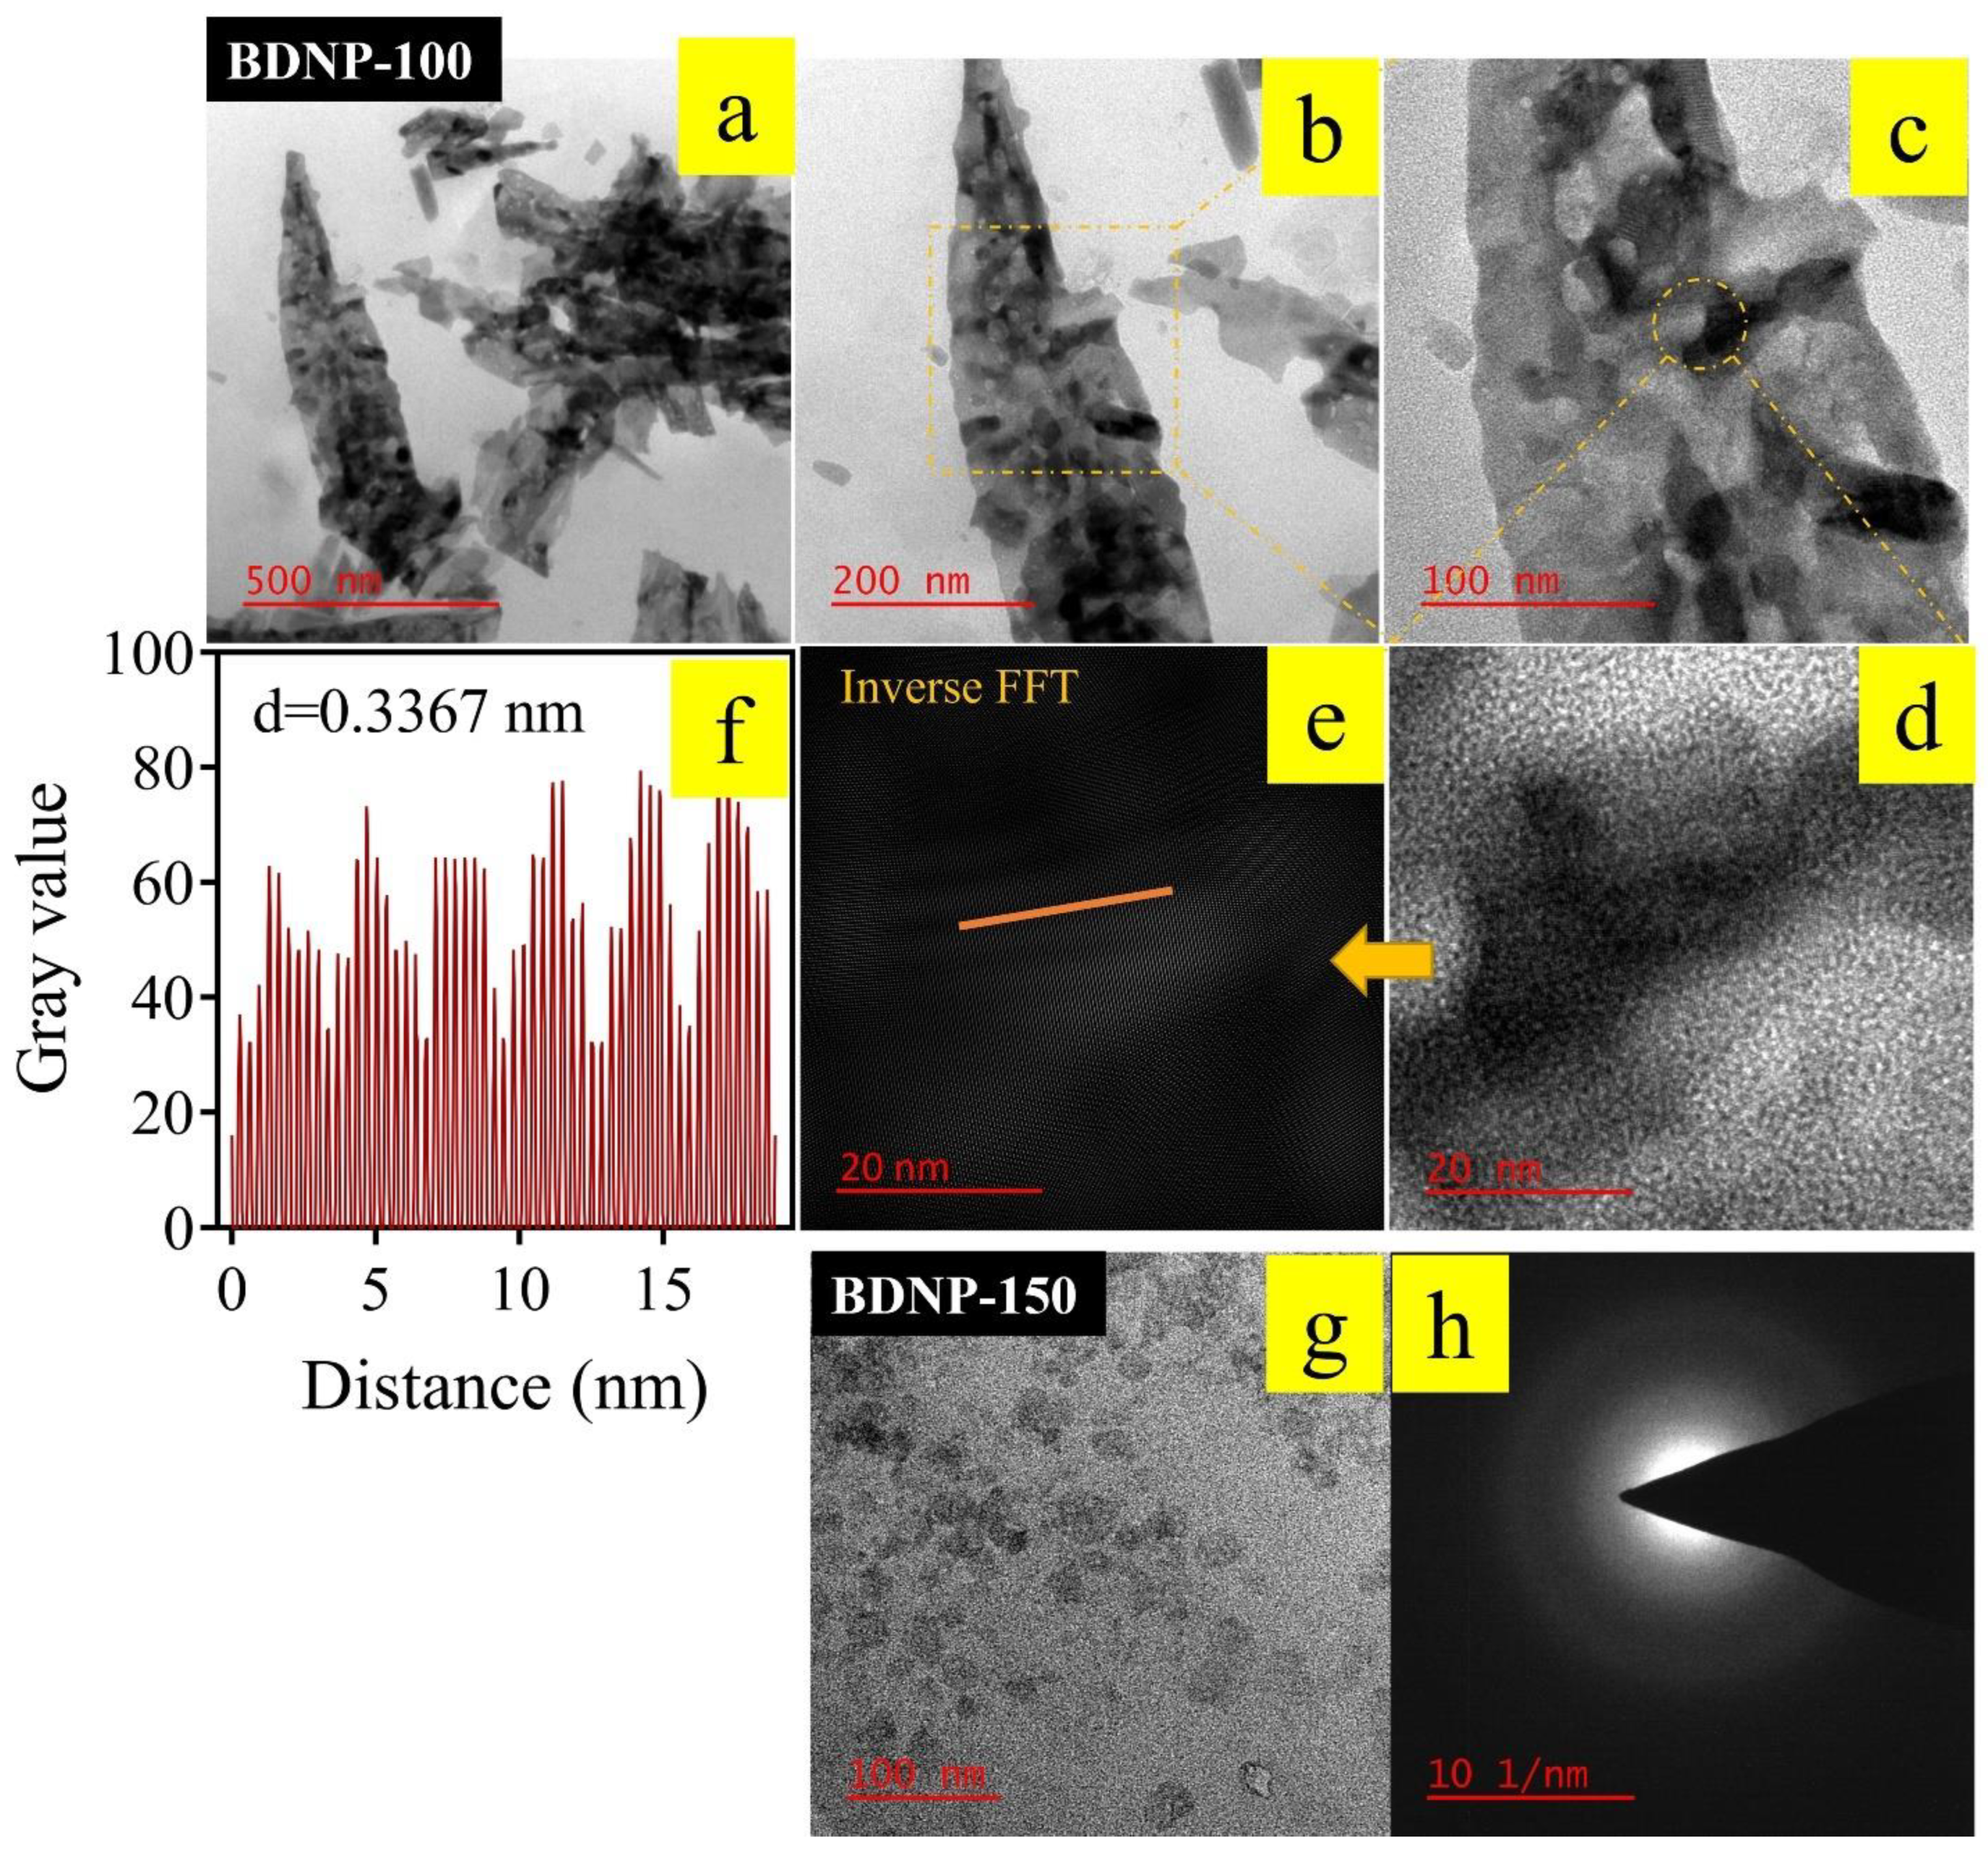
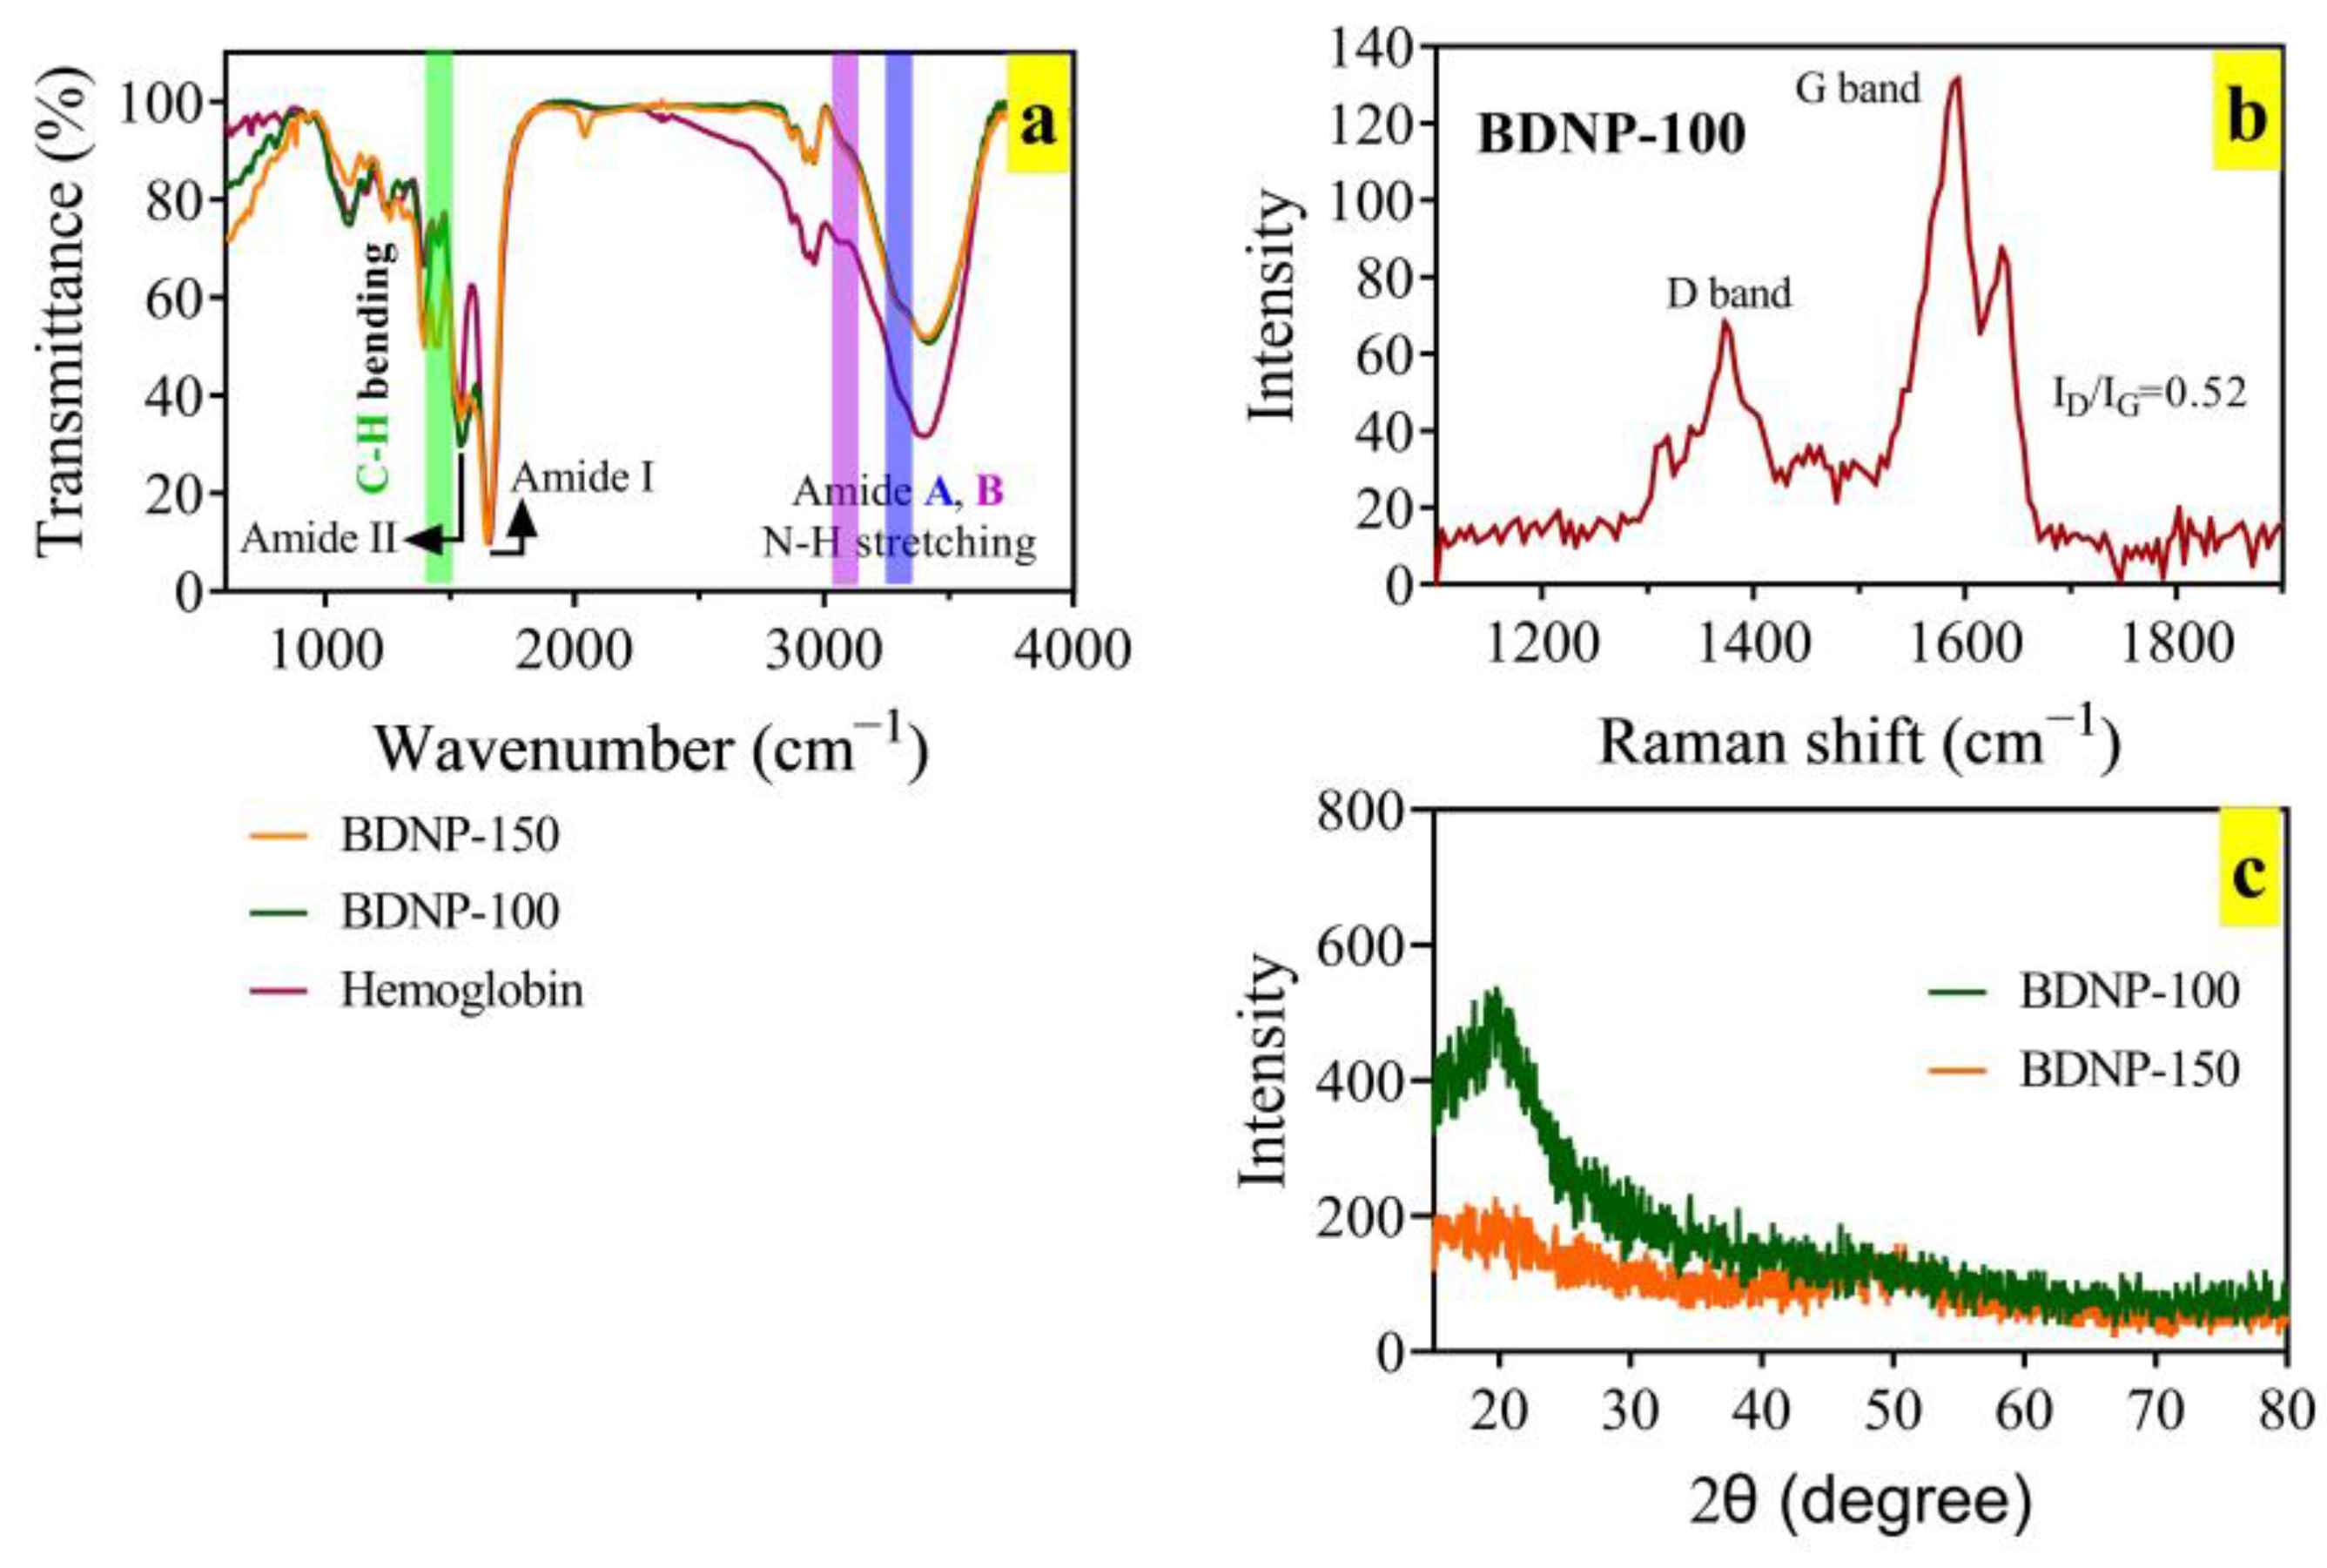
3.1. Characterization
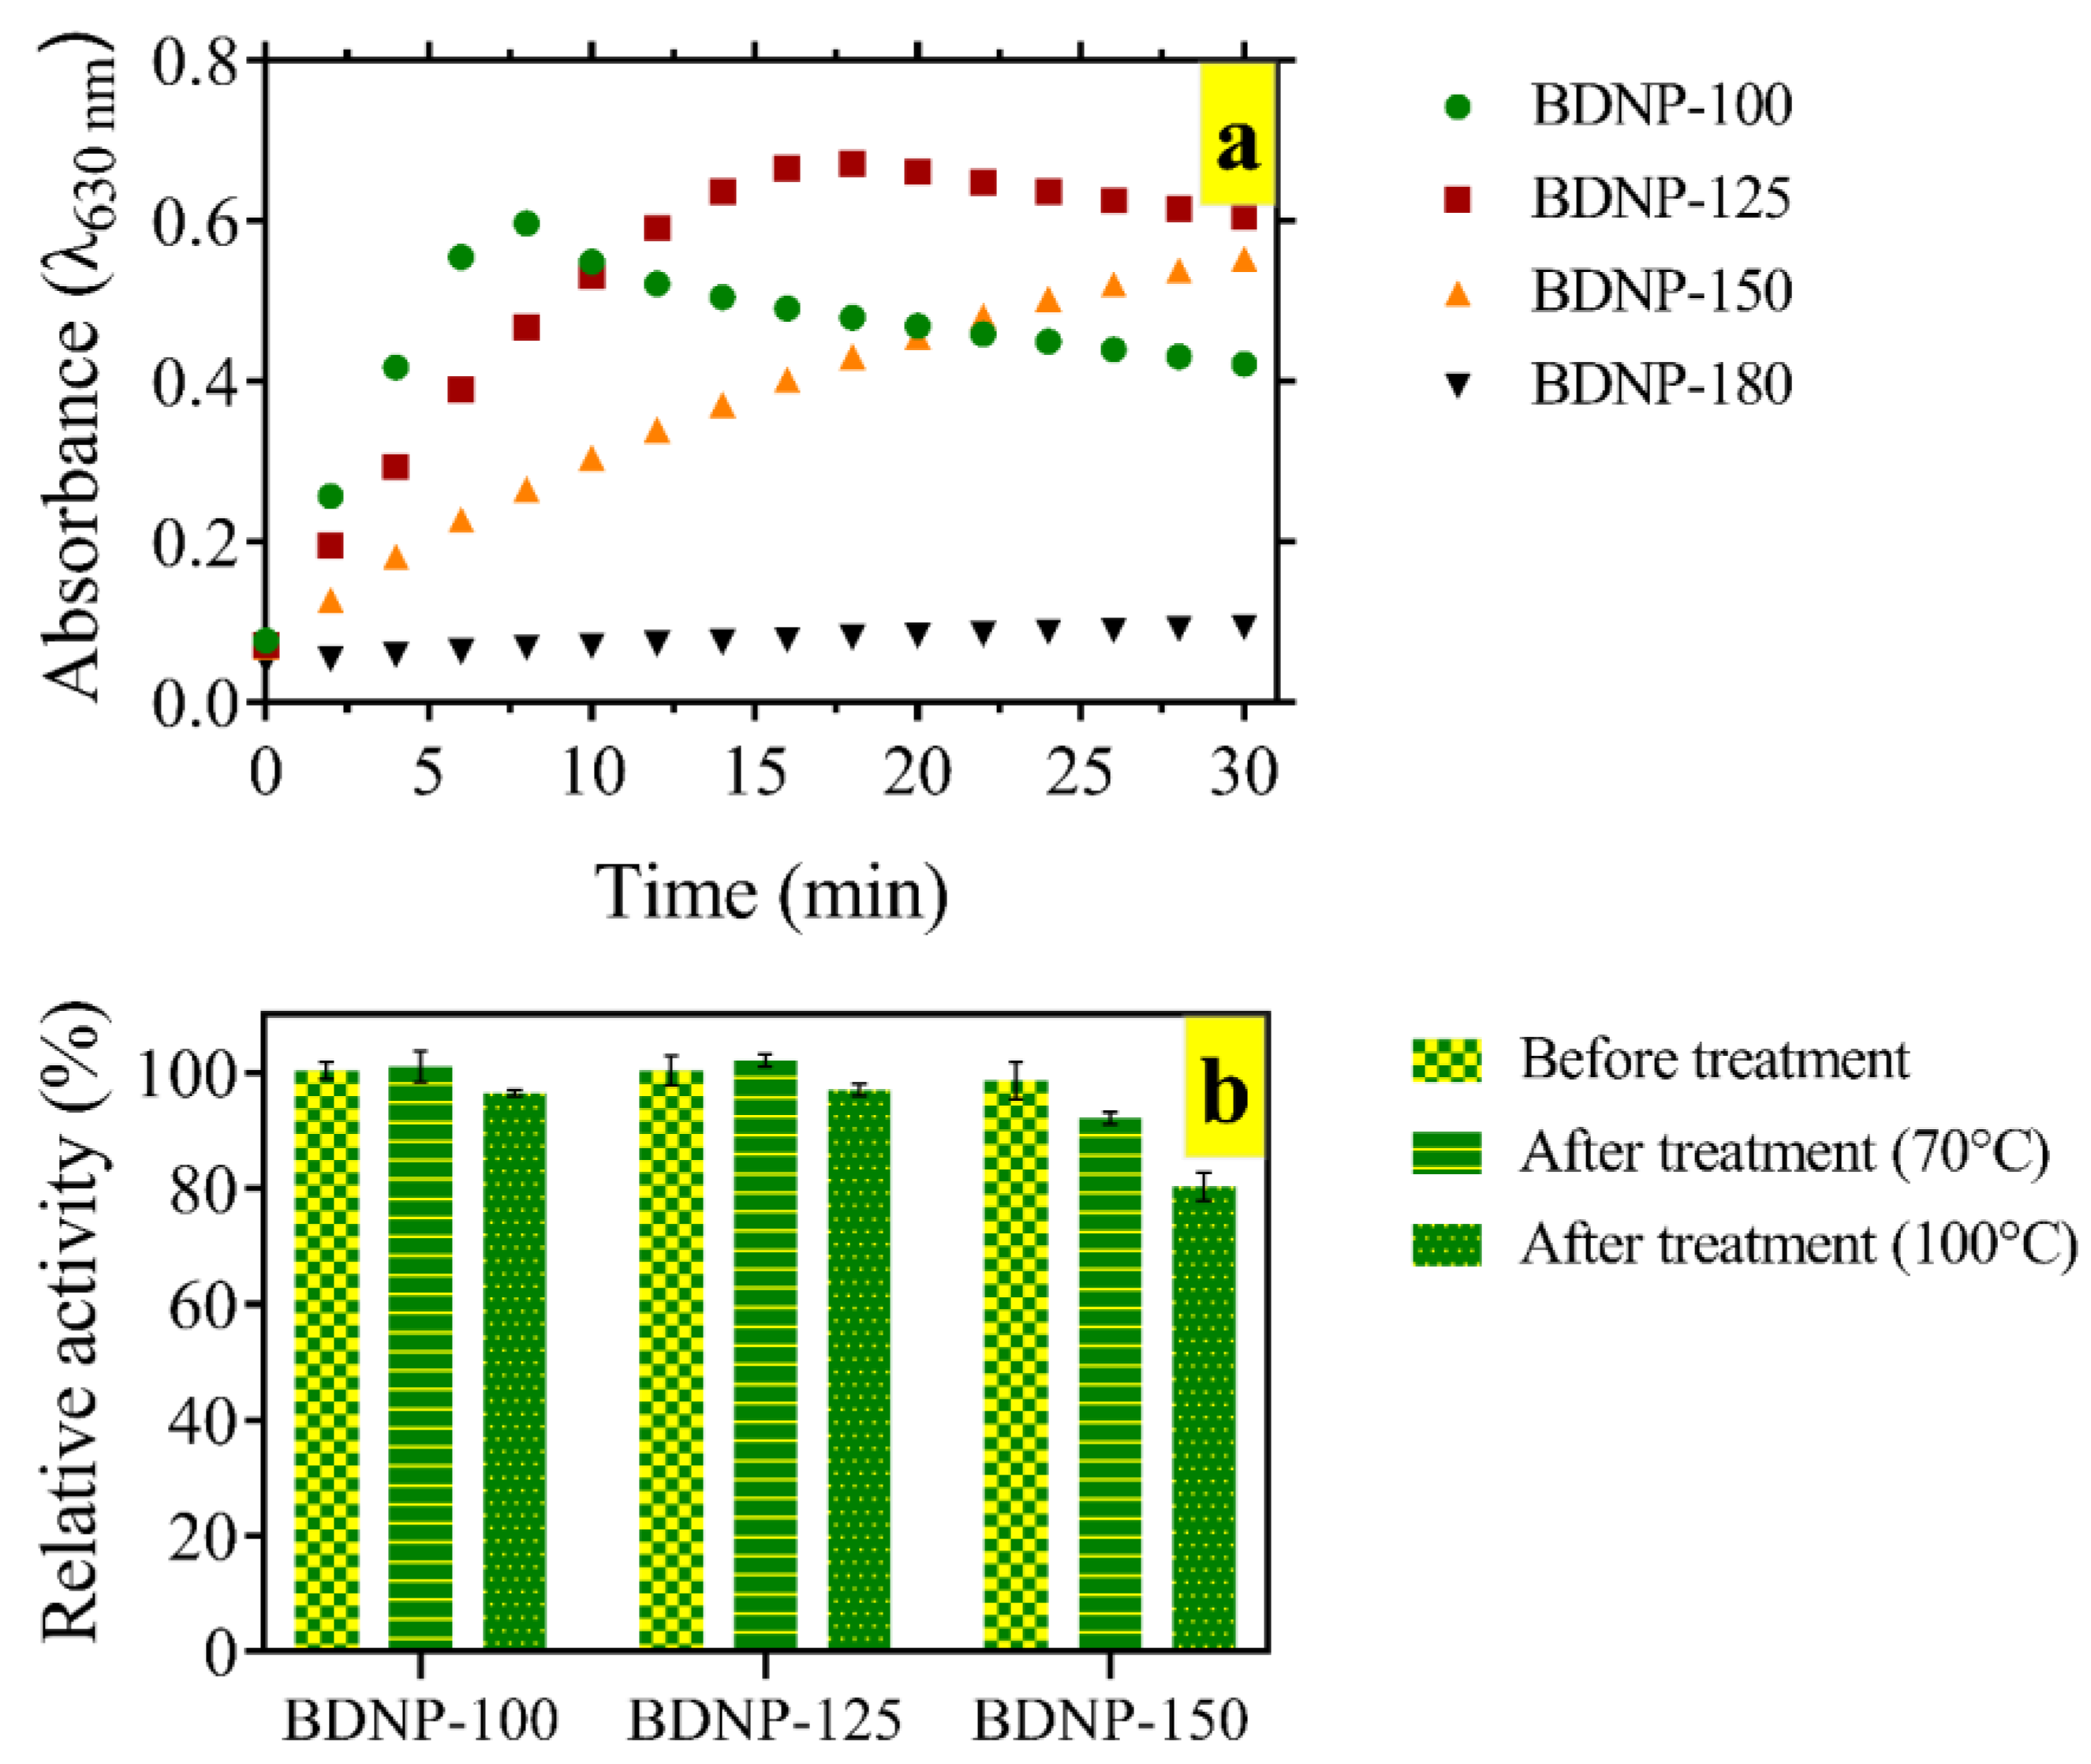
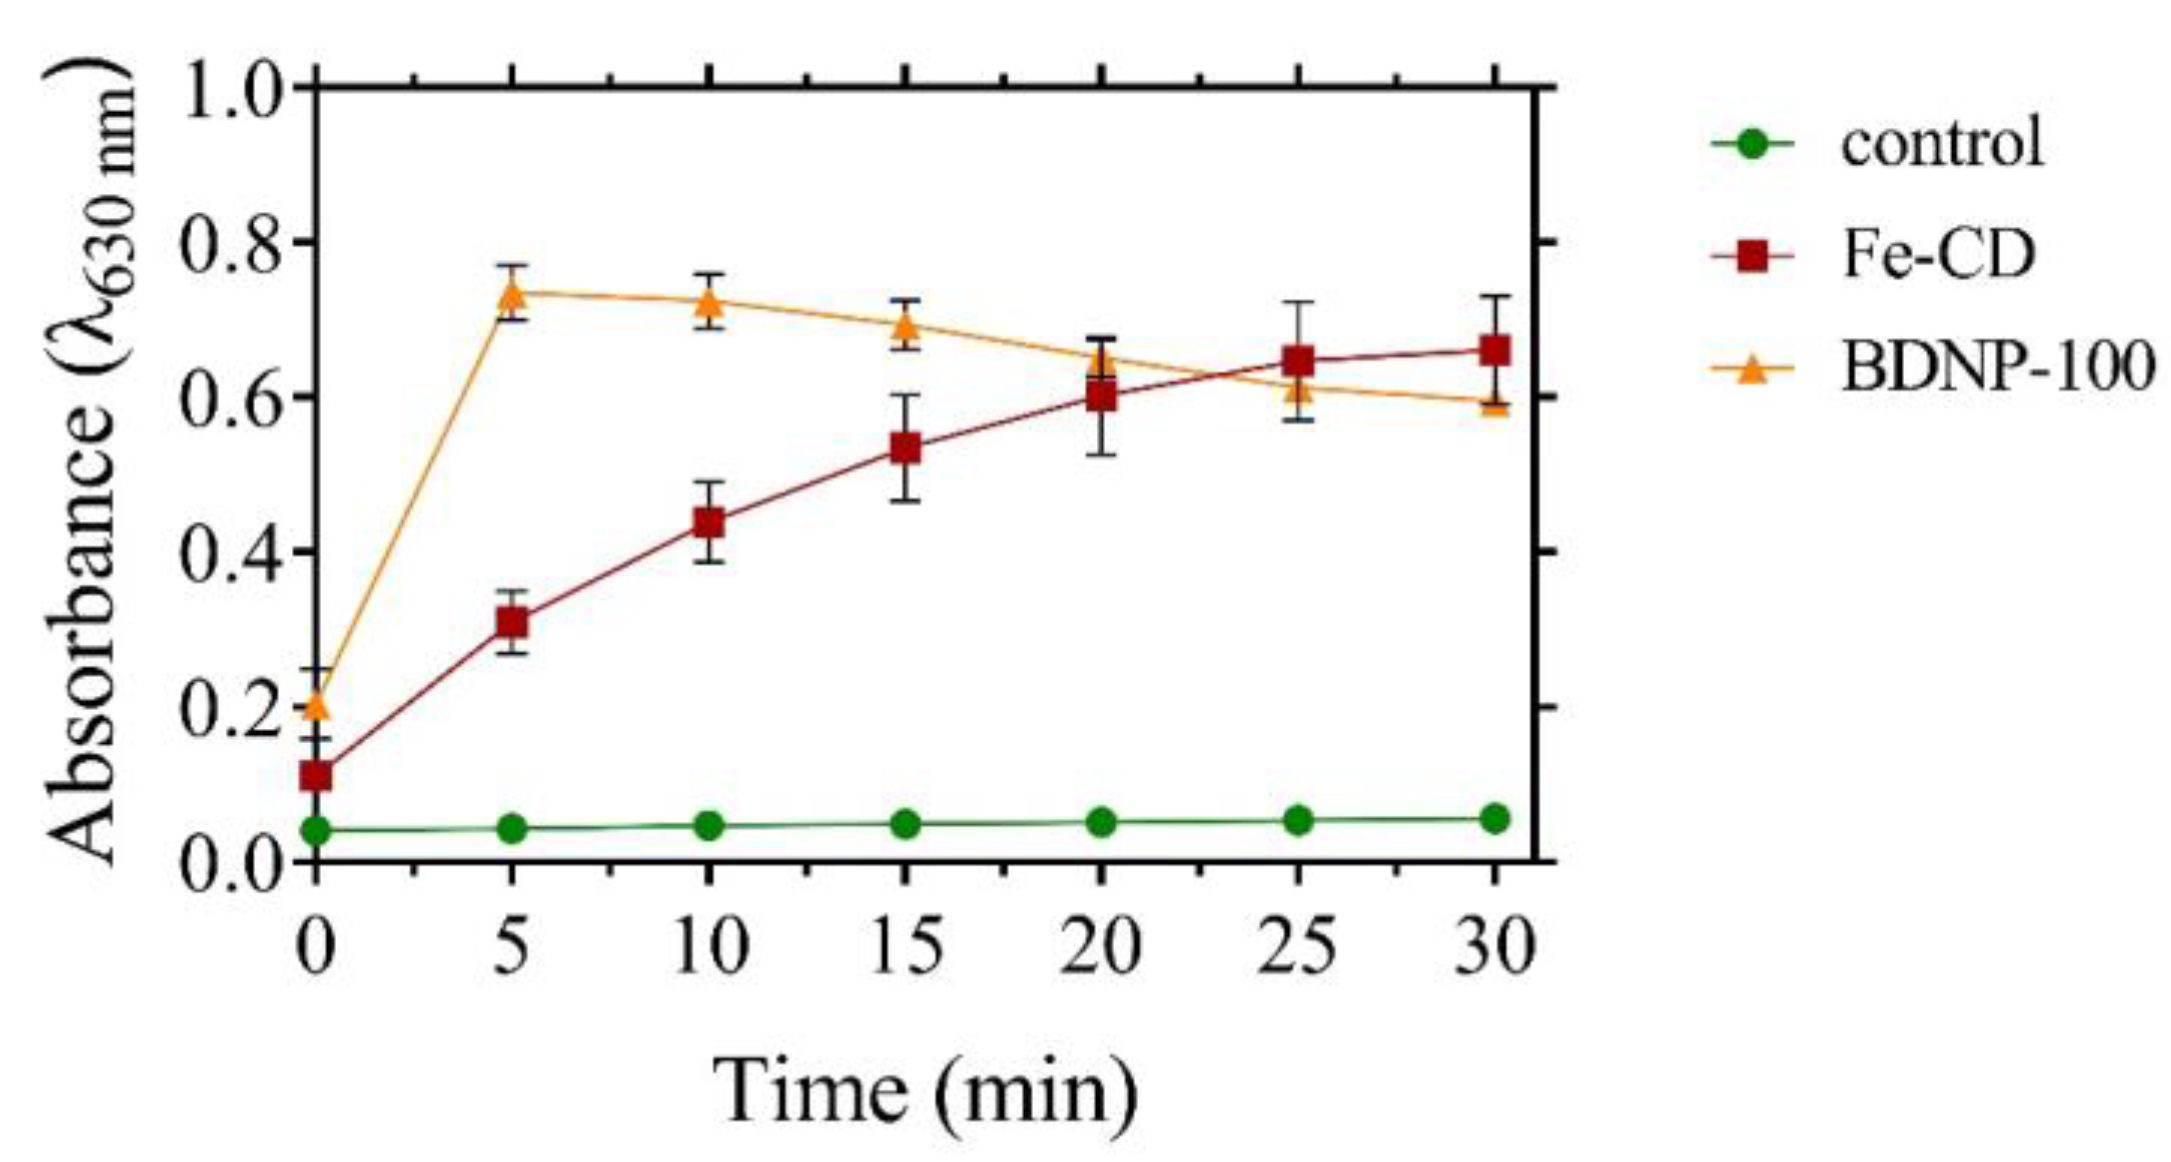
3.2. Catalytic Properties of BDNP Samples
3.3. Kinetic Study
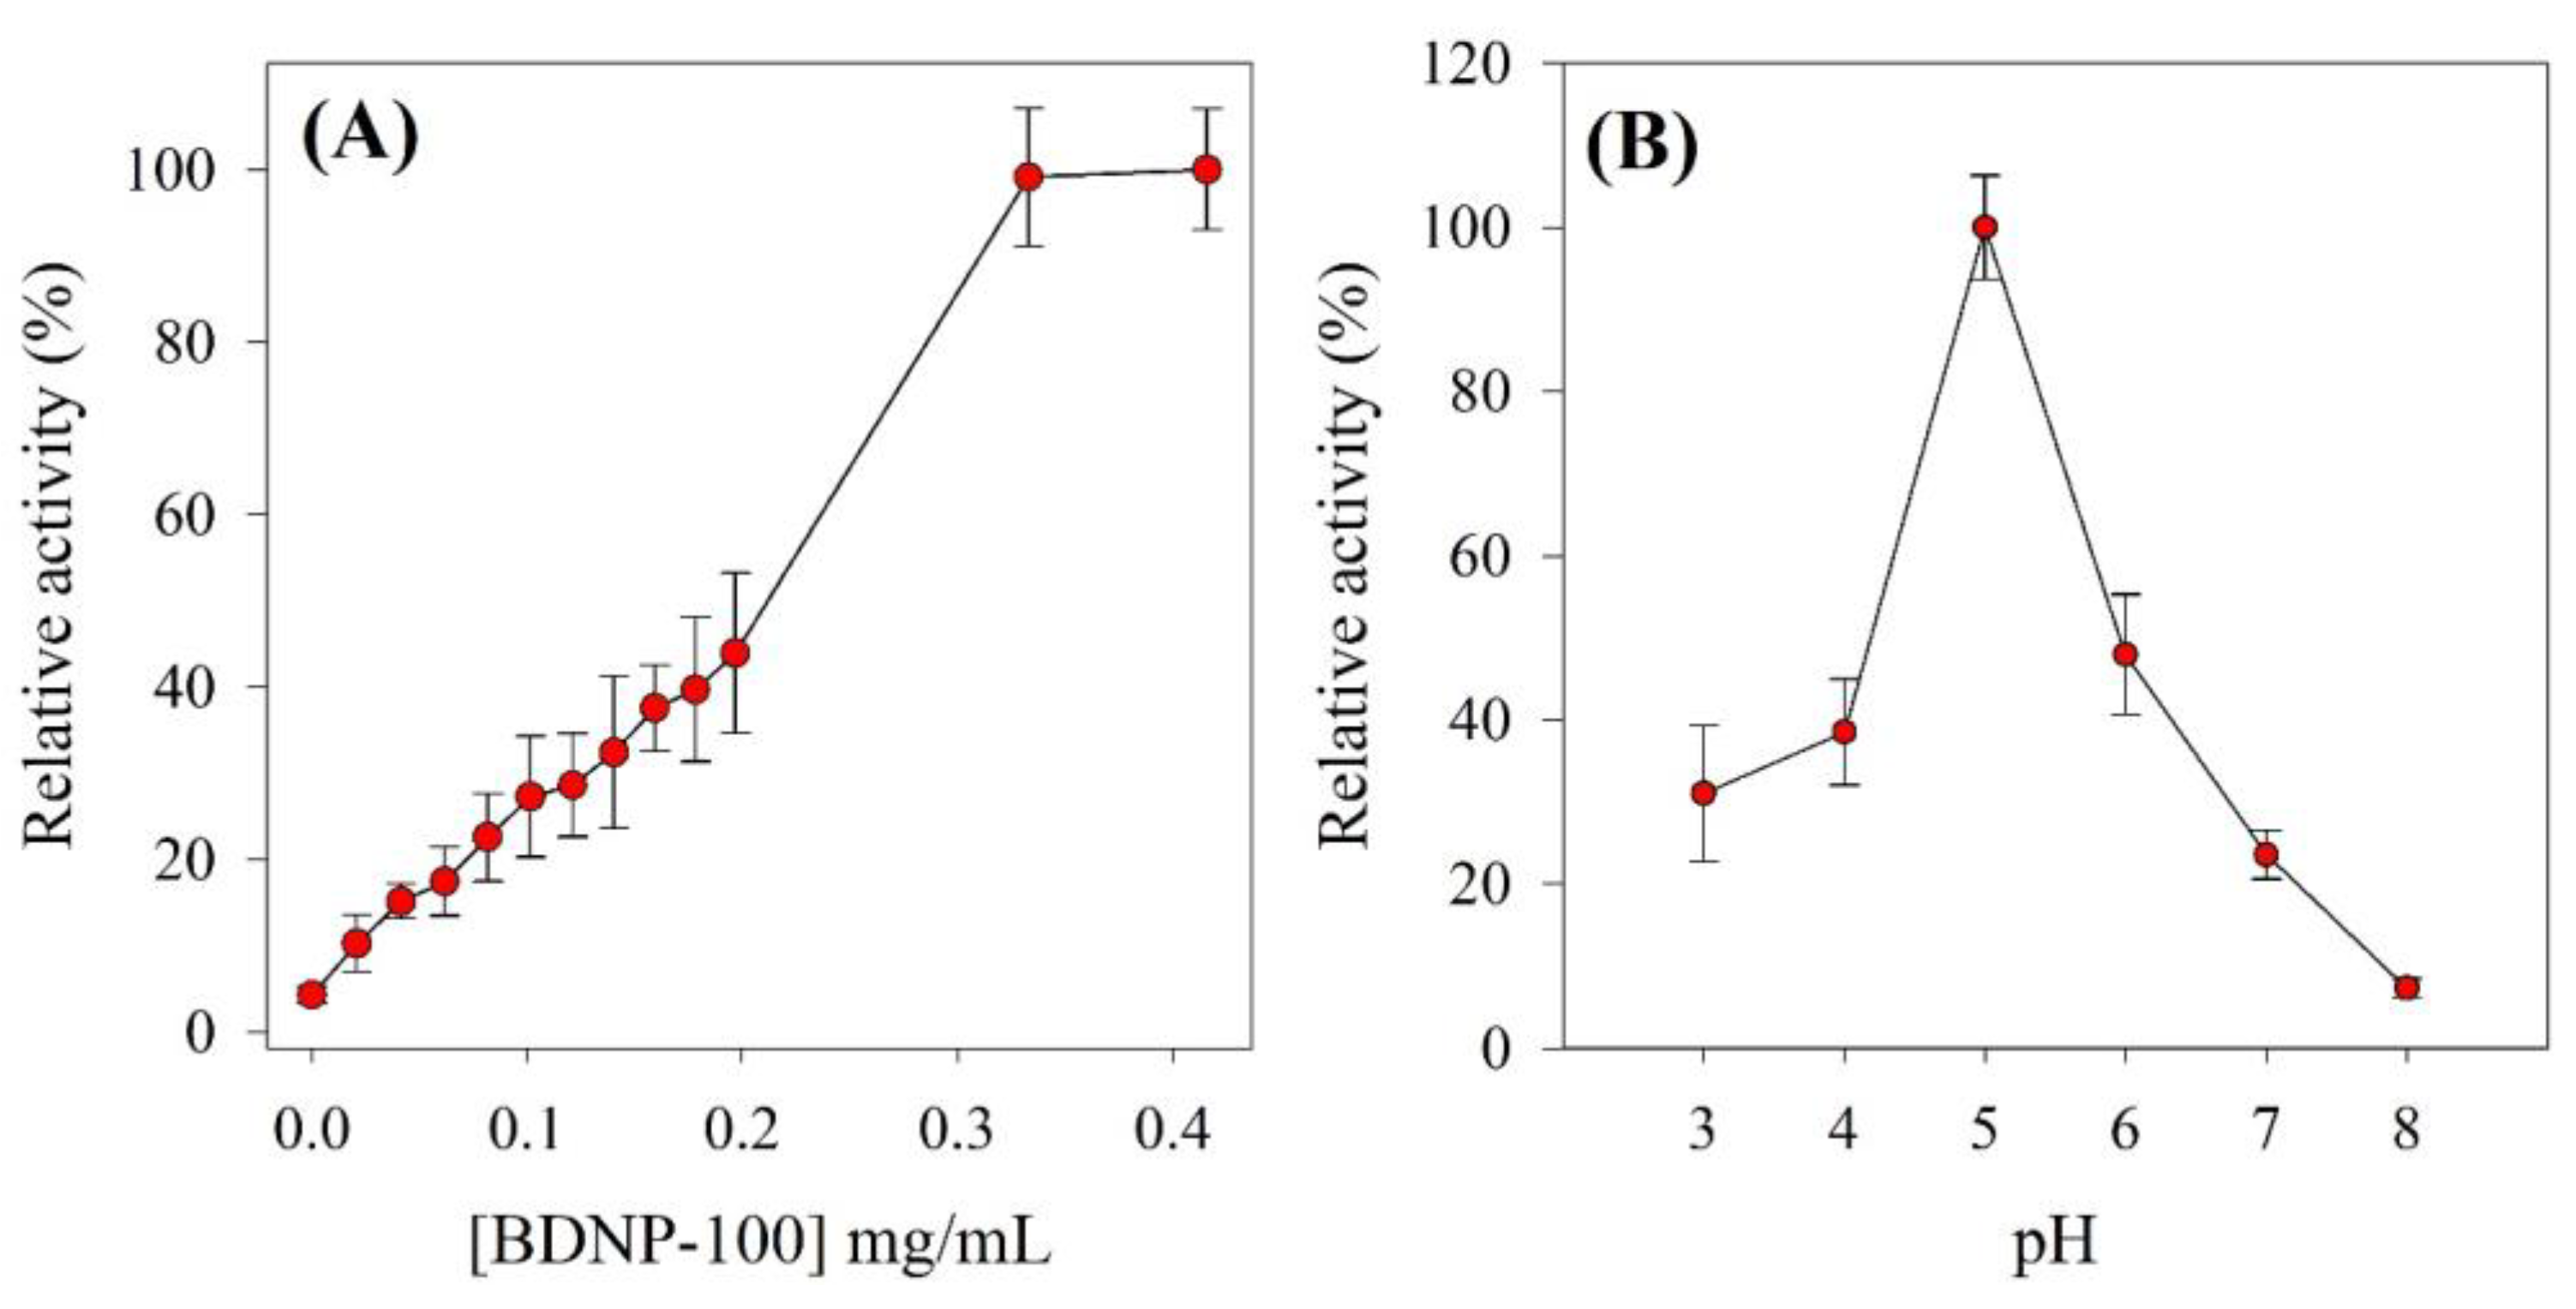
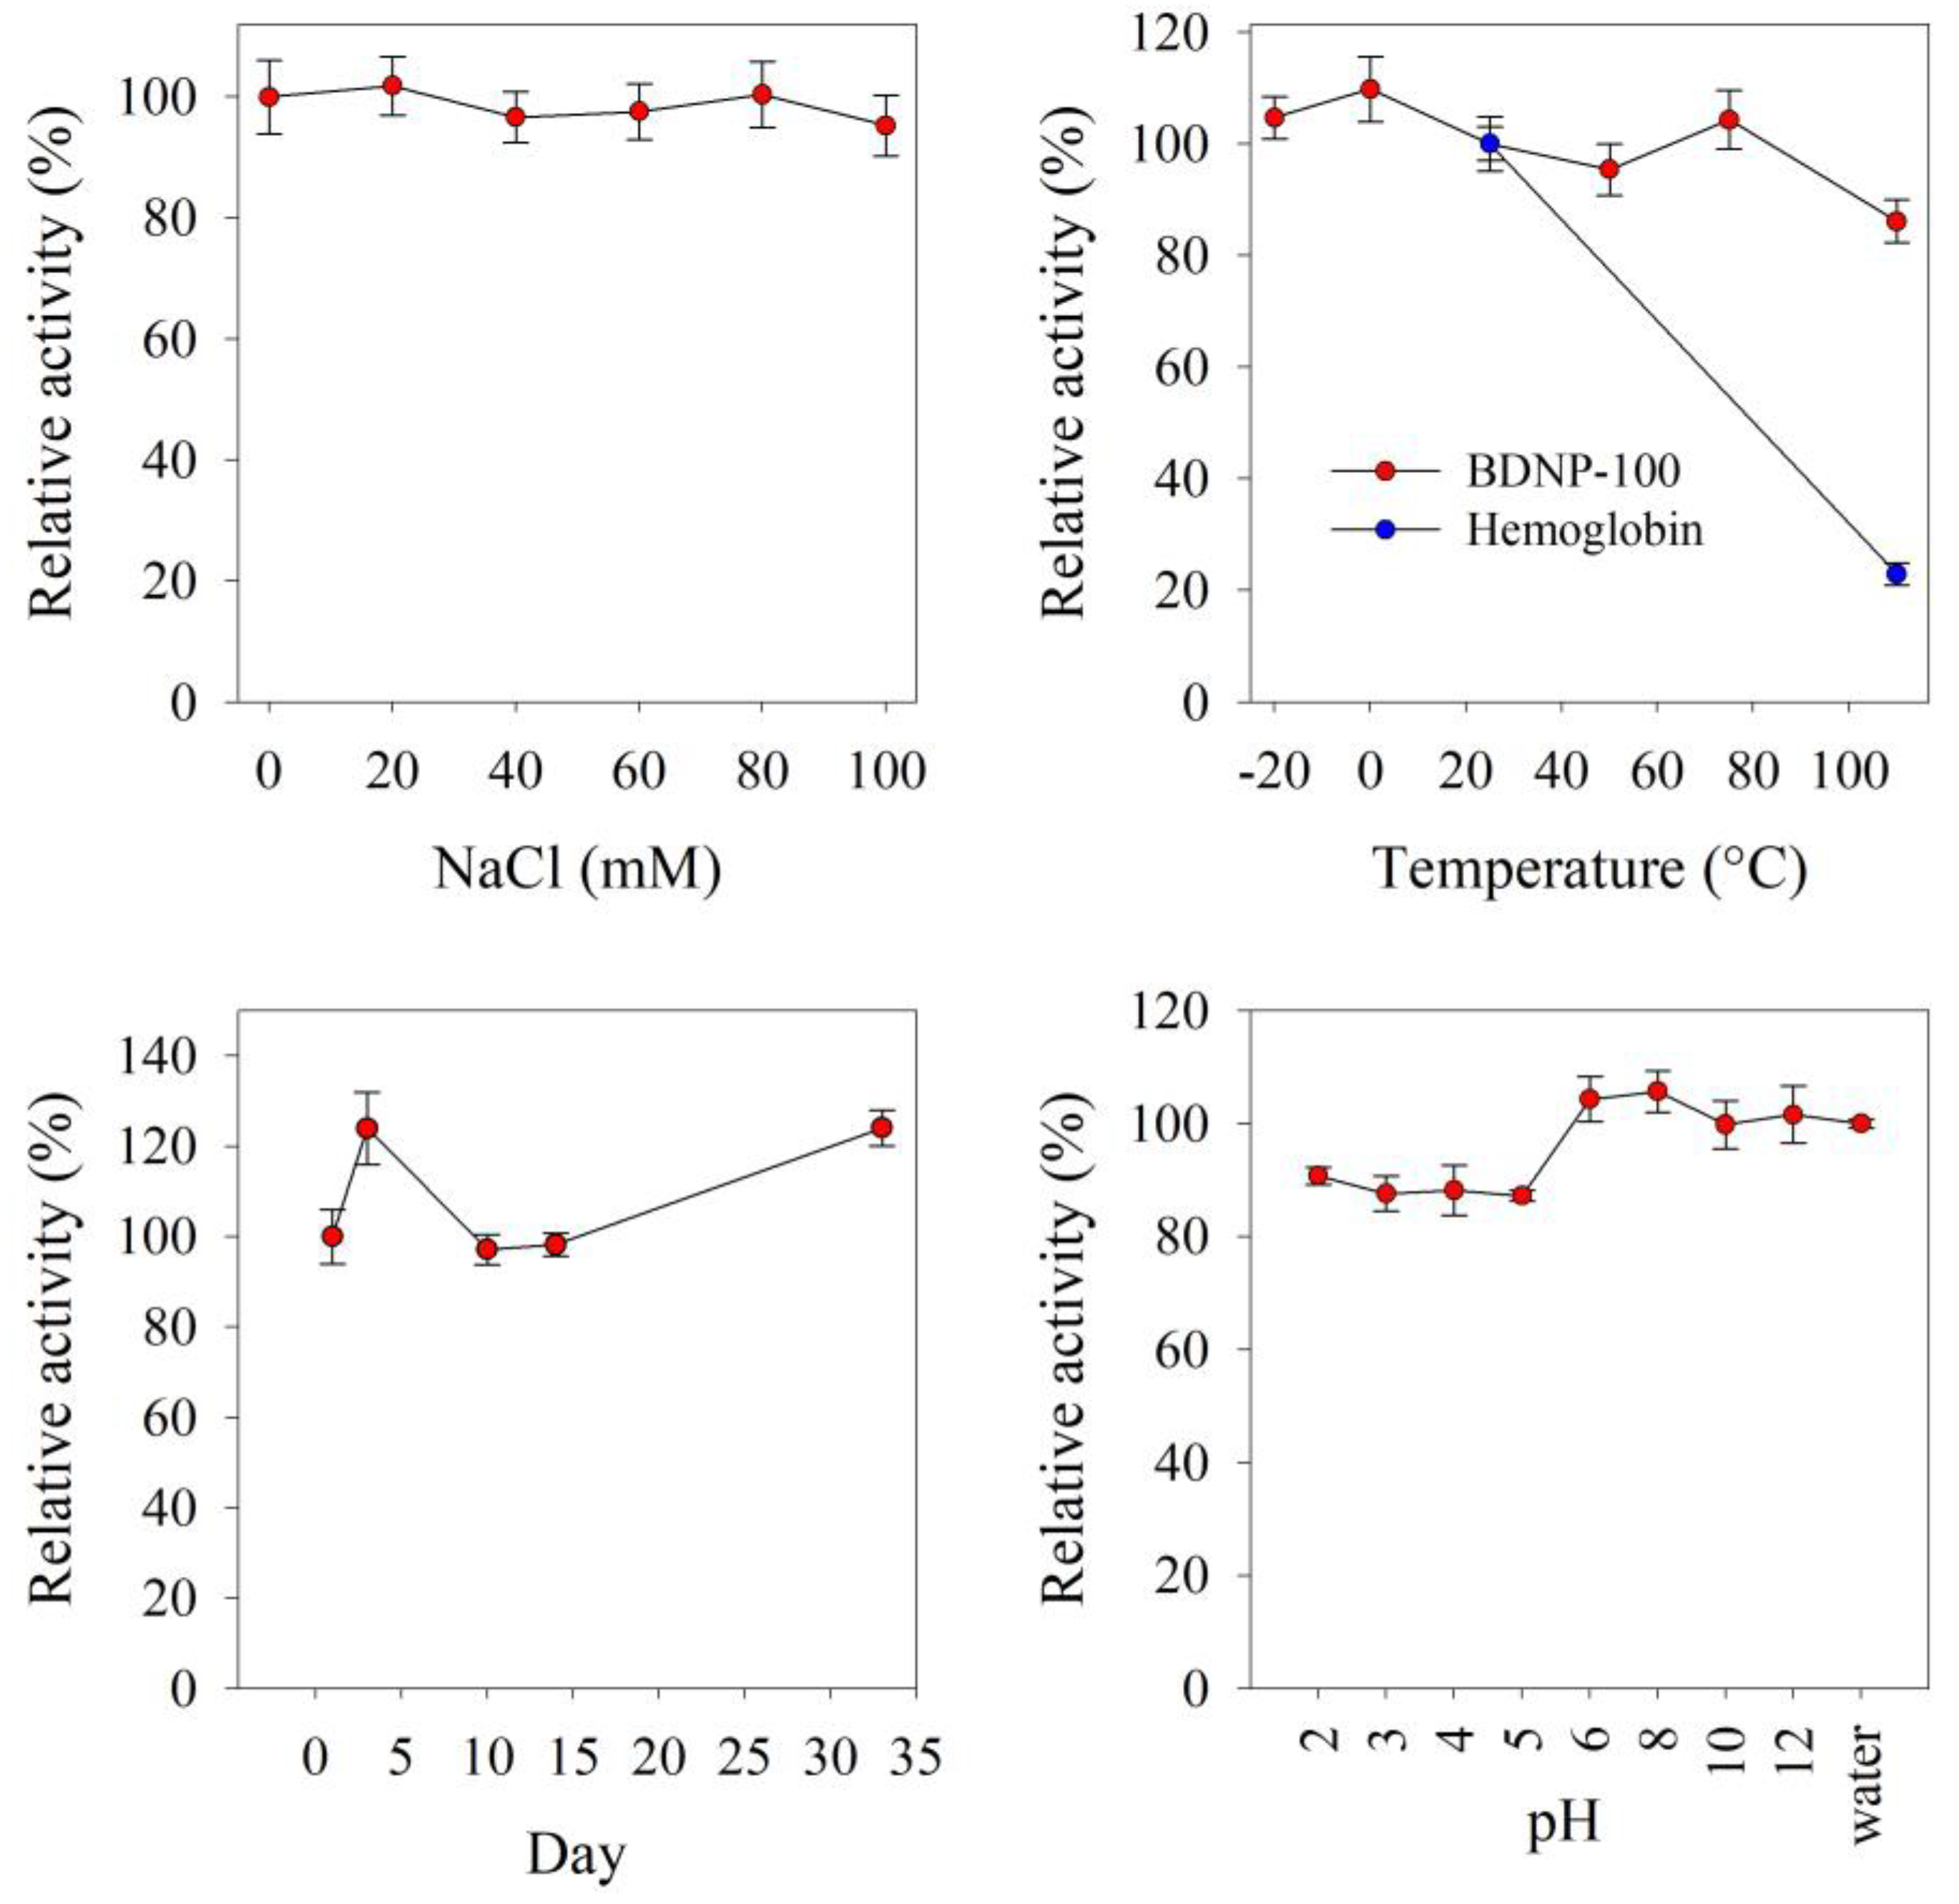
3.4. Optimization and Robustness Evaluation
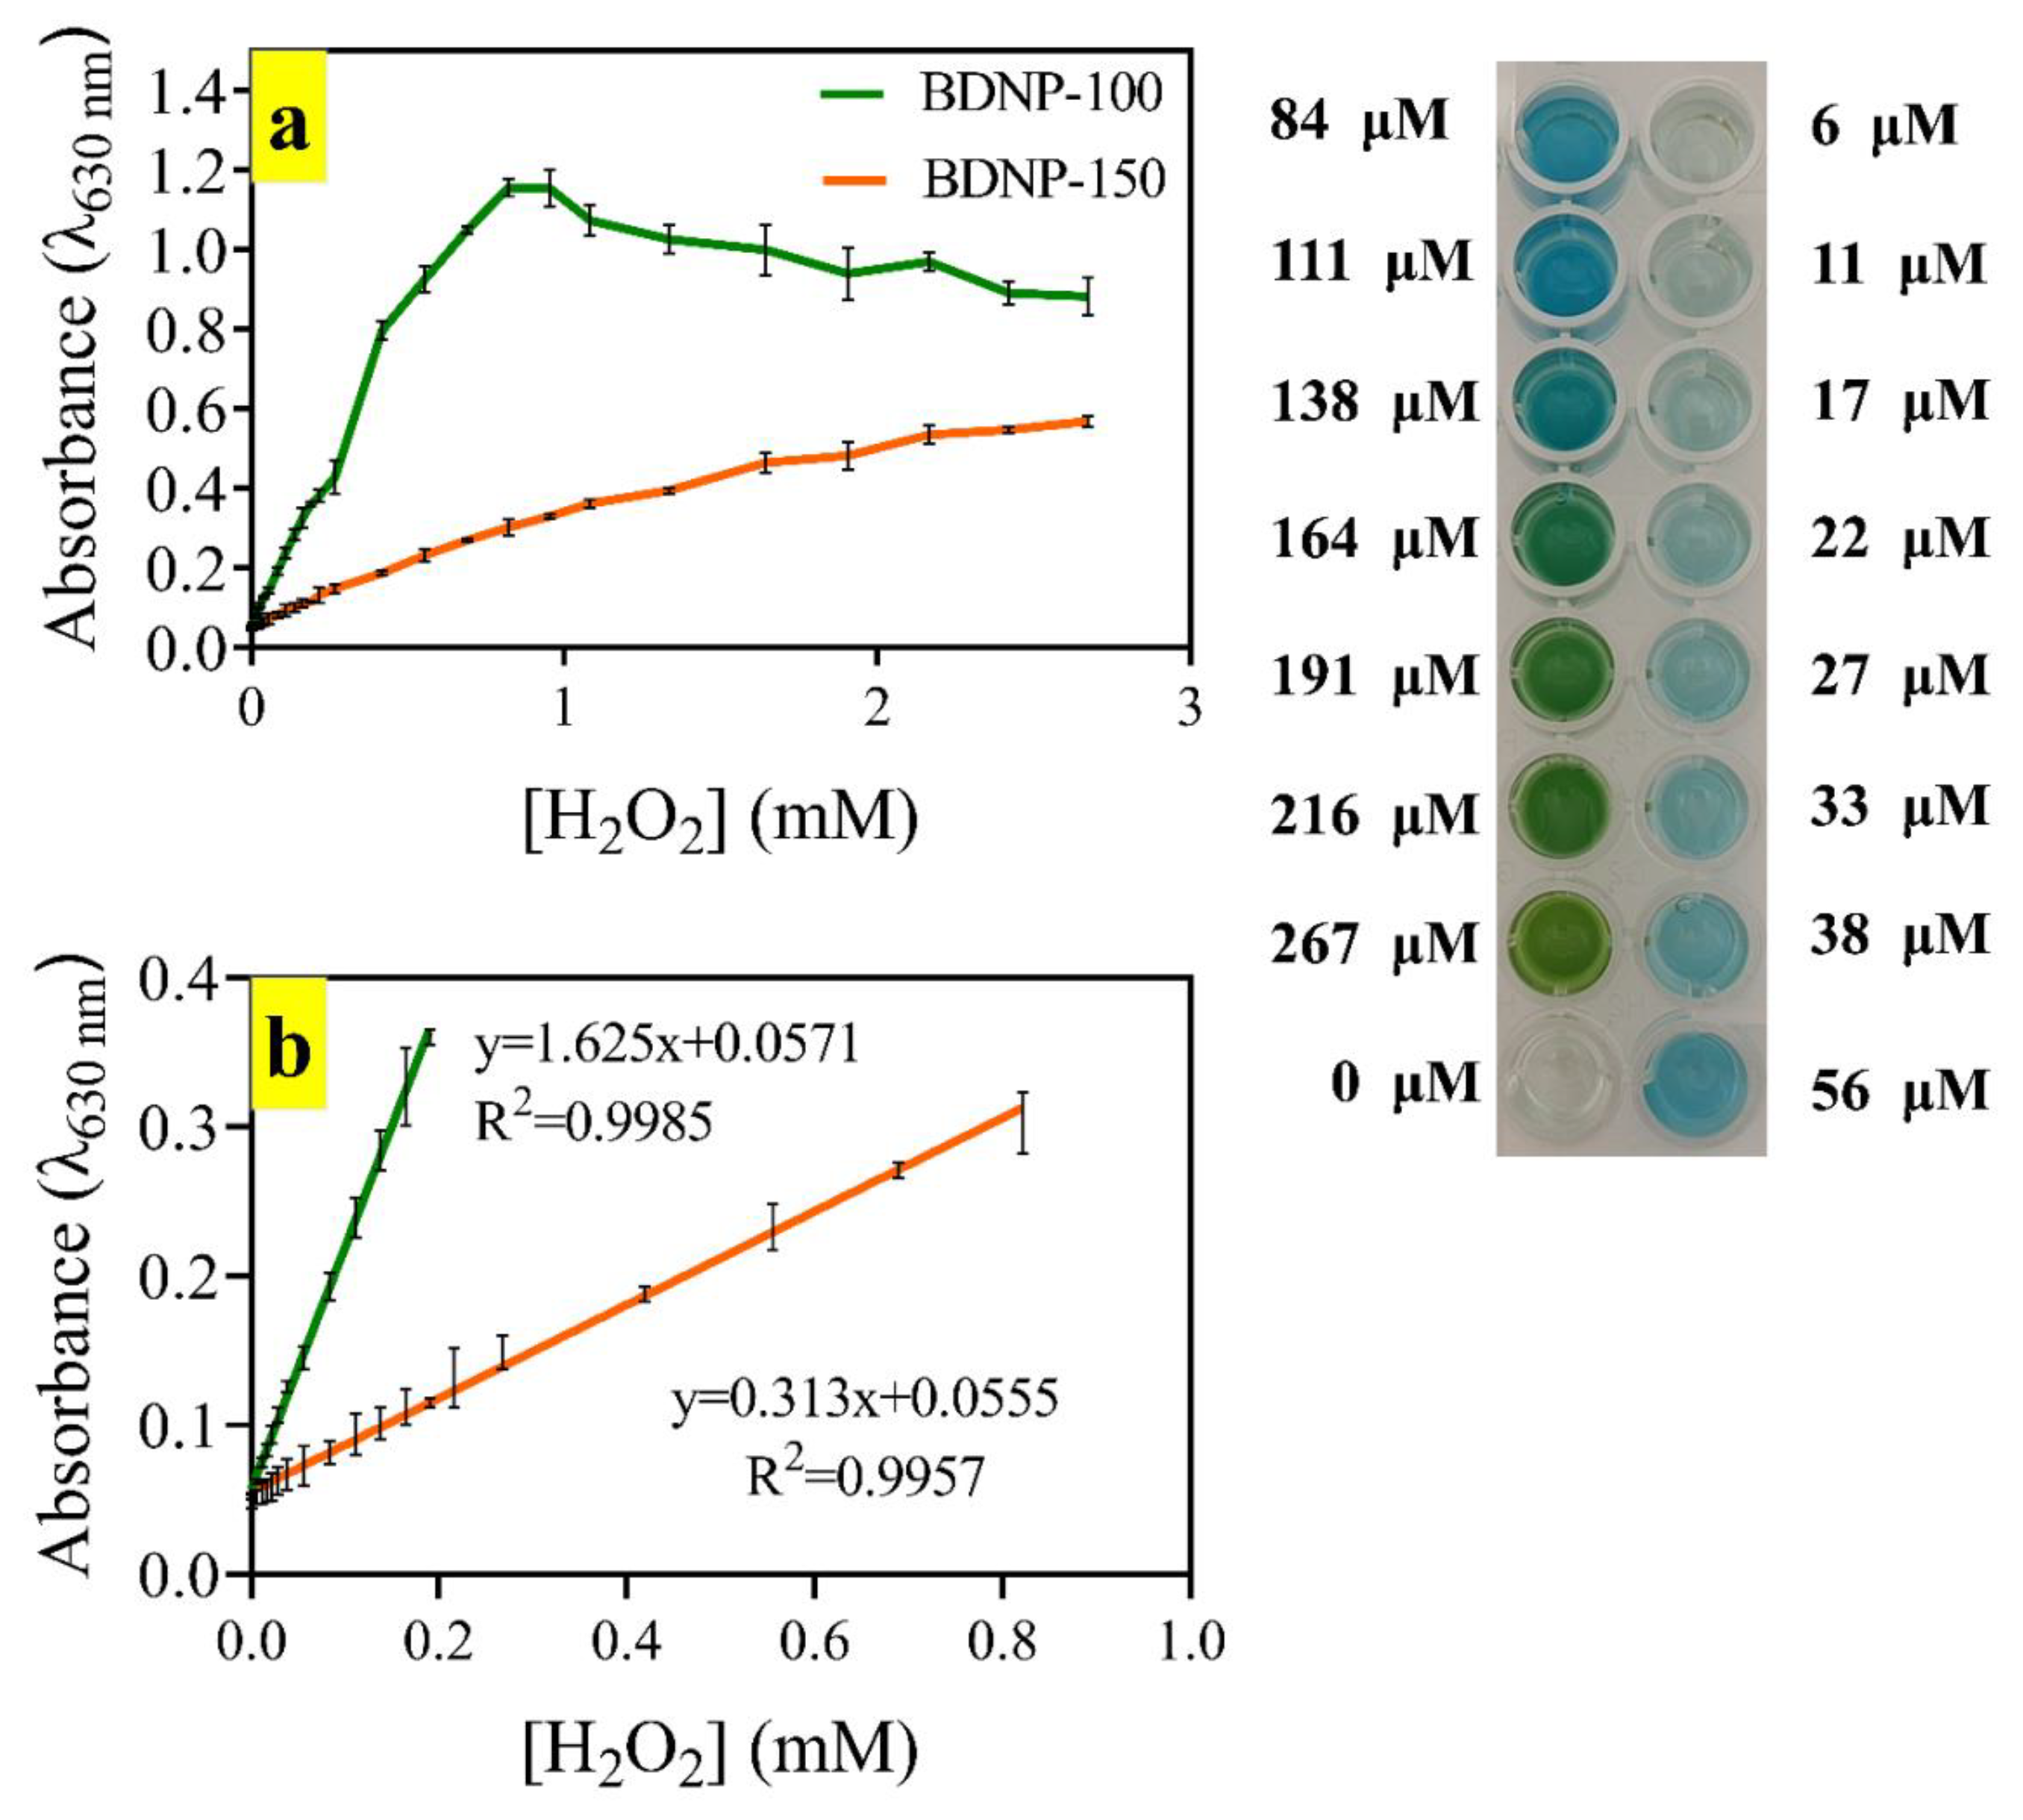
3.5. H2O2 Assay
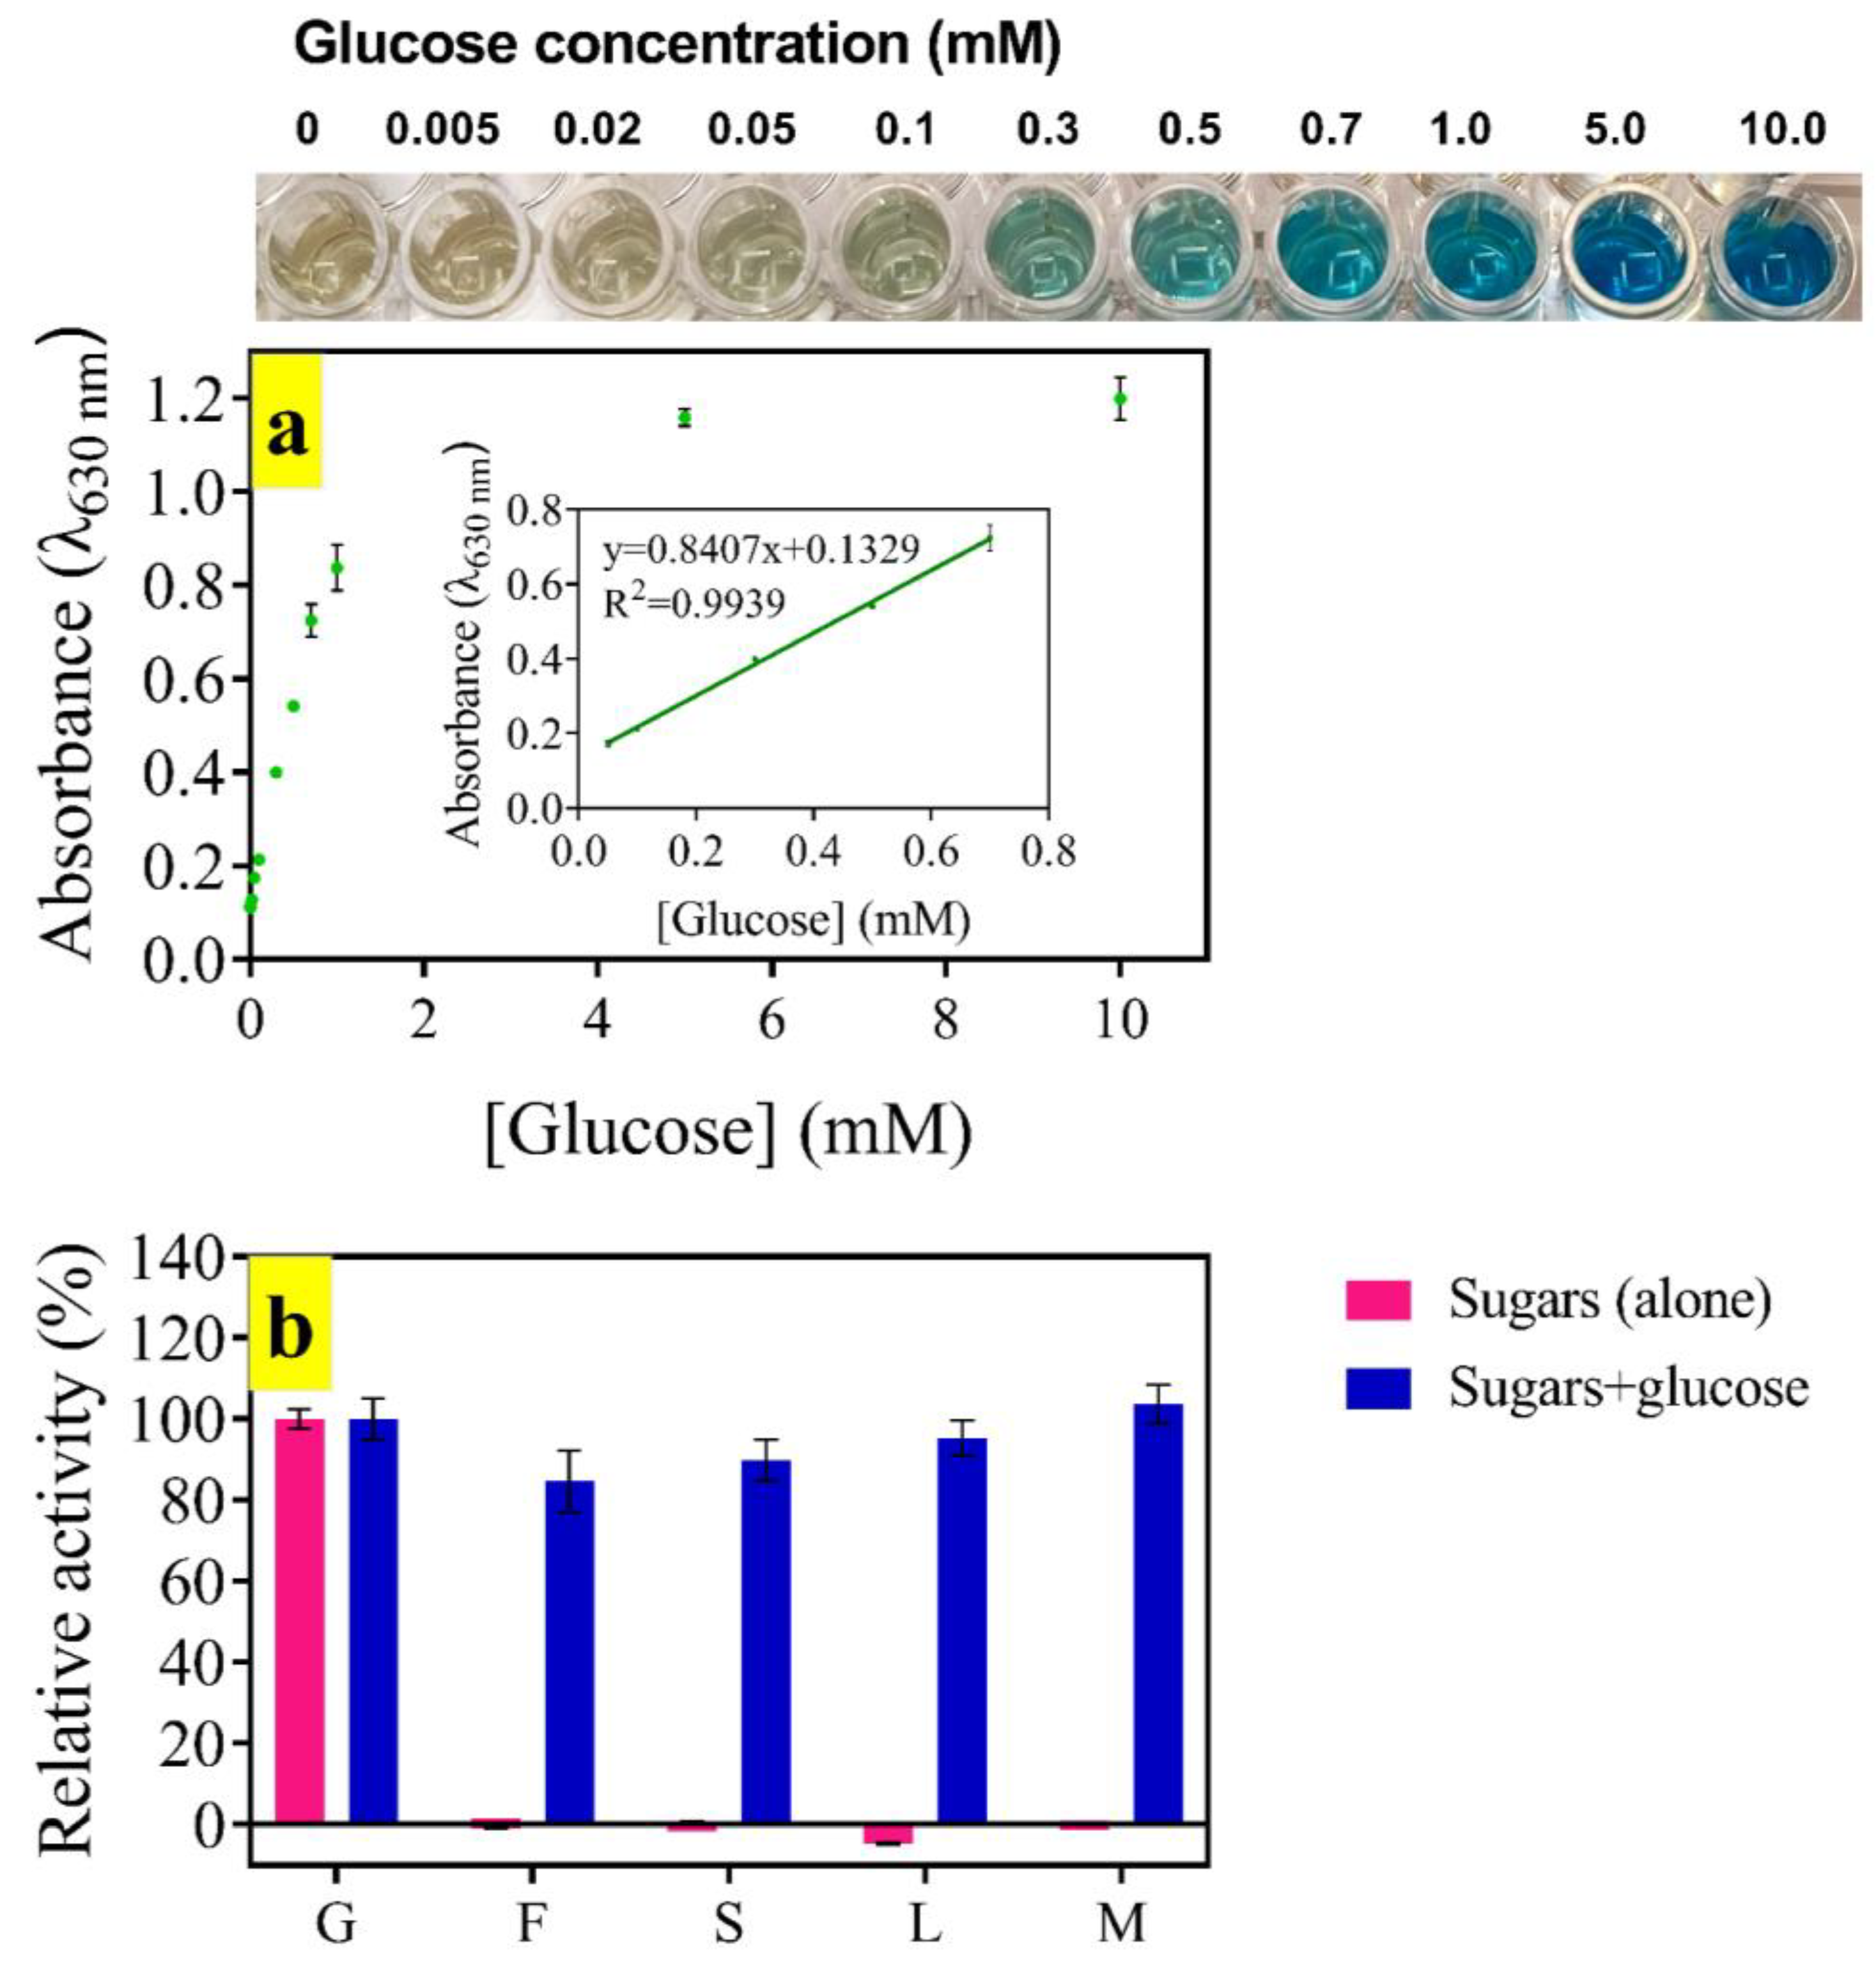
3.6. Glucose Assay
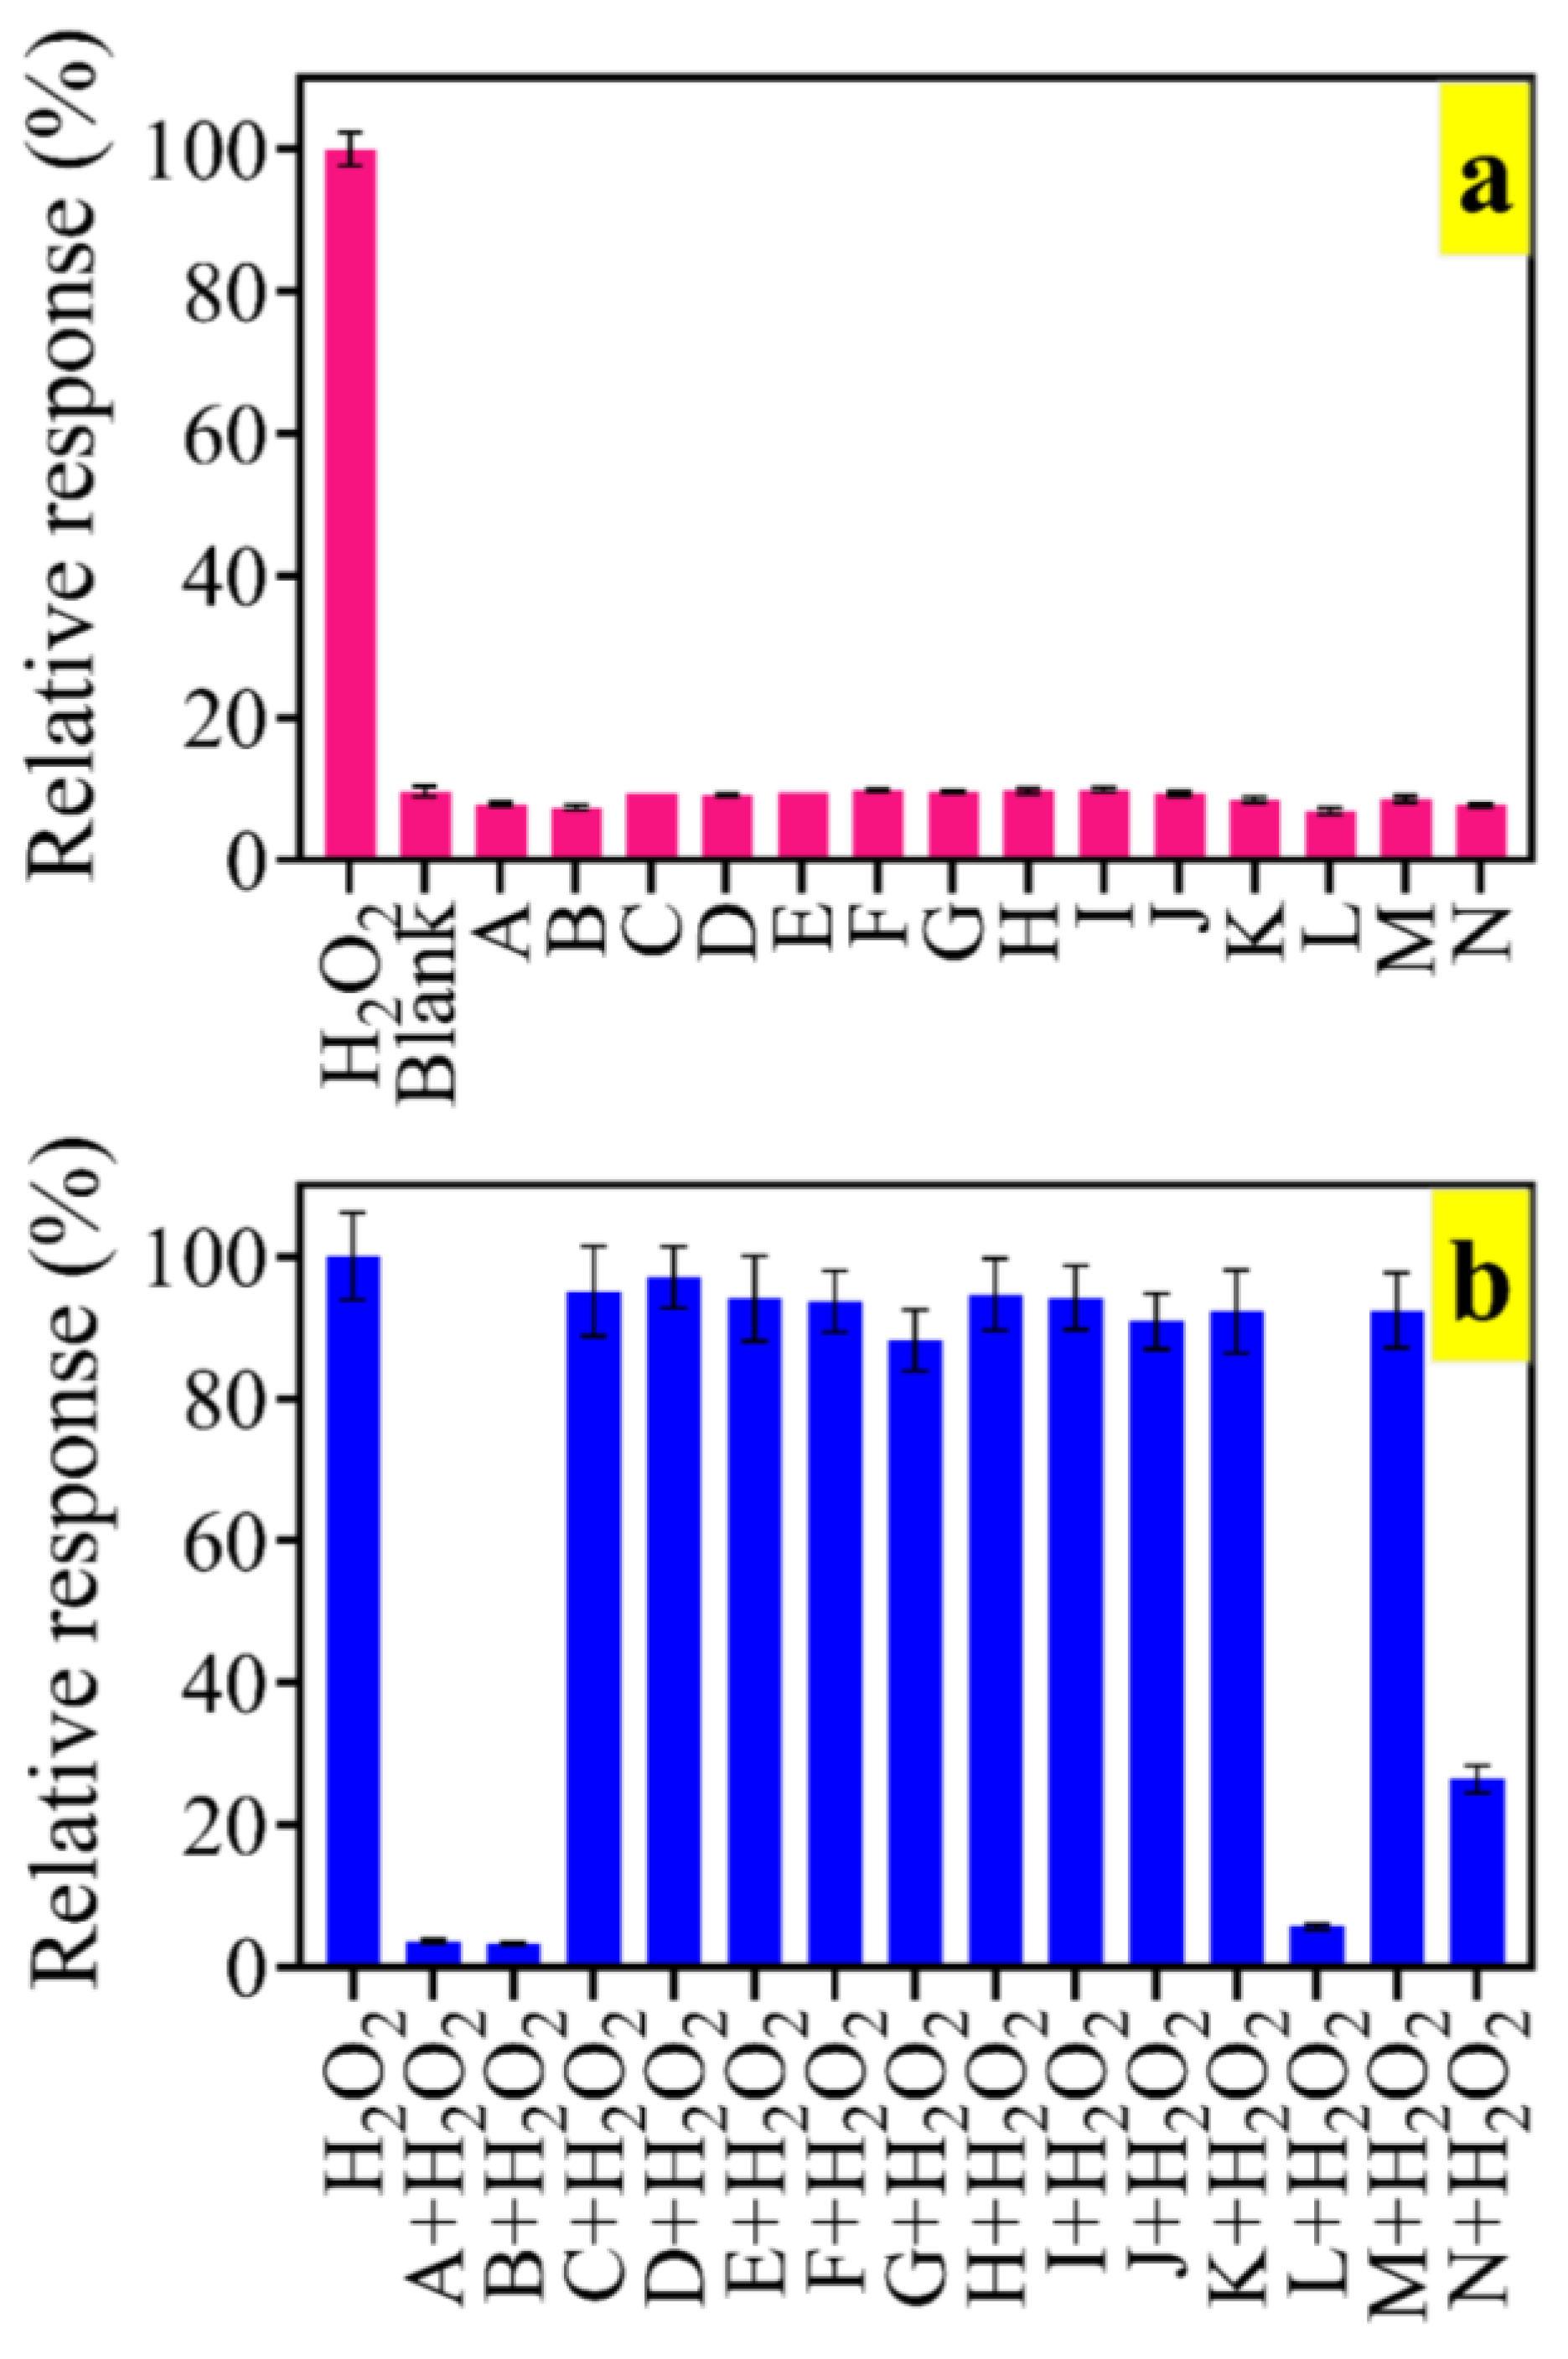
3.7. Real Sample Analysis
3.8. Biological Characterization of BDNP-100
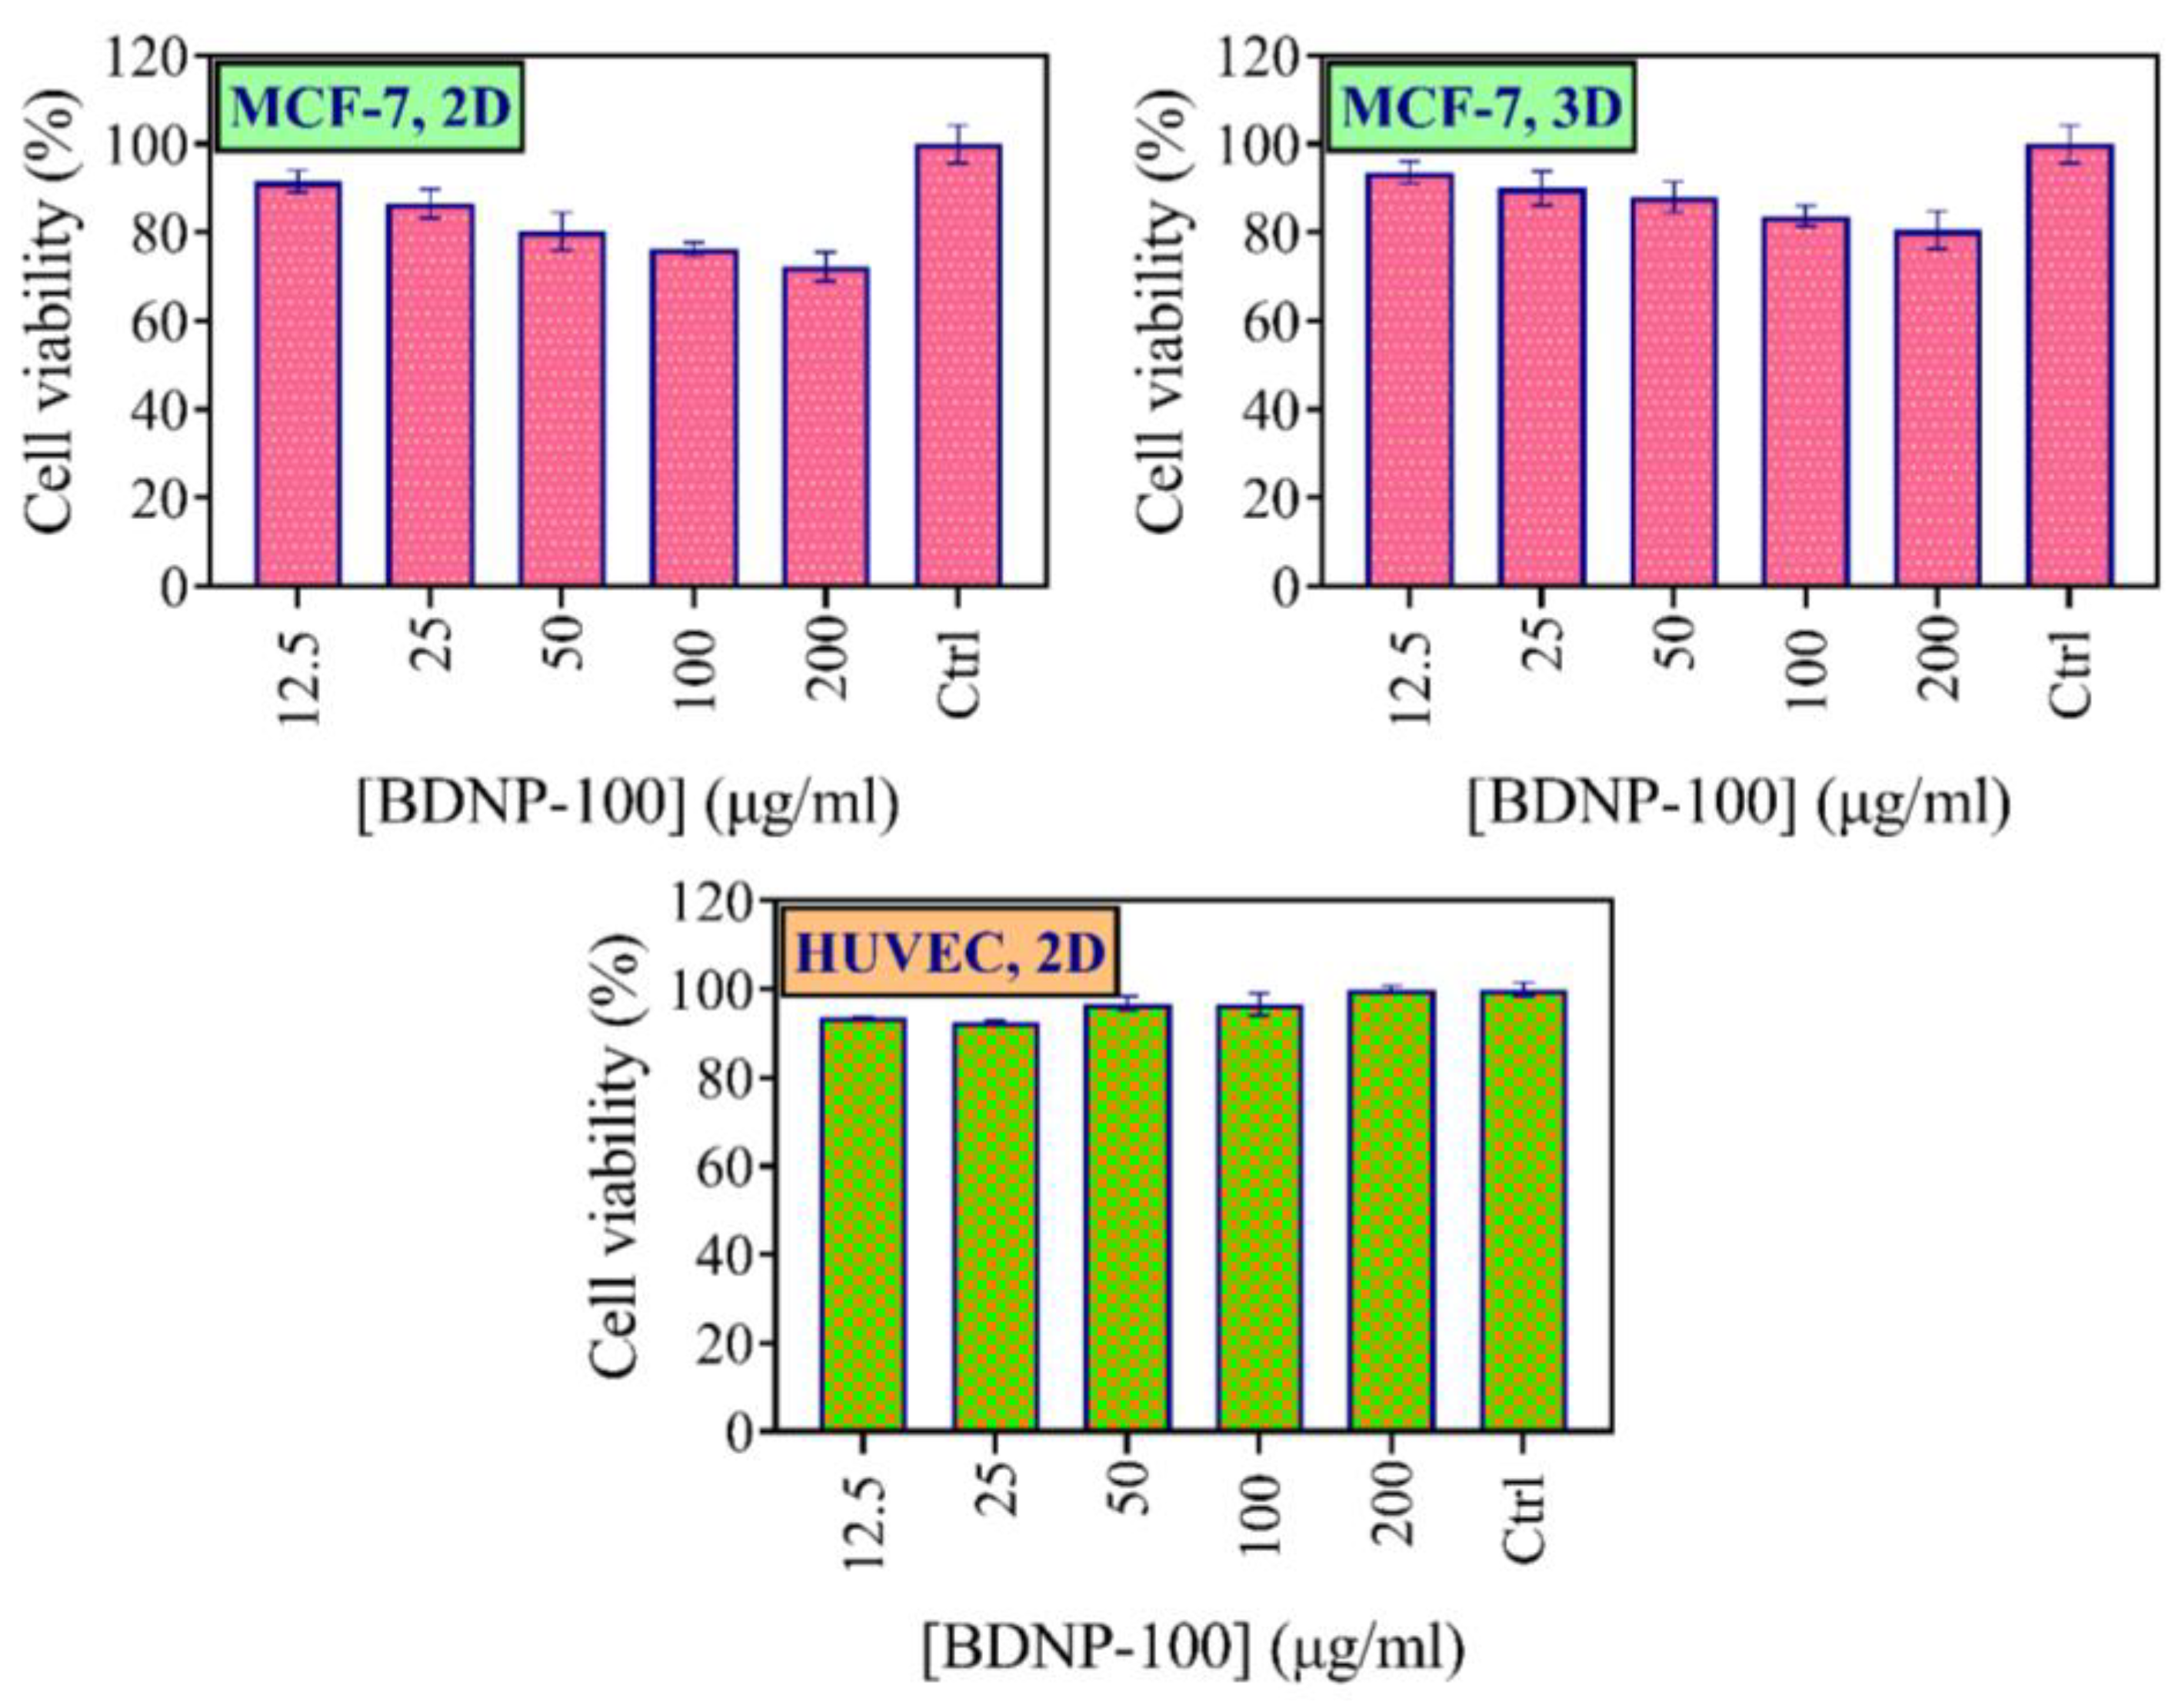
3.8.1. MTT
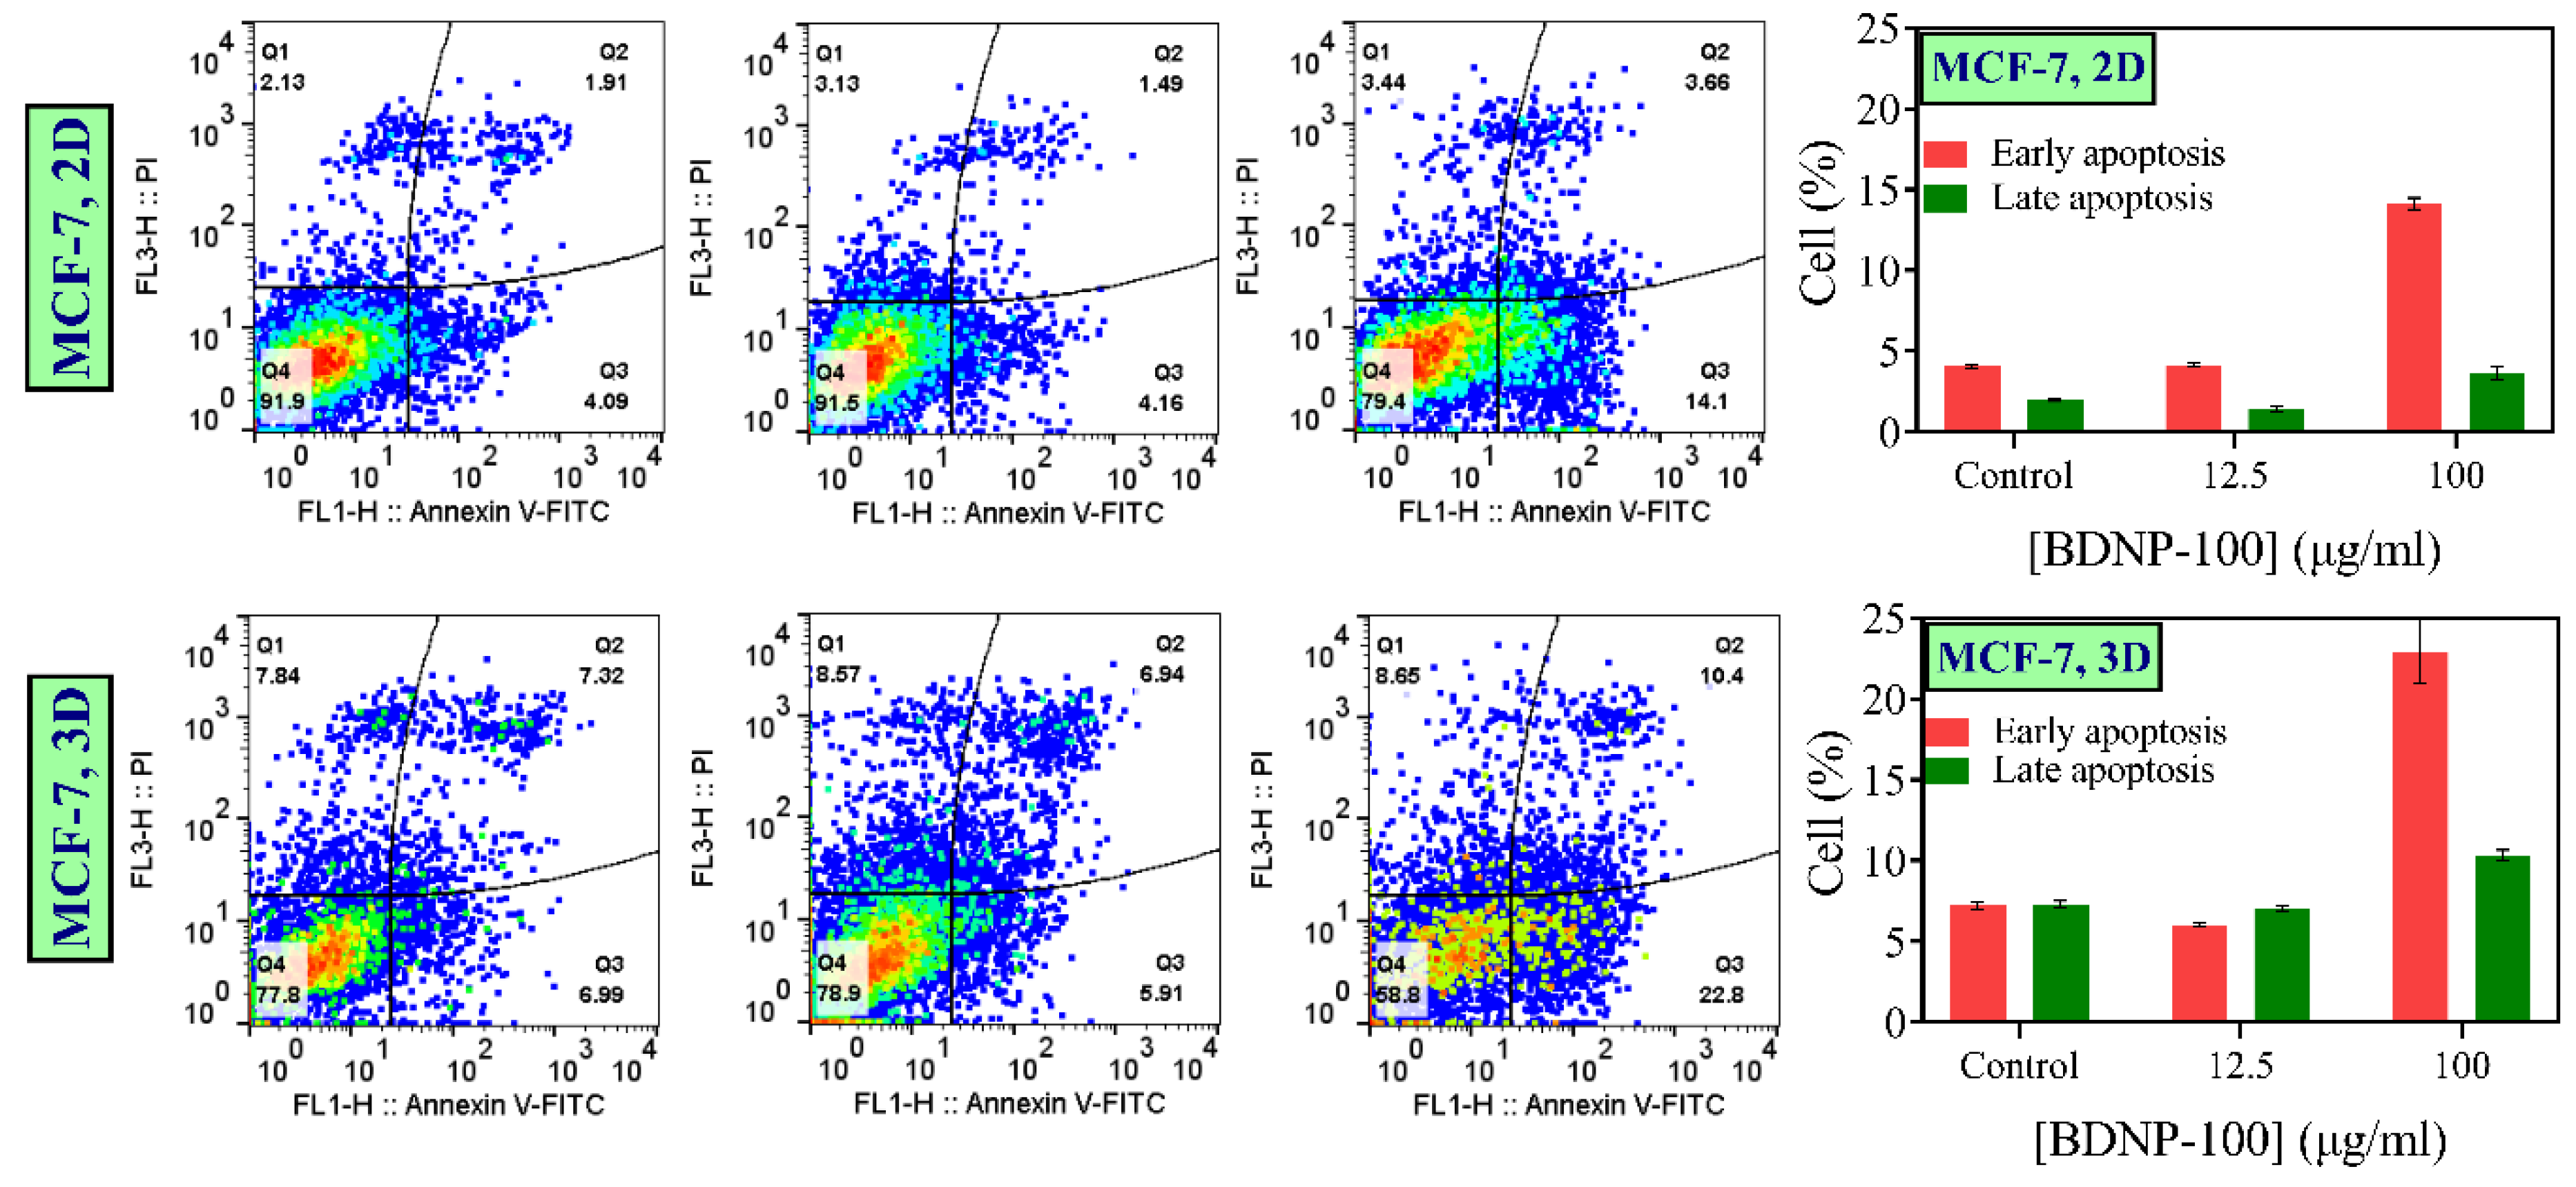
3.8.2. Apoptosis
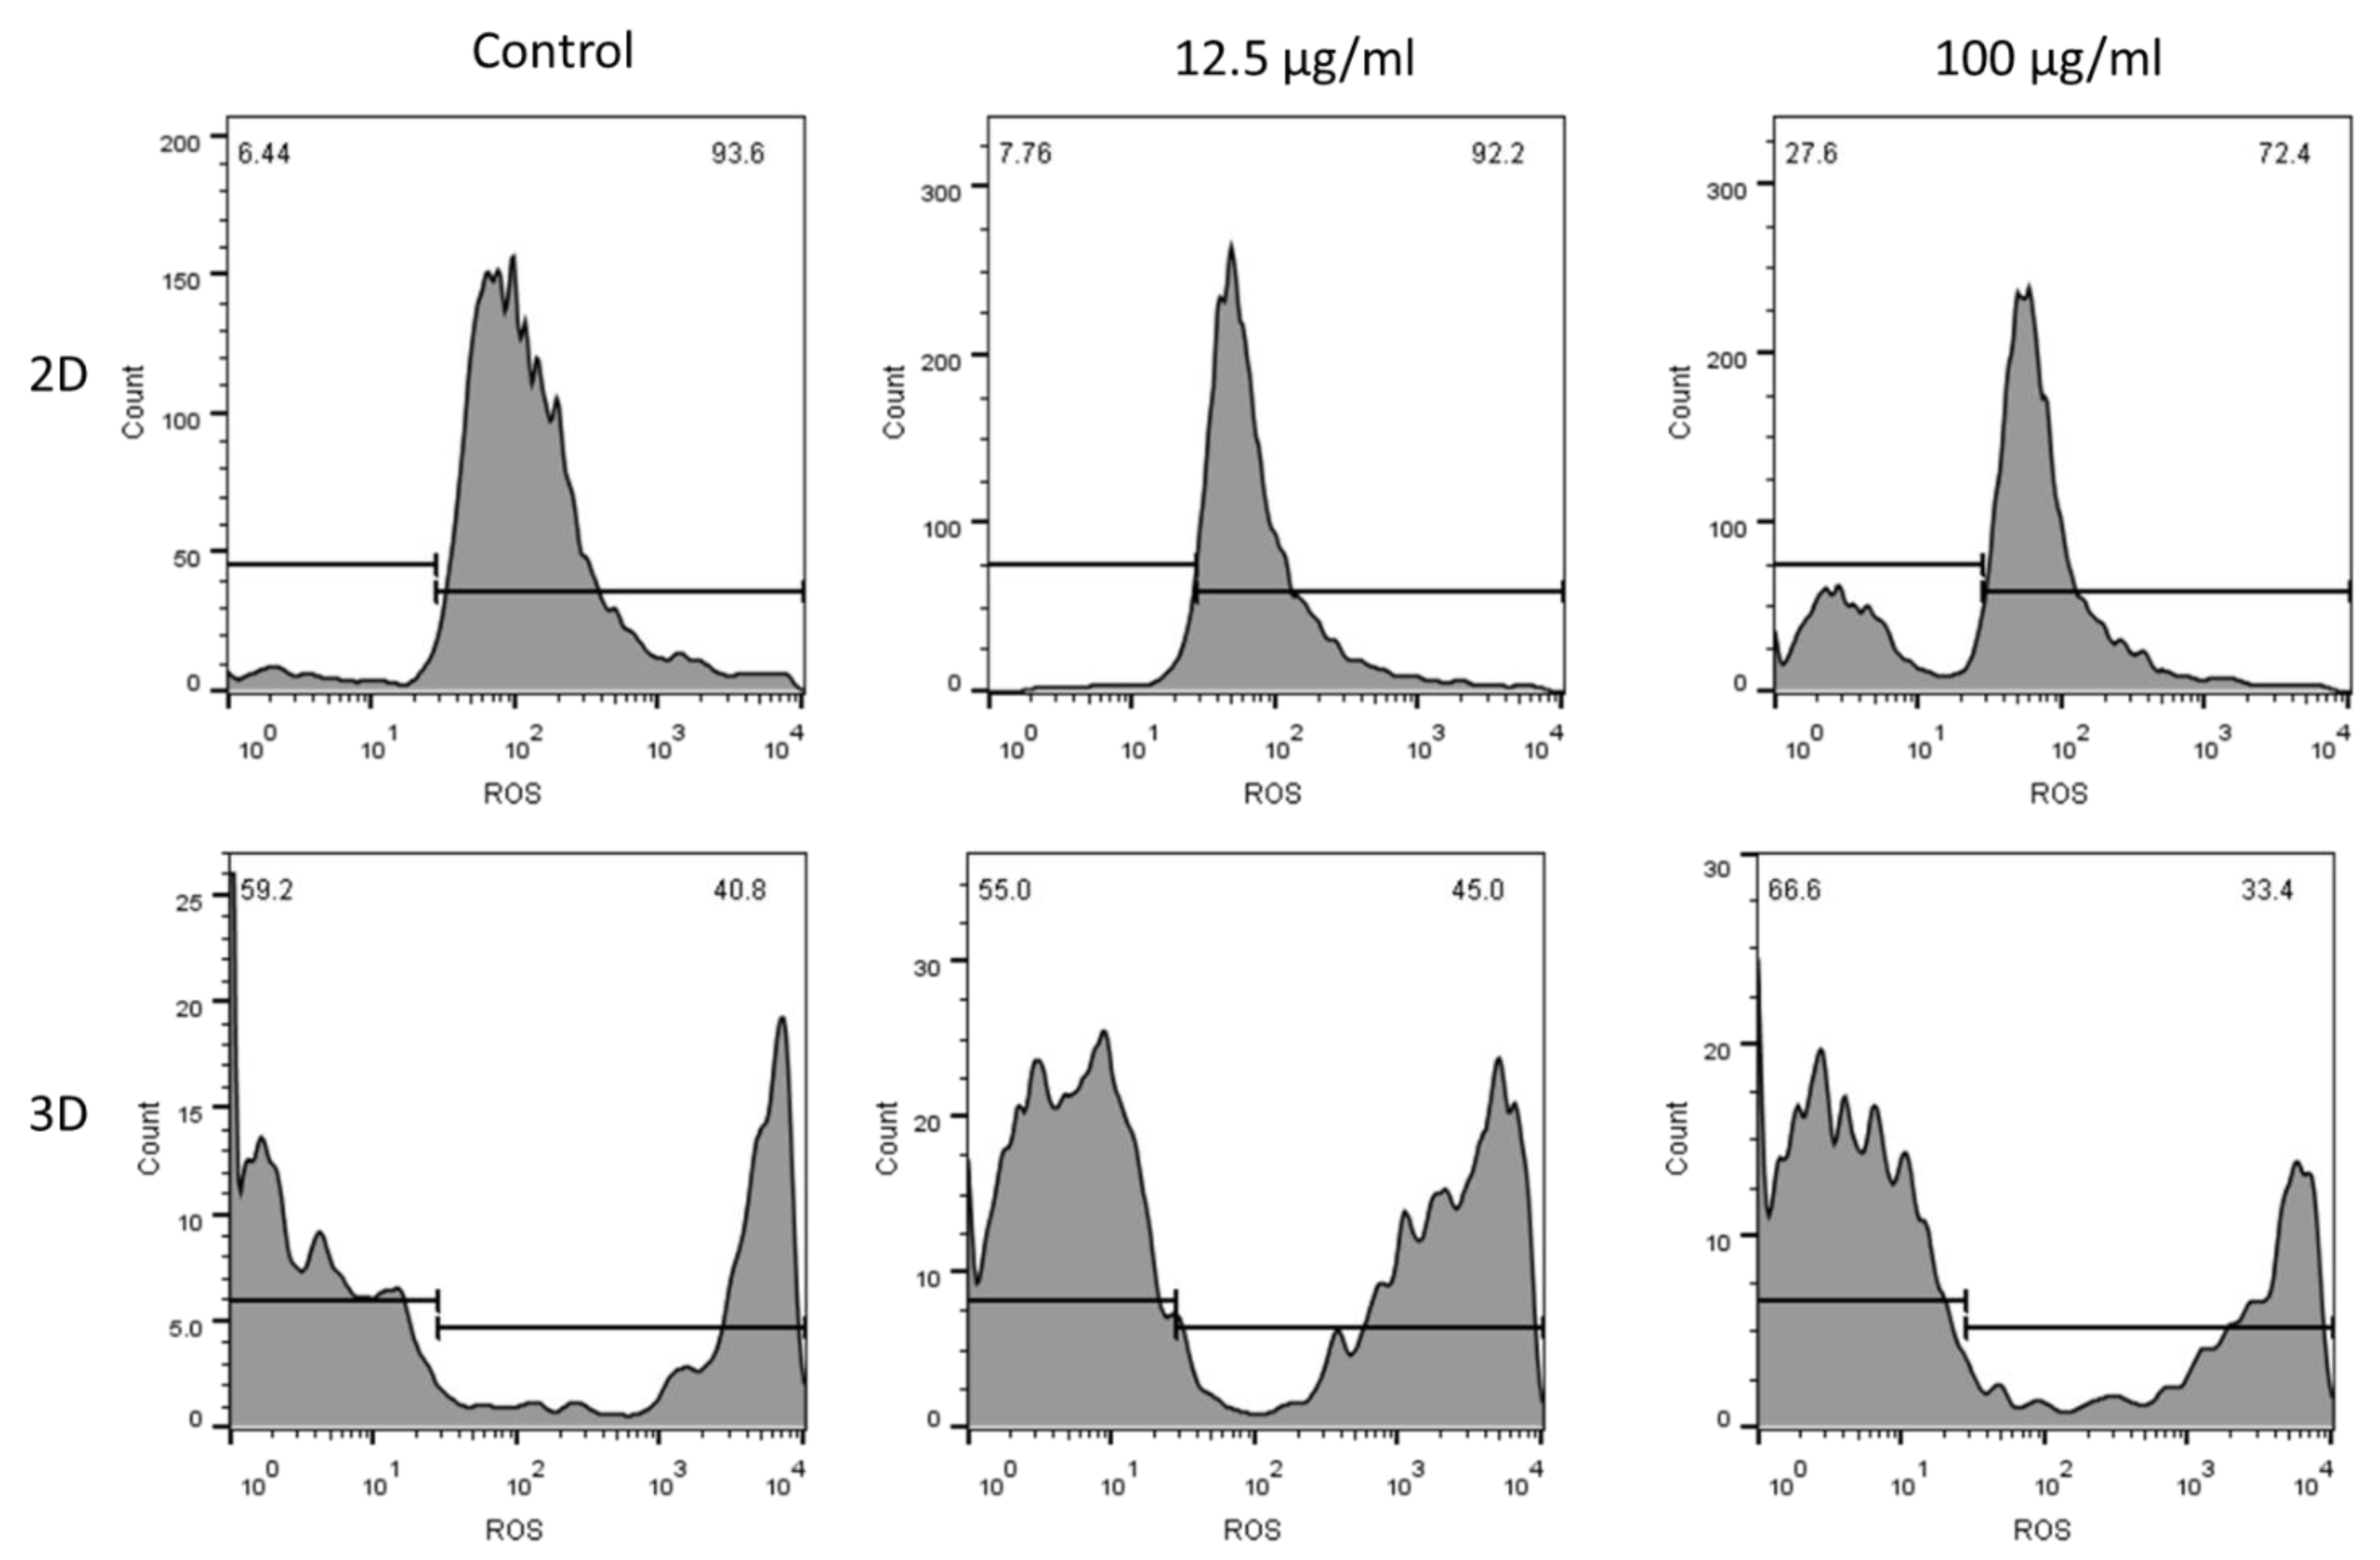
3.8.3. ROS and Cell Cycle Arrest
4. Conclusions
Supplementary Materials
Author Contributions
Funding
Institutional Review Board Statement
Informed Consent Statement
Data Availability Statement
Acknowledgments
Conflicts of Interest
References
- Mohammadpour-Haratbar, A.; Zare, Y.; Rhee, K.Y. Electrochemical biosensors based on polymer nanocomposites for detecting breast cancer: Recent progress and future prospects. Adv. Colloid Interface Sci. 2022, 309, 102795. [Google Scholar] [CrossRef] [PubMed]
- Boraei, S.B.A.; Nourmohammadi, J.; Mahdavi, F.S.; Zare, Y.; Rhee, K.Y.; Montero, A.F.; Herencia, A.J.S.; Ferrari, B. Osteogenesis capability of three-dimensionally printed poly (lactic acid)-halloysite nanotube scaffolds containing strontium ranelate. Nanotechnol. Rev. 2022, 11, 1901–1910. [Google Scholar] [CrossRef]
- Mohammadpour-Haratbar, A.; Boraei, S.B.A.; Zare, Y.; Rhee, K.Y.; Park, S.-J. Graphene-Based Electrochemical Biosensors for Breast Cancer Detection. Biosensors 2023, 13, 80. [Google Scholar] [CrossRef] [PubMed]
- Zare, Y.; Rhee, K.Y. Effect of contact resistance on the electrical conductivity of polymer graphene nanocomposites to optimize the biosensors detecting breast cancer cells. Sci. Rep. 2022, 12, 5406. [Google Scholar] [CrossRef]
- Mohammadpour-Haratbar, A.; Mohammadpour-Haratbar, S.; Zare, Y.; Rhee, K.Y.; Park, S.-J. A Review on Non-Enzymatic Electrochemical Biosensors of Glucose Using Carbon Nanofiber Nanocomposites. Biosensors 2022, 12, 1004. [Google Scholar] [CrossRef]
- Sadrabadi, E.A.; Khosravi, F.; Benvidi, A.; Dezfuli, A.S.; Khashayar, P.; Khashayar, P.; Azimzadeh, M. Alprazolam Detection Using an Electrochemical Nanobiosensor Based on AuNUs/Fe-Ni@ rGO Nanocomposite. Biosensors 2022, 12, 945. [Google Scholar] [CrossRef]
- Gao, L.; Zhuang, J.; Nie, L.; Zhang, J.; Zhang, Y.; Gu, N.; Wang, T.; Feng, J.; Yang, D.; Perrett, S.; et al. Intrinsic peroxidase-like activity of ferromagnetic nanoparticles. Nat. Nanotechnol. 2007, 2, 577–583. [Google Scholar] [CrossRef]
- Jiang, D.; Ni, D.; Rosenkrans, Z.T.; Huang, P.; Yan, X.; Cai, W. Nanozyme: New horizons for responsive biomedical applications. Chem. Soc. Rev. 2019, 48, 3683–3704. [Google Scholar] [CrossRef]
- Wang, H.; Wan, K.; Shi, X. Recent Advances in Nanozyme Research. Adv. Mater. 2019, 31, 1805368. [Google Scholar] [CrossRef]
- Cai, X.; Jiao, L.; Yan, H.; Wu, Y.; Gu, W.; Du, D.; Lin, Y.; Zhu, C. Nanozyme-involved biomimetic cascade catalysis for biomedical applications. Mater. Today 2021, 44, 211–228. [Google Scholar] [CrossRef]
- Huang, Y.; Ren, J.; Qu, X. Nanozymes: Classification, catalytic mechanisms, activity regulation, and applications. Chem. Rev. 2019, 119, 4357–4412. [Google Scholar] [CrossRef]
- Wang, P.; Wang, T.; Hong, J.; Yan, X.; Liang, M. Nanozymes: A New Disease Imaging Strategy. Front. Bioeng. Biotechnol. 2020, 8, 15. [Google Scholar] [CrossRef] [PubMed] [Green Version]
- Wu, J.; Wang, X.; Wang, Q.; Lou, Z.; Li, S.; Zhu, Y.; Qin, L.; Wei, H. Nanomaterials with enzyme-like characteristics (nanozymes): Next-generation artificial enzymes (II). Chem. Soc. Rev. 2019, 48, 1004–1076. [Google Scholar] [CrossRef] [PubMed]
- Hendrickson, O.D.; Zvereva, E.A.; Panferov, V.G.; Solopova, O.N.; Zherdev, A.V.; Sveshnikov, P.G.; Dzantiev, B.B. Application of Au@ Pt Nanozyme as Enhancing Label for the Sensitive Lateral Flow Immunoassay of Okadaic Acid. Biosensors 2022, 12, 1137. [Google Scholar] [CrossRef] [PubMed]
- Zhou, L.; Liu, Y.; Lu, Y.; Zhou, P.; Lu, L.; Lv, H.; Hai, X. Recent Advances in the Immunoassays Based on Nanozymes. Biosensors 2022, 12, 1119. [Google Scholar] [CrossRef]
- Vu, T.H.; Nguyen, P.T.; Kim, M.I. Polydopamine-Coated Co3O4 Nanoparticles as an Efficient Catalase Mimic for Fluorescent Detection of Sulfide Ion. Biosensors 2022, 12, 1047. [Google Scholar] [CrossRef] [PubMed]
- Siddiquee, M.A.; Parray, M.U.D.; Kamli, M.R.; Malik, M.A.; Mehdi, S.H.; Imtiyaz, K.; Rizvi, M.M.A.; Rajor, H.K.; Patel, R. Biogenic synthesis, in-vitro cytotoxicity, esterase activity and interaction studies of copper oxide nanoparticles with lysozyme. J. Mater. Res. Technol. 2021, 13, 2066–2077. [Google Scholar] [CrossRef]
- Smutok, O.; Kavetskyy, T.; Prokopiv, T.; Serkiz, R.; Šauša, O.; Novák, I.; Švajdlenková, H.; Maťko, I.; Gonchar, M.; Katz, E. Biosensor Based on Peroxidase-Mimetic Nanozyme and Lactate Oxidase for Accurate L-Lactate Analysis in Beverages. Biosensors 2022, 12, 1042. [Google Scholar] [CrossRef]
- Chen, Y.; Gao, X.; Xue, H.; Liu, G.; Zhou, Y.; Peng, J. One-Pot Preparation of Imidazole-Ring-Modified Graphitic Carbon Nitride Nanozymes for Colorimetric Glucose Detection. Biosensors 2022, 12, 930. [Google Scholar] [CrossRef]
- Liang, M.; Fan, K.; Pan, Y.; Jiang, H.; Wang, F.; Yang, D.; Lu, D.; Feng, J.; Zhao, J.; Yang, L.; et al. Fe3O4 Magnetic Nanoparticle Peroxidase Mimetic-Based Colorimetric Assay for the Rapid Detection of Organophosphorus Pesticide and Nerve Agent. Anal. Chem. 2013, 85, 308–312. [Google Scholar] [CrossRef]
- Lu, C.; Liu, X.; Li, Y.; Yu, F.; Tang, L.; Hu, Y.; Ying, Y. Multifunctional Janus Hematite–Silica Nanoparticles: Mimicking Peroxidase-Like Activity and Sensitive Colorimetric Detection of Glucose. ACS Appl. Mater. Interfaces 2015, 7, 15395–15402. [Google Scholar] [CrossRef]
- Zhang, T.; Cao, C.; Tang, X.; Cai, Y.; Yang, C.; Pan, Y. Enhanced peroxidase activity and tumour tissue visualization by cobalt-doped magnetoferritin nanoparticles. Nanotechnology 2016, 28, 045704. [Google Scholar] [CrossRef]
- Ni, P.; Sun, Y.; Dai, H.; Lu, W.; Jiang, S.; Wang, Y.; Li, Z.; Li, Z. Prussian blue nanocubes peroxidase mimetic-based colorimetric assay for screening acetylcholinesterase activity and its inhibitor. Sens. Actuators B Chem. 2017, 240, 1314–1320. [Google Scholar] [CrossRef]
- Shi, W.; Wang, Q.; Long, Y.; Cheng, Z.; Chen, S.; Zheng, H.; Huang, Y. Carbon nanodots as peroxidase mimetics and their applications to glucose detection. Chem. Commun. 2011, 47, 6695–6697. [Google Scholar] [CrossRef] [PubMed]
- Shamsipur, M.; Safavi, A.; Mohammadpour, Z. Indirect colorimetric detection of glutathione based on its radical restoration ability using carbon nanodots as nanozymes. Sens. Actuators B Chem. 2014, 199, 463–469. [Google Scholar] [CrossRef]
- Mohammadpour, Z.; Safavi, A.; Shamsipur, M. A new label free colorimetric chemosensor for detection of mercury ion with tunable dynamic range using carbon nanodots as enzyme mimics. Chem. Eng. J. 2014, 255, 1–7. [Google Scholar] [CrossRef]
- Wang, J.; Huang, R.; Qi, W.; Su, R.; Binks, B.P.; He, Z. Construction of a bioinspired laccase-mimicking nanozyme for the degradation and detection of phenolic pollutants. Appl. Catal. B Environ. 2019, 254, 452–462. [Google Scholar] [CrossRef]
- Mohammadpour, Z.; Hashemi, Z.S.; Malekian Jebeli, F.; Ghasemzadeh, S.; Askari, E.; Akbary-Yekta, M.; Sarrami-Forooshani, R. Iron Oxychloride/Bovine Serum Albumin Nanosheets as Chemodynamic Therapy Agents. Part. Part. Syst. Charact. 2021, 38, 2100162. [Google Scholar] [CrossRef]
- Tang, G.; He, J.; Liu, J.; Yan, X.; Fan, K. Nanozyme for tumor therapy: Surface modification matters. Exploration 2021, 1, 75–89. [Google Scholar] [CrossRef]
- Yin, X.; Liu, P.; Xu, X.; Pan, J.; Li, X.; Niu, X. Breaking the pH limitation of peroxidase-like CoFe2O4 nanozyme via vitriolization for one-step glucose detection at physiological pH. Sens. Actuators B Chem. 2021, 328, 129033. [Google Scholar] [CrossRef]
- Zhao, W.; Zhang, G.; Du, Y.; Chen, S.; Fu, Y.; Xu, F.; Xiao, X.; Jiang, W.; Ji, Q. Sensitive colorimetric glucose sensor by iron-based nanozymes with controllable Fe valence. J. Mater. Chem. B 2021, 9, 4726–4734. [Google Scholar] [CrossRef] [PubMed]
- Wahab, M.A.; Hossain, S.M.A.; Masud, M.K.; Park, H.; Ashok, A.; Mustapić, M.; Kim, M.; Patel, D.; Shahbazi, M.; Hossain, M.S.A.; et al. Nanoarchitectured superparamagnetic iron oxide-doped mesoporous carbon nanozymes for glucose sensing. Sens. Actuators B Chem. 2022, 366, 131980. [Google Scholar] [CrossRef]
- Feng, L.; Zhang, L.; Chu, S.; Zhang, S.; Chen, X.; Du, Z.; Gong, Y.; Wang, H. Controllable doping of Fe atoms into MoS2 nanosheets towards peroxidase-like nanozyme with enhanced catalysis for colorimetric analysis of glucose. Appl. Surf. Sci. 2022, 583, 152496. [Google Scholar] [CrossRef]
- Zha, J.; Wu, W.; Xie, P.; Han, H.; Fang, Z.; Chen, Y.; Jia, Z. Polymeric Nanocapsule Enhances the Peroxidase-like Activity of Fe3O4 Nanozyme for Removing Organic Dyes. Catalysts 2022, 12, 614. [Google Scholar] [CrossRef]
- Wang, Q.; Zhang, X.; Huang, L.; Zhang, Z.; Dong, S. One-Pot Synthesis of Fe3O4 Nanoparticle Loaded 3D Porous Graphene Nanocomposites with Enhanced Nanozyme Activity for Glucose Detection. ACS Appl. Mater. Interfaces 2017, 9, 7465–7471. [Google Scholar] [CrossRef]
- Bao, Y.; Shi, C.; Wang, T.; Li, X.; Ma, J. Recent progress in hollow silica: Template synthesis, morphologies and applications. Microporous Mesoporous Mater. 2016, 227, 121–136. [Google Scholar] [CrossRef]
- Dong, W.; Chen, G.; Hu, X.; Zhang, X.; Shi, W.; Fu, Z. Molybdenum disulfides nanoflowers anchoring iron-based metal organic framework: A synergetic catalyst with superior peroxidase-mimicking activity for biosensing. Sens. Actuators B Chem. 2020, 305, 127530. [Google Scholar] [CrossRef]
- Mu, Z.; Wu, S.; Guo, J.; Zhao, M.; Wang, Y. Dual Mechanism Enhanced Peroxidase-like Activity of Iron–Nickel Bimetal–Organic Framework Nanozyme and Its Application for Biosensing. ACS Sustain. Chem. Eng. 2022, 10, 2984–2993. [Google Scholar] [CrossRef]
- Chen, M.; Zhou, H.; Liu, X.; Yuan, T.; Wang, W.; Zhao, C.; Zhao, Y.; Zhou, F.; Wang, X.; Xue, Z.; et al. Single Iron Site Nanozyme for Ultrasensitive Glucose Detection. Small 2020, 16, 2002343. [Google Scholar] [CrossRef]
- Bandi, R.; Alle, M.; Park, C.-W.; Han, S.-Y.; Kwon, G.-J.; Kim, N.-H.; Kim, J.-C.; Lee, S.-H. Cellulose nanofibrils/carbon dots composite nanopapers for the smartphone-based colorimetric detection of hydrogen peroxide and glucose. Sens. Actuators B Chem. 2021, 330, 129330. [Google Scholar] [CrossRef]
- Zhang, Z.; Hao, J.; Zhang, J.; Zhang, B.; Tang, J. Protein as the source for synthesizing fluorescent carbon dots by a one-pot hydrothermal route. RSC Adv. 2012, 2, 8599–8601. [Google Scholar] [CrossRef]
- Tan, M.; Li, X.; Wu, H.; Wang, B.; Wu, J. N-doped carbon dots derived from bovine serum albumin and formic acid with one- and two-photon fluorescence for live cell nuclear imaging. Colloids Surf. B Biointerfaces 2015, 136, 141–149. [Google Scholar] [CrossRef] [PubMed]
- Liu, X.; Li, T.; Hou, Y.; Wu, Q.; Yi, J.; Zhang, G. Microwave synthesis of carbon dots with multi-response using denatured proteins as carbon source. RSC Adv. 2016, 6, 11711–11718. [Google Scholar] [CrossRef]
- Chowdhury, Z.Z.; Krishnan, B.; Sagadevan, S.; Rafique, R.F.; Hamizi, N.A.B.; Abdul Wahab, Y.; Khan, A.A.; Johan, R.B.; Al-Douri, Y.; Kazi, S.N.; et al. Effect of Temperature on the Physical, Electro-Chemical and Adsorption Properties of Carbon Micro-Spheres Using Hydrothermal Carbonization Process. Nanomaterials 2018, 8, 597. [Google Scholar] [CrossRef] [PubMed]
- Jiang, Y.; Li, C.; Nguyen, X.; Muzammil, S.; Towers, E.; Gabrielson, J.; Narhi, L. Qualification of FTIR spectroscopic method for protein secondary structural analysis. J. Pharm. Sci. 2011, 100, 4631–4641. [Google Scholar] [CrossRef]
- Kong, J.; Yu, S. Fourier Transform Infrared Spectroscopic Analysis of Protein Secondary Structures. Acta Biochim. Biophys. Sin. 2007, 39, 549–559. [Google Scholar] [CrossRef] [Green Version]
- Mallamace, F.; Baglioni, P.; Corsaro, C.; Chen, S.-H.; Mallamace, D.; Vasi, C.; Stanley, H.E. The influence of water on protein properties. J. Chem. Phys. 2014, 141, 165104. [Google Scholar] [CrossRef] [Green Version]
- Zhou, L.; Yang, Y.; Ren, H.; Zhao, Y.; Wang, Z.; Wu, F.; Xiao, Z. Structural Changes in Rice Bran Protein upon Different Extrusion Temperatures: A Raman Spectroscopy Study. J. Chem. 2016, 2016, 6898715. [Google Scholar] [CrossRef] [Green Version]
- Tan, C.; Zuo, S.; Zhao, Y.; Shen, B. Preparation of multicolored carbon quantum dots using HNO3/HClO4 oxidation of graphitized carbon. J. Mater. Res. 2019, 34, 3428–3438. [Google Scholar] [CrossRef]
- Wang, L.; Hu, N. Direct electrochemistry of hemoglobin in layer-by-layer films with poly(vinyl sulfonate) grown on pyrolytic graphite electrodes. Bioelectrochemistry 2001, 53, 205–212. [Google Scholar] [CrossRef]
- Paynter, R.W.; Ratner, B.D.; Horbett, T.A.; Thomas, H.R. XPS studies on the organization of adsorbed protein films on fluoropolymers. J. Colloid Interface Sci. 1984, 101, 233–245. [Google Scholar] [CrossRef]
- Ogi, T.; Aishima, K.; Permatasari, F.A.; Iskandar, F.; Tanabe, E.; Okuyama, K. Kinetics of nitrogen-doped carbon dot formation via hydrothermal synthesis. New J. Chem. 2016, 40, 5555–5561. [Google Scholar] [CrossRef]
- Miao, X.; Yan, X.; Qu, D.; Li, D.; Tao, F.F.; Sun, Z. Red Emissive Sulfur, Nitrogen Codoped Carbon Dots and Their Application in Ion Detection and Theraonostics. ACS Appl. Mater. Interfaces 2017, 9, 18549–18556. [Google Scholar] [CrossRef] [PubMed]
- Greenstein, J.P. Sulfhydryl groups in proteins: I. egg albumin in solutions of urea, guanidine, and their derivatives. J. Biol. Chem. 1938, 125, 501–513. [Google Scholar] [CrossRef]
- Meng, F.; Alayash, A.I. Determination of extinction coefficients of human hemoglobin in various redox states. Anal. Biochem. 2017, 521, 11–19. [Google Scholar] [CrossRef] [PubMed] [Green Version]
- Zheng, N.; Lian, Y.; Zhou, Q.; Wang, R.; He, X.; Hu, R.; Hu, Z. An effective Fenton reaction by using waste ferriciron and red phosphorus. Chem. Eng. J. 2022, 437, 135265. [Google Scholar] [CrossRef]
- Buettner, G.R.; Jurkiewicz, B.A. Catalytic Metals, Ascorbate and Free Radicals: Combinations to Avoid. Radiat. Res. 1996, 145, 532–541. [Google Scholar] [CrossRef] [Green Version]
- Hakanson, M.; Kobel, S.; Lutolf, M.P.; Textor, M.; Cukierman, E.; Charnley, M. Controlled breast cancer microarrays for the deconvolution of cellular multilayering and density effects upon drug responses. PLoS ONE 2012, 7, e40141. [Google Scholar] [CrossRef]
- Gong, X.; Lin, C.; Cheng, J.; Su, J.; Zhao, H.; Liu, T.; Wen, X.; Zhao, P. Generation of Multicellular Tumor Spheroids with Microwell-Based Agarose Scaffolds for Drug Testing. PLoS ONE 2015, 10, e0130348. [Google Scholar] [CrossRef] [Green Version]
- Guo, J.; Wang, Y.; Zhao, M. Target-directed functionalized ferrous phosphate-carbon dots fluorescent nanostructures as peroxidase mimetics for cancer cell detection and ROS-mediated therapy. Sens. Actuators B Chem. 2019, 297, 126739. [Google Scholar] [CrossRef]
- Schieber, M.; Chandel, N.S. ROS function in redox signaling and oxidative stress. Curr. Biol. CB 2014, 24, R453–R462. [Google Scholar] [CrossRef] [Green Version]
- Jamali, T.; Kavoosi, G.; Safavi, M.; Ardestani, S.K. In-vitro evaluation of apoptotic effect of OEO and thymol in 2D and 3D cell cultures and the study of their interaction mode with DNA. Sci. Rep. 2018, 8, 15787. [Google Scholar] [CrossRef] [PubMed] [Green Version]
- Guidet, B.; Shah, S.V. Enhanced in vivo H2O2 generation by rat kidney in glycerol-induced renal failure. Am. J. Physiol. 1989, 257 Pt 2, F440–F445. [Google Scholar] [CrossRef] [PubMed]
- Jiang, Z.Y.; Woollard, A.C.; Wolff, S.P. Hydrogen peroxide production during experimental protein glycation. FEBS Lett. 1990, 268, 69–71. [Google Scholar] [CrossRef] [Green Version]
- Thannickal, V.J.; Fanburg, B.L. Activation of an H2O2-generating NADH oxidase in human lung fibroblasts by transforming growth factor beta 1. J. Biol. Chem. 1995, 270, 30334–30338. [Google Scholar] [CrossRef] [PubMed] [Green Version]
- Andrade, C.T.; Barros, L.A.M.; Lima, M.C.P.; Azero, E.G. Purification and characterization of human hemoglobin: Effect of the hemolysis conditions. Int. J. Biol. Macromol. 2004, 34, 233–240. [Google Scholar] [CrossRef]
- Schneider, J.; Reckmeier, C.J.; Xiong, Y.; von Seckendorff, M.; Susha, A.S.; Kasák, P.; Rogach, A.L. Molecular Fluorescence in Citric Acid-Based Carbon Dots. J. Phys. Chem. C 2017, 121, 2014–2022. [Google Scholar] [CrossRef]
- Chen, Y.; Yuchi, Q.; Li, T.; Yang, G.; Miao, J.; Huang, C.; Liu, J.; Li, A.; Qin, Y.; Zhang, L. Precise engineering of ultra-thin Fe2O3 decorated Pt-based nanozymes via atomic layer deposition to switch off undesired activity for enhanced sensing performance. Sens. Actuators B Chem. 2020, 305, 127436. [Google Scholar] [CrossRef]
- Zhao, Z.; Huang, Y.; Liu, W.; Ye, F.; Zhao, S. Immobilized Glucose Oxidase on Boronic Acid-Functionalized Hierarchically Porous MOF as an Integrated Nanozyme for One-Step Glucose Detection. ACS Sustain. Chem. Eng. 2020, 8, 4481–4488. [Google Scholar] [CrossRef]
- Xian, J.; Weng, Y.; Guo, H.; Li, Y.; Yao, B.; Weng, W. One-pot fabrication of Fe-doped carbon nitride nanoparticles as peroxidase mimetics for H2O2 and glucose detection. Spectrochim. Acta Part A Mol. Biomol. Spectrosc. 2019, 215, 218–224. [Google Scholar] [CrossRef]
- Zhong, Y.; Yang, J.; Yin, X.; Zheng, J.; Lu, N.; Zhang, M. Enhanced synergistic effects from multiple iron oxide nanoparticles encapsulated within nitrogen-doped carbon nanocages for simple and label-free visual detection of blood glucose. Nanotechnology 2019, 30, 355501. [Google Scholar] [CrossRef] [PubMed]
- Chen, H.; Yuan, C.; Yang, X.; Cheng, X.; Elzatahry, A.A.; Alghamdi, A.; Su, J.; He, X.; Deng, Y. Hollow Mesoporous Carbon Nanospheres Loaded with Pt Nanoparticles for Colorimetric Detection of Ascorbic Acid and Glucose. ACS Appl. Nano Mater. 2020, 3, 4586–4598. [Google Scholar] [CrossRef]
- Li, T.; Hu, P.; Li, J.; Huang, P.; Tong, W.; Gao, C. Enhanced peroxidase-like activity of Fe@PCN-224 nanoparticles and their applications for detection of H2O2 and glucose. Colloids Surf. A Physicochem. Eng. Asp. 2019, 577, 456–463. [Google Scholar] [CrossRef]


| Amount | ||||
|---|---|---|---|---|
| XPS | Element | ppm | At% (BDNP-100) | At% (BDNP-150) |
| O | - | 12.44 | 15.83 | |
| C=O | - | 74.37 | 77.04 | |
| C-O | - | 25.63 | 22.96 | |
| C | - | 79.13 | 71.72 | |
| C-C | - | 57.95 | 54.53 | |
| N-C=O | - | 14.70 | 15.70 | |
| C=C | - | 27.35 | 29.77 | |
| N | - | 7.00 | 7.91 | |
| C-N | - | 100 | 94.95 | |
| Graphitic N, N-H | - | 0 | 5.05 | |
| Na | - | 1.44 | 4.54 | |
| EDS | C | - | 74.55 | 71.61 |
| O | - | 25.41 | 28.31 | |
| Fe | - | 0.05 | 0.07 | |
| ICP-MS | Fe (BDNP-100) | 3.1 | - | - |
| Fe (BDNP-125) | 3.3 | - | - | |
| Fe (BDNP-150) | 0.30 | - | - | |
| Fe (BDNP-180) | 0.37 | - | - | |
| Sample | Substrate | Km (mM) | Vmax (×10−8, mol L−1 s−1) |
|---|---|---|---|
| Hb (blood, fresh) | H2O2 | 1.79 | 69.7 |
| TMB | 0.18 | 7.1 | |
| Hb (blood, dated) | H2O2 | 1.54 | 35.5 |
| TMB | 0.142 | 0.819 | |
| Hb (Sigma) | H2O2 | 2.00 | 3.64 |
| TMB | 0.291 | 1.57 | |
| BDNP-100 | H2O2 | 11.84 | 8.56 |
| TMB | 0.121 | 0.538 | |
| BDNP-150 | H2O2 | 11.32 | 3.18 |
| TMB | 0.137 | 0.254 | |
| Fe-CD | H2O2 | 2.31 | 2.87 |
| TMB | 0.134 | 0.789 |
| Sample | Spiked (µM) | Found (µM) | Standard Method (µM) | Recovery (%) | Relative Error (%) | RSD (%, n = 3) |
|---|---|---|---|---|---|---|
| Sample 1 Human serum | 0 | 76.02 | 77.15 | - | 1.46 | 6.60 |
| 95 | 175.91 | - | 105.14 | - | 11.53 | |
| 285 | 385.59 | - | 108.62 | - | 1.72 | |
| 475 | 529.12 | - | 95.40 | - | 10.63 | |
| Spiked (µM) | Found (µM) | Standard method (µM) | Recovery (%) | Relative error (%) | RSD (%, n = 3) | |
| Sample 2 Human plasma | 0 | 87.38 | 80.38 | - | 8.71 | 14.8 |
| 95 | 192.65 | - | 110.81 | - | 1.53 | |
| 285 | 378.16 | - | 102.03 | - | 5.34 | |
| 475 | 549.20 | - | 97.22 | - | 7.60 | |
| Spiked (µM) | Found (µM) | Standard method (µM) | Recovery (%) | Relative error (%) | RSD (%, n = 3) | |
| Sample 3 Human serum | 0 | 102.69 | 109.00 | - | 5.78 | 2.80 |
| 285 | 392.44 | - | 101.67 | - | 5.96 | |
| 475 | 571.59 | - | 98.72 | - | 4.13 | |
| Spiked (µM) | Found (µM) | Standard method (µM) | Recovery (%) | Relative error (%) | RSD (%, n = 3) | |
| Sample 4 Human serum | 0 | 93.12 | 86.81 | - | 7.27 | 1.76 |
| 285 | 373.82 | - | 98.49 | - | 8.94 | |
| 475 | 555.93 | - | 97.43 | - | 13.44 |
Disclaimer/Publisher’s Note: The statements, opinions and data contained in all publications are solely those of the individual author(s) and contributor(s) and not of MDPI and/or the editor(s). MDPI and/or the editor(s) disclaim responsibility for any injury to people or property resulting from any ideas, methods, instructions or products referred to in the content. |
© 2023 by the authors. Licensee MDPI, Basel, Switzerland. This article is an open access article distributed under the terms and conditions of the Creative Commons Attribution (CC BY) license (https://creativecommons.org/licenses/by/4.0/).
Share and Cite
Mohammadpour, Z.; Askari, E.; Shokati, F.; Hoseini, H.S.; Kamankesh, M.; Zare, Y.; Rhee, K.Y. Synthesis of Fe-Doped Peroxidase Mimetic Nanozymes from Natural Hemoglobin for Colorimetric Biosensing and In Vitro Anticancer Effects. Biosensors 2023, 13, 583. https://doi.org/10.3390/bios13060583
Mohammadpour Z, Askari E, Shokati F, Hoseini HS, Kamankesh M, Zare Y, Rhee KY. Synthesis of Fe-Doped Peroxidase Mimetic Nanozymes from Natural Hemoglobin for Colorimetric Biosensing and In Vitro Anticancer Effects. Biosensors. 2023; 13(6):583. https://doi.org/10.3390/bios13060583
Chicago/Turabian StyleMohammadpour, Zahra, Esfandyar Askari, Farhad Shokati, Hosna Sadat Hoseini, Mojtaba Kamankesh, Yasser Zare, and Kyong Yop Rhee. 2023. "Synthesis of Fe-Doped Peroxidase Mimetic Nanozymes from Natural Hemoglobin for Colorimetric Biosensing and In Vitro Anticancer Effects" Biosensors 13, no. 6: 583. https://doi.org/10.3390/bios13060583