1. Introduction
Surface plasmon resonance (SPR) microscopy sensors are highly sensitive and flexible instruments [
1,
2]. Most conventional commercial SPR-based biosensors harness the relatively simple Kretschmann’s [
3] scheme of plasmon excitation to detect target biological substances in liquid samples [
4]. The simplicity of this optical scheme, and the high sensitivity of SPR sensors, have led to the employment of such instruments across the broad spectrum of biological applications: measurements of binding constants and kinetics of biomolecular interactions, concentration measurements, and many others; however, each sensor using this scheme has its merits and limitations [
5]. For a long time, despite their high sensitivity, SPR-based sensors were not considered appropriate instruments for detecting individual bioNPs in liquid samples. Recently, results from independent research teams have proved the applicability of SPR-based sensors to the detection and quantification of individual bioNPs [
6,
7,
8,
9,
10].
Considered an analytical instrument suitable for the real-time sizing and quantification of individual viruses and virus-like particles (VLPs) [
7,
11,
12], the SPR microscopy sensor has also demonstrated its features by analyzing samples containing microvesicles–a subgroup of extracellular vesicles [
6]. SPR microscopy enables the specific detection of individual bioNPs in liquid samples without needing biological labeling [
2,
5] and can directly compare relative concentrations of microvesicles in such samples [
6].
Similarly to rapid antigen tests, an antigen-specific antibody coating on the gold sensor surface provides biological selectivity against a specific virus or extracellular vesicle [
2]. Additional selectivity against the unspecific background is facilitated by the sizing capabilities [
6] and temporal profiles of the binding event recognized by a detection algorithm [
13].
Different materials have been employed as sensor surfaces, potentially improving optical performance [
5,
14,
15]. Some of the materials employed in SPR-based sensors have facilitated the coupling of the plasmonic technique to other well-known techniques, such as fluorescent spectroscopy [
16,
17]. However, gold as a surface is chemically inert, stable against oxidation under atmospheric or liquid conditions, and can be easily produced and cleaned. Moreover, surface functionalization with biologically relevant molecules is well-established for gold films. Therefore, from the practical employment point of view, gold has clear benefits over more advanced plasmonic materials. The theoretical background of the SPR microscopy sensor measurements is provided in the recently published work of Zybin and colleagues [
18].
Separate localization of individual particle signals enables particle concentration measurement and the sizing of particles. Once a region has been detected as a particle signal region, the changes of intensity value in the associated pixels over time indicate its relative size [
6,
19]. By measuring the relative size of particles with known optical properties, the conversion factor from relative sizes to absolute sizes is ascertained. If the optical properties are unknown, then a calibration with known particles (e.g., bio-similar particles, such as VLP or polymeric particles) is possible. The conversion of particle counts can be converted to an actual concentration, either by an absolute measurement [
20] or a calibration with known particle suspensions. In this way, size and concentration can be simultaneously determined [
6,
19].
To date, evaluations have demonstrated the detection capabilities on the submicrometer scale, starting from 80
for biological or polymeric particles [
5,
21]. The limits of detection, in terms of size, depend on the contrast, i.e., the difference in the refractive index between solvent and particle [
18]; therefore, NPs with a high refractive index—for instance, gold in an aqueous solution—can be visualized down to a size of 40
.
Commonly used for EV analysis, flow cytometry (FC) and nanoparticle tracking analysis (NTA) require biological labeling prior to the specific detection of EVs. In addition, conventional FC instruments often suffer from resolution and sensitivity problems [
2]. SPR microscopy, as a real-time imaging technique without biological labeling, overcomes the constraints of FC and NTA [
2]. Moreover, as previously reported [
6], the functionalization of a gold sensor chip surface by cysteine-conjugated protein A/G permits the achievement of the oriented immobilization of an unmodified anti-target antibody, which enables the re-use of a sensor chip after eluting an analyte-capturing antibody layer: thus, captured EVs or other bioNPs can be pre-concentrated, sized, and quantified onto a gold chip surface during SPR microscopy measurements, and further characterized after elution from an SPR gold chip. However, a primary custom-made version of the SPR microscopy instrument still had inhomogeneous illumination of the gold sensor layer and a relatively small focusing area. These limitations hampered the ability of the SPR microscopy sensor to detect low concentrations of analyte bioNPs in solutions. Mounting a concave lens and a diffraction grating helped to correct the image distortion caused by tilted object and image planes in the primary version of the SPR microscopy sensor: thus, mounting these elements resulted in a more homogeneous illumination of the enlarged focused gold sensor surface area of the modified SPR microscopy instrument.
Among the aims of the current work was the necessity to provide detailed protocols describing the setup of the primary and modified versions of the SPR microscopy sensors, as well as principles of measurements for samples containing different types of NPs. It was important to confirm that employed modifications did not affect the main characteristics of the SPR microscopy sensors, such that, for the primary and modified versions of the SPR microscopy sensor, the character of dependency between NPs concentration and the number of binding signals detected by the sensor, as well as between the size of NPs and the intensity of binding signals, remained linear. We demonstrate the ability of a modified SPR microscopy sensor to establish a wide dynamic size range in detecting silica NPs (with a refractive index close to bioNPs) of sizes 200 and 800 on the same gold sensor chip simultaneously. We study the power of the modified and primary versions of SPR microscopy sensors in detecting EVs isolated via different approaches. We suggest the employment of actuators—precise stepper motors—that help to adjust the positions of the optical elements in the primary version of the SPR microscopy sensor. Finally, we discuss the principles of software development, which aim to establish efficient and reliable sensor–actuator coupling.
The structure of this manuscript is as follows: In
Section 2, the setup of the SPR sensor, the preparation of the gold surface, and the samples are described; a description of the acquisition, analysis, and optimization of the prism rotation, or the camera lens shift based on it, is given;
Section 3 shows the results of the previously described approaches and investigations. In
Section 4, we discuss the presented results, and we present an outlook on future research perspectives.
2. Materials and Methods
Section 2.3 describes the utilization of the SPR sensor for detecting wide ranges of nanoparticle sizes in one sample (
Section 2.3.1), and the recording and analysis of nanoparticle images (
Section 2.3.2). The creation of a comparative analysis by a commercial nanoparticle-tracking analysis device for determining particle sizes is discussed in
Section 1.3 in Supplementary Materials.
In
Section 2.4, we present our approach to optimizing the adjustment of prism rotation (
Section 2.4.1) and camera objective translation (
Section 2.4.2), to improve the conditions for downstream nanoparticle detection.
2.1. SPR Microscopy Sensor
2.1.1. Assembling of the Flow Cell, SPR Sensor Prism, and Gold Sensor Plate for a Wide-Field SPR Microscopy Instrument
We previously reported the ability of the primary-version SPR microscopy sensor to visualize the binding of inorganic nanoparticles (NPs) [
11,
12], as well as inactivated influenza A viruses or HIV-virus-like particles (HIV-VLPs) [
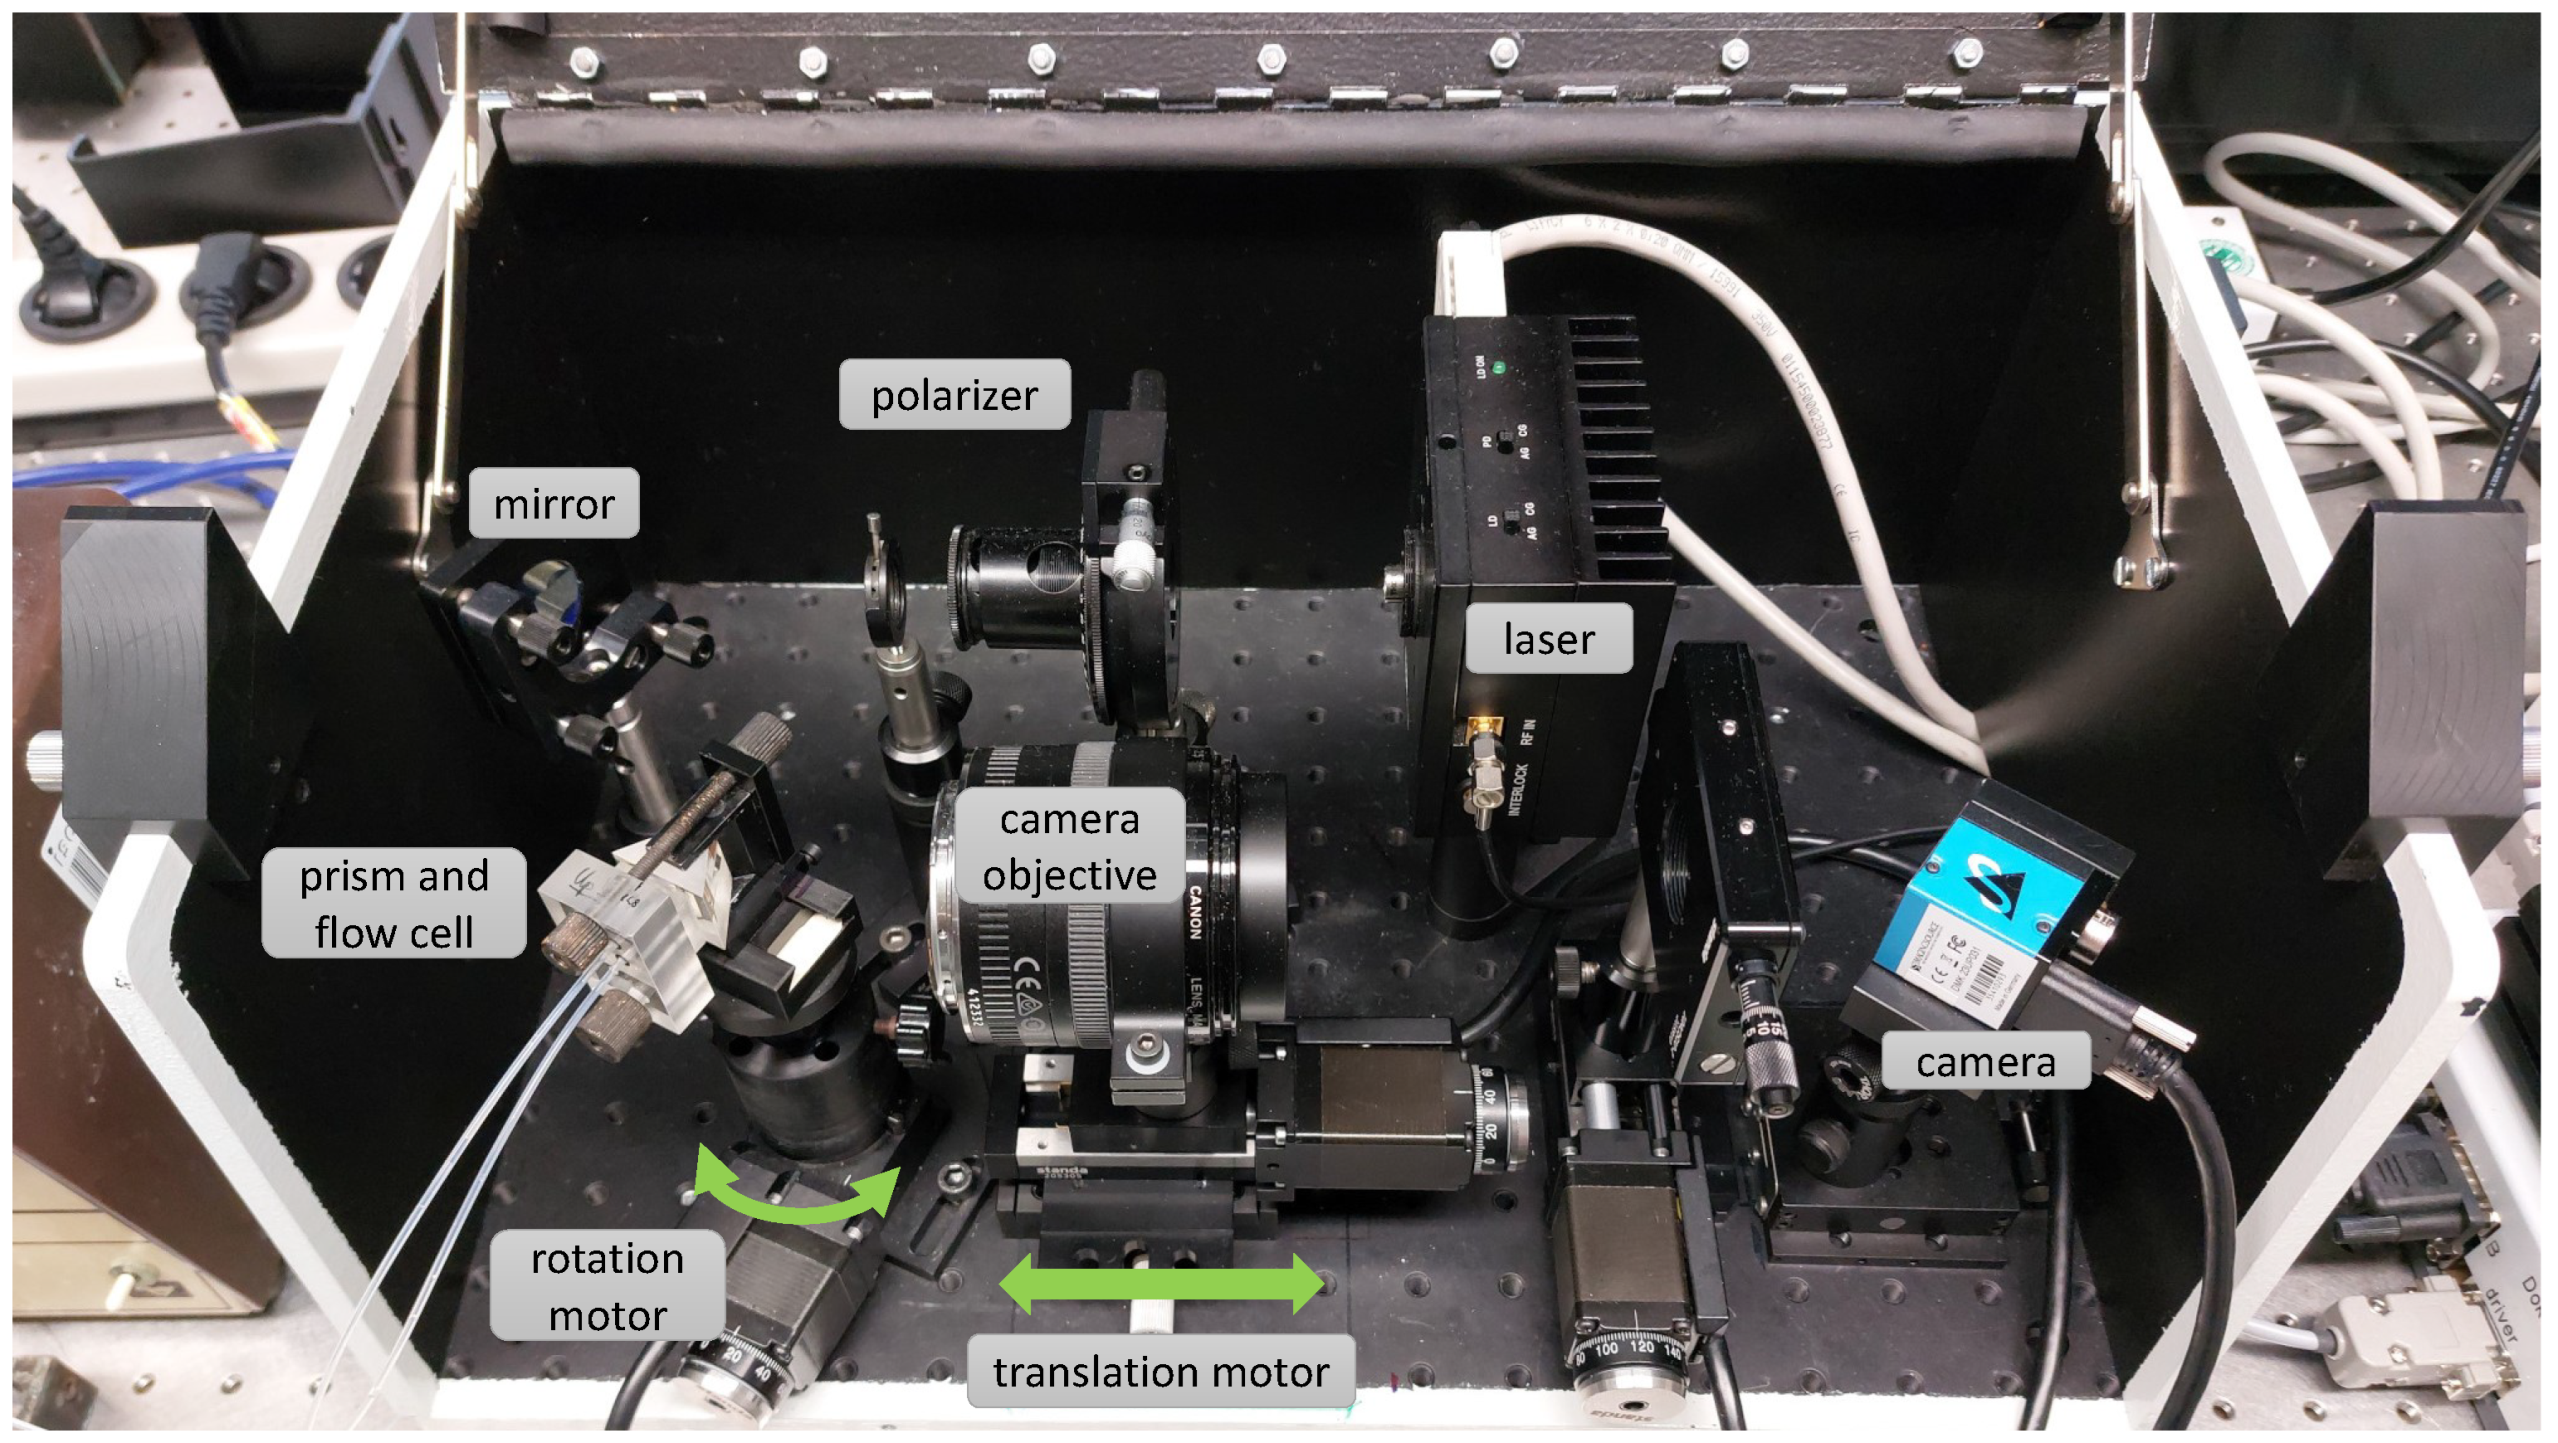
7], to the functionalized sensor surface. This custom-made instrument, shown in
Figure 1, employed Kretschmann’s scheme [
3] of plasmon excitation.
However, the base of the SPR prism (SF10 glass, with refractive index
; 4 polished surfaces;
; 40-20scr/dig, SF l/2@ 633
, angle 56 deg ± 5’ produced by Eksma Optics, Vilnius, Lithuania,
www.eksmaoptics.com, accessed on 2 April 2023) used for the studies mentioned above was not directly coated with a thin gold film, as described in Kretschmann’s original work [
3]: instead, glass slides with the same refractive index and made from the same type of glass (SF10) were employed as a sensing surface carrying slides (the slides were produced either by Hellma Optics, Jena, Germany, or UQG (Optics) Ltd., Cambridge, UK). The glass slides (sizes
) were coated with a 5
adhesion layer of Ti and an approximately 41
-to-45
layer of gold. The deposition was performed using a magnetron sputtering technique (PHASIS, Geneva, Switzerland or Innolume, Dortmund, Germany). Cut glass slides—”gold sensors” (
Section 1.3 in Supplementary Materials)—were placed on the prism base, using an immersion liquid with the same refractive index
(Cargille Laboratories, Cedar Grove, NJ, USA). Then, an SPR prism with a gold sensor placed on its base was mounted into a flow cell (
Figure 2A). The flow cell was custom-constructed and made from Teflon
®. A polydimethylsiloxane (PDMS) gasket was used to prevent the flow cell from leaking (
Section 1.1 in Supplementary Materials). Assembled this way, the flow cell, together with a gold sensor and prism (
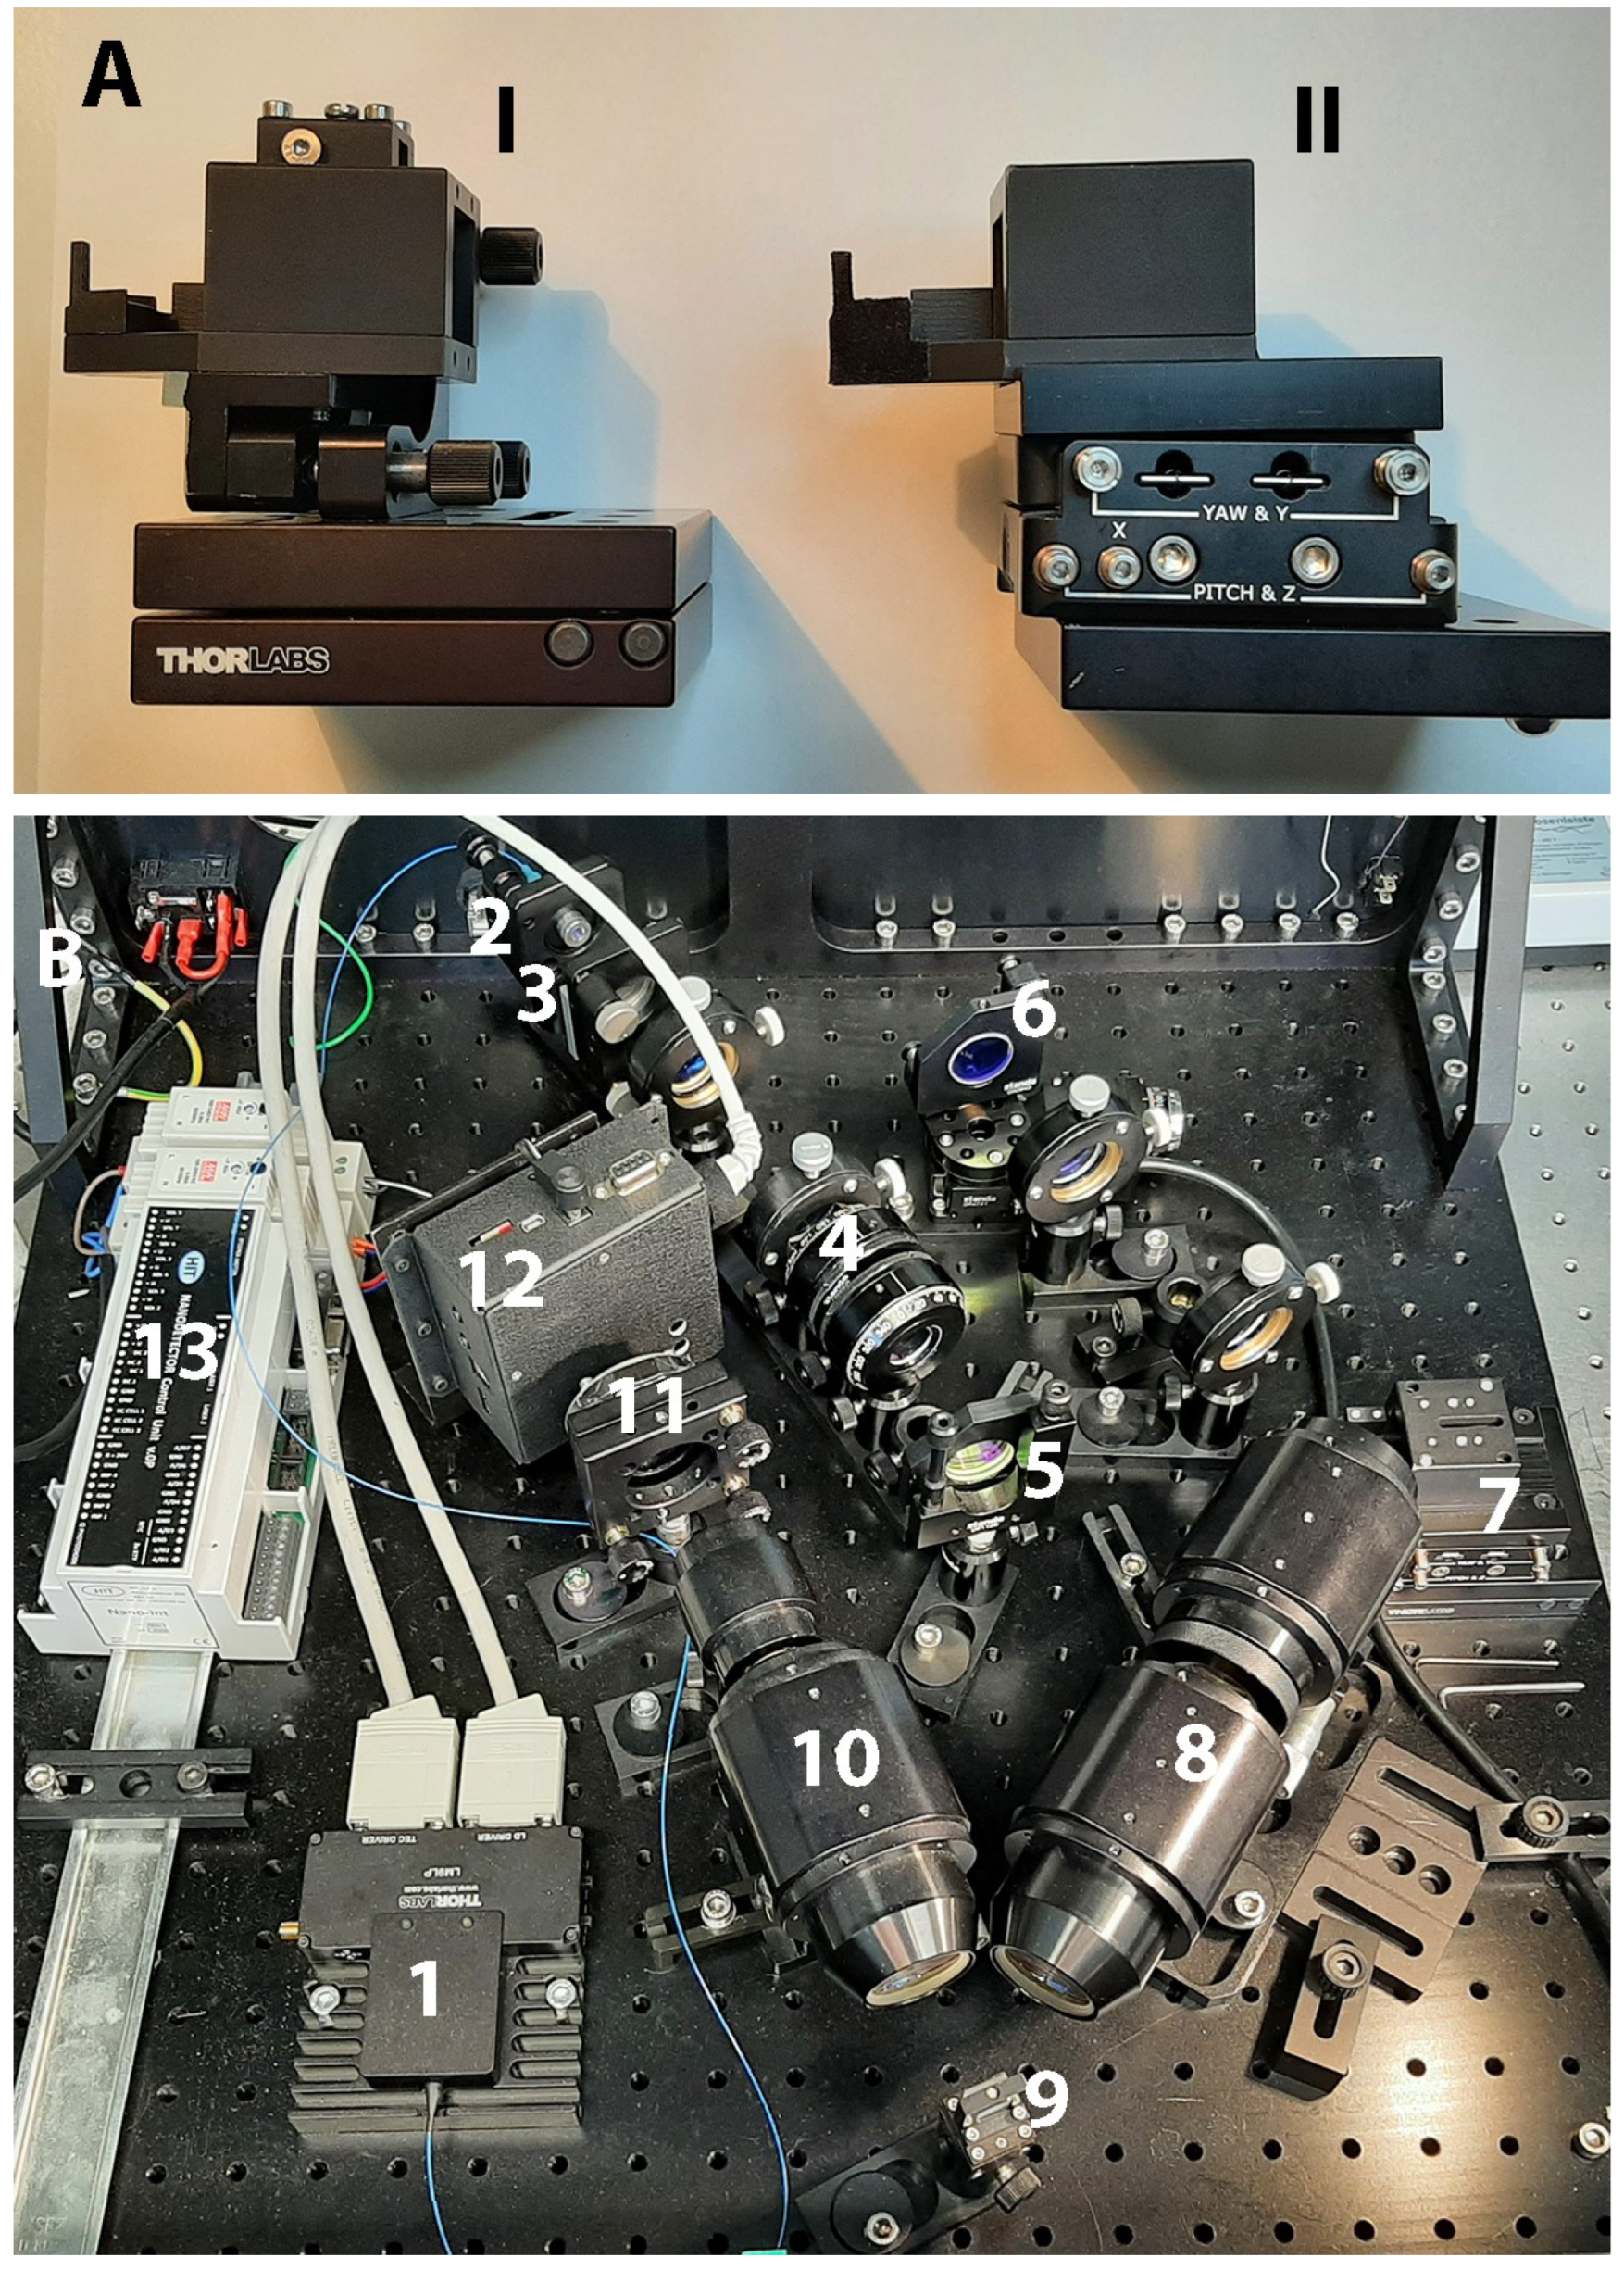
Figure 2B), was mounted on the small rotation stage (Thorlabs GmbH, Bergkirchen, Germany, Cat#KM100 or Eksma Optics Cat# 960-0170), which could be motorized, or on the static 5-axis platform (Thorlabs GmbH, Germany, Cat# PY005/M) (see
Figure 3) in the case of the modified SPR microscopy sensor.
The initial steps of the flow cell assembling process are very similar for both the primary-version SPR microscopy instrument and its updated version (
Figure 3), developed within the EC-FP7 project ”Nanodetector”. However, there are some differences: for example, for the improved version of the SPR microscopy sensor, smaller prisms are employed (SF10 glass prisms sizes
were produced by Eksma Optics as a part of the EU-Nanodetector equipment); moreover, as mentioned above, an SPR prism with a gold sensor has to be mounted on the static 5-axis platform, which helps to adjust the exact position of a prism and a flow cell near the objective. Thus, in the updated version of the SPR microscopy sensor, the prism, with an assembled flow cell and a gold sensor inside, remains motionless; in the primary version of the SPR microscopy sensor, the situation is the opposite: the prism is mounted on the rotation platform, and thus, can rotate.
2.1.2. The Main Mechanical Parts of the Archetypal Hand-Constructed SPR Microscopy Sensor and Its Modified Version
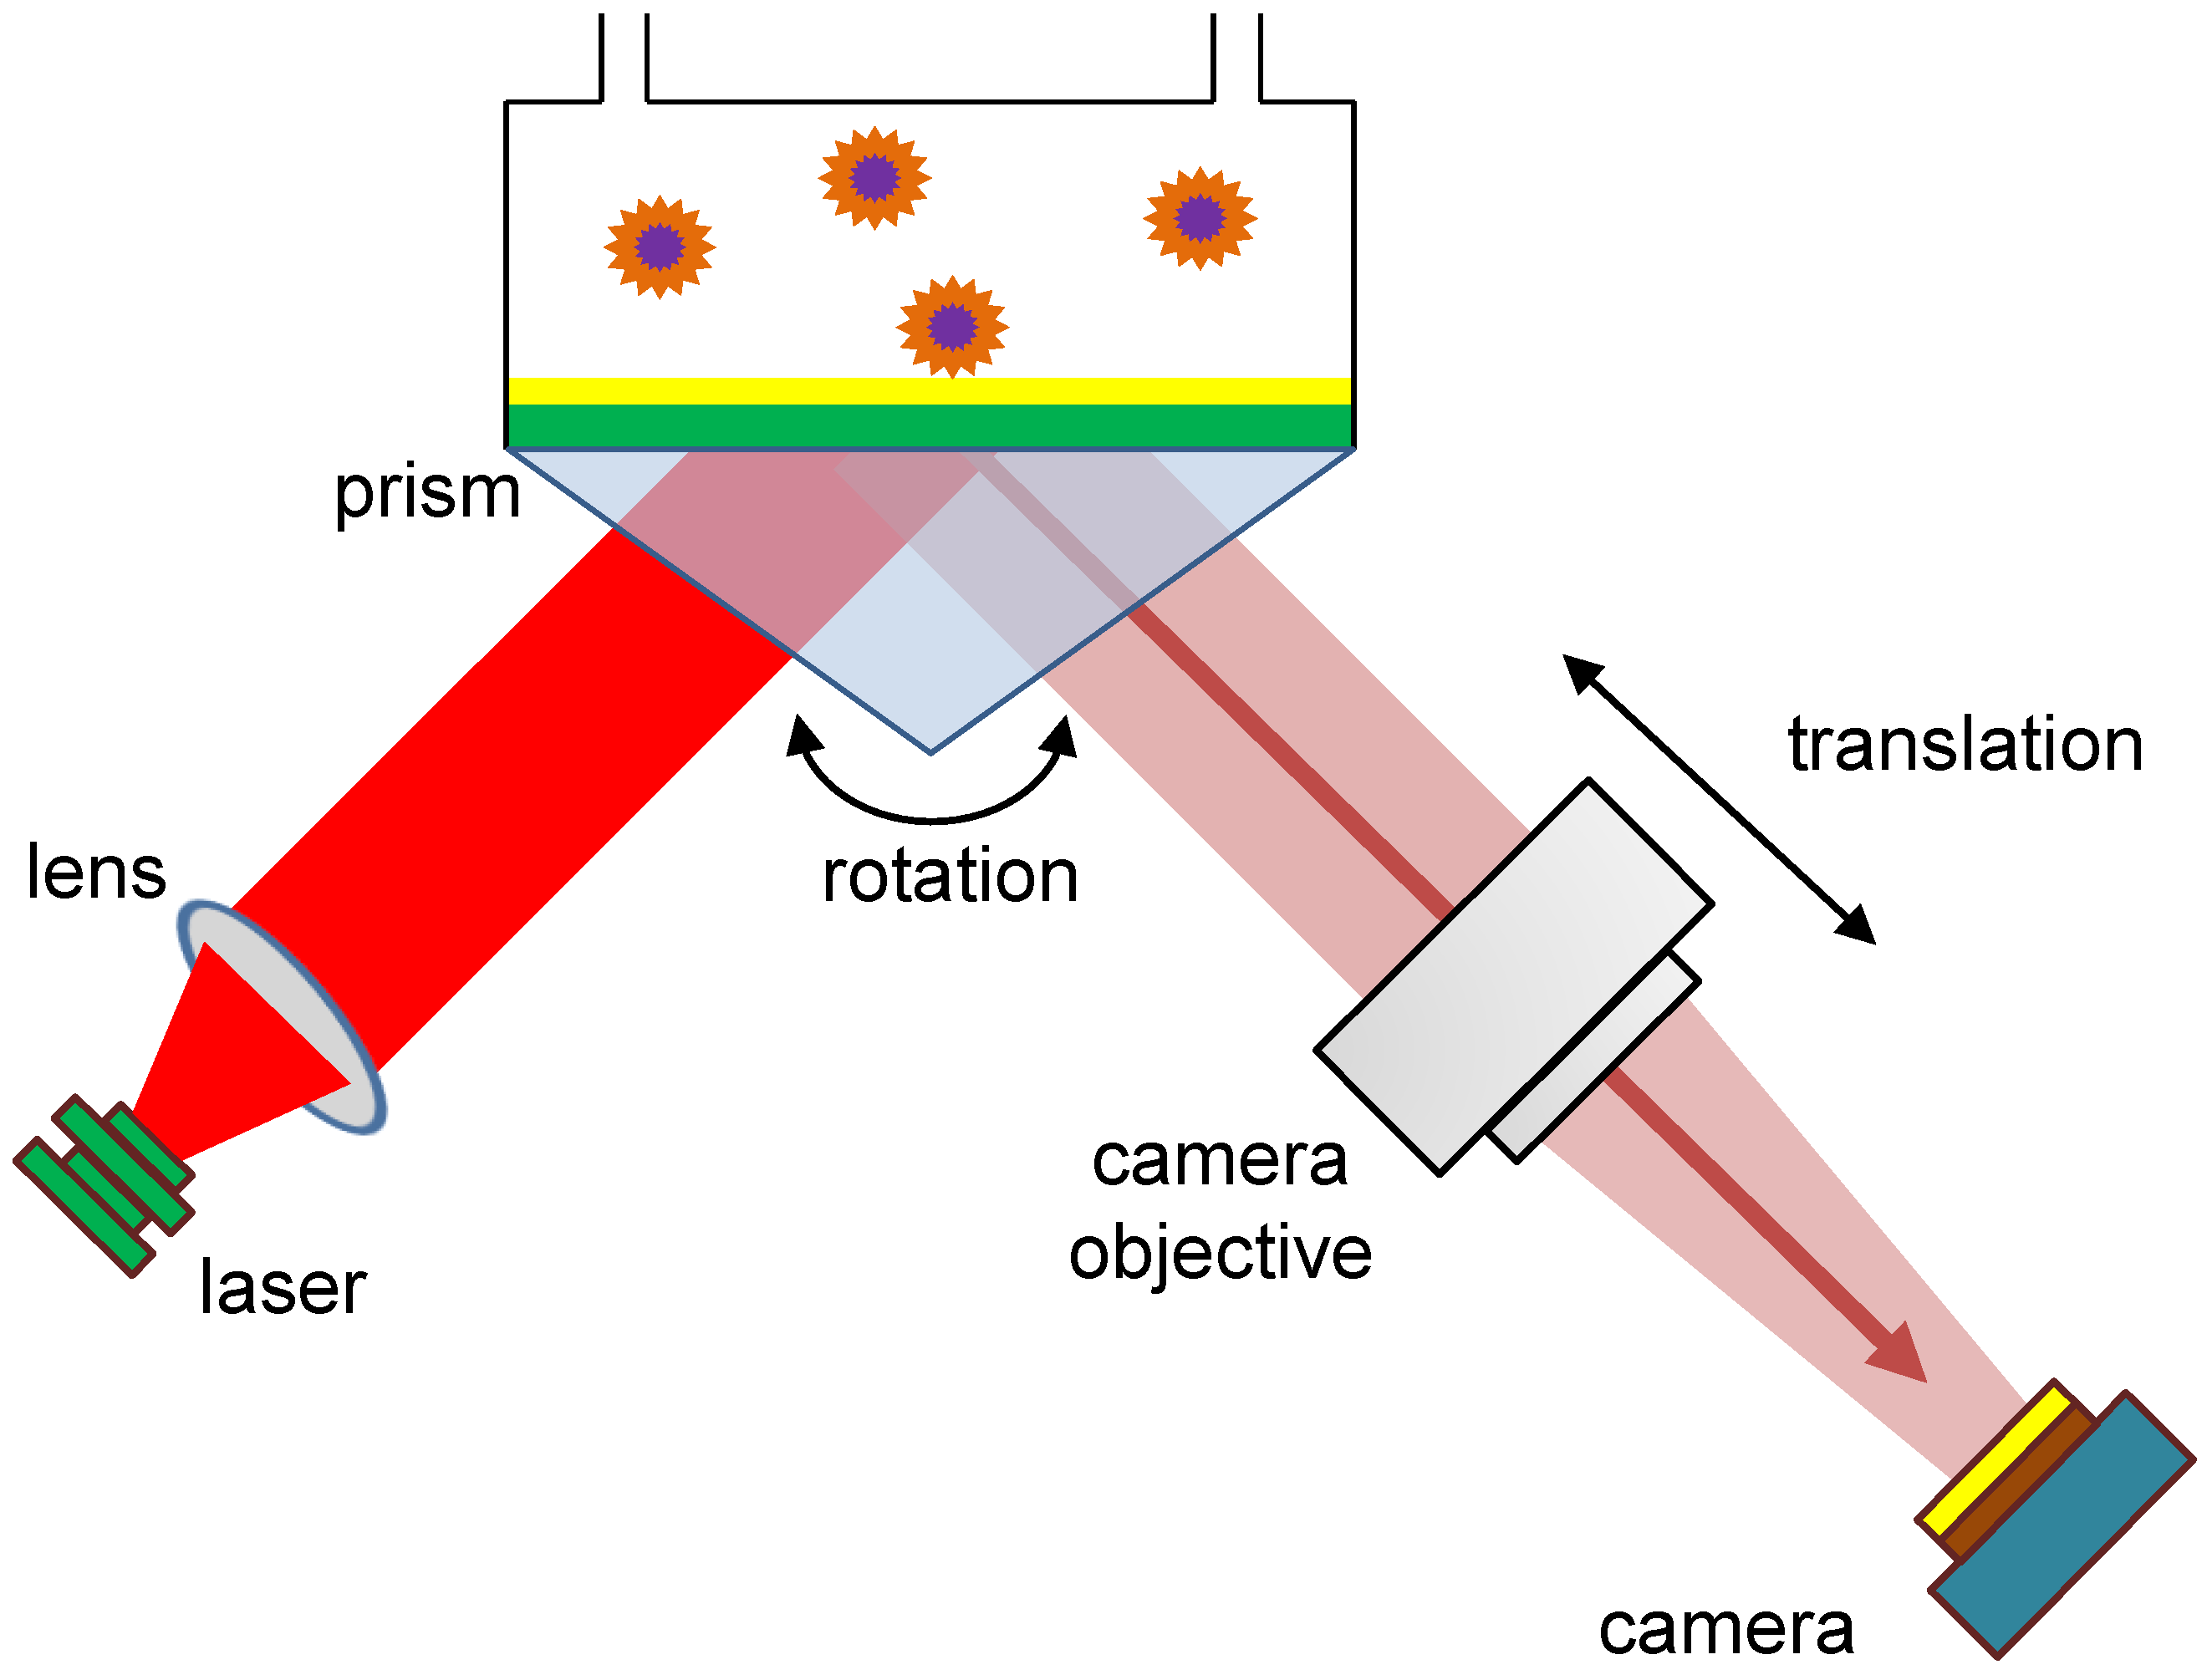
In the Kretschmann scheme, as shown in
Figure 4, the gold sensor layer can be illuminated through the glass prism by a collimated beam of the superluminescent diode or a laser diode. For the primary-version SPR microscopy sensor, a superluminescent diode (QSDM-680-9; QPhotonix, Ann Arbor, MI, USA) or a laser diode HL6750MG (Thorlabs GmbH, Germany) demonstrated their applicability [
7]. Both diodes provided the excitation wavelength of the incidence beam
. In the case of the modified version of the SPR microscopy instrument, the wavelength used in the incidence beam was
, and an SM-fiber-coupled diode was employed (Thorlabs GmbH, Germany). For both instruments, current and temperature controllers from Thorlabs (Cat# LDC202C or LDC205C Benchtop LD current controller and Cat# TED 200C temperature controller) were employed. In the modified version of the SPR microscopy sensor, a beam was collimated by a 16
-focus-length objective (MVL16, Thorlabs GmbH, Germany) and was directed through a 14
-free-aperture Glan polarizer (from Eksma Optics,
www.eksmaoptics.com, accessed on 2 April 2023), to create p-polarized light. In the setup of the primary-version SPR microscopy instrument, a Glan–Taylor polarizer (Cat# GT10-A; Thorlabs GmbH, Germany) was employed to achieve the p-polarization of the light illuminating the gold sensor surface. A 50
Minolta Rokkor MD photo-objective, with an aperture of
, was used to image the gold surface signals with a video camera. An objective from Canon (Canon Compact Macro Lens EF 50
1:2.5) could also be employed for the gold sensor surface imaging. Different CMOS and CCD image sensor chips have proved their power for detecting individual nanoparticles in SPR microscopy instruments. As with the primary version, the modified version of the SPR microscopy instrument used an MT9P031 CMOS image sensor chip with a resolution of 5 Megapixels; in the primary version of the SPR microscopy instrument, this CMOS chip was used in a DMK23UP031 camera, produced by Imaging Source (Bremen, Germany). This chip possesses a pixel size of
. However, for the primary version of the SPR microscopy sensor, a 5-megapixel GC2450 Prosilica camera (Allied Vision, Stadtroda, Germany), with a Sony ICX625 CCD image sensor and a pixel size of
, also proved its efficiency at detecting extracellular vesicles [
6], viruses, and virus-like particles [
7].
2.1.3. Functionalization of the Gold Sensor Surface for Detecting Biological NPs Employing SPR Microscopy Instruments
After cutting and cleaning the “gold sensors” (
Section 1.1 in Supplementary Materials), sensor surface functionalization can be performed. The functionalization steps for the detection of inorganic nanoparticles (polystyrene and silica) are described in
Section 1.2 in the Supplementary Materials. Here, we describe the steps for the detection of bioNPs. The following self-assembling monolayers (SAMs) are formed on the sensor surface: (1) the first layer is formed by cysteine-conjugated protein A/G (cys-protein A/G) (from BioTechne, Wiesbaden, Germany; Cat# NBP2-34862-5mg;
www.novusbio.com, accessed on 2 April 2023); (2) the second layer is constituted by anti-target antibodies. For the detection of extracellular vesicles (EVs), anti-CD81 (Santa Cruz Biotechnology, Heidelberg, Germany, clone 5A6, Cat#sc-23962 or BD Biosciences, Heidelberg, Germany, clone JS-81, Cat#555675), anti-CD63 (BD Biosciences, clone H5C6, Cat#556019), and anti-CD9 (Dianova, Hamburg, Germany, clone VJ1/20, Cat#9PU-01MG or Santa Cruz Biotechnology, clone ALB6, Cat#sc-59140) antibodies can be employed. Moreover, using cys-protein A/G as an intermediator layer between the gold sensor surface and the layer of anti-target antibodies helps to re-use the same gold sensor at least three times [
6]. The antibodies can be eluted with captured bioNPs, and replaced by the same or different antibodies [
6]. Cys-protein A/G was used to coat a gold sensor surface at a concentration of 30
/mL. Anti-target antibodies (CD81, CD63, or CD9) were used in a concentration of 10
/mL to be immobilized on the cys-protein A/G layer for further capturing of EVs isolated from HT29 or human mesenchymal cells. Unbound cys-protein A/G and antibodies were removed via washing steps, which were performed by applying PBS (Pan Biotech GmbH, Aidenbach, Germany,
calcium and magnesium, pH = 7.4). The saturation stage of each monolayer formation was indicated by a uniform and temporally constant background image. Thus, the formation of each monolayer (cys-protein A/G and antibodies) could also be monitored on the SPR microscopy instrument. The coating of a gold sensor with cys-protein A/G and antibody was performed for approximately 40
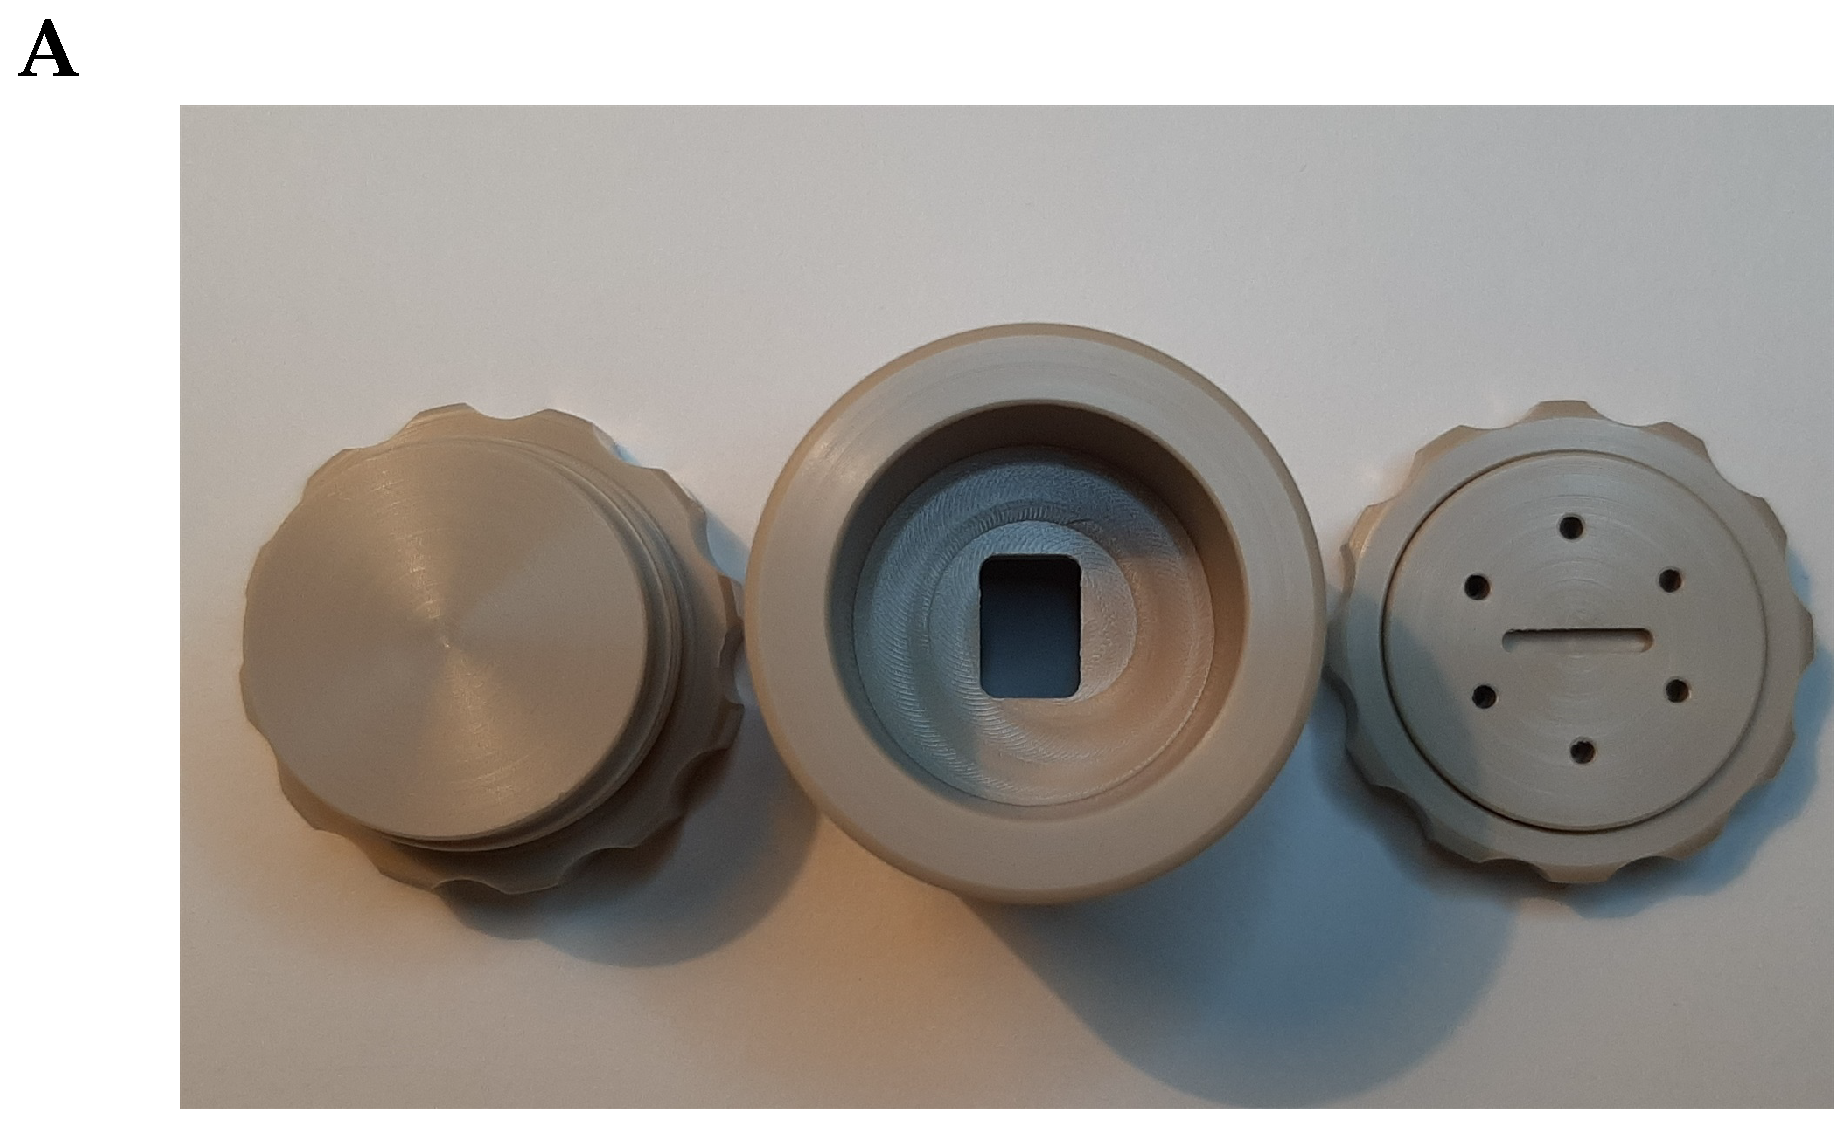
for each step. However, to minimize the time a gold sensor was placed in the SPR microscopy instrument, a custom-constructed ”coating chamber” was applied (see
Figure 5). In this coating chamber, a gold sensor was located in such a way that only the gold surface, not the glass one, was exposed to the PBS solution containing cys-protein A/G or antibodies. The coating could be performed at room temperature (RT) for 2 h on a shaker (CAT Ingenierbüro M. Zipper GmbH, Germany, Model#S20) at approximately a speed of 300 movements per minute or overnight at +4
. Exposure of the glass surface to the protein-containing solution would have resulted in problems during the SPR microscopy measurements.
2.2. Cell Culture
2.2.1. Culture of HT29 Cells and Collection of the Cell Culture Medium Containing Extracellular Vesicles (EVs)
HT29 cells were thawed at passage 6, seeded in a monolayer at a density of 5000 cells per , and further expanded in McCoy’s Medium A5 supplemented with 1% penicillin/streptomycin and 10% heat-inactivated FBS (Sigma-Aldrich, Darmstadt, Germany). The cells were kept under standard culture conditions (37 and 5% CO) in a humidified incubator, and medium exchange was performed every 2–3 days. The HT29 cells were maintained in a complete culture media. When the HT29 cells reached 80% confluence, the old culture media was aspirated, and the cells were washed with pre-warmed (37 ) sterile PBS twice, and once with complete culture media containing 10% heat-inactivated and exosomes-depleted FBS (Gibco via ThermoFisher, Cat#A2720803): this process eliminated the presence of EVs of bovine origin. Afterward, the cells were cultured with the same media for 48 before the collection of conditioned media (CM). The CM aliquots were centrifuged at 3000× g for 10 , and the supernatants were transferred to new tubes without disturbing the pellet: this step was essential to excluding cell debris and apoptotic bodies. The supernatants received this way were divided into three portions, each containing 20 mL. The portions were filtered using filters to collect EVs of different sizes. CM samples were kept at for further processing in EV isolation, using different approaches.
2.2.2. Isolation of EVs Produced by HT29 Cells
To evaluate EV isolation based on membrane affinity spin columns, we employed an exoEasy Maxi kit from Qiagen and followed the isolation steps recommended by the manufacturer. In brief, frozen CMs were thawed and then re-filtered to remove cryo-precipitate. CM was mixed in a 1:1 ratio with XBP buffer, with further gentle inverting at room temperature. The XBP/CM mixture was added to the exoEasy spin column, centrifuged at 500× g for 1 , and then the flow-through was discarded: this step was repeated until the whole volume was centrifuged. Next, 10 mL of washing buffer was added to the membrane, centrifuged at 5000× g for 5 , and the flow-through was discarded. The spin column was then transferred to a new collection tube. A 400 L volume of Elution buffer was added to the membrane of the spin column, and the column was centrifuged at 500× g for 5 . Another 400 L of elution buffer was added to the membrane and was centrifuged at 5000× g for 5 . Aliquots of 100 L of EVs in elution buffer were kept at for further processing in SPR microscopy measurements. Another approach, which was also tested, is based on the ability of certain compounds to tie up and force less-soluble EVs out of the solution. We applied, for this type of EV isolation, Total Exosome Isolation (from cell culture media) reagent (Invitrogen): this reagent helps to concentrate EVs from cell culture media after overnight incubation with collected media samples, followed by their centrifugation at 10,000× g for 1 at 2 to 8 .
2.2.3. Culture of Human Mesenchymal Cells (MSCs)
Human bone marrow (BM) aspirates from healthy donors were obtained, following informed consent according to the Declaration of Helsinki. Their usage was approved by the ethics committee of the University of Duisburg–Essen (12-5295-BO). To raise MSCs, aliquots of the obtained BM aspirates were seeded into cell culture flasks containing endothelial basal media (EBM-2, Lonza, Köln, Germany), supplemented by 10% human platelet lysate (PL; produced by the working team of Prof. Dr. Giebel), and provided by a Lonza bullet kit. After incubation for 24
at 37
in a 5%
atmosphere, non-adherent cells were removed by the medium exchange to DMEM low glucose (PAN Biotech GmbH, Aidenbach, Germany), supplemented by 10% PL, 100 U/mL penicillin–streptomycin–glutamine (Thermo Fisher Scientific, Darmstadt, Germany), and 5 IU/mL heparin (RatioPharm, Ulm, Germany). The cells were continuously cultured at 37
in a 5%
atmosphere and were regularly screened microscopically until the first MSC colonies became visible. Following trypsin/EDTA (Sigma-Aldrich, Darmstadt, Germany) treatment, including a washing step, the adherent cells were re-seeded, at densities of approximately 1000 cells per
, into 4-layer-stack cell factoryTM systems (Thermo Fischer Scientific GmbH, Schwerte, Germany). Within the second passage, the MSCs were analyzed according to the criteria of the International Society of Cell and Gene Therapy (ISCT) [
23]. Upon reaching densities of approximately 50% confluence, the conditioned media (CM) were changed every 48
. At 80% confluence, the MSCs were passaged. Before preserving the CM, cells and larger debris were removed via centrifugation at 2000×
g for 15
. MSC-free CMs were stored at
.
2.2.4. Isolation of EVs from MSCs
For EV harvesting, the CM were thawed and further purified, following 45 min 6800×
g centrifugation (Rotor: JS-5.3; Beckman Coulter), by a subsequent
filtration step using rapid-flow filter (Nalgene, Thermo Fisher Scientific). The EVs were precipitated in 10% polyethylene glycol 6000 (PEG) and 75 mM sodium chloride (NaCl) by overnight incubation and subsequent centrifugation at 1500×
g and 4
for 30
, as described previously [
24,
25]. The pelleted EVs were re-suspended and washed with a sterile 0.9% NaCl solution (Braun, Melsungen, Germany). Next, the EVs were re-precipitated by ultracentrifugation at 110,000×
g for 130
(XPN-80, Ti45 rotor, k-factor: 133). Finally, the EV pellets were re-suspended in 10 mM HEPES 0.9% NaCl buffer (Thermo Fisher Scientific, Darmstadt, Germany). MSC–EVs preparations were stored at
until use in SPR microscopy experiments.
2.3. Image Processing and Analysis
2.3.1. Detecting the Binding of Polystyrene or Silica Particles to the Gold Sensor Surface of the Modified SPR Microscopy Sensor
For the detection of the binding of polystyrene 100
, 200
, 300
, and 400
in diameter, or silica nanoparticles 200
and 800
in diameter, to the gold sensor surface, gold sensors functionalized with “Nüscoflock” were used (see
Section 1.1 in Supplementary Materials). Prior to the measurements, all NP suspensions were incubated in an ultrasonic water bath Elmasonic S10-H (Elma, Singen, Germany) for a duration of 10–15 min to eliminate particle agglomerates. Nanoparticles were pumped through the flow cell as a suspension in distilled water containing 0.1% sodium chloride. For pumping, silicon tubing (IDEX Health and Science, Germany; ID of the product:
; color orange/yellow) and a peristaltic pump Rabbit, Peristaltic Pump (4-channel; Rainin Instruments, France) were used. Pumping was performed at a speed of 0.3 mL/min. Before and after each experiment, the flow cell system was washed with PBS (for the measurements of extracellular vesicles) or distilled water containing the appropriate concentration of sodium chloride (for the measurements of silica or polystyrene NPs). For the visualization of NP binding events, the beam incidence angle was chosen on the left (smaller angle) slope of the reflected intensity curve, near the minimum of the reflected intensity (resonance angle) [
18]. Therefore, the highest signal-to-noise ratio was expected at an angle close to the minimum of the reflected light intensity [
18]. Thus, measurements of inorganic NPs and bioNPs were performed at approximately
degrees before the SPR minimum. However, a different position was chosen for the visual control of SAM formation on the gold sensor surface: these measurements were performed at approximately
degrees before the SPR minimum.
2.3.2. Nanoparticle Image Recording and Image Processing
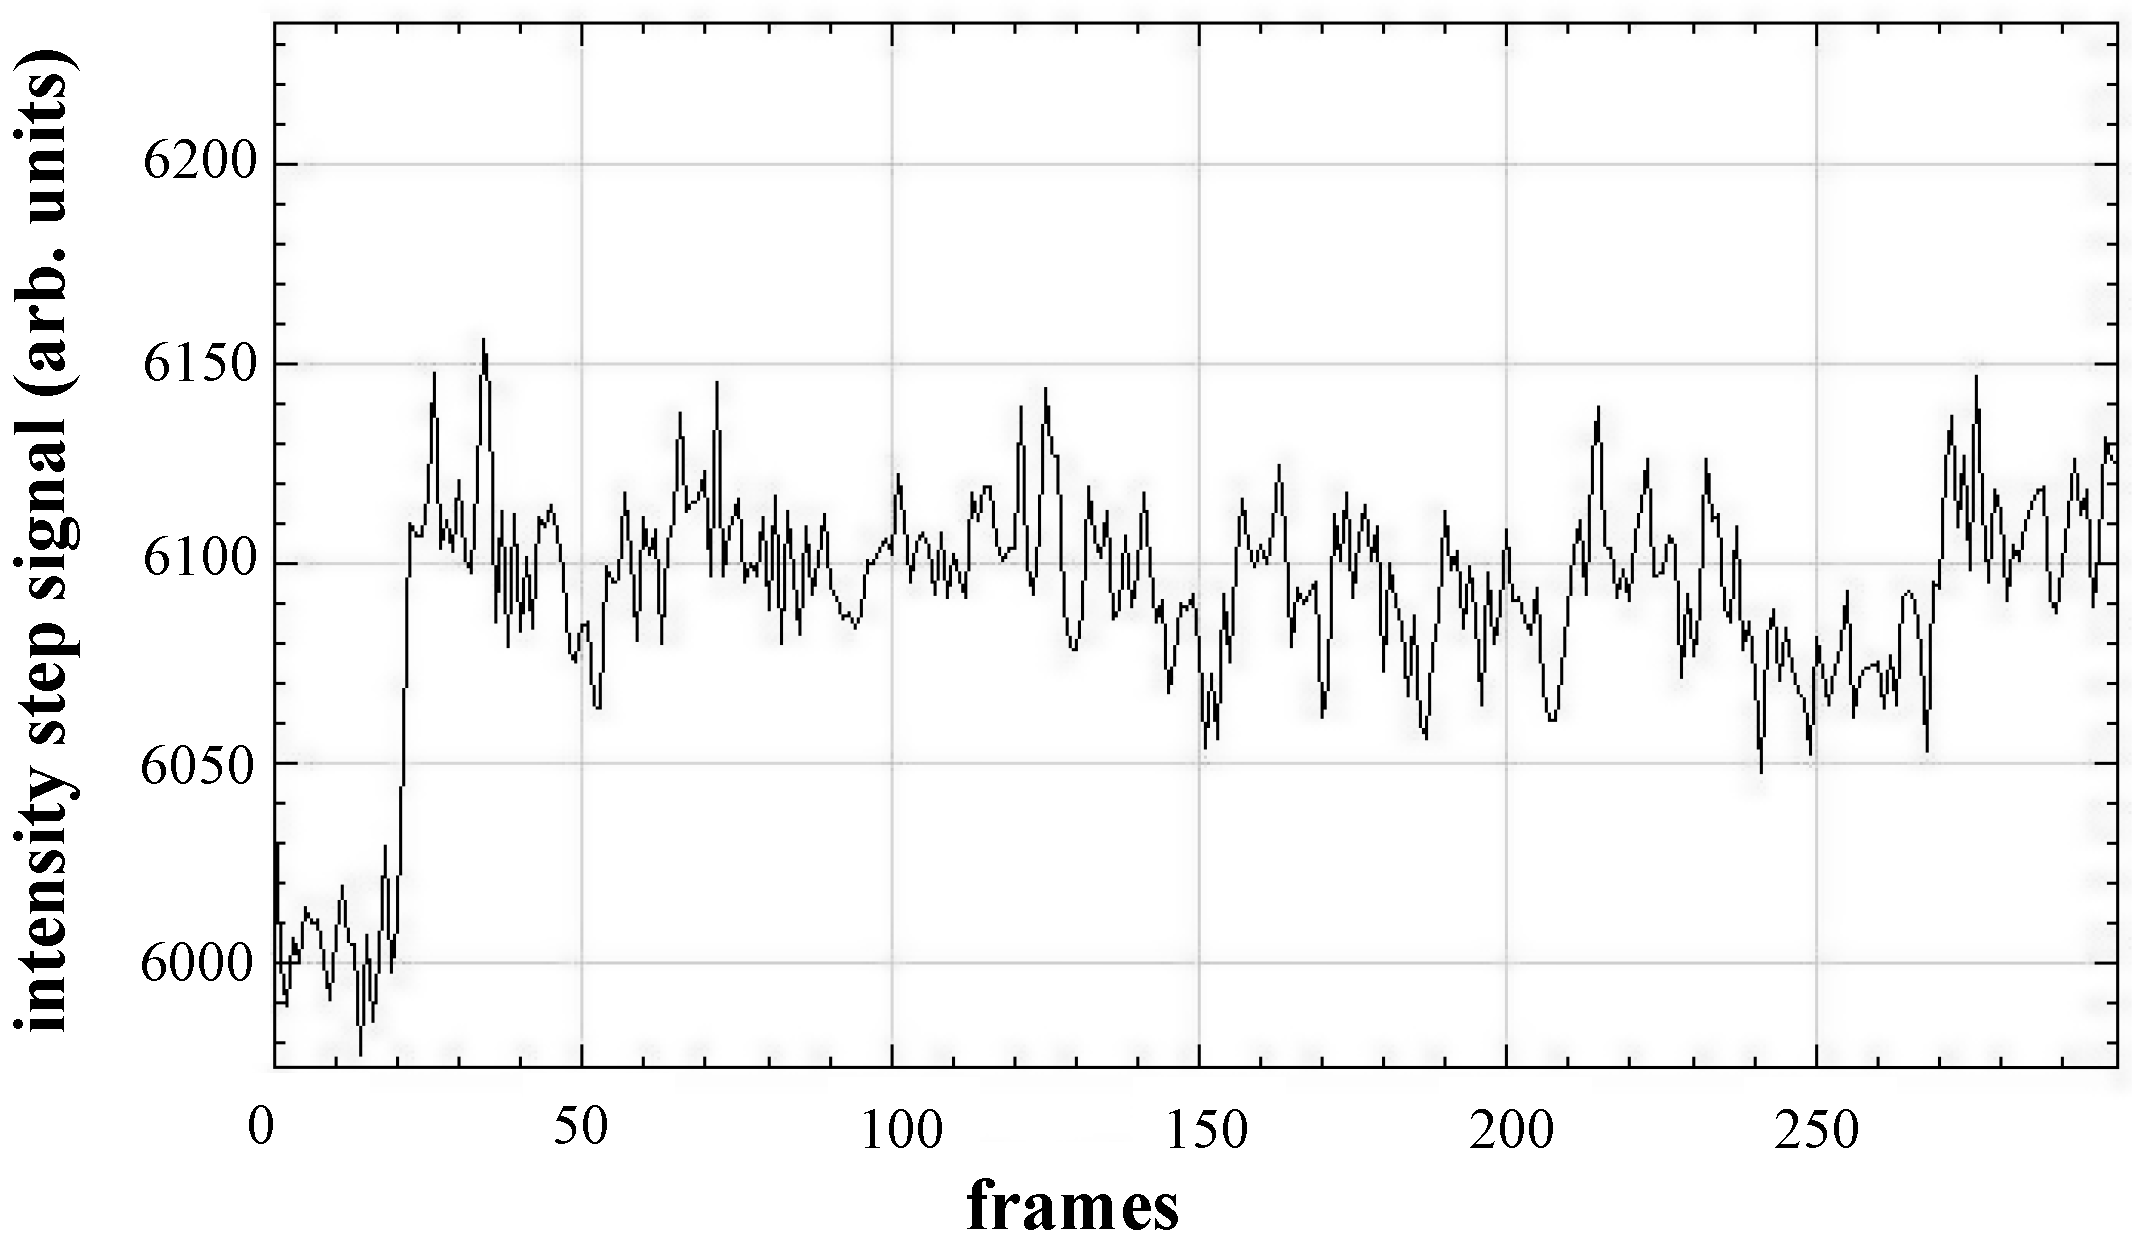
A characteristic feature of a nanoparticle binding event in the processed images is intensity changes—“step” signal—(see
Figure 6), which help to confirm the particle binding. This feature can be easily noticed during manual image processing (see
Section 1.2 Supplementary Materials).
However, manual processing of the recorded images is an ineffective procedure. Thus, different methods for analyzing recorded images have been developed and described [
22]. Recent improvements are based on machine learning methods and exploit their adaptivity to learning a tailored analysis from training data in order to find the characteristic features of particle regions [
27,
28,
29,
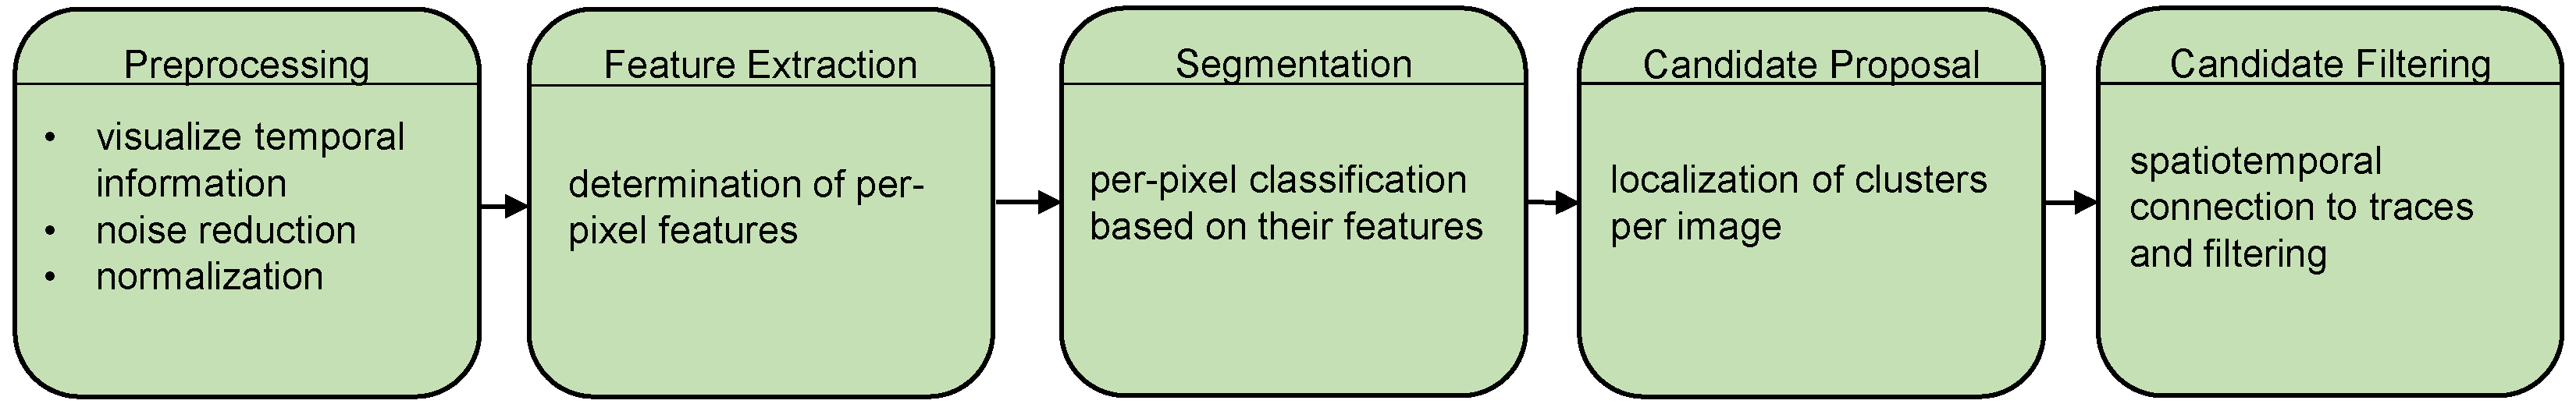
30]. Although individual approaches differ, they can usually be assigned to a meta-pipeline, as illustrated in
Figure 7. The first step is preprocessing, which renders particle signals expressed in time by the changed reflection behavior visible spatially. Next, characteristic features are extracted for each pixel or region of the image: This information is used to segment pixels whose features suggest particles of interest based on the features of their vicinity. Segmented clusters that match given criteria are then detected as candidates for single representatives of particles of interest. As those particles are not only visible on one image but over multiple frames, the candidates per image are connected spatiotemporally, so that multiple local detections form a particle trace. As the final step, non-plausible traces are filtered out based on spatial, temporal, or spatiotemporal criteria, and the remaining traces are seen as actual particles of interest.
An example of a concrete implementation is an approach that uses a U-Net [
31] on preprocessed images to generate features and segment them in one module [
27]. The candidate proposal is achieved via a Difference-of-Gaussian-based detector [
32], which processes the output of the U-Net. Next, the candidates of all the images are connected over time and filtered based on their length and missing frames in between multiple detections at one image region. As optical disturbances appear in each recording and can also be seen in different types—e.g., random noise, fixed-pattern noise, wave-like, or line-like artifacts [
27]—we developed an approach for achieving high robustness against image artifacts [
27]. In this approach, a U-Net was trained on real examples showing particles of interest combined with disturbance patterns. These patterns were generated by a generative adversarial network (GAN) [
33] that was trained on real disturbance patterns and was used to create an arbitrary amount of synthetic but realistic-looking images containing artifacts. By this method, the robustness of the detection against imaging artifacts increased [
27]. In the following, we also use this analysis method as a metric for optimizing the settings of the motors for reliable detection of particles.
2.4. Optimization of Adjustments via Sensor–Actuator Coupling
When preparing the SPR microscopy sensor for analysis, it must be adjusted beforehand: this means that after preparing the flow cell, the position of the camera objective and the rotation of the prism must be adapted to the current experimental requirements. In a typical experiment, the prism rotation and the camera objective translation are done by manual control of two stepper motors, which are shown schematically in
Figure 4, and as an actual setup in
Figure 1. The stepper motors (Eksma Optics, Lithuania,
www.eksmaoptics.com, accessed on 2 April 2023) employed for the adjustments in the primary version of the SPR microscopy instrument are the following: (1) motorized rotation stage small precision of 0.9 arcmin (Art.# 960-0170); (2) narrow motorized translation stage (Art.#960-0060). In order to control these motorized stages, a one-axis USB controller (Art.# 980-1045) was used. Aiming to reduce the need for manual interaction, we describe an approach to measuring the quality of the recorded images, tailored to the given task of nanoparticle detection: We propose an automation prototype based on that measure and evaluate it on sample recordings, with different configurations of the motorized sensor platforms.
2.4.1. Adjusting the Prism Rotation
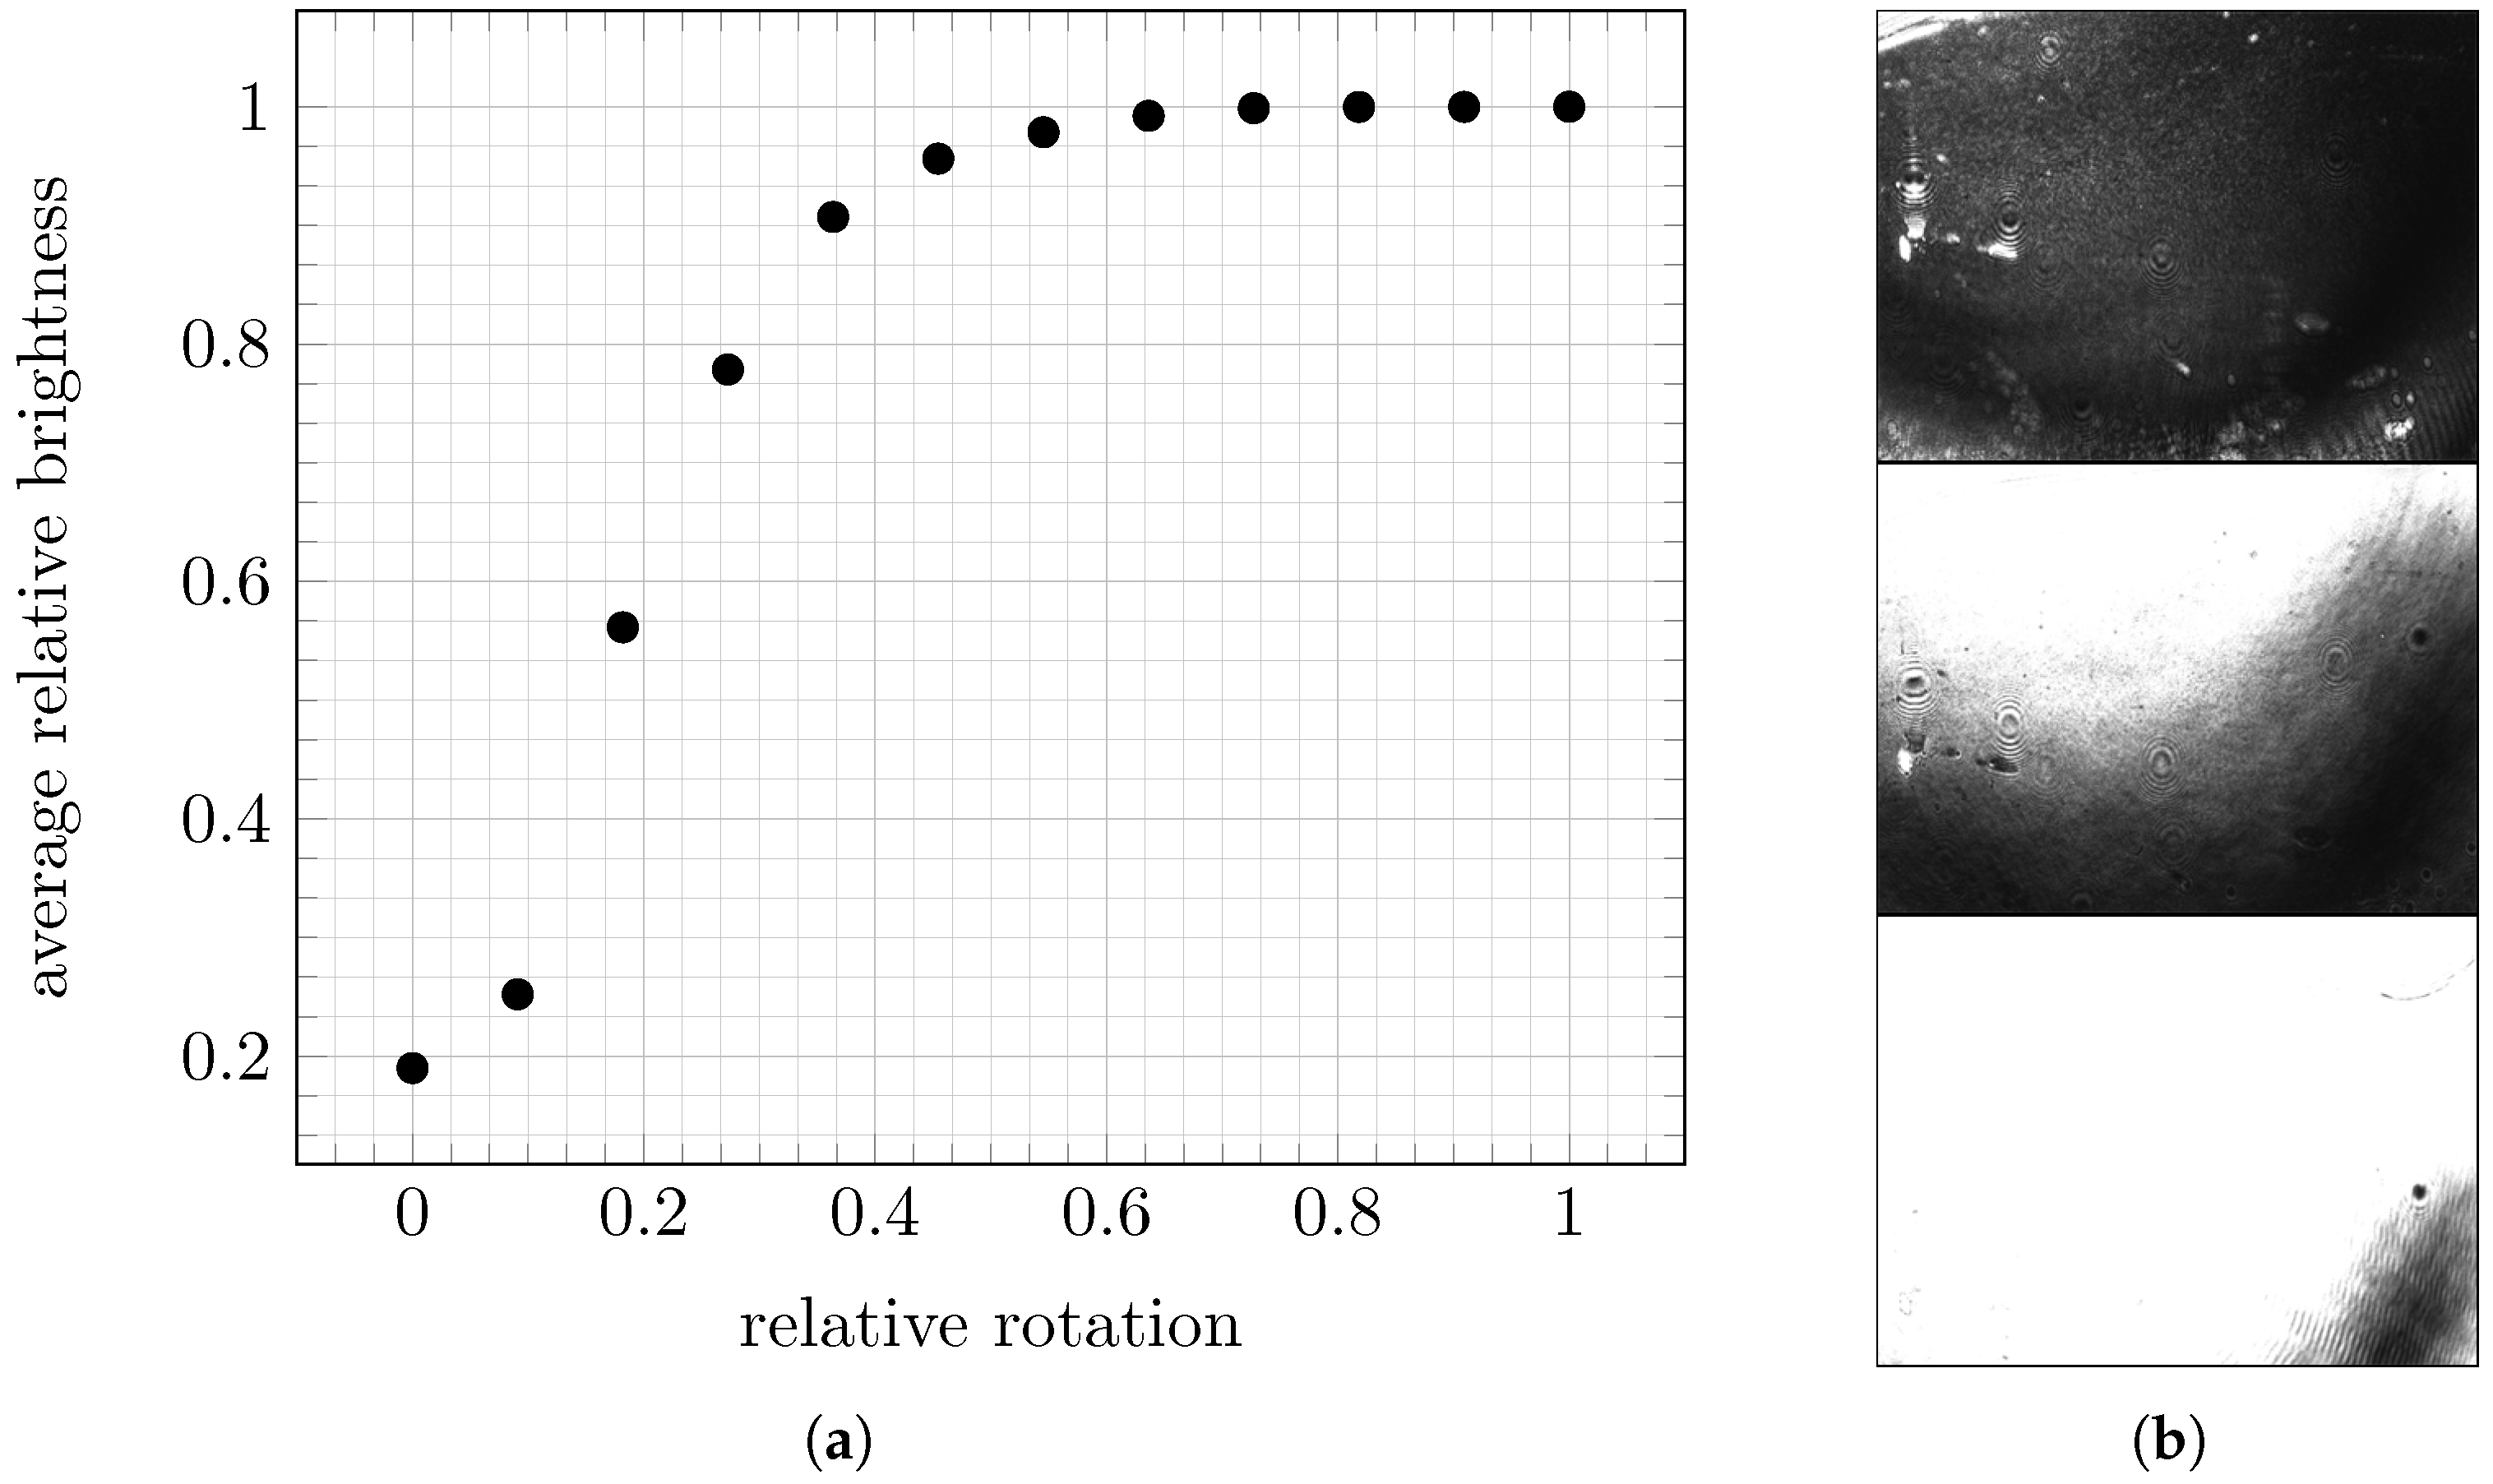
One factor in an optimal configuration to make nanoparticles detectable is the rotation angle of the prism, which influences the contrast between the particles of interest and background signals. At this point, a solution containing 0.1% sodium chloride in distilled water, but without particles of interest, is used for calibration. By rotating the prism, we approximate the angle of total reflection [
34] under which the reflected laser beam has the lowest intensity while still hitting the camera chip. As the analyzed solution does not contain any particles of interest, the intensity of the background signals is minimized. The possible range of rotation is given relatively, including only the positions in which two conditions are fulfilled: the laser hits the camera chip, and there is no risk that the prism rotation will physically pull the tubing for pumping the fluid through the flow cell.
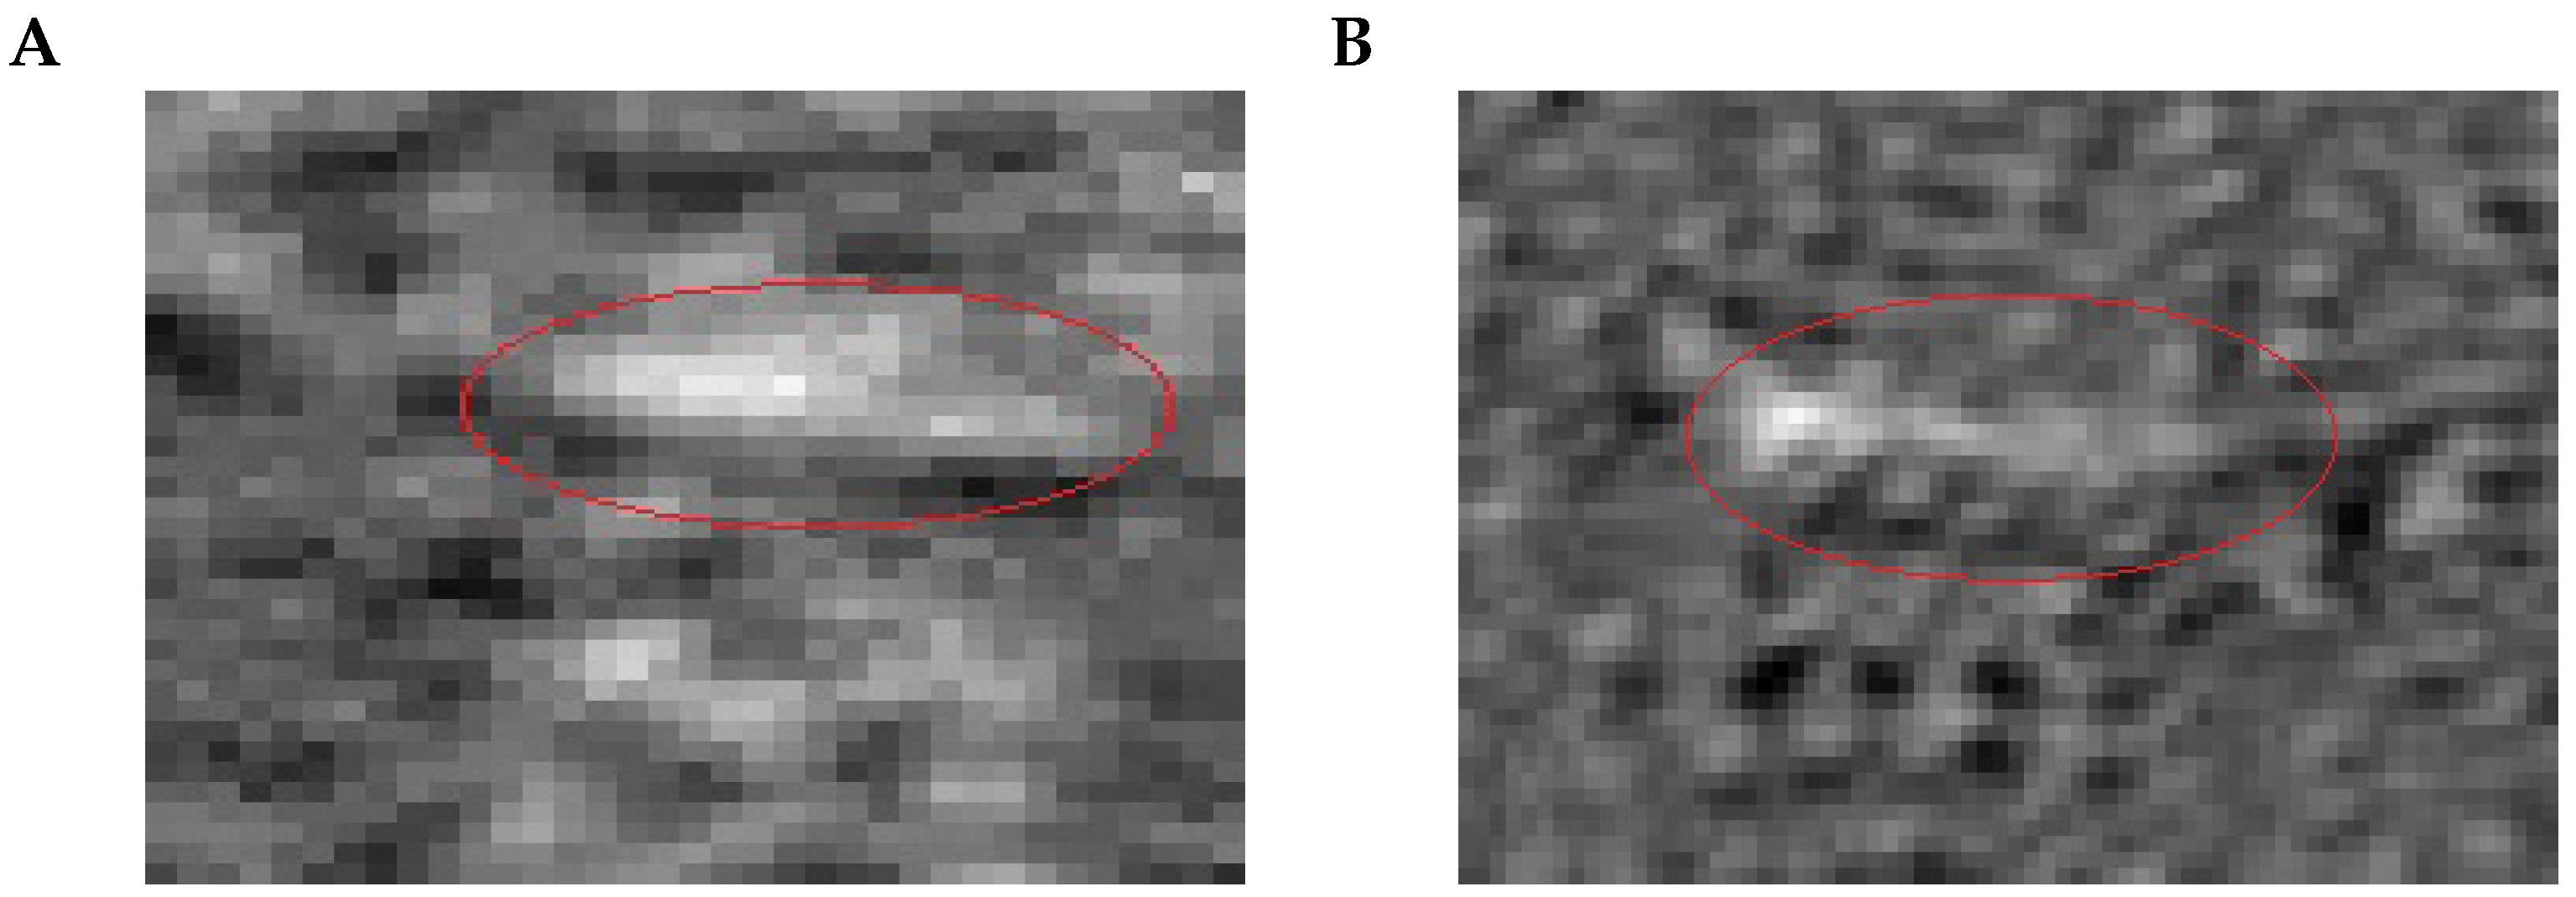
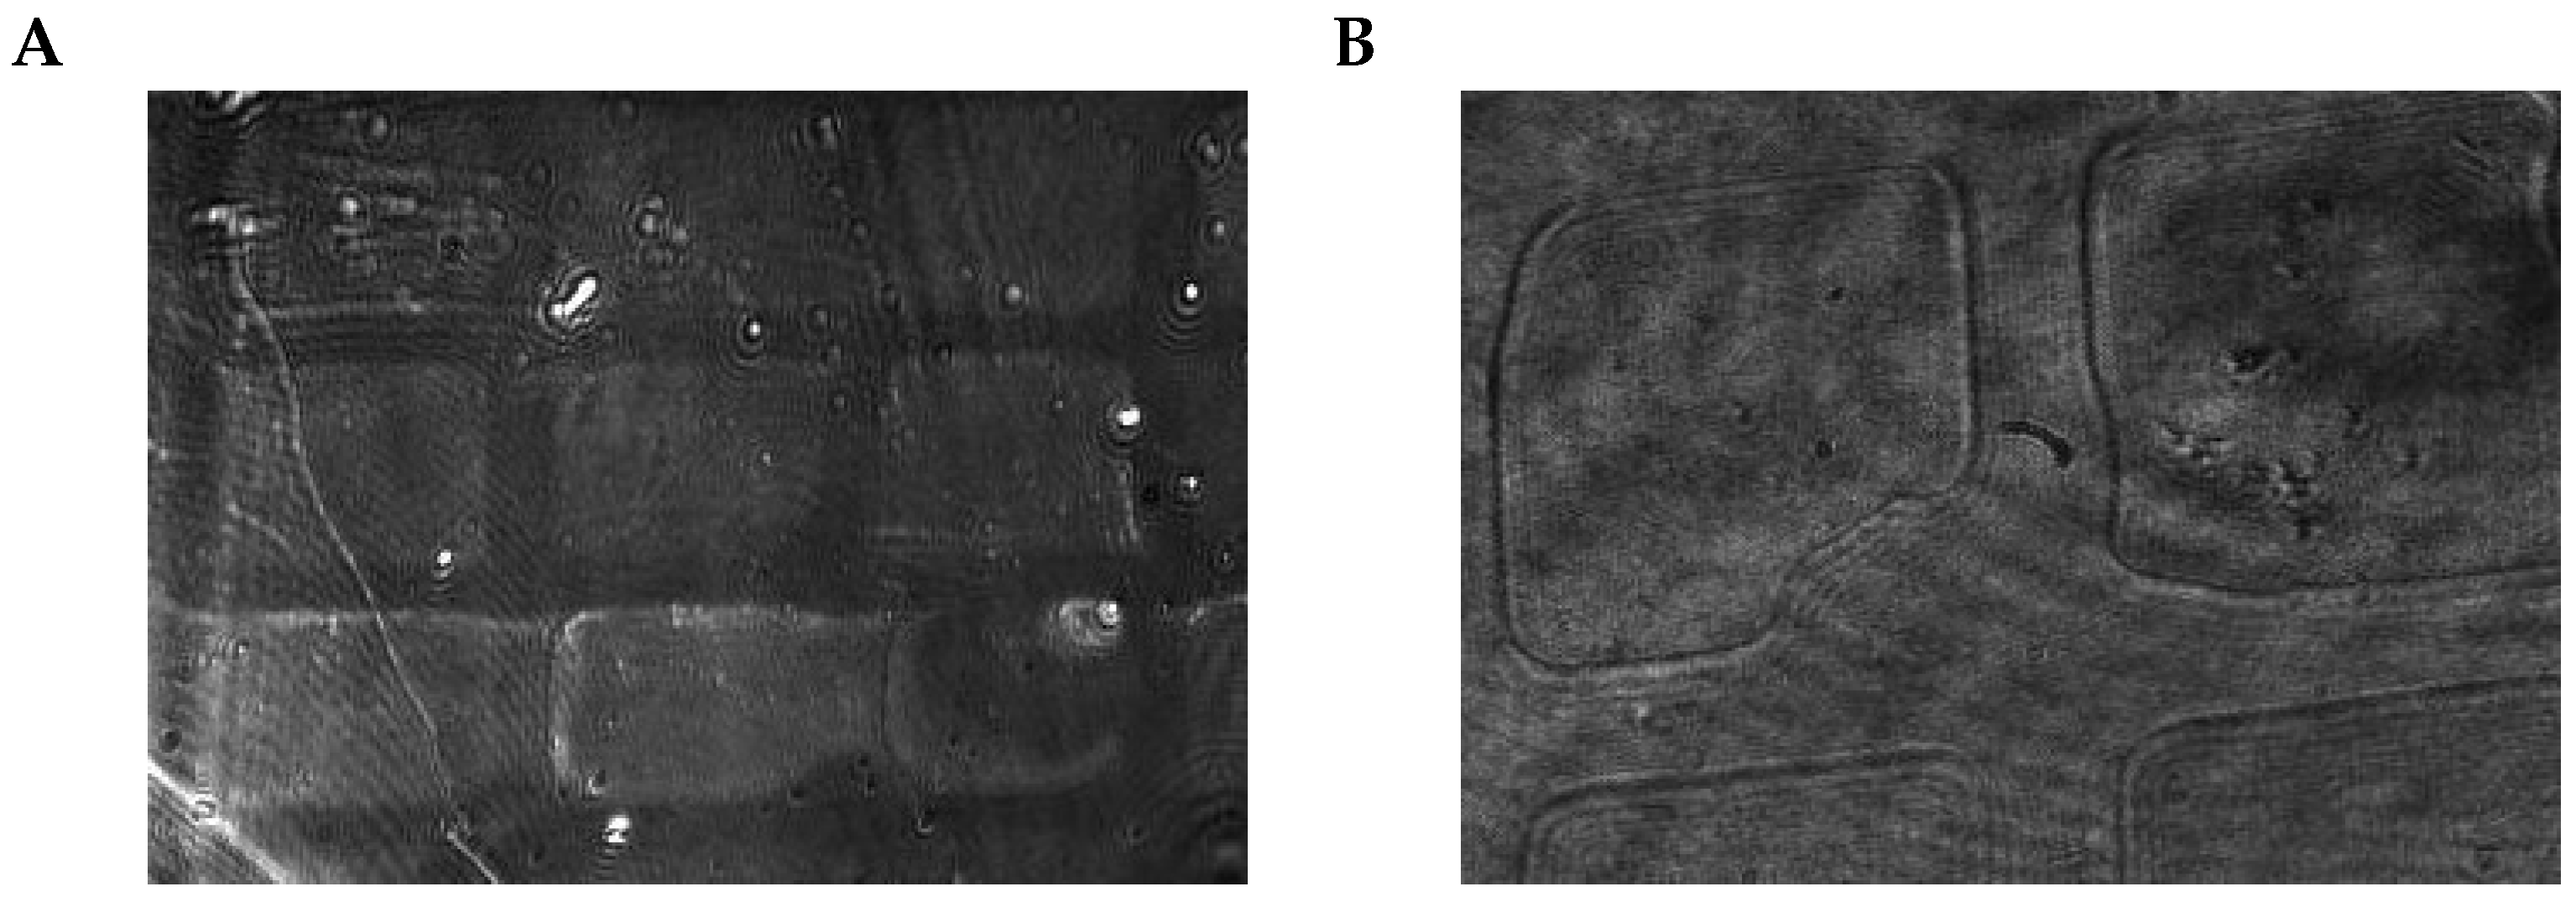
2.4.2. Adjusting the Camera Objective Translation
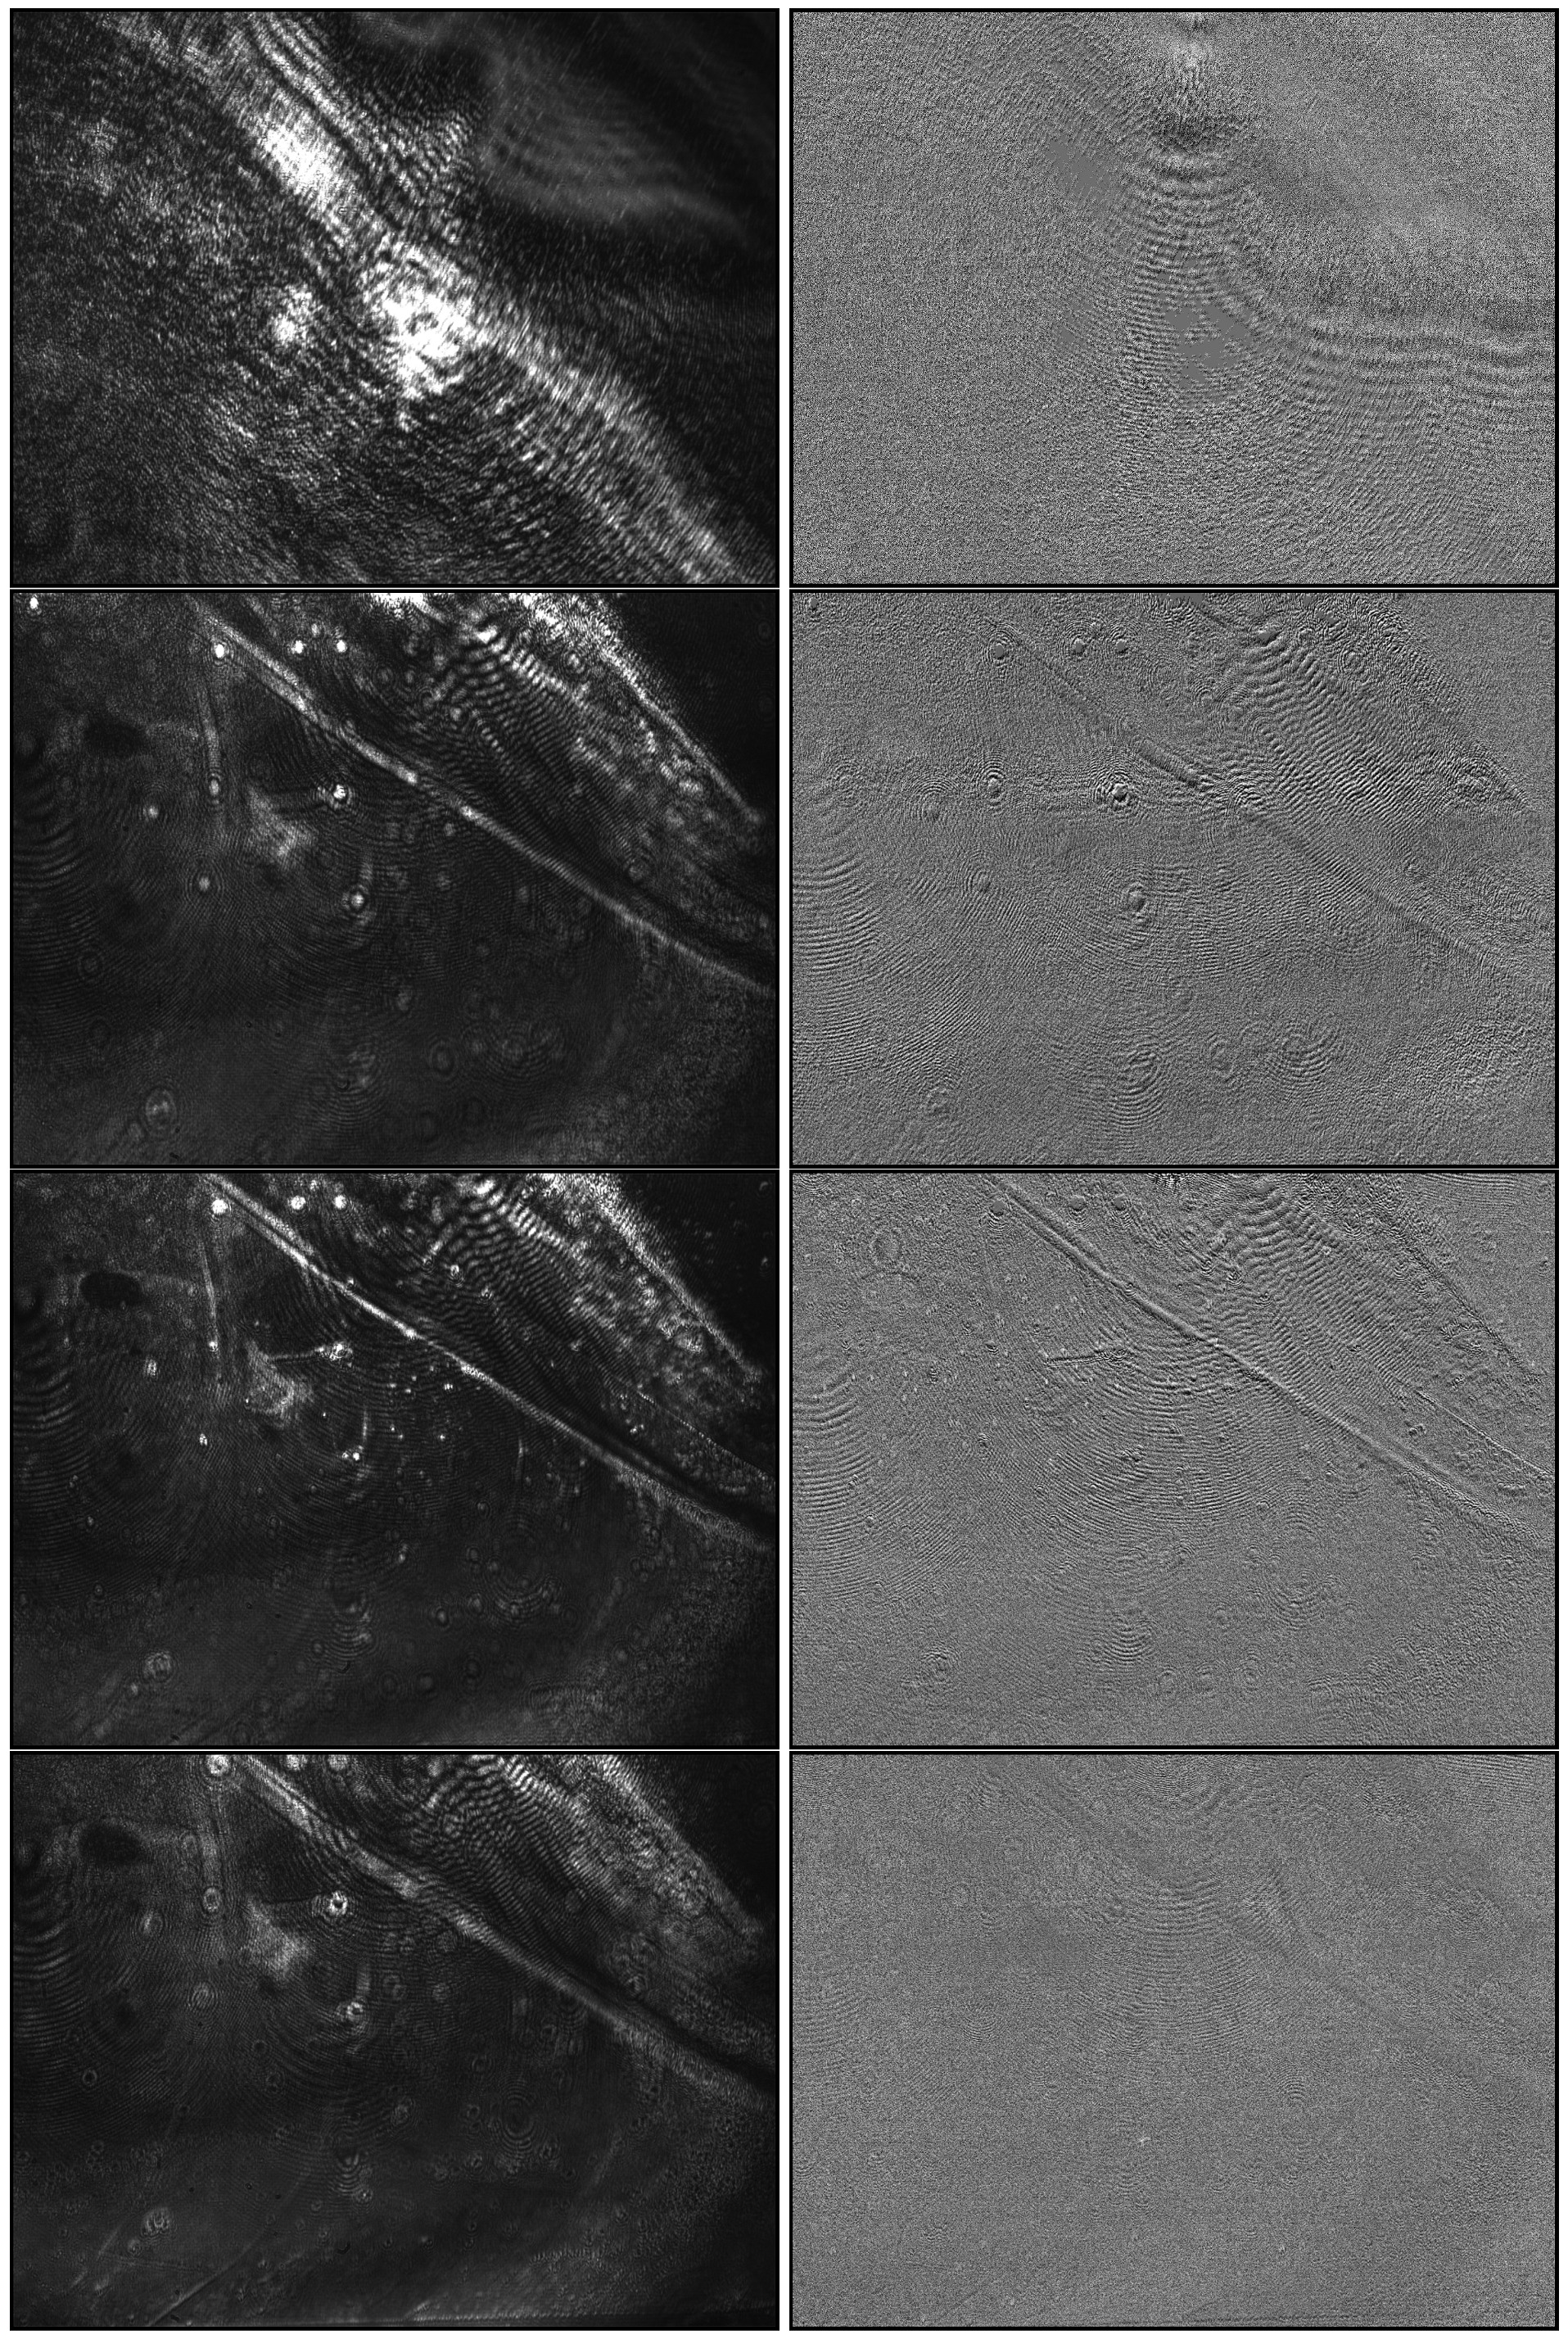
The second optimization determines the focus area by the position of the camera objective, and is characterized by particles being imaged as sharply as possible: this means that low distortion of the spots showing particle signals in preprocessed images provides optimal conditions for downstream particle detection. As particle detection is the main task and the reason for improving the adjustments, the detection method is used to measure image quality. Preprocessing is needed to make particles of interest visible for image analysis methods by extracting the changes in the signals over time instead of using the absolute intensities on each image.
Figure 8 shows raw and preprocessed images for selected example positions, containing in-focus and out-of-focus examples. As this approach relies on particle signals, sample particles are needed for calibration, and each position has to be held to record a sufficient amount of images. The reason for this is that particles attach over time: A longer acquisition time per position improves the accuracy but slows the overall process; a higher concentration of particles in the calibration sample can, on the other hand, reduce this time. In each case, the time requirement is relativized by the fact that the calibration process does not have to be repeated for each follow-up analysis.
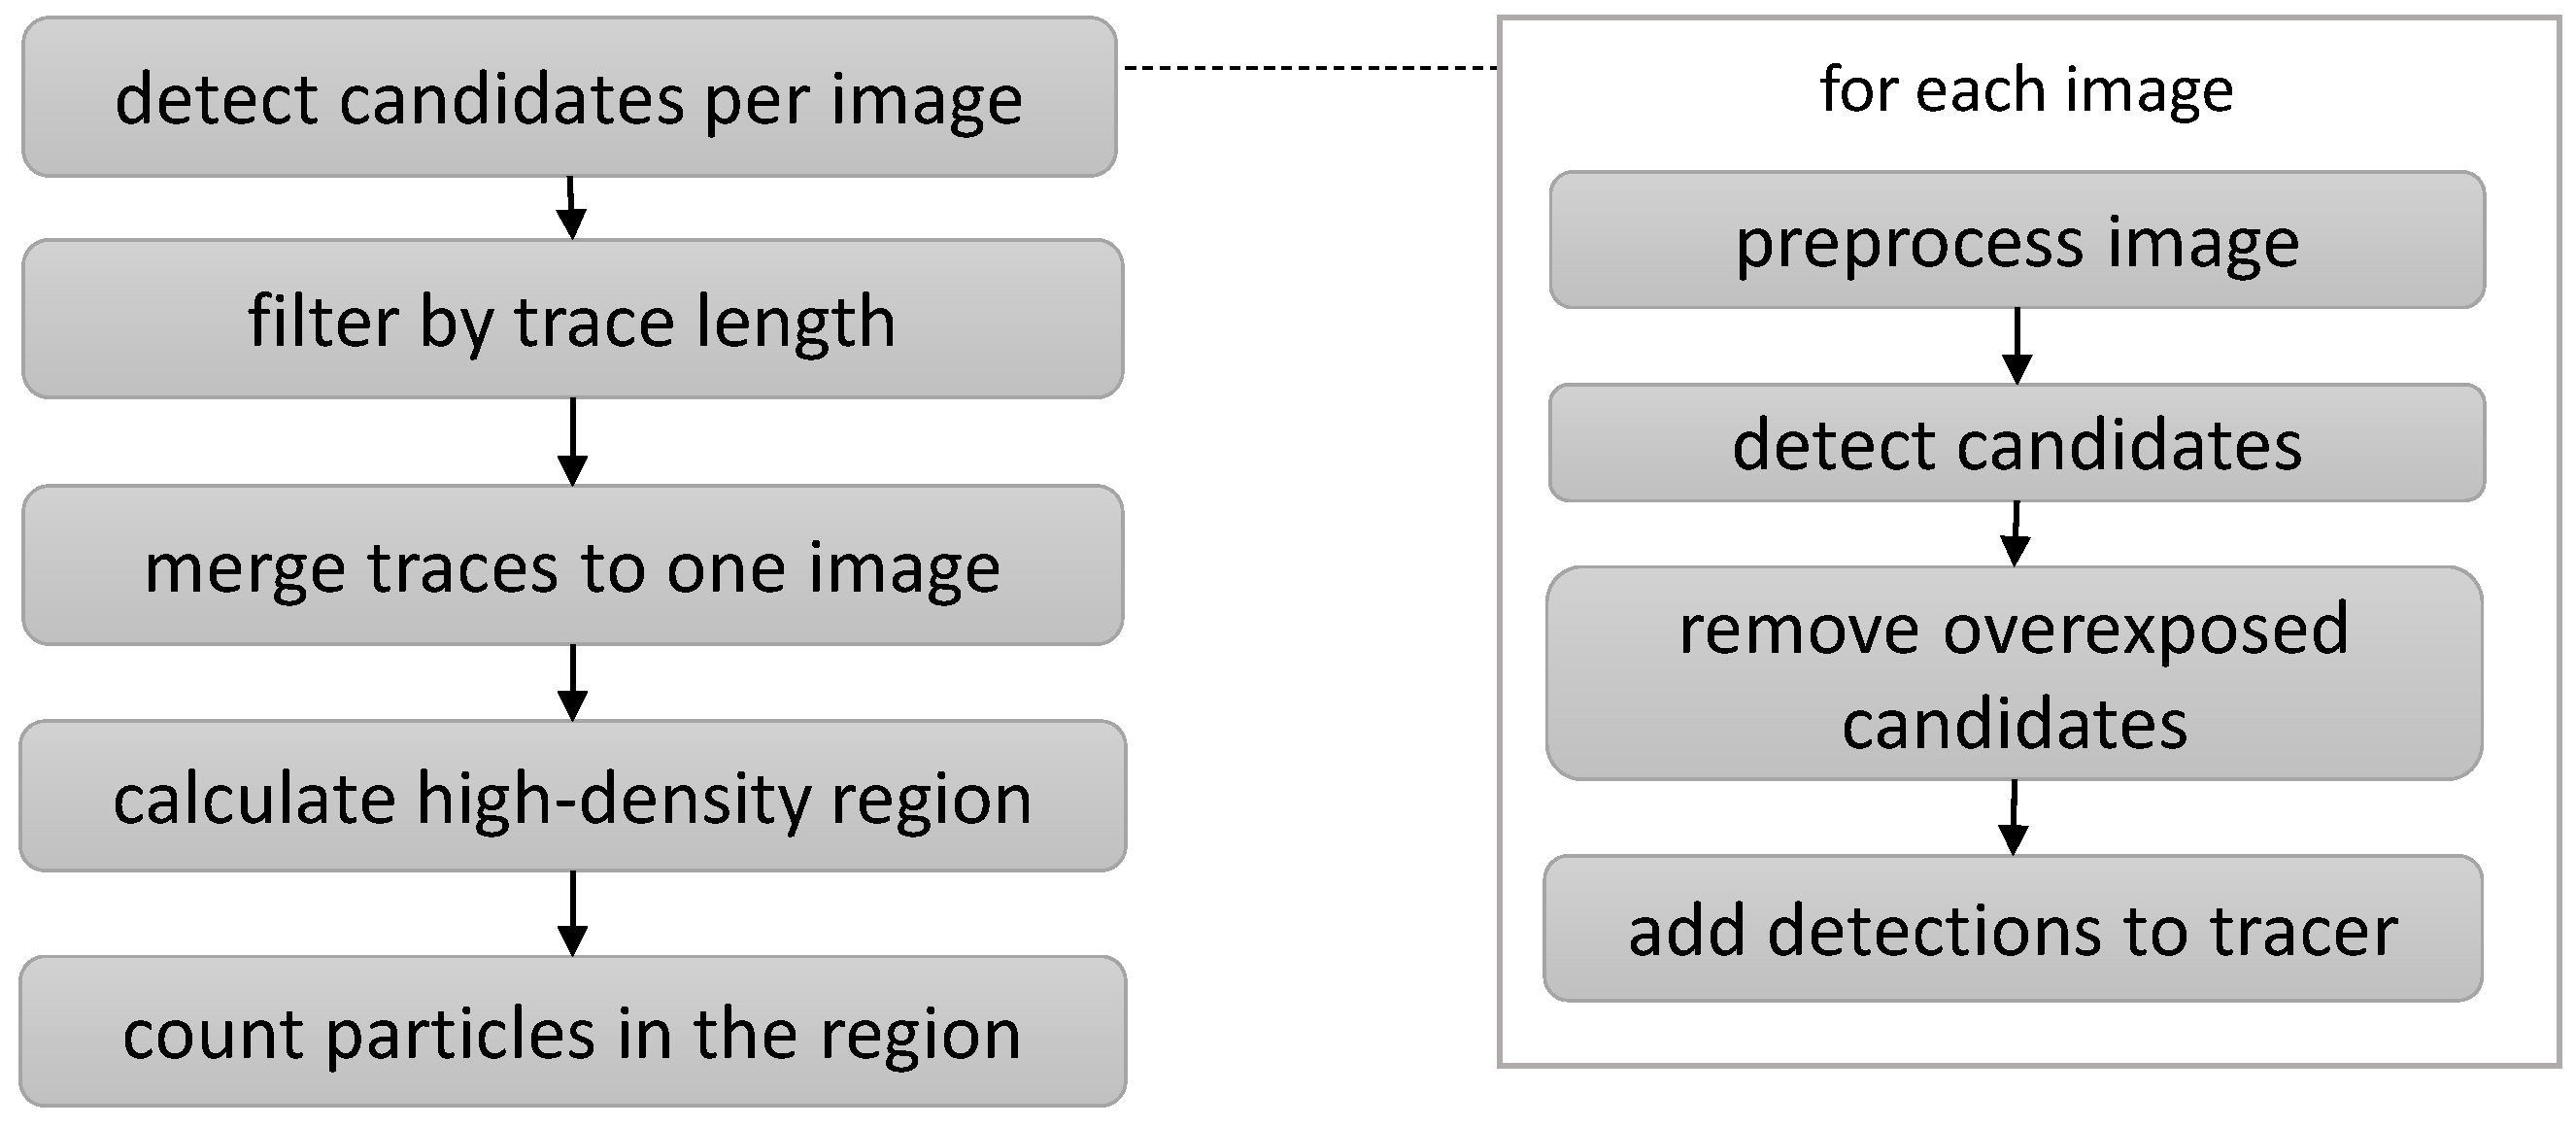
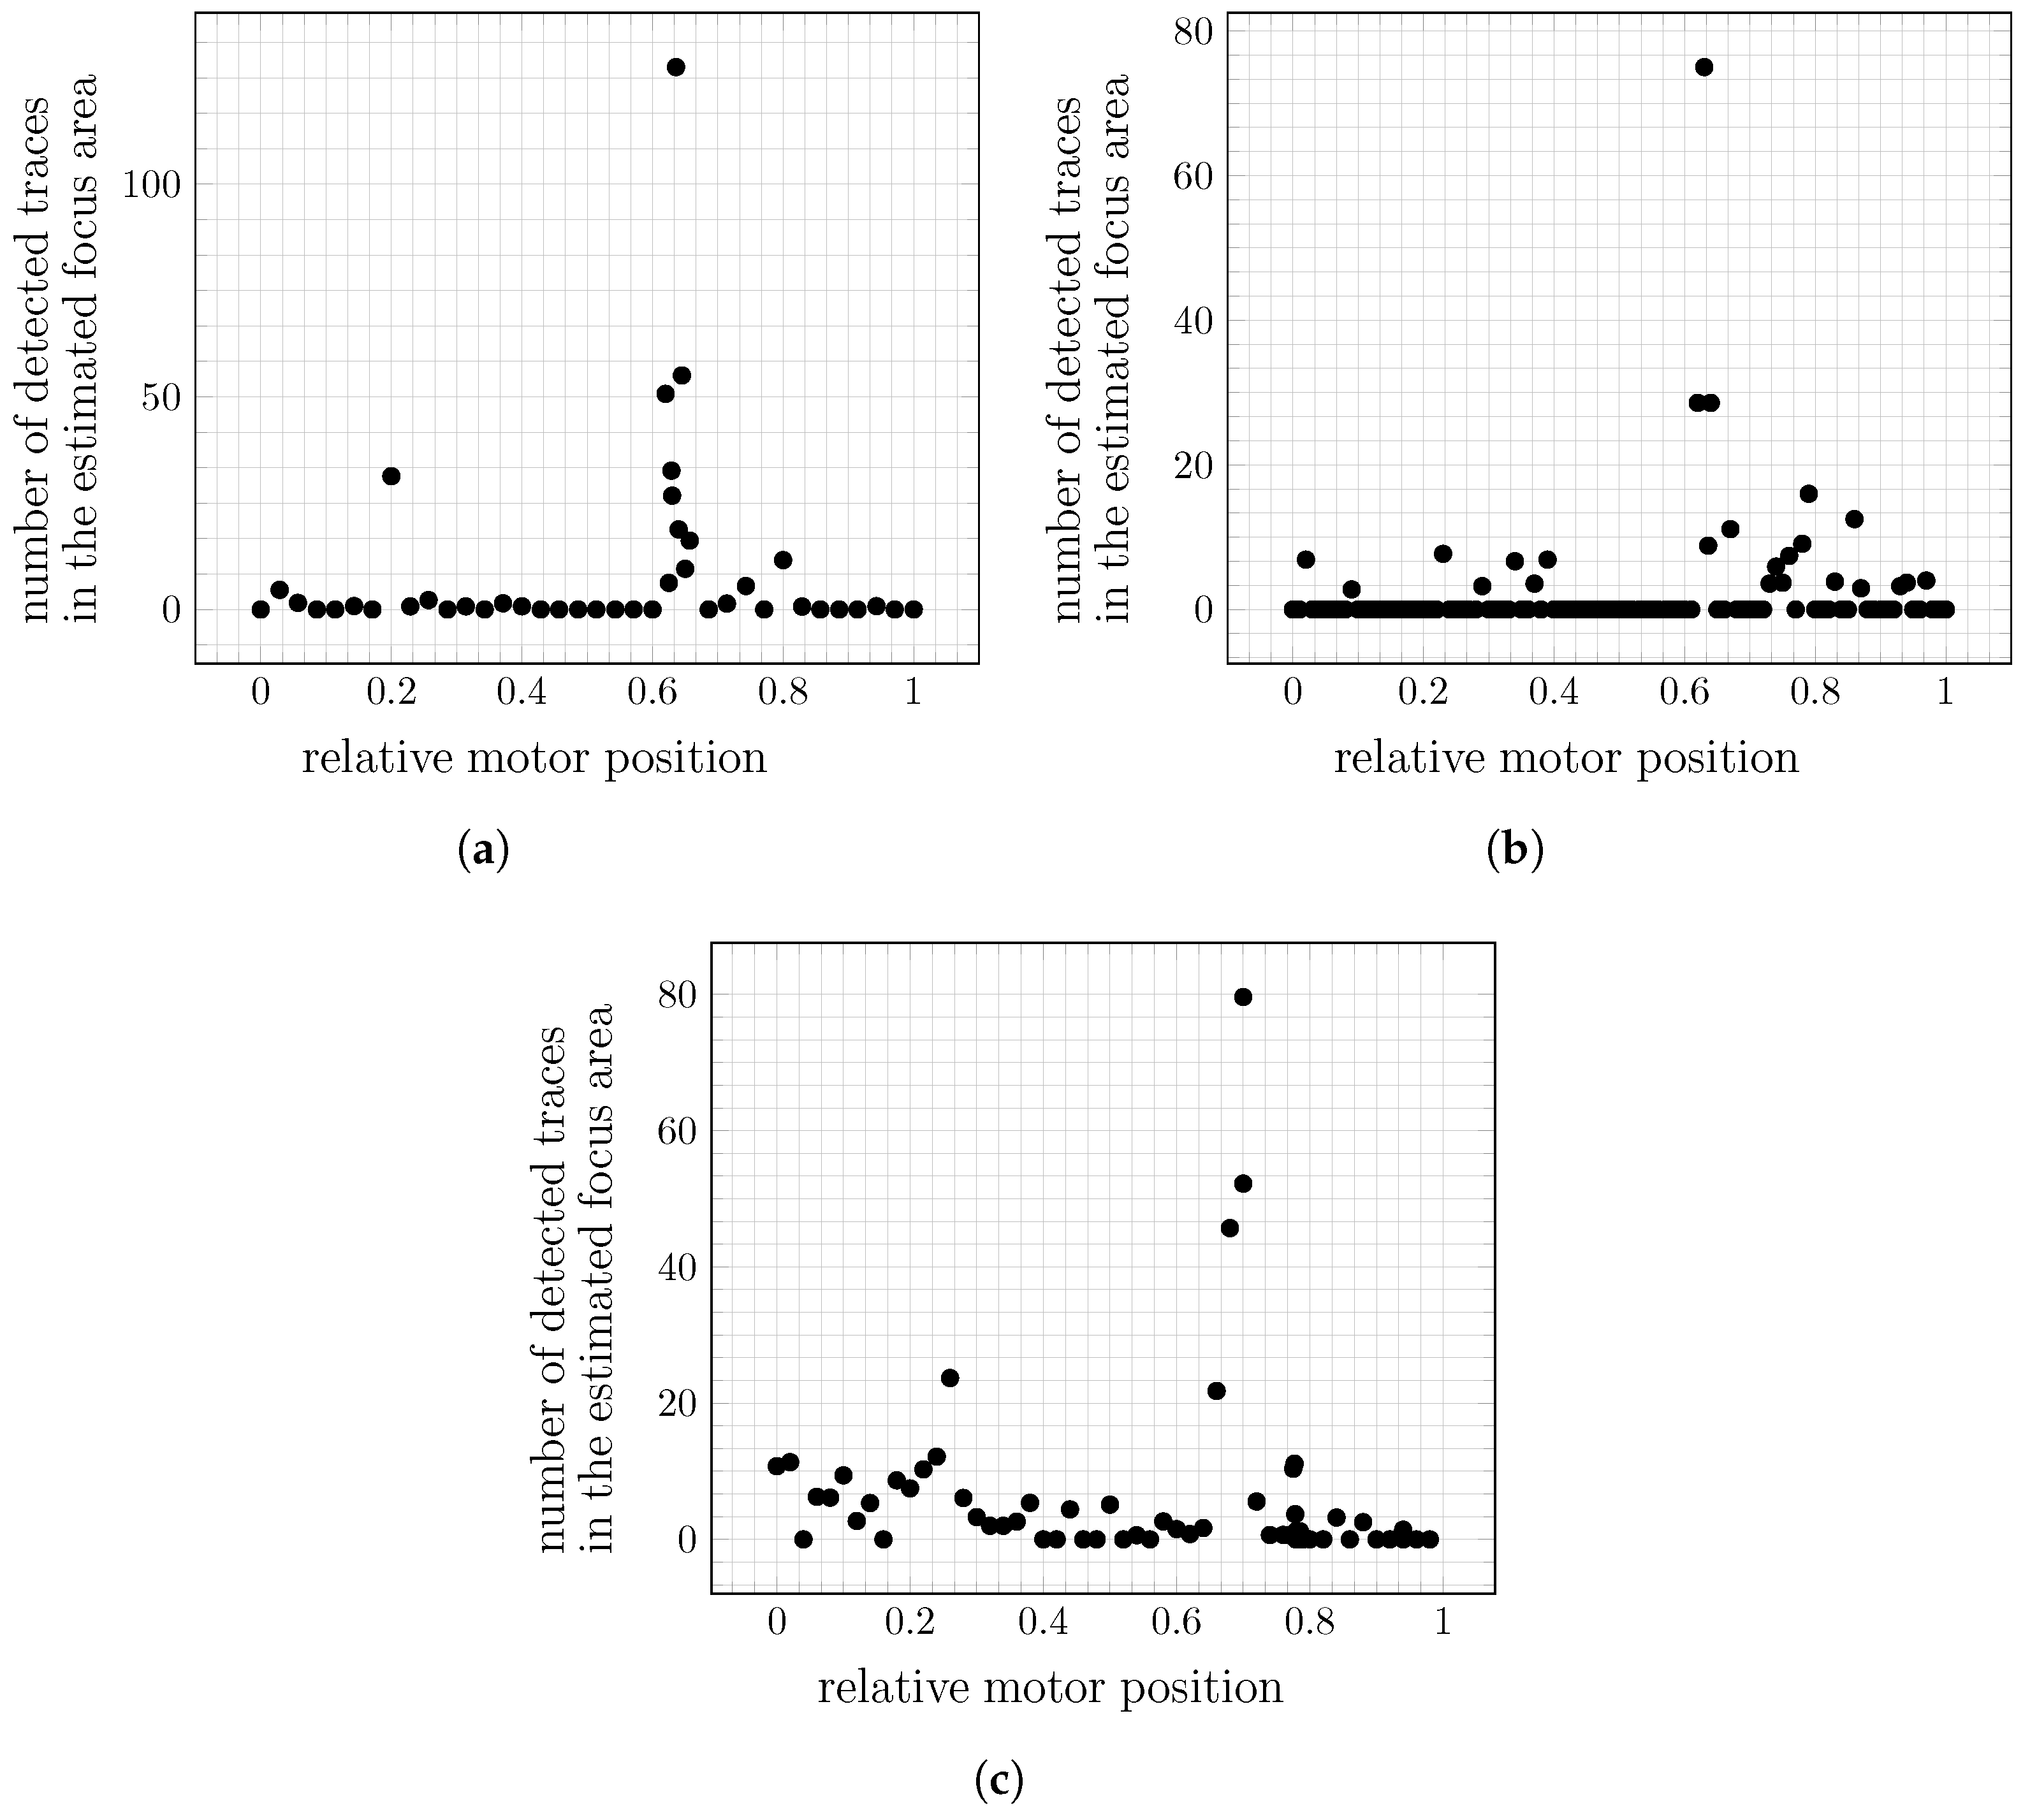
Focus determination is executed in the steps visualized in
Figure 9. The steps of focus detection are performed in each of the chosen positions of the motorized platform so that one focus region candidate, and the number of particles detected in it, are determined for each position separately: the latter is relativized to the count per 100 images, and is used as a metric in the overall detection of the optimal positioning; the following paragraphs detail the individual steps.
Preprocessing
In order to make particles visible for detection and evaluation of the focus, the acquired raw images are first preprocessed to emphasize signal changes instead of absolute intensities. This step is undertaken separately for each position of the translation stage. Recording
n raw images
with
for
in a fixed sample position, the first raw image
serves as a reference to visualize the changes
and, by that, also the particle adhesions from a subsequent raw image
for
. In detail, increases in pixel intensities, such as those caused by particles of interest, are transformed to high values, while other signals should show lower values. For better visibility, static contrast enhancement [
28], with a factor of
and a clipping of extreme values, is applied before further use.
Detection of Particles
In order to detect particle candidate regions in a preprocessed image, we used a previously developed approach based on a 5-layer U-Net [
31] architecture, with 8 filters in the first layer. The way it was trained, as described in
Section 2.3.2, optimized it to be robust for imaging artifacts: in this way, false detections are significantly reduced [
27] so that the detection of the focus region becomes more reliable.
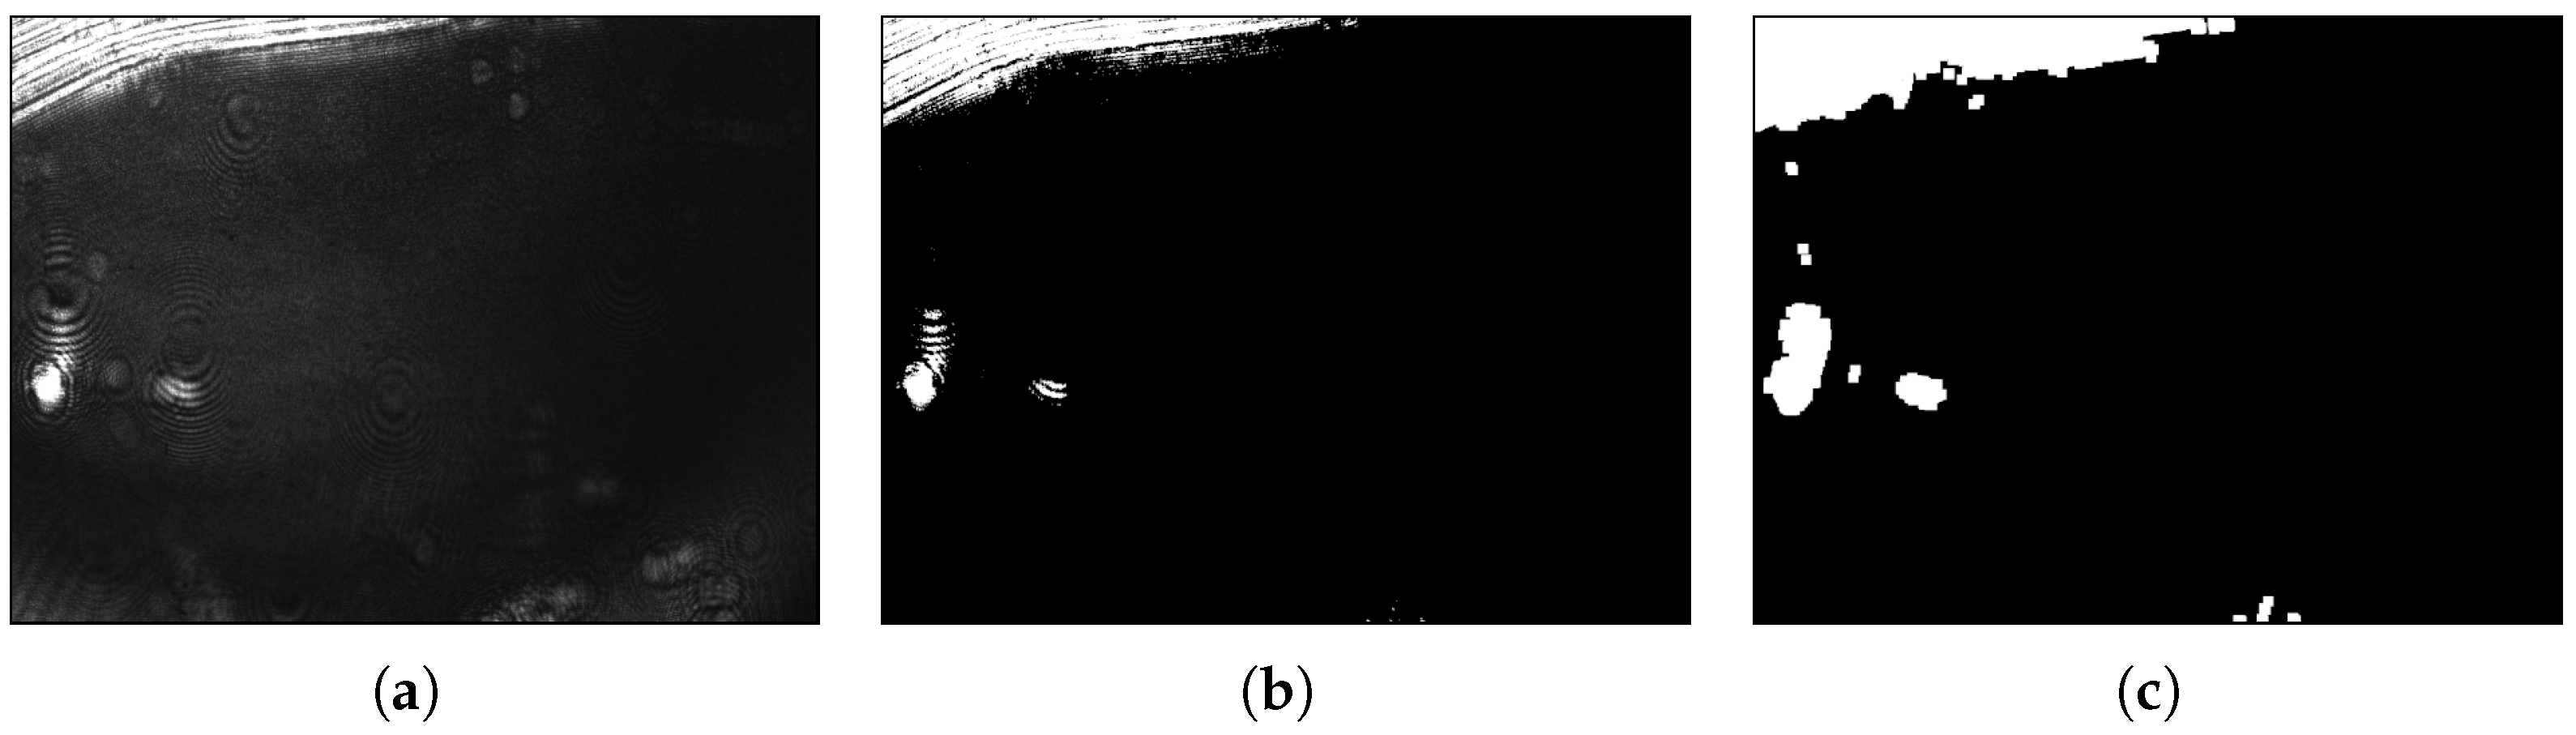
Removal of Overexposed Candidates
No image taken by the sensor can be assumed to be free of disturbances [
27]. One type of disturbance that can be reduced directly, based on domain knowledge, originates from film defects, which are the main reason for local flickering effects visible in the raw image as overexposed, i.e., bright regions. In the preprocessed images, the flickering is visible in the direct vicinity of defect regions and can lead to false detections. The overexposed pixels are determined based on a previous method by Libuschewski [
35]: first, a binary map is created, using a brightness threshold that marks overexposed pixels as 1 and others as 0; then, the white areas are dilated with a maximum filter of fixed side lengths
, to include the neighborhood of defects; next, those candidate boxes from the previous step that overlap the dilated map of overexposed regions are filtered out. An example of this process is shown in
Figure 10.
Tracing
Particles of interest can be seen on multiple frames of the preprocessed images so that a detection
b in one image is only considered a candidate of such a particle. As the attached particles hardly move spatially over the acquisition period, the candidates detected on previous images are linked over time [
28]. Two detected regions,
and
, that appear in consecutive images are therefore linked to form a trace if they have a Jaccard index
of greater than
. A trace
is extended by another detection
if
. This process continues across all detections until no more merges are possible. To account for short-term missing detections that would otherwise cause a link to be missing, we use the function
to represent the index of the frame that contains a detection
b. A temporal gap of
frames between two detections is tolerated to connect them to one trace. This means that
holds for each accepted trace
of length
n. When all traces are constructed, we remove each trace that is visible on too few frames. In detail, an accepted trace
of length
n has to fulfill
.
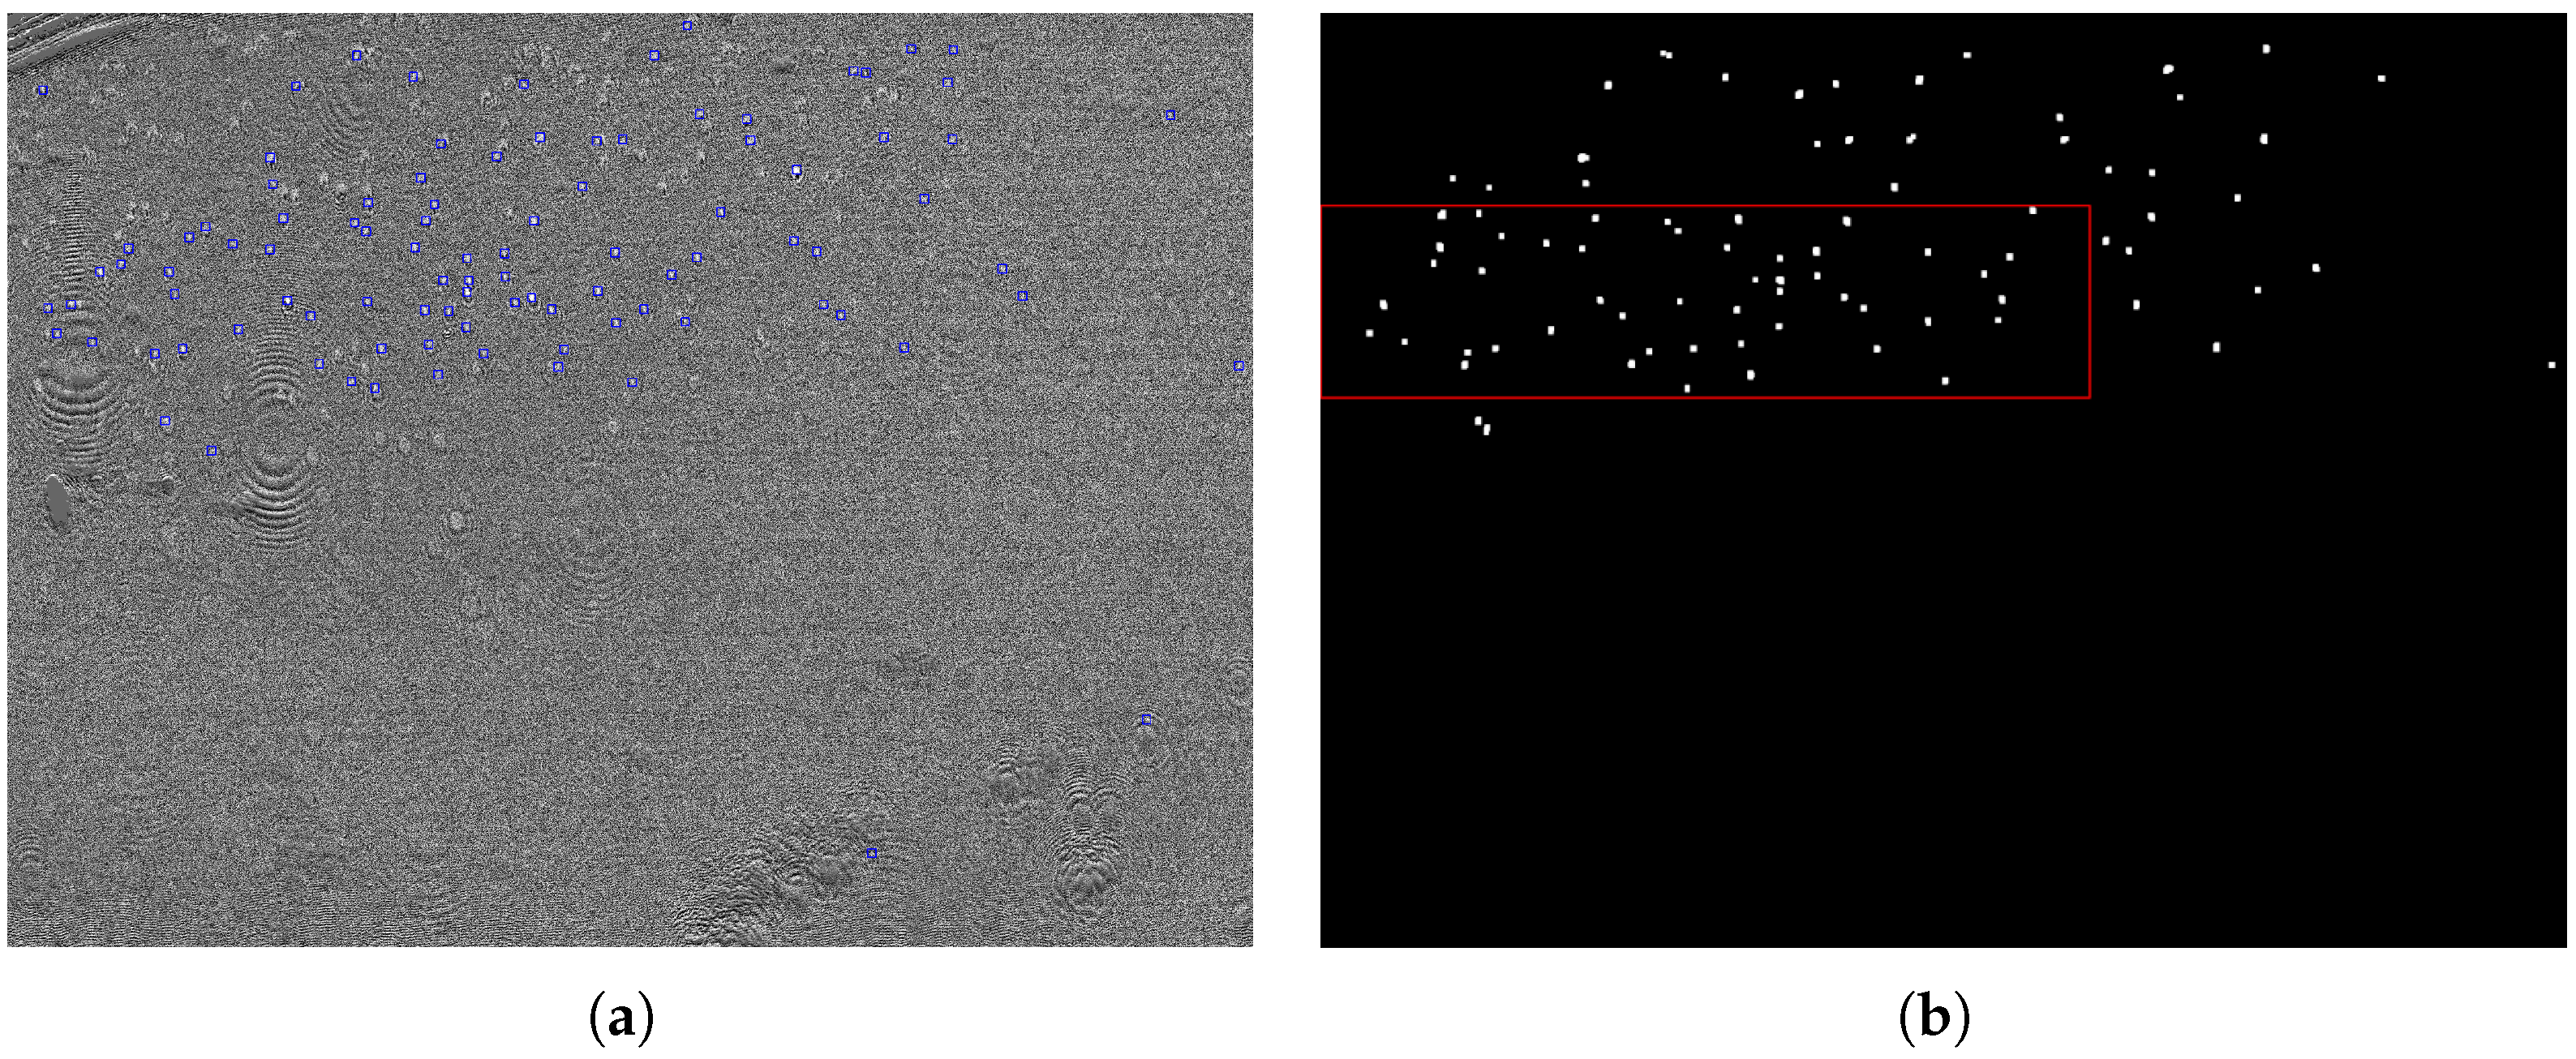
Determination of the Focus Region and Focus Metric
The focus for one motor position can be calculated with the traces
that remain after filtering. For each trace
, the pixels included in any
are used to create an image
that combines all traces in one image. In this image, each pixel
p is marked as
Then, a set of overlapping boxes of size
is extracted from
, and the mean value of all the pixels is calculated for each region. The region with the highest value is considered a candidate focus region, while the number of detected particles in it is used as a measure for the respective motor position. An example of this step is illustrated in
Figure 11.
Overall Process
The method described above is applied to each motor position separately. In each position, preprocessing, detection, and removal of overexposed regions are performed for each image recorded in that motor position. With all detections combined to traces, the focus region and its measure are calculated per motor position, based on the image of merged traces. When the focus information is available for each position, the highest value is chosen to set the optimal motor position, focusing on the particles of interest. The determined box in the optimal motor position is considered the focus area.
4. Discussion and Outlook
There is a clear need for new methods of analyzing biological NPs, such as viruses or extracellular vesicles. PCR (polymerase chain reaction) remains the gold standard for detection, provided that replicable material (i.e., nucleic acids) is present. However, PCR is rather time-consuming and expensive, and it requires expertise and laboratories. In a point-of-care situation, standard antigen detection is currently the choice; however, standard antigen detection often lacks desirable specificity and sensitivity. In such a situation, SPR-based sensor-like instruments can become a new paradigm: they provide higher specificity due to their single-particle detection capability and have the potential to ensure improved sensitivity. In the case of extracellular vesicles where no vesicle type defining replicable material (i.e., DNA, RNA) is available, and PCR is not applicable, SPR microscopy adds a new strategy to the analytical toolbox because it works directly with the NPs and the specific protein expression pattern presented on their surface. However, to complement or even outpace current methods, certain requirements must be met.
In the current research work, we not only aimed to report our new findings but also wanted to supply detailed SPR microscopy measurement protocols, aspiring to enhance the availability of this technique in the research fields dealing with nanoparticle characterization. In addition, we also aimed to verify whether the main analytical features of conventional SPR microscopy sensors remain persistent or even become improved after corrections of the tilted image plane (i.e., Scheimpflug correction). It was also important to define whether SPR microscopy sensors possess a sufficiently wide dynamic size range to analyze simultaneously biological objects belonging to different classes: for example, extracellular vesicles (nanoscale) and bacteria (microscale). Indeed, in the current research work, we demonstrated that the modified SPR microscopy sensor enables simultaneous detection of NPs that are significantly diverse in size. We detected simultaneously the binding of silica NPs (their refractive index is close to one of the biological NPs) with a four-times size difference. In [
38], the binding of single micro-objects with a size of approximately 10
in diameter (lymphocytes) was observed. We, too, were able to detect the binding of HT29 cells (approximately 15
in diameter) to the gold surface using the SPR microscopy instrument (unpublished observation). Taken together, these findings indicate that biological objects that differ in size by at least two orders can be detected by employing the SPR microscopy instrument. The size resolution of the detectable NPs increases with the growth of the refractive index.
As SPR instruments are routinely employed to assess the formation of a layer of biomolecules on the sensor surface, it is straightforward to envision an instrument combining an opportunity to detect individual bio-NPs with an ability to monitor the formation of biomolecular layers. Findings reported in this work indicate that the SPR microscopy instrument can serve for both types of measurements. Acting this way, the SPR microscopy sensor can serve as a platform for the development of cell-based assays requiring simultaneous detection of soluble bio-molecules produced by cells (classical SPR features) and individual extracellular vesicles (SPR microscopy features).
The employment of an SPR microscope as a sensor instrument relies on its ability to automatize basic functionalities. We have presented an approach for automatically adjusting prism rotation and camera objective translation for the custom-constructed conventional SPR microscope. The prototype of this system was able to determine an optimal rotation angle and translation positions, with a quality comparable to a manual adjustment, autonomously. As the translation adjustment used the result of reference particle detection as a metric for calibration, this downstream task was directly considered in the optimization.
It has yet to be determined which concentrations of particles are required for reliable focus detection and by which amount the needed time for an automatic adjustment is reduced when using higher concentrations. It is also plausible that a calculation of the focus region is possible on raw images instead of preprocessed images, as focusing also affects non-particle signals: This means that even the disturbances visible in the raw images that occur due to defects in the film will appear sharper or blurrier, depending on the setting. Quantifying the sharpness of a raw image would consequently be further away from the actual downstream task of particle detection but has the potential to work without reference particles for calibration. Presumably, it could also be used as additional information to reduce the necessary positioning steps of the preprocessing-based focus determination.

 ,
, 


