Polydopamine Nanoparticles-Based Three-Line Lateral Flow Immunoassay for COVID-19 Detection


Abstract
:1. Introduction
2. Materials and Methods
2.1. Synthesis of Polydopamine Nanoparticles
2.2. Polyelectrolyte-Mediated Silica Coating
2.3. Surface Modification of Polydopamine Nanoparticles
2.4. Antibody Conjugation to PDA NPs
2.5. Characterization of PDA NPs
2.6. PDA-Based LFLA Fabrication
2.7. Lateral Flow Immunoassay Detection
2.8. Software Development
3. Results and Discussion
4. Conclusions
Author Contributions
Funding
Institutional Review Board Statement
Informed Consent Statement
Data Availability Statement
Acknowledgments
Conflicts of Interest
References
- Wang, W.; Xu, Y.; Gao, R.; Lu, R.; Han, K.; Wu, G.; Tan, W. Detection of SARS-CoV-2 in Different Types of Clinical Specimens. JAMA 2020, 323, 1843–1844. [Google Scholar] [CrossRef] [PubMed] [Green Version]
- Peng, X.; Xu, X.; Li, Y.Q.; Cheng, L.; Zhou, X.D.; Ren, B. Transmission routes of 2019-nCoV and controls in dental practice. Int. J. Oral. Sci. 2020, 12, 9. [Google Scholar] [CrossRef] [PubMed] [Green Version]
- Ghinai, I.; McPherson, T.D.; Hunter, J.C.; Kirking, H.L.; Christiansen, D.; Joshi, K.; Rubin, R.; Morales-Estrada, S.; Black, S.R.; Pacilli, M.; et al. First known person-to-person transmission of severe acute respiratory syndrome coronavirus 2 (SARS-CoV-2) in the USA. Lancet 2020, 395, 1137–1144. [Google Scholar] [CrossRef] [PubMed]
- Orooji, Y.; Sohrabi, H.; Hemmat, N.; Oroojalian, F.; Baradaran, B.; Mokhtarzadeh, A.; Mohaghegh, M.; Karimi-Maleh, H. An Overview on SARS-CoV-2 (COVID-19) and Other Human Coronaviruses and Their Detection Capability via Amplification Assay, Chemical Sensing, Biosensing, Immunosensing, and Clinical Assays. Nano-Micro Lett. 2021, 13, 1137–1144. [Google Scholar] [CrossRef]
- Giovannini, G.; Haick, H.; Garoli, D. Detecting COVID-19 from Breath: A Game Changer for a Big Challenge. Acs Sens. 2021, 6, 1408–1417. [Google Scholar] [CrossRef]
- Ngonghala, C.N.; Iboi, E.A.; Gumel, A.B. Could masks curtail the post-lockdown resurgence of COVID-19 in the US? Math. Biosci. 2020, 329, 108452. [Google Scholar] [CrossRef]
- Jin, Y.-H.; Cai, L.; Cheng, Z.-S.; Cheng, H.; Deng, T.; Fan, Y.-P.; Fang, C.; Huang, D.; Huang, L.-Q.; Huang, Q.; et al. A rapid advice guideline for the diagnosis and treatment of 2019 novel coronavirus (2019-nCoV) infected pneumonia (standard version). Mil. Med. Res. 2020, 7, 4. [Google Scholar] [CrossRef] [Green Version]
- Somerville, L.K.; Ratnamohan, V.M.; Dwyer, D.E.; Kok, J. Molecular diagnosis of respiratory viruses. Pathology 2015, 47, 243–249. [Google Scholar] [CrossRef]
- Zhou, P.; Yang, X.L.; Wang, X.G.; Hu, B.; Zhang, L.; Zhang, W.; Si, H.R.; Zhu, Y.; Li, B.; Huang, C.L.; et al. A pneumonia outbreak associated with a new coronavirus of probable bat origin. Nature 2020, 579, 270–273. [Google Scholar] [CrossRef] [Green Version]
- Espejo, A.P.; Akgun, Y.; Al Mana, A.F.; Tjendra, Y.; Millan, N.C.; Gomez-Fernandez, C.; Cray, C. Review of Current Advances in Serologic Testing for COVID-19. Am. J. Clin. Pathol. 2020, 154, 293–304. [Google Scholar] [CrossRef]
- Verelst, F.; Kuylen, E.; Beutels, P. Indications for healthcare surge capacity in European countries facing an exponential increase in coronavirus disease (COVID-19) cases, March 2020. Eurosurveillance 2020, 25, 13–16. [Google Scholar] [CrossRef] [Green Version]
- Chartrand, C.; Tremblay, N.; Renaud, C.; Papenburg, J. Diagnostic Accuracy of Rapid Antigen Detection Tests for Respiratory Syncytial Virus Infection: Systematic Review and Meta-analysis. J. Clin. Microbiol. 2015, 53, 3738–3749. [Google Scholar] [CrossRef] [Green Version]
- Mak, G.C.K.; Cheng, P.K.C.; Lau, S.S.Y.; Wong, K.K.Y.; Lau, C.S.; Lam, E.T.K.; Chan, R.C.W.; Tsang, D.N.C. Evaluation of rapid antigen test for detection of SARS-CoV-2 virus. J. Clin. Virol. 2020, 129, 104500. [Google Scholar] [CrossRef]
- Ji, T.X.; Liu, Z.W.; Wang, G.Q.; Guo, X.G.; Khan, S.A.; Lai, C.C.; Chen, H.Y.; Huang, S.W.; Xia, S.M.; Chen, B.; et al. Detection of COVID-19: A review of the current literature and future perspectives. Biosens. Bioelectron. 2020, 166, 112455. [Google Scholar] [CrossRef]
- Ihling, C.; Tanzler, D.; Hagemann, S.; Kehlen, A.; Huttelmaier, S.; Arlt, C.; Sinz, A. Mass Spectrometric Identification of SARS-CoV-2 Proteins from Gargle Solution Samples of COVID-19 Patients. J. Proteome Res. 2020, 19, 4389–4392. [Google Scholar] [CrossRef]
- Yuce, M.; Filiztekin, E.; Ozkaya, K.G. COVID-19 diagnosis—A review of current methods. Biosens. Bioelectron. 2021, 172, 112752. [Google Scholar] [CrossRef]
- Yu, H.Q.; Sun, B.Q.; Fang, Z.F.; Zhao, J.C.; Liu, X.Y.; Li, Y.M.; Sun, X.Z.; Liang, H.F.; Zhong, B.; Huang, Z.F.; et al. Distinct features of SARS-CoV-2-specific IgA response in COVID-19 patients. Eur. Respir. J. 2020, 56, 2001526. [Google Scholar] [CrossRef]
- Nicol, T.; Lefeuvre, C.; Serri, O.; Pivert, A.; Joubaud, F.; Dubee, V.; Kouatchet, A.; Ducancelle, A.; Lunel-Fabiani, F.; Le Guillou-Guillemette, H. Assessment of SARS-CoV-2 serological tests for the diagnosis of COVID-19 through the evaluation of three immunoassays: Two automated immunoassays (Euroimmun and Abbott) and one rapid lateral flow immunoassay (NG Biotech). J Clin Virol 2020, 129, 104511. [Google Scholar] [CrossRef]
- Mekonnen, D.; Mengist, H.M.; Derbie, A.; Nibret, E.; Munshea, A.; He, H.L.; Li, B.F.; Jin, T.C. Diagnostic accuracy of serological tests and kinetics of severe acute respiratory syndrome coronavirus 2 antibody: A systematic review and meta-analysis. Rev. Med. Virol. 2021, 31, e2181. [Google Scholar] [CrossRef]
- Luo, S.H.; Xu, J.H.; Cho, C.Y.; Zhu, S.W.; Whittaker, K.C.; Wang, X.Q.; Feng, J.; Wang, M.; Xie, S.H.; Fang, J.M.; et al. Quantitative Detection of Anti-SARS-CoV-2 Antibodies Using Indirect ELISA. Lab. Med. 2022, 53, 225–234. [Google Scholar] [CrossRef]
- Lin, D.C.; Liu, L.; Zhang, M.X.; Hu, Y.L.; Yang, Q.T.; Guo, J.B.; Dai, Y.C.; Xu, Y.Z.; Cai, Y.; Chen, X.C.; et al. Evaluations of the serological test in the diagnosis of 2019 novel coronavirus (SARS-CoV-2) infections during the COVID-19 outbreak. Eur. J. Clin. Microbiol. 2020, 39, 2271–2277. [Google Scholar] [CrossRef] [PubMed]
- Trombetta, B.A.; Kandigian, S.E.; Kitchen, R.R.; Grauwet, K.; Webb, P.K.; Miller, G.A.; Jennings, C.G.; Jain, S.; Miller, S.; Kuo, Y.K.; et al. Evaluation of serological lateral flow assays for severe acute respiratory syndrome coronavirus-2 (vol 21, 580, 2021). Bmc. Infect Dis. 2021, 21, 580. [Google Scholar]
- Chen, C.X.; Hu, H.Z.; Li, X.Q.; Zheng, Z.; Wang, Z.Z.; Wang, X.C.; Zheng, P.M.; Cui, F.C.; Li, G.; Wang, Y.H.; et al. Rapid Detection of Anti-SARS-CoV-2 Antibody Using a Selenium Nanoparticle-Based Lateral Flow Immunoassay. Ieee Trans. NanoBioscience 2022, 21, 37–43. [Google Scholar] [CrossRef] [PubMed]
- Wang, Z.; Zheng, Z.; Hu, H.; Zhou, Q.; Liu, W.; Li, X.; Liu, Z.; Wang, Y.; Ma, Y. A point-of-care selenium nanoparticle-based test for the combined detection of anti-SARS-CoV-2 IgM and IgG in human serum and blood. Lab A Chip 2020, 20, 4255–4261. [Google Scholar] [CrossRef]
- Xie, X.; Zhong, Z.; Zhao, W.; Zheng, C.; Wang, F.; Liu, J. Chest CT for Typical Coronavirus Disease 2019 (COVID-19) Pneumonia: Relationship to Negative RT-PCR Testing. Radiology 2020, 296, E41–E45. [Google Scholar] [CrossRef] [Green Version]
- Cassaniti, I.; Novazzi, F.; Giardina, F.; Salinaro, F.; Sachs, M.; Perlini, S.; Bruno, R.; Mojoli, F.; Baldanti, F.; Task, S.M.P.C. Performance of VivaDiag COVID-19 IgM/IgG Rapid Test is inadequate for diagnosis of COVID-19 in acute patients referring to emergency room department. J. Med. Virol. 2020, 92, 1724–1727. [Google Scholar] [CrossRef] [Green Version]
- Soler, M.; Estevez, M.C.; Cardenosa-Rubio, M.; Astua, A.; Lechuga, L.M. How Nanophotonic Label-Free Biosensors Can Contribute to Rapid and Massive Diagnostics of Respiratory Virus Infections: COVID-19 Case. ACS Sens. 2020, 5, 2663–2678. [Google Scholar] [CrossRef]
- Tong, H.Y.; Cao, C.Y.; You, M.L.; Han, S.; Liu, Z.; Xiao, Y.; He, W.H.; Liu, C.; Peng, P.; Xue, Z.R.; et al. Artificial intelligence-assisted colorimetric lateral flow immunoassay for sensitive and quantitative detection of COVID-19 neutralizing antibody. Biosens. Bioelectron. 2022, 213, 114449. [Google Scholar] [CrossRef]
- Cong, Y.; Xia, T.; Zou, M.; Li, Z.N.; Peng, B.; Guo, D.Z.; Deng, Z.W. Mussel-inspired polydopamine coating as a versatile platform for synthesizing polystyrene/Ag nanocomposite particles with enhanced antibacterial activities. J. Mater. Chem. B 2014, 2, 3450–3461. [Google Scholar] [CrossRef]
- Yang, S.H.; Kang, S.M.; Lee, K.B.; Chung, T.D.; Lee, H.; Choi, I.S. Mussel-Inspired Encapsulation and Functionalization of Individual Yeast Cells. J. Am. Chem. Soc. 2011, 133, 2795–2797. [Google Scholar] [CrossRef]
- Thapa, D.; Samadi, N.; Tabatabaei, N. Handheld Thermo-Photonic Device for Rapid, Low-Cost, and On-Site Detection and Quantification of Anti-SARS-CoV-2 Antibody. IEEE Sens. J. 2021, 21, 18504–18511. [Google Scholar] [CrossRef]
- Yakoh, A.; Pimpitak, U.; Rengpipat, S.; Hirankarn, N.; Chailapakul, O.; Chaiyo, S. Paper-based electrochemical biosensor for diagnosing COVID-19: Detection of SARS-CoV-2 antibodies and antigen. Biosens. Bioelectron. 2021, 176, 112912. [Google Scholar] [CrossRef]
- Zhou, Y.F.; Wu, Y.H.; Ding, L.; Huang, X.L.; Xiong, Y.H. Point-of-care COVID-19 diagnostics powered by lateral flow assay. Trac-Trend Anal. Chem. 2021, 145, 116452. [Google Scholar] [CrossRef]


| Targets | Probe | Limit of Detection (ng/mL) | Linear Range (ng/mL) | Test Time (Minutes) | References |
|---|---|---|---|---|---|
| IgG | AuNP | 102 | 200~104 | 15 | [31] |
| IgM/IgG | Selenium NP | 60/20 | 60~103/20~103 | 10 | [23] |
| IgM/IgG | Selenium NP | 20/5 | 20~102/5~102 | 10 | [24] |
| IgM/IgG | ePAD | 103 | 103~5 × 10⁴/103~5 × 104 | - | [32] |
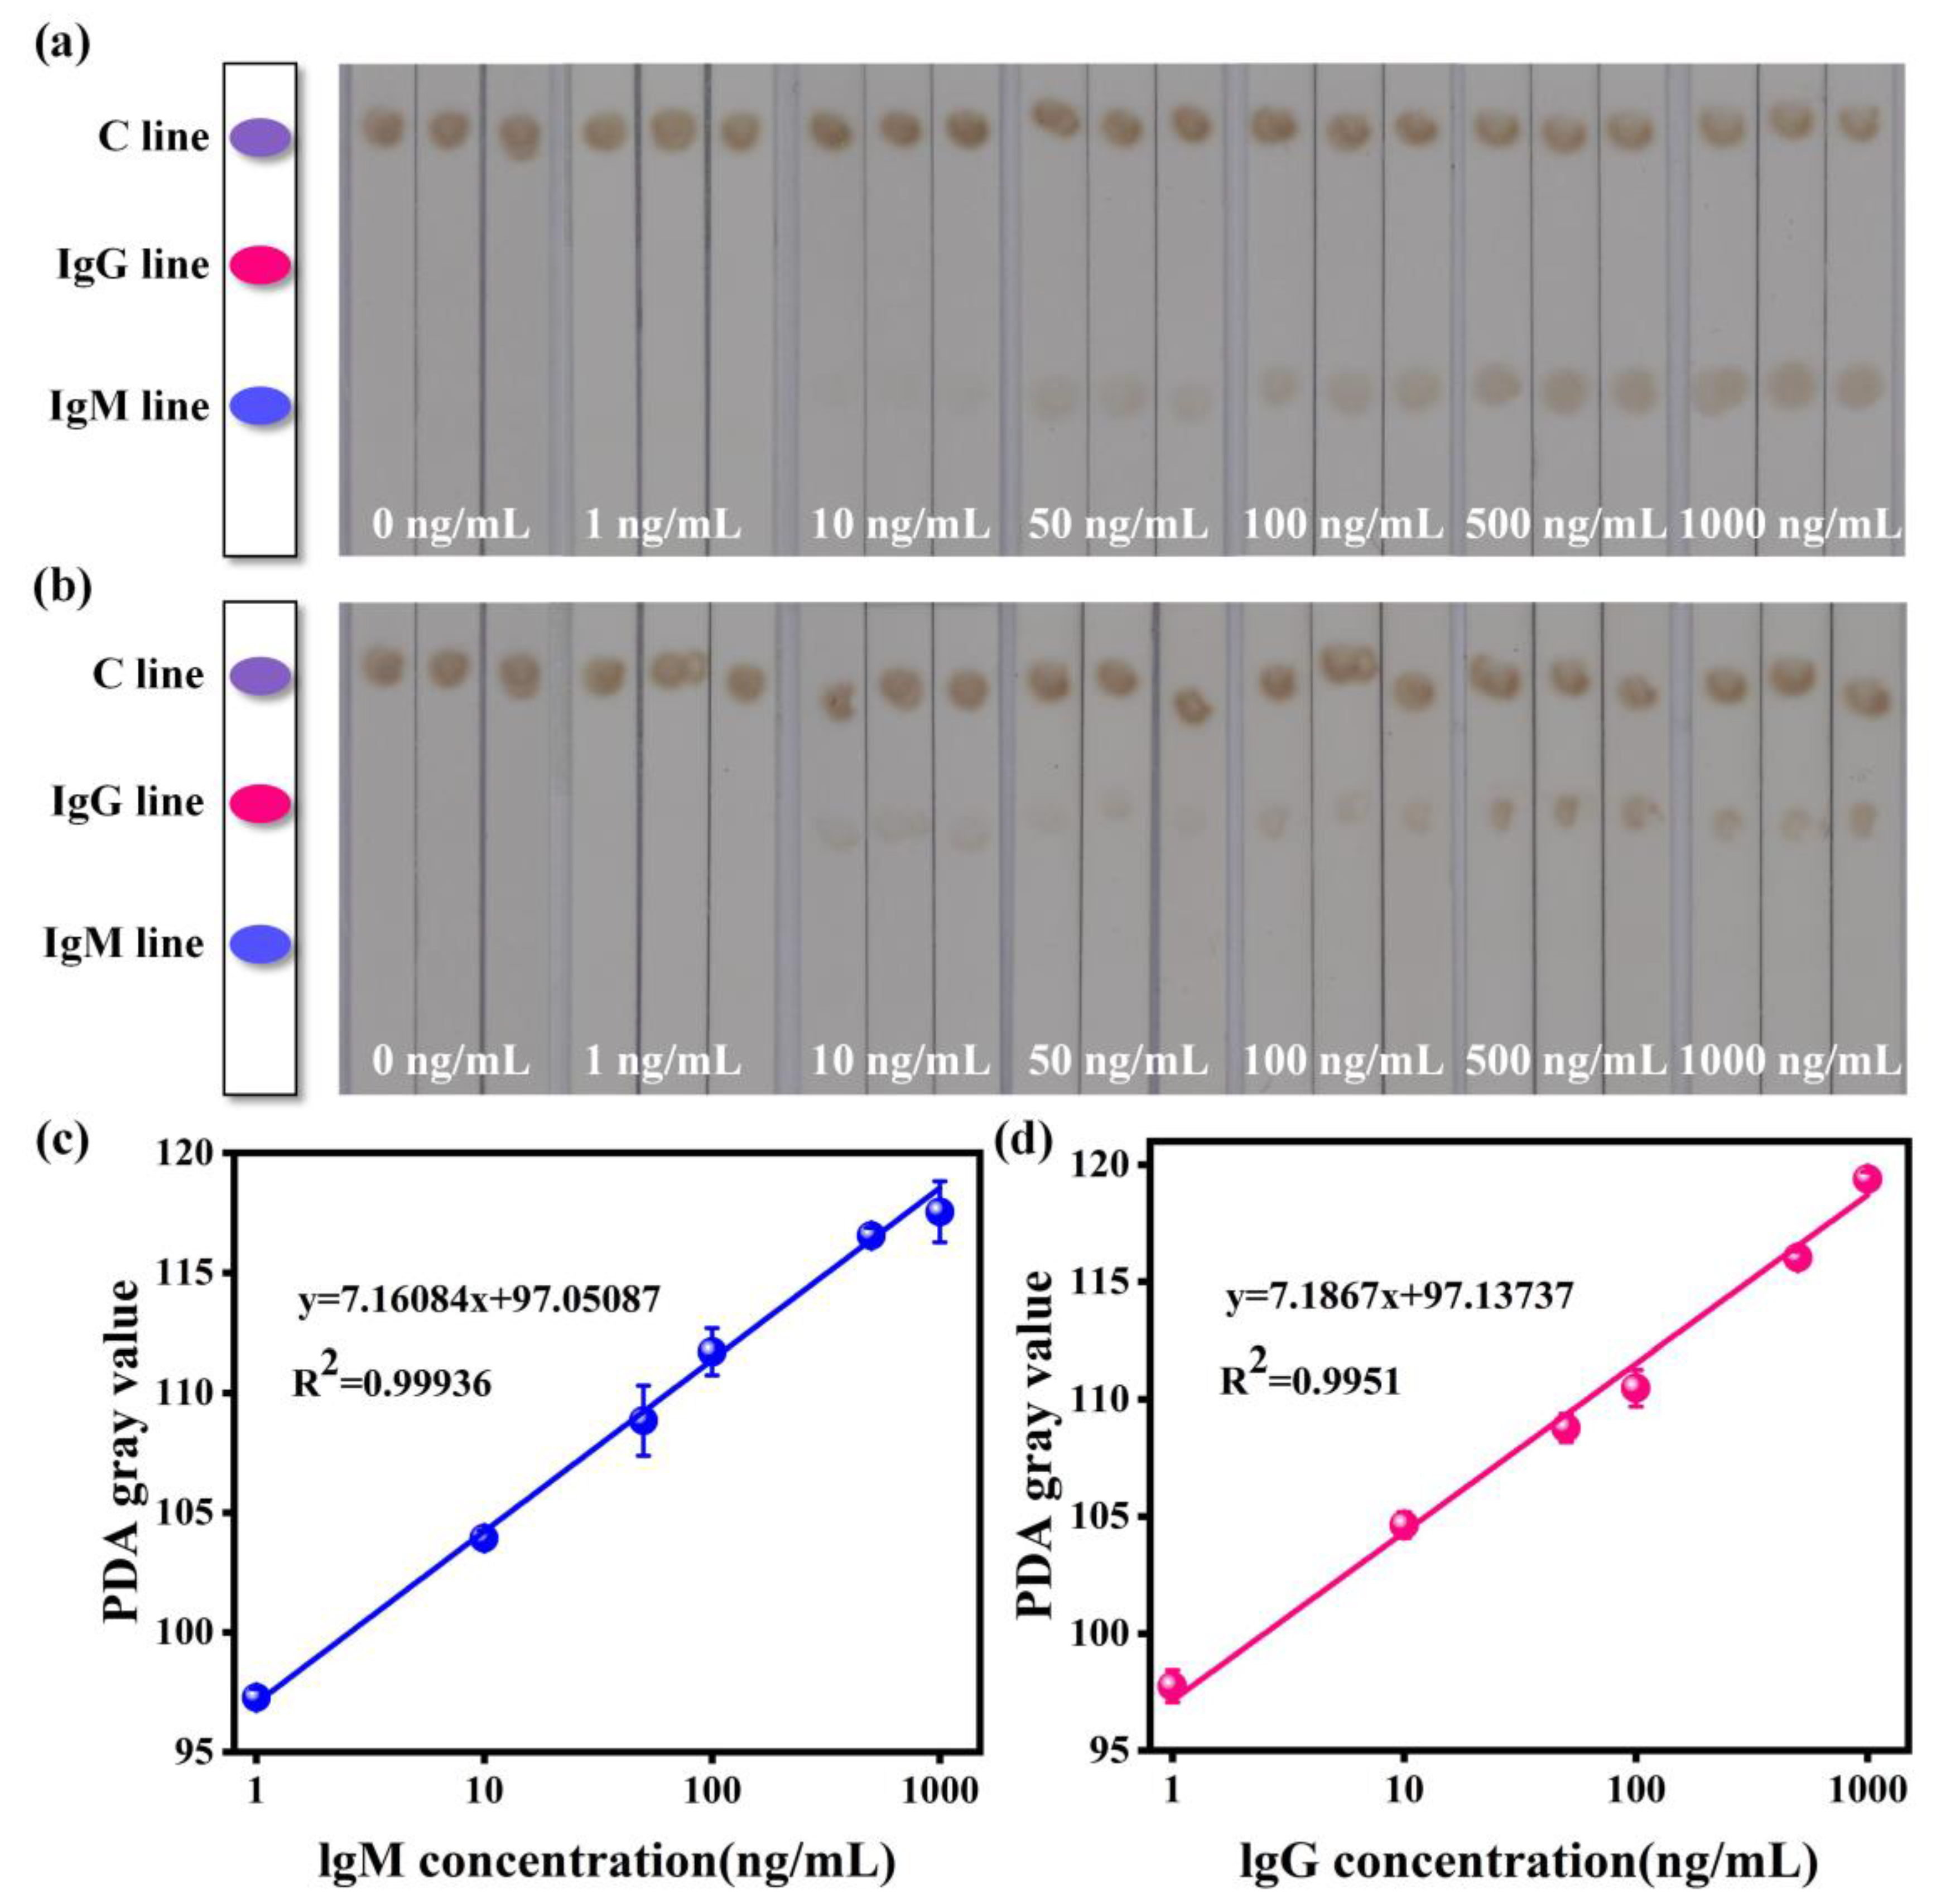
| IgM/IgG | PDA | 1.51/2.34 | 1~103/1~103 | 15 | this work |
Disclaimer/Publisher’s Note: The statements, opinions and data contained in all publications are solely those of the individual author(s) and contributor(s) and not of MDPI and/or the editor(s). MDPI and/or the editor(s) disclaim responsibility for any injury to people or property resulting from any ideas, methods, instructions or products referred to in the content. |
© 2023 by the authors. Licensee MDPI, Basel, Switzerland. This article is an open access article distributed under the terms and conditions of the Creative Commons Attribution (CC BY) license (https://creativecommons.org/licenses/by/4.0/).
Share and Cite
Liu, Z.; Cao, C.; Tong, H.; You, M. Polydopamine Nanoparticles-Based Three-Line Lateral Flow Immunoassay for COVID-19 Detection. Biosensors 2023, 13, 352. https://doi.org/10.3390/bios13030352
Liu Z, Cao C, Tong H, You M. Polydopamine Nanoparticles-Based Three-Line Lateral Flow Immunoassay for COVID-19 Detection. Biosensors. 2023; 13(3):352. https://doi.org/10.3390/bios13030352
Chicago/Turabian StyleLiu, Zhe, Chaoyu Cao, Haoyang Tong, and Minli You. 2023. "Polydopamine Nanoparticles-Based Three-Line Lateral Flow Immunoassay for COVID-19 Detection" Biosensors 13, no. 3: 352. https://doi.org/10.3390/bios13030352