Assessing Meat Freshness via Nanotechnology Biosensors: Is the World Prepared for Lightning-Fast Pace Methods?


 ,
, 
 ,
,  and
and 
Abstract
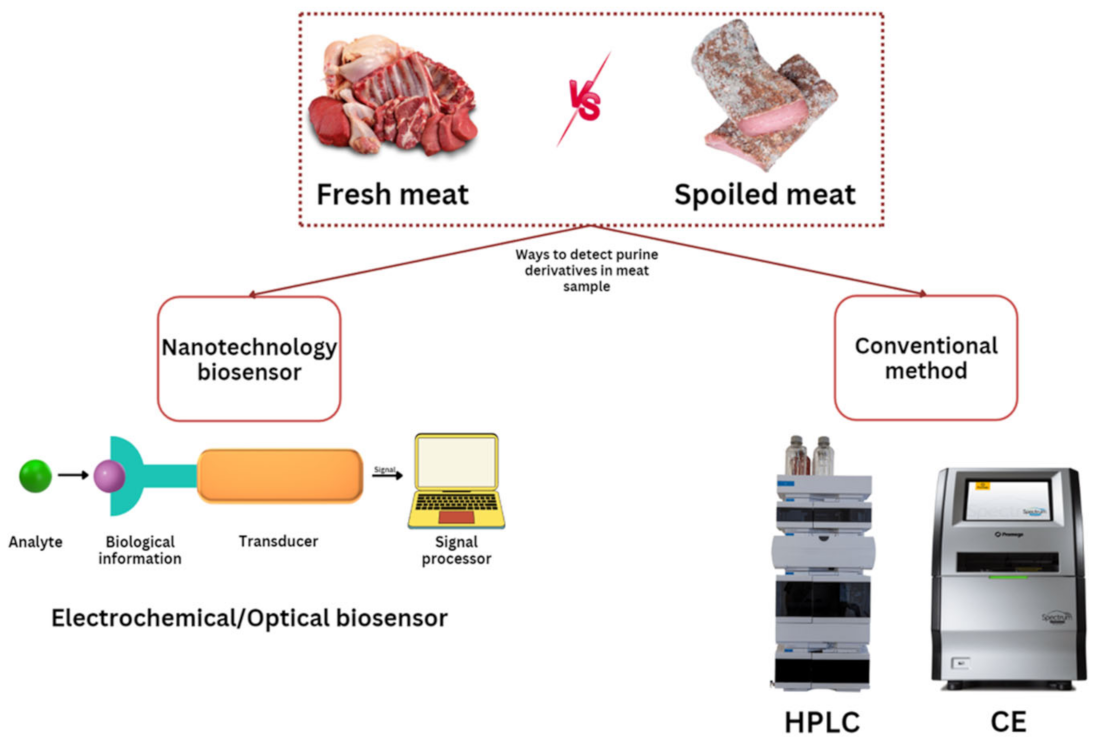
:1. Introduction
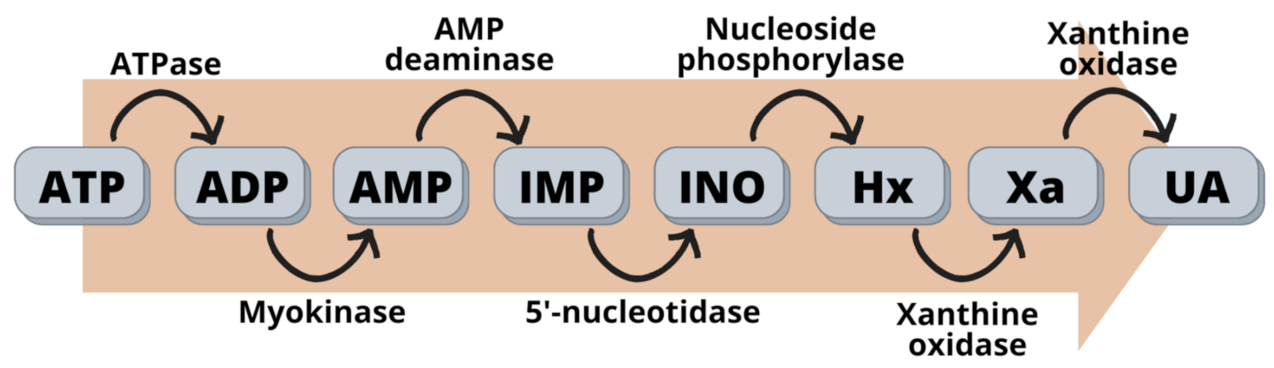
2. Meat Freshness Indicators
3. Conventional Techniques Used for Quantification of Purine Derivatives
3.1. High-Performance Liquid Chromatography (HPLC)
3.2. Capillary Electrophoresis (CE)
4. Nanotechnology Biosensor Used in Determining Purine Derivatives
4.1. Electrochemical Biosensor

| Sensor | Detection Method | Nanomaterials | Samples | Analytes | Linear Range | LOD | Reference |
|---|---|---|---|---|---|---|---|
| Nafion/XOD/TiO2-G/GCE sensor | Voltammetry | Graphene/titanium dioxide nanocomposite (TiO2-G) | Pork tenderloins | Hx | 20-512 μM | 9.5 μM | [3] |
| XO-modified GLAD NiO electrodes | Conductometry | - | Fish | Xa | 0.1–5 μM | 37 nM | [19] |
| XOs/PANI@ TiO2/ITO electrode | Differential pulse voltammetry | Polyaniline-wrapped titanium dioxide (PANI@TiO2) nanohybrid | Rohu (Labeo rohita) fish | Xa | 1–100 µM | 0.1 µM | [18] |
| Au-PEDOT- fMWCNT/ GCE | Conductometry | Functionalized MWCNT-nanogold | Fish meat | UA Xa Hx | 0.1–800 μM 0.05–175 μM 0.1–150 μM | 199.3 nM 24.1 nM 90.5 nM | [20] |
| ZnIn2S4/UiO-66-NH2/GCE | Amperometry | - | Large yellow croaker | Hx Xa | 0.3–40 µM 0.025–40 µM | 0.1 µM 0.0083 µM | [25] |
| EPPGE | Amperometry | - | Fish | Hx Xa UA | 0.1–50 μM 0.1–50 μM 0.1–25.0 μM | 0.08 μM 0.06 μM 0.03 μM | [39] |
| XOD-Cu-MOF | Amperometry | Metal organic framework nanofibers (MOF) | Chilled squid Large yellow croaker | Hx Xa | 0.01–10 μM | 0.0023 μM 0.0064 μM | [83] |
| XODNPs/Au | Differential pulse voltammetry (DPV) | Nanoparticles of xanthine oxidase (XODNPs) | Fish meat | Xa | 0.01–1.0 μM | 0.01 μM | [84] |
| Pt/PPy-pTS-XnOx/U | Cyclic voltammetry | - | Fish meat | Hx | 5 × 10⁻⁶–5 × 10⁻³ M | 5 × 10⁻⁶ M | [85] |
| XO/nano-Au/c-MWCNT | Amperometry | Screen-printed multi–walled carbon nanotubes (c-MWCNT) gold particle | Fish and chicken meat | Xa | 2388.88 µA/cm2/nM | 1.14 nM | [86] |
| XO/nano Ag–ZnO/PPy/PGE | Cyclic voltammetry | Silver-doped zinc oxide nanoparticle (nano Ag-ZnO) | Sea bass fish | Xa | 0.06–0.6 μM | 0.07 μM | [87] |
| MFPP/FPP/PtNPs | Amperometry | Platinum nanoparticles (PtNPs) | Fish | Xa | 0.1–1.4 mM | 48 nM | [88] |
| Co(TMA)MOF@CNF | Amperometry | Carbon nanofibers (CNFs) Cobalt-metal organic framework (MOF) | Fish meat | Xa UA | 25–700 µM | 96.2 nM, 103.5 nM | [90] |
| SnO2@CeO2-Co | Differential pulse voltammetry | Cerium oxide nanocrystals doped with cobalt heteroatoms (CeO2-Co) and Tin oxide (SnO2) nanorods | Chicken | Xa | 25 nM–55 µM | 58 nM | [91] |
| GCE/PEDOT:PSS-AuNPs | Voltammetry | Functionalized gold nanoparticle | Fish and meat | Xa | 5.0 × 10⁻⁸–1.0 × 10⁻⁵ M | 3.0 × 10⁻⁸ M | [94] |
| GCE/rGO/CS/Cr2O3 | Amperometry | Reduced graphene oxide | Fish meat | DA UA Xa Hx | 5–160 μM 10–500 μM 10–400 μM 2–300 μM | 0.65 μM 0.80 μM 1.20 μM 0.85 μM | [95] |
| XO/Poly(l-Asp)/MWCNT/GCE electrode |
| Multi-walled carbon nanotube (MWCNT) | Fish meat | Xa | 0.001–0.004 μM | 3.5 × 10⁻⁴ μM | [96] |
| Ag/AgCl (4B-PGE*) | Amperometry | - | Freshly dead fish | Hx Xa UA | 6–30 μM 8–36 μM 3–21 μM | 1.09 μM 0.40 μM 0.17 μM | [101] |
| Cu-BTC/CPE | Amperometry | - | Fish | Hx | 5–8000 nM | 2.0 nM | [102] |
4.2. Optical Sensor
| Sensor | Detection Method | Nanomaterials | Sample | Analyte | Linear Range | LOD | References |
|---|---|---|---|---|---|---|---|
| Fluorescent-TPE- HPro/XO | Colorimetric | - | Fish | Hx | 5–120 μM | 1.2 μM | [10] |
| O-CDs | Colorimetric | Carbon dots | Fish | Hx | 2–250 µM | 0.61 µM | [24] |
| XOD-ASS | Fluorescence | - | Fish | Hx | 20–100 μM | 6.93 μM | [52] |
| Fluorescent-PtNPs | Fluorescence | Platinum nanoparticles | Fish, shrimp, squid | Hx | 8–2500 μM | 2.88 μM | [121] |
| Fluorescent-NH2-Cu-MOF nanosheet | Fluorescence | Metal organic frameworks (MOF) nanosheet | Fish | Hx | 10–2000 μM | 3.93 μM | [123] |
| DNA-F/GO | Fluorescence | Graphene oxide (GO) | Beef | ATP | 20–3500 μM | 3.2 μM | [124] |
| Cys-CuNCs | Fluorescence | Copper nanoclusters | Fish | Hx | 8–400 μmol/L | 0.7 μmol/L | [125] |
| XOD@ZnO nanomaterials | Colorimetric | Zinc oxide (ZnO) nanomaterials | Fish | Xa | 2.67 × 10⁻⁶–2.67 × 10⁻⁴ mol L−1 | 1.30 × 10⁻¹⁰ mol L−1 | [126] |
| Silver ions and β-D-GP | Fiber-optic | - | Fish | BAs | 28.5–114.9 × 10⁻⁹ mol dm−3 | 2.77 × 10⁻⁹ mol dm−3 | [127] |
| AgP | Colorimetric | Silver nanoplates (AgP) | Fish | Xa | 0.15–0.60 μM | 0.011 μM | [129] |
| Paper-based colorimetric biosensor | Fluorescence | - | Pork, chicken, fish meat and fish sauce | Hx | 5–40 mg/L | 1.8 mg/L | [130] |
| Co-doped-g-C3N4 | Colorimetric | - | Fish | Hx | 2.50–153.1 mg/kg | 1.84 mg/kg | [131] |
| XO/NBT/sol–gel biohybrid | Colorimetric | - | Tilapia fish | Hx | - | 3.7 μM | [132] |
| CeNPs/XOD/silanized paper | Colorimetric | Cerium oxide nanoparticles (CeNPs) | Degraded fish | Hx | 800 μM | 15 μM | [133] |
| SPB NPs/Agarose hydrogel | Fluorescence/ colorimetric | Silver-doped prussian blue nanoparticles (SPB NPs) | Shrimp, fish | TMA | 0.21–0.54 ppm | - | [134] |
| Colorimetric-CTAB- Au nanorods | Fluorescence | Gold nanorods (GNrs) | Fish | Hx | 0–1130 μM | - | [135] |
5. Comparison between Conventional Techniques and Nanotechnology Biosensor
6. Conclusion and Future Perspectives
Author Contributions
Funding
Institutional Review Board Statement
Informed Consent Statement
Data Availability Statement
Acknowledgments
Conflicts of Interest
References
- Bonnet, C.; Bouamra-Mechemache, Z.; Réquillart, V.; Treich, N. Regulating meat consumption to improve health, the environment and animal welfare. Food Policy 2020, 97, 101847. [Google Scholar] [CrossRef]
- Erna, K.H.; Rovina, K.; Mantihal, S. Current Detection Techniques for Monitoring the Freshness of Meat-Based Products: A Review. J. Package. Technol. Res. 2021, 5, 127–141. [Google Scholar] [CrossRef]
- Albelda, J.A.; Uzunoglu, A.; Santos, G.N.C.; Stanciu, L.A. Graphene-titanium dioxide nanocomposite based hypoxanthine sensor for assessment of meat freshness. Biosens. Bioelectron. 2017, 89, 518–524. [Google Scholar] [CrossRef] [PubMed]
- Díaz, F.; Díaz-Luis, A.; Sierra, V.; Diñeiro, Y.; González, P.; García-Torres, S.; Oliván, M. What functional proteomic and biochemical analysis tell us about animal stress in beef? J. Proteom. 2020, 218, 103722. [Google Scholar] [CrossRef] [PubMed]
- Hong, H.; Regenstein, J.M.; Luo, Y. The importance of ATP-related compounds for the freshness and flavor of post-mortem fish and shellfish muscle: A review. Crit. Rev. Food Sci. Nutr. 2017, 57, 1787–1798. [Google Scholar] [CrossRef] [PubMed]
- Karim, N.U.; Kennedy, J.T.; Linton, M.; Patterson, M.; Watson, S.; Gault, N. Determination of nucleotide and enzyme degradation in haddock (Melanogrammus aeglefinus) and herring (Clupea harengus) after high pressure processing. PeerJ 2019, 7, 7527. [Google Scholar] [CrossRef] [PubMed]
- Hwang, J.H.; Kim, Y.; Choi, H.; Lee, K.G. ATP degradation products as freshness indicator of flatfish during storage. Food Sci. Biotechnol. 2019, 28, 1891–1897. [Google Scholar] [CrossRef]
- Zhang, Y.; Gao, X.; Ye, Y.; Shen, Y. Fe-Doped polydopamine nanoparticles with peroxidase-mimicking activity for the detection of hypoxanthine related to meat freshness. Analyst 2022, 147, 956–964. [Google Scholar] [CrossRef]
- Chen, J.; Kong, Q.; Sun, Z.; Liu, J. Freshness analysis based on lipidomics for farmed Atlantic salmon (Salmo salar L.) stored at different times. Food Chem. 2022, 373, 131564. [Google Scholar] [CrossRef]
- Zhang, Z.; Kwok, R.T.; Yu, Y.; Tang, B.Z.; Ng, K.M. Aggregation-induced emission luminogen-based fluorescence detection of hypoxanthine: A probe for biomedical diagnosis of energy metabolism-related conditions. J. Mater. Chem. B 2018, 6, 4575–4578. [Google Scholar] [CrossRef]
- Guo, X.; Wang, X.; Huang, D.; Zhang, J.; Xu, D.; Yang, W.; Huang, T. Method study on determination of total purine content in fish meat by diazotization reaction combined with SERS. LWT 2020, 123, 109027. [Google Scholar] [CrossRef]
- Jia, W.; Fan, Z.; Shi, Q.; Zhang, R.; Wang, X.; Shi, L. LC-MS-based metabolomics reveals metabolite dynamic changes during irradiation of goat meat. Int. Food Res. J. 2021, 150, 110721. [Google Scholar] [CrossRef]
- Daldal, Y.D.; Demiralay, E.Ç. Chromatographic and UV–visible spectrophotometric pKa determination of some purine antimetabolites. J. Mol. Liq. 2020, 317, 113930. [Google Scholar] [CrossRef]
- Mathew, M.R.; Kumar, K.G. Poly (Amino Hydroxy Naphthalene Sulphonic Acid) Modified Glassy Carbon Electrode; An Effective Sensing Platform for the Simultaneous Determination of Xanthine and Hypoxanthine. J. Electrochem. Soc. 2020, 167, 047519. [Google Scholar] [CrossRef]
- Dervisevic, M.; Dervisevic, E.; Şenel, M. Recent progress in nanomaterial-based electrochemical and optical sensors for hypoxanthine and xanthine. A review. Mikrochim. Acta 2019, 186, 749. [Google Scholar] [CrossRef] [PubMed]
- Vlassa, M.; Filip, M.; Dragomir, C. Simultaneous quantifications of four purine derivatives biomarkers in cow milk by SPE HPLC-DAD. Czech J. Food Sci. 2021, 39, 122–130. [Google Scholar] [CrossRef]
- Nanda, P.K.; Bhattacharya, D.; Das, J.K.; Bandyopadhyay, S.; Ekhlas, D.; Lorenzo, J.M.; Gagaoua, M. Emerging Role of Biosensors and Chemical Indicators to Monitor the Quality and Safety of Meat and Meat Products. Chemosens 2022, 10, 322. [Google Scholar] [CrossRef]
- Thakur, D.; Pandey, C.M.; Kumar, D. Highly Sensitive Enzymatic Biosensor Based on Polyaniline-Wrapped Titanium Dioxide Nanohybrid for Fish Freshness Detection. Appl. Biochem. Biotechnol. 2022, 194, 3765–3778. [Google Scholar] [CrossRef] [PubMed]
- Tripathi, A.; Elias, A.L.; Jemere, A.B.; Harris, K.D. Amperometric Determination of Xanthine Using Nanostructured NiO Electrodes Loaded with Xanthine Oxidase. ACS Food Sci. Technol. 2022, 2, 1307–1317. [Google Scholar] [CrossRef]
- Sen, S.; Sarkar, P. A simple electrochemical approach to fabricate functionalized MWCNT-nanogold decorated PEDOT nanohybrid for simultaneous quantification of uric acid, xanthine and hypoxanthine. Anal. Chim. Acta 2020, 1114, 15–28. [Google Scholar] [CrossRef]
- Wang, G.; Sun, J.; Yao, Y.; An, X.; Zhang, H.; Chu, G.; Liu, Y. Detection of Inosine Monophosphate (IMP) in meat using double-enzyme sensor. Food Anal. Methods 2020, 13, 420–432. [Google Scholar] [CrossRef]
- Tan, J.; Liu, L.; Li, F.; Chen, Z.; Chen, G.Y.; Fang, F.; Guo, J.; He, M.; Zhou, X. Screening of Endocrine Disrupting Potential of Surface Waters via an Affinity-Based Biosensor in a Rural Community in the Yellow River Basin, China. Environ. Sci. Technol. 2022, 56, 14350–14360. [Google Scholar] [CrossRef]
- Memon, A.G.; Xing, Y.; Zhou, X.; Wang, R.; Liu, L.; Zeng, S.; He, M.; Ma, M. Ultrasensitive colorimetric aptasensor for Hg2+ detection using Exo-III assisted target recycling amplification and unmodified AuNPs as indicators. J. Hazard. Mater. 2020, 384, 120948. [Google Scholar] [CrossRef] [PubMed]
- Mou, Z.; Gao, Z.; Hu, Y. Orange emissive carbon dots for fluorescent determination of hypoxanthine in fish. SAA 2022, 269, 120734. [Google Scholar] [CrossRef] [PubMed]
- Song, D.; Chen, Q.; Zhai, C.; Tao, H.; Zhang, L.; Jia, T.; Zhu, B. Label-Free ZnIn2S4/UiO-66-NH2 Modified Glassy Carbon Electrode for Electrochemically Assessing Fish Freshness by Monitoring Xanthine and Hypoxanthine. Chemosens 2022, 10, 158. [Google Scholar] [CrossRef]
- Liu, R.; Warner, R.D.; Zhou, G.; Zhang, W. Contribution of nitric oxide and protein S-nitrosylation to variation in fresh meat quality. Meat Sci. 2018, 144, 135–148. [Google Scholar] [CrossRef]
- Cenci-Goga, B.T.; Iulietto, M.F.; Sechi, P.; Borgogni, E.; Karama, M.; Grispoldi, L. New trends in meat packaging. Microbiol. Res. 2020, 11, 56–67. [Google Scholar] [CrossRef]
- Mohammed, H.H.H.; Jin, G.; Ma, M.; Khalifa, I.; Shukat, R.; Elkhedir, A.E.; Noman, A.E. Comparative characterization of proximate nutritional compositions, microbial quality and safety of camel meat in relation to mutton, beef, and chicken. LWT 2020, 118, 108714. [Google Scholar] [CrossRef]
- Johnson, J.; Atkin, D.; Lee, K.; Sell, M.; Chandra, S. Determining meat freshness using electrochemistry: Are we ready for the fast and furious? Meat Sci. 2019, 150, 40–46. [Google Scholar] [CrossRef]
- Álvarez, S.; Mullen, A.M.; Hamill, R.; O’Neill, E.; Álvarez, C. Dry-aging of beef as a tool to improve meat quality. Impact of processing conditions on the technical and organoleptic meat properties. Adv. Food Nutr. Res. 2021, 95, 97–130. [Google Scholar] [CrossRef]
- Rey, A.I.; Menoyo, D.; Segura, J.; López-Bote, C.J.; Calvo, L. Combination of dietary glycaemic index and fasting time prior to slaughter as strategy to modify quality of pork. Meat Sci. 2020, 161, 108013. [Google Scholar] [CrossRef]
- Chauhan, S.S.; England, E.M. Postmortem glycolysis and glycogenolysis: Insights from species comparisons. Meat Sci. 2018, 144, 118–126. [Google Scholar] [CrossRef] [PubMed]
- Shi, C.; Cui, J.; Qin, N.; Luo, Y.; Lu, H.; Wang, H. Effect of ginger extract and vinegar on ATP metabolites, IMP-related enzyme activity, reducing sugars and phosphorylated sugars in silver carp during postslaughter storage. Int. J. Food Sci. 2017, 52, 413–423. [Google Scholar] [CrossRef]
- Rongsheng, Z.; Huaizhong, W.; Song, L.; Yanping, W.; Hongmei, H. Deposition Pattern of Inosine Monophosphate (IMP) in Pig Muscle during Cold Storage. Anim. Feed Sci. 2017, 9, 197–218. [Google Scholar] [CrossRef]
- Feng, X.; Moon, S.H.; Lee, H.Y.; Ahn, D.U. Effect of irradiation on the degradation of nucleotides in turkey meat. LWT 2016, 73, 88–94. [Google Scholar] [CrossRef]
- Lin, W.C.; He, Y.M.; Shi, C.; Mu, C.K.; Wang, C.L.; Li, R.H.; Ye, Y.F. ATP catabolism and bacterial succession in postmortem tissues of mud crab (Scylla paramamosain) and their roles in freshness. Int. Food Res. J. 2022, 155, 110992. [Google Scholar] [CrossRef]
- Ebata, K.; Yamashita, Y.; Inohara, K.; Fuwa, S.; Kimura, I.; Tamotsu, S.; Shinmachi, T. Evaluation of Muscle Post-mortem Changes of Japanese Anchovy Engraulis japonicus and Round Herring Etrumeus teres and Recovery of ATP Concentration of Japanese Anchovy Following Brief Rest in a Fish Cage. J. Fish. Eng. 2020, 56, 149–158. [Google Scholar] [CrossRef]
- Huang, Z.; Zhang, J.; Gu, Y.; Cai, Z.; Feng, X.; Yang, C.; Xin, G. Research progress on inosine monophosphate deposition mechanism in chicken muscle. Crit. Rev. Food Sci. Nutr. 2022, 62, 1062–1078. [Google Scholar] [CrossRef]
- Pierini, G.D.; Robledo, S.N.; Zon, M.A.; Di Nezio, M.S.; Granero, A.M.; Fernandez, H. Development of an electroanalytical method to control quality in fish samples based on an edge plane pyrolytic graphite electrode. Simultaneous determination of hypoxanthine, xanthine and uric acid. Microchem. J. 2018, 138, 58–64. [Google Scholar] [CrossRef]
- Li, J.; Zhou, G.; Xue, P.; Dong, X.; Xia, Y.; Regenstein, J.; Sun, L. Spoilage microbes’ effect on freshness and IMP degradation in sturgeon fillets during chilled storage. Food Biosci. 2021, 41, 101008. [Google Scholar] [CrossRef]
- Min, J.G.; Joung, B.C.; Jung, W.Y. Postmortem Changes in Spinal Cord-damaged Olive Flounder (Paralichthys olivaceus). J. Food Nutr. Res. 2019, 7, 500–505. [Google Scholar] [CrossRef]
- Yoshioka, T.; Konno, Y.; Konno, K. Below-zero storage of fish to suppress loss of freshness. Fish. Sci. 2018, 85, 601–609. [Google Scholar] [CrossRef]
- Larashinda, M.; Sayuti, K.; Yenrina, R.; Refdi, C.W. Purine Content in Various Type of Gulai as Specialty Food of West Sumatra. IJPSAT 2020, 21, 109–114. [Google Scholar] [CrossRef]
- Takayanagi, F.; Fukuuchi, T.; Yamaoka, N.; Kaneko, K. Measurement of the total purine contents and free nucleosides, nucleotides, and purine bases composition in Japanese anchovies (Engraulis japonicus) using high-performance liquid chromatography with UV detection. Nucleos. Nucleat. Nucl. 2020, 39, 1458–1464. [Google Scholar] [CrossRef]
- Qu, X.; Sui, J.; Mi, N.; Lin, H. Determination of four different purines and their content change in seafood by high-performance liquid chromatography. J. Sci. Food Agric. 2017, 97, 520–525. [Google Scholar] [CrossRef] [PubMed]
- Felisiak, K.; Szymczak, M.; Kołakowski, E. Identification of non-protein nitrogen compounds separated by CZE without derivatization from TCA extract from salted herring meat. J. Food Compos. Anal. 2019, 77, 108–114. [Google Scholar] [CrossRef]
- Ali, N.S.M.; Zabidi, A.R.; Manap, M.N.A.; SMSNS, Z.; Yahaya, N. Effect of different slaughtering methods on metabolites of broiler chickens using Ultra High-Performance Liquid Chromatography-Time of Flight-Mass Spectrometry (UHPLC-TOF-MS). Food Res. 2020, 4, 133–138. [Google Scholar] [CrossRef]
- Zheng, Y.; Li, X.; Chen, X.; Cai, Z.; Zhao, H. Simultaneous determination of amino acids, purines and derivatives in serum by ultrahigh-performance liquid chromatography/tandem mass spectrometry. RCM 2019, 33, 81–88. [Google Scholar] [CrossRef]
- Ueda, S.; Yamanoue, M.; Sirai, Y.; Iwamoto, E. Exploring the Characteristic Aroma of Beef from Japanese Black Cattle (Japanese Wagyu) via Sensory Evaluation and Gas Chromatography-Olfactometry. Metabolites 2021, 11, 56. [Google Scholar] [CrossRef]
- Chang, W.C.W.; Wu, H.Y.; Yeh, Y.; Liao, P.C. Untargeted foodomics strategy using high-resolution mass spectrometry reveals potential indicators for fish freshness. Anal. Chim. Acta 2020, 1127, 98–105. [Google Scholar] [CrossRef]
- Dibirasulaev, M.; Belozerov, G.; Arkhipov, L.; Stoyanova, L. Quick and simple spectrophotometric method of identification of the thermal state of meat on the basis of composition and content of free nucleotides. Food Sci. Nutr. 2018, 9, 572–583. [Google Scholar] [CrossRef]
- Guo, C.; You, S.; Li, C.; Chen, T.; Wang, X. One-Step and Colorimetric Detection of Fish Freshness Indicator Hypoxanthine Based on the Peroxidase Activity of Xanthine Oxidase Grade I Ammonium Sulfate Suspension. Front. Microbiol. 2021, 12, 791227. [Google Scholar] [CrossRef]
- Fukuuchi, T.; Iyama, N.; Yamaoka, N.; Kaneko, K. Simultaneous quantification by HPLC of purines in umami soup stock and evaluation of their effects on extracellular and intracellular purine metabolism. Nucleos. Nucleat. Nucl. 2018, 37, 273–279. [Google Scholar] [CrossRef]
- Larashinda, M.; Sayuti, K.; Yenrina, R.; Refdi, C.W. Identification of Purine Content in Various Processed Foods of Chicken as Specialty Food of West Sumatra. In Proceedings of the IOP Conference Series: Earth and Environmental Science, Phuket, Thailand, 18–21 October 2019. [Google Scholar] [CrossRef]
- Wu, M.; Zhang, W.; Shen, X.; Wang, W. Simultaneous Determination of Purines and Uric Acid in Chinese Chicken Broth Using TFA/FA Hydrolysis Coupled with HPLC-VWD. Foods 2021, 10, 2814. [Google Scholar] [CrossRef]
- Xiao, L.; Sha, W.; Tao, C.; Hou, C.; Xiao, G.; Ren, J. Effect on purine releasement of Lentinus edodes by different food processing techniques. Food Chem. X 2022, 13, 100260. [Google Scholar] [CrossRef]
- Zhu, P.; Wang, S.; Wang, J.; Zhou, L.; Shi, P. A capillary zone electrophoresis method for adenine nucleotides analysis in Saccharomyces cerevisiae. J. Chromatogr. B 2016, 1008, 156–163. [Google Scholar] [CrossRef]
- Klampfl, C.W.; Himmelsbach, M.; Buchberger, W.; Klein, H. Determination of purines and pyrimidines in beer samples by capillary zone electrophoresis. Anal. Chim. Acta 2002, 454, 185–191. [Google Scholar] [CrossRef]
- Mu, G.; Luan, F.; Xu, L.; Hu, F.; Liu, H.; Gao, Y. Determination of purines in soybean milk by capillary electrophoresis in comparison with high performance liquid chromatography. Anal. Methods 2012, 4, 3386–3391. [Google Scholar] [CrossRef]
- Medina, D.A.V.; Borsatto, J.V.B.; Maciel, E.V.S.; Lancas, F.M. Current role of modern chromatography and mass spectrometry in the analysis of mycotoxins in food. TRAC-Trends Analyt. Chem. 2021, 135, 116156. [Google Scholar] [CrossRef]
- Hu, Q.; Sun, Y.; Yuan, P.; Lei, H.; Zhong, H.; Wang, Y.; Tang, H. Quantitative structure-retention relationship for reliable metabolite identification and quantification in metabolomics using ion-pair reversed-phase chromatography coupled with tandem mass spectrometry. Talanta 2022, 238, 123059. [Google Scholar] [CrossRef]
- Hou, C.; Xiao, G.; Amakye, W.K.; Sun, J.; Xu, Z.; Ren, J. Guidelines for purine extraction and determination in foods. Food Front. 2021, 2, 557–573. [Google Scholar] [CrossRef]
- Li, C.; Hao, J.; Wu, K. Triethylamine-controlled Cu-BTC frameworks for electrochemical sensing fish freshness. Anal. Chim. Acta 2019, 1085, 68–74. [Google Scholar] [CrossRef] [PubMed]
- Ramirez, D.A.; Locatelli, D.A.; González, R.E.; Cavagnaro, P.F.; Camargo, A.B. Analytical methods for bioactive sulfur compounds in Allium: An integrated review and future directions. J. Food Compos. Anal. 2017, 61, 4–19. [Google Scholar] [CrossRef]
- Masci, M.; Zoani, C.; Nevigato, T.; Turrini, A.; Jasionowska, R.; Caproni, R.; Ratini, P. Authenticity assessment of dairy products by Capillary Electrophoresis. Electrophoresis 2022, 43, 340–354. [Google Scholar] [CrossRef] [PubMed]
- Felisiak, K.; Szymczak, M. Use of rapid capillary zone electrophoresis to determine amino acids indicators of herring ripening during salting. Foods 2021, 10, 2518. [Google Scholar] [CrossRef] [PubMed]
- Shrestha, B. Nanotechnology for Biosensor Applications. In Sustainable Nanotechnology for Environmental Remediation; Elsevier: Amsterdam, The Netherlands, 2022; Volume 1, pp. 513–531. [Google Scholar] [CrossRef]
- Huang, X.; Zhu, Y.; Kianfar, E. Nano biosensors: Properties, applications and electrochemical techniques. J. Mater. Res. Technol. 2021, 12, 1649–1672. [Google Scholar] [CrossRef]
- Rastogi, S.; Kumari, V.; Sharma, V.; Ahmad, F.J. Gold Nanoparticle-based Sensors in Food Safety Applications. Food Anal. Methods 2021, 15, 468–484. [Google Scholar] [CrossRef]
- Prajapati, S.; Padhan, B.; Amulyasai, B.; Sarkar, A. Nanotechnology-based sensors. Biopolym.-Based Formul. 2020, 1, 237–262. [Google Scholar] [CrossRef]
- Bashir, O.; Bhat, S.A.; Basharat, A.; Qamar, M.; Qamar, S.A.; Bilal, M.; Iqbal, H.M. Nano-engineered materials for sensing food pollutants: Technological advancements and safety issues. Chemosphere 2022, 292, 133320. [Google Scholar] [CrossRef]
- Inan, H.; Poyraz, M.; Inci, F.; Lifson, M.A.; Baday, M.; Cunningham, B.T.; Demirci, U. Photonic crystals: Emerging biosensors and their promise for point-of-care applications. Chem. Soc. Rev. 2017, 46, 366–388. [Google Scholar] [CrossRef] [PubMed]
- Jayanthi, V.S.A.; Das, A.B.; Saxena, U. Recent advances in biosensor development for the detection of cancer biomarkers. Biosens. Bioelectron. 2017, 91, 15–23. [Google Scholar] [CrossRef] [PubMed]
- Chen, Y.; Liu, J.; Yang, Z.; Wilkinson, J.S.; Zhou, X. Optical biosensors based on refractometric sensing schemes: A review. Biosens. Bioelectron. 2019, 144, 111693. [Google Scholar] [CrossRef] [PubMed]
- Ahmad, R.; Wolfbeis, O.S.; Hahn, Y.B.; Alshareef, H.N.; Torsi, L.; Salama, K.N. Deposition of nanomaterials: A crucial step in biosensor fabrication. Mater. Today Commun. 2018, 17, 289–321. [Google Scholar] [CrossRef]
- Kaçar, C.; Erden, P.E. An amperometric biosensor based on poly (l-aspartic acid), nanodiamond particles, carbon nanofiber, and ascorbate oxidase–modified glassy carbon electrode for the determination of l-ascorbic acid. Anal. Bioanal. Chem. 2020, 412, 5315–5327. [Google Scholar] [CrossRef]
- Erna, K.H.; Felicia, W.X.L.; Rovina, K.; Vonnie, J.M.; Huda, N. Development of curcumin/rice starch films for sensitive detection of hypoxanthine in chicken and fish meat. Carbohydr. Polym. 2022, 3, 100189. [Google Scholar] [CrossRef]
- Nur Topkaya, S.; Cetin, A.E. Electrochemical aptasensors for biological and chemical analyte detection. Electroanalysis 2021, 33, 277–291. [Google Scholar] [CrossRef]
- Gulaboski, R.; Mirceski, V.; Lovric, M. Square-wave protein-film voltammetry: New insights in the enzymatic electrode processes coupled with chemical reactions. J. Solid State Electrochem. 2019, 23, 2493–2506. [Google Scholar] [CrossRef]
- Schockman, K.M.; Byrne, R.H. A hybrid conductometric/spectrophotometric method for determining ionic strength of dilute aqueous solutions. Anal. Chim. Acta 2022, 1220, 340008. [Google Scholar] [CrossRef]
- Bais, R. An Overview of the Synergy of Electrochemistry and Nanotechnology for Advancements in Sensing Applications. In Frontiers in Voltammetry; IntechOpen: Rijeka, Croatia, 2022; Volume 1. [Google Scholar] [CrossRef]
- Nguyen, H.H.; Lee, S.H.; Lee, U.J.; Fermin, C.D.; Kim, M. Immobilized enzymes in biosensor applications. Materials 2019, 12, 121. [Google Scholar] [CrossRef]
- Wang, Z.; Ma, B.; Shen, C.; Lai, O.M.; Tan, C.P.; Cheong, L.Z. Electrochemical biosensing of chilled seafood freshness by xanthine oxidase immobilized on copper-based metal–organic framework nanofiber film. Food Anal. Methods 2019, 12, 1715–1724. [Google Scholar] [CrossRef]
- Joon, A.; Ahlawat, J.; Aggarwal, V.; Jaiwal, R.; Pundir, C.S. An improved amperometric determination of xanthine with xanthine oxidase nanoparticles for testing of fish meat freshness. Sens. Bio-Sens. Res. 2021, 33, 100437. [Google Scholar] [CrossRef]
- Erol, E.; Yildirim, E.; Cete, S. Construction of biosensor for hypoxanthine determination by immobilization of xanthine oxidase and uricase in polypyrrole-paratoluenesulfonate film. J. Solid State Electrochem. 2020, 24, 1695–1707. [Google Scholar] [CrossRef]
- Sharma, N.K.; Kaushal, A.; Thakur, S.; Thakur, N.; Kumar, D.; Bhalla, T.C. Nanohybrid electrochemical enzyme sensor for xanthine determination in fish samples. Biotech 2021, 11, 212. [Google Scholar] [CrossRef]
- Sahyar, B.Y.; Kaplan, M.; Ozsoz, M.; Celik, E.; Otles, S. Electrochemical xanthine detection by enzymatic method based on Ag doped ZnO nanoparticles by using polypyrrole. Bioelectrochemistry 2019, 130, 107327. [Google Scholar] [CrossRef]
- Boluda, A.; Casado, C.M.; Alonso, B.; García Armada, M.P. Efficient Oxidase Biosensors Based on Bioelectrocatalytic Surfaces of Electrodeposited Ferrocenyl Polycyclosiloxanes—Pt Nanoparticles. Chemosensors 2021, 9, 81. [Google Scholar] [CrossRef]
- Furuhashi, M. New insights into purine metabolism in metabolic diseases: Role of xanthine oxidoreductase activity. Am. J. Physiol. Endocrinol. Metab. 2020, 319, E827–E834. [Google Scholar] [CrossRef]
- Ahmad, M.W.; Dey, B.; Sarkhel, G.; Yang, D.J.; Choudhury, A. Sea-urchin-like Cobalt-MOF on Electrospun Carbon Nanofiber Mat as a Self-Supporting Electrode for Sensing of Xanthine and Uric Acid. J. Electroanal. Chem. 2022, 920, 116646. [Google Scholar] [CrossRef]
- Malhotra, D.; Tran, P.K.L.; Tran, D.T.; Kim, N.H.; Lee, J.H. Cobalt-doped cerium oxide nanocrystals shelled 1D SnO2 structures for highly sensitive and selective xanthine detection in biofluids. J. Colloid Interface Sci. 2021, 600, 299–309. [Google Scholar] [CrossRef]
- Norrrahim, M.N.F.; Knight, V.F.; Nurazzi, N.M.; Jenol, M.A.; Misenan, M.S.M.; Janudin, N.; Kasim, N.A.M.; Shukor, M.F.A.; Ilyas, R.A.; Asyraf, M.R.M.; et al. The Frontiers of Functionalized Nanocellulose-Based Composites and Their Application as Chemical Sensors. Polymers 2022, 14, 4461. [Google Scholar] [CrossRef]
- Fenton, A.M., Jr.; Brushett, F.R. Using voltammetry augmented with physics-based modeling and Bayesian hypothesis testing to identify analytes in electrolyte solutions. J. Electroanal. Chem. 2022, 904, 115751. [Google Scholar] [CrossRef]
- Khan, M.Z.H.; Ahommed, M.S.; Daizy, M. Detection of xanthine in food samples with an electrochemical biosensor based on PEDOT: PSS and functionalized gold nanoparticles. RSC Adv. 2020, 10, 36147–36154. [Google Scholar] [CrossRef] [PubMed]
- Ghanbari, K.; Nejabati, F. Ternary nanocomposite-based reduced graphene oxide/chitosan/Cr2O3 for the simultaneous determination of dopamine, uric acid, xanthine, and hypoxanthine in fish meat. Anal. Methods 2020, 12, 1650–1661. [Google Scholar] [CrossRef]
- Yazdanparast, S.; Benvidi, A.; Abbasi, S.; Rezaeinasab, M. Enzyme-based ultrasensitive electrochemical biosensor using poly (l-aspartic acid)/MWCNT bio-nanocomposite for xanthine detection: A meat freshness marker. Microchem. J. 2019, 149, 104000. [Google Scholar] [CrossRef]
- Wang, D.; Wang, J. A sensitive and label-free electrochemical microRNA biosensor based on Polyamidoamine Dendrimer functionalized Polypyrrole nanowires hybrid. Microchim. Acta 2021, 188, 173. [Google Scholar] [CrossRef] [PubMed]
- Sari, S.R.; Tominaga, M. Progress and current trends in the electrochemical determination of phosphate ions for environmental and biological monitoring applications. Anal. Sci. 2022. [Google Scholar] [CrossRef]
- Shen, H.; Liu, H.; Wang, X. Surface construction of catalase-immobilized Au/PEDOT nanocomposite on phase-change microcapsules for enhancing electrochemical biosensing detection of hydrogen peroxide. Appl. Surf. Sci. 2023, 612, 155816. [Google Scholar] [CrossRef]
- Purohit, B.; Vernekar, P.R.; Shetti, N.P.; Chandra, P. Biosensor nanoengineering: Design, operation, and implementation for biomolecular analysis. Sens. Int. 2020, 1, 100040. [Google Scholar] [CrossRef]
- Vishnu, N.; Gandhi, M.; Rajagopal, D.; Kumar, A.S. Pencil graphite as an elegant electrochemical sensor for separation-free and simultaneous sensing of hypoxanthine, xanthine and uric acid in fish samples. Anal. Methods 2017, 9, 2265–2274. [Google Scholar] [CrossRef]
- Zhang, Y.; Bo, X.; Nsabimana, A.; Han, C.; Li, M.; Guo, L. Electrocatalytically active cobalt-based metal–organic framework with incorporated macroporous carbon composite for electrochemical applications. J. Mater. Chem. A 2015, 3, 732–738. [Google Scholar] [CrossRef]
- Bilal, S.; Hassan, M.M.; ur Rehman, M.F.; Nasir, M.; Sami, A.J.; Hayat, A. An insect acetylcholinesterase biosensor utilizing WO3/g-C3N4 nanocomposite modified pencil graphite electrode for phosmet detection in stored grains. Food Chem. 2021, 346, 128894. [Google Scholar] [CrossRef] [PubMed]
- Idris, A.; Saleh, T.; Muraza, O.; Sanhoob, M.; Aziz, M.; Al-Betar, A.R. Synthesis of phosphate-modified zeolite as a modifier in carbon paste electrode for nitrite electrochemical detection. J. Mater. Sci. Mater. Electron. 2019, 30, 3283–3293. [Google Scholar] [CrossRef]
- Mahale, R.S.; Vasanth, S.; Krishna, H.; Shashanka, R.; Sharath, P.C.; Sreekanth, N.V. Electrochemical sensor applications of nanoparticle modified carbon paste electrodes to detect various neurotransmitters: A review. Appl. Mech. Mater. 2022, 908, 69–88. [Google Scholar] [CrossRef]
- Saeed, R.; Feng, H.; Wang, X.; Xiaoshuan, Z.; Zetian, F. Fish quality evaluation by sensor and machine learning: A mechanistic review. Food Control 2022, 137, 108902. [Google Scholar] [CrossRef]
- Cao, Q.; Lucktong, J.; Shao, Z.; Chang, Y.; Venton, B.J. Electrochemical treatment in KOH renews and activates carbon fiber microelectrode surfaces. Anal. Bioanal. Chem. 2021, 413, 6737–6746. [Google Scholar] [CrossRef] [PubMed]
- Elbadawi, M.; Ong, J.J.; Pollard, T.D.; Gaisford, S.; Basit, A.W. Additive manufacturable materials for electrochemical biosensor electrodes. Adv. Funct. Mater. 2021, 31, 2006407. [Google Scholar] [CrossRef]
- Kim, J.; Lee, Y.; Kang, M.; Hu, L.; Zhao, S.; Ahn, J.H. 2D Materials for Skin-Mountable Electronic Devices. Adv. Mater. 2021, 33, 2005858. [Google Scholar] [CrossRef]
- Wang, G.; Liu, J.; Yue, F.; Shen, Z.; Xu, D.; Fang, H.; Sun, X. Dual enzyme electrochemiluminescence sensor based on in situ synthesis of ZIF-67@ AgNPs for the detection of IMP in fresh meat. LWT 2022, 165, 113658. [Google Scholar] [CrossRef]
- Mazlumoglu, H.; Yilmaz, M. Silver nanoparticle-decorated titanium dioxide nanowire systems via bioinspired poly (l-DOPA) thin film as a surface-enhanced Raman spectroscopy (SERS) platform, and photocatalyst. Phys. Chem. Chem. Phys. 2021, 23, 13396–13404. [Google Scholar] [CrossRef]
- Ibrahim, N.; Jamaluddin, N.D.; Tan, L.L.; Mohd Yusof, N.Y. A Review on the Development of Gold and Silver Nanoparticles-Based Biosensor as a Detection Strategy of Emerging and Pathogenic RNA Virus. Sensors 2021, 21, 5114. [Google Scholar] [CrossRef]
- Gu, X.; Wang, K.; Qiu, J.; Wang, Y.; Tian, S.; He, Z.; Zong, R.; Kraatz, H.-B. Enhanced electrochemical and SERS signals by self-assembled gold microelectrode arrays: A dual readout platform for multiplex immumoassay of tumor biomarkers. Sens. Actuators B Chem. 2021, 334, 129674. [Google Scholar] [CrossRef]
- Zhang, L.T.; Zhou, Y.; Han, S.T. The role of metal–organic frameworks in electronic sensors. Angew. Chem. 2021, 133, 15320–15340. [Google Scholar] [CrossRef]
- Dong, J.; Zhao, D.; Lu, Y.; Sun, W.Y. Photoluminescent metal–organic frameworks and their application for sensing biomolecules. J. Mater. Chem. 2019, 7, 22744–22767. [Google Scholar] [CrossRef]
- Khorsandi, D.; Zarepour, A.; Rezazadeh, I.; Ghomi, M.; Ghanbari, R.; Zarrabi, A.; Esfahani, F.T.; Mojahed, N.; Baghayeri, M.; Zare, E.N.; et al. Ionic liquid-based materials for electrochemical biosensing. Clin. Transl. Sci. 2022, 2, e127. [Google Scholar] [CrossRef]
- Zhang, L.; Li, S.; Xin, J.; Ma, H.; Pang, H.; Tan, L.; Wang, X. A non-enzymatic voltammetric xanthine sensor based on the use of platinum nanoparticles loaded with a metal-organic framework of type MIL-101 (Cr). Application to simultaneous detection of dopamine, uric acid, xanthine and hypoxanthine. Mikrochim. Acta 2019, 186, 9. [Google Scholar] [CrossRef]
- Singh, P. Surface plasmon resonance: A boon for viral diagnostics. Ref. Modul. Life Sci. 2017, 2, 1–16. [Google Scholar] [CrossRef]
- Malhotra, B.D.; Ali, M.A. Nanomaterials in biosensors: Fundamentals and applications. Nanomater. Biosens. 2018, 1, 1–74. [Google Scholar]
- Damborský, P.; Švitel, J.; Katrlík, J. Optical biosensors. Essays Biochem. 2016, 60, 91–100. [Google Scholar] [CrossRef]
- Chen, J.; Lu, Y.; Yan, F.; Wu, Y.; Huang, D.; Weng, Z. A fluorescent biosensor based on catalytic activity of platinum nanoparticles for freshness evaluation of aquatic products. Food Chem. 2020, 310, 125922. [Google Scholar] [CrossRef]
- Ong, J.J.; Pollard, T.D.; Goyanes, A.; Gaisford, S.; Elbadawi, M.; Basit, A.W. Optical biosensors-Illuminating the path to personalized drug dosing. Biosens. Bioelectron. 2021, 188, 113331. [Google Scholar] [CrossRef]
- Hu, S.; Yan, J.; Huang, X.; Guo, L.; Lin, Z.; Luo, F.; Chen, G. A sensing platform for hypoxanthine detection based on amino-functionalized metal organic framework nanosheet with peroxidase mimic and fluorescence properties. Sens. Actuators B Chem. 2018, 267, 312–319. [Google Scholar] [CrossRef]
- Liu, Z.; Zhong, Y.; Hu, Y.; Yuan, L.; Luo, R.; Chen, D.; Li, Y. Fluorescence strategy for sensitive detection of adenosine triphosphate in terms of evaluating meat freshness. Food Chem. 2019, 270, 573–578. [Google Scholar] [CrossRef] [PubMed]
- Zhao, Z.X.; Guo, Y.P.; Wei, J.; Chen, Q.S.; Chen, X.M. Fluorescent copper nanoclusters for highly sensitive monitoring of hypoxanthine in fish. J. Anal. Test. 2021, 5, 76–83. [Google Scholar] [CrossRef]
- Xue, G.; Yu, W.; Yutong, L.; Qiang, Z.; Xiuying, L.; Yiwei, T.; Jianrong, L. Construction of a novel xanthine biosensor using zinc oxide (ZnO) and the biotemplate method for detection of fish freshness. Anal. Methods 2019, 11, 1021–1026. [Google Scholar] [CrossRef]
- Luo, Q.; Zhang, Y.; Zhou, Y.; Liu, S.G.; Gao, W.; Shi, X. Portable functional hydrogels based on silver metallization for visual monitoring of fish freshness. Food Control 2021, 123, 107824. [Google Scholar] [CrossRef]
- Rayappa, M.K.; Viswanathan, P.A.; Rattu, G.; Krishna, P.M. Nanomaterials enabled and bio/chemical analytical sensors for acrylamide detection in thermally processed foods: Advances and outlook. J. Agric. Food Chem. 2021, 69, 4578–4603. [Google Scholar] [CrossRef]
- Hsu, H.C.; Liao, P.W.; Lee, H.T.; Liu, W.C.; Ho, M.L. Silver Nanoplates for Colorimetric Determination of Xanthine in Human Plasma and in Fish Meat via Etching/Aggregation/Fusion Steps. Sensors 2020, 20, 5739. [Google Scholar] [CrossRef]
- Mooltongchun, M.; Teepoo, S. A simple and cost-effective microfluidic paper-based biosensor analytical device and its application for hypoxanthine detection in meat samples. Food Anal. Methods 2019, 12, 2690–2698. [Google Scholar] [CrossRef]
- Wang, X.; Lin, Z.Z.; Hong, C.Y.; Huang, Z.Y. Colorimetric detection of hypoxanthine in aquatic products based on the enzyme mimic of cobalt-doped carbon nitride. New J. Chem. 2021, 45, 18307–18314. [Google Scholar] [CrossRef]
- Mustafa, F.; Andreescu, S. Based enzyme biosensor for one-step detection of hypoxanthine in fresh and degraded fish. ACS Sens. 2020, 5, 4092–4100. [Google Scholar] [CrossRef]
- Mustafa, F.; Othman, A.; Andreescu, S. Cerium oxide-based hypoxanthine biosensor for Fish spoilage monitoring. Sens. Actuators B Chem. 2021, 332, 129435. [Google Scholar] [CrossRef]
- Ding, N.; Dong, S.; Zhang, Y.; Lu, D.; Lin, J.; Zhao, Q.; Shi, X. Portable silver-doped prussian blue nanoparticle hydrogels for colorimetric and photothermal monitoring of shrimp and fish freshness. Sens. Actuators B Chem. 2022, 363, 131811. [Google Scholar] [CrossRef]
- Chen, Z.; Lin, Y.; Ma, X.; Guo, L.; Qiu, B.; Chen, G.; Lin, Z. Multicolor biosensor for fish freshness assessment with the naked eye. Sens. Actuators B Chem. 2017, 252, 201–208. [Google Scholar] [CrossRef]
- Fanali, S.; Chankvetadze, B. Some thoughts about enantioseparations in capillary electrophoresis. Electrophoresis 2019, 40, 2420–2437. [Google Scholar] [CrossRef] [PubMed]
- Kubáň, P.; Foret, F.; Erny, G. Open source capillary electrophoresis. Electrophoresis 2019, 40, 65–78. [Google Scholar] [CrossRef]
- Lemasson, E.; Richer, Y.; Bertin, S.; Hennig, P.; West, C. Characterization of retention mechanisms in mixed-mode HPLC with a bimodal reversed-phase/cation-exchange stationary phase. Chromatographia 2018, 81, 387–399. [Google Scholar] [CrossRef]
- Garg, D.; Singh, M.; Verma, N. Review on recent advances in fabrication of enzymatic and chemical sensors for hypoxanthine. Food Chem. 2021, 375, 131839. [Google Scholar] [CrossRef]
- Cho, I.H.; Kim, D.H.; Park, S. Electrochemical biosensors: Perspective on functional nanomaterials for on-site analysis. Biomater. Res. 2020, 24, 6. [Google Scholar] [CrossRef]
- Manikandan, V.S.; Adhikari, B.; Chen, A. Nanomaterial based electrochemical sensors for the safety and quality control of food and beverages. Analyst 2018, 143, 4537–4554. [Google Scholar] [CrossRef]


| Analysis Method | Sample | Analyte | Linear Range | LOD | Reference |
|---|---|---|---|---|---|
| HPLC-DAD | Cow milk | Allantoin, Uric acid, Xa, Hx | 3.125–100 µg/mL | 0.74 µg/mL 0.16 µg/mL 0.09 µg/mL 0.14 µg/mL | [16] |
| HPLC-UV | Fish, shellfish, clam | Adenine, Guanine, Hx, Xa | 0.05–300 mg/L | 0.02 mg/L 0.03 mg/L 0.06 mg/L 0.10 mg/L | [45] |
| CZE | Salted herring meat | Trp, Thr, Met, Phe, Tyr | - | - | [46] |
| UHPLC-MS | Chicken | Histidine, Hx, Inosine | - | - | [47] |
| UHPLC-MS | Serum | Twenty-three purine derivatives | 0.002–11.2 μg/mL | 0.05–6.3 ng/mL | [48] |
| GCMS | Beef | Glutamine, Adenosine, Hx | - | - | [49] |
| UPLC-MS | Fresh tuna fish | Uracil, Inosine, Hx | - | - | [50] |
| Spectrophotometric | Cattle meat | Adenosine, Inosine, Hx | - | - | [51] |
| HPLC-UV | Umami soup stock | Inosine monophosphate, Guanosine monophosphate, Hypoxanthine, Inosine | - | - | [53] |
| Reverse phase HPLC | Processed chicken meat | Adenine, Guanine, Hx, Xa | - | - | [54] |
| HPLC-VWD | Chinese chicken broth | Adenine, Guanine, Hx, Xa, Uric acid | 0.05–100 mg/L | 0.66 µg/L 0.64 µg/L 0.58 µg/L 1.14 µg/L 1.71 µg/L | [55] |
| HPLC-UV | Shiitake mushroom | Guanine, Adenine, Hx, Xa | - | - | [56] |
| CZE | Yeast (Saccharomyces cerevisiae) | Adenine | 1–20 mg/L | 1.11 μg/L | [57] |
| CZE-UV | Beer | Hx, Xa, Adenine, Thymine | 0.4–40 mg/L | 0.1 mg/L 0.1 mg/L 0.1 mg/L 0.3 mg/L | [58] |
| CE-UV | Soybean milk | Adenine, Guanine, Xa, Hx | 0.5 to 100 mg/mL | 0.08 μg/mL 0.06 μg/mL 0.09 μg/mL 0.05 μg/mL | [59] |
| Analysis Method | Sample | Analyte | Linear Range | LOD | Reference |
|---|---|---|---|---|---|
| Conventional | |||||
| HPLC-DAD | Cow milk | Allantoin, Uric acid, Xa, Hx | 3.125–100 µg/mL | 0.74 µg/mL 0.16 µg/mL 0.09 µg/mL 0.14 µg/mL | [16] |
| Au-PEDOT-fMWCNT/GCE | Fish meat | UA Xa Hx | 0.1–800 μM 0.05–175 μM 0.1–150 μM | 199.3 nM 24.1 nM 90.5 nM | [20] |
| HPLC-UV | Marine fish | Adenine, Guanine, Hx, Xa | 0.1–300 mg/L | 0.0774 mg/L 0.0178 mg/L 0.0118 mg/L 0.0555 mg/L | [40] |
| HPLC-UV | Raw anchovies | Adenine, Guanine, Hx, Xa | - | - | [44] |
| HPLC-UV | Fish, shellfish, clam | Adenine, Guanine, Hx, Xa | 0.05–300 mg/L | 0.02 mg/L 0.03 mg/L 0.06 mg/L 0.10 mg/L | [45] |
| UHPLC-MS | Serum | 23 of purine derivatives | 0.002–11.2 μg/mL | 0.05–6.3 ng/mL | [48] |
| HPLC-VWD | Chinese chicken broth | Adenine, Guanine, Hx, Xa, Uric acid | 0.05–100 mg/L | 0.66 µg/L 0.64 µg/L 0.58 µg/L 1.14 µg/L 1.71 µg/L | [59] |
| Nanotechnology based biosensor | |||||
| Amperometry (XODNPs/Au) | Fish meat | Xa | 0.01–1.0 μM | 0.01 μM | [84] |
| XO/Poly(l-Asp)/MWCNT/GCE electrode | Fish meat | Xa | 0.001–0.004 μM | 3.5 × 10⁻⁴ μM | [96] |
| Fluorescent-NH2-Cu-MOF nanosheet | Fish | Hx | 10–2000 μM | 3.93 μM | [123] |
| CeNPs/XOD/silanized paper | Degraded fish | Hx | 800 μM | 15 μM | [133] |
Disclaimer/Publisher’s Note: The statements, opinions and data contained in all publications are solely those of the individual author(s) and contributor(s) and not of MDPI and/or the editor(s). MDPI and/or the editor(s) disclaim responsibility for any injury to people or property resulting from any ideas, methods, instructions or products referred to in the content. |
© 2023 by the authors. Licensee MDPI, Basel, Switzerland. This article is an open access article distributed under the terms and conditions of the Creative Commons Attribution (CC BY) license (https://creativecommons.org/licenses/by/4.0/).
Share and Cite
Felicia, W.X.L.; Rovina, K.; ‘Aqilah, N.M.N.; Vonnie, J.M.; Yin, K.W.; Huda, N. Assessing Meat Freshness via Nanotechnology Biosensors: Is the World Prepared for Lightning-Fast Pace Methods? Biosensors 2023, 13, 217. https://doi.org/10.3390/bios13020217
Felicia WXL, Rovina K, ‘Aqilah NMN, Vonnie JM, Yin KW, Huda N. Assessing Meat Freshness via Nanotechnology Biosensors: Is the World Prepared for Lightning-Fast Pace Methods? Biosensors. 2023; 13(2):217. https://doi.org/10.3390/bios13020217
Chicago/Turabian StyleFelicia, Wen Xia Ling, Kobun Rovina, Nasir Md Nur ‘Aqilah, Joseph Merillyn Vonnie, Koh Wee Yin, and Nurul Huda. 2023. "Assessing Meat Freshness via Nanotechnology Biosensors: Is the World Prepared for Lightning-Fast Pace Methods?" Biosensors 13, no. 2: 217. https://doi.org/10.3390/bios13020217