Textile Knitted Stretch Sensors for Wearable Health Monitoring: Design and Performance Evaluation

 ,
,  and
and
Abstract
:1. Introduction
- A comprehensive demonstration of knitted stretch sensors with different structures and their performance.
- Investigating a setup showing different stretching percentages of knitted sensors and identifying how knitted loop structure changes the sensor’s sensitivity.
- Study and analysis of the sensor’s durability and chemical stability to quantify sensing materials constraints.
- Demonstration and design recommendations of the knitted sensors in respiration monitoring applications.
2. Materials and Methods
2.1. Machine
2.2. Materials
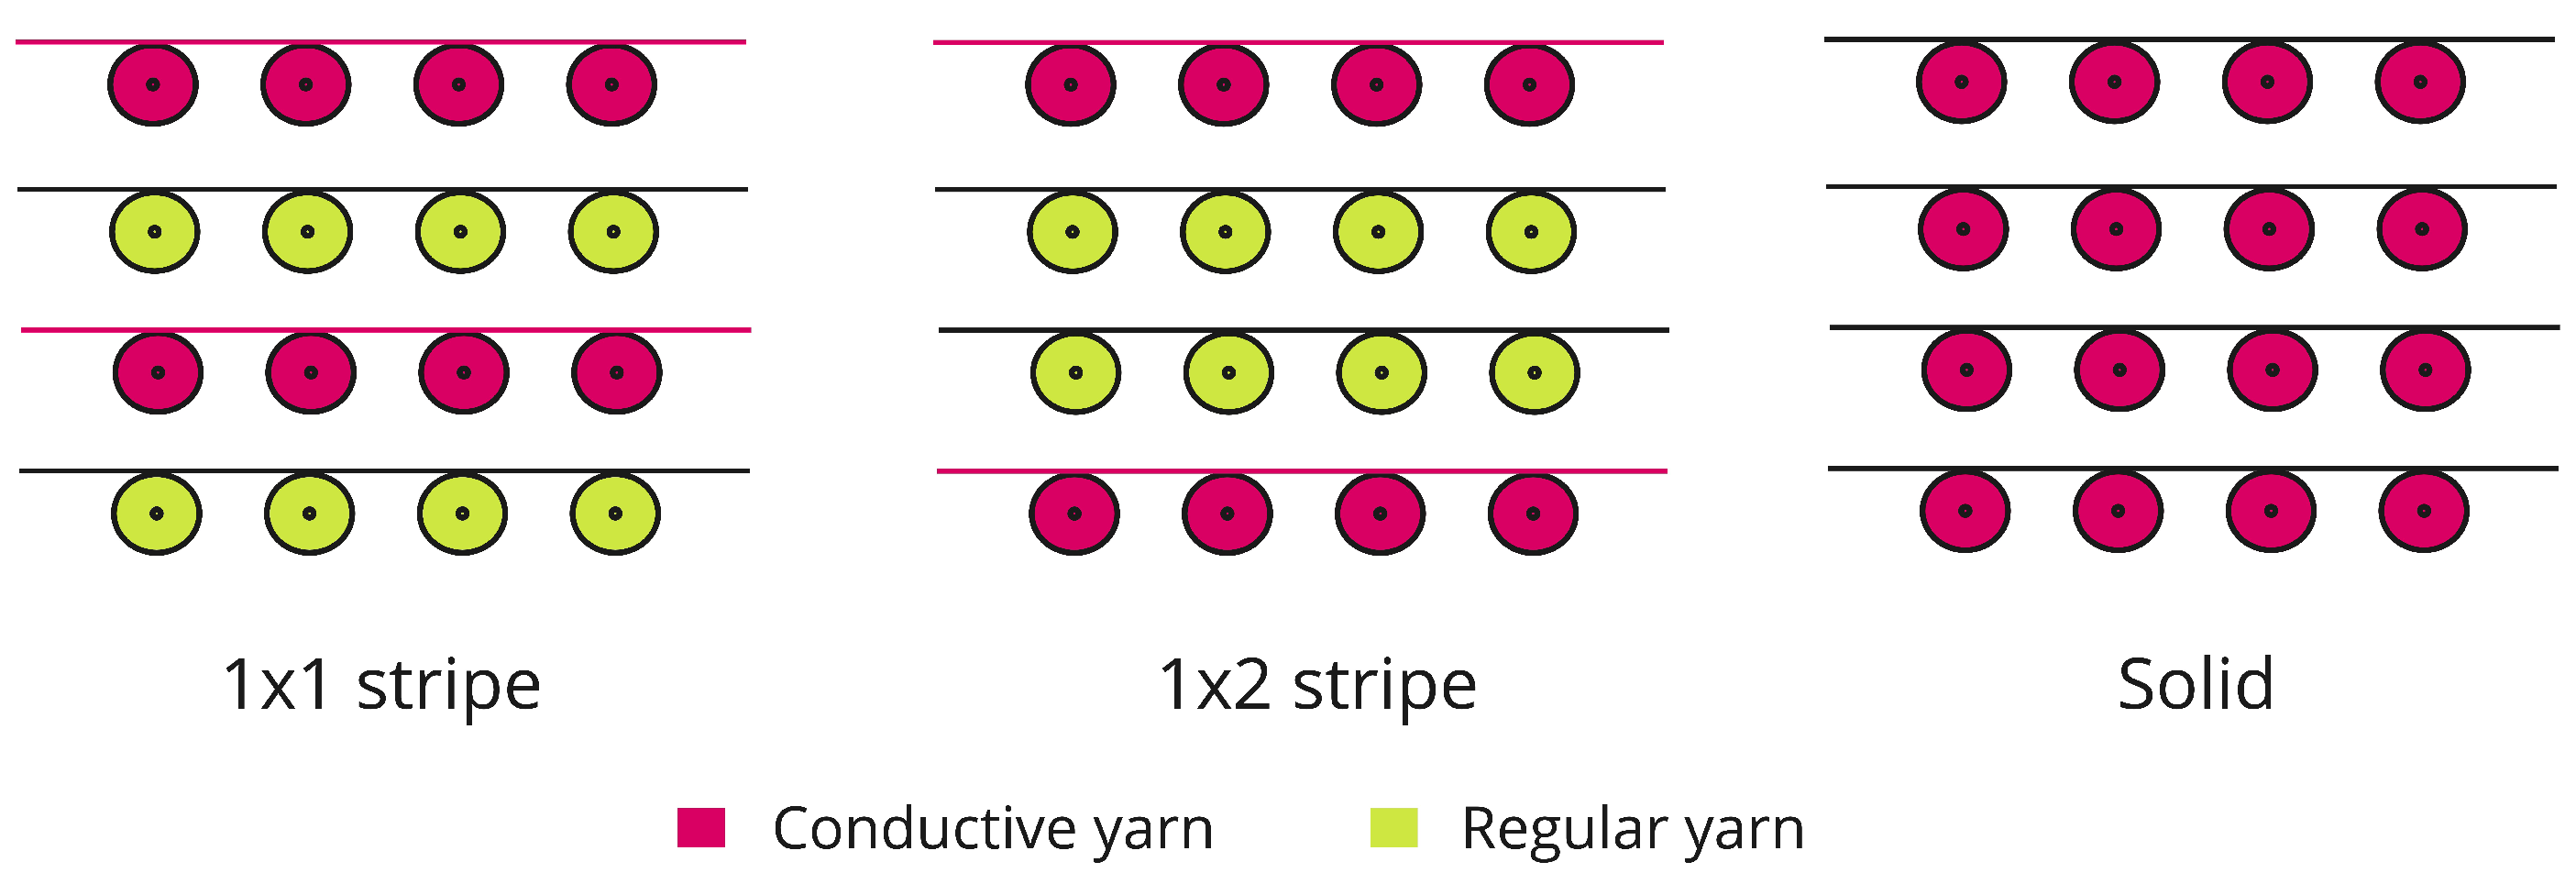
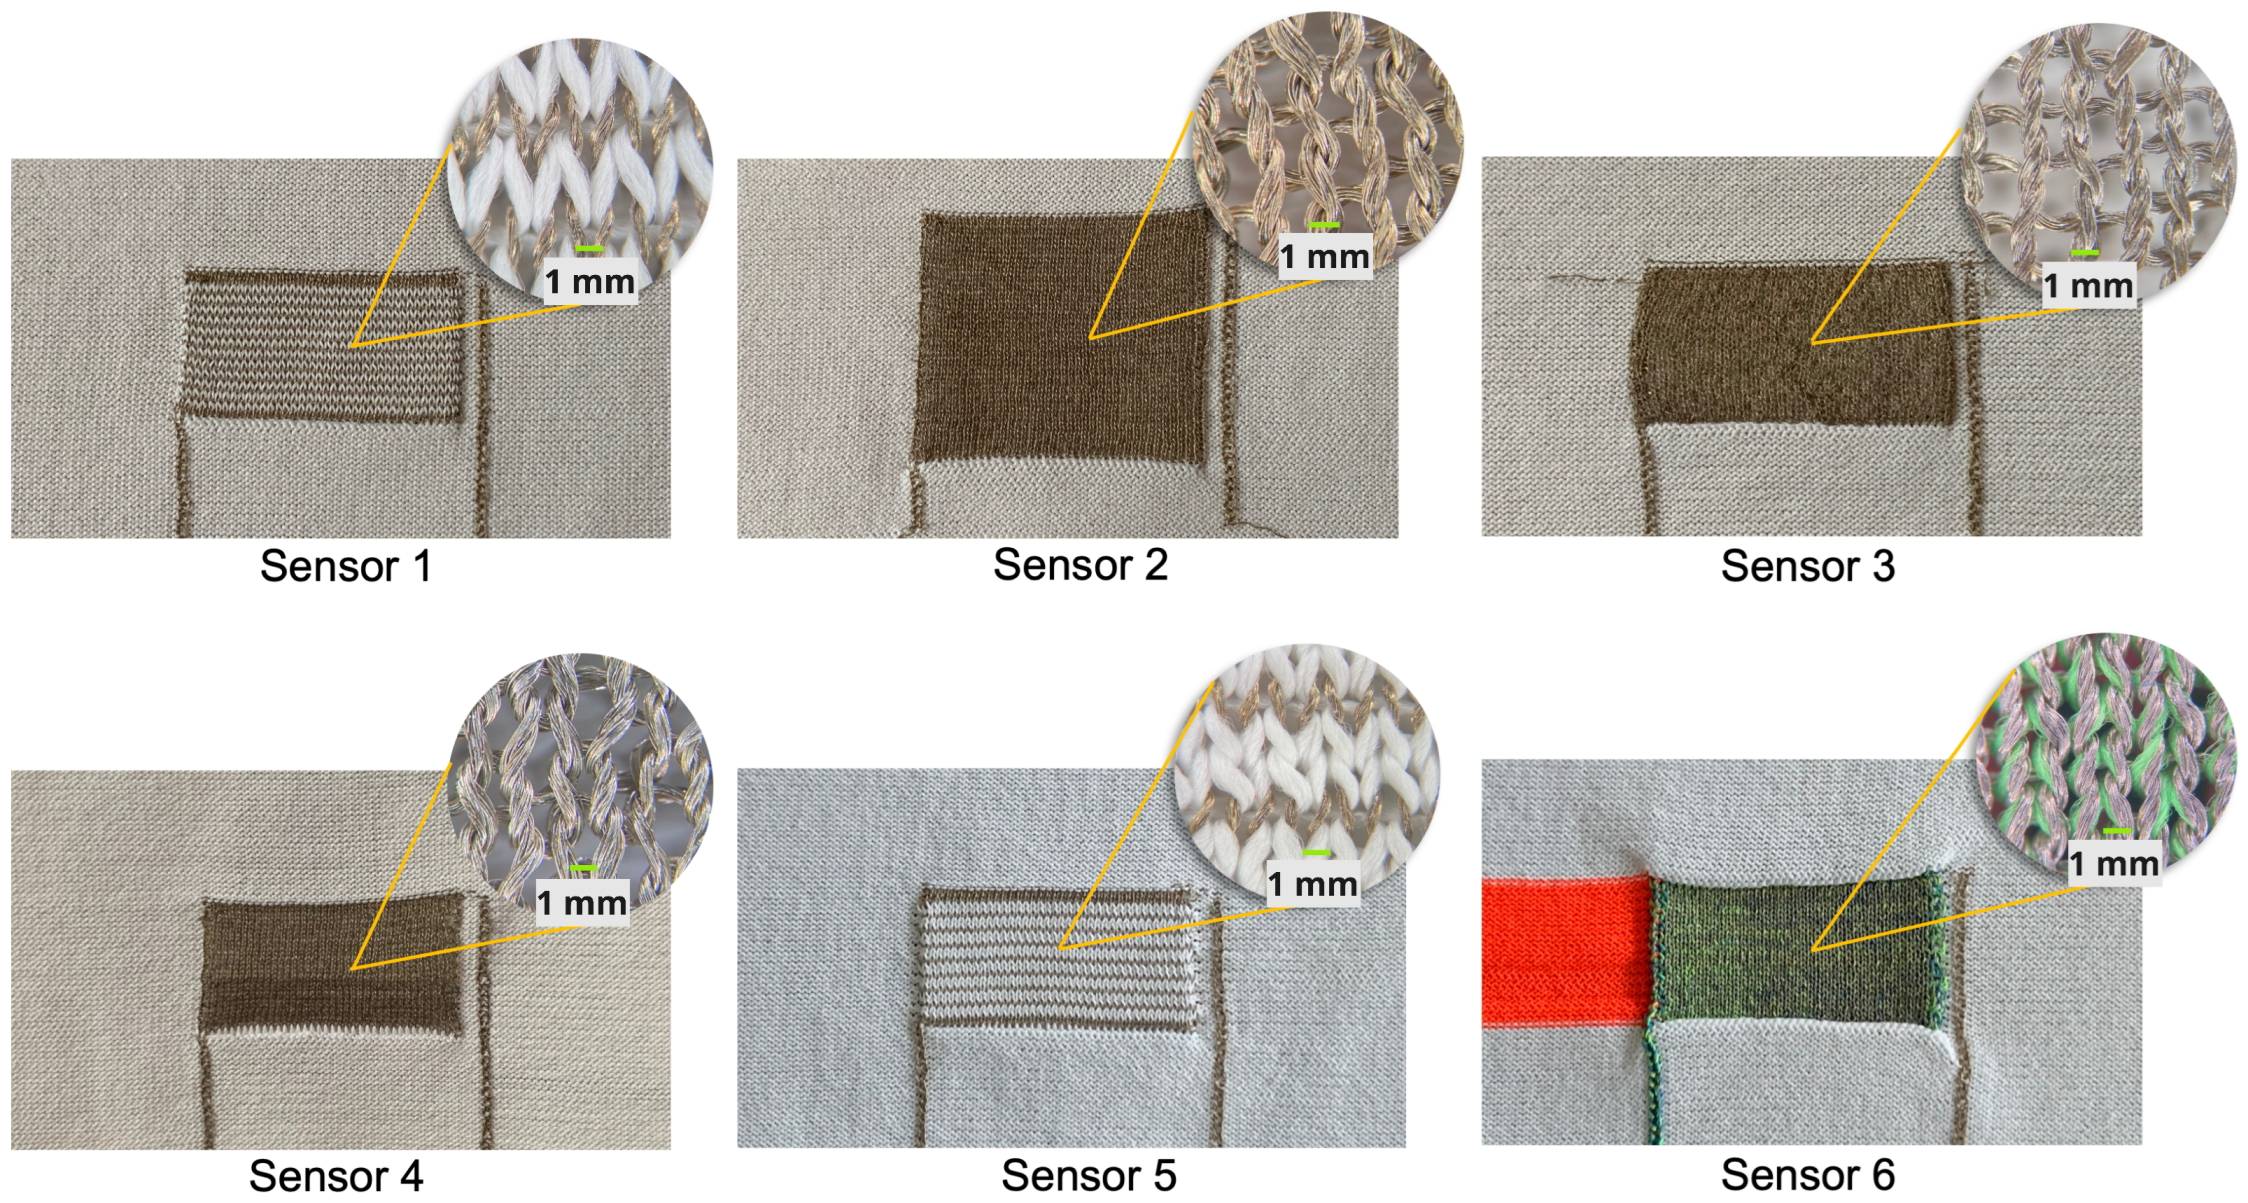
2.3. Design
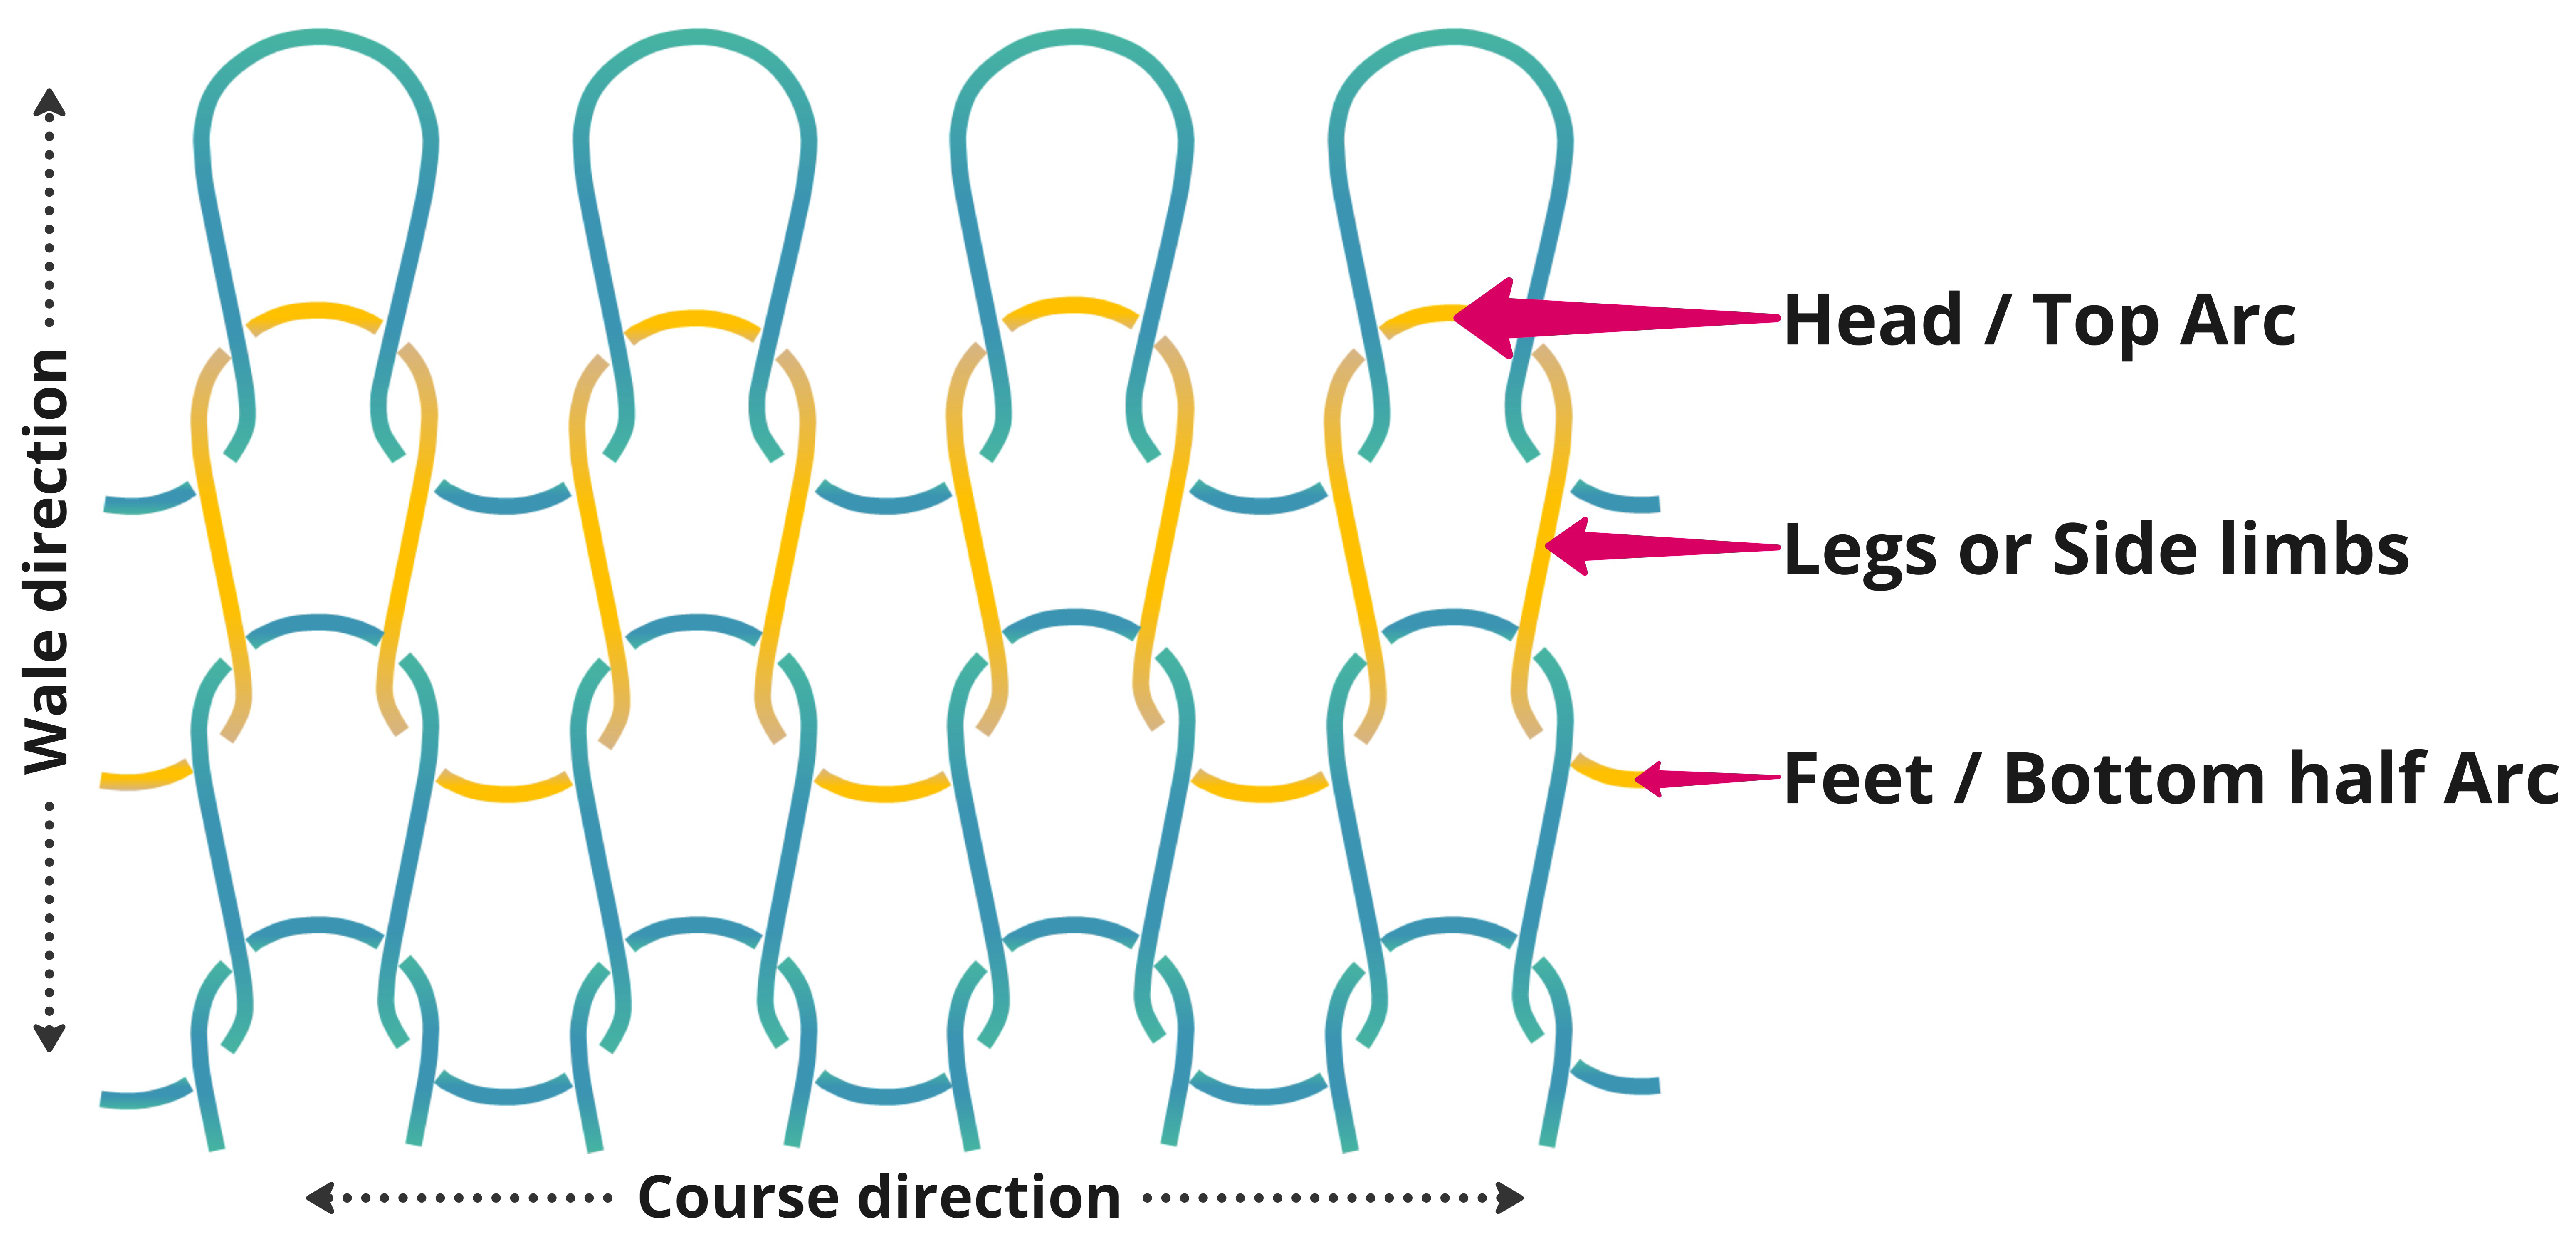
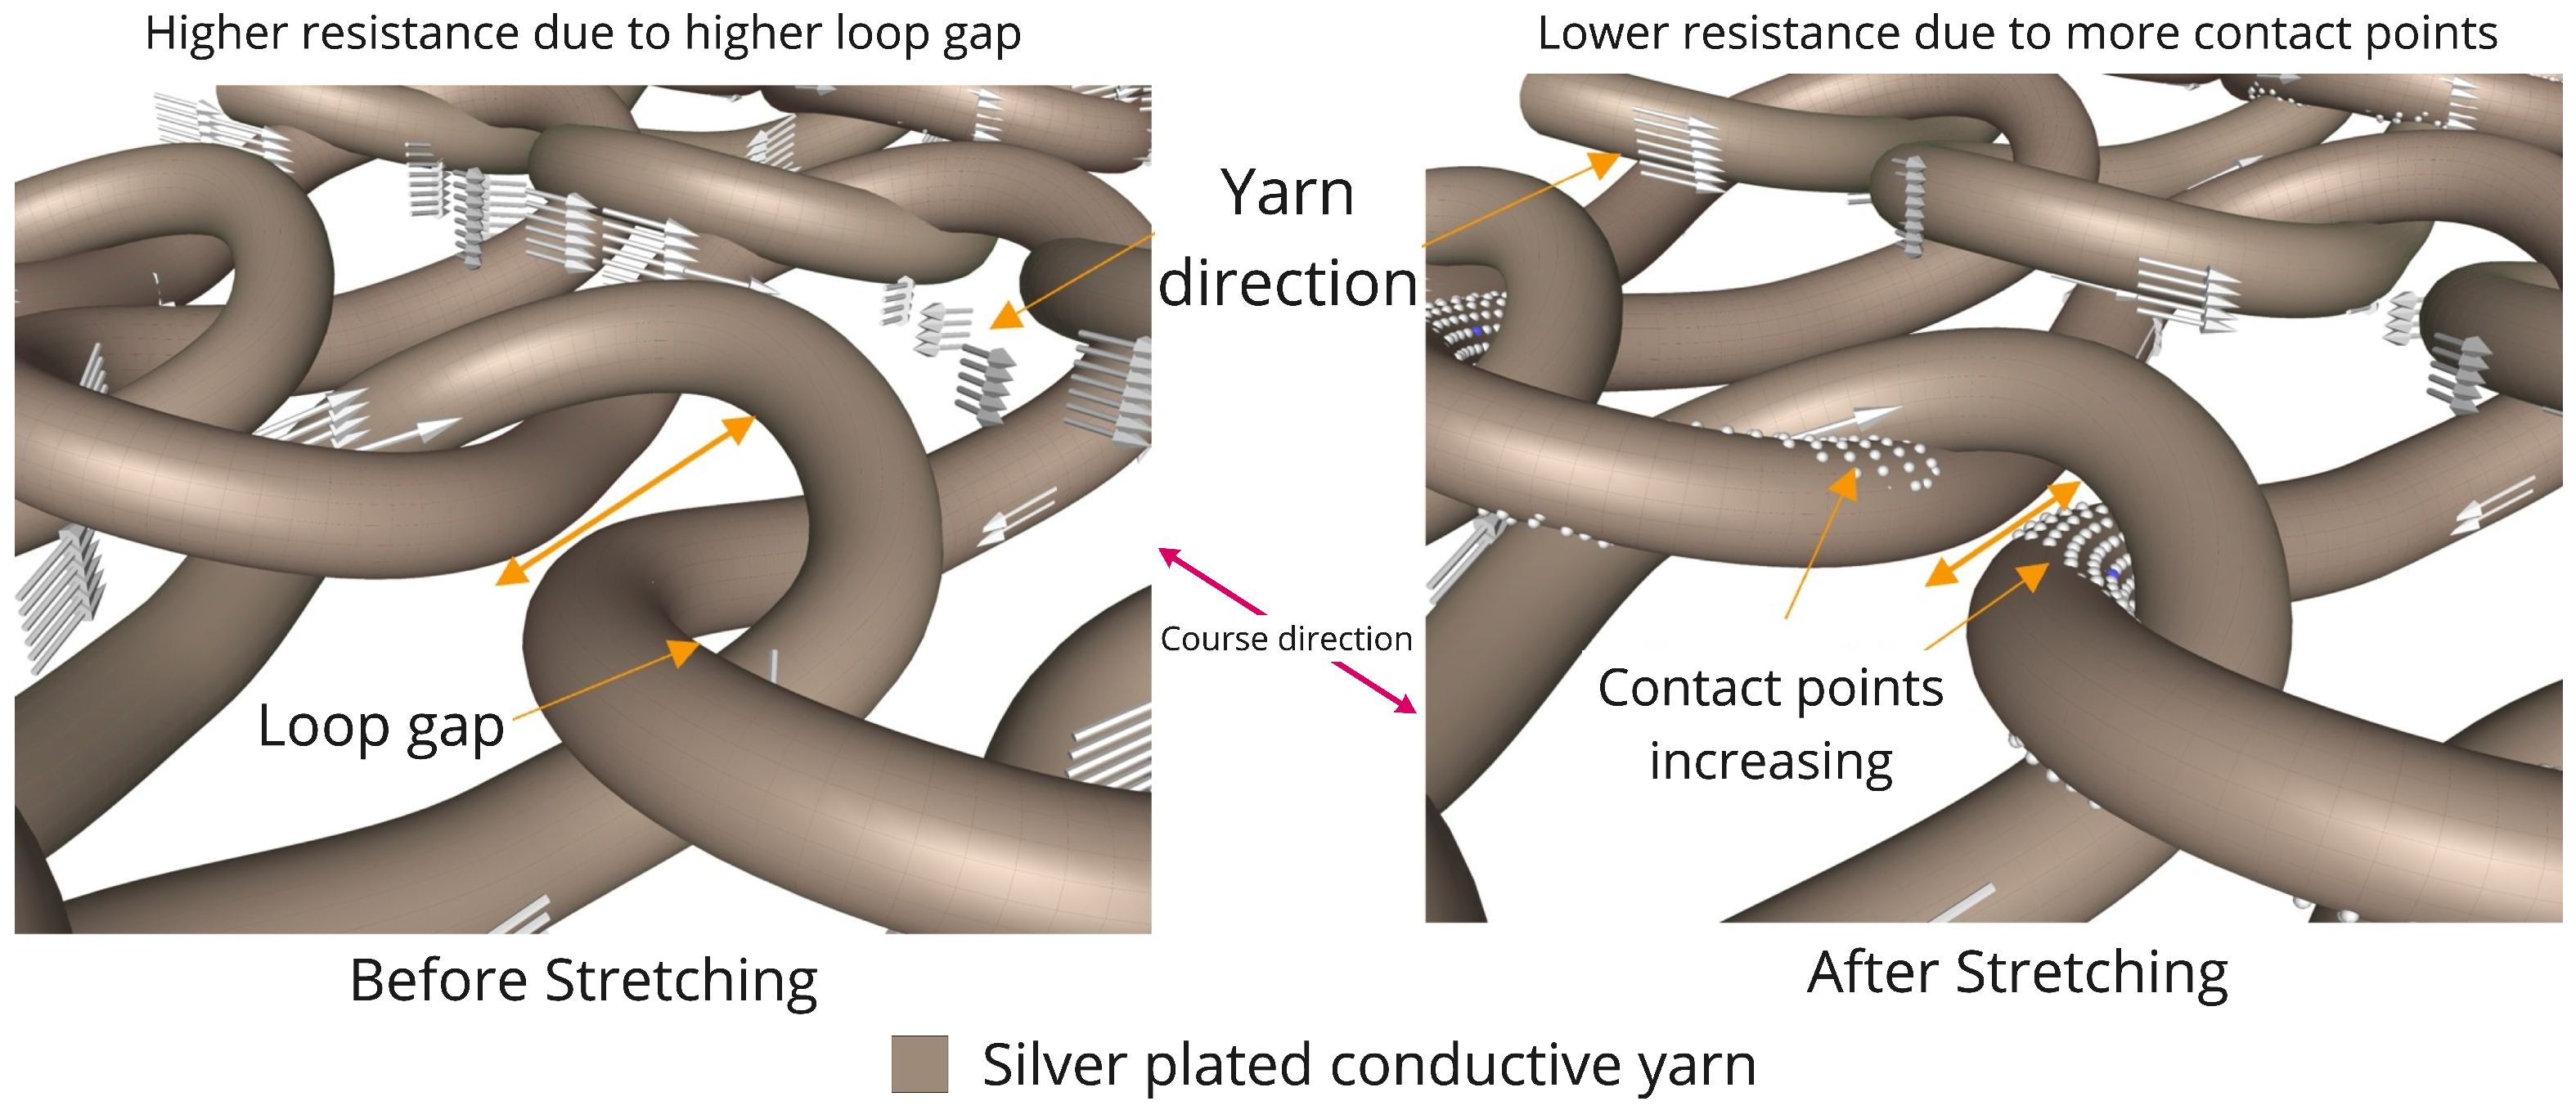
2.4. Sensing Mechanism
3. System and Experimental Design
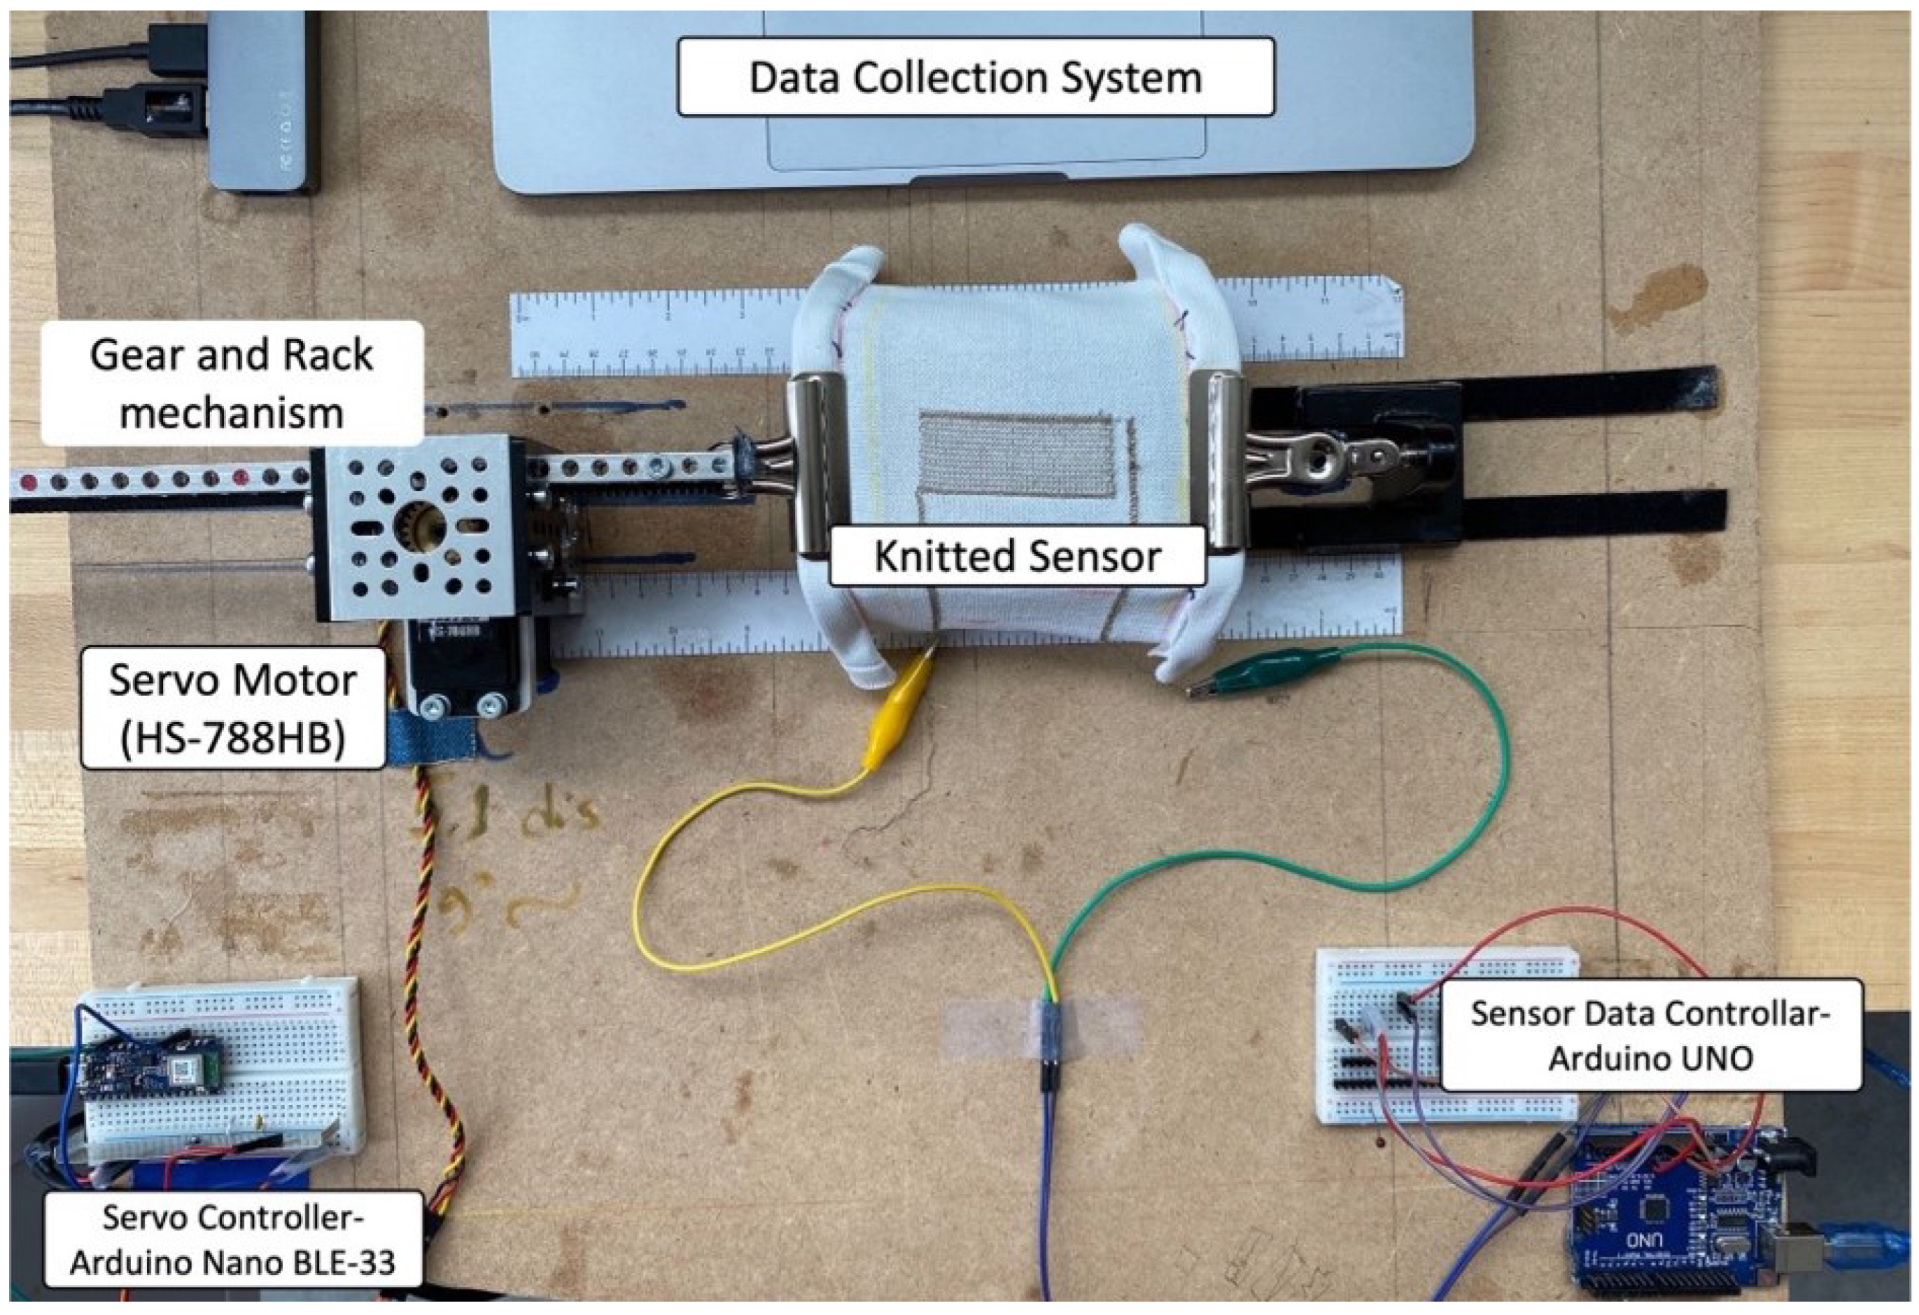
3.1. Electromechanical Test Setup
3.2. Stretching Test
3.3. Durability Test (Cyclic Test)
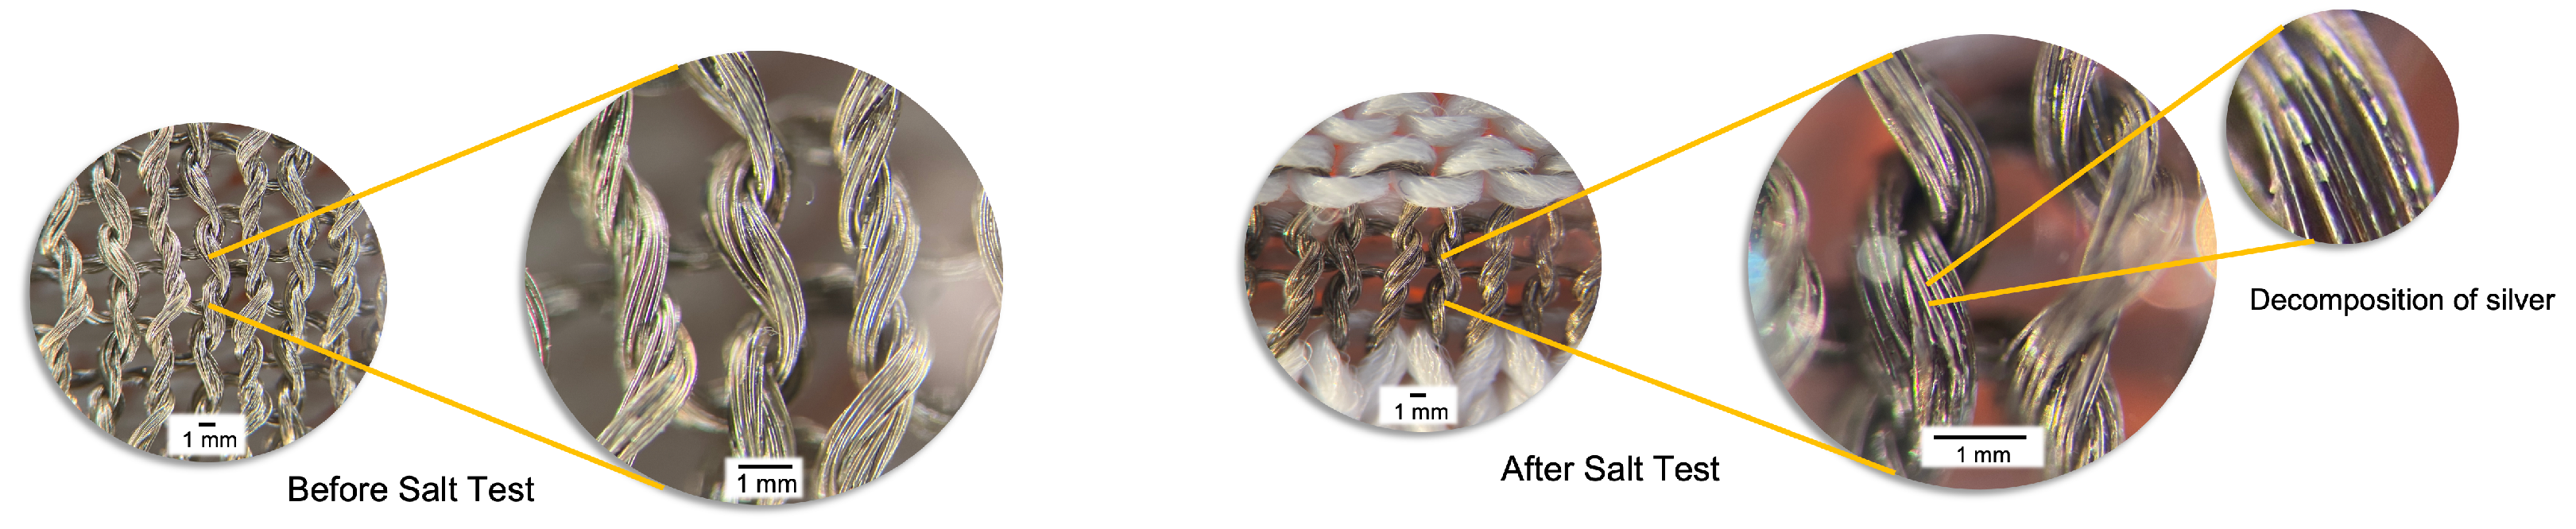
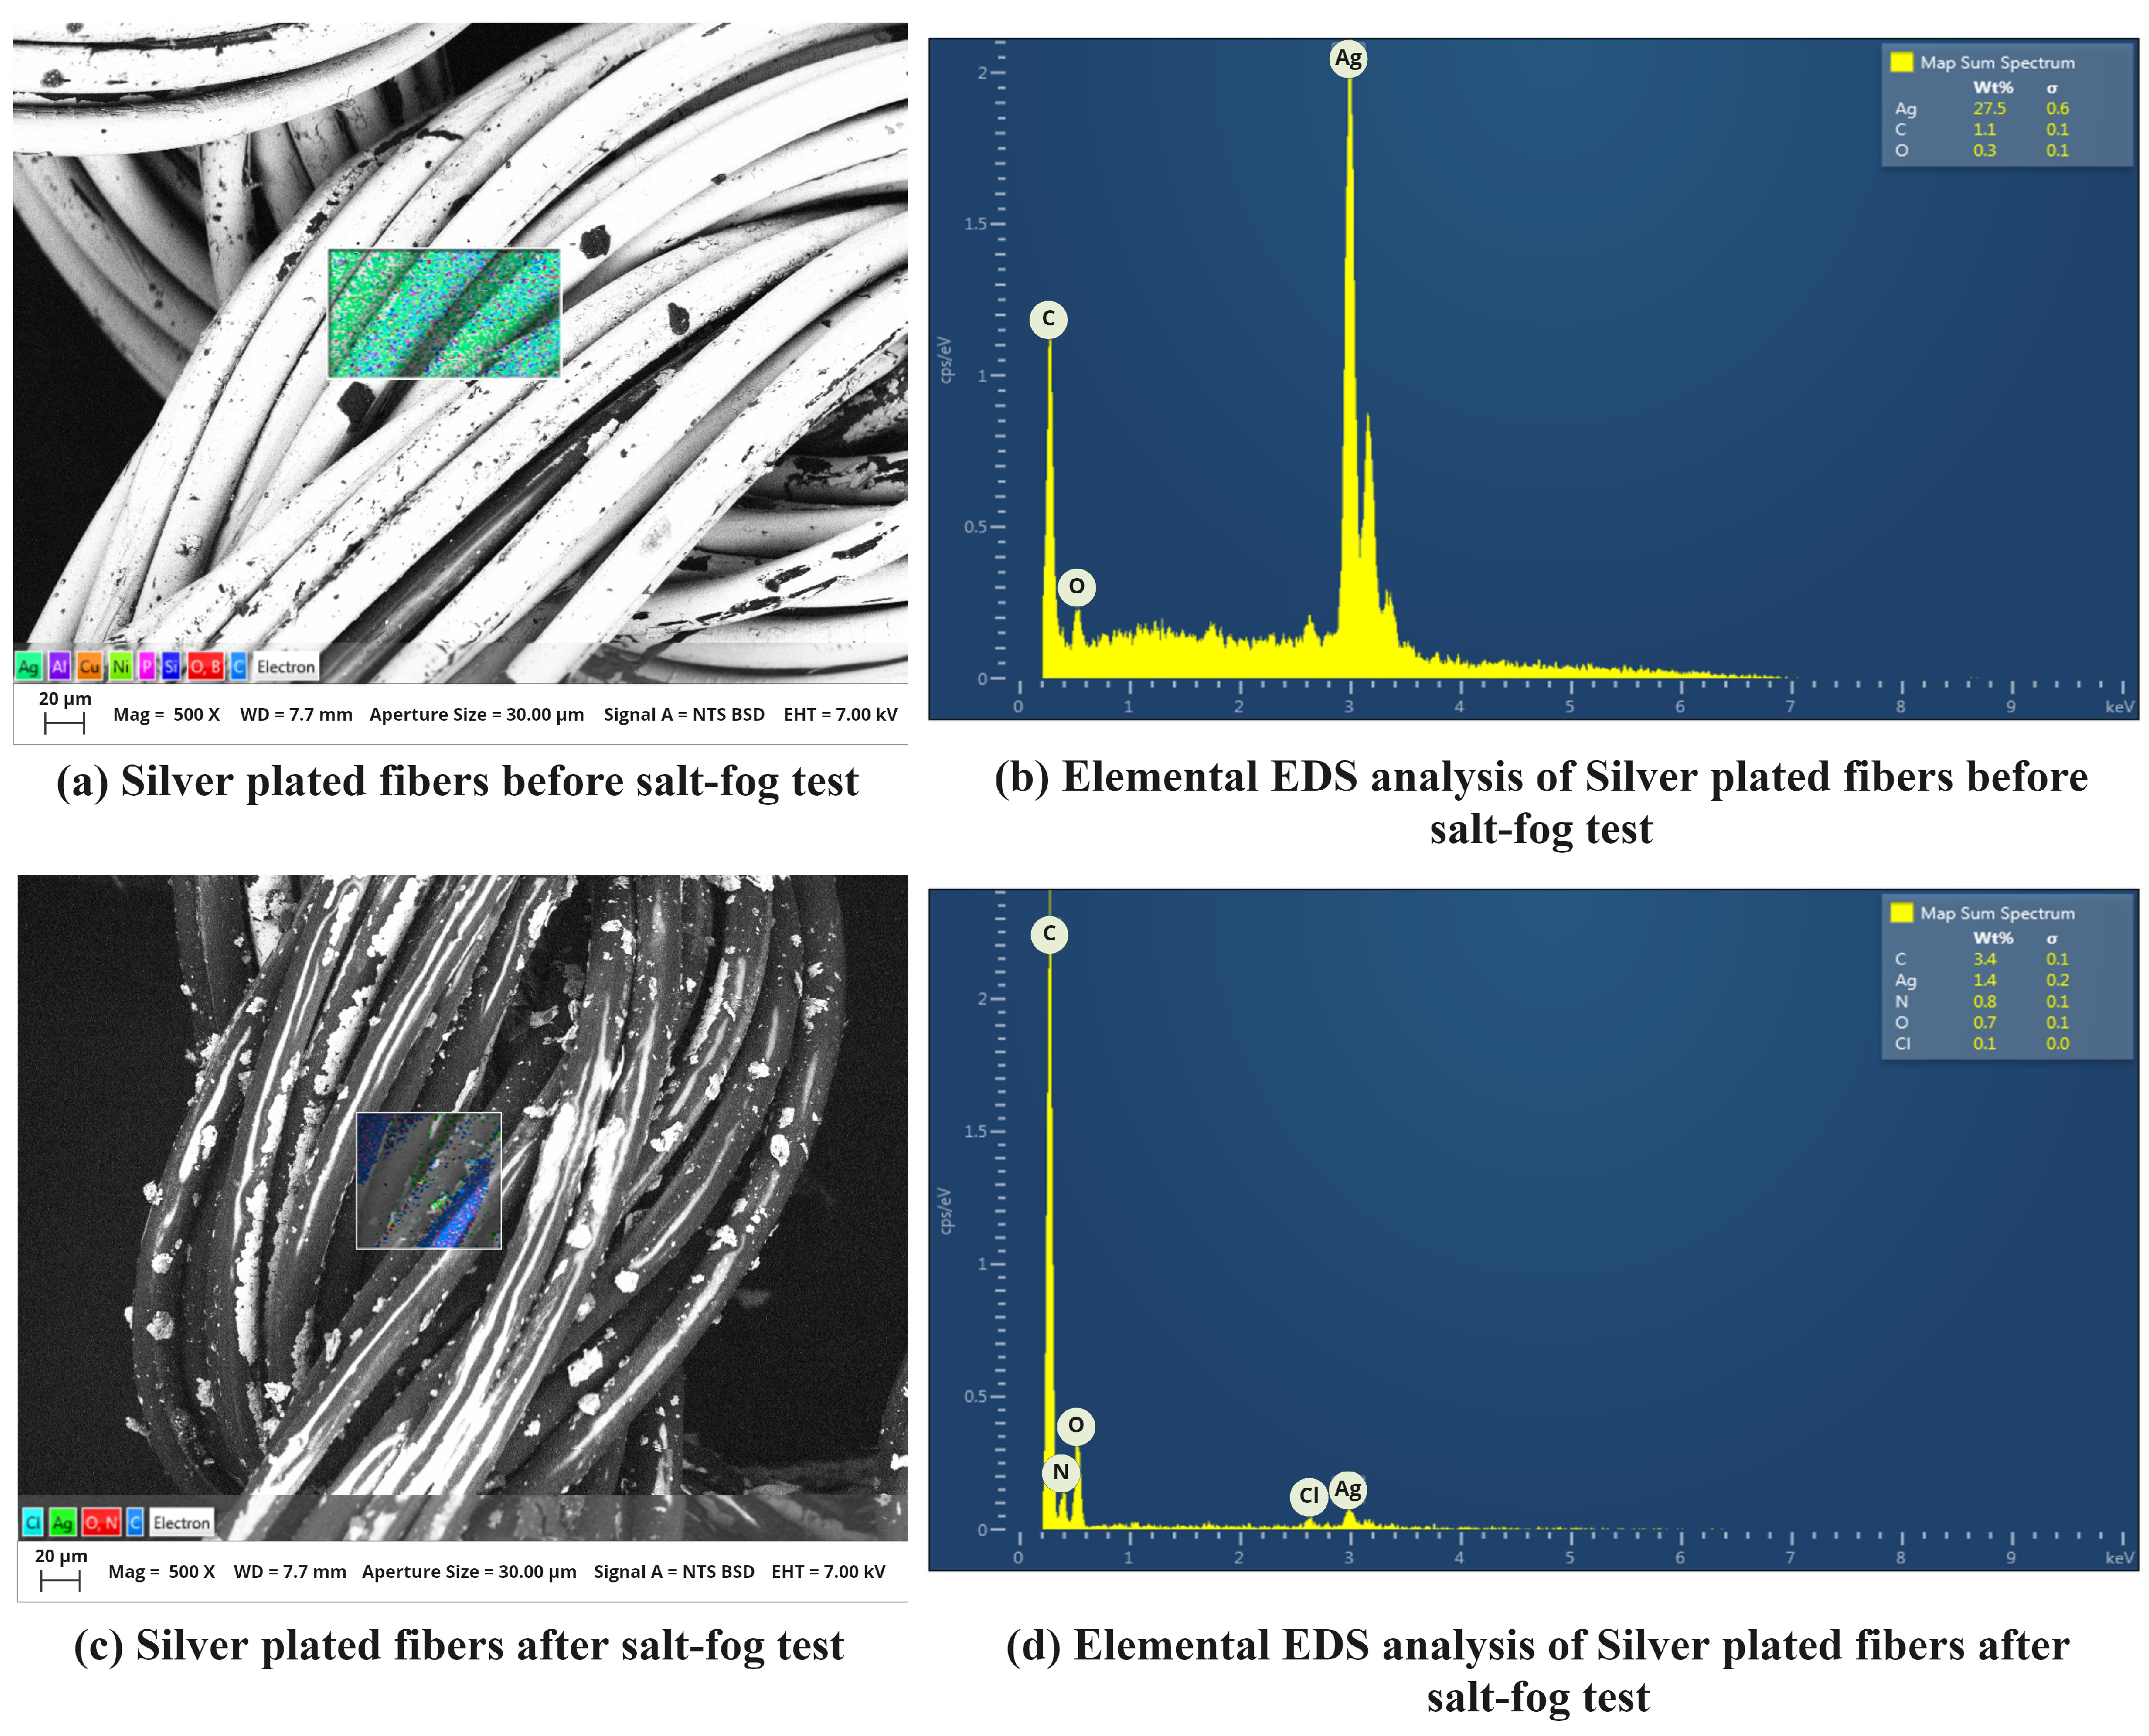
3.4. Salt Fog Test
4. Results and Discussions
4.1. Investigating Effects of Stretching on the Sensor Performance
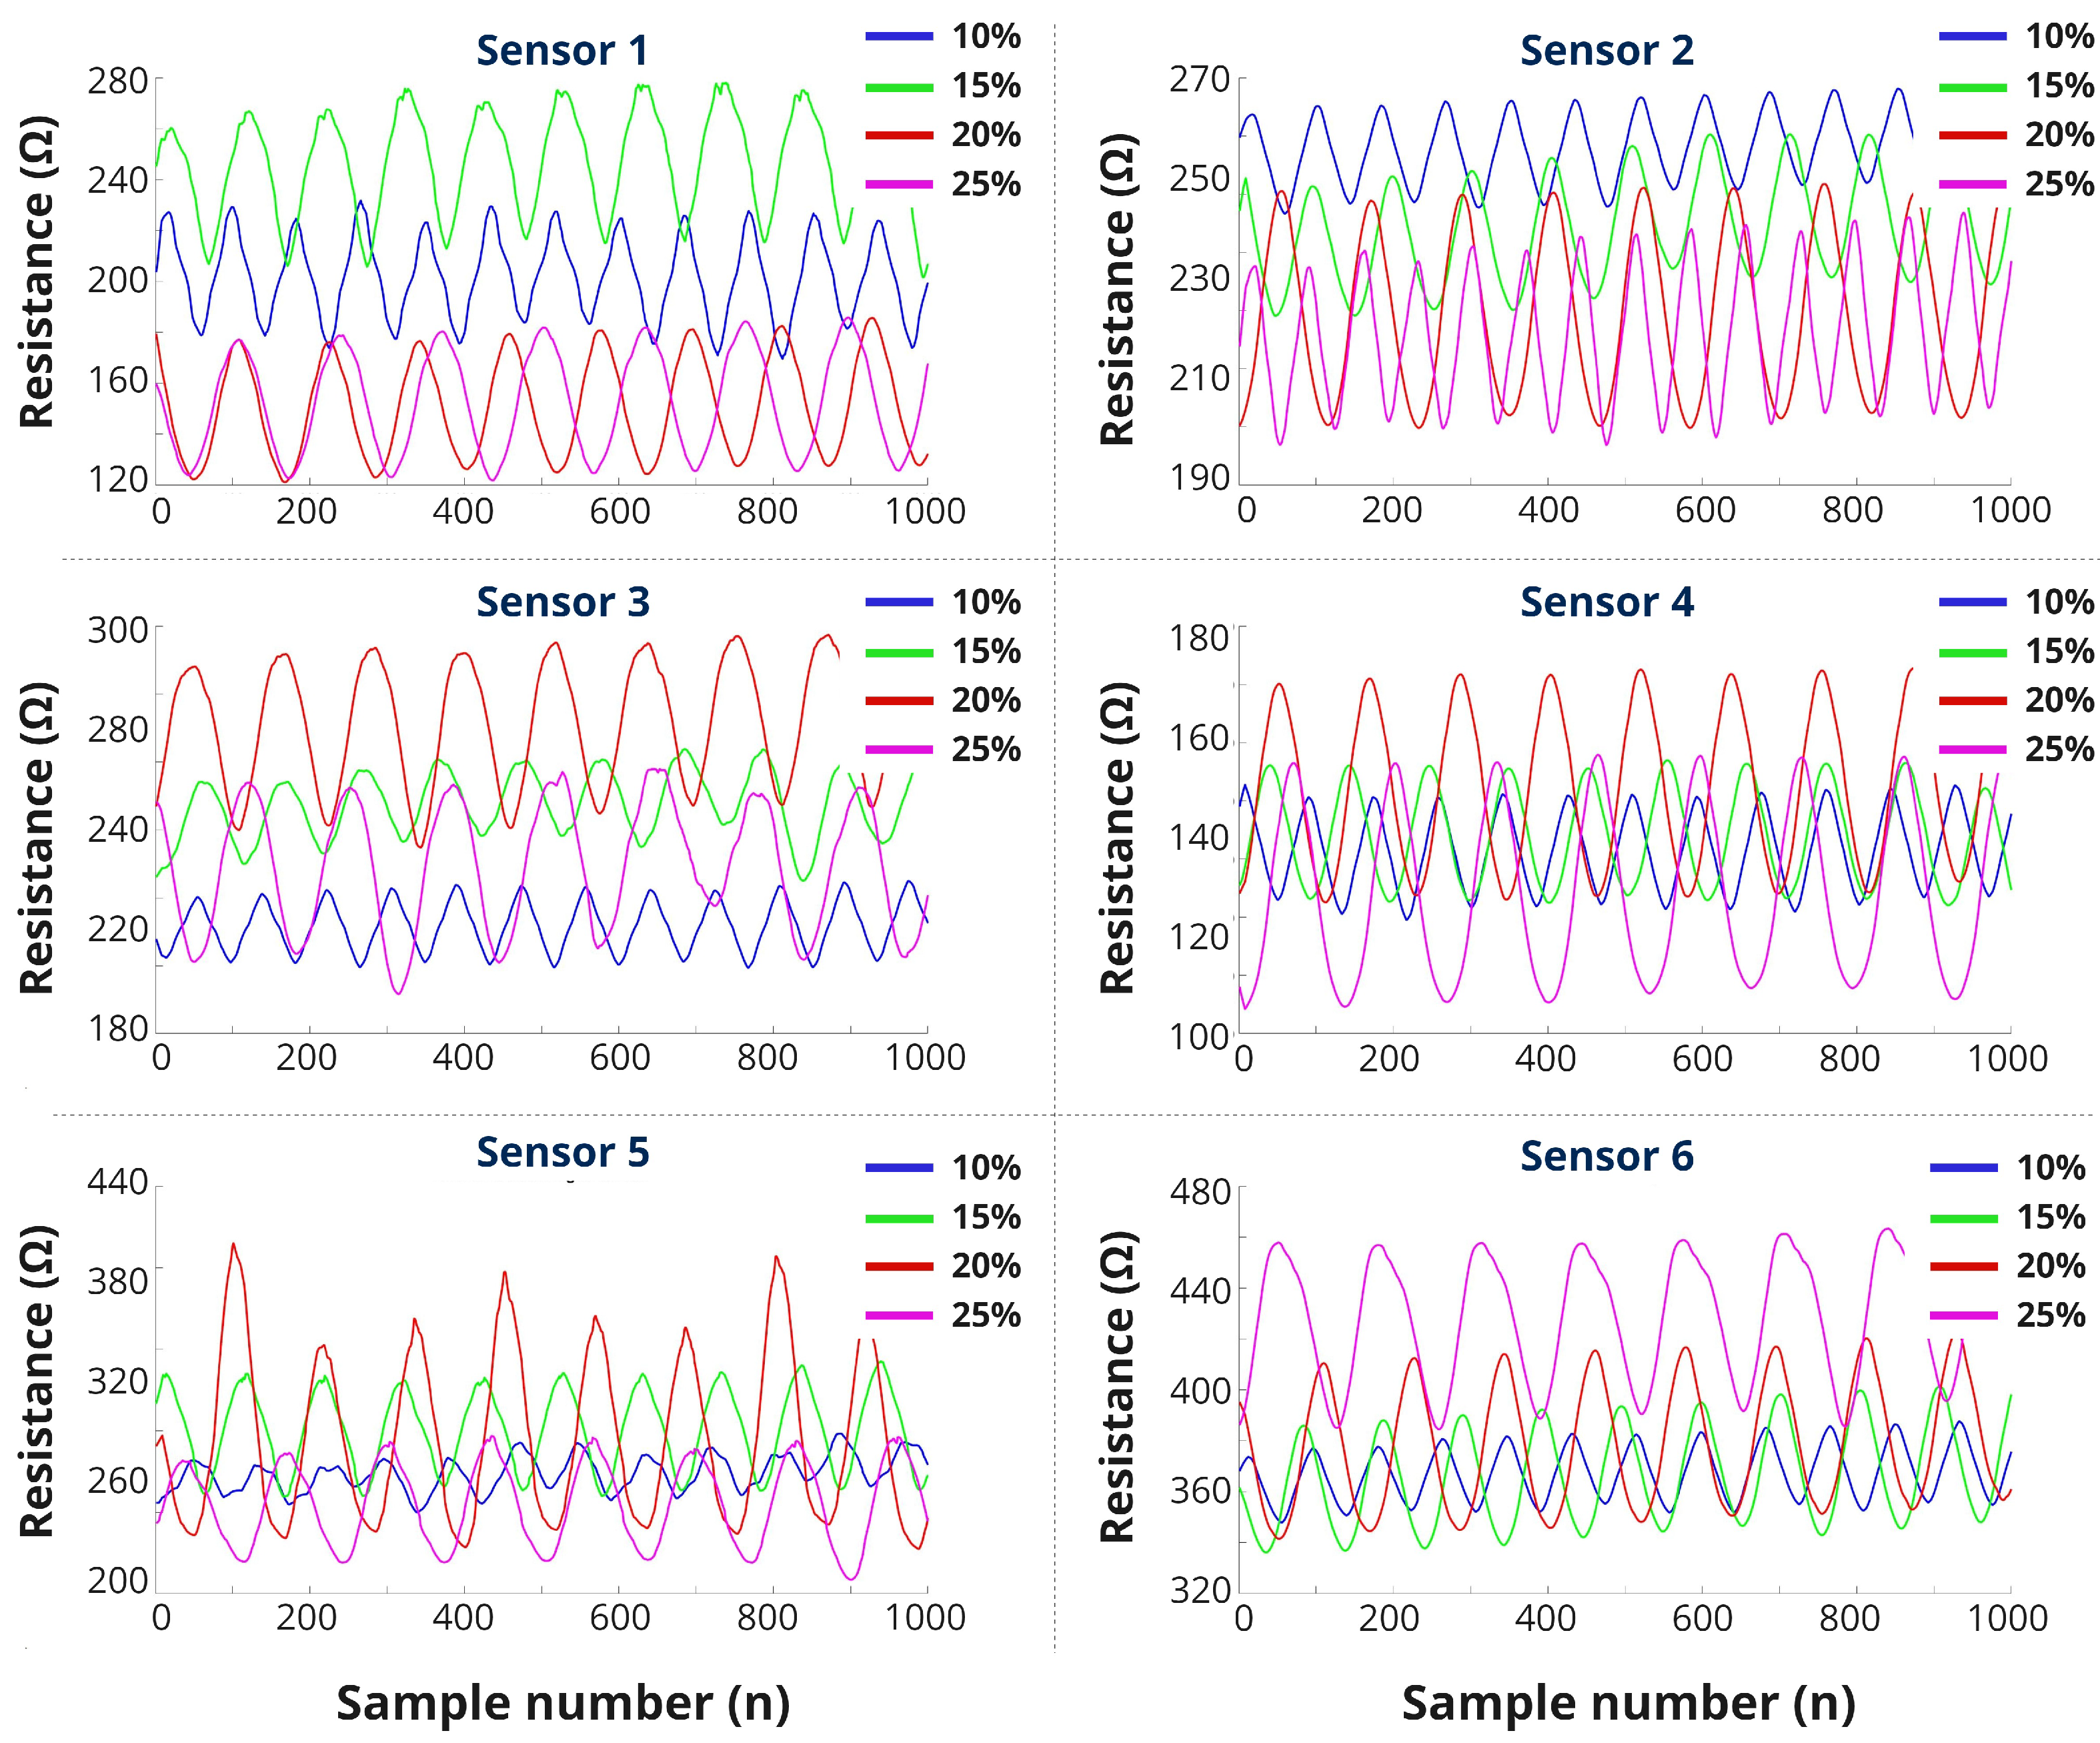
4.1.1. Intermittent Stretching
4.1.2. Continuous Stretching
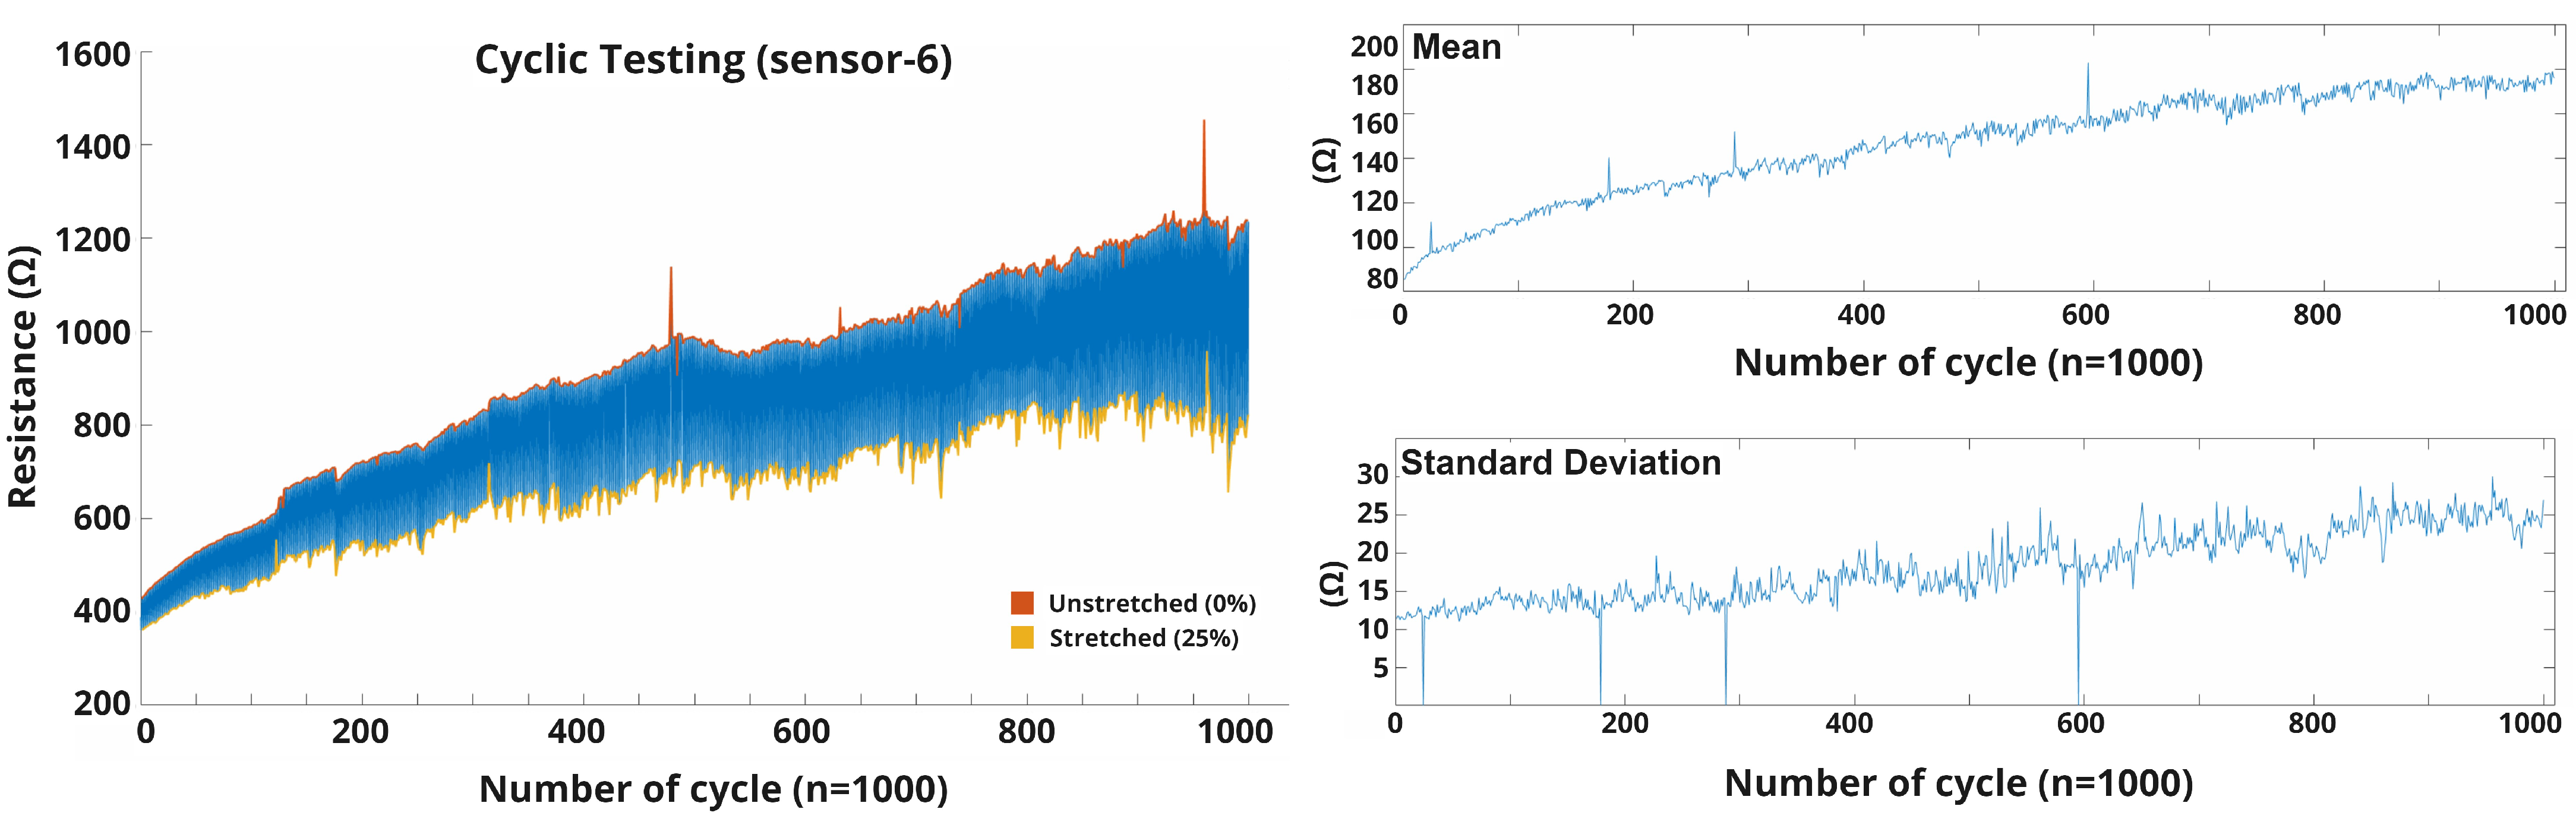
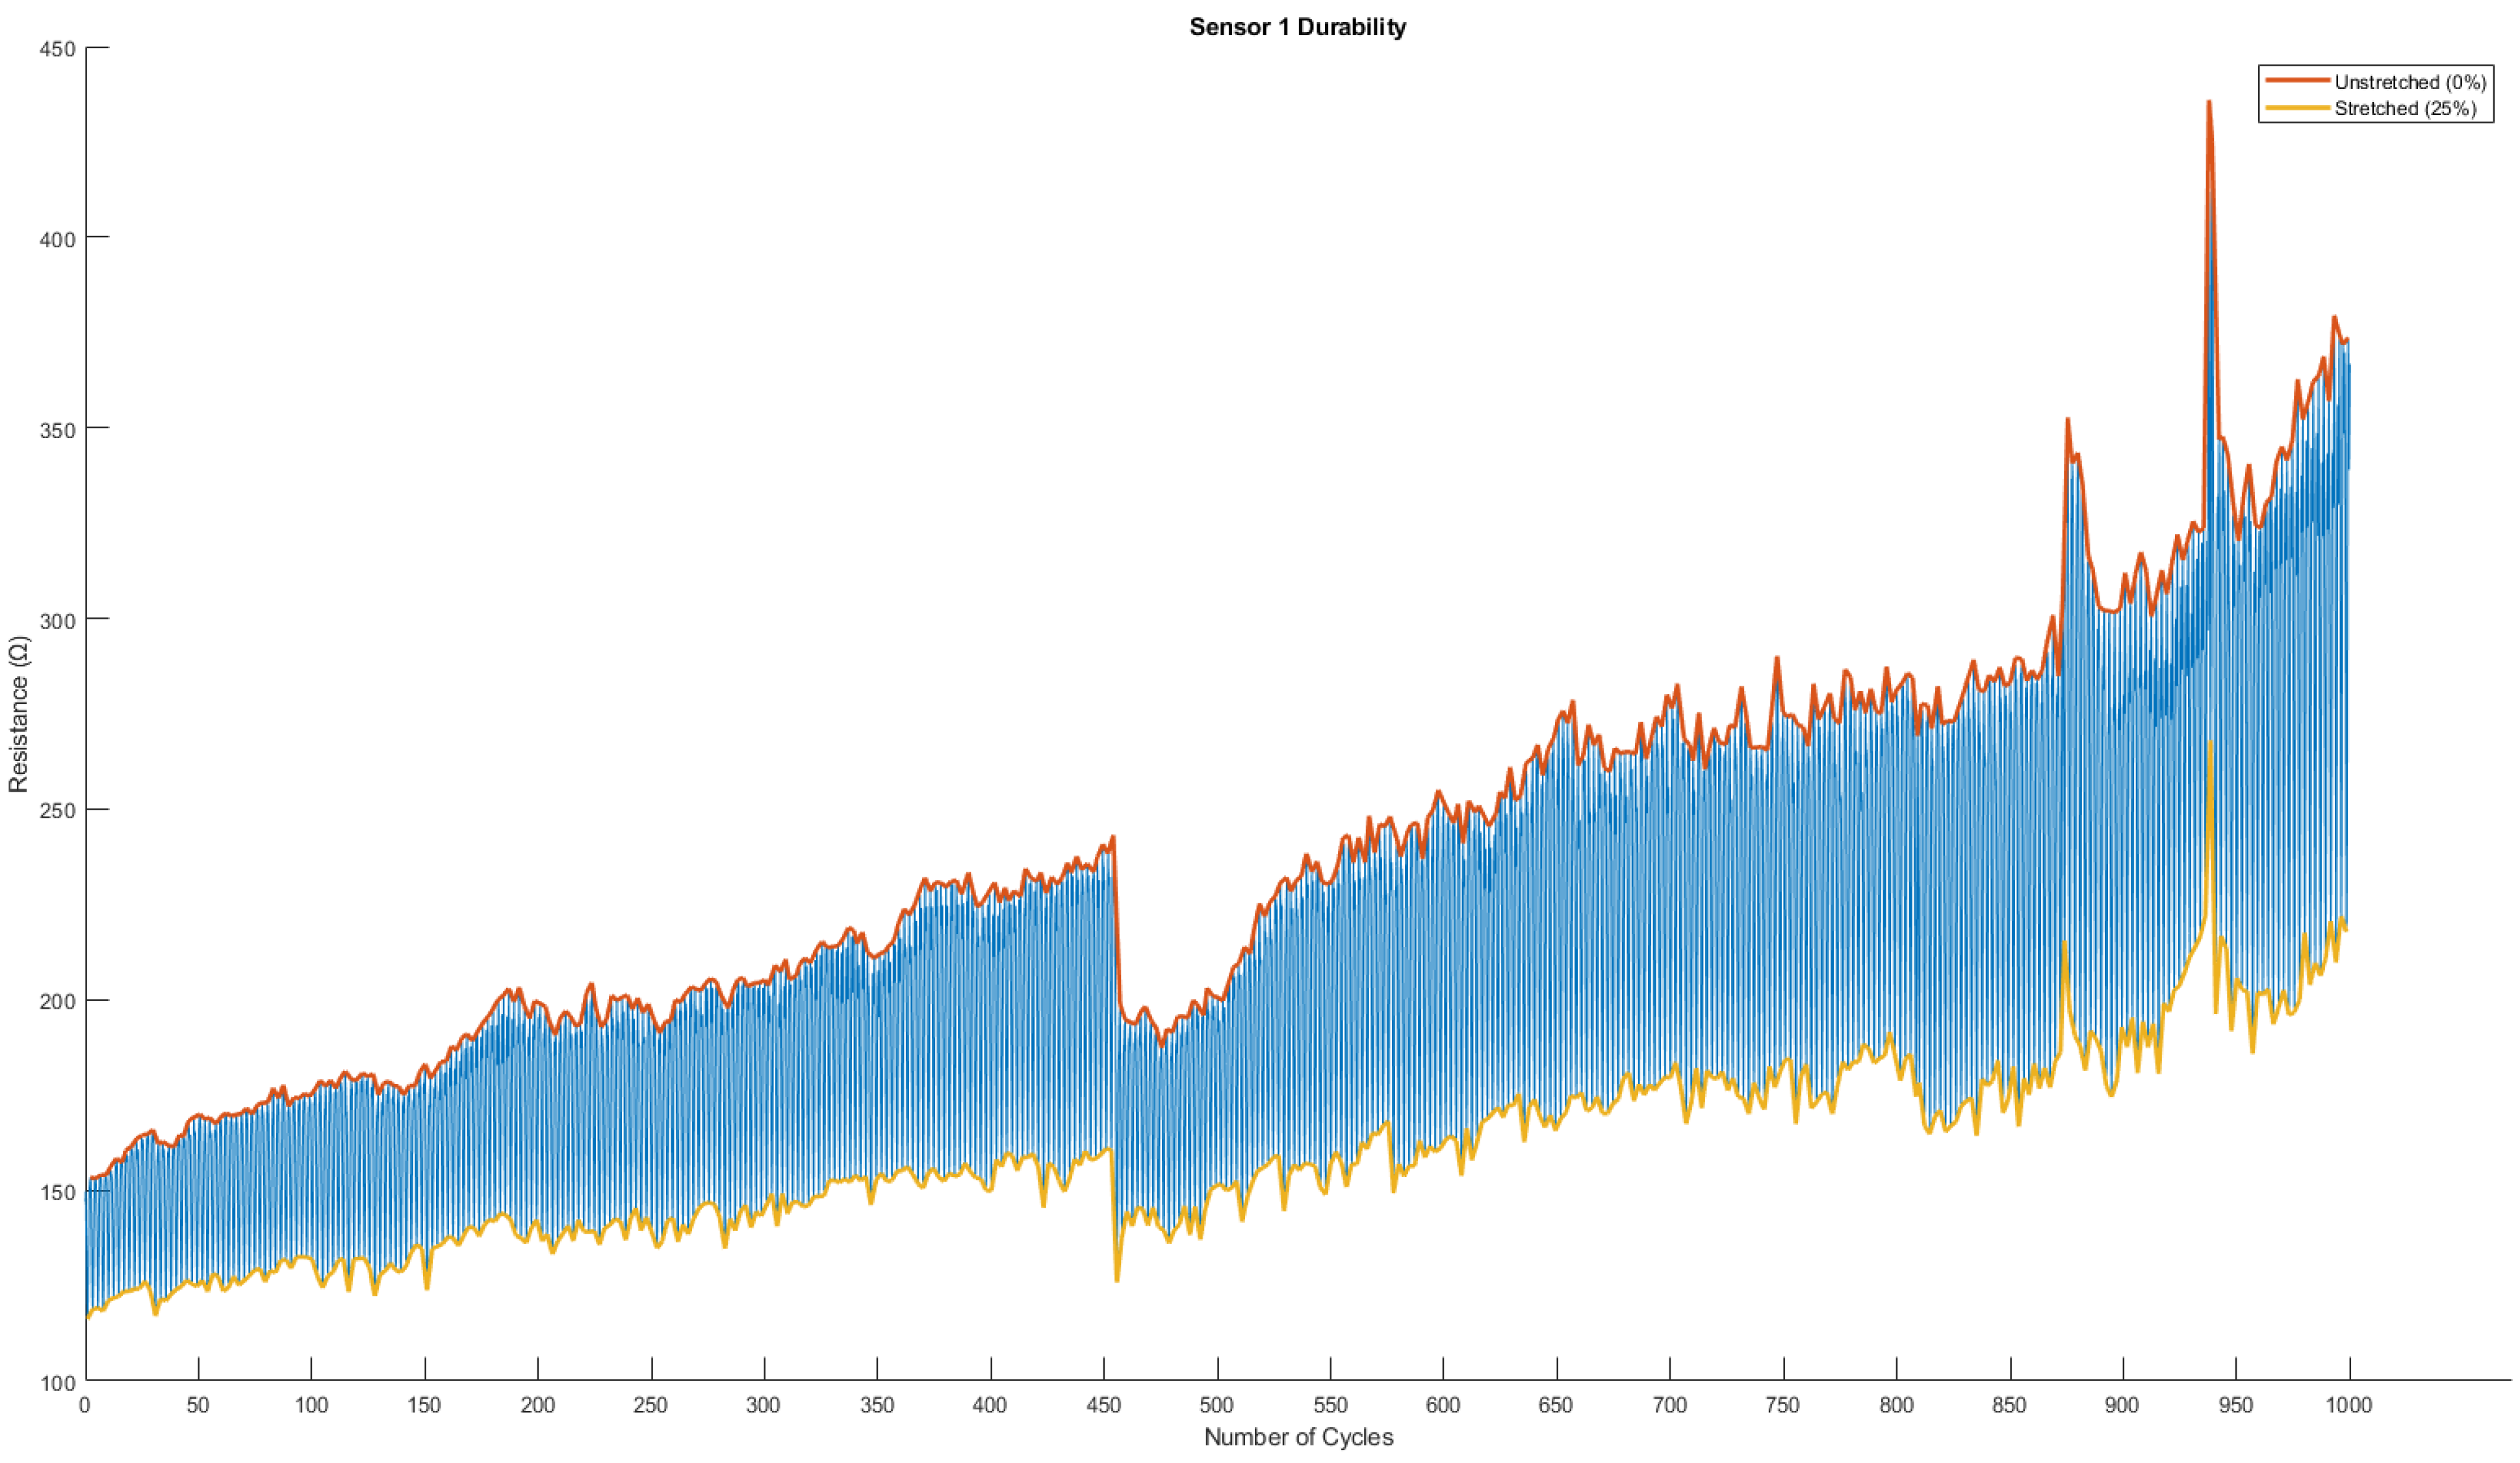
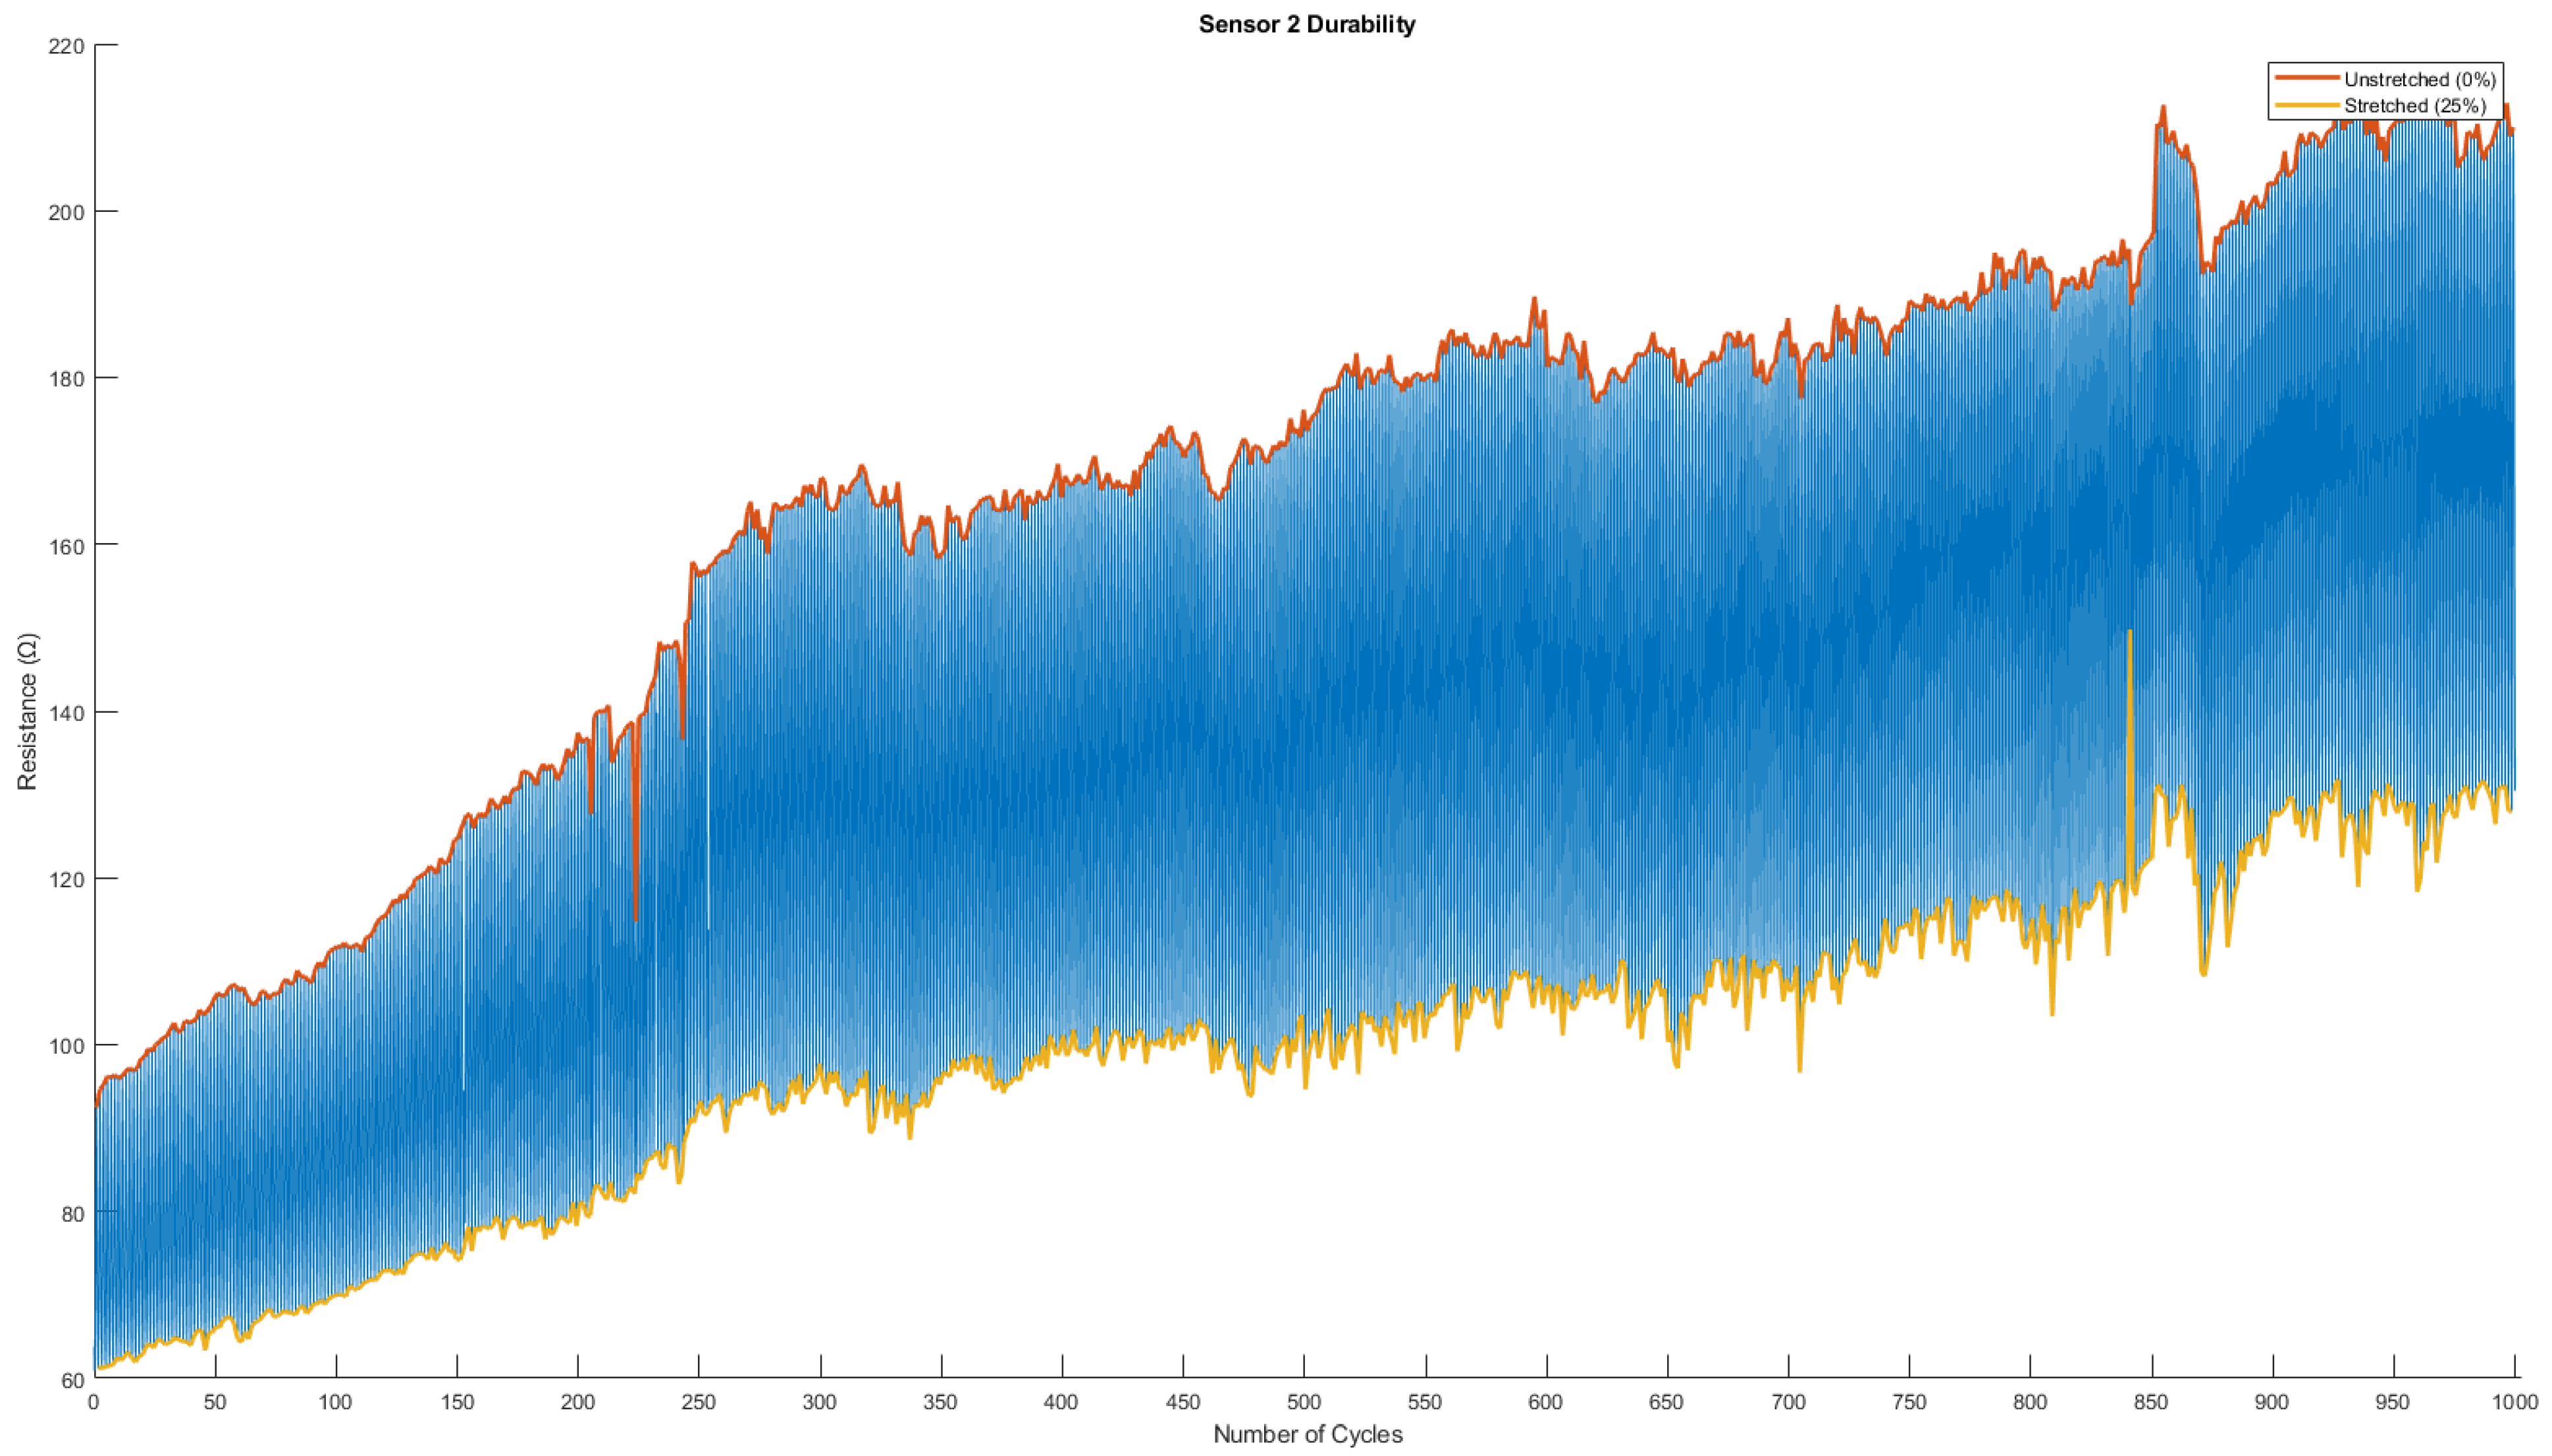
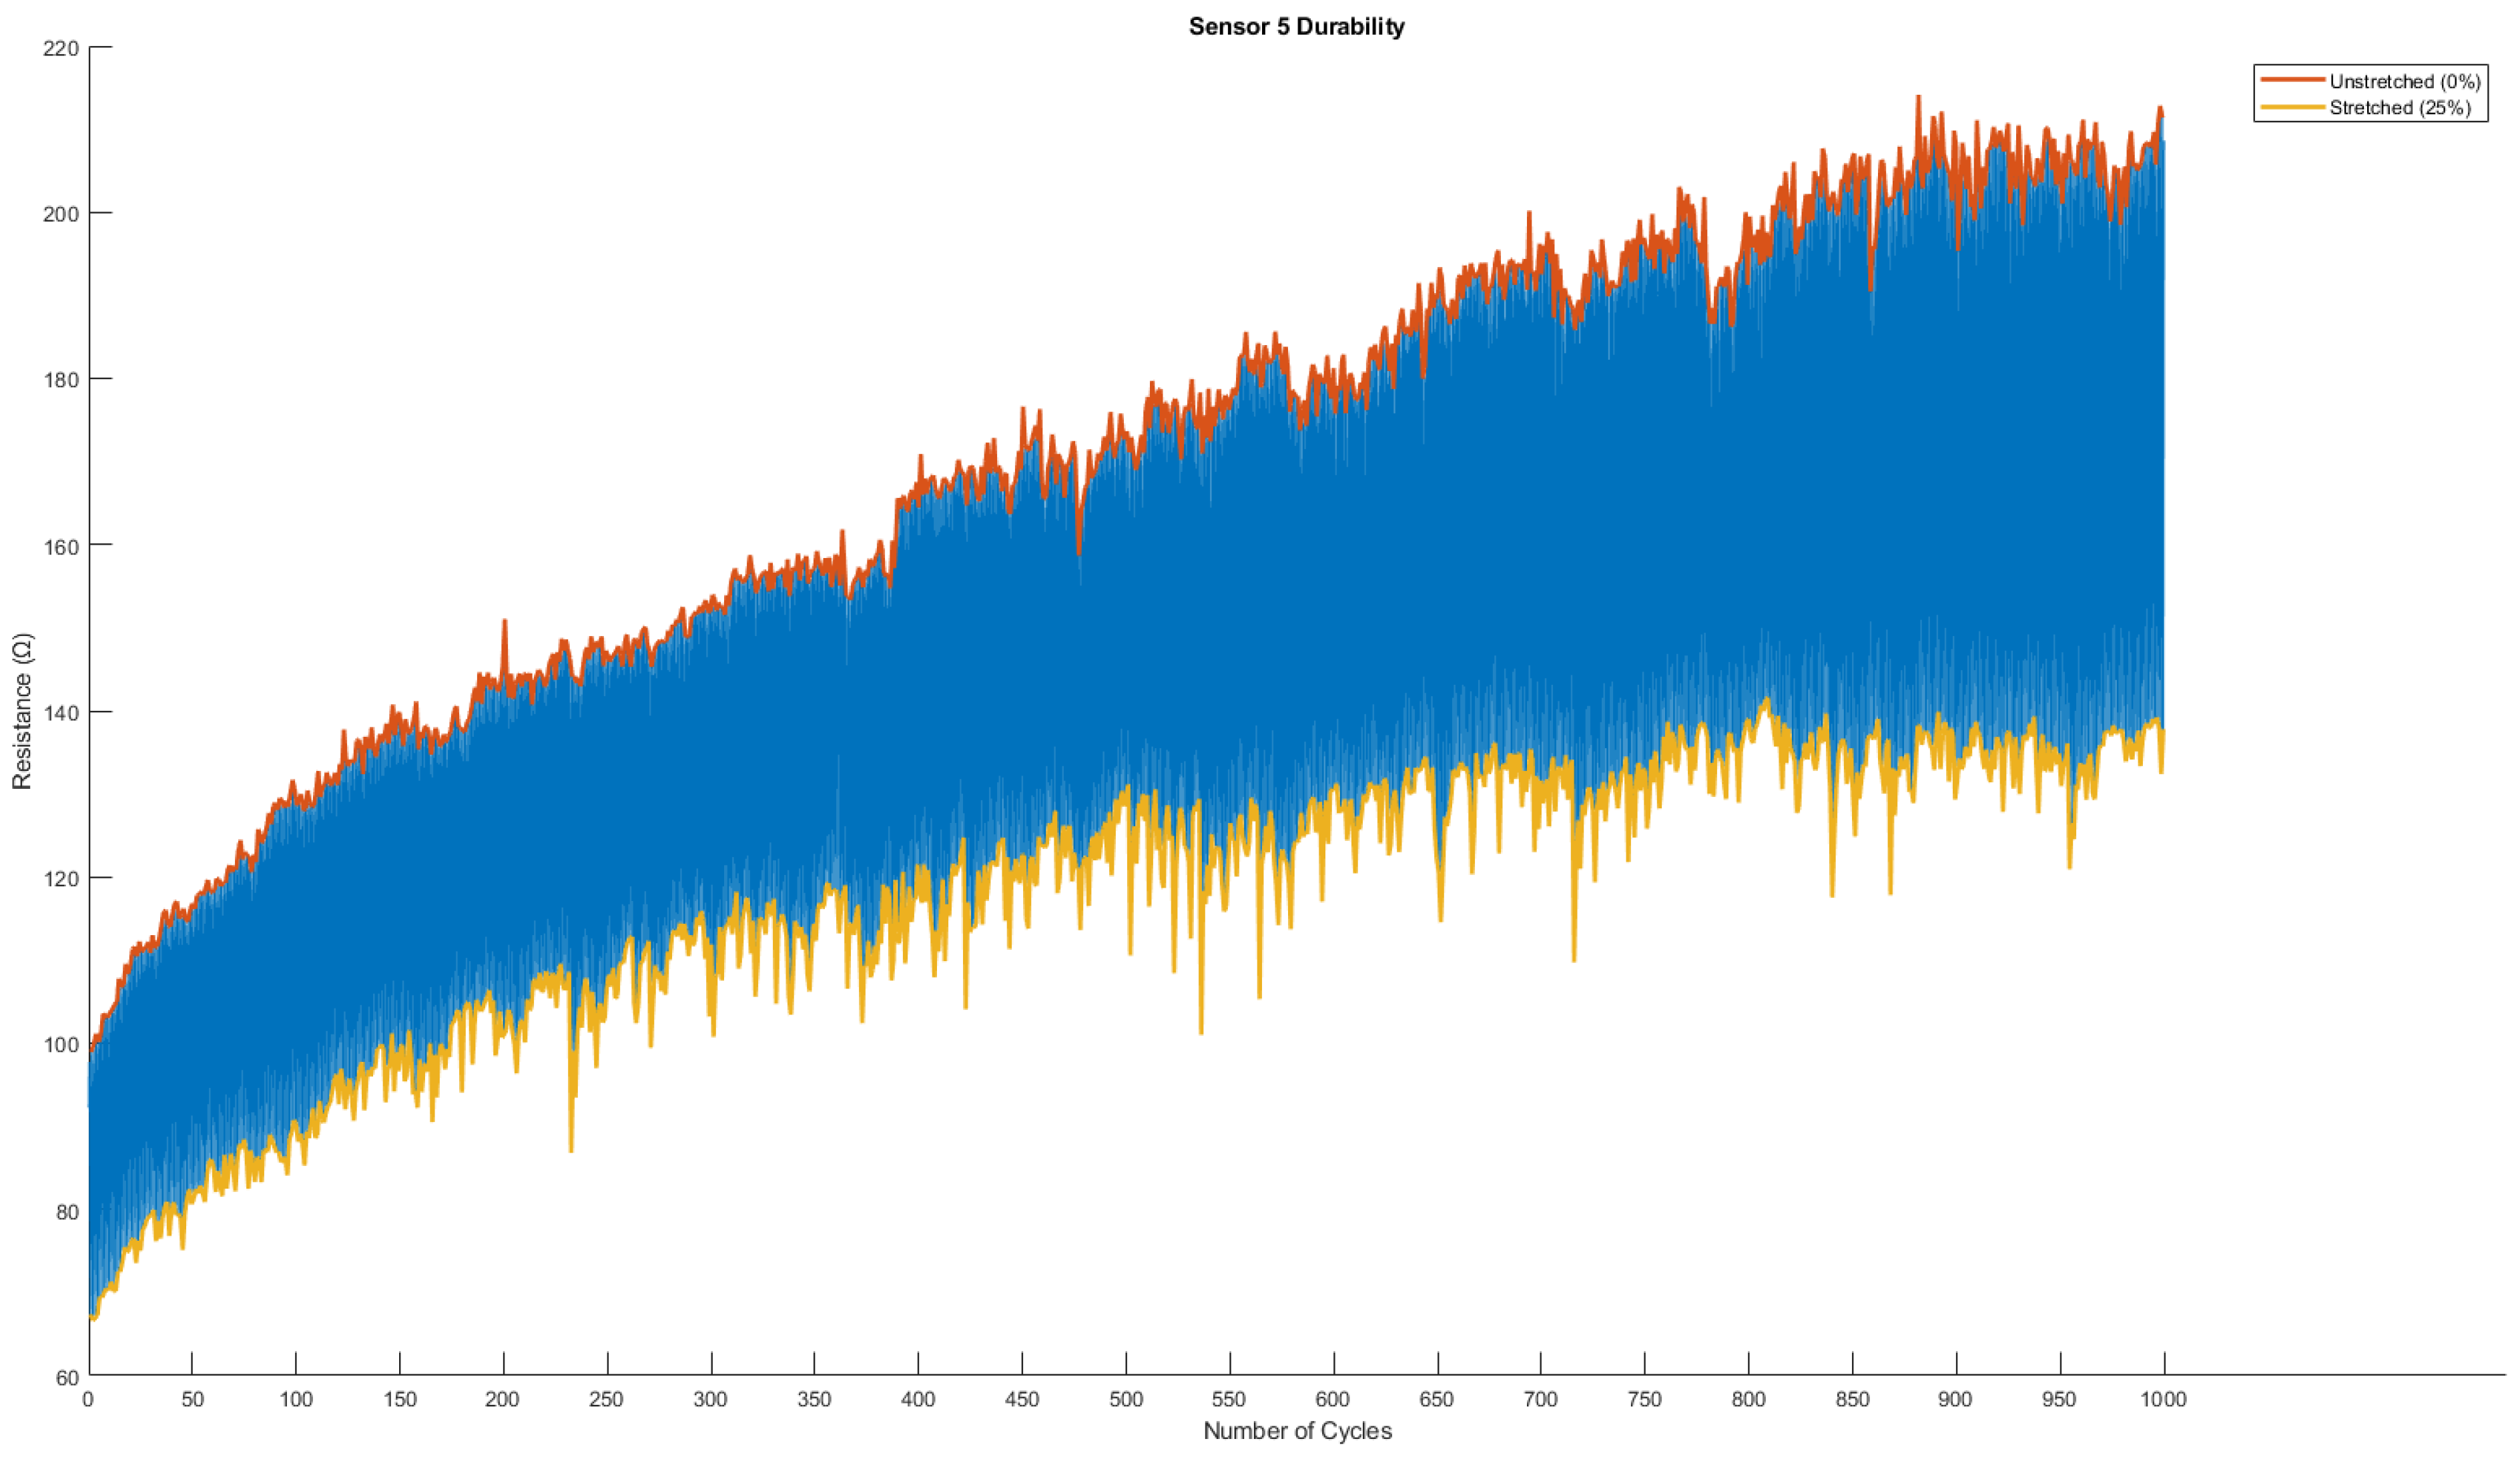
4.2. Durability Test (Cyclic Test)
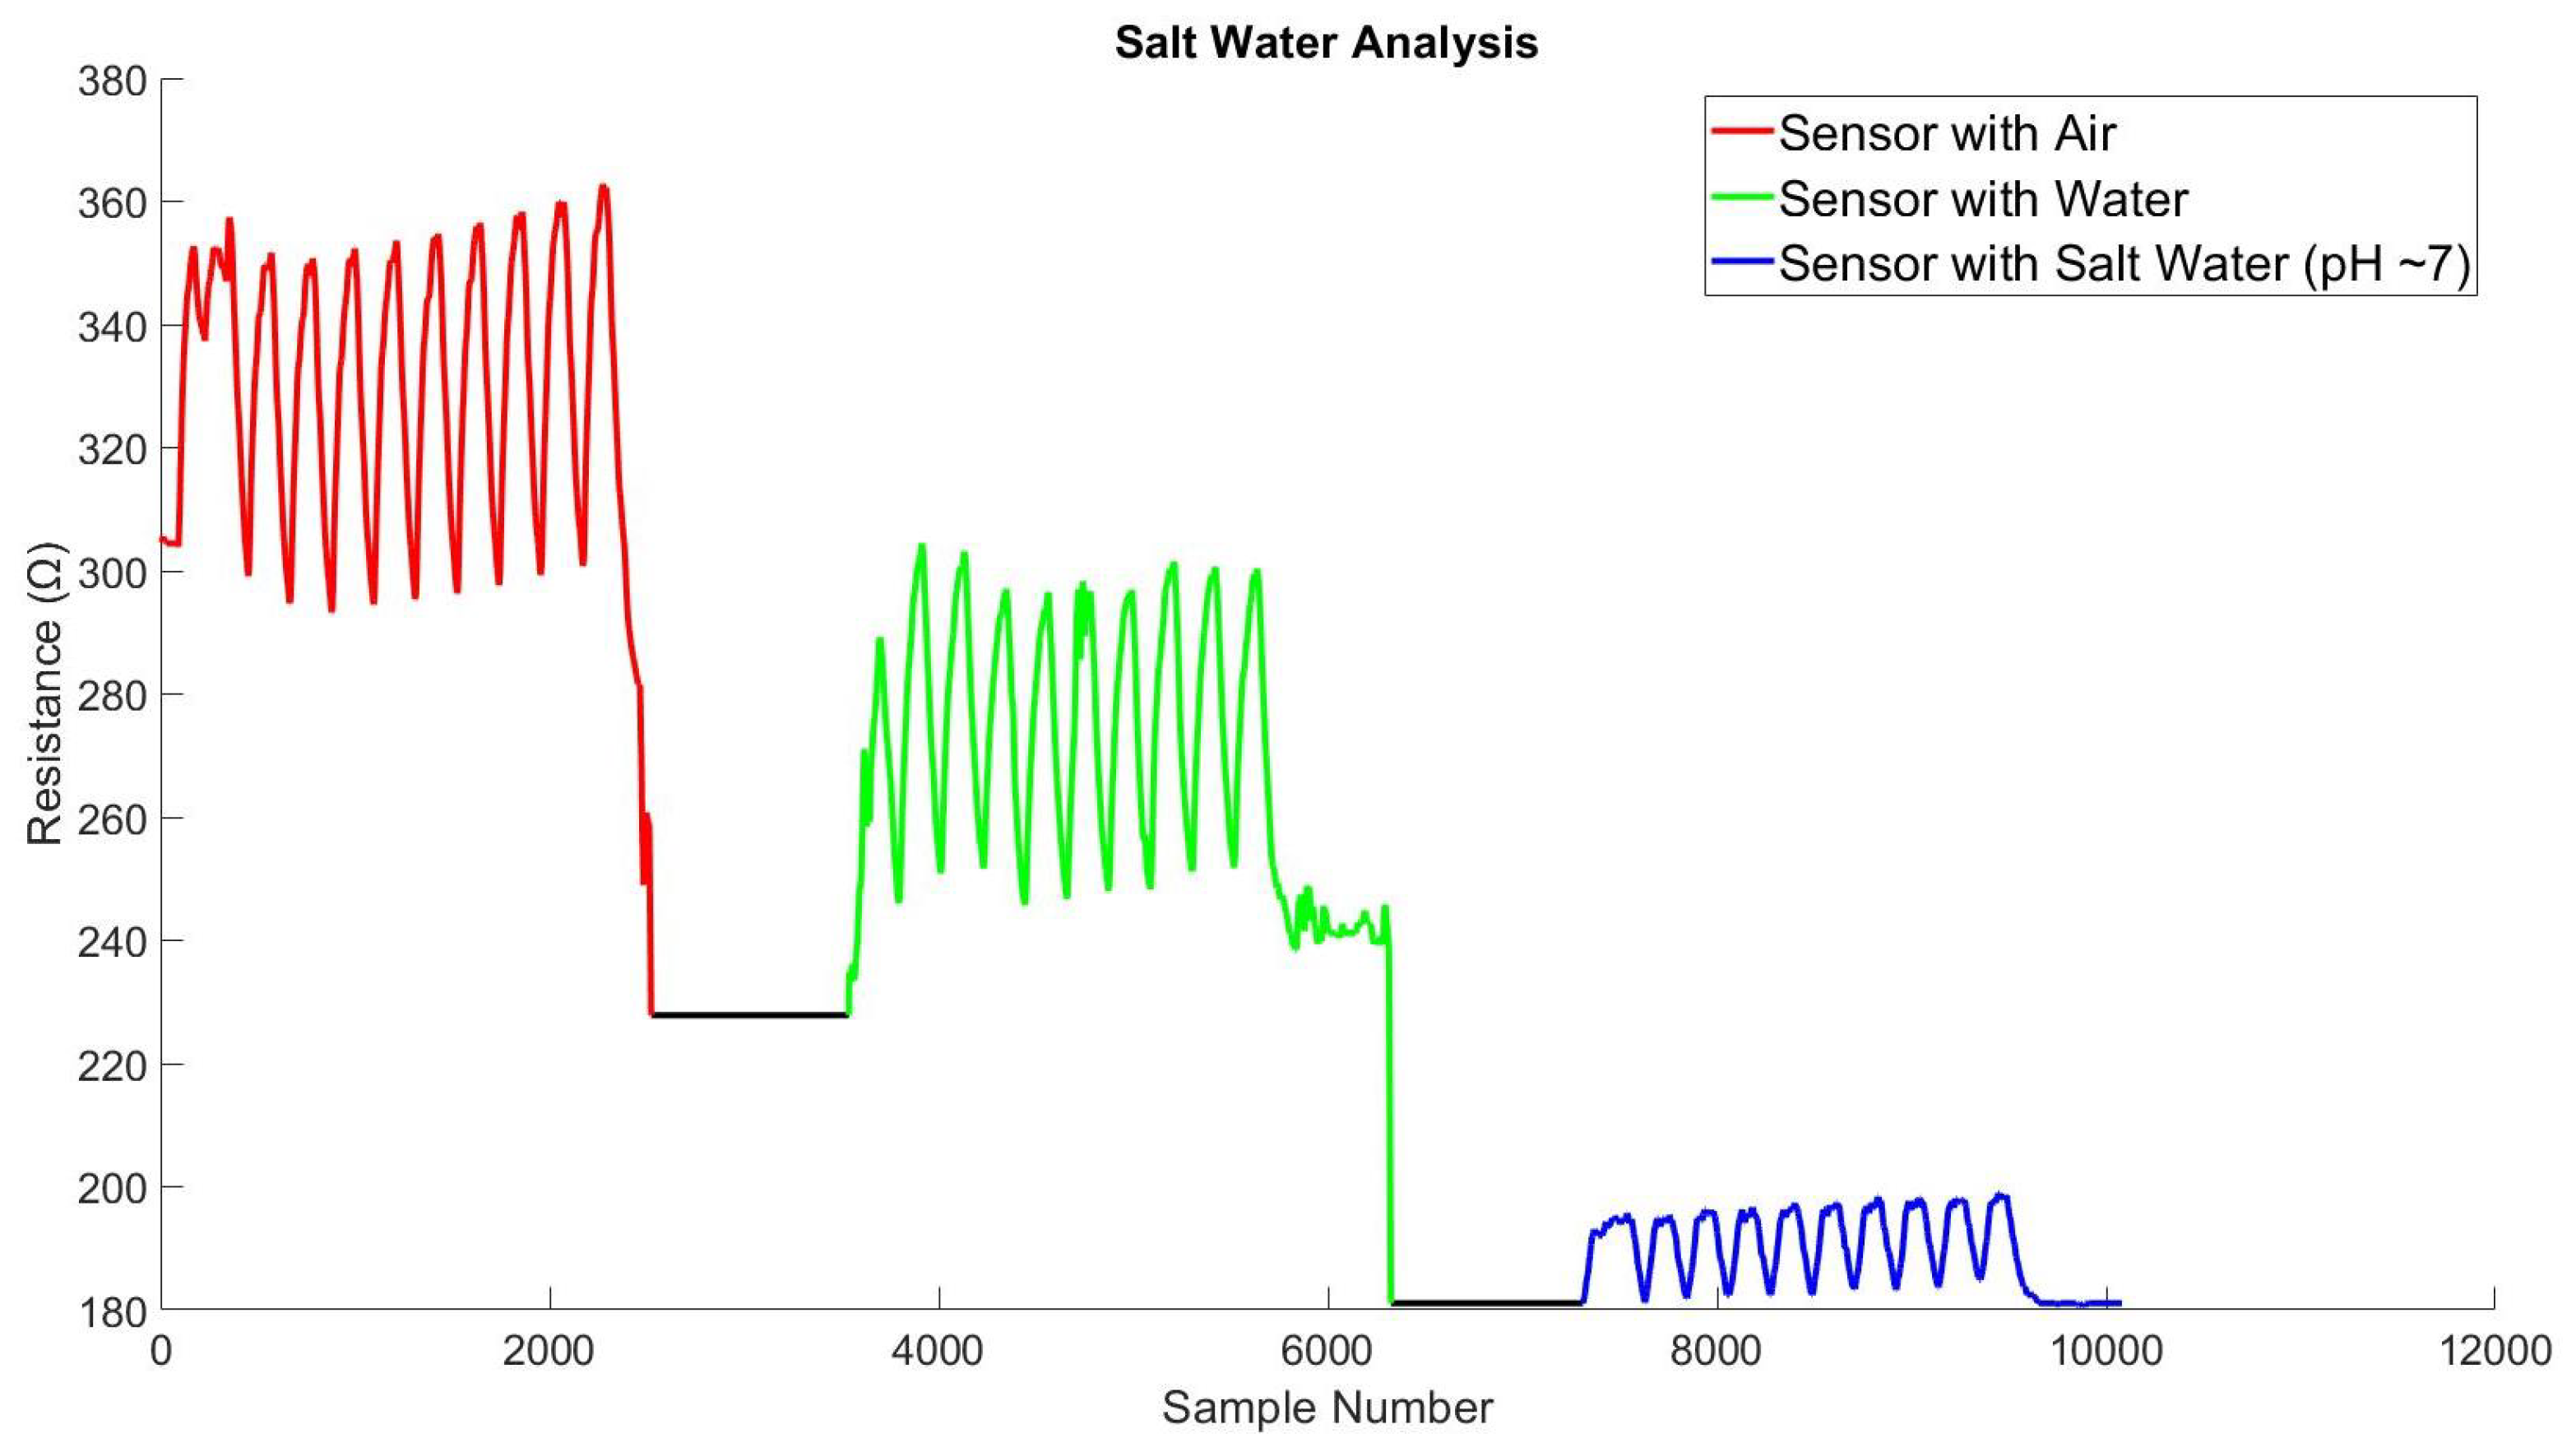
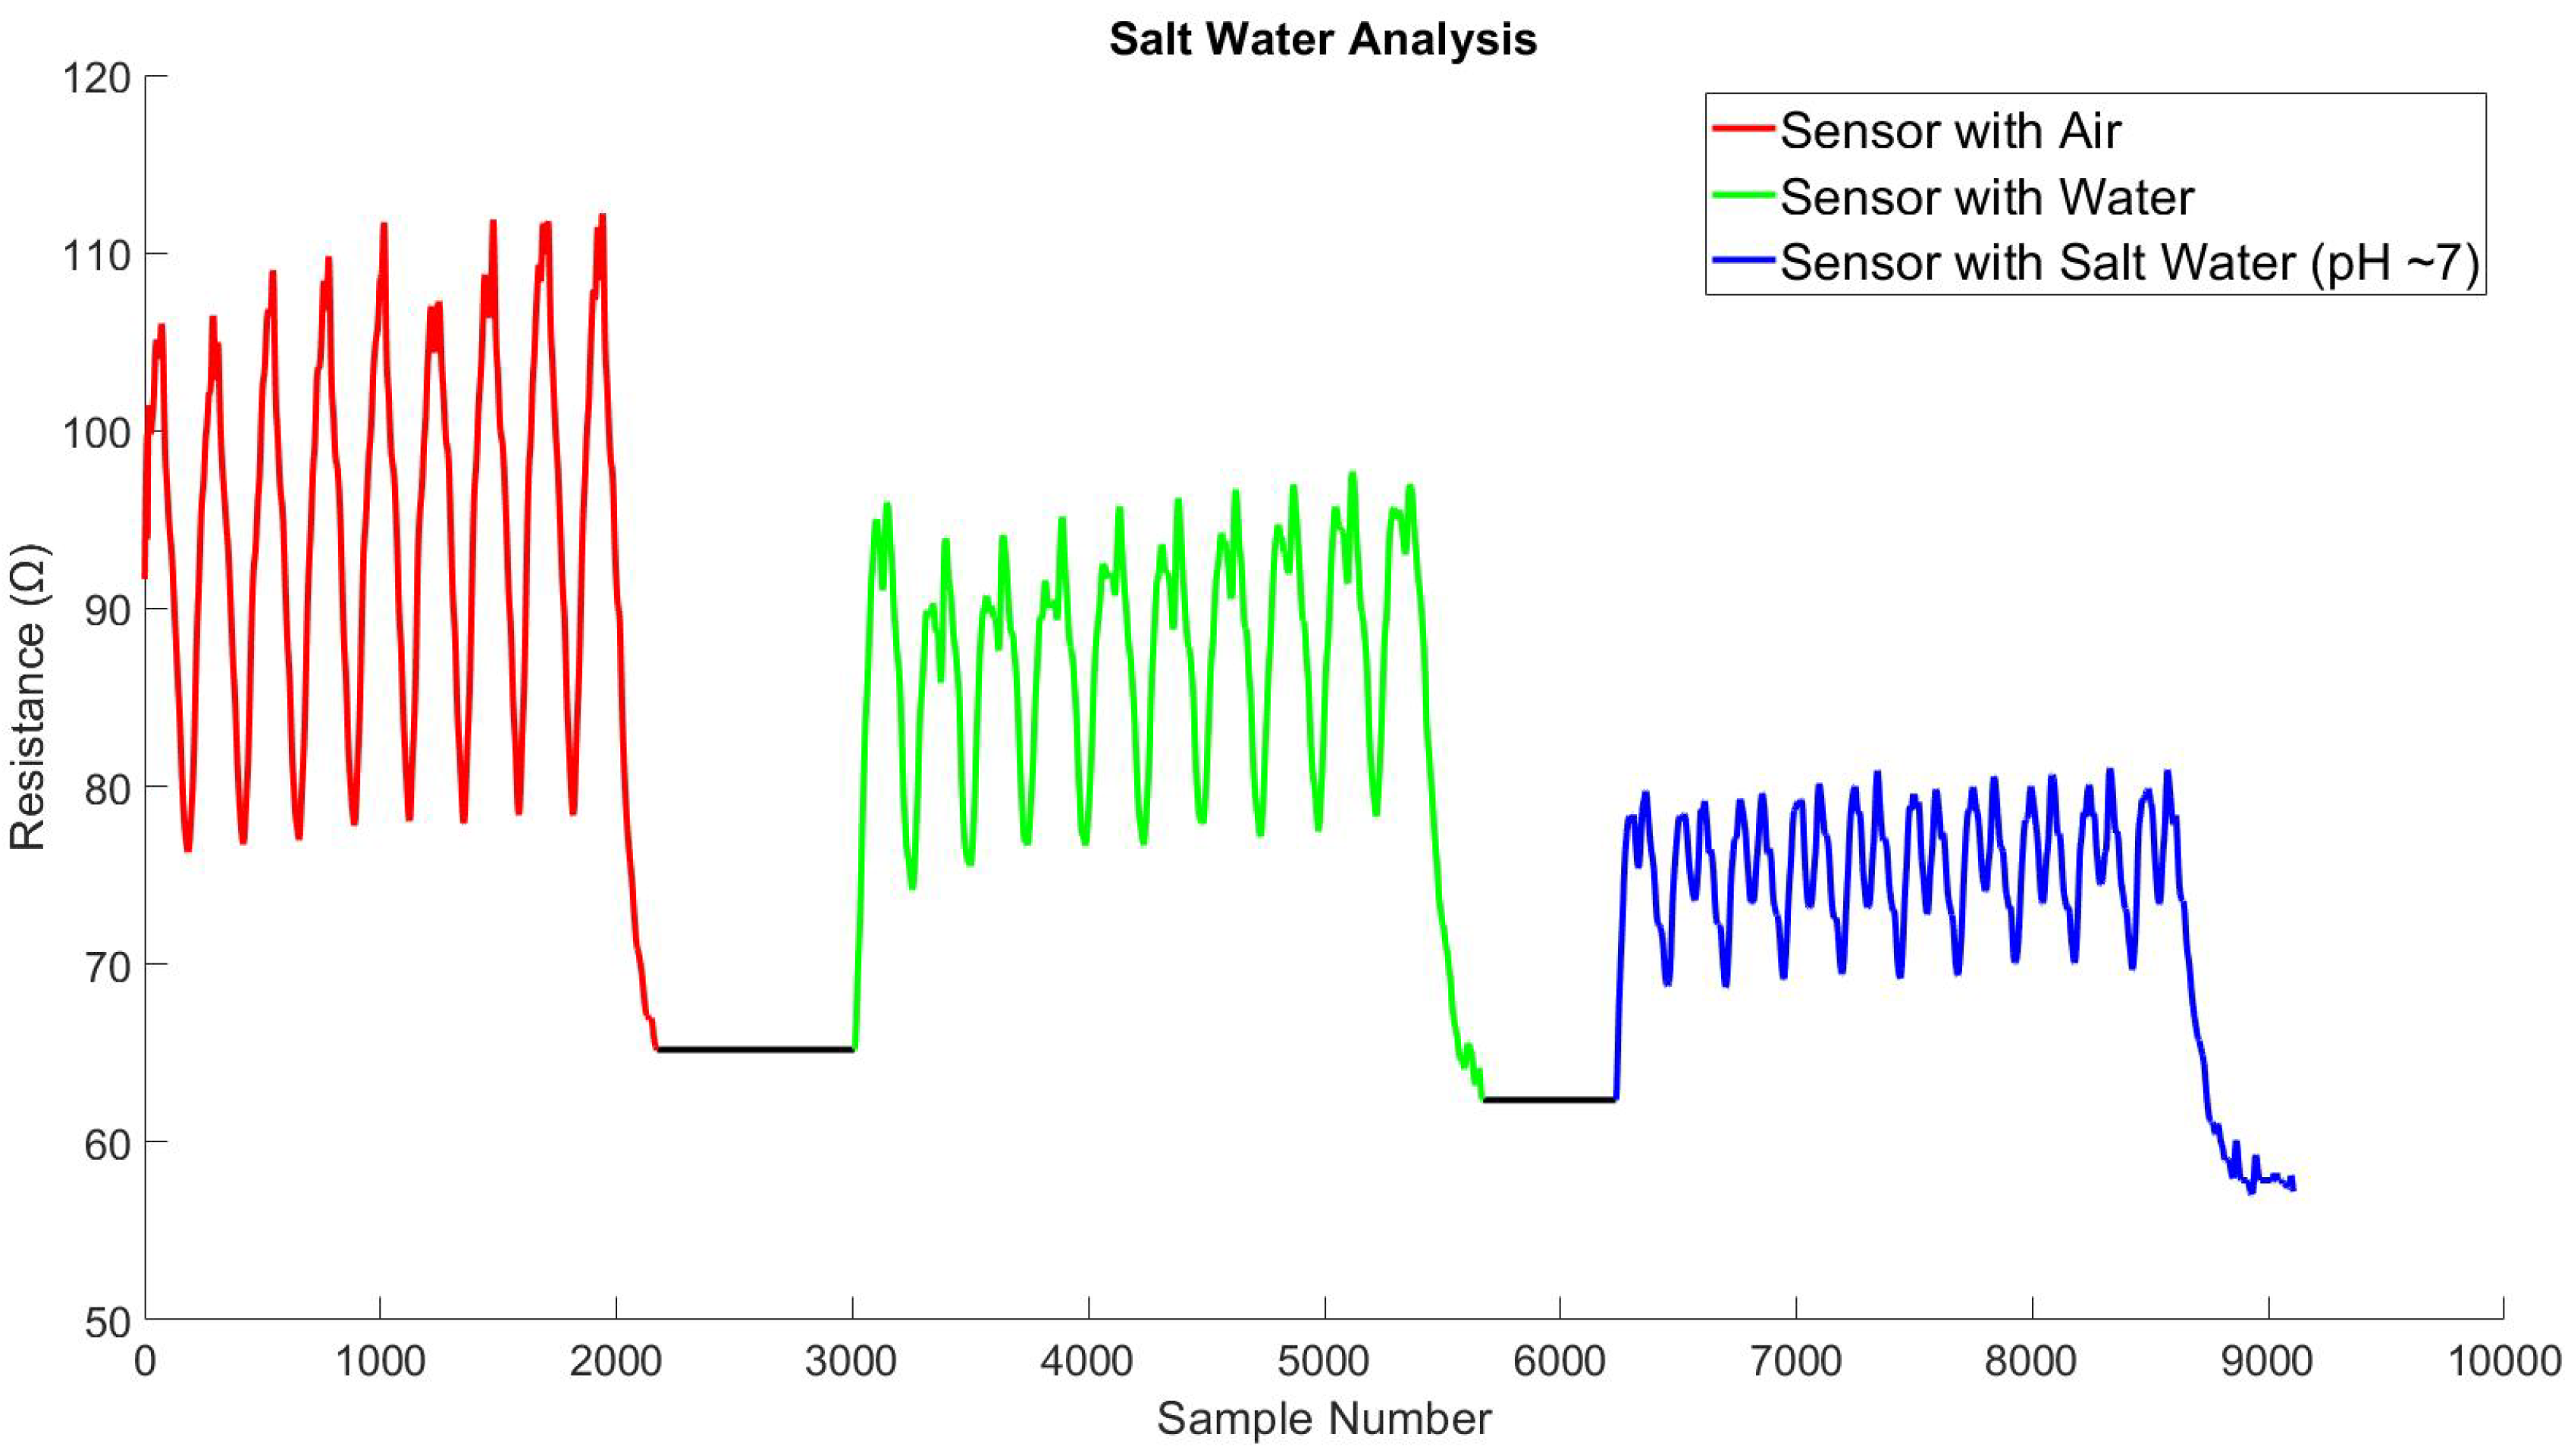
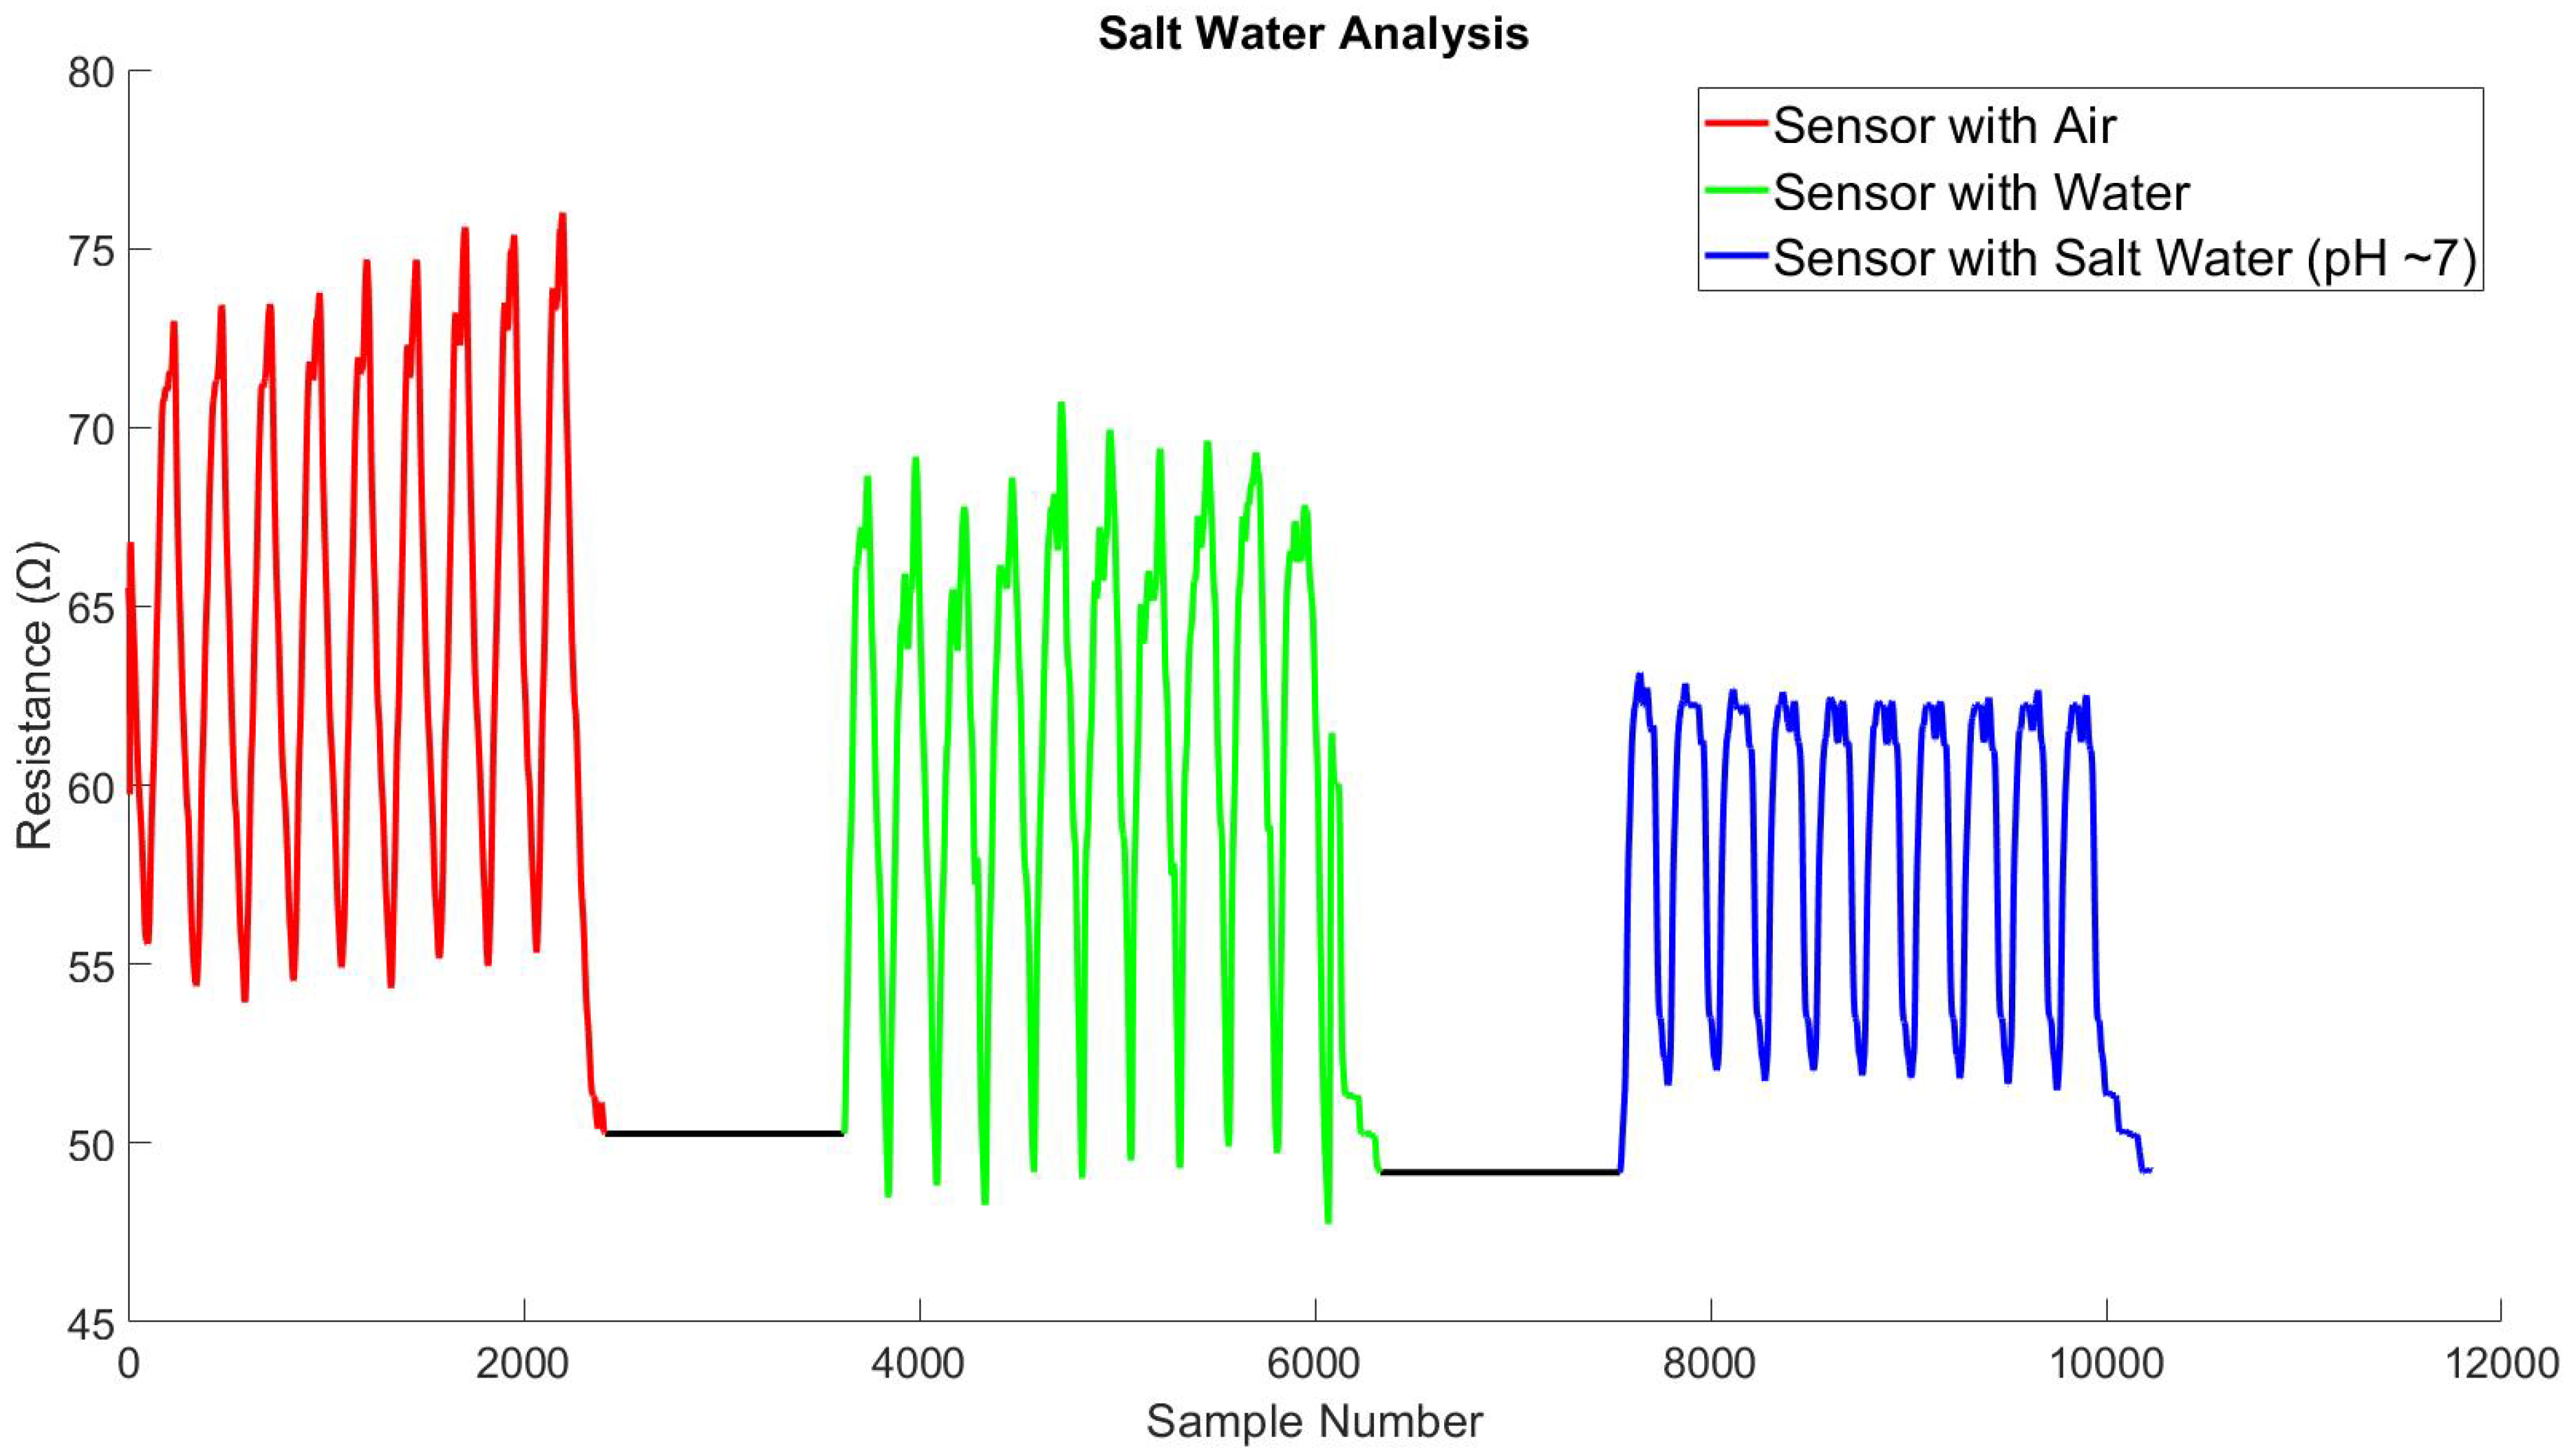
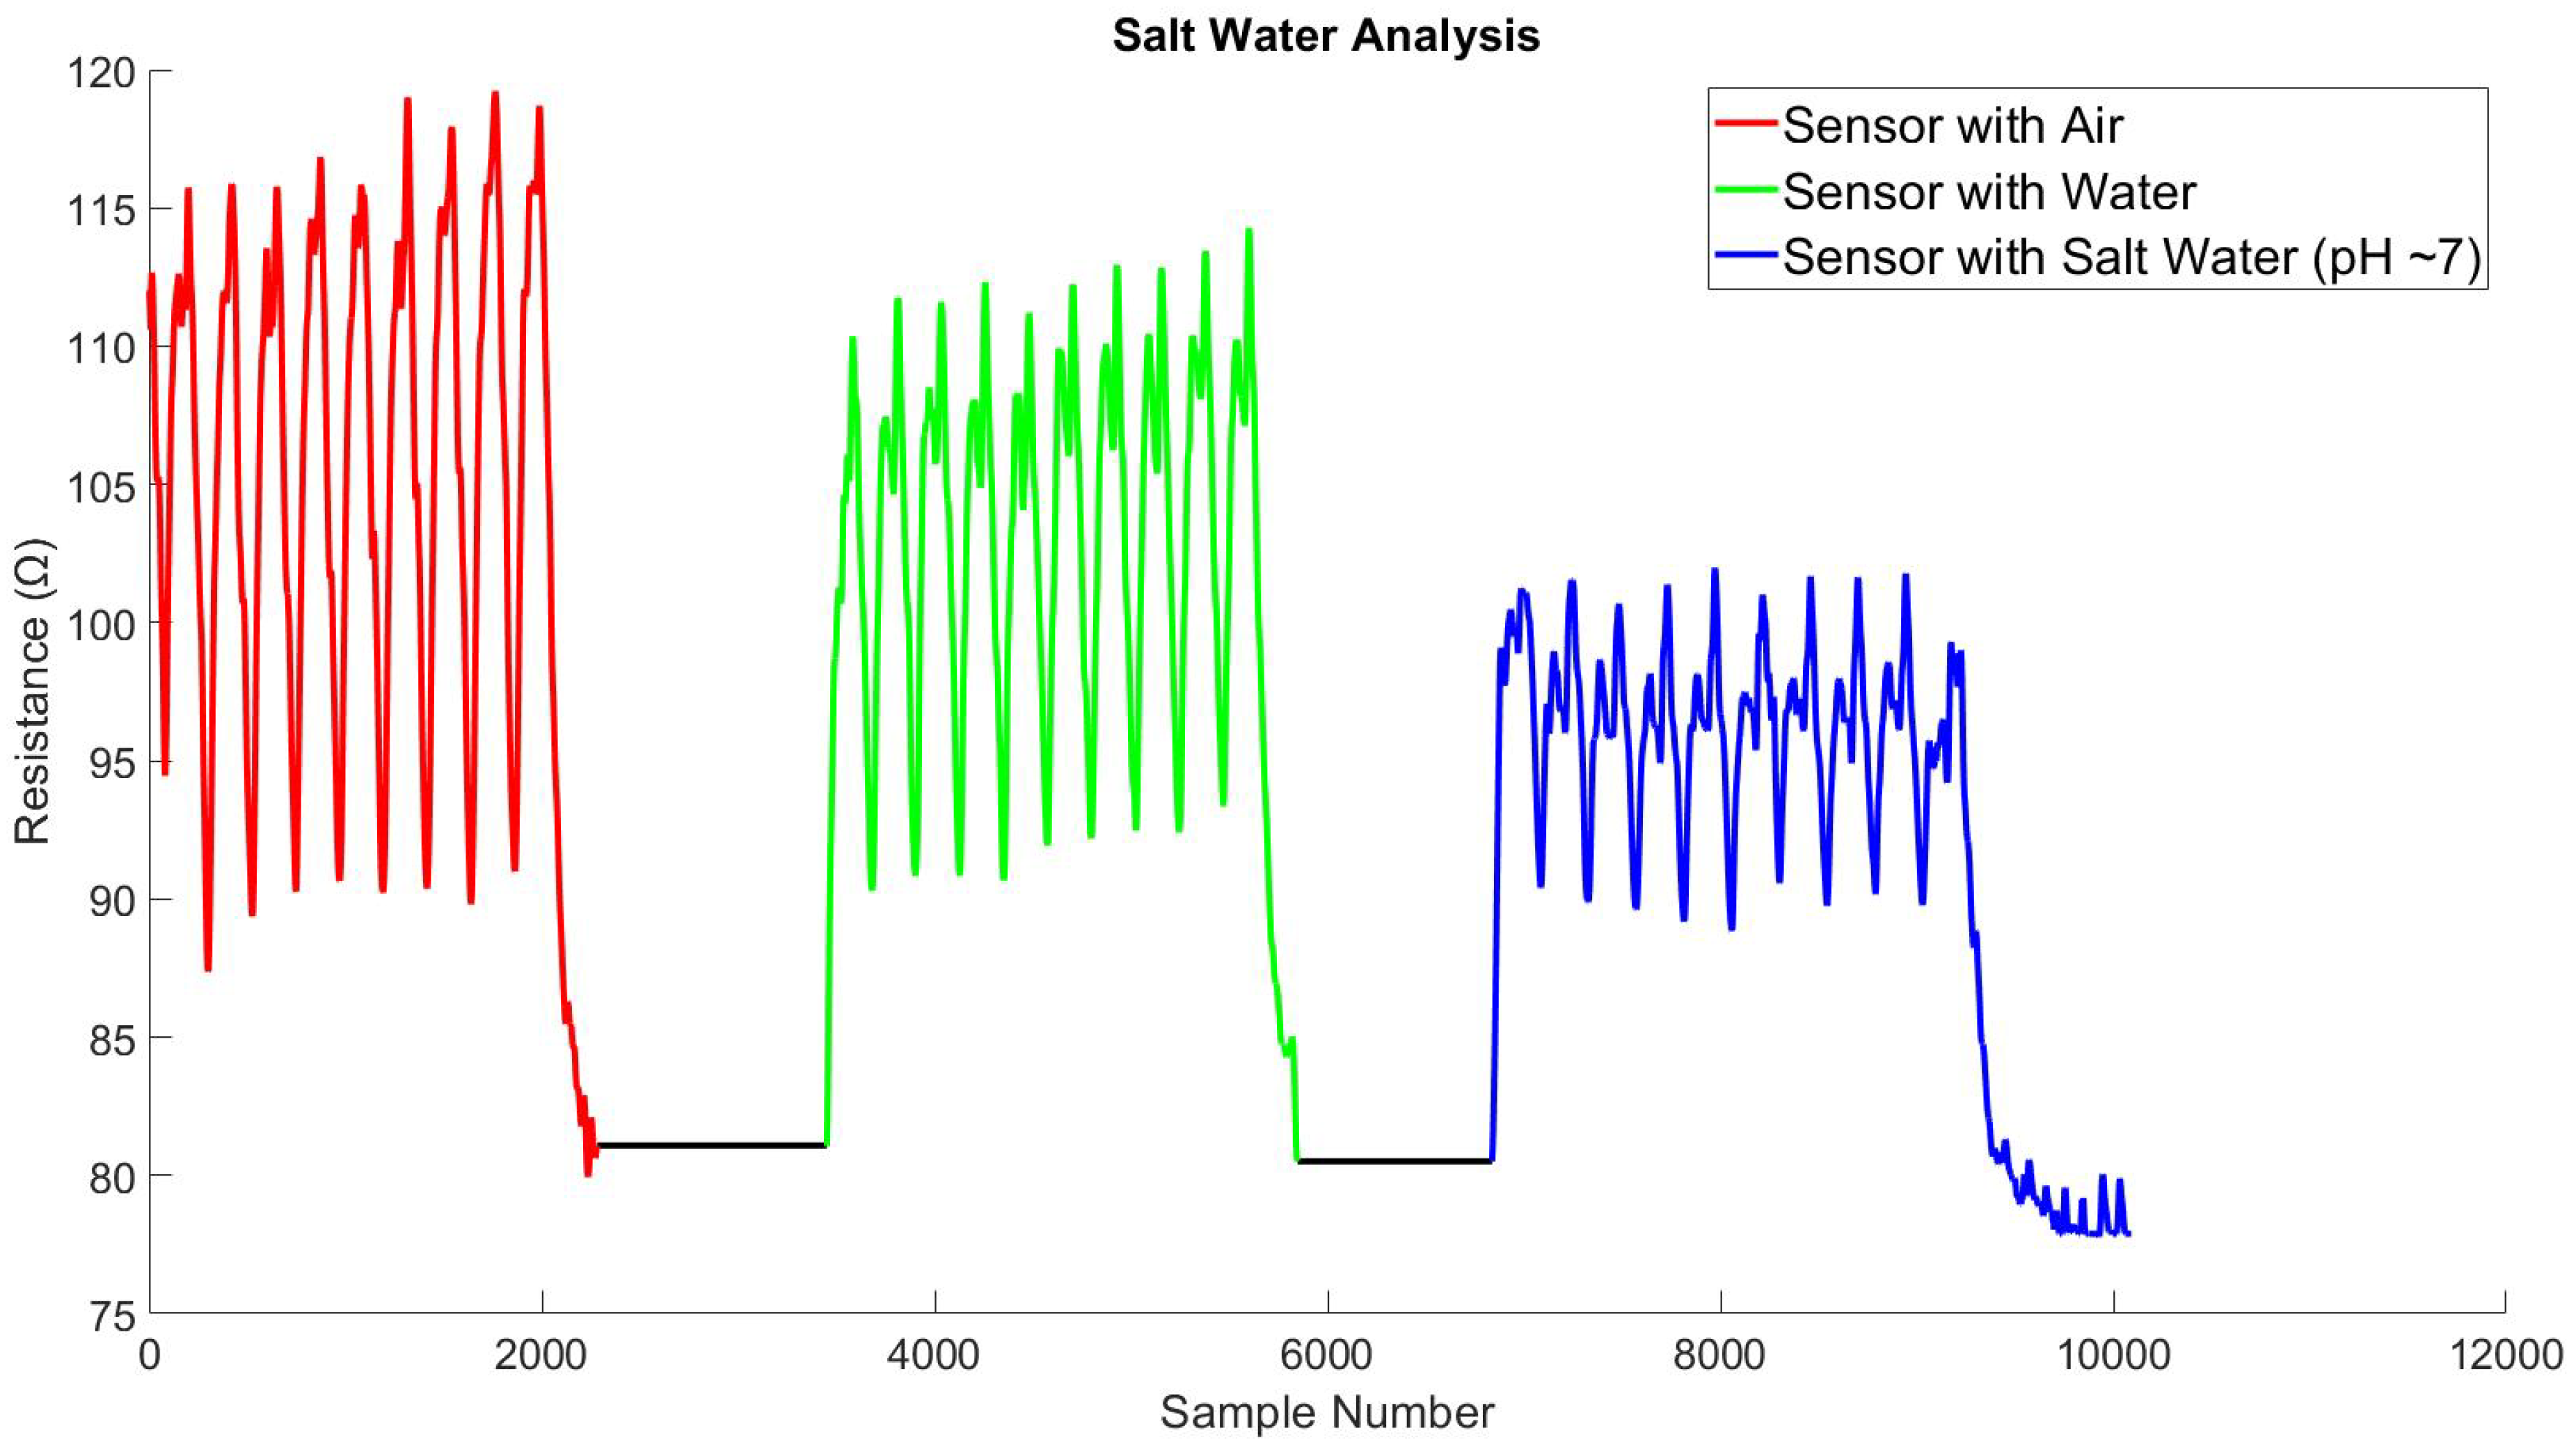
4.3. Salt-Fog Test
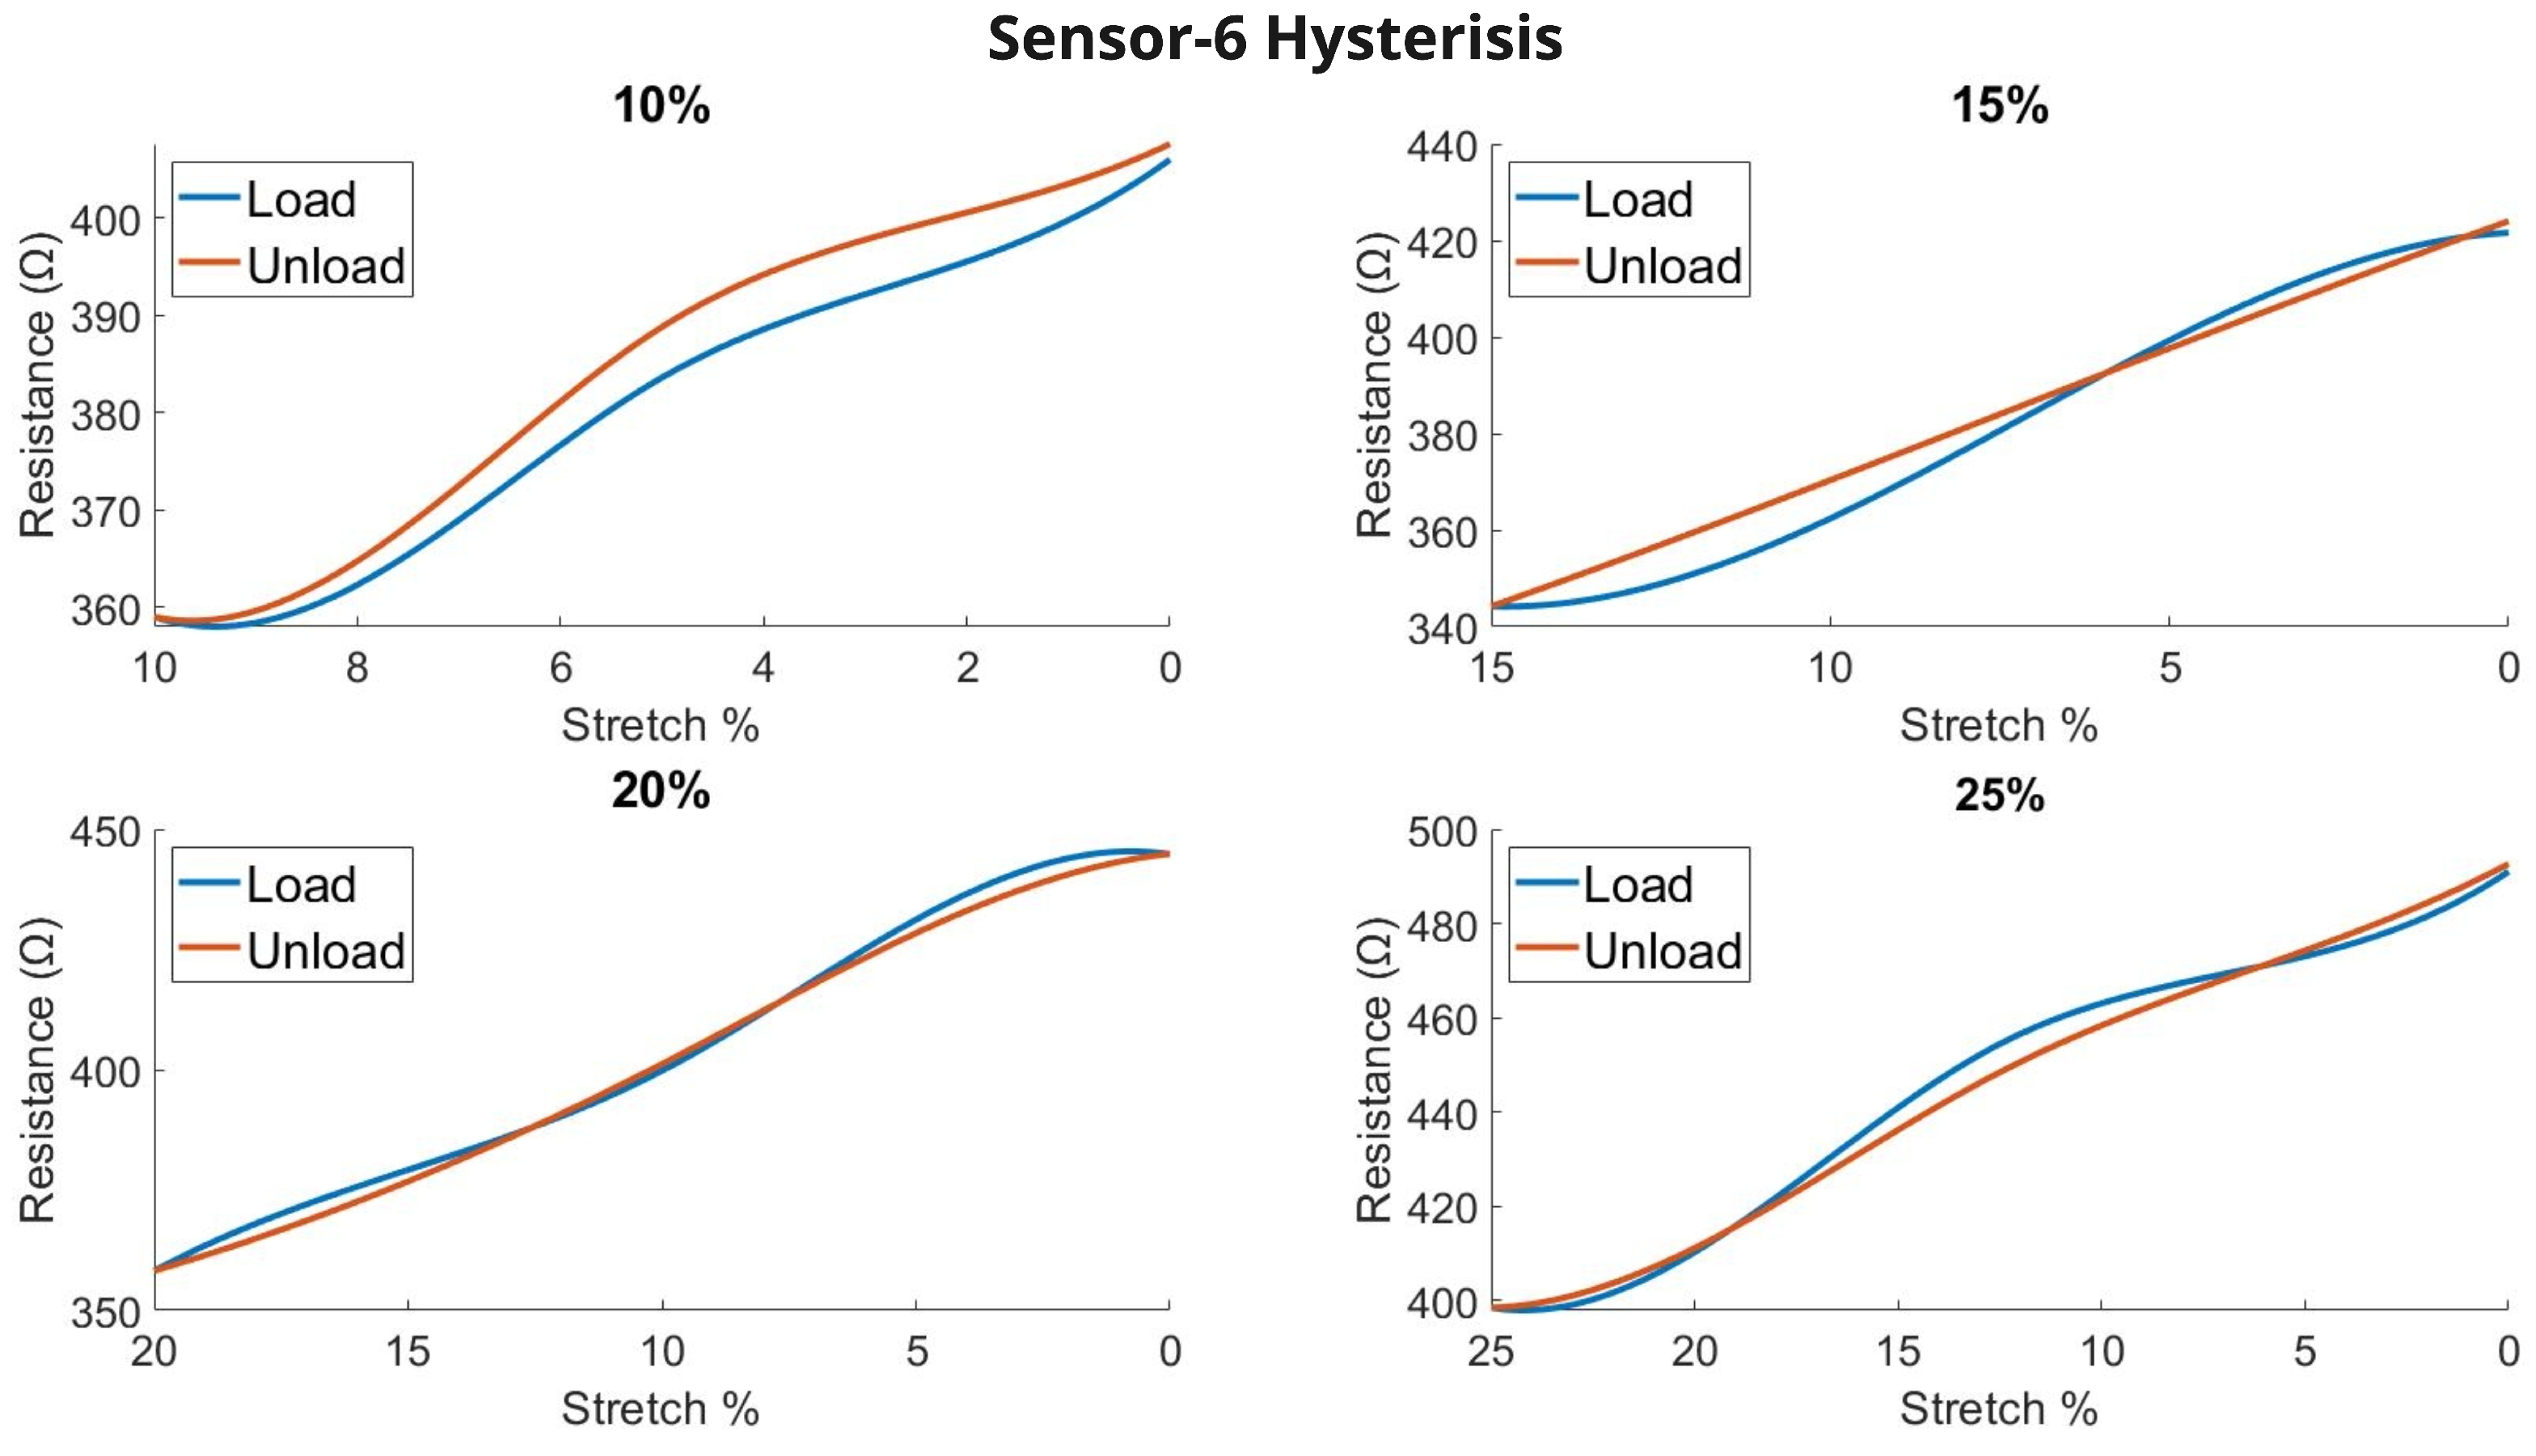
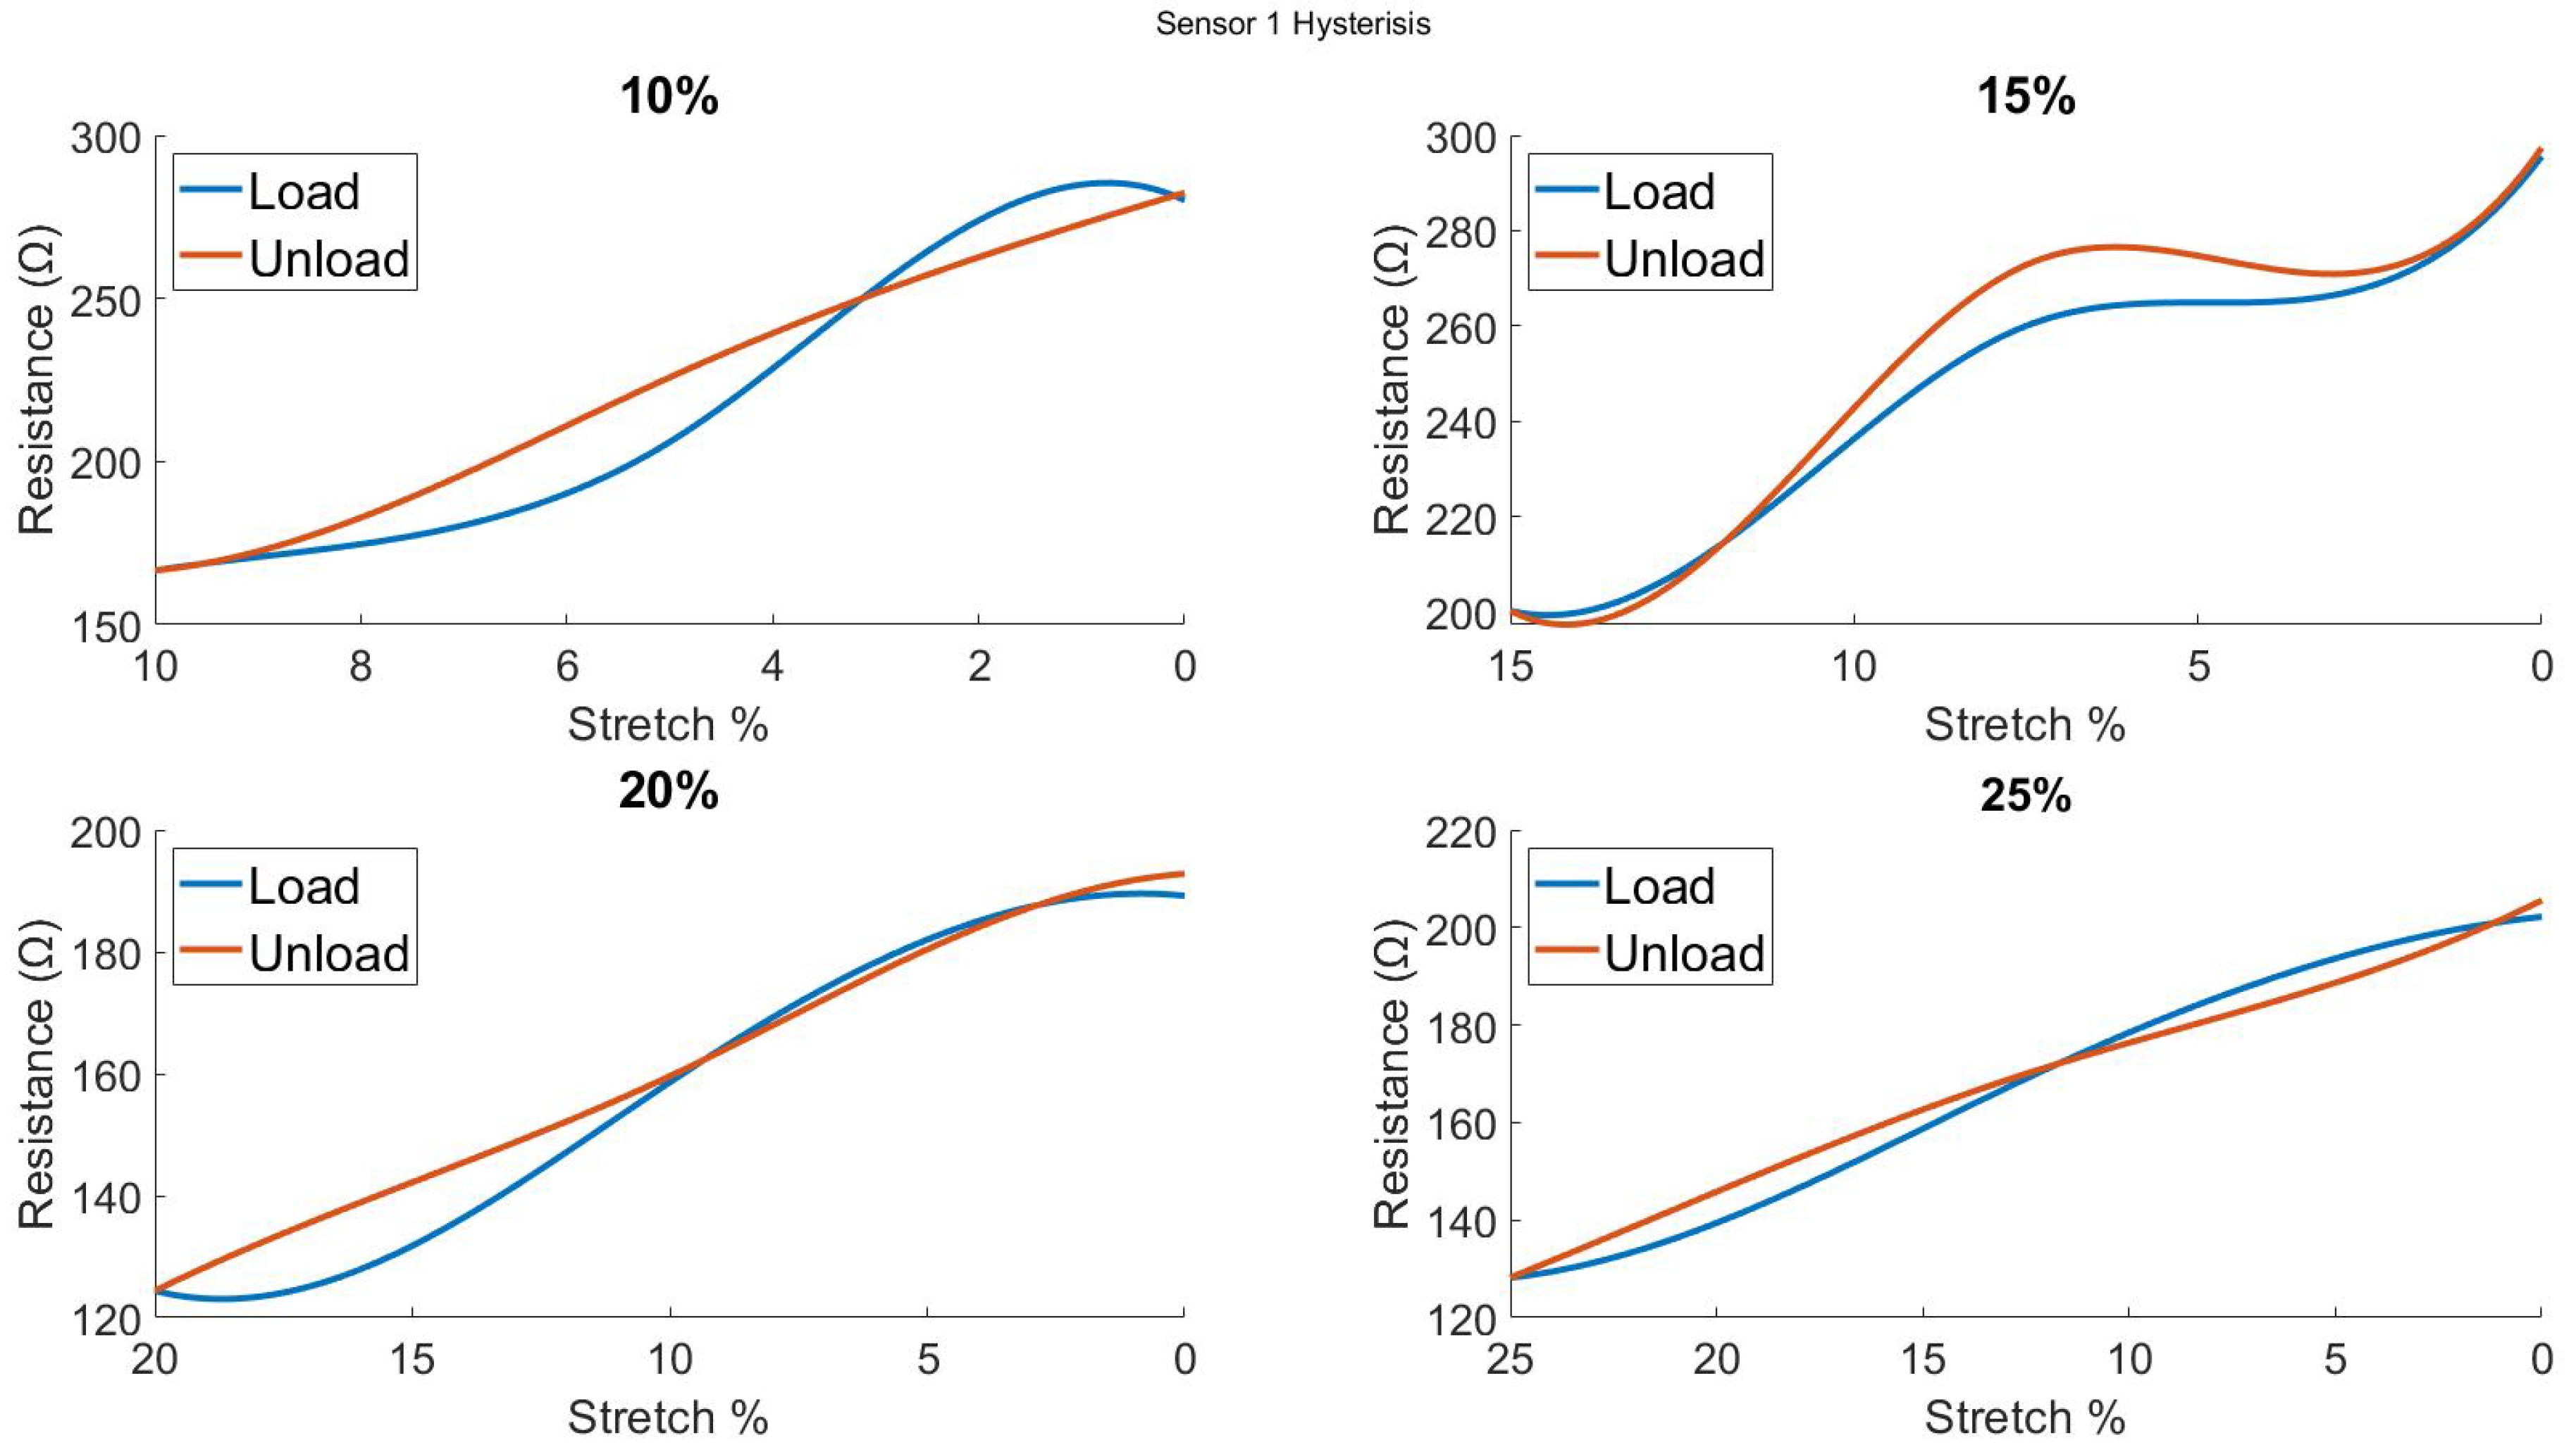
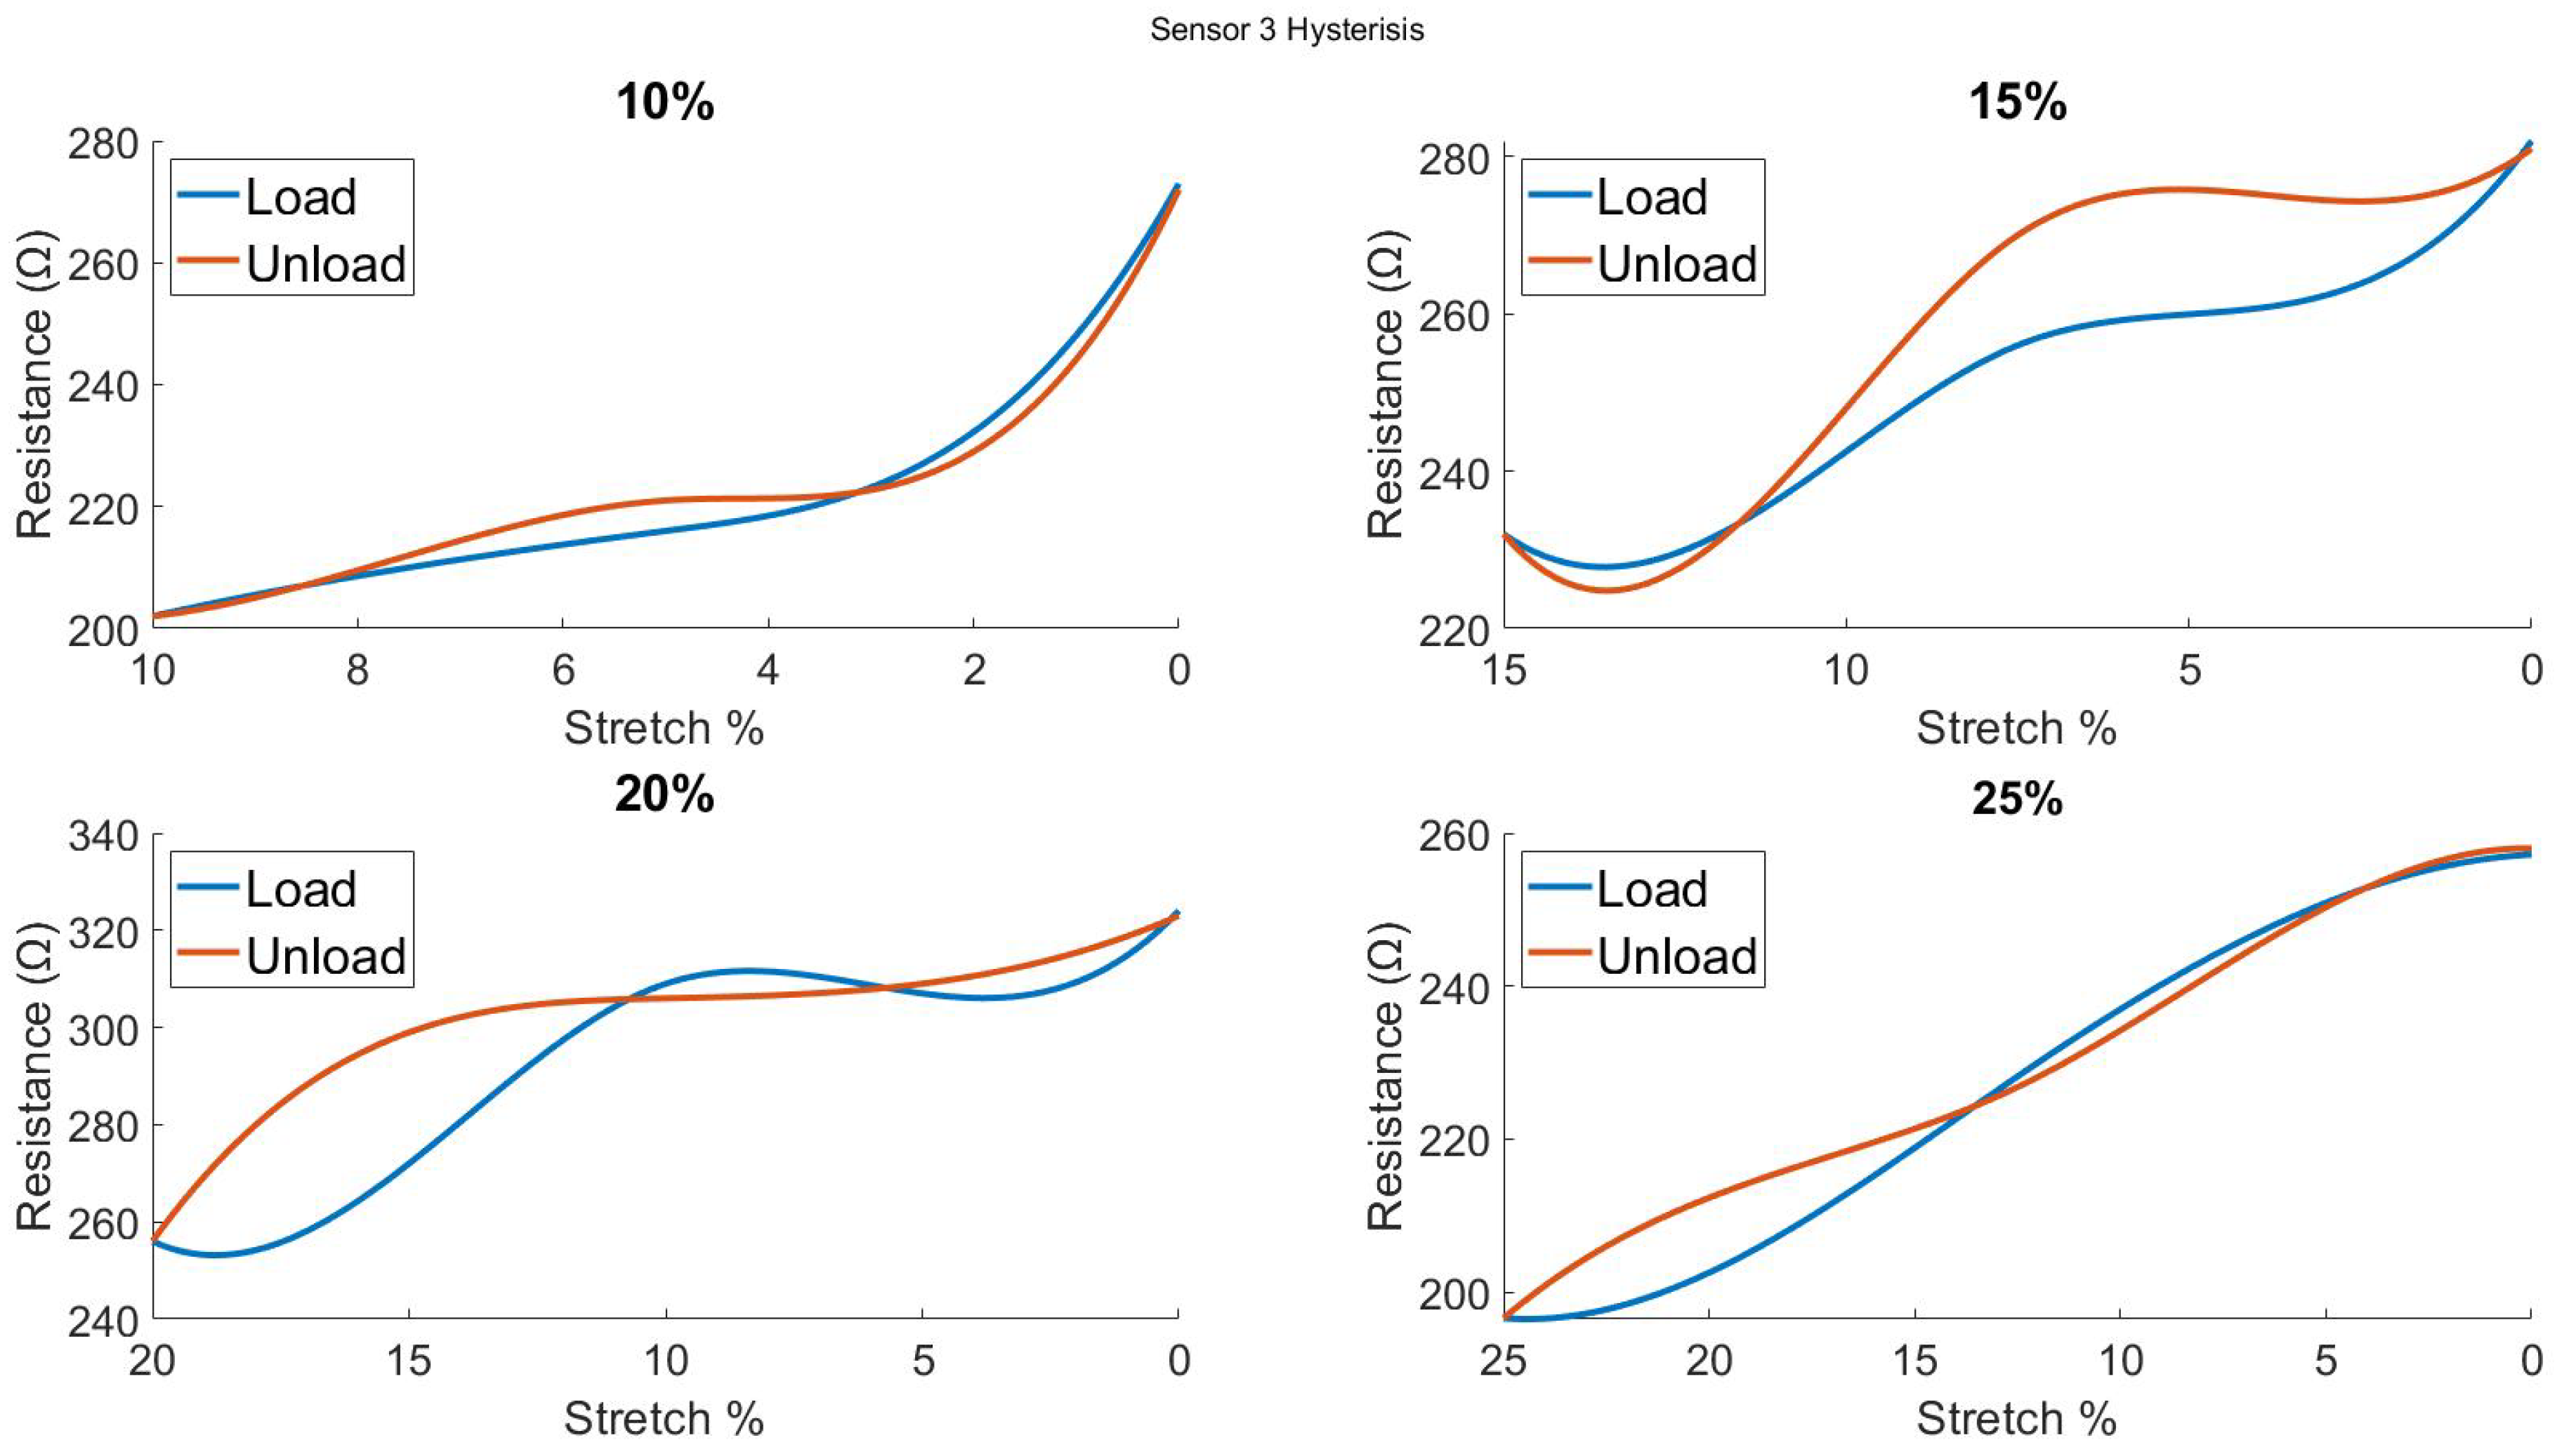
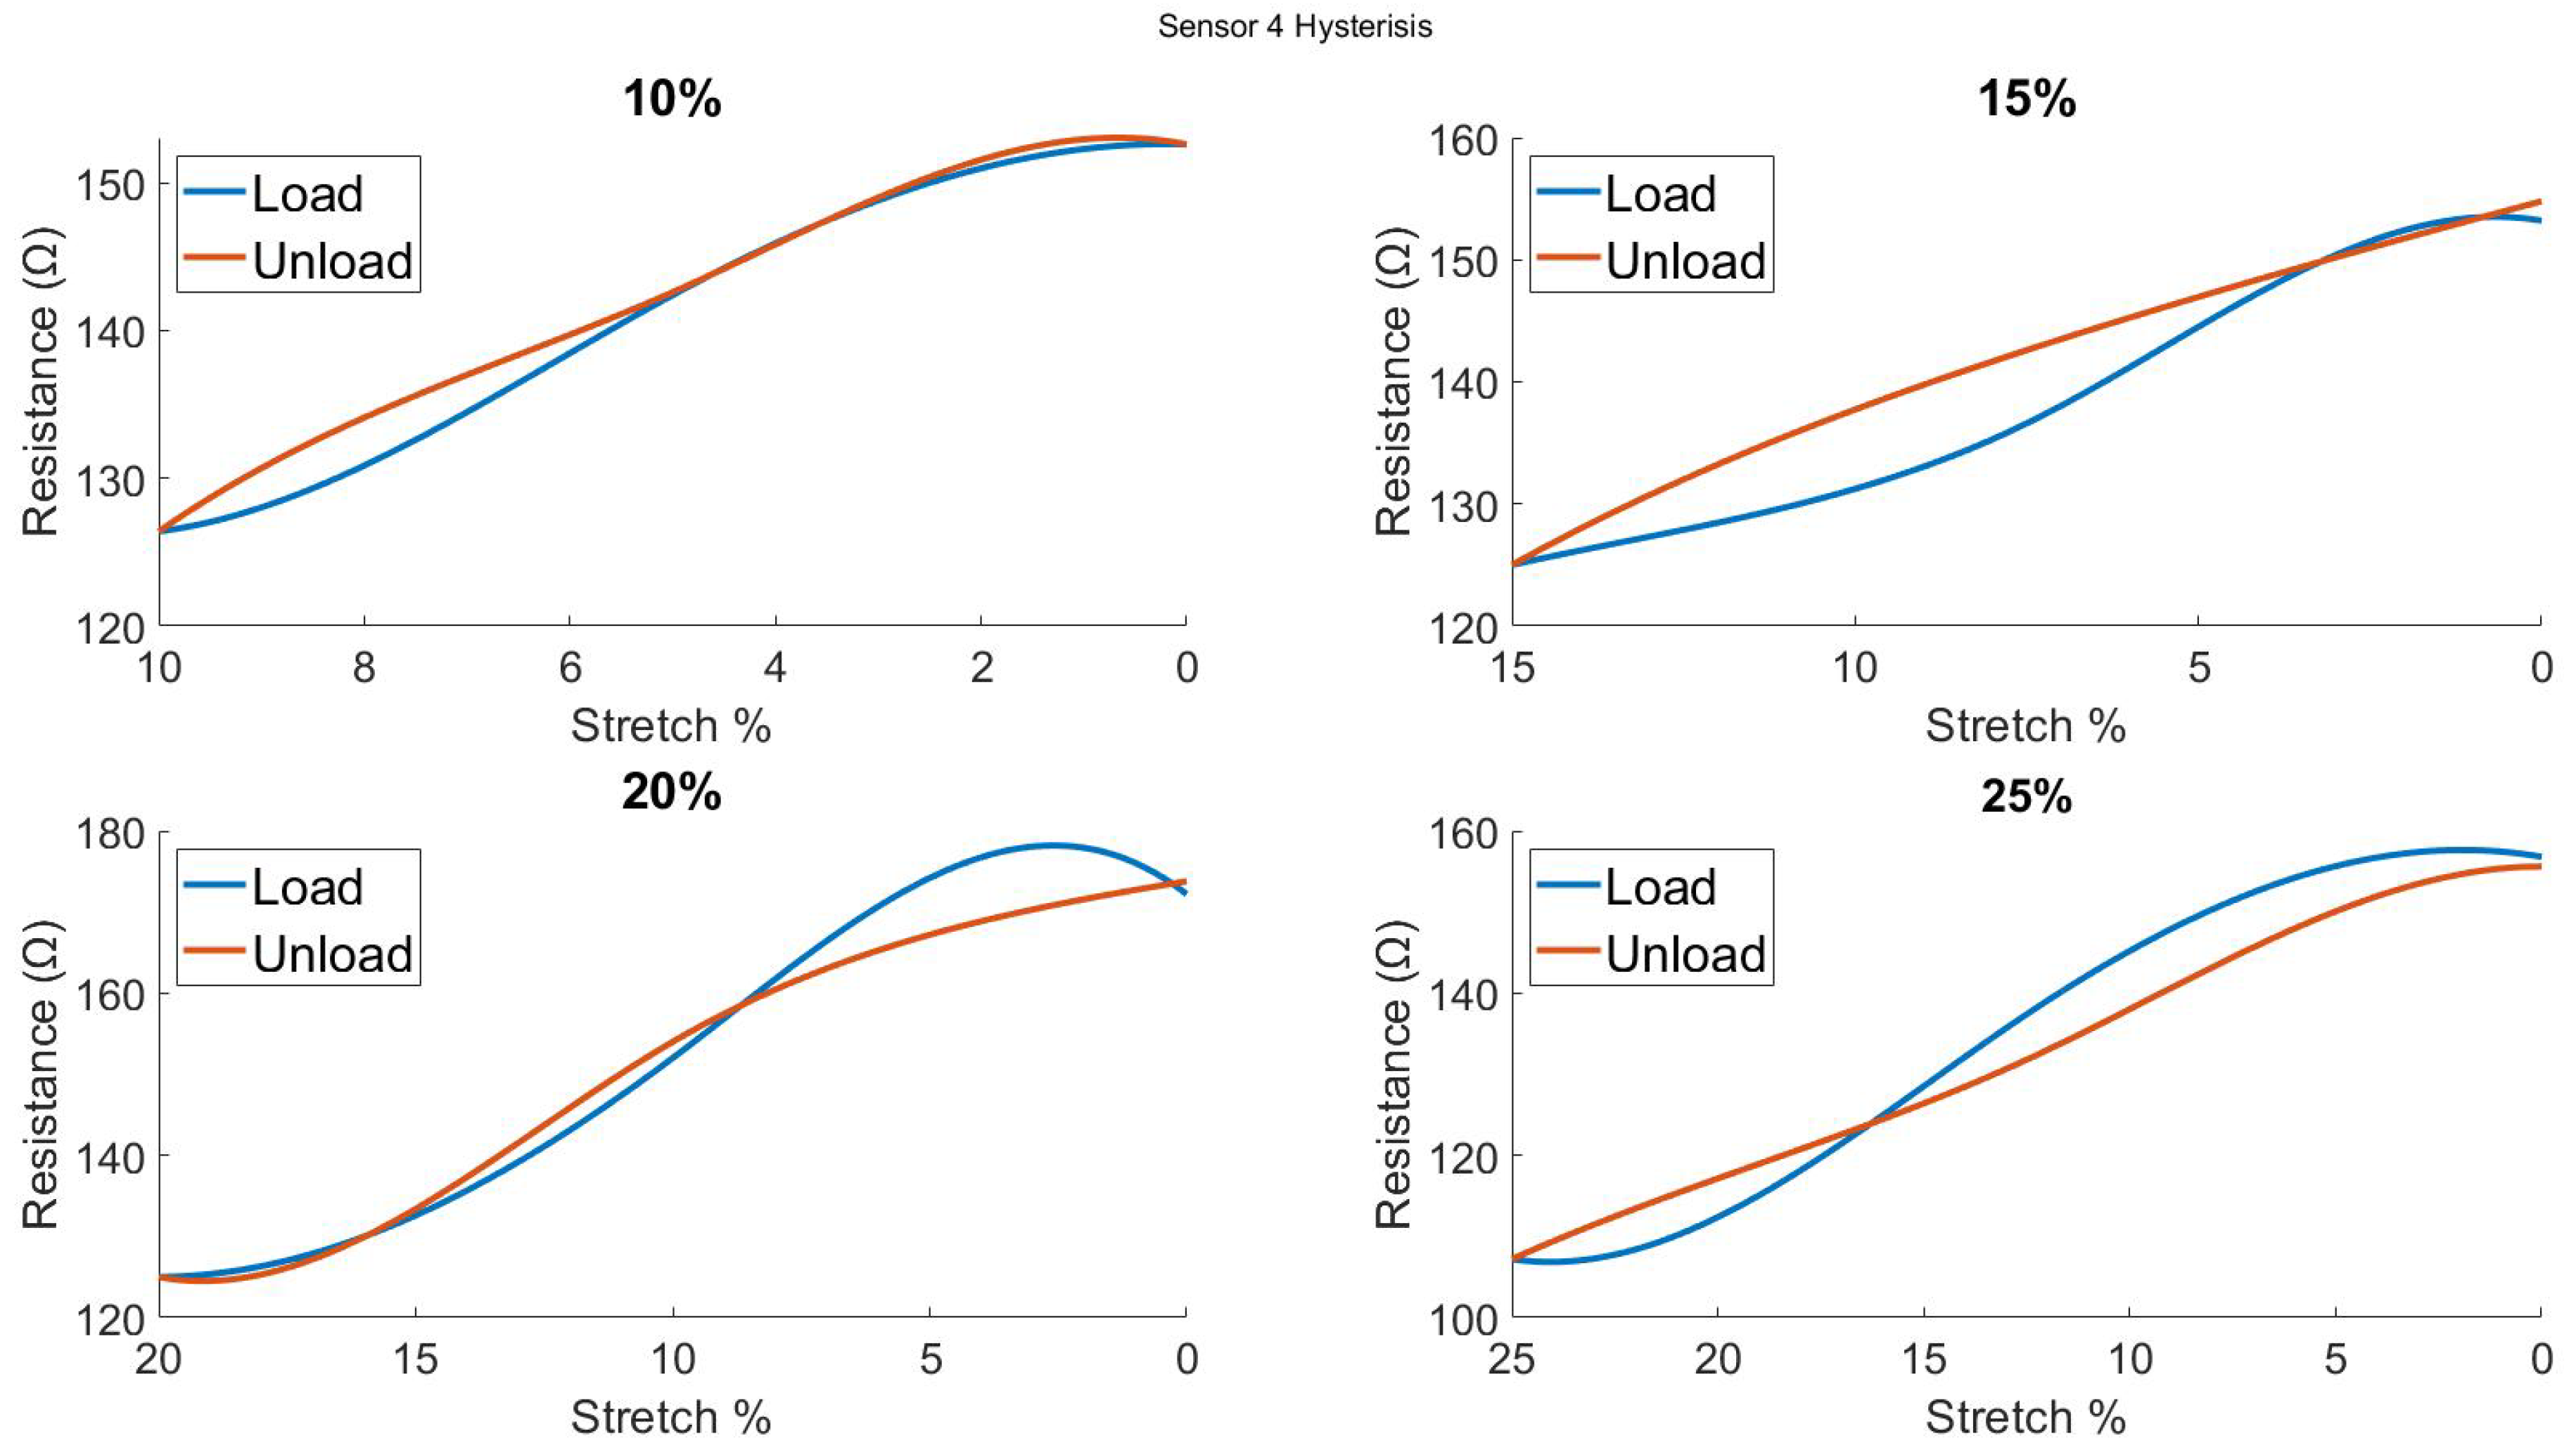
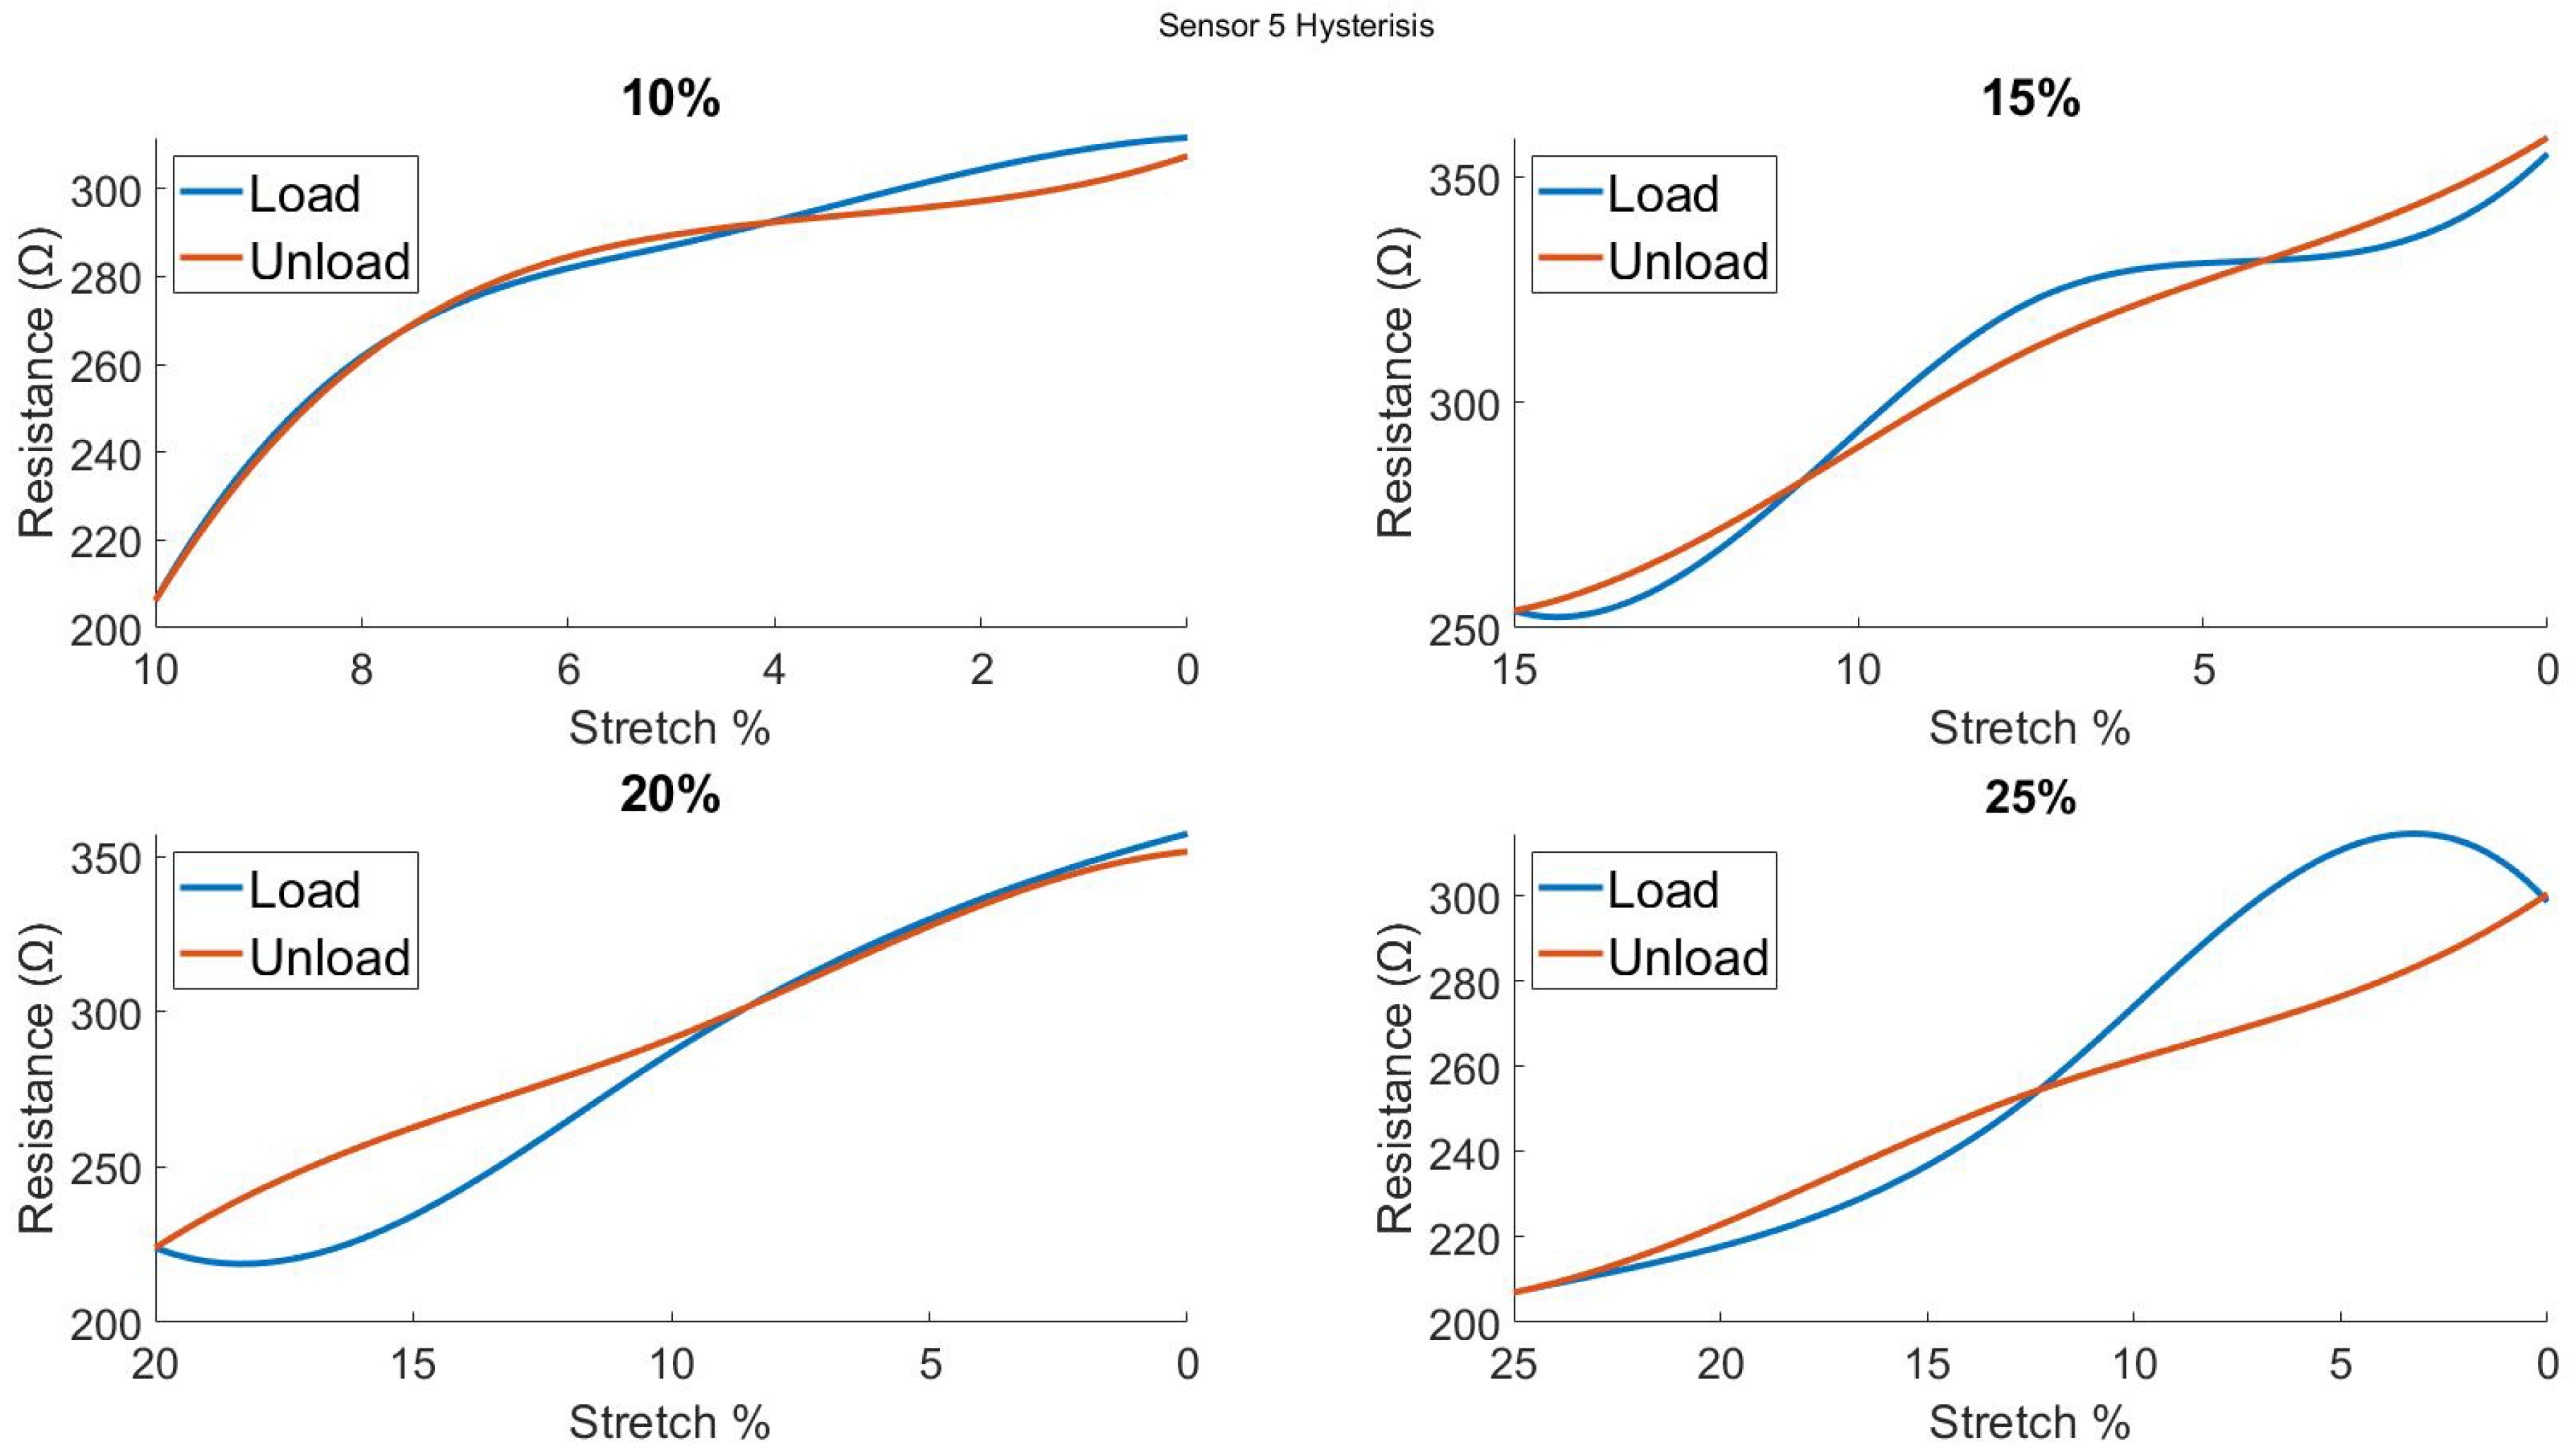
4.4. Hysteresis
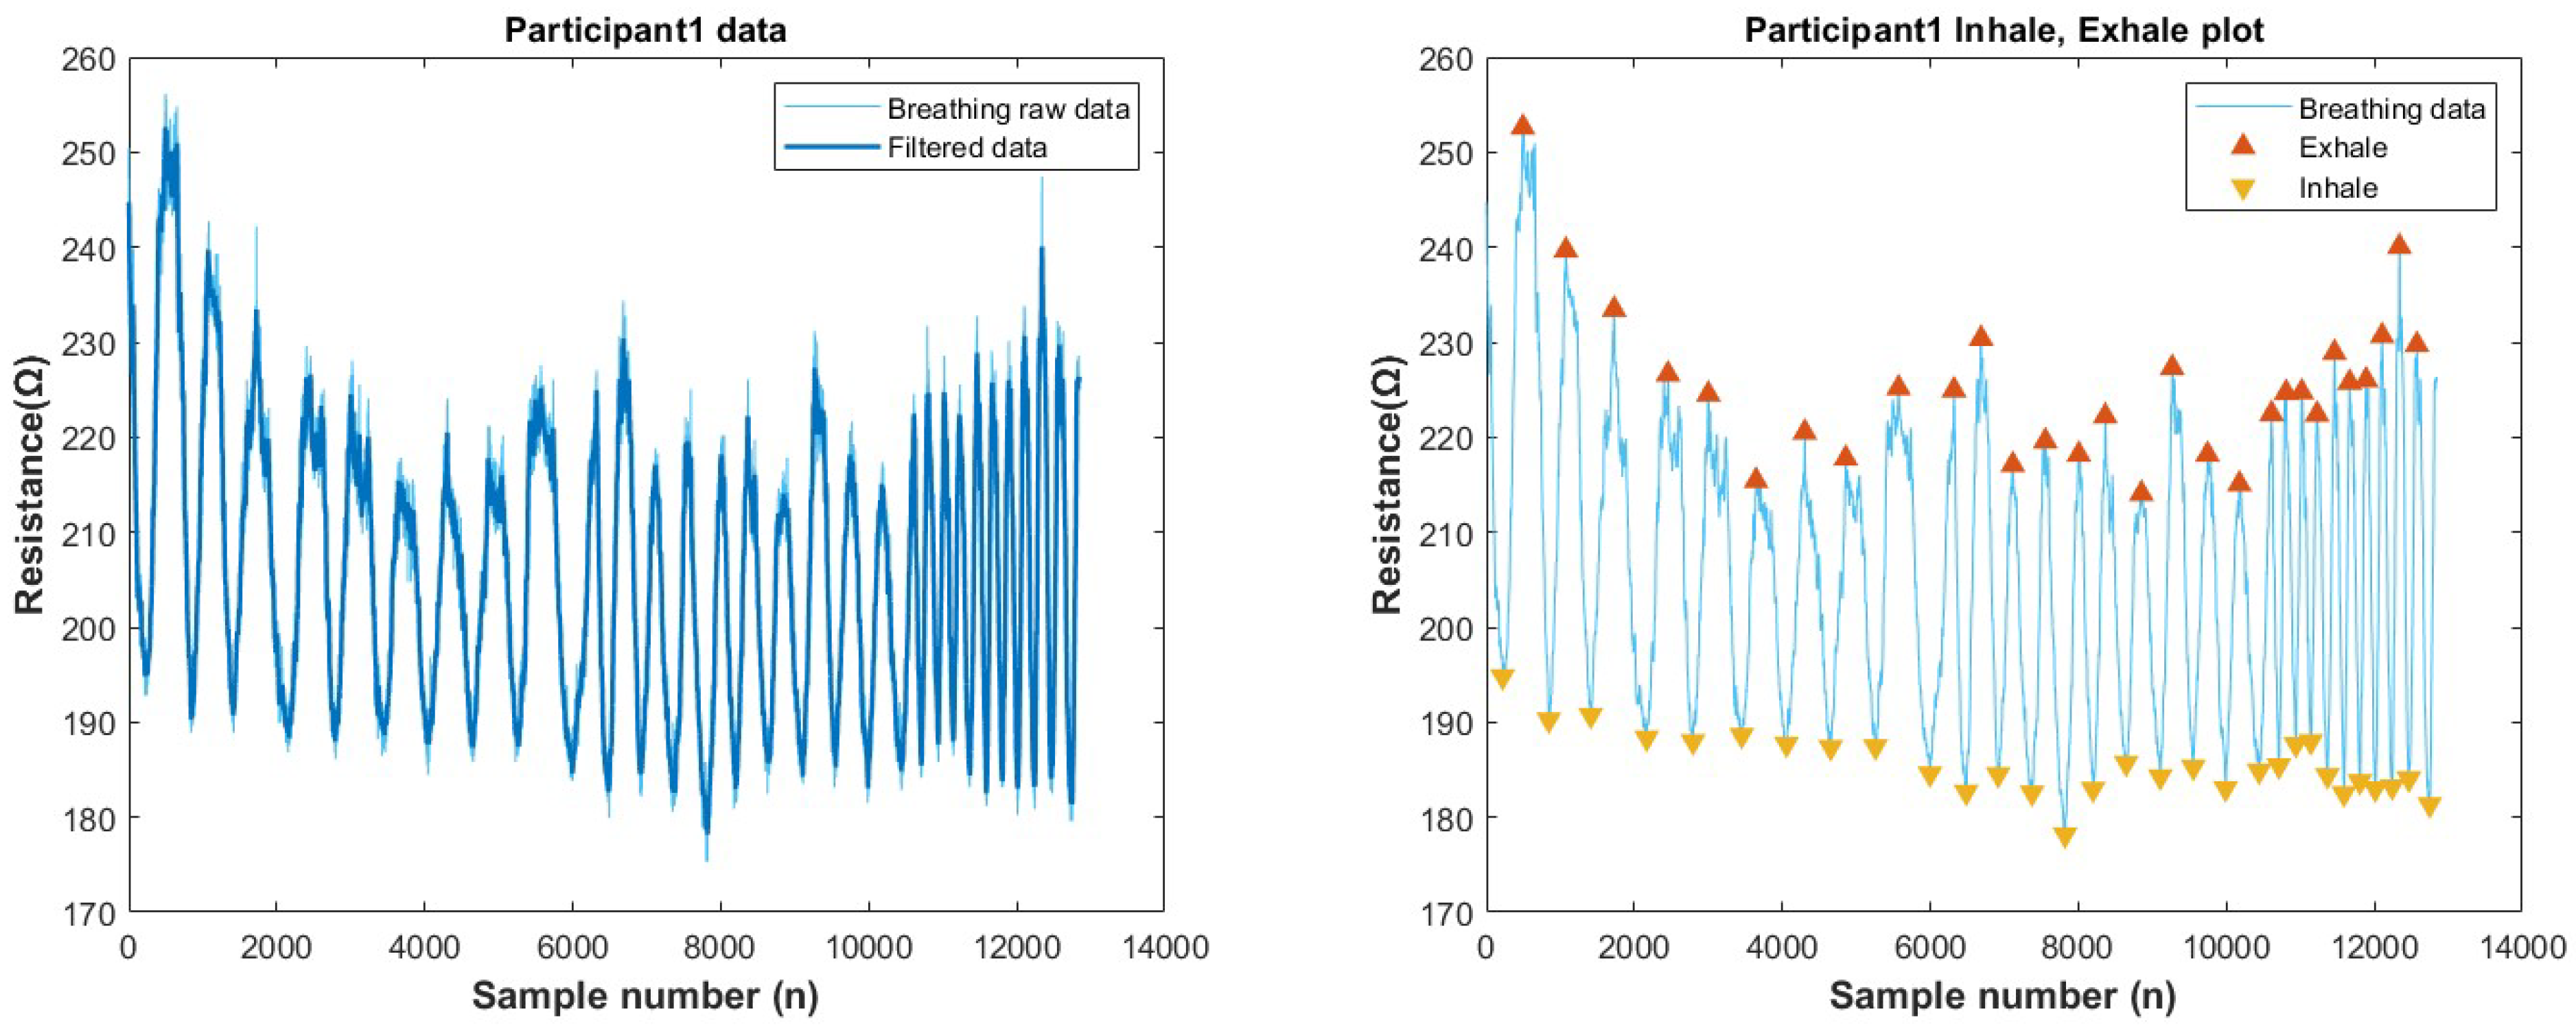
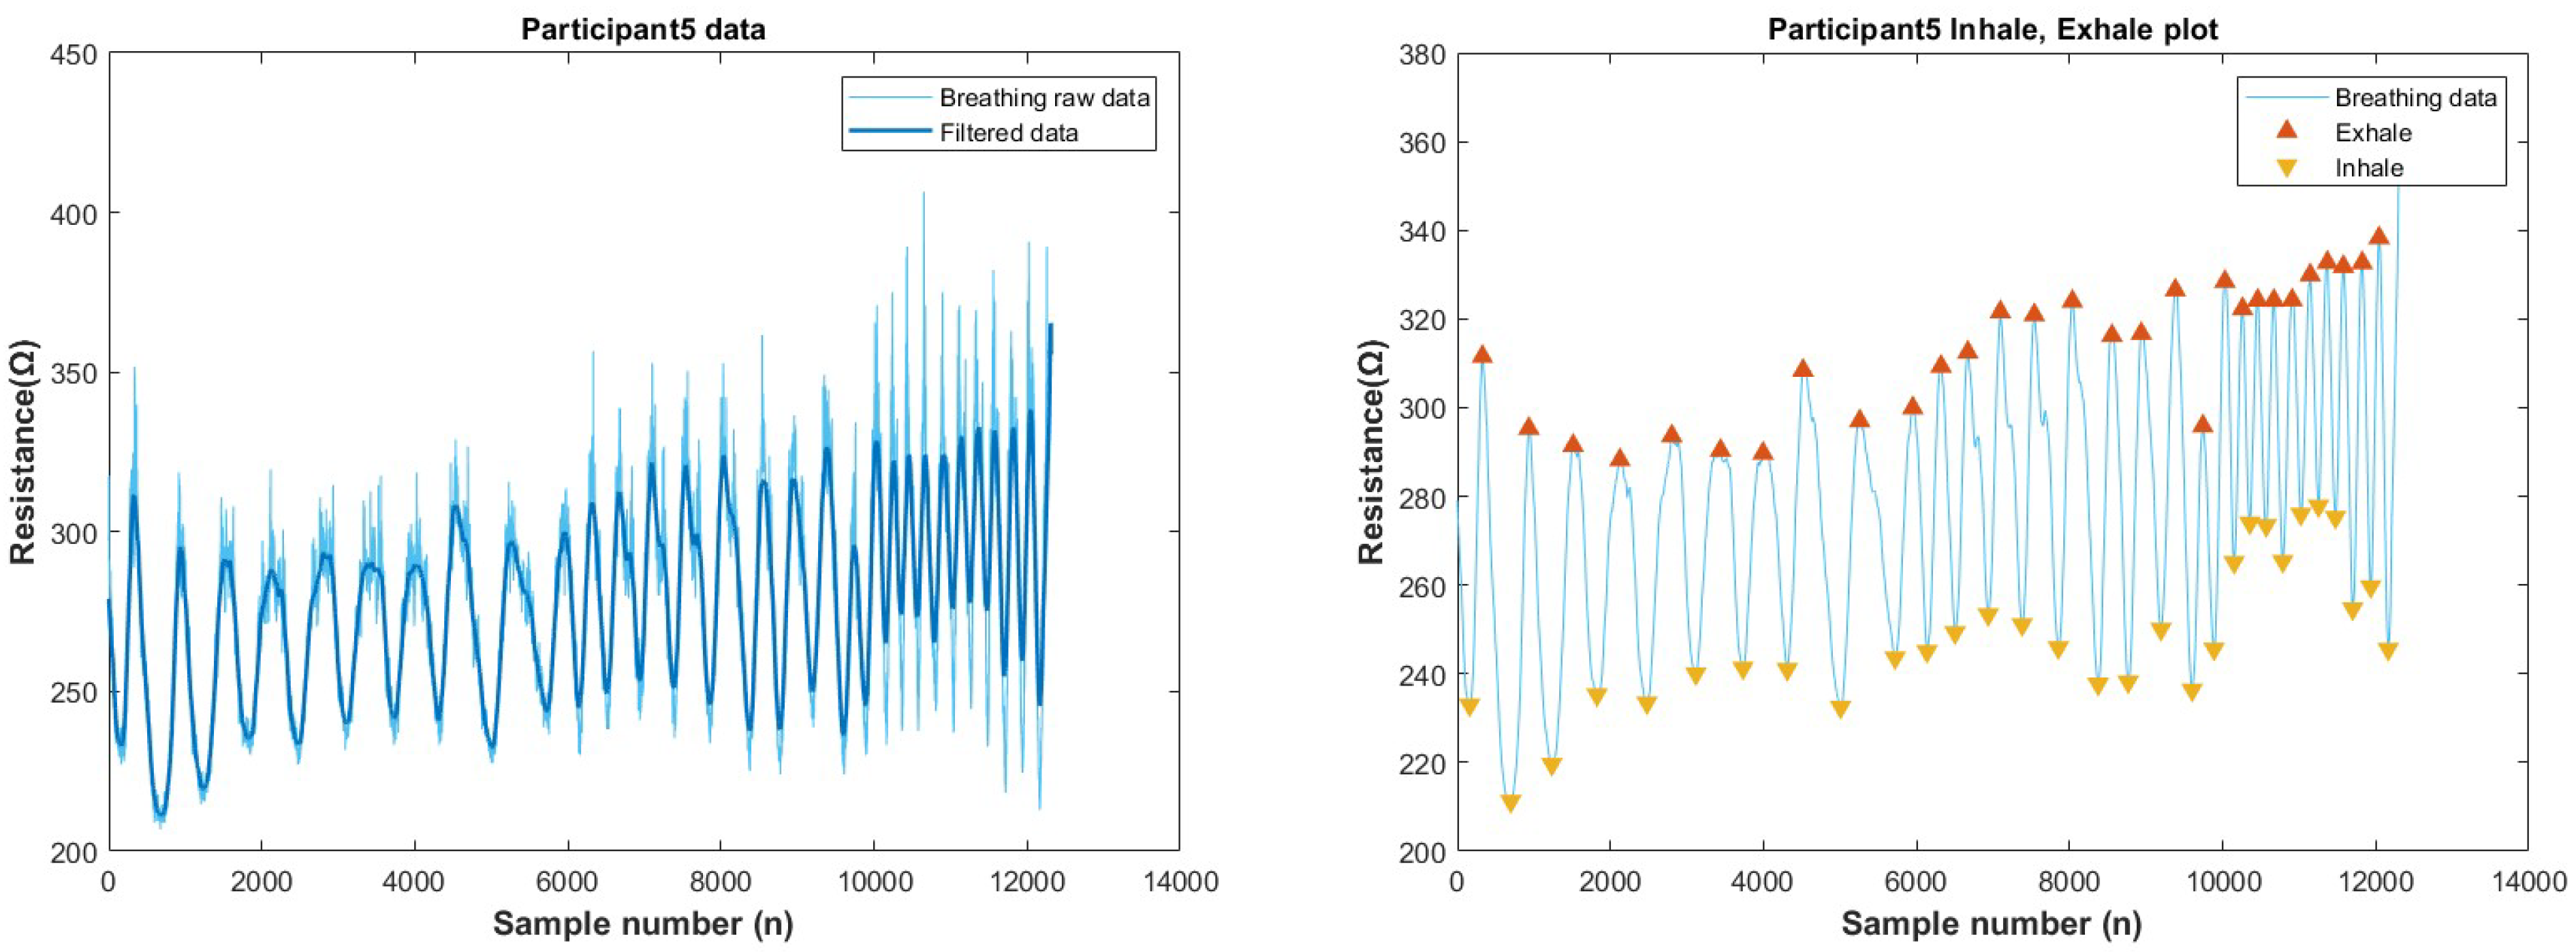
5. Sensor Testing—Regulated Respiration Monitoring
5.1. Testing Protocol
5.2. Data Acquisition System
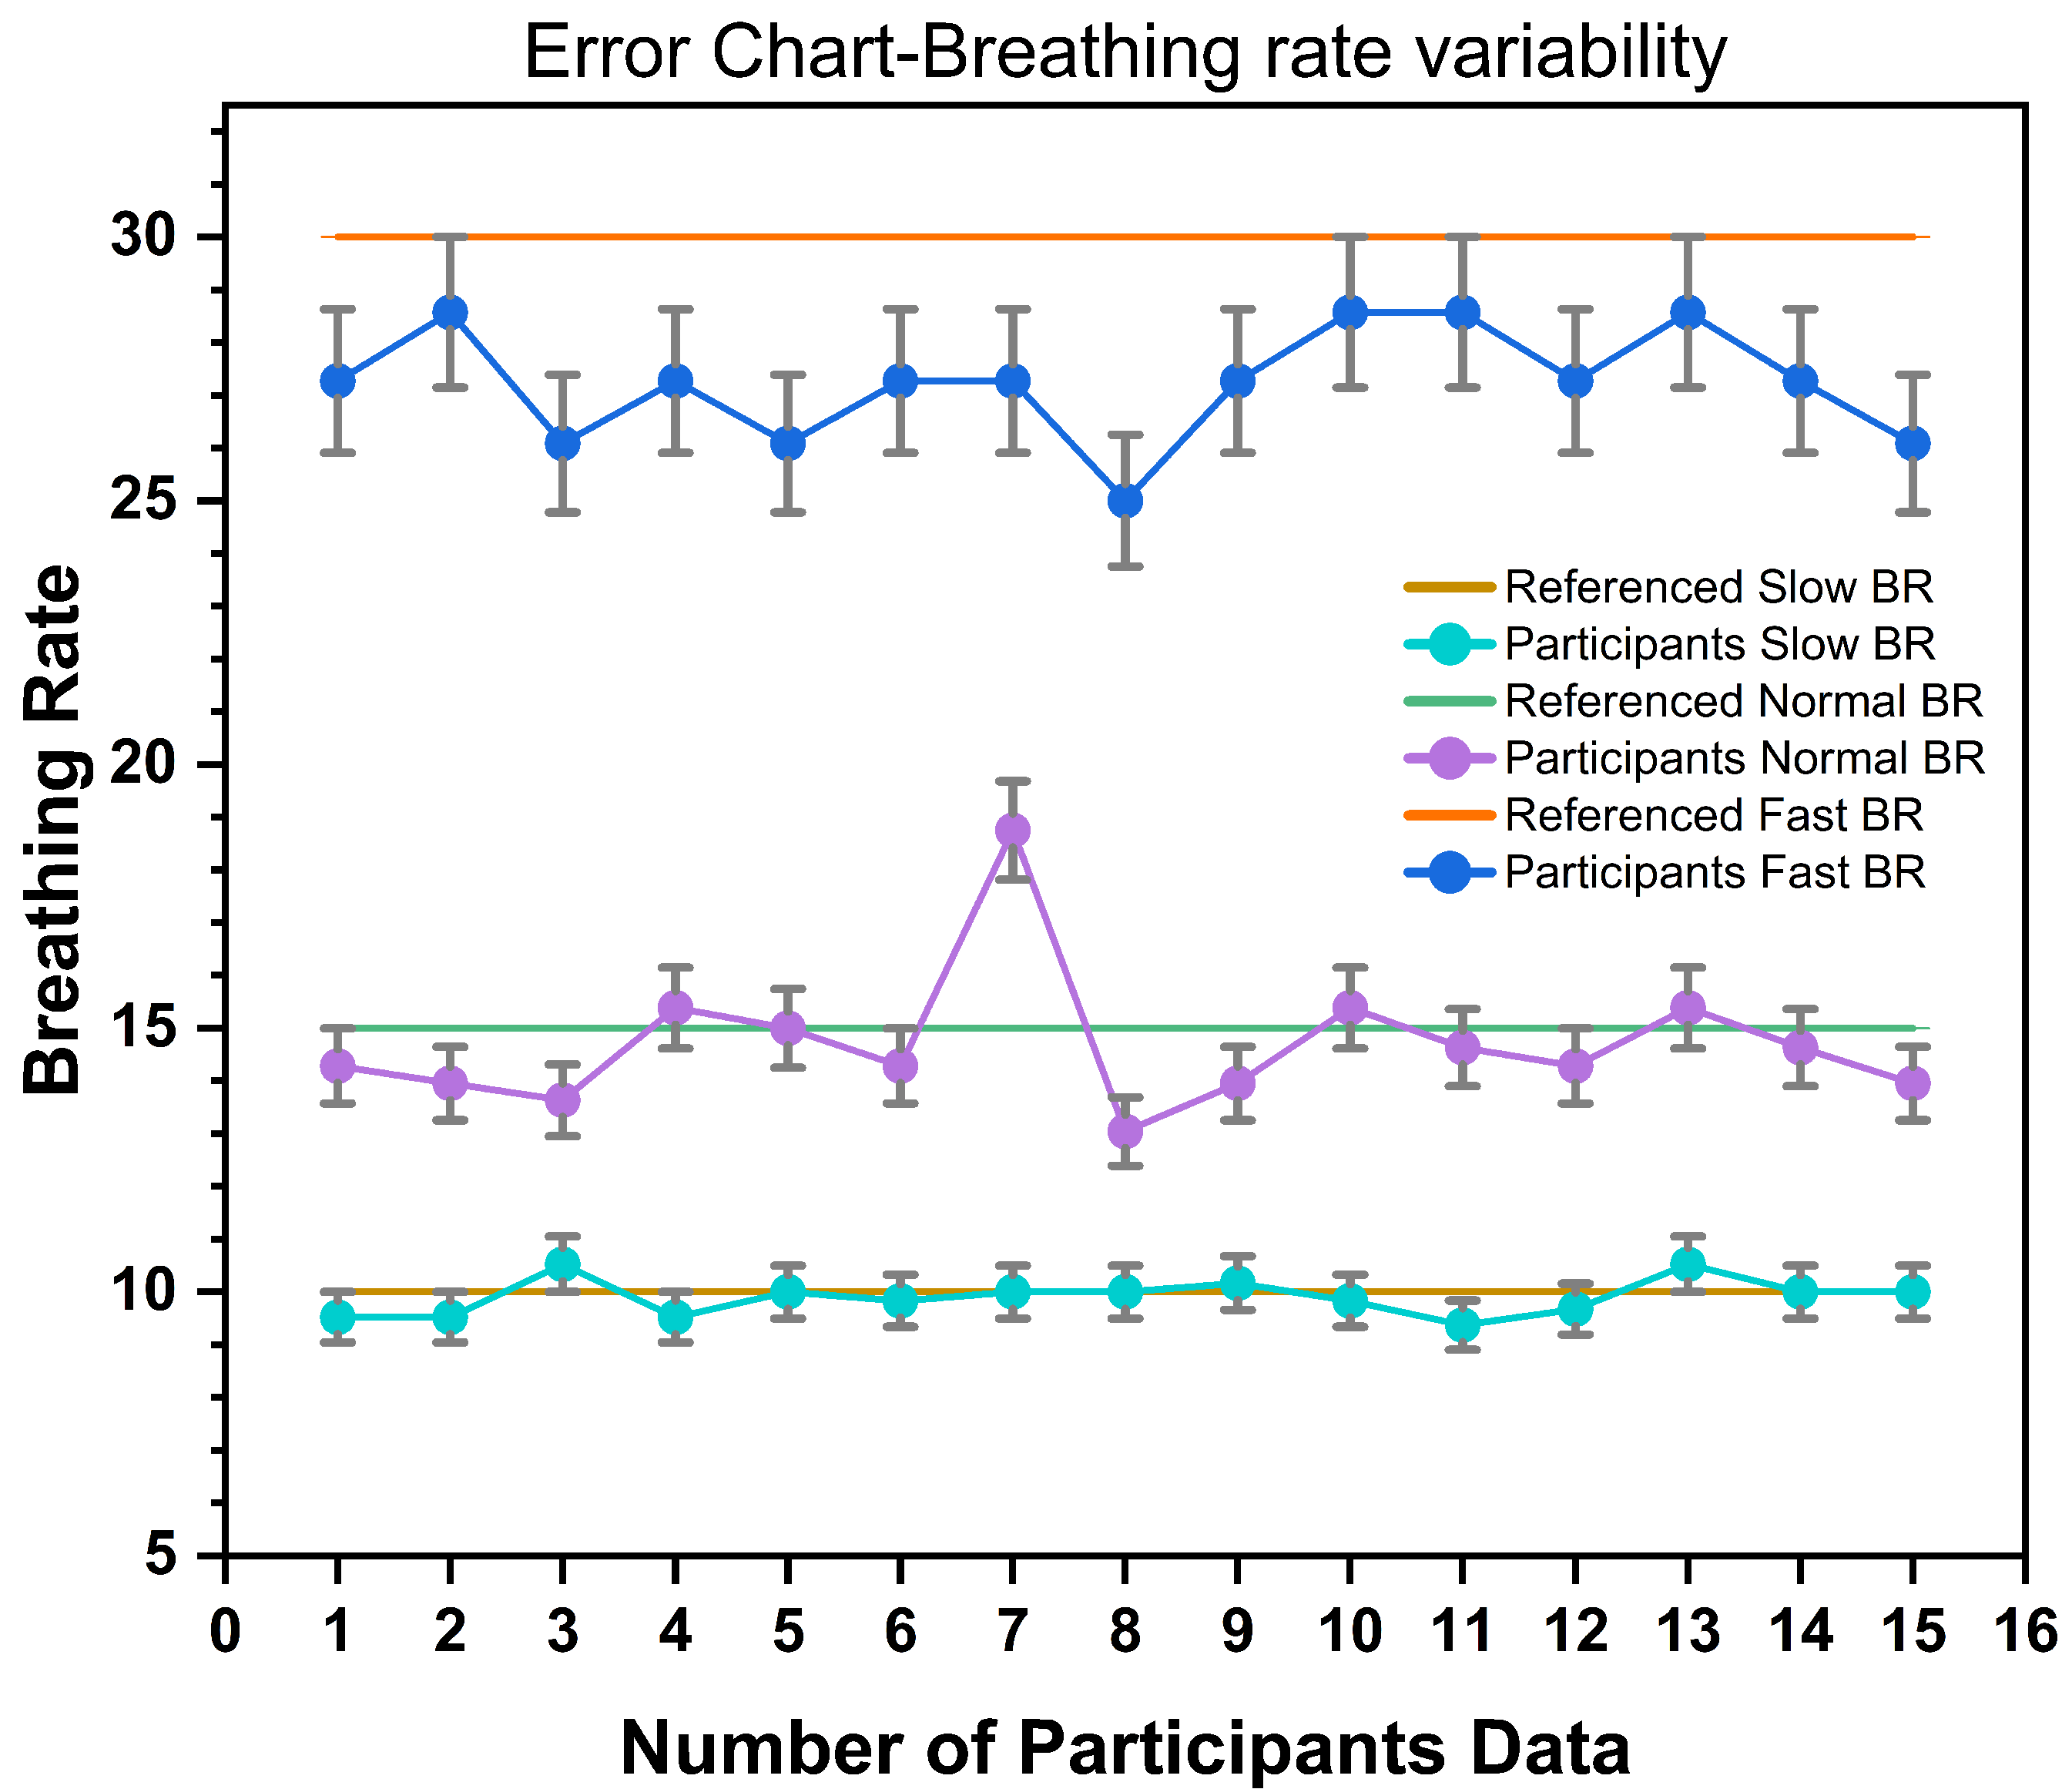
5.3. Test Result
6. Conclusions
Author Contributions
Funding
Institutional Review Board Statement
Informed Consent Statement
Data Availability Statement
Acknowledgments
Conflicts of Interest
Appendix A. Result
Appendix A.1. Durability Test


Appendix A.2. Salt-Fog Test


Appendix A.3. Hysteresis


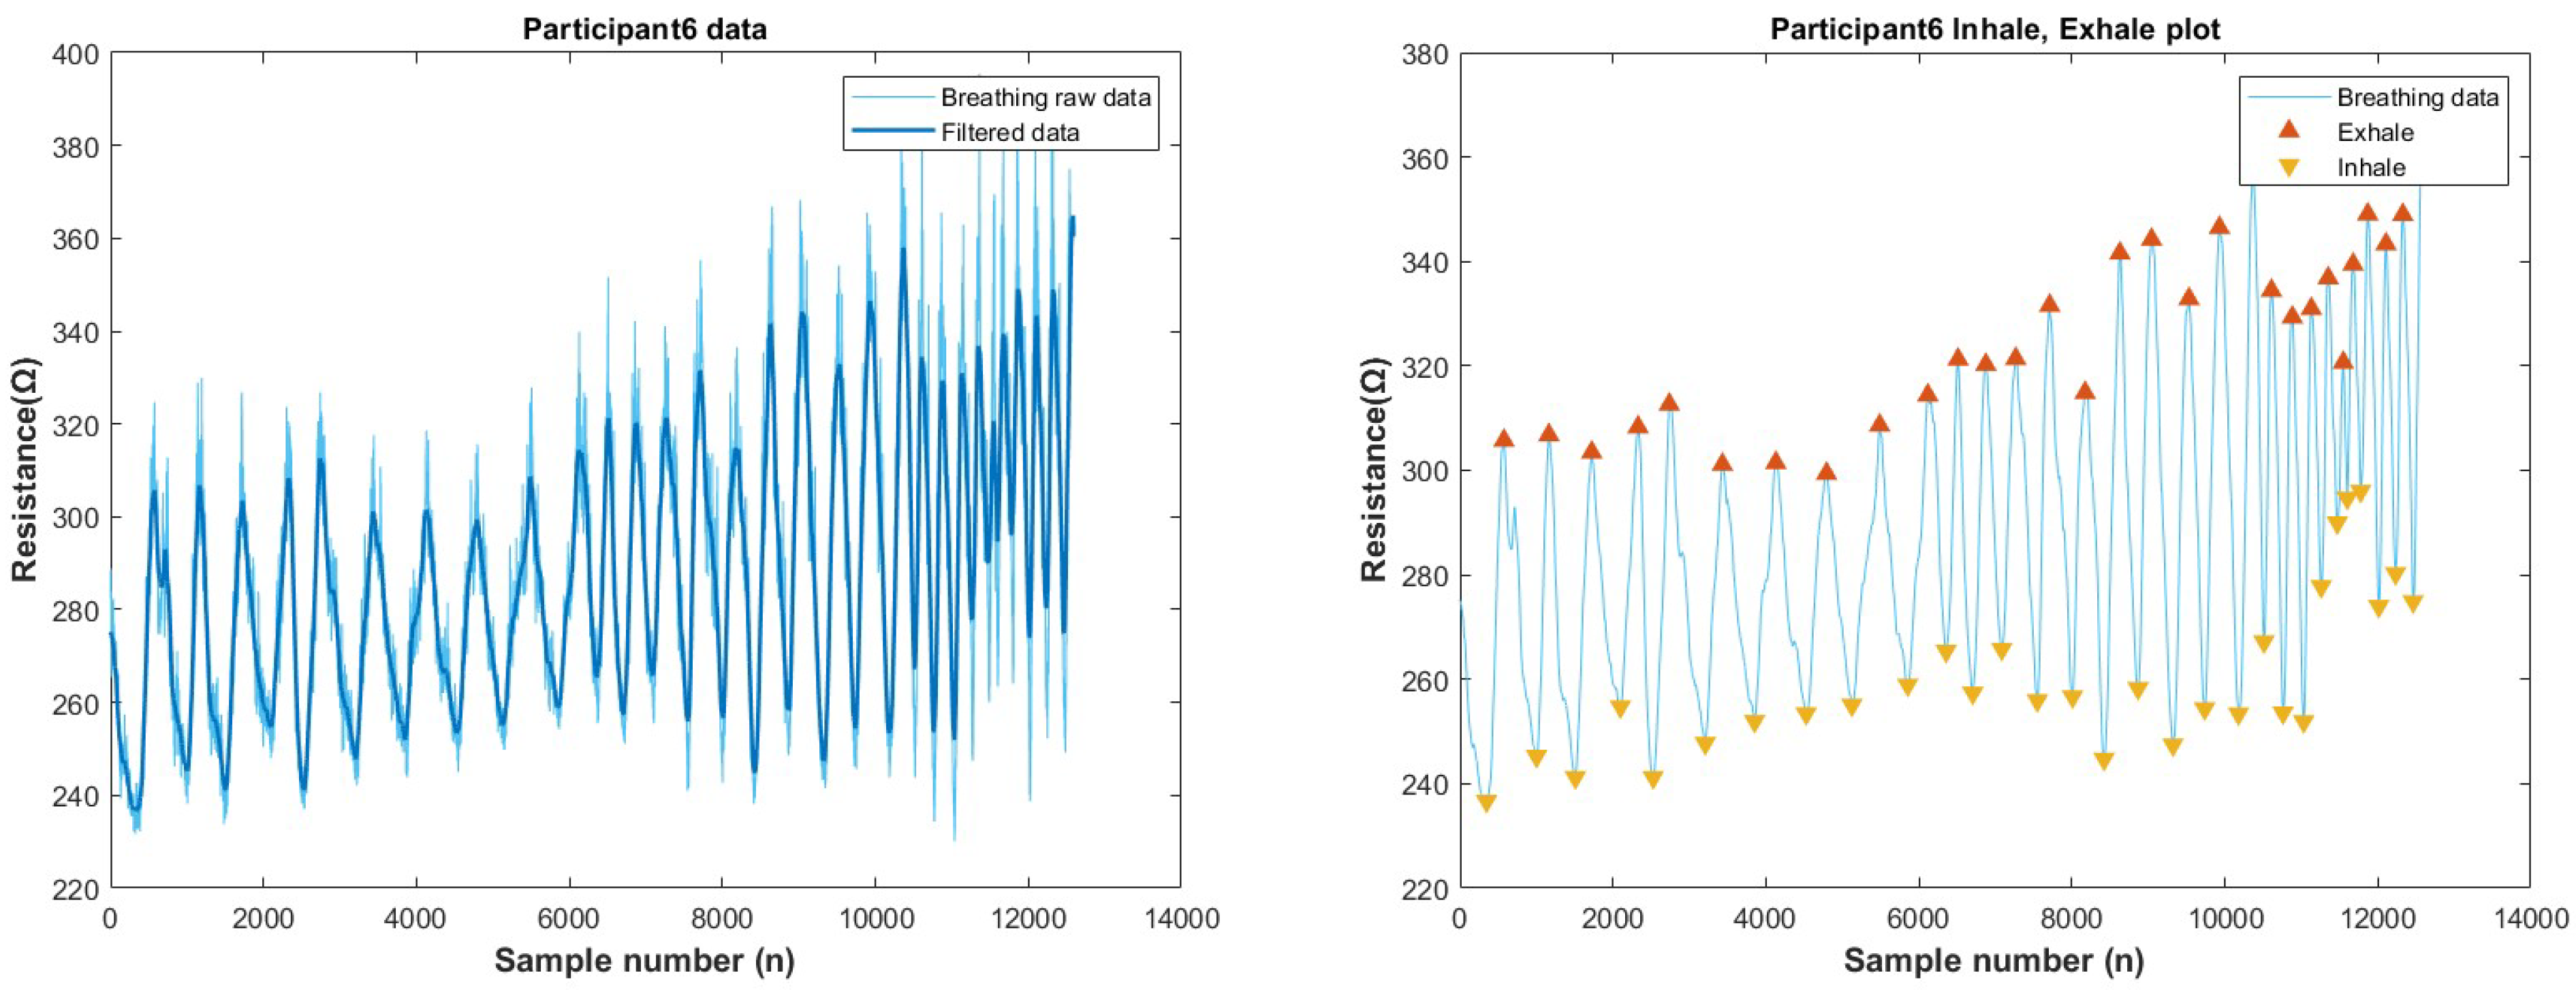
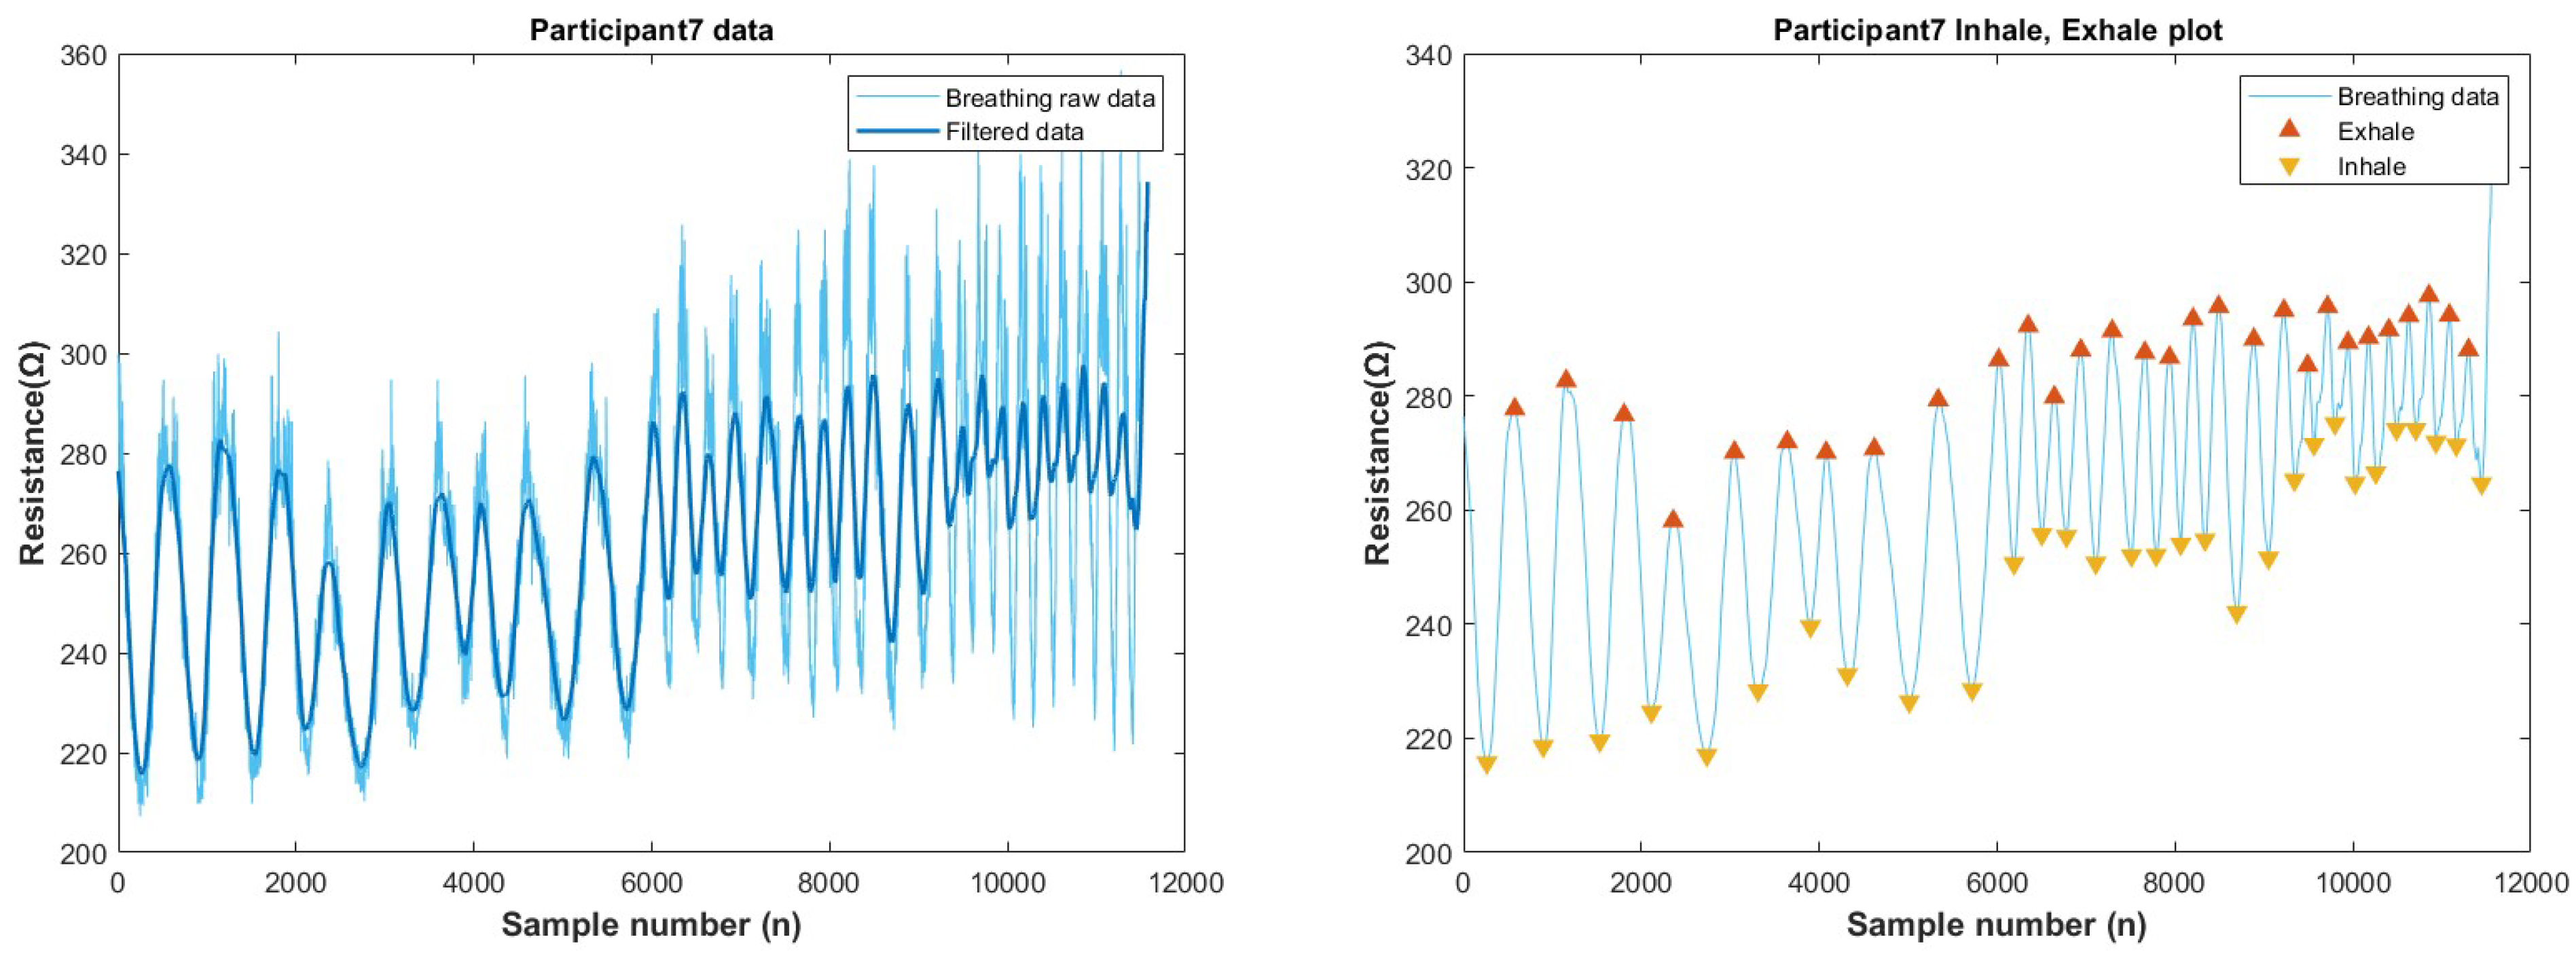
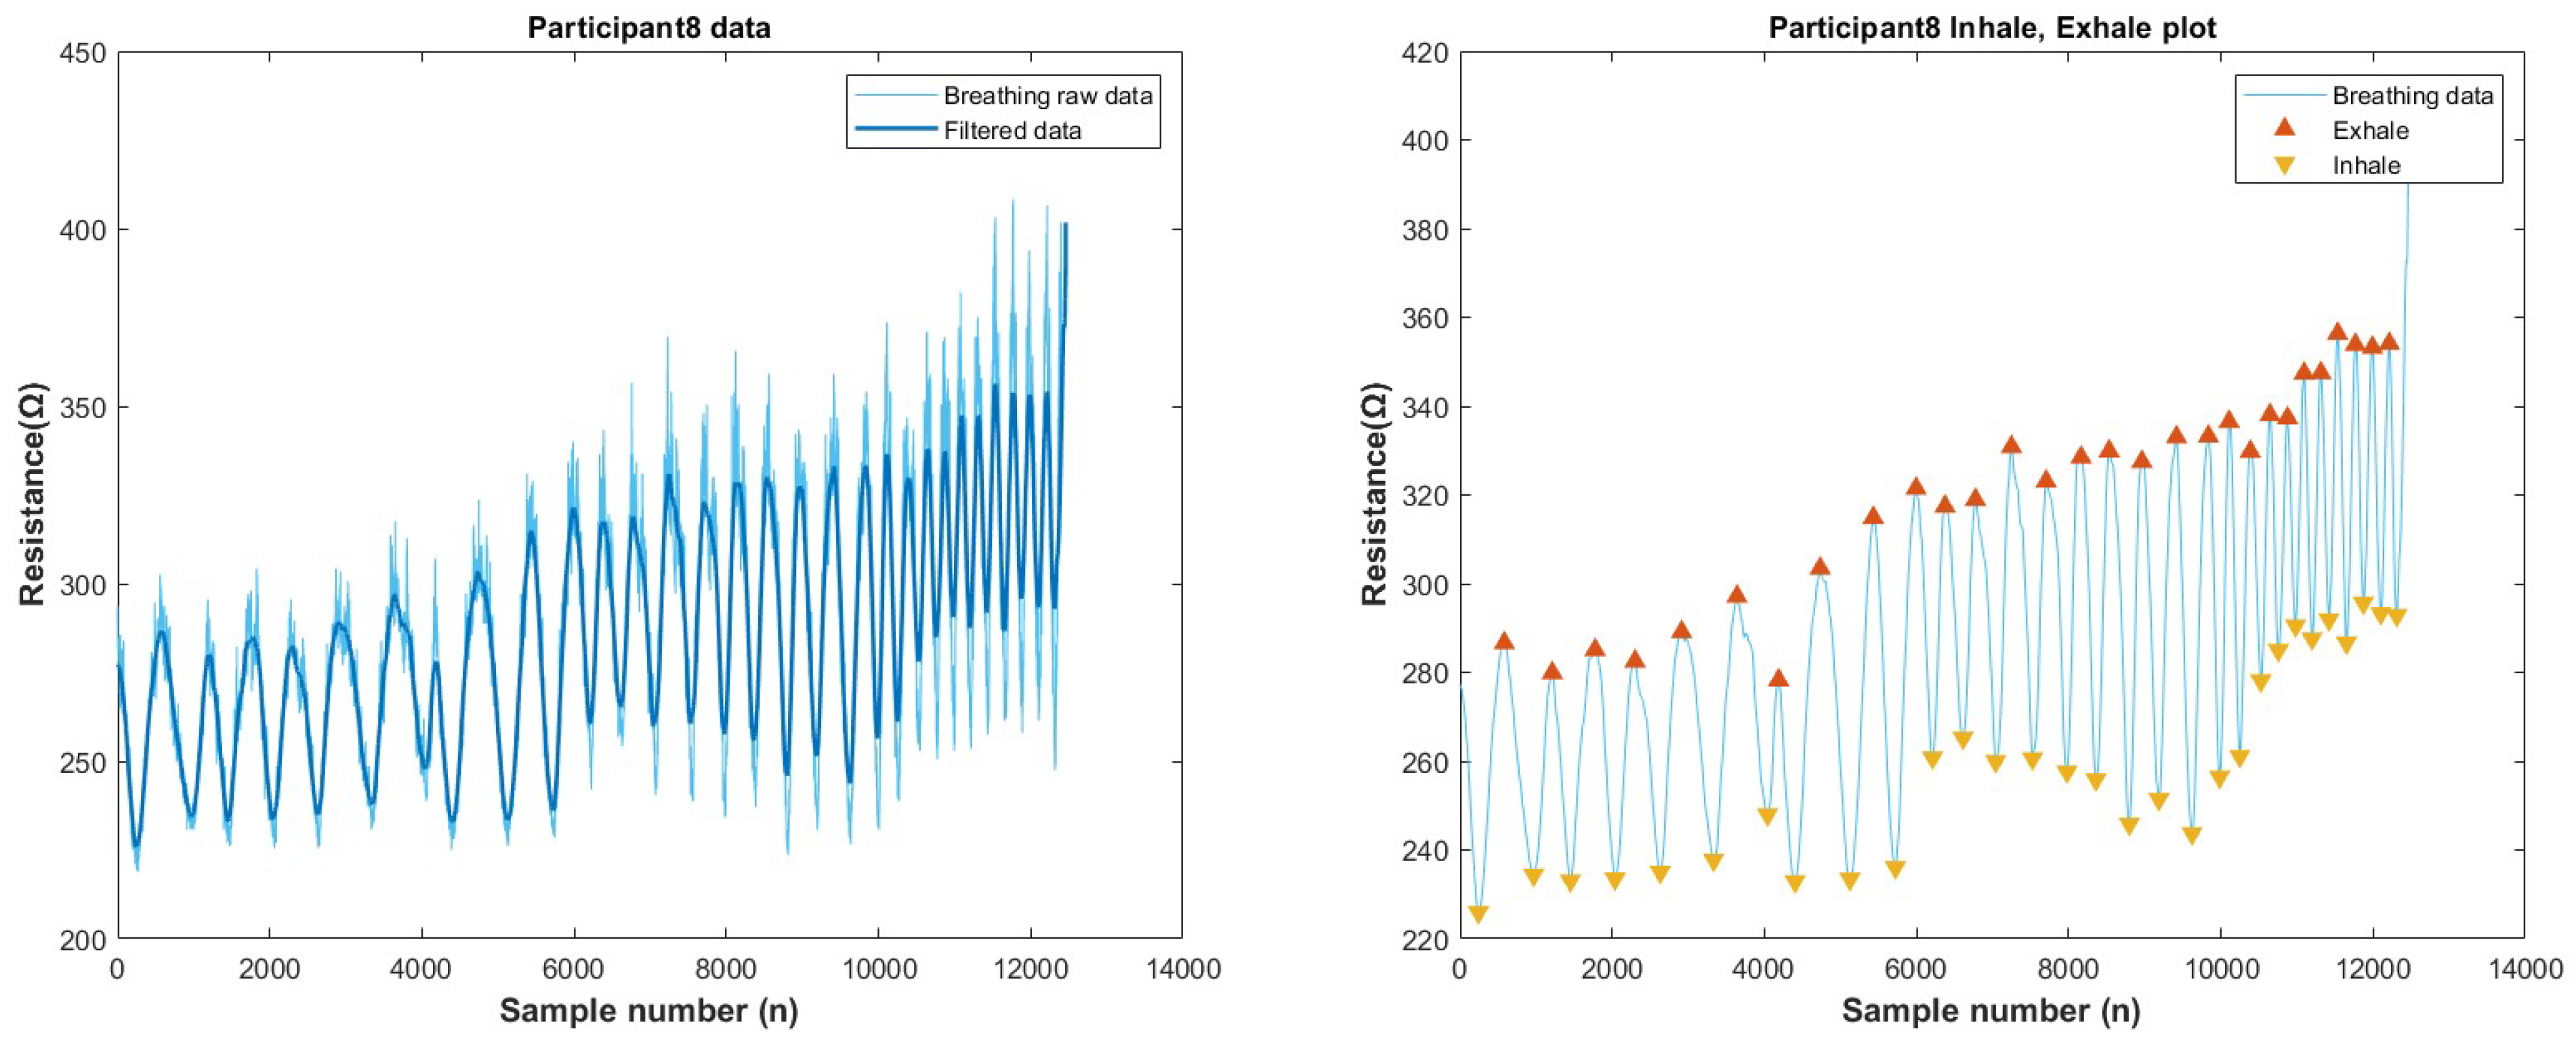
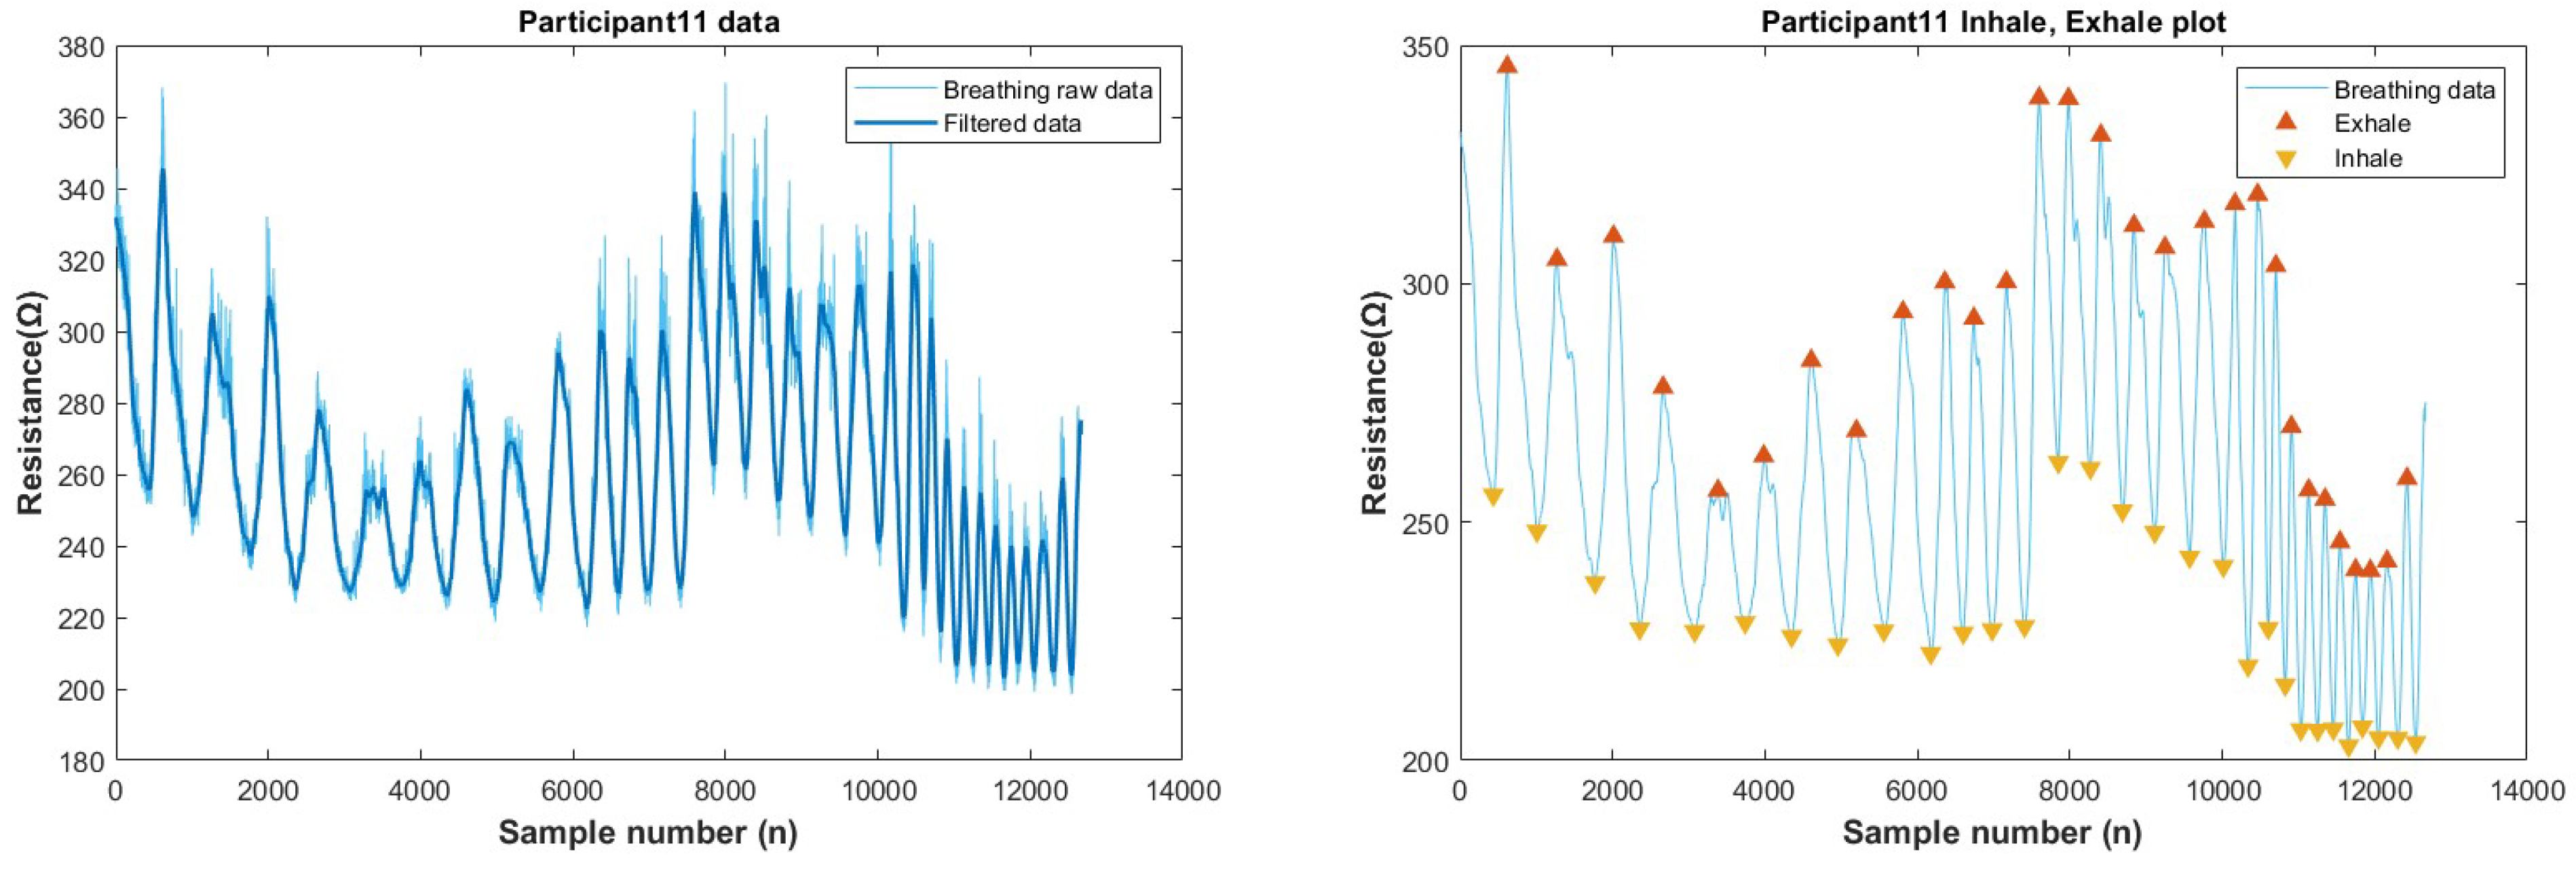
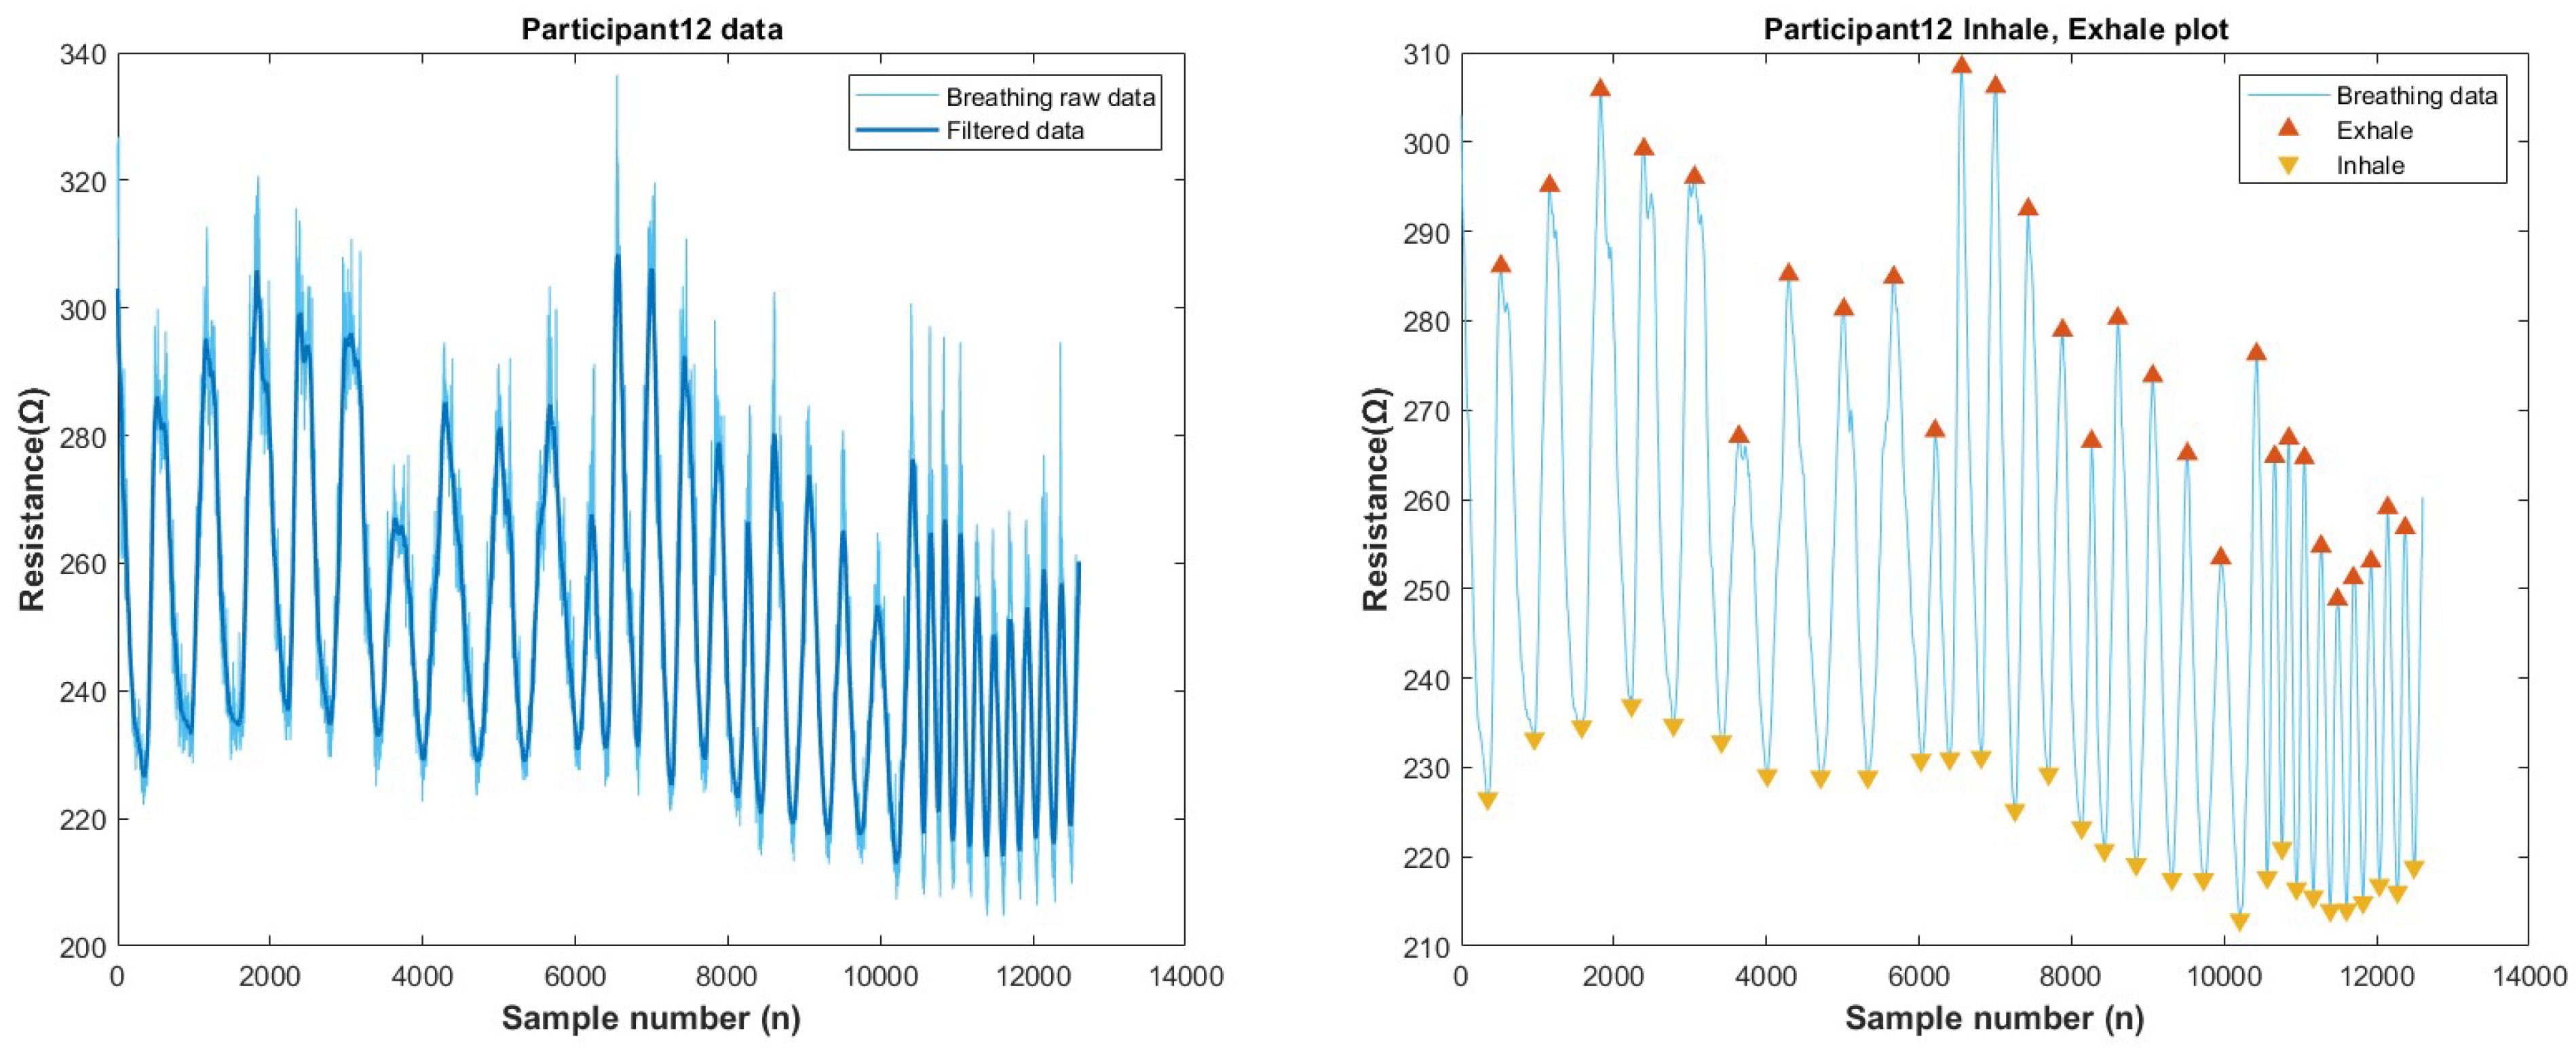
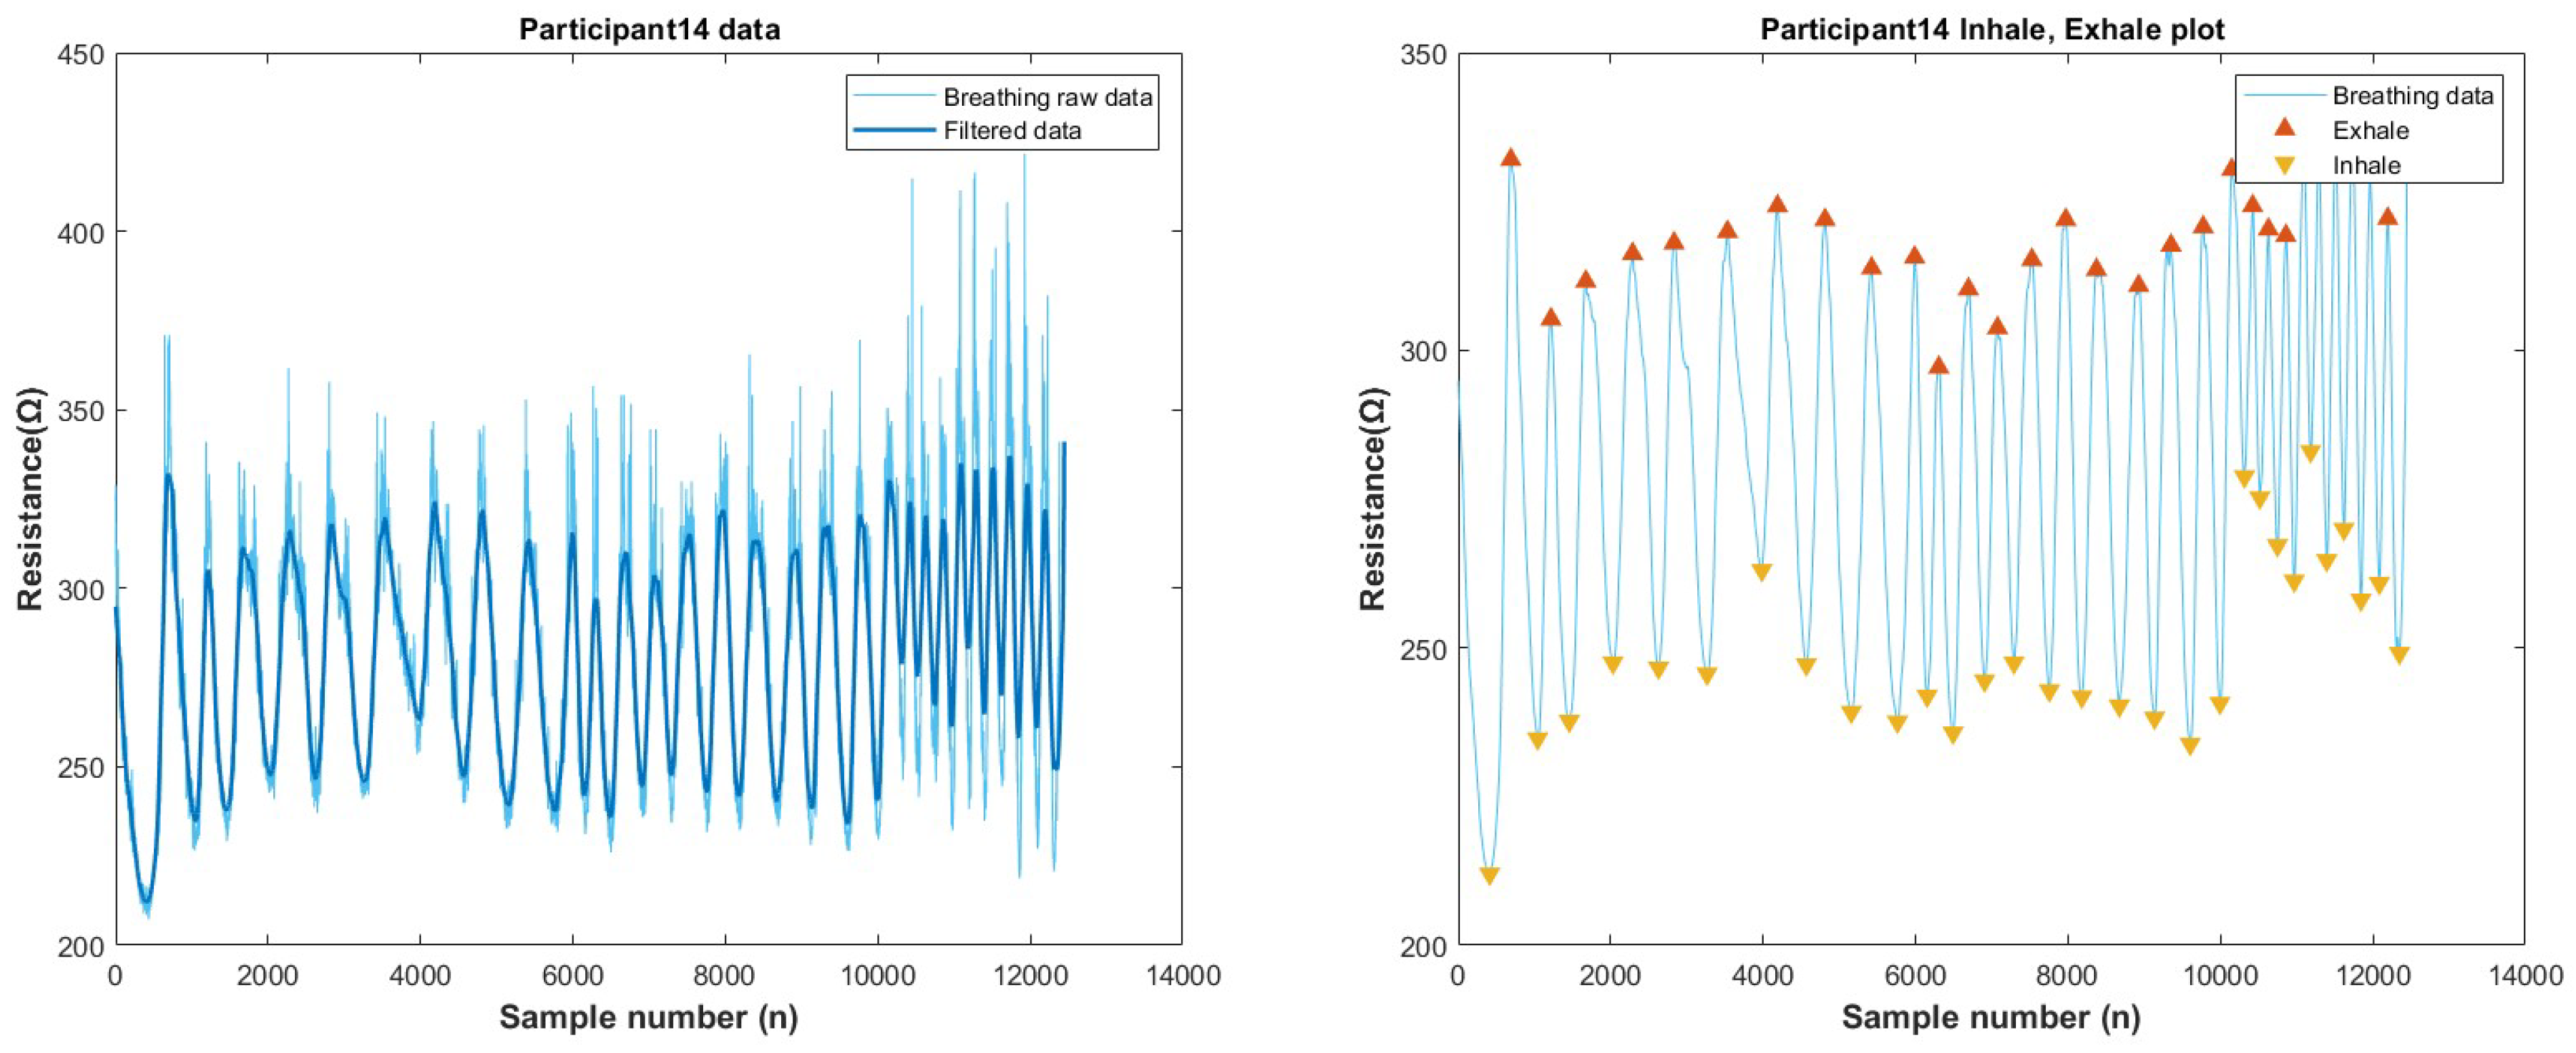
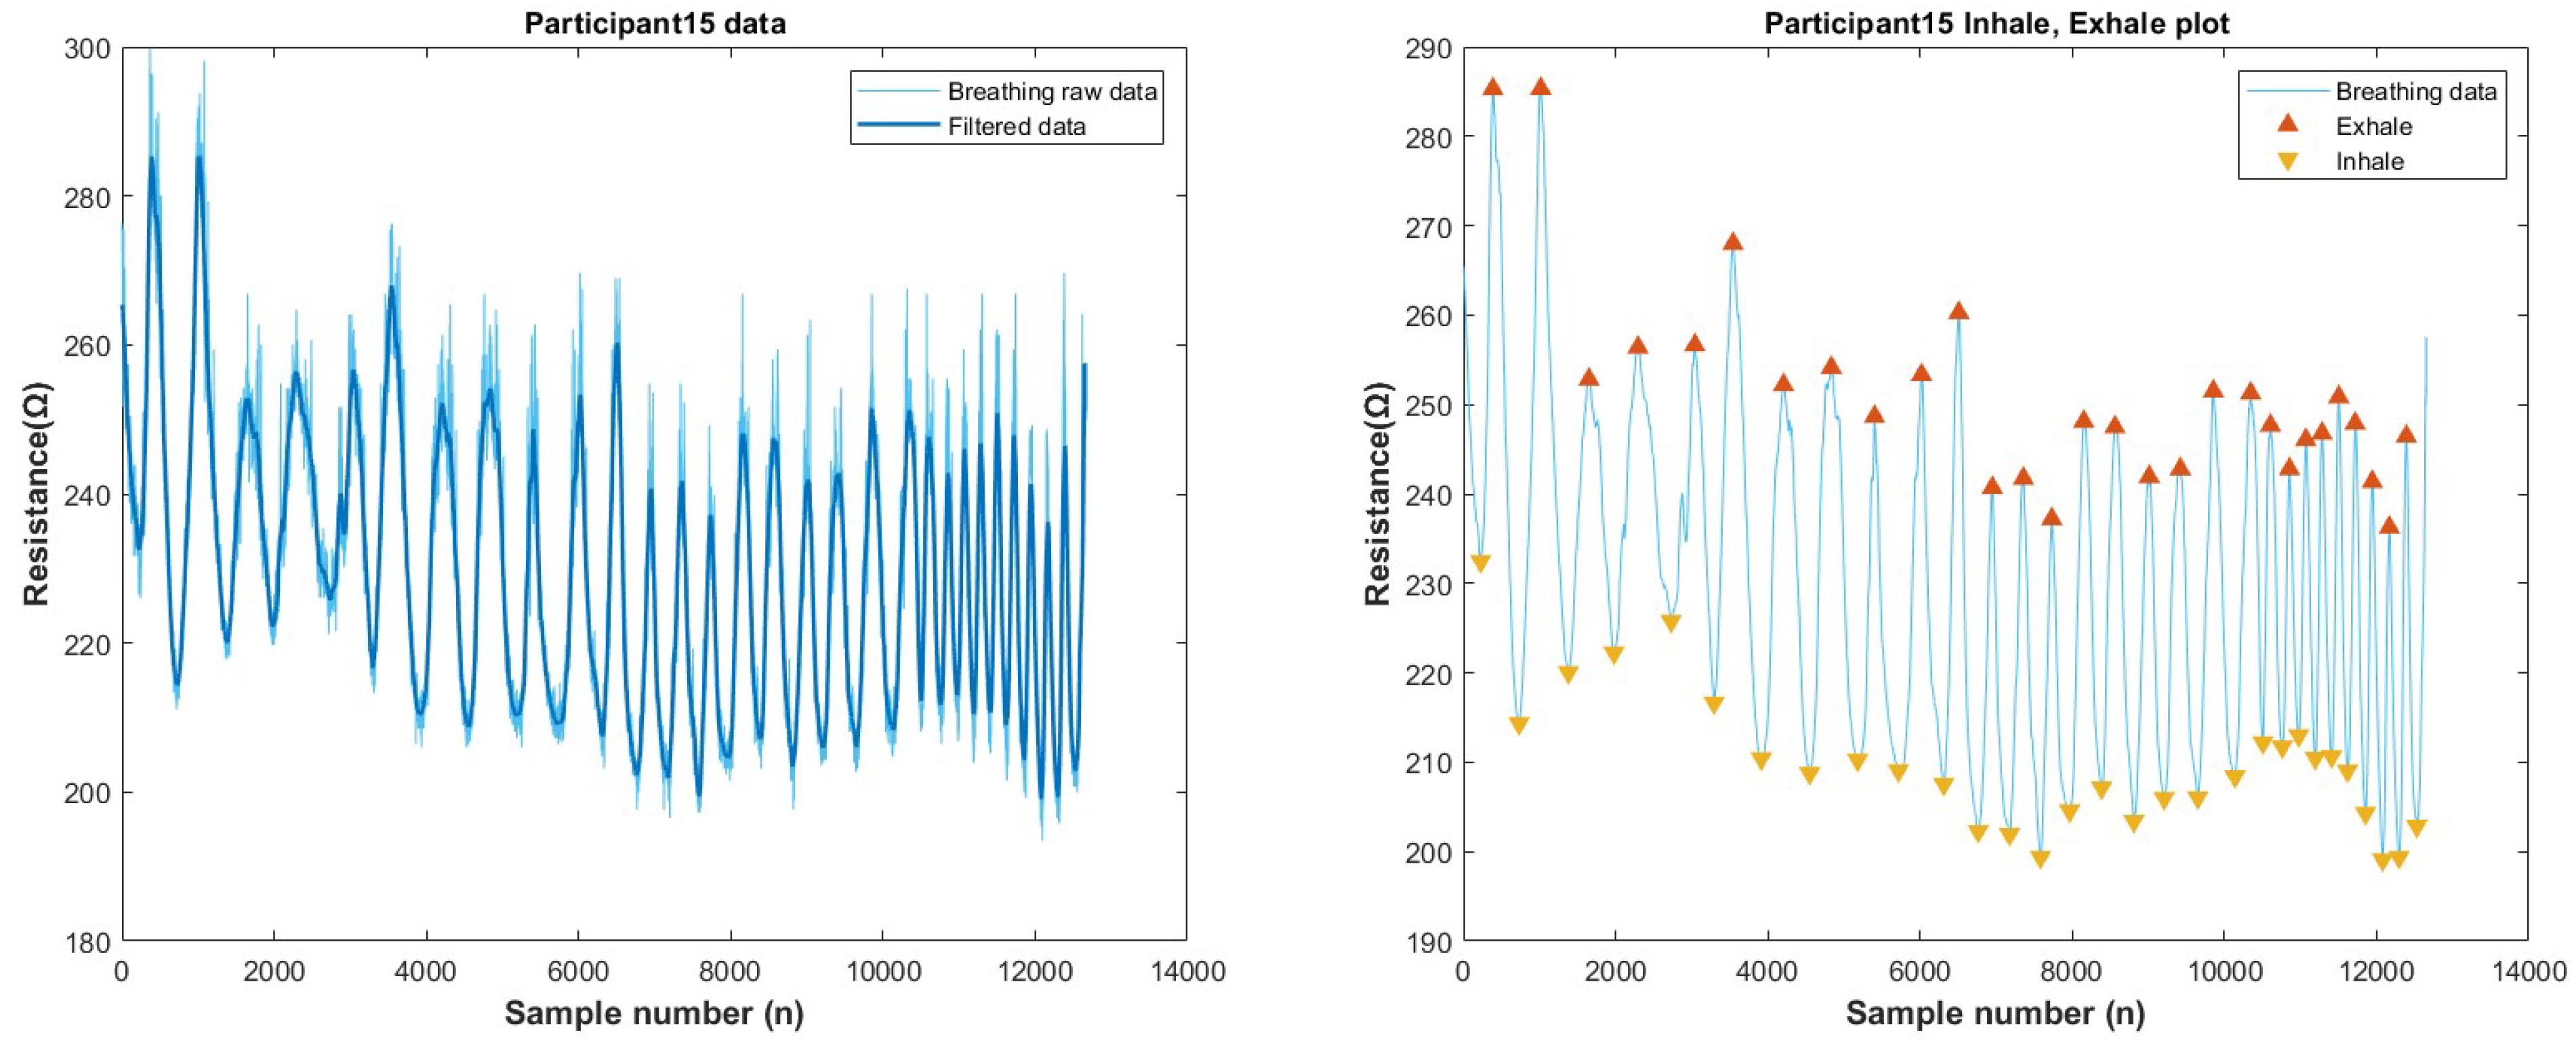
Appendix A.4. Participant’s Breathing Test


References
- Shi, J.; Liu, S.; Zhang, L.; Yang, B.; Shu, L.; Yang, Y.; Ren, M.; Wang, Y.; Chen, J.; Chen, W.; et al. Smart textile-integrated microelectronic systems for wearable applications. Adv. Mater. 2020, 32, 1901958. [Google Scholar] [CrossRef] [PubMed]
- Grancarić, A.M.; Jerković, I.; Koncar, V.; Cochrane, C.; Kelly, F.M.; Soulat, D.; Legrand, X. Conductive polymers for smart textile applications. J. Ind. Text. 2018, 48, 612–642. [Google Scholar] [CrossRef]
- Ahmed, A.; Hossain, M.M.; Adak, B.; Mukhopadhyay, S. Recent advances in 2D MXene integrated smart-textile interfaces for multifunctional applications. Chem. Mater. 2020, 32, 10296–10320. [Google Scholar] [CrossRef]
- Angelucci, A.; Cavicchioli, M.; Cintorrino, I.A.; Lauricella, G.; Rossi, C.; Strati, S.; Aliverti, A. Smart textiles and sensorized garments for physiological monitoring: A review of available solutions and techniques. Sensors 2021, 21, 814. [Google Scholar] [CrossRef]
- Cherenack, K.; Van Pieterson, L. Smart textiles: Challenges and opportunities. J. Appl. Phys. 2012, 112, 091301. [Google Scholar] [CrossRef] [Green Version]
- Simegnaw, A.A.; Malengier, B.; Rotich, G.; Tadesse, M.G.; Van Langenhove, L. Review on the Integration of Microelectronics for E-Textile. Materials 2021, 14, 5113. [Google Scholar] [CrossRef]
- Gehrke, I.; Tenner, V.; Lutz, V.; Schmelzeisen, D.; Gries, T. Smart Textiles Production: Overview of Materials, Sensor and Production Technologies for Industrial Smart Textiles; MDPI Books: Basel, Switzerland, 2019. [Google Scholar]
- Xiao, Y.; Li, Q.; Zhang, C.; Zhang, W.; Yun, W.; Yang, L. Fabrication of Silver Electrical Circuits on Textile Substrates by Reactive Inkjet Printing. IEEE Sens. J. 2022, 22, 11056–11064. [Google Scholar] [CrossRef]
- Zhao, J.; Fu, Y.; Xiao, Y.; Dong, Y.; Wang, X.; Lin, L. A naturally integrated smart textile for wearable electronics applications. Adv. Mater. Technol. 2020, 5, 1900781. [Google Scholar] [CrossRef]
- al Rumon, M.A.; Shahariar, H. Fabrication of interdigitated capacitor on fabric as tactile sensor. Sens. Int. 2021, 2, 100086. [Google Scholar] [CrossRef]
- Tseghai, G.B.; Malengier, B.; Fante, K.A.; Nigusse, A.B.; Van Langenhove, L. Integration of conductive materials with textile structures, an overview. Sensors 2020, 20, 6910. [Google Scholar] [CrossRef]
- Tao, X. Electrical textile sensors for repeated large deformation: Structures and electromechanical properties. In Proceedings of the ICEM 2008: International Conference on Experimental Mechanics 2008, Nanjing, China, 8–11 November 2008; Volume 7375, pp. 1043–1047. [Google Scholar]
- Husain, M.D.; Kennon, R.; Dias, T. Design and fabrication of temperature sensing fabric. J. Ind. Text. 2014, 44, 398–417. [Google Scholar] [CrossRef]
- Atalay, O.; Kennon, W.R.; Demirok, E. Weft-knitted strain sensor for monitoring respiratory rate and its electro-mechanical modeling. IEEE Sens. J. 2014, 15, 110–122. [Google Scholar] [CrossRef]
- Castano, L.M.; Flatau, A.B. Smart fabric sensors and e-textile technologies: A review. Smart Mater. Struct. 2014, 23, 053001. [Google Scholar] [CrossRef]
- Wu, J.; Zhou, D.; Too, C.O.; Wallace, G.G. Conducting polymer coated lycra. Synth. Met. 2005, 155, 698–701. [Google Scholar] [CrossRef]
- Munro, B.J.; Campbell, T.E.; Wallace, G.G.; Steele, J.R. The intelligent knee sleeve: A wearable biofeedback device. Sens. Actuators B Chem. 2008, 131, 541–547. [Google Scholar] [CrossRef]
- Yue, B.; Wang, C.; Ding, X.; Wallace, G.G. Polypyrrole coated nylon lycra fabric as stretchable electrode for supercapacitor applications. Electrochim. Acta 2012, 68, 18–24. [Google Scholar] [CrossRef] [Green Version]
- Yang, Z.; Pang, Y.; Han, X.l.; Yang, Y.; Ling, J.; Jian, M.; Zhang, Y.; Yang, Y.; Ren, T.L. Graphene textile strain sensor with negative resistance variation for human motion detection. ACS Nano 2018, 12, 9134–9141. [Google Scholar] [CrossRef]
- Wang, J.; Lu, C.; Zhang, K. Textile-based strain sensor for human motion detection. Energy Environ. Mater. 2020, 3, 80–100. [Google Scholar] [CrossRef] [Green Version]
- Shen, Z.; Liu, F.; Huang, S.; Wang, H.; Yang, C.; Hang, T.; Tao, J.; Xia, W.; Xie, X. Progress of flexible strain sensors for physiological signal monitoring. Biosens. Bioelectron. 2022, 211, 114298. [Google Scholar] [CrossRef]
- Da Silva, J.G.; De Carvalho, A.A.; de Oliveira Rodriges, R. High sensitivity low cost capacitive strain gage. In Proceedings of the 21st IEEE Instrumentation and Measurement Technology Conference (IEEE Cat. No. 04CH37510), Como, Italy, 18–20 May 2004; Volume 1, pp. 358–362. [Google Scholar]
- Ştefănescu, D.M. Strain gauges and Wheatstone bridges—Basic instrumentation and new applications for electrical measurement of non-electrical quantities. In Proceedings of the Eighth International Multi-Conference on Systems, Signals & Devices, Sousse, Tunisia, 22–25 March 2011; pp. 1–5. [Google Scholar]
- Chan, M.W.; Myers, D.R.; Sosnowchik, B.D.; Lin, L.; Pisano, A.P. Localized strain sensing using high spatial resolution, highly-sensitive MEMS resonant strain gauges for failure prevention. In Proceedings of the 2011 16th International Solid-State Sensors, Actuators and Microsystems Conference, Beijing, China, 5–9 June 2011; pp. 2859–2862. [Google Scholar]
- Seyedin, S.; Zhang, P.; Naebe, M.; Qin, S.; Chen, J.; Wang, X.; Razal, J.M. Textile strain sensors: A review of the fabrication technologies, performance evaluation and applications. Mater. Horizons 2019, 6, 219–249. [Google Scholar] [CrossRef]
- Gao, Y.; Li, Q.; Dong, A.; Wang, F.; Wang, X. Characterizing the resistance relaxation of the fabric-based resistive sensors based on an electro-mechanical model. Sens. Actuators A Phys. 2020, 310, 112041. [Google Scholar] [CrossRef]
- Atalay, O. Textile-based, interdigital, capacitive, soft-strain sensor for wearable applications. Materials 2018, 11, 768. [Google Scholar] [CrossRef] [PubMed] [Green Version]
- Zhang, R.Q.; Li, J.Q.; Li, D.J.; Xu, J.J. Study of the structural design and capacitance characteristics of fabric sensor. In Advanced Materials Research; Trans Tech Publ: Sanya, China, 2011; Volume 194, pp. 1489–1495. [Google Scholar]
- Sadeqi, A.; Nejad, H.R.; Alaimo, F.; Yun, H.; Punjiya, M.; Sonkusale, S.R. Washable smart threads for strain sensing fabrics. IEEE Sens. J. 2018, 18, 9137–9144. [Google Scholar] [CrossRef]
- Souri, H.; Bhattacharyya, D. Wearable strain sensors based on electrically conductive natural fiber yarns. Mater. Des. 2018, 154, 217–227. [Google Scholar] [CrossRef]
- Sun, H.; Dai, K.; Zhai, W.; Zhou, Y.; Li, J.; Zheng, G.; Li, B.; Liu, C.; Shen, C. A highly sensitive and stretchable yarn strain sensor for human motion tracking utilizing a wrinkle-assisted crack structure. ACS Appl. Mater. Interfaces 2019, 11, 36052–36062. [Google Scholar] [CrossRef]
- Si, S.; Sun, C.; Qiu, J.; Liu, J.; Yang, J. Knitting integral conformal all-textile strain sensor with commercial apparel characteristics for smart textiles. Appl. Mater. Today 2022, 27, 101508. [Google Scholar] [CrossRef]
- Isaia, C.; McMaster, S.A.; McNally, D. Study of performance of knitted conductive sleeves as wearable textile strain sensors for joint motion tracking. In Proceedings of the 2020 42nd Annual International Conference of the IEEE Engineering in Medicine & Biology Society (EMBC), Montreal, QC, Canada, 20–24 July 2020; pp. 4555–4558. [Google Scholar]
- Zhao, B.; Dong, Z.; Cong, H. A wearable and fully-textile capacitive sensor based on flat-knitted spacing fabric for human motions detection. Sens. Actuators A Phys. 2022, 340, 113558. [Google Scholar] [CrossRef]
- Liu, Y.; Levitt, A.; Kara, C.; Sahin, C.; Dion, G.; Dandekar, K.R. An improved design of wearable strain sensor based on knitted RFID technology. In Proceedings of the 2016 IEEE Conference on Antenna Measurements & Applications (CAMA), Syracuse, NY, USA, 23–27 October 2016; pp. 1–4. [Google Scholar]
- Patron, D.; Mongan, W.; Kurzweg, T.P.; Fontecchio, A.; Dion, G.; Anday, E.K.; Dandekar, K.R. On the use of knitted antennas and inductively coupled RFID tags for wearable applications. IEEE Trans. Biomed. Circuits Syst. 2016, 10, 1047–1057. [Google Scholar] [CrossRef]
- Gao, Q.; Zhang, J.; Xie, Z.; Omisore, O.; Zhang, J.; Wang, L.; Li, H. Highly stretchable sensors for wearable biomedical applications. J. Mater. Sci. 2019, 54, 5187–5223. [Google Scholar] [CrossRef]
- Baribina, N.; Oks, A.; Baltina, I.; Eizentals, P. Comparative analysis of knitted pressure sensors. In Proceedings of the International Scientific Conference Engineering for Rural Development, Jelgava, Latvia, 23–25 May 2018. [Google Scholar]
- Reddy K, R.; Gandla, S.; Gupta, D. Highly sensitive, rugged, and wearable fabric strain sensor based on graphene clad polyester knitted elastic band for human motion monitoring. Adv. Mater. Interfaces 2019, 6, 1900409. [Google Scholar] [CrossRef]
- Lv, J.; Liu, Z.; Zhang, L.; Li, K.; Zhang, S.; Xu, H.; Mao, Z.; Zhang, H.; Chen, J.; Pan, G. Multifunctional polypyrrole and rose-like silver flower-decorated E-textile with outstanding pressure/strain sensing and energy storage performance. Chem. Eng. J. 2022, 427, 130823. [Google Scholar] [CrossRef]
- Xie, J.; Long, H.; Miao, M. High sensitivity knitted fabric strain sensors. Smart Mater. Struct. 2016, 25, 105008. [Google Scholar] [CrossRef]
- Molinaro, N.; Massaroni, C.; Presti, D.L.; Saccomandi, P.; Di Tomaso, G.; Zollo, L.; Perego, P.; Andreoni, G.; Schena, E. Wearable textile based on silver plated knitted sensor for respiratory rate monitoring. In Proceedings of the 2018 40th Annual International Conference of the IEEE Engineering in Medicine and Biology Society (EMBC), Honolulu, HI, USA, 18–21 July 2018; pp. 2865–2868. [Google Scholar]
- Kiener, K.; Anand, A.; Fobelets, W.; Fobelets, K. Low Power Respiration Monitoring using Wearable 3D knitted Helical Coils. IEEE Sens. J. 2021, 22, 1374–1381. [Google Scholar] [CrossRef]
- Li, Y.; Miao, X.; Niu, L.; Jiang, G.; Ma, P. Human motion recognition of knitted flexible sensor in walking cycle. Sensors 2019, 20, 35. [Google Scholar] [CrossRef] [Green Version]
- Li, Y.; Miao, X.; Raji, R.K. Flexible knitted sensing device for identifying knee joint motion patterns. Smart Mater. Struct. 2019, 28, 115042. [Google Scholar] [CrossRef]
- Li, Y.; Miao, X.; Chen, J.Y.; Jiang, G.; Liu, Q. Sensing performance of knitted strain sensor on two-dimensional and three-dimensional surfaces. Mater. Des. 2021, 197, 109273. [Google Scholar] [CrossRef]
- STOLL. Available online: http://www.stoll.com/en/machines/ (accessed on 16 October 2022).
- M1 Plus. Available online: https://www.stoll.com/en/service/online-training-courses/m1plusr/ (accessed on 16 October 2022).
- Shieldex. Available online: https://www.shieldex.de/en-us/ (accessed on 16 October 2022).
- Madeirausa. Available online: https://www.madeirausa.com (accessed on 16 October 2022).
- Servocity. Available online: https://www.servocity.com (accessed on 16 October 2022).
- Raji, R.K.; Miao, X.; Wan, A.; Niu, L.; Li, Y.; Boakye, A. Knitted piezoresistive smart chest band and its application for respiration patterns assessment. J. Eng. Fibers Fabr. 2019, 14, 1558925019868474. [Google Scholar] [CrossRef] [Green Version]
- Zięba, J.; Frydrysiak, M.; Błaszczyk, J. Textronic clothing with resistance textile sensor to monitoring frequency of human breathing. In Proceedings of the 2012 IEEE International Symposium on Medical Measurements and Applications Proceedings, Budapest, Hungary, 18–19 May 2012; pp. 1–6. [Google Scholar]
- Wang, J.; Soltanian, S.; Servati, P.; Ko, F.; Weng, M. A knitted wearable flexible sensor for monitoring breathing condition. J. Eng. Fibers Fabr. 2020, 15, 1558925020930354. [Google Scholar] [CrossRef]
- Baker, L.B. Physiology of sweat gland function: The roles of sweating and sweat composition in human health. Temperature 2019, 6, 211–259. [Google Scholar] [CrossRef] [Green Version]
- Sigmaaldrich. Available online: https://www.sigmaaldrich.com/US/en (accessed on 16 October 2022).
- Abo El-Ola, S.M. New approach for imparting antimicrobial properties for polyamide and wool containing fabrics. Polym.-Plast. Technol. Eng. 2007, 46, 831–839. [Google Scholar] [CrossRef]
- Li, F.Y.; Yan, S.Y.; Cheng, X.W. Performance of electrically conductive fabrics based on polyester/metal wire wrapped yarns. In Advanced Materials Research; Trans Tech Publ: Sanya, China, 2011; Volume 287, pp. 2543–2546. [Google Scholar]
- Zhang, H. Flexible textile-based strain sensor induced by contacts. Meas. Sci. Technol. 2015, 26, 105102. [Google Scholar] [CrossRef]
- Xiao, S.; Nie, J.; Tan, R.; Duan, X.; Ma, J.; Li, Q.; Wang, T. Fast-response ionogel humidity sensor for real-time monitoring of breathing rate. Mater. Chem. Front. 2019, 3, 484–491. [Google Scholar] [CrossRef]
- Adafruit. Available online: https://learn.adafruit.com (accessed on 16 October 2022).


| Sensor Number | Knitting Type | Description | Dimensions |
|---|---|---|---|
| 1 | 1 × 1 Stripe | Alternate loops of polyester and conductive yarn | 1" × 2" |
| 2 | Solid | Successive conductive loops | 2" × 2" |
| 3 | Solid | Successive conductive loops | 1.5" × 2" |
| 4 | Solid | Successive conductive loops | 1" × 2" |
| 5 | 1 × 2 stripe | alternate loops of two polyester and one conductive yarn | 1" × 2" |
| 6 | Solid | Hybrid loops of polyester and conductive yarn | 1" × 2" |
| Resistance Change () | ||||
|---|---|---|---|---|
| Sensor | 10% | 15% | 20% | 25% |
| 1 | 55.57 | 79.92 | 64.66 | 70 |
| 2 | 34.49 | 63.16 | 76.68 | 81.76 |
| 3 | 22.67 | 27.88 | 53.17 | 59.65 |
| 4 | 18.86 | 24.10 | 39.58 | 42.15 |
| 5 | 29.83 | 75.08 | 119.85 | 79 |
| 6 | 36.42 | 66.67 | 81.18 | 85.54 |
| Sensor Number | Before Durability Cycle Test | After Durability Cycle Test |
|---|---|---|
| GF Sensor 1 | 3.097 | 2.328 |
| GF Sensor 2 | 2.611 | 2.359 |
| GF Sensor 3 | 3.179 | 2.776 |
| GF Sensor 4 | 2.769 | 2.396 |
| GF Sensor 5 | 2.694 | 2.486 |
| GF Sensor 6 | 3.576 | 2.502 |
| Breathing Incident | R-Squared Value |
|---|---|
| Fast–normal | 0.7281 |
| Normal–fast | 0.6747 |
| Normal–slow | 0.7205 |
| Slow–normal | 0.7005 |
| Fast–slow | 0.7588 |
| Slow–fast | 0.7334 |
Disclaimer/Publisher’s Note: The statements, opinions and data contained in all publications are solely those of the individual author(s) and contributor(s) and not of MDPI and/or the editor(s). MDPI and/or the editor(s) disclaim responsibility for any injury to people or property resulting from any ideas, methods, instructions or products referred to in the content. |
© 2022 by the authors. Licensee MDPI, Basel, Switzerland. This article is an open access article distributed under the terms and conditions of the Creative Commons Attribution (CC BY) license (https://creativecommons.org/licenses/by/4.0/).
Share and Cite
Rumon, M.A.a.; Cay, G.; Ravichandran, V.; Altekreeti, A.; Gitelson-Kahn, A.; Constant, N.; Solanki, D.; Mankodiya, K. Textile Knitted Stretch Sensors for Wearable Health Monitoring: Design and Performance Evaluation. Biosensors 2023, 13, 34. https://doi.org/10.3390/bios13010034
Rumon MAa, Cay G, Ravichandran V, Altekreeti A, Gitelson-Kahn A, Constant N, Solanki D, Mankodiya K. Textile Knitted Stretch Sensors for Wearable Health Monitoring: Design and Performance Evaluation. Biosensors. 2023; 13(1):34. https://doi.org/10.3390/bios13010034
Chicago/Turabian StyleRumon, Md Abdullah al, Gozde Cay, Vignesh Ravichandran, Afnan Altekreeti, Anna Gitelson-Kahn, Nicholas Constant, Dhaval Solanki, and Kunal Mankodiya. 2023. "Textile Knitted Stretch Sensors for Wearable Health Monitoring: Design and Performance Evaluation" Biosensors 13, no. 1: 34. https://doi.org/10.3390/bios13010034