Unraveling the Secrets of Colistin Resistance with Label-Free Raman Spectroscopy

 and
and 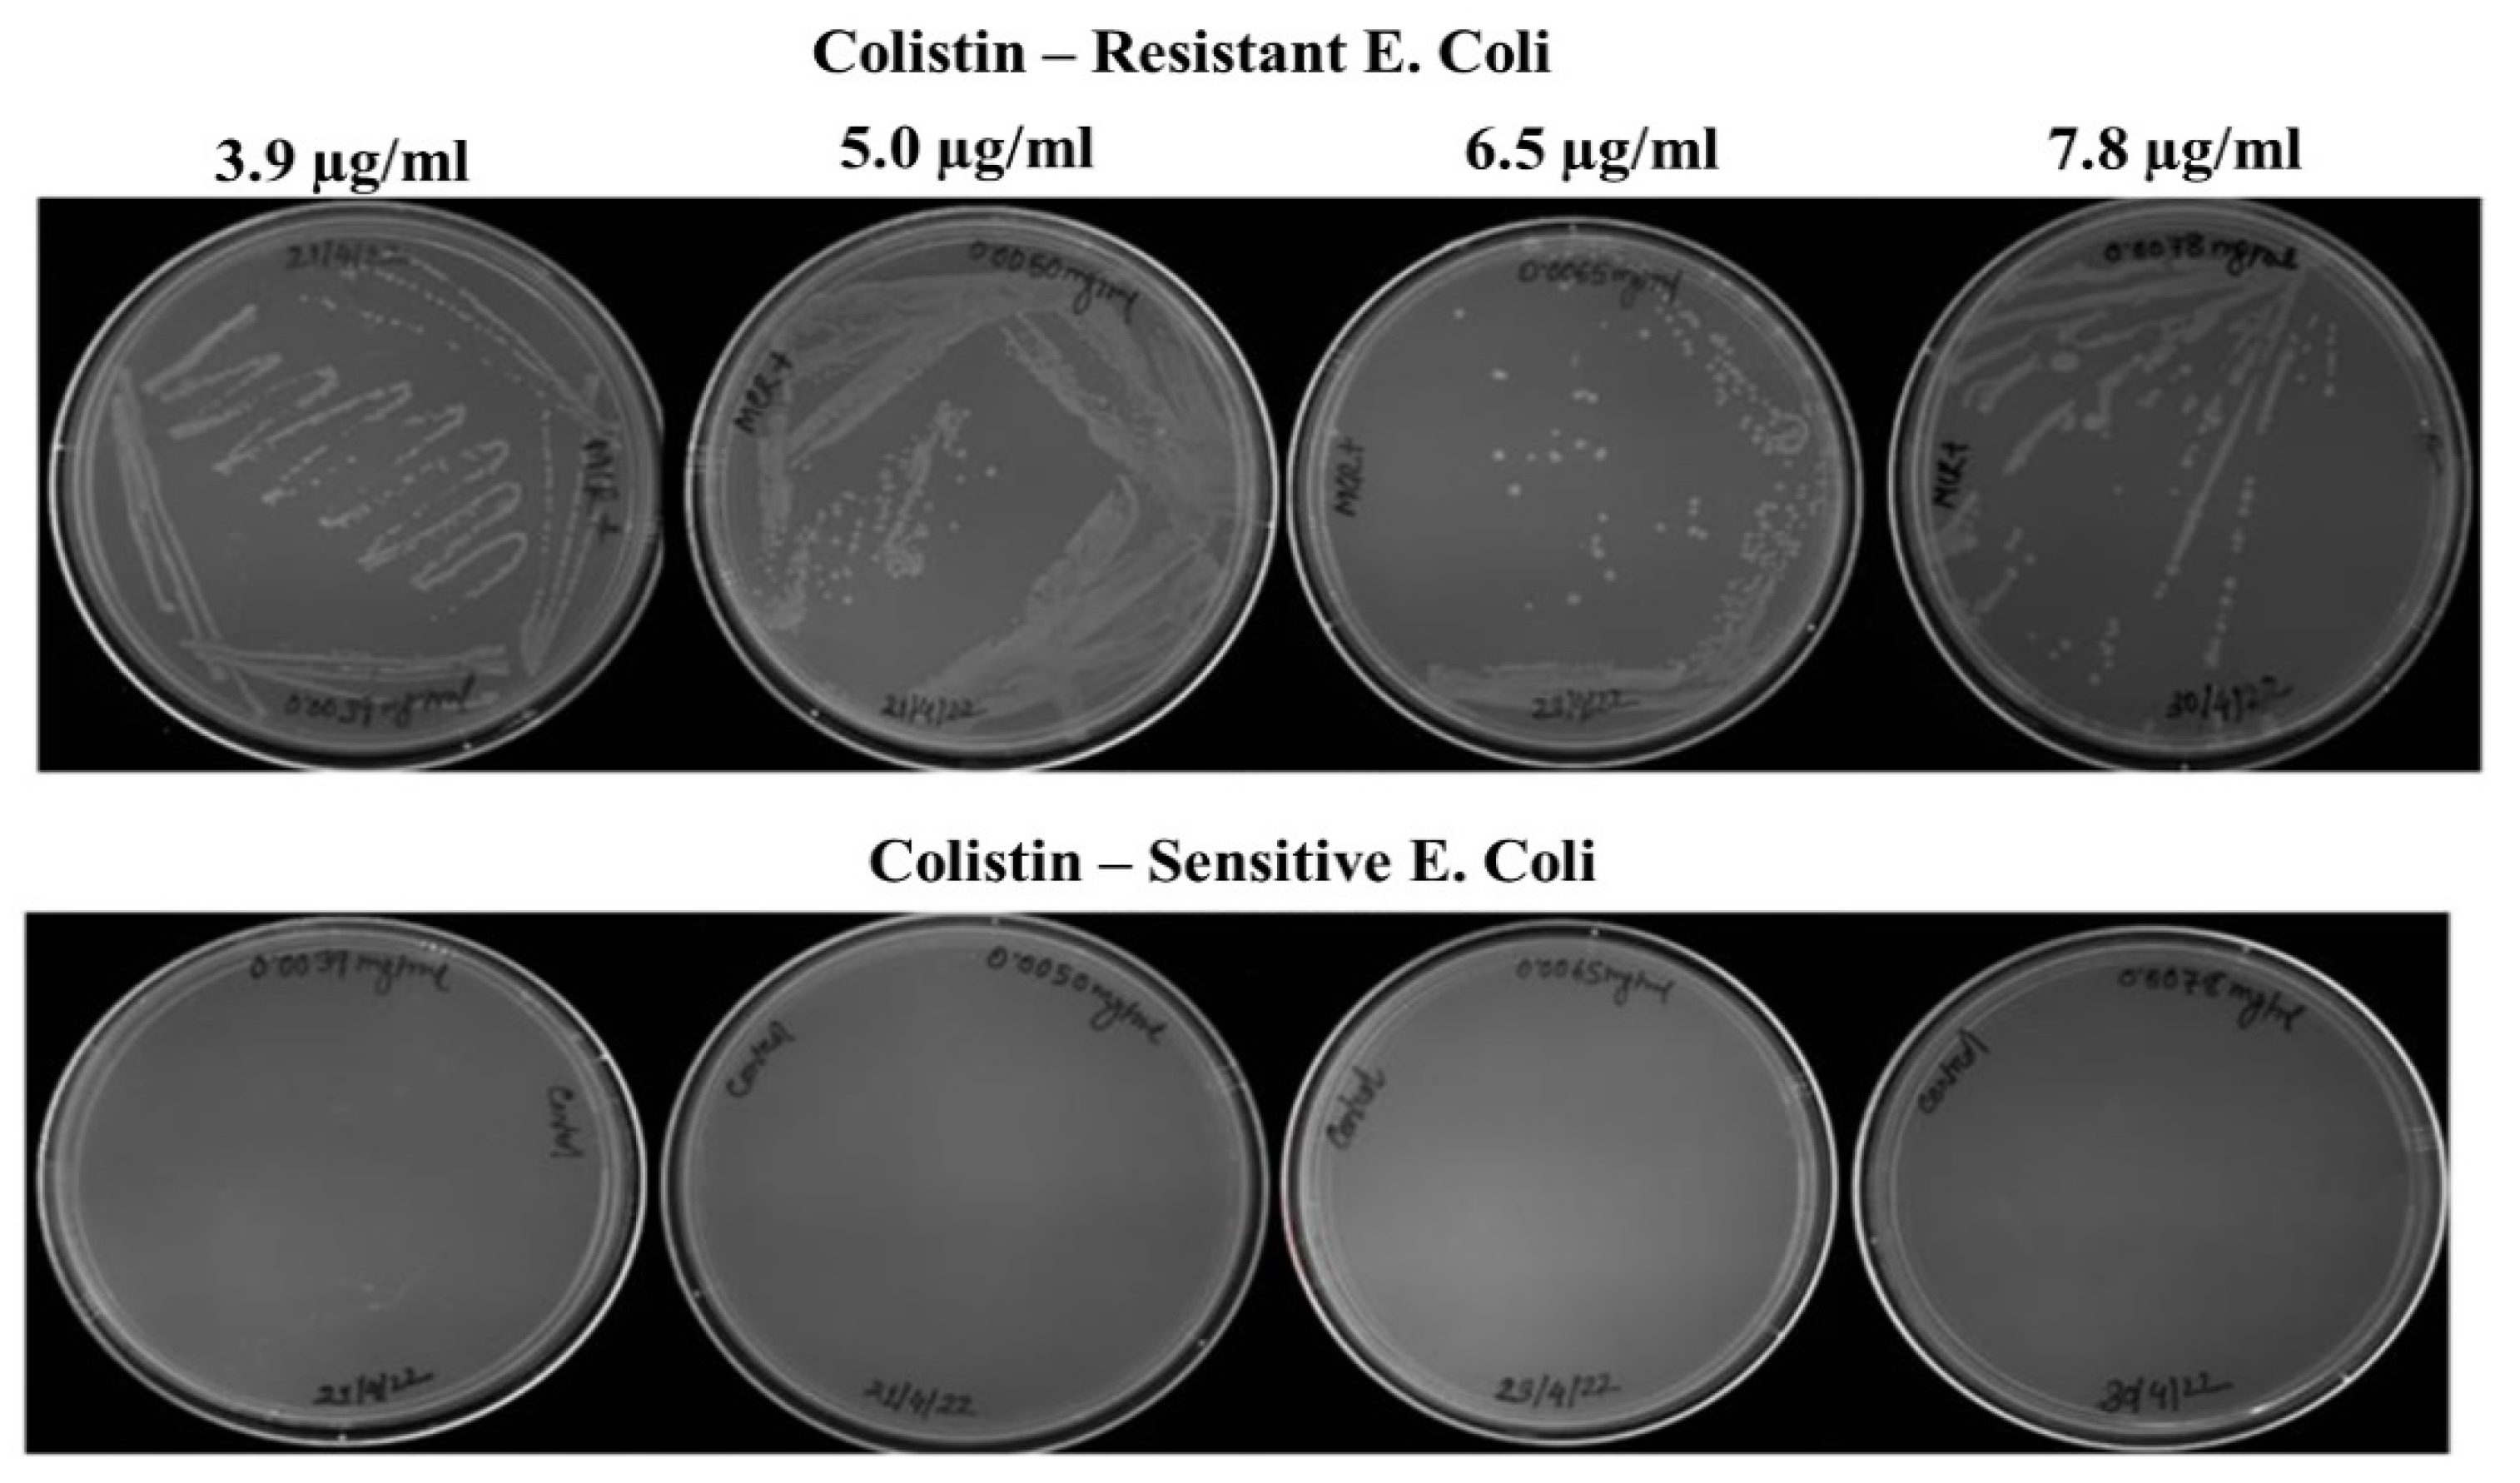
Abstract
:1. Introduction
2. Materials and Methods
2.1. Bacterial Strain
2.2. Induction of the Colistin Resistance
2.3. Validation of Sensitive and Resistance Breakpoints
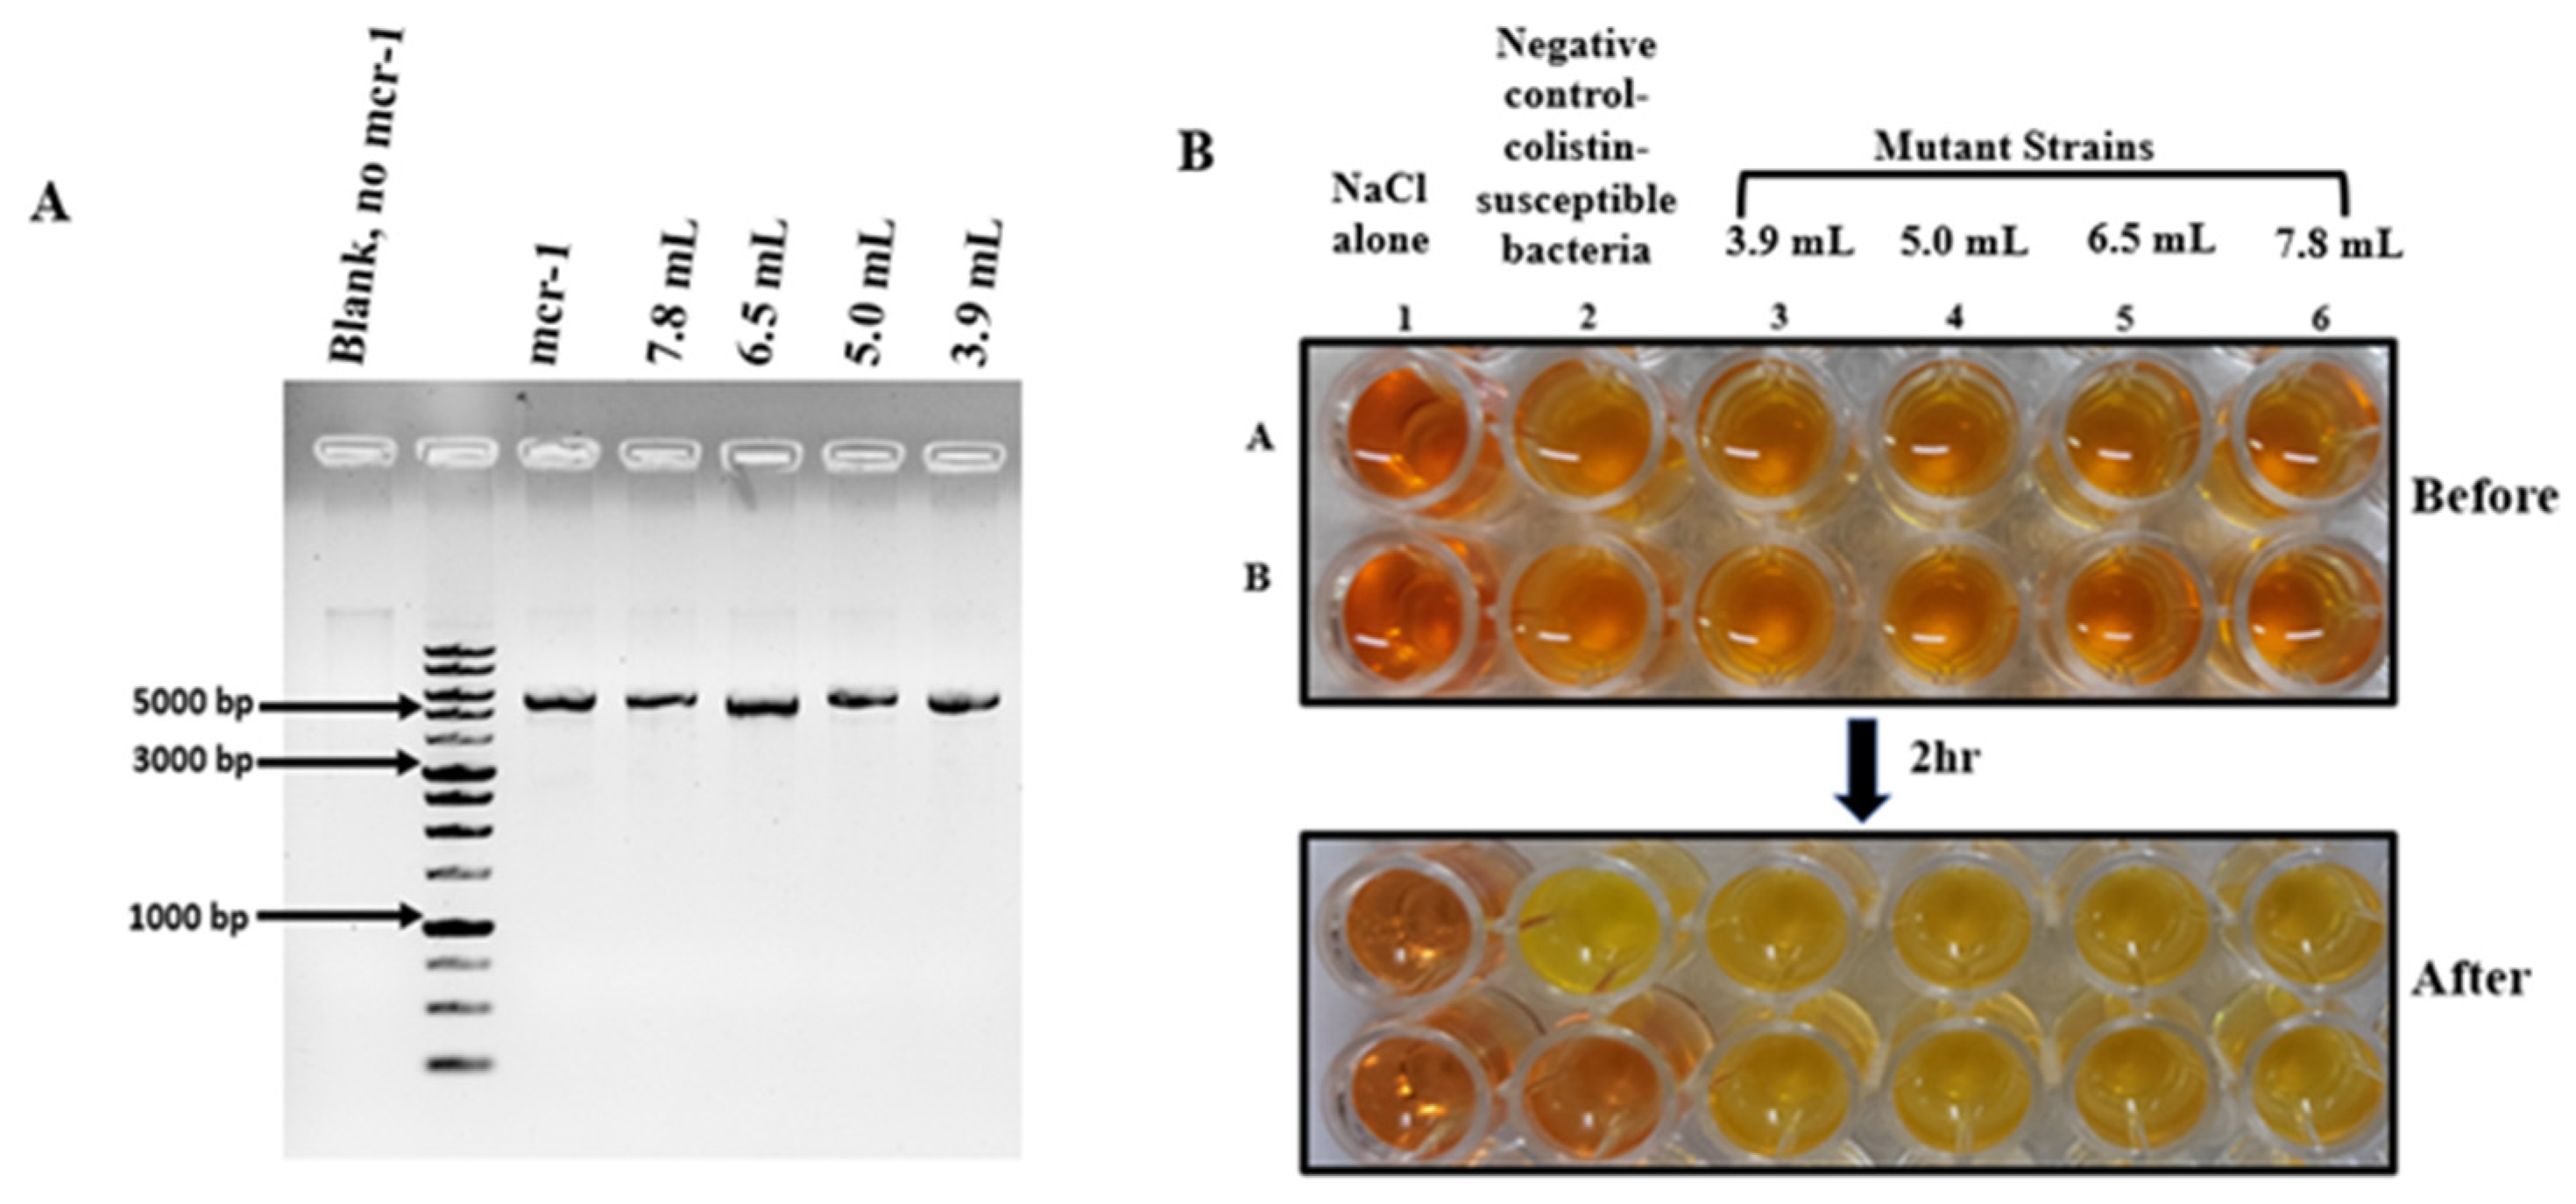
2.4. Rapid Polymyxin NP (Nordmann/Poirel) Test
2.5. Raman Spectroscopy
2.6. Spectral Pre-Processing and Analysis
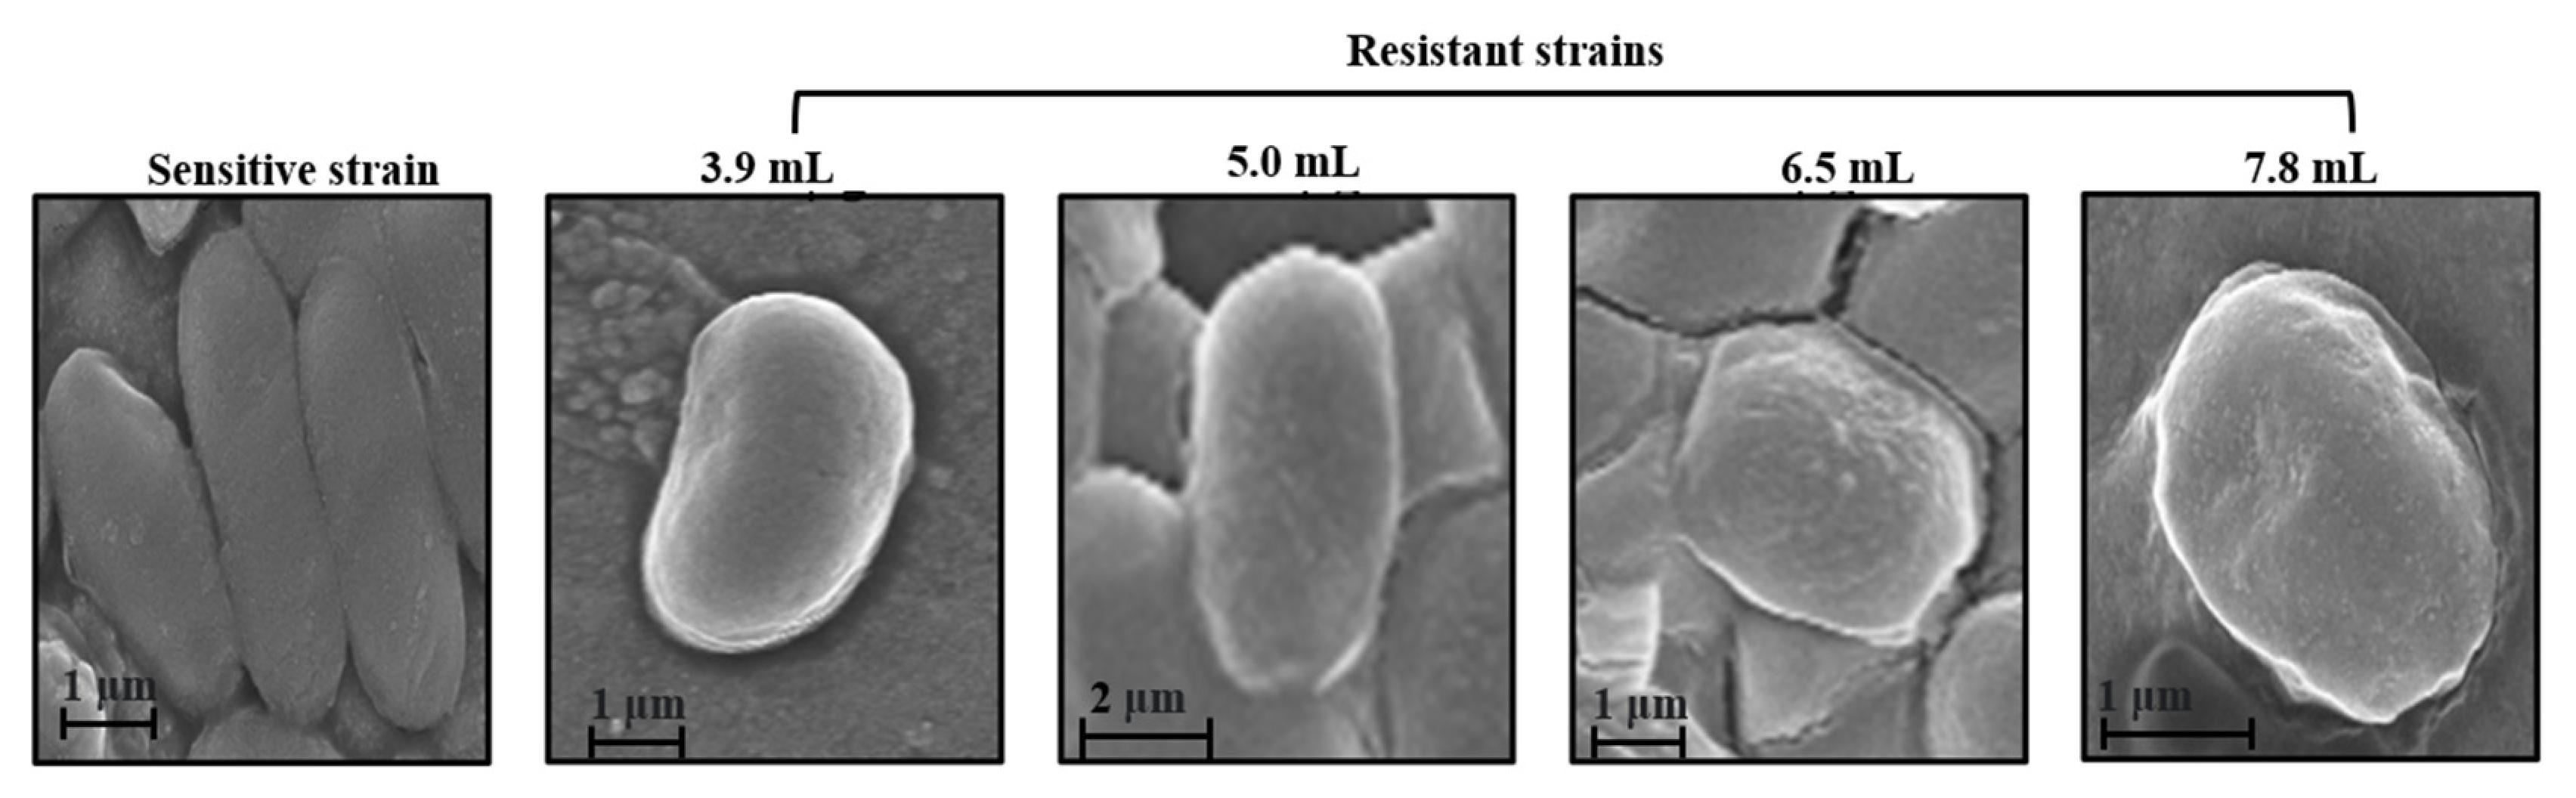
2.7. Field Emission Scanning Electron Microscopy (FESEM)
3. Results
3.1. Generation and Validation of Colistin Resistant E. coli Cells
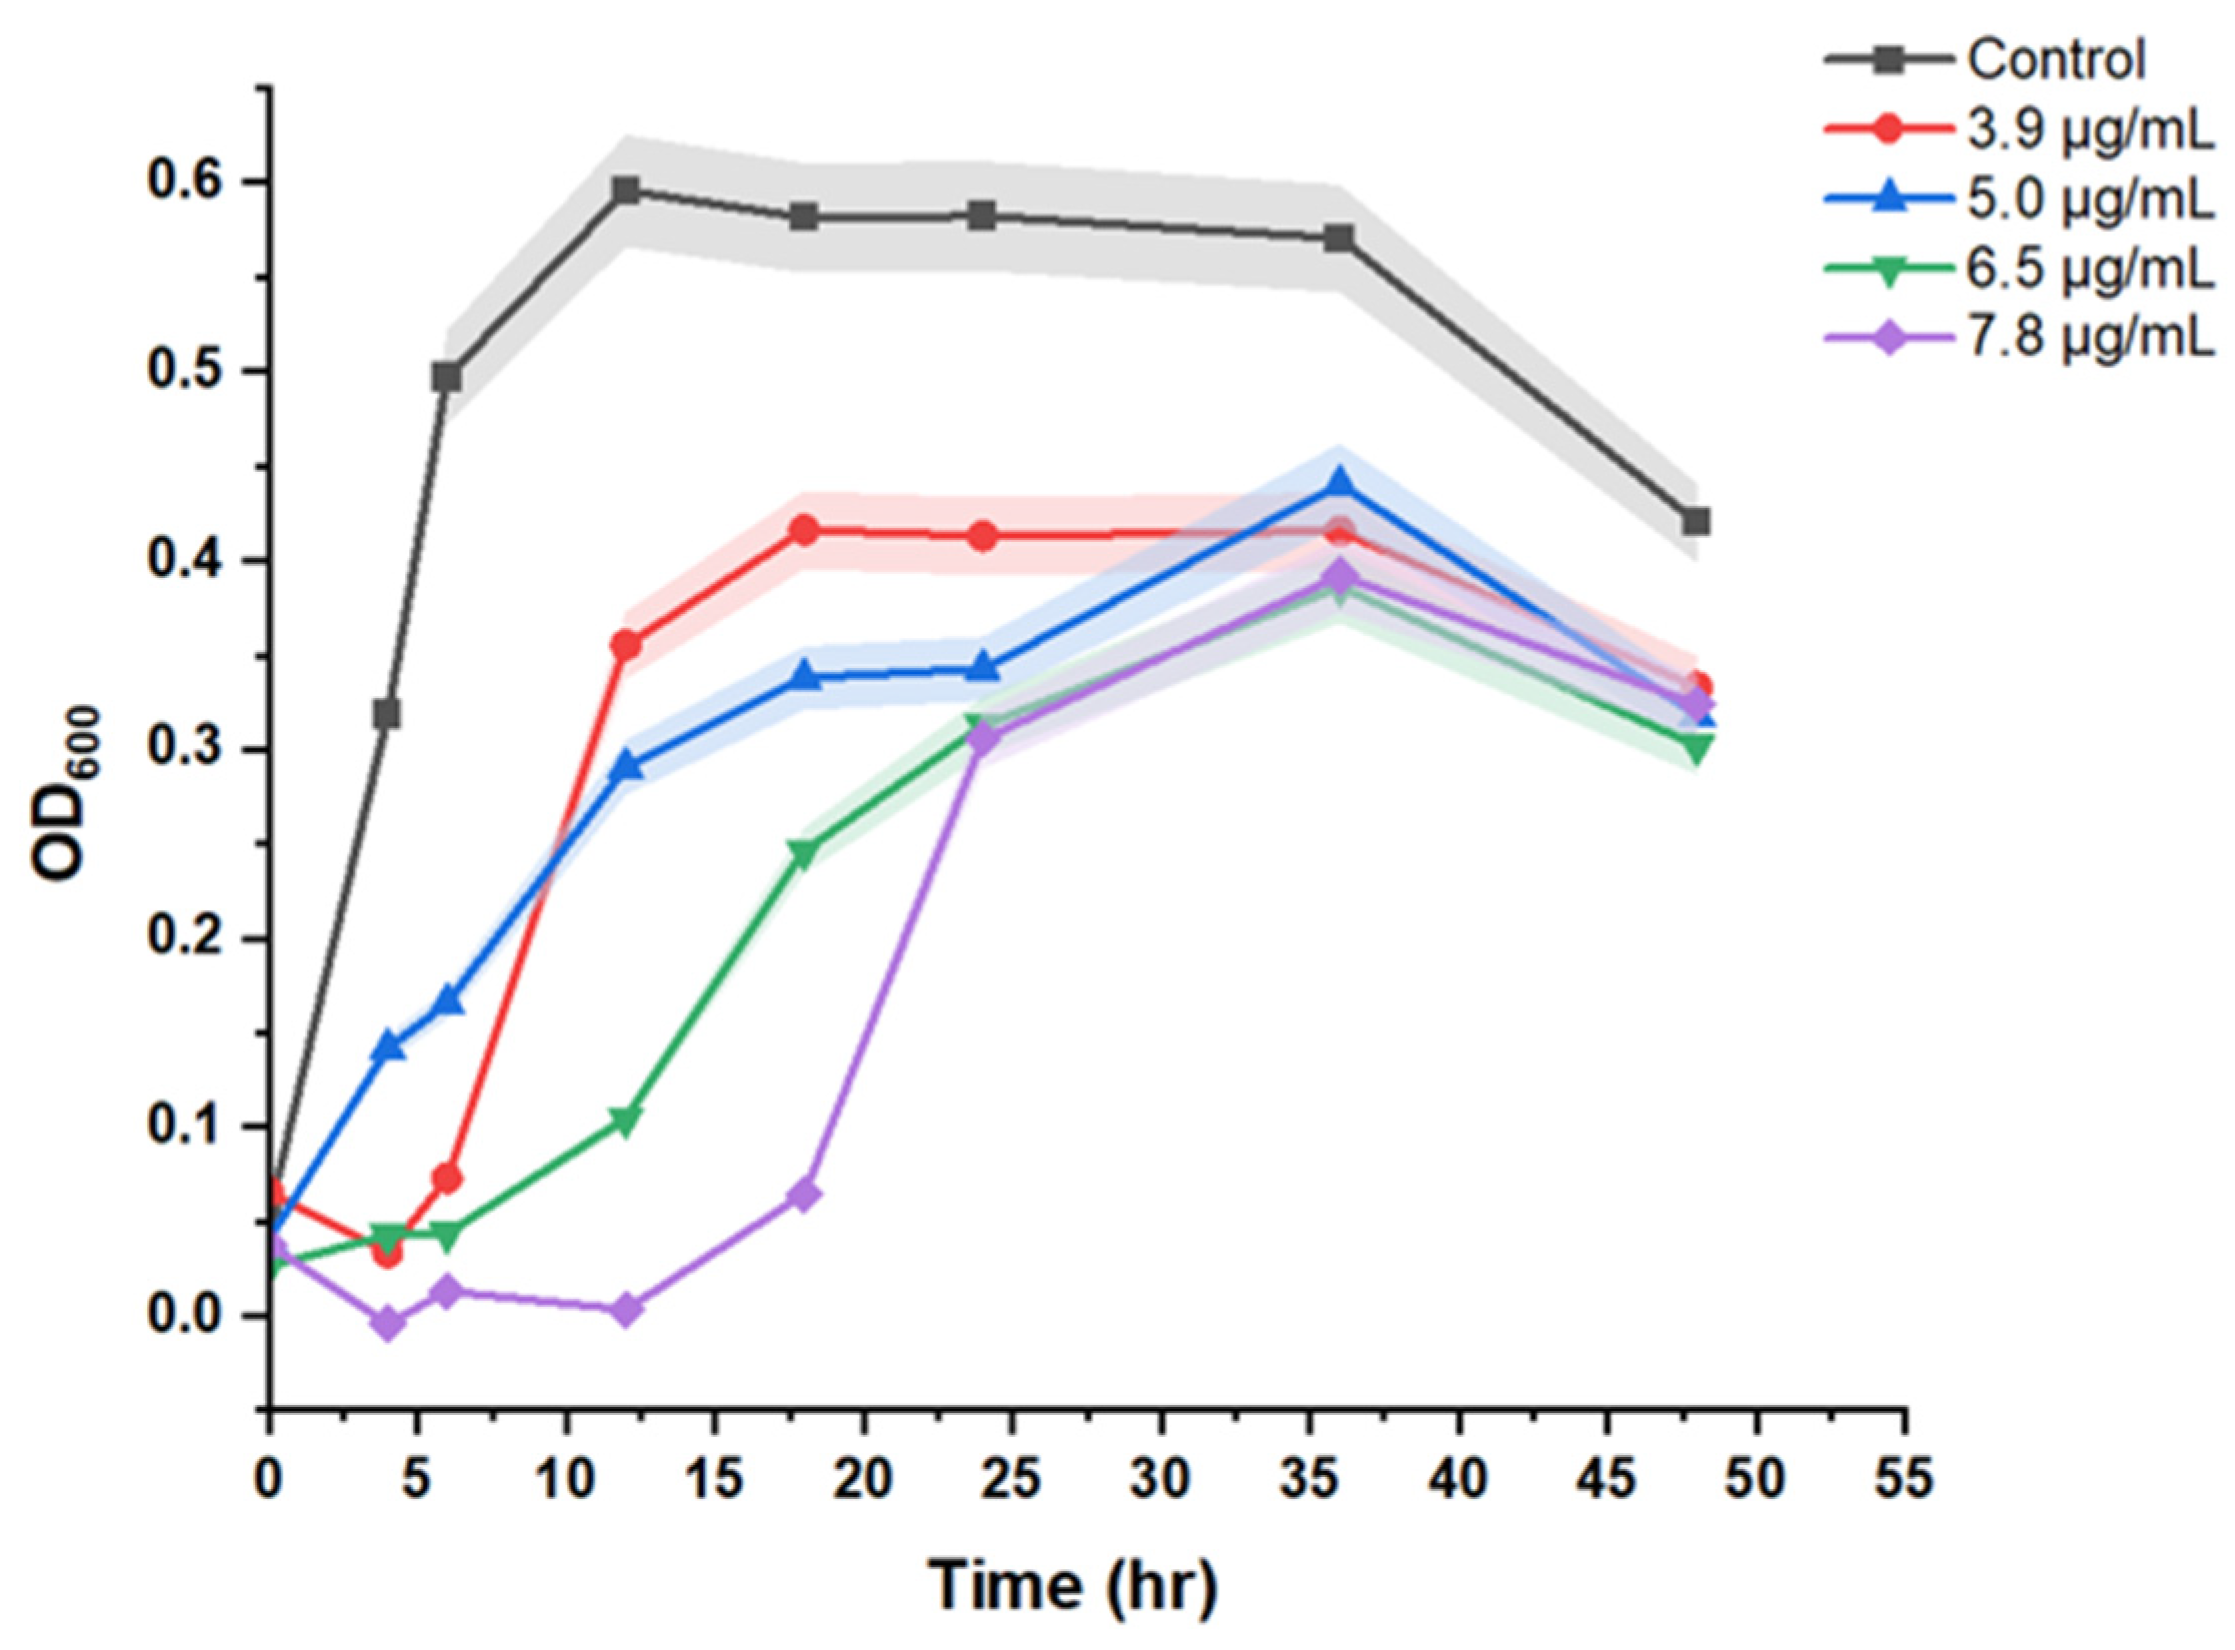
3.2. Resistant Induction
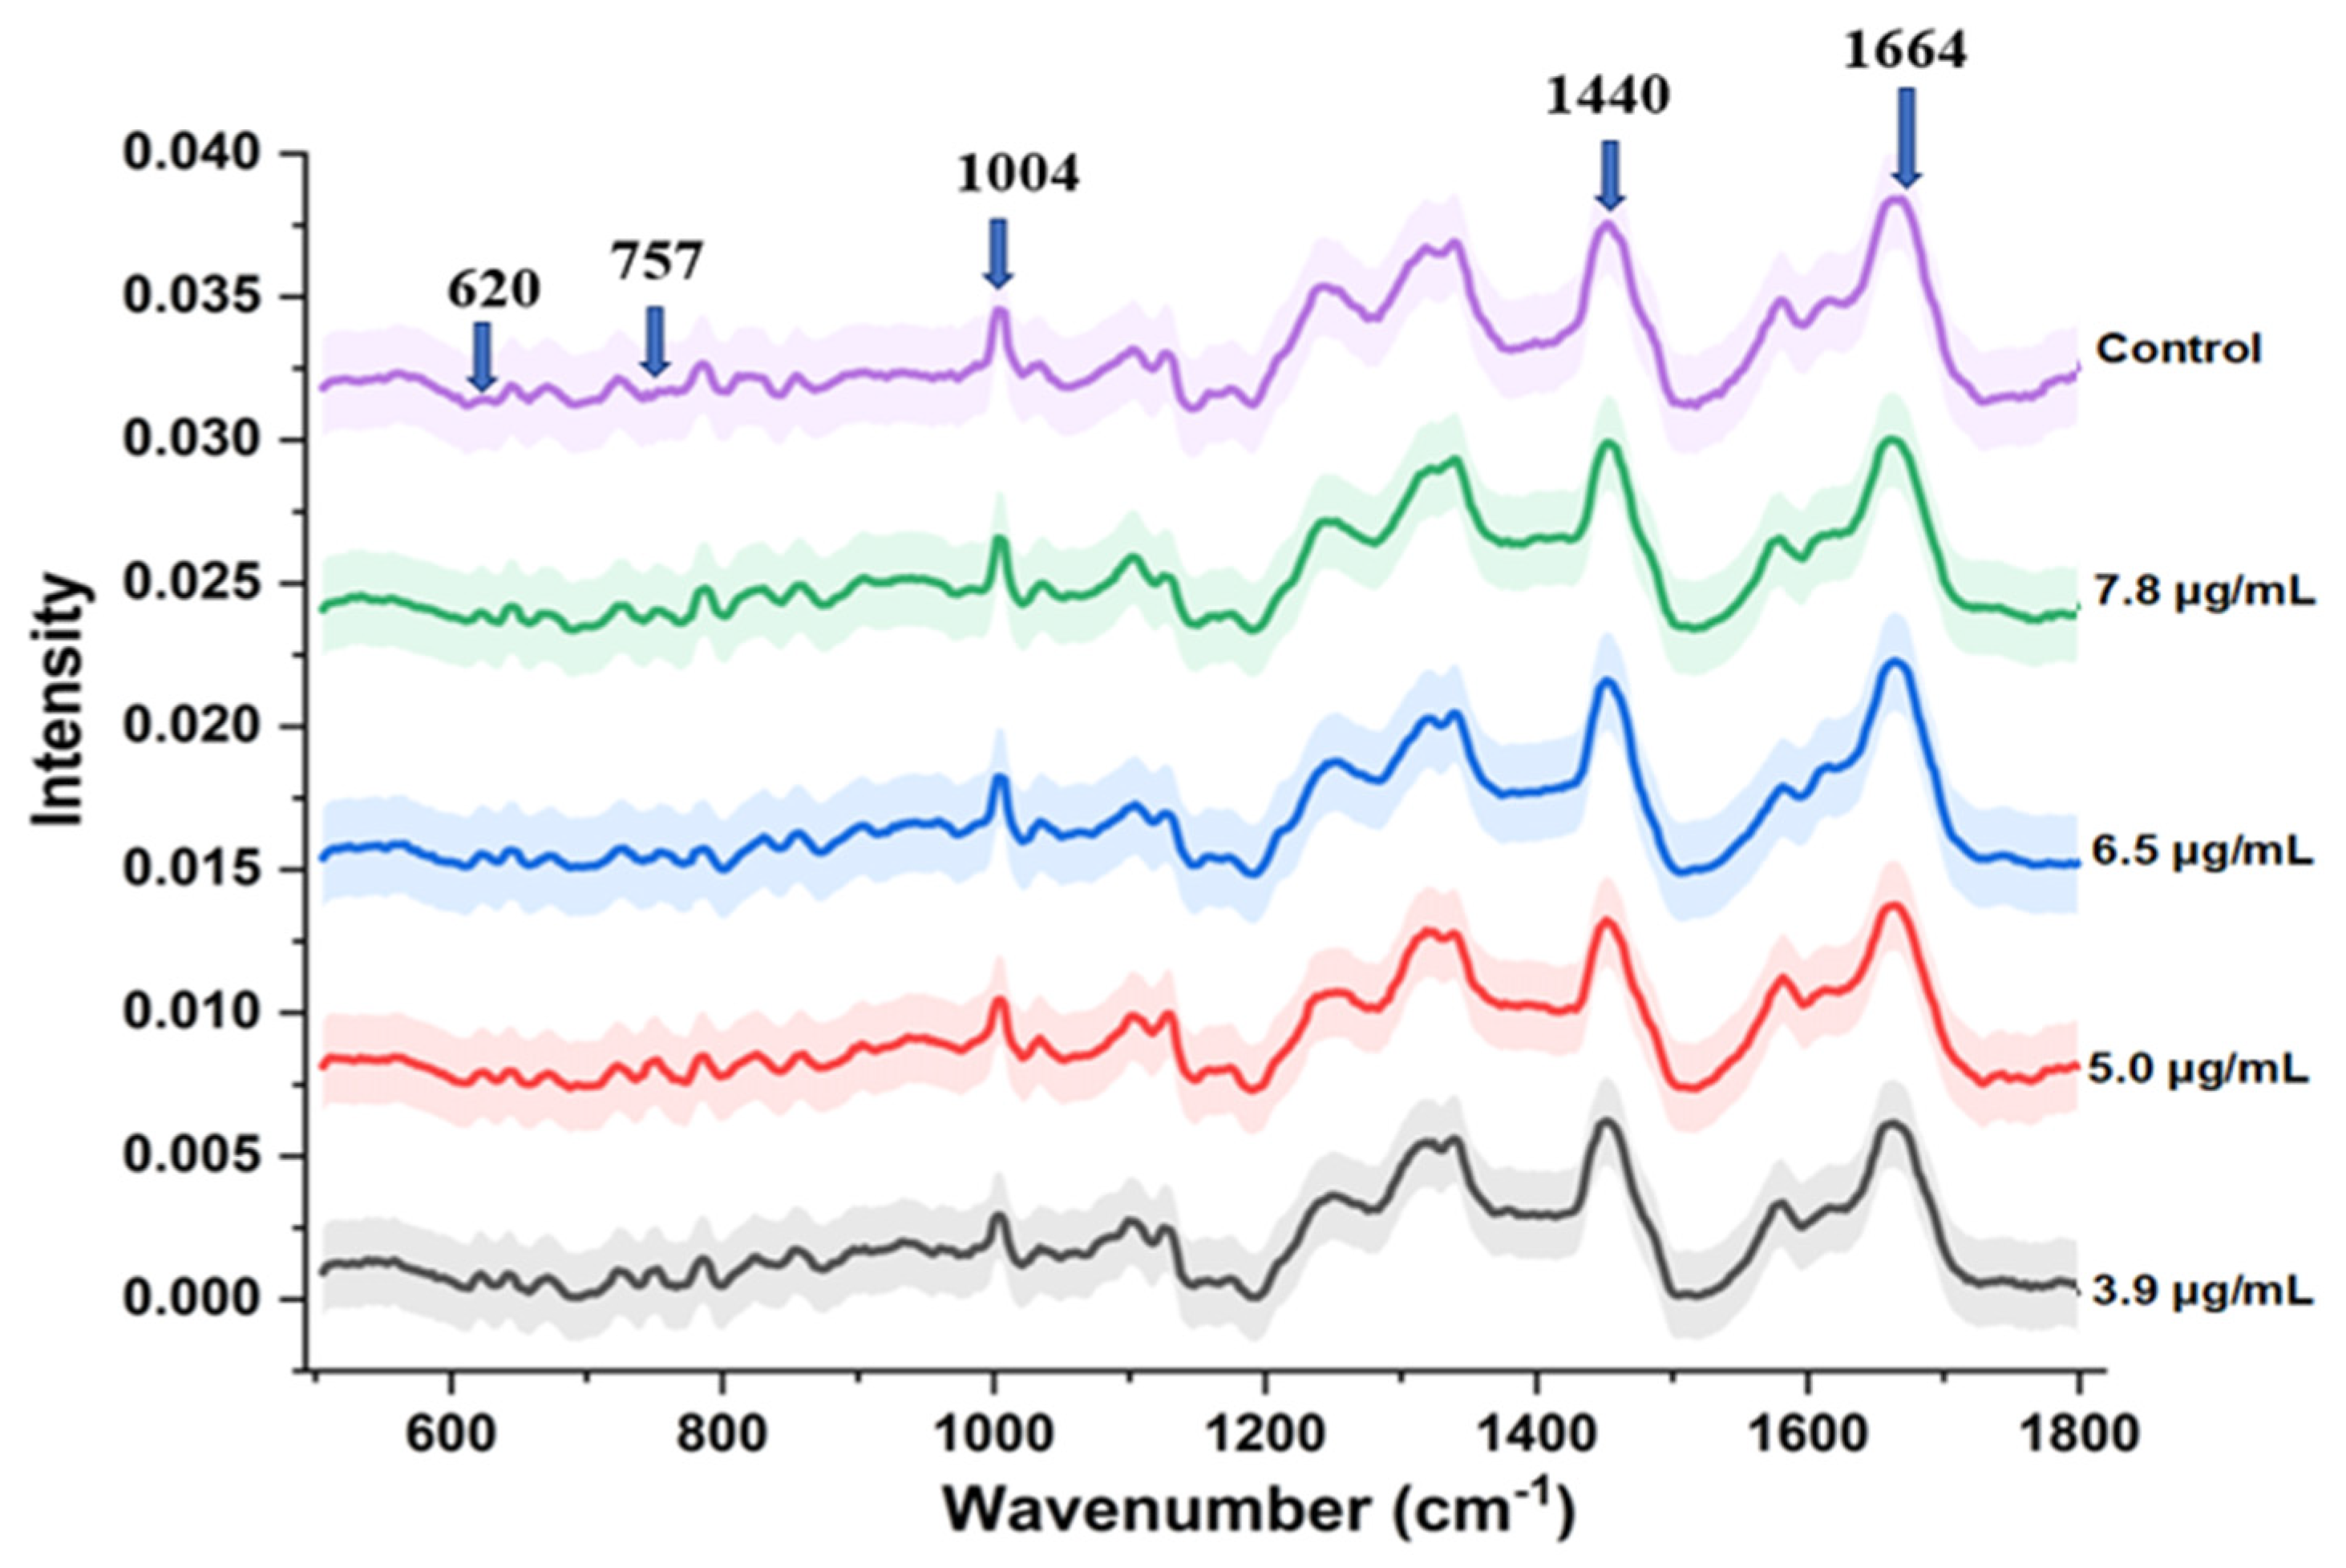
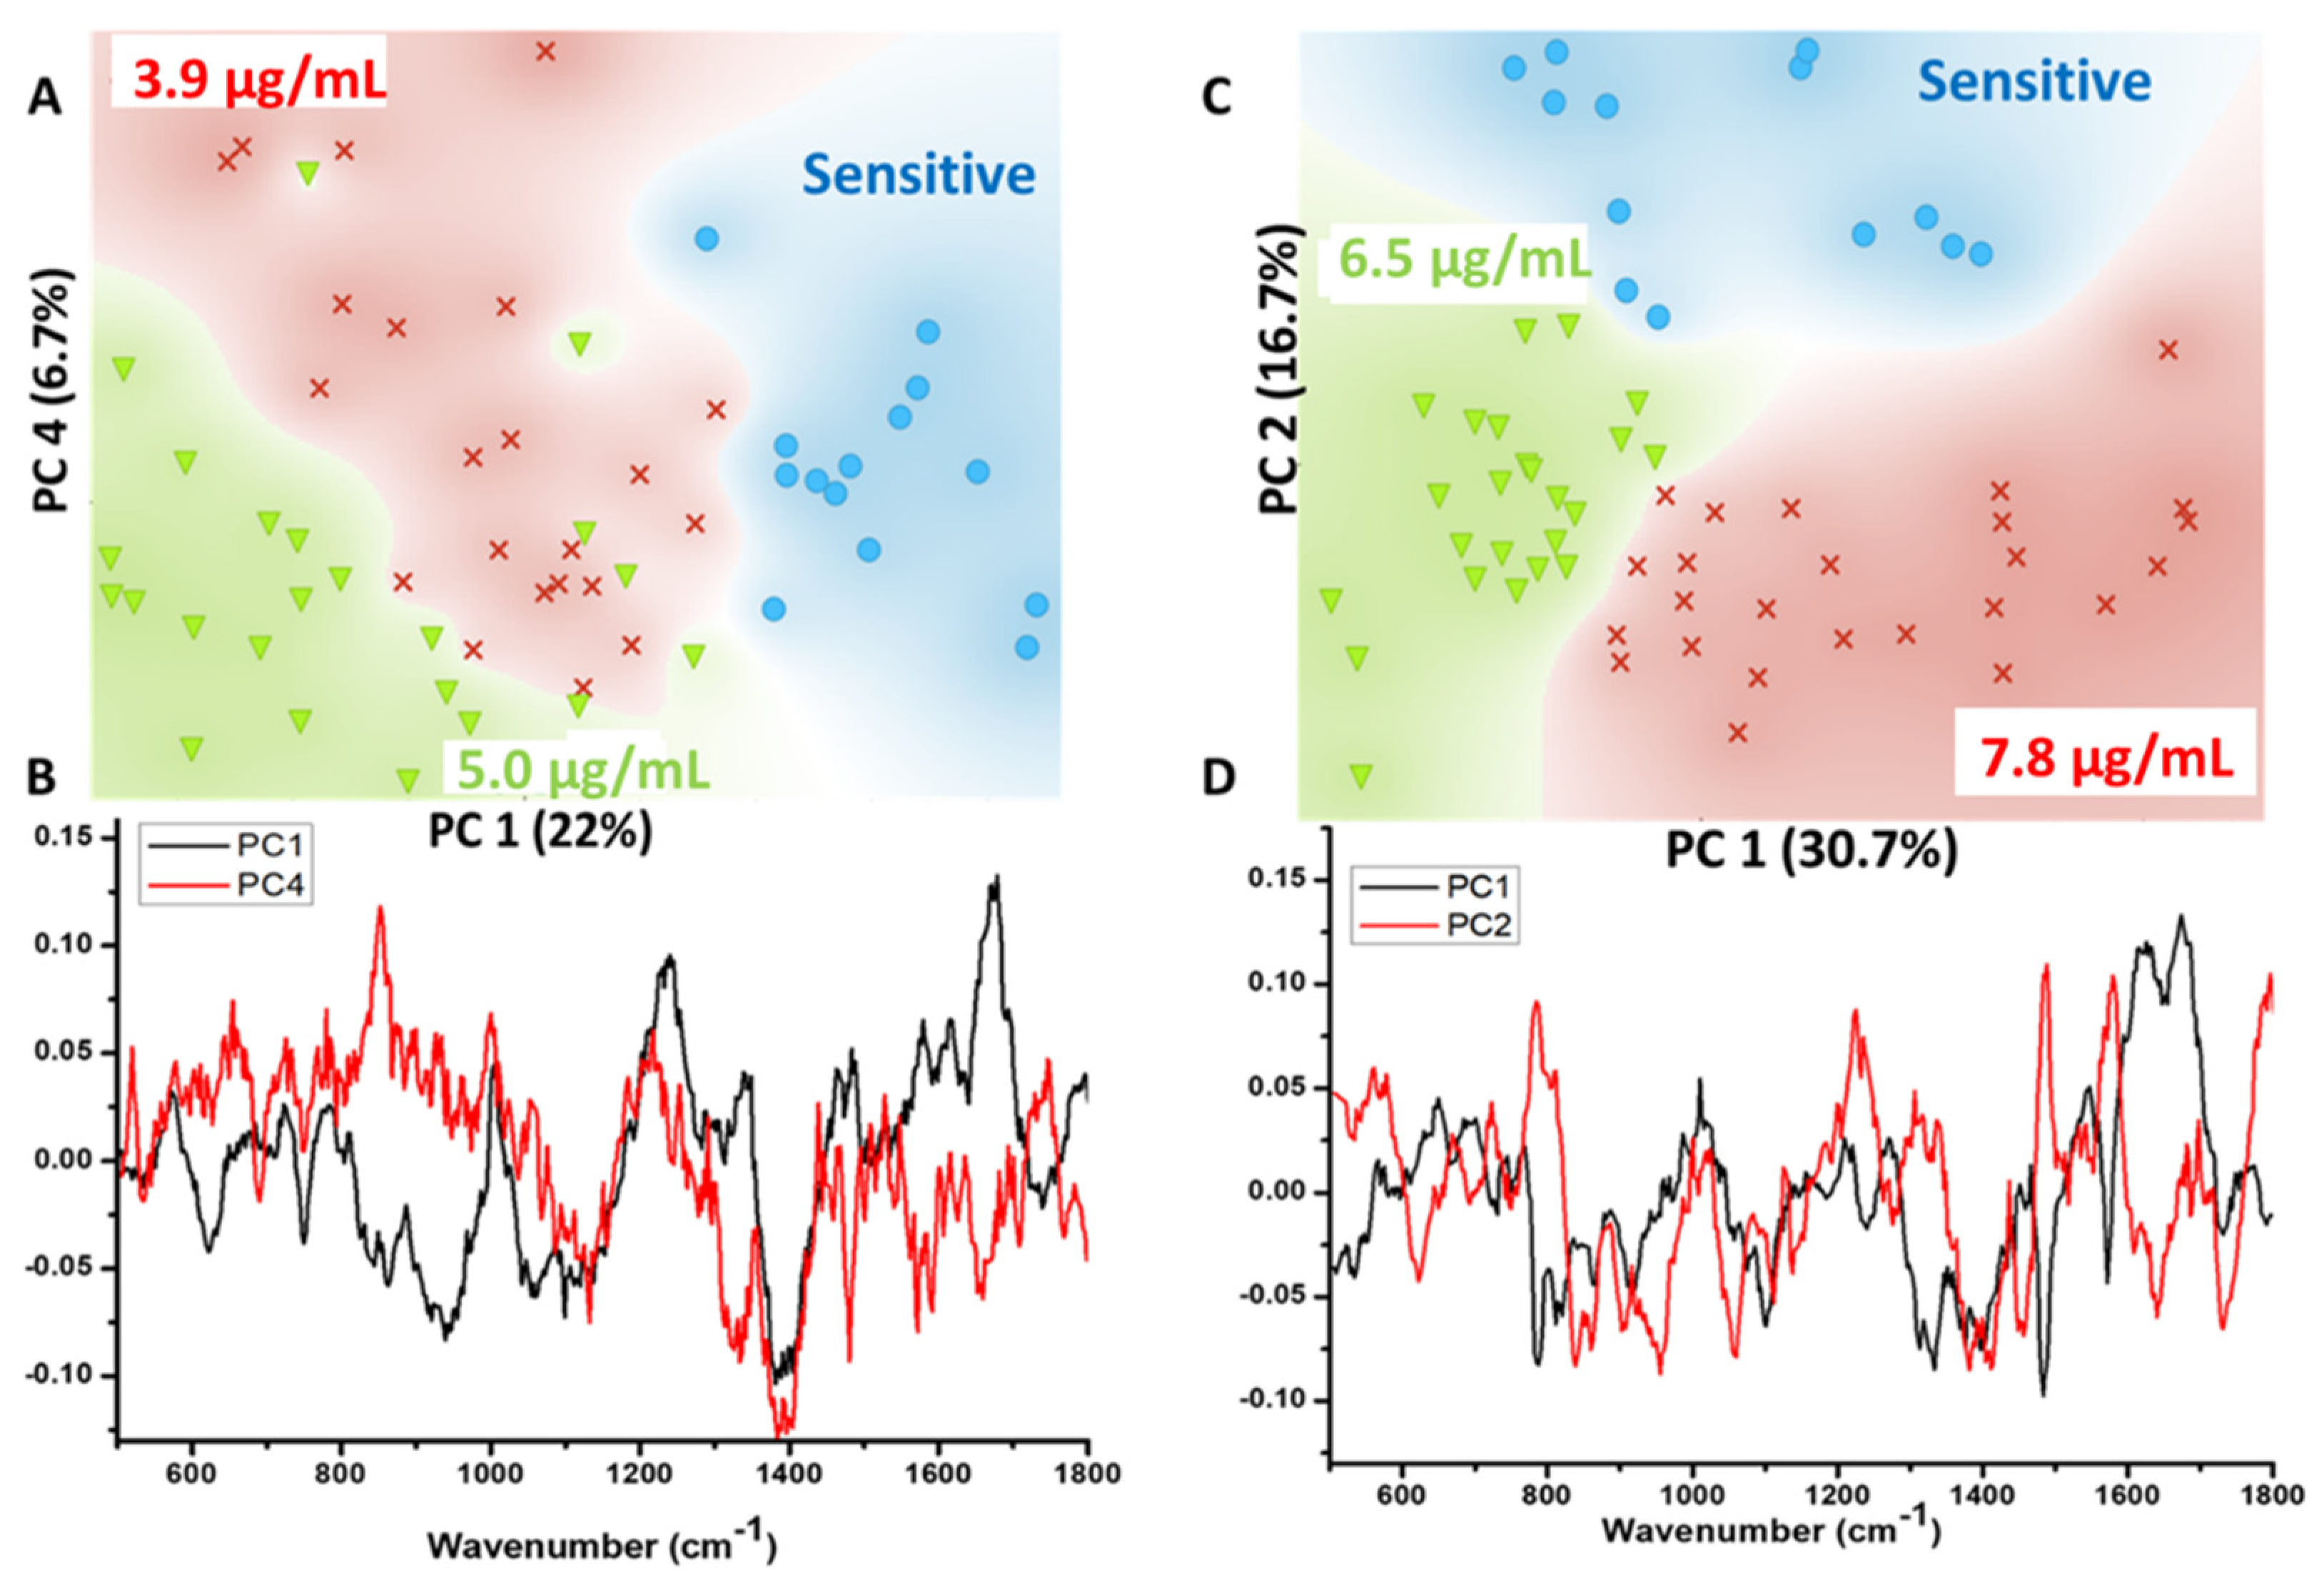
3.3. Spectral and Statistical Data Analysis
4. Discussion
5. Conclusions
Author Contributions
Funding
Institutional Review Board Statement
Informed Consent Statement
Data Availability Statement
Conflicts of Interest
References
- Sharma, A.; Sarin, S. Indian Priority Pathogen List. 2019. Available online: https://cdn.who.int/media/docs/default-source/searo/india/antimicrobial-resistance/ippl_final_web.pdf?sfvrsn=9105c3d1_6 (accessed on 10 September 2022).
- Li, B.; Yin, F.; Zhao, X.; Guo, Y.; Wang, W.; Wang, P.; Zhu, H.; Yin, Y.; Wang, X. Colistin Resistance Gene mcr-1 Mediates Cell Permeability and Resistance to Hydrophobic Antibiotics. Front. Microbiol. 2020, 10, 3015. [Google Scholar] [CrossRef] [PubMed]
- Falagas, M.E.; Kasiakou, S.K.; Saravolatz, L.D. Colistin: The Revival of Polymyxins for the Management of Multidrug-Resistant Gram-Negative Bacterial Infections. Clin. Infect. Dis. 2005, 40, 1333–1342. [Google Scholar] [CrossRef] [PubMed]
- Liu, Y.-Y.; Wang, Y.; Walsh, T.R.; Yi, L.-X.; Zhang, R.; Spencer, J.; Doi, Y.; Tian, G.; Dong, B.; Huang, X.; et al. Emergence of plasmid-mediated colistin resistance mechanism MCR-1 in animals and human beings in China: A microbiological and molecular biological study. Lancet Infect. Dis. 2016, 16, 161–168. [Google Scholar] [CrossRef]
- By, C.; Neill, J.I.M.O. Tackling Drug-Resistant Infections Globally: Final Report and Recommendations the Review on Antimicrobial Resistant, Report is Supported by Welcome Trust and UK Government. 2016. Available online: https://amr-review.org/Publications.html (accessed on 10 September 2022).
- Li, J.; Nation, R.L.; Milne, R.W.; Turnidge, J.D.; Coulthard, K. Evaluation of colistin as an agent against multi-resistant Gram-negative bacteria. Int. J. Antimicrob. Agents 2005, 25, 11–25. [Google Scholar] [CrossRef]
- Landman, D.; Georgescu, C.; Martin, D.A.; Quale, J. Polymyxins Revisited. Clin. Microbiol. Rev. 2008, 21, 449–465. [Google Scholar] [CrossRef]
- BSAC Working Party on Susceptibility Testing Andrews; Andrews, J.M. BSAC standardized disc susceptibility testing method. J. Antimicrob. Chemother. 2001, 48 (Suppl. S1), 43–57. [CrossRef]
- Anandan, A.; Evans, G.L.; Condic-Jurkic, K.; O’Mara, M.L.; John, C.M.; Phillips, N.J.; Jarvis, G.A.; Wills, S.S.; Stubbs, K.A.; Moraes, I.; et al. Structure of a lipid A phosphoethanolamine transferase suggests how conformational changes govern substrate binding. Proc. Natl. Acad. Sci. USA 2017, 114, 2218–2223. [Google Scholar] [CrossRef]
- Raetz, C.R.H.; Whitfield, C. Lipopolysaccharide Endotoxins. Annu. Rev. Biochem. 2002, 71, 635–700. [Google Scholar] [CrossRef]
- Nikaido, H. Molecular Basis of Bacterial Outer Membrane Permeability Revisited. Microbiol. Mol. Biol. Rev. 2003, 67, 593–656. [Google Scholar] [CrossRef]
- Lacour, S.; Bechet, E.; Cozzone, A.J.; Mijakovic, I.; Grangeasse, C. Tyrosine Phosphorylation of the UDP-Glucose Dehydrogenase of Escherichia coli Is at the Crossroads of Colanic Acid Synthesis and Polymyxin Resistance. PLoS ONE 2008, 3, e3053. [Google Scholar] [CrossRef] [Green Version]
- Richter, P.; Krüger, M.; Prasad, B.; Gastiger, S.; Bodenschatz, M.; Wieder, F.; Burkovski, A.; Geißdörfer, W.; Lebert, M.; Strauch, S.M. Using Colistin as a Trojan Horse: Inactivation of Gram-Negative Bacteria with Chlorophyllin. Antibiotics 2019, 8, 158. [Google Scholar] [CrossRef] [PubMed]
- Balouiri, M.; Sadiki, M.; Ibnsouda, S.K. Methods for in vitro evaluating antimicrobial activity: A review. J. Pharm. Anal. 2016, 6, 71–79. [Google Scholar] [CrossRef] [PubMed]
- Bergkessel, M.; Basta, D.W.; Newman, D.K. The physiology of growth arrest: Uniting molecular and environmental microbiology. Nat. Rev. Genet. 2016, 14, 549–562. [Google Scholar] [CrossRef] [PubMed]
- Orsini, F.; Ami, D.; Villa, A.M.; Sala, G.; Bellotti, M.; Doglia, S. FT-IR microspectroscopy for microbiological studies. J. Microbiol. Methods 2000, 42, 17–27. [Google Scholar] [CrossRef]
- Cemil, K.Ü. Applicability of Raman Spectroscopy for Characterization of Three Major Foodborne Pathogens. Harran. Üniv. Vet. Fak. Derg 2016, 5, 141–145. [Google Scholar]
- Salman, A.; Tsror, L.; Pomerantz, A.; Moreh, R.; Mordechai, S.; Huleihel, M. FTIR spectroscopy for detection and identification of fungal phytopathogenes. Spectroscopy 2010, 24, 261–267. [Google Scholar] [CrossRef]
- Łopusiewicz, L.; Mazurkiewicz-Zapalowicz, K.; Tkaczuk, C. Chemical changes in spores of the entomopathogenic fungus Metarhizium robertsii after exposure to heavy metals, studied through the use of FTIR spectroscopy. J. Elem. 2019, 25, 487–499. [Google Scholar] [CrossRef]
- Nakamoto, K.; Brown, C.W. Introductory Raman Spectroscopy, 2nd ed.; Elsevier: Amsterdam, The Netherlands, 2003. [Google Scholar]
- Lee, K.S.; Landry, Z.; Pereira, F.C.; Wagner, M.; Berry, D.; Huang, W.E.; Taylor, G.T.; Kneipp, J.; Popp, J.; Zhang, M.; et al. Raman microspectroscopy for microbiology. Nat. Rev. Methods Prim. 2021, 1, 80. [Google Scholar] [CrossRef]
- Váradi, L.; Luo, J.L.; Hibbs, D.E.; Perry, J.D.; Anderson, R.J.; Orenga, S.; Groundwater, P.W. Methods for the detection and identification of pathogenic bacteria: Past, present, and future. Chem. Soc. Rev. 2017, 46, 4818–4832. [Google Scholar] [CrossRef]
- Ashton, L.; Lau, K.; Winder, C.L.; Goodacre, R. Raman spectroscopy: Lighting up the future of microbial identification. Futur. Microbiol. 2011, 6, 991–997. [Google Scholar] [CrossRef]
- Lin, Z.; Zhao, X.; Huang, J.; Liu, W.; Zheng, Y.; Yang, X.; Zhang, Y.; de la Chapelle, M.L.; Fu, W. Rapid screening of colistin-resistant Escherichia coli, Acinetobacter baumannii and Pseudomonas aeruginosa by the use of Raman spectroscopy and hierarchical cluster analysis. Analyst 2019, 144, 2803–2810. [Google Scholar] [CrossRef]
- Nakar, A.; Pistiki, A.; Ryabchykov, O.; Bocklitz, T.; Rösch, P.; Popp, J. Detection of multi-resistant clinical strains of E. coli with Raman spectroscopy. Anal. Bioanal. Chem. 2022, 414, 1481–1492. [Google Scholar] [CrossRef] [PubMed]
- Ciloglu, F.U.; Hora, M.; Gundogdu, A.; Kahraman, M.; Tokmakci, M.; Aydin, O. SERS-based sensor with a machine learning based effective feature extraction technique for fast detection of colistin-resistant Klebsiella pneumoniae. Anal. Chim. Acta 2022, 1221, 340094. [Google Scholar] [CrossRef] [PubMed]
- Mushtaq, A.; Nawaz, H.; Majeed, M.I.; Rashid, N.; Tahir, M.; Nawaz, M.Z.; Shahzad, K.; Dastgir, G.; Bari, R.Z.A.; Haq, A.U.; et al. Surface-enhanced Raman spectroscopy (SERS) for monitoring colistin-resistant and susceptible E. coli strains. Spectrochim. Acta Part A Mol. Biomol. Spectrosc. 2022, 278, 121315. [Google Scholar] [CrossRef] [PubMed]
- Hindler, J.A.; Humphries, R.M. Colistin MIC Variability by Method for Contemporary Clinical Isolates of Multidrug-Resistant Gram-Negative Bacilli. J. Clin. Microbiol. 2013, 51, 1678–1684. [Google Scholar] [CrossRef] [PubMed]
- Tan, T.Y.; Ng, S.Y. Comparison of Etest, Vitek and agar dilution for susceptibility testing of colistin. Clin. Microbiol. Infect. 2007, 13, 541–544. [Google Scholar] [CrossRef]
- Jayol, A.; Dubois, V.; Poirel, L.; Nordmann, P. Rapid Detection of Polymyxin-Resistant Enterobacteriaceae from Blood Cultures. J. Clin. Microbiol. 2016, 54, 2273–2277. [Google Scholar] [CrossRef]
- Nordmann, P.; Jayol, A.; Poirel, L. Rapid Detection of Polymyxin Resistance in Enterobacteriaceae. Emerg. Infect. Dis. 2016, 22, 1038–1043. [Google Scholar] [CrossRef]
- Saikia, D.; Jadhav, P.; Hole, A.R.; Krishna, C.M.; Singh, S.P. Growth Kinetics Monitoring of Gram-Negative Pathogenic Microbes Using Raman Spectroscopy. Appl. Spectrosc. 2022, 00037028221109624. [Google Scholar] [CrossRef]
- Krafft, C.; Neudert, L.; Simat, T.; Salzer, R. Near infrared Raman spectra of human brain lipids. Spectrochim. Acta Part A Mol. Biomol. Spectrosc. 2005, 61, 1529–1535. [Google Scholar] [CrossRef]
- Gogry, F.A.; Siddiqui, M.T.; Sultan, I.; Husain, F.M.; Al-Kheraif, A.A.; Ali, A.; Haq, Q.M.R. Colistin Interaction and Surface Changes Associated with mcr-1 Conferred Plasmid Mediated Resistance in E. coli and A. veronii Strains. Pharmaceutics 2022, 14, 295. [Google Scholar] [CrossRef]
- Movasaghi, Z.; Rehman, S.; Rehman, I.U. Raman Spectroscopy of Biological Tissues. Appl. Spectrosc. Rev. 2007, 42, 493–541. [Google Scholar] [CrossRef]
- Talari, A.C.S.; Movasaghi, Z.; Rehman, S.; Rehman, I.U. Raman Spectroscopy of Biological Tissues. Appl. Spectrosc. Rev. 2014, 50, 46–111. [Google Scholar] [CrossRef]
- Hartmann, M.; Berditsch, M.; Hawecker, J.; Ardakani, M.F.; Gerthsen, D.; Ulrich, A.S. Damage of the Bacterial Cell Envelope by Antimicrobial Peptides Gramicidin S and PGLa as Revealed by Transmission and Scanning Electron Microscopy. Antimicrob. Agents Chemother. 2010, 54, 3132–3142. [Google Scholar] [CrossRef] [PubMed]
- Biswas, S.; Brunel, J.-M.; Dubus, J.-C.; Reynaud-Gaubert, M.; Rolain, J.-M. Colistin: An update on the antibiotic of the 21st century. Expert Rev. Anti-Infect. Ther. 2012, 10, 917–934. [Google Scholar] [CrossRef] [PubMed]
- Pruss, A.; Kwiatkowski, P.; Łopusiewicz, Ł.; Masiuk, H.; Sobolewski, P.; Fijałkowski, K.; Sienkiewicz, M.; Smolak, A.; Giedrys-Kalemba, S.; Dołęgowska, B. Evaluation of Chemical Changes in Laboratory-Induced Colistin-Resistant Klebsiella pneumoniae. Int. J. Mol. Sci. 2021, 22, 7104. [Google Scholar] [CrossRef] [PubMed]
- Soon, R.L.; Nation, R.L.; Hartley, P.G.; Larson, I.; Li, J. Atomic Force Microscopy Investigation of the Morphology and Topography of Colistin-Heteroresistant Acinetobacter baumannii Strains as a Function of Growth Phase and in Response to Colistin Treatment. Antimicrob. Agents Chemother. 2009, 53, 4979–4986. [Google Scholar] [CrossRef]
- Ditta, A.; Nawaz, H.; Mahmood, T.; Majeed, M.; Tahir, M.; Rashid, N.; Muddassar, M.; Al-Saadi, A.; Byrne, H. Principal components analysis of Raman spectral data for screening of Hepatitis C infection. Spectrochim. Acta Part A Mol. Biomol. Spectrosc. 2019, 221, 117173. [Google Scholar] [CrossRef] [Green Version]


Publisher’s Note: MDPI stays neutral with regard to jurisdictional claims in published maps and institutional affiliations. |
© 2022 by the authors. Licensee MDPI, Basel, Switzerland. This article is an open access article distributed under the terms and conditions of the Creative Commons Attribution (CC BY) license (https://creativecommons.org/licenses/by/4.0/).
Share and Cite
Saikia, D.; Jadhav, P.; Hole, A.R.; Krishna, C.M.; Singh, S.P. Unraveling the Secrets of Colistin Resistance with Label-Free Raman Spectroscopy. Biosensors 2022, 12, 749. https://doi.org/10.3390/bios12090749
Saikia D, Jadhav P, Hole AR, Krishna CM, Singh SP. Unraveling the Secrets of Colistin Resistance with Label-Free Raman Spectroscopy. Biosensors. 2022; 12(9):749. https://doi.org/10.3390/bios12090749
Chicago/Turabian StyleSaikia, Dimple, Priyanka Jadhav, Arti R. Hole, Chilakapati Murali Krishna, and Surya P. Singh. 2022. "Unraveling the Secrets of Colistin Resistance with Label-Free Raman Spectroscopy" Biosensors 12, no. 9: 749. https://doi.org/10.3390/bios12090749