Flexible Glassy Carbon Multielectrode Array for In Vivo Multisite Detection of Tonic and Phasic Dopamine Concentrations

 , , , , and
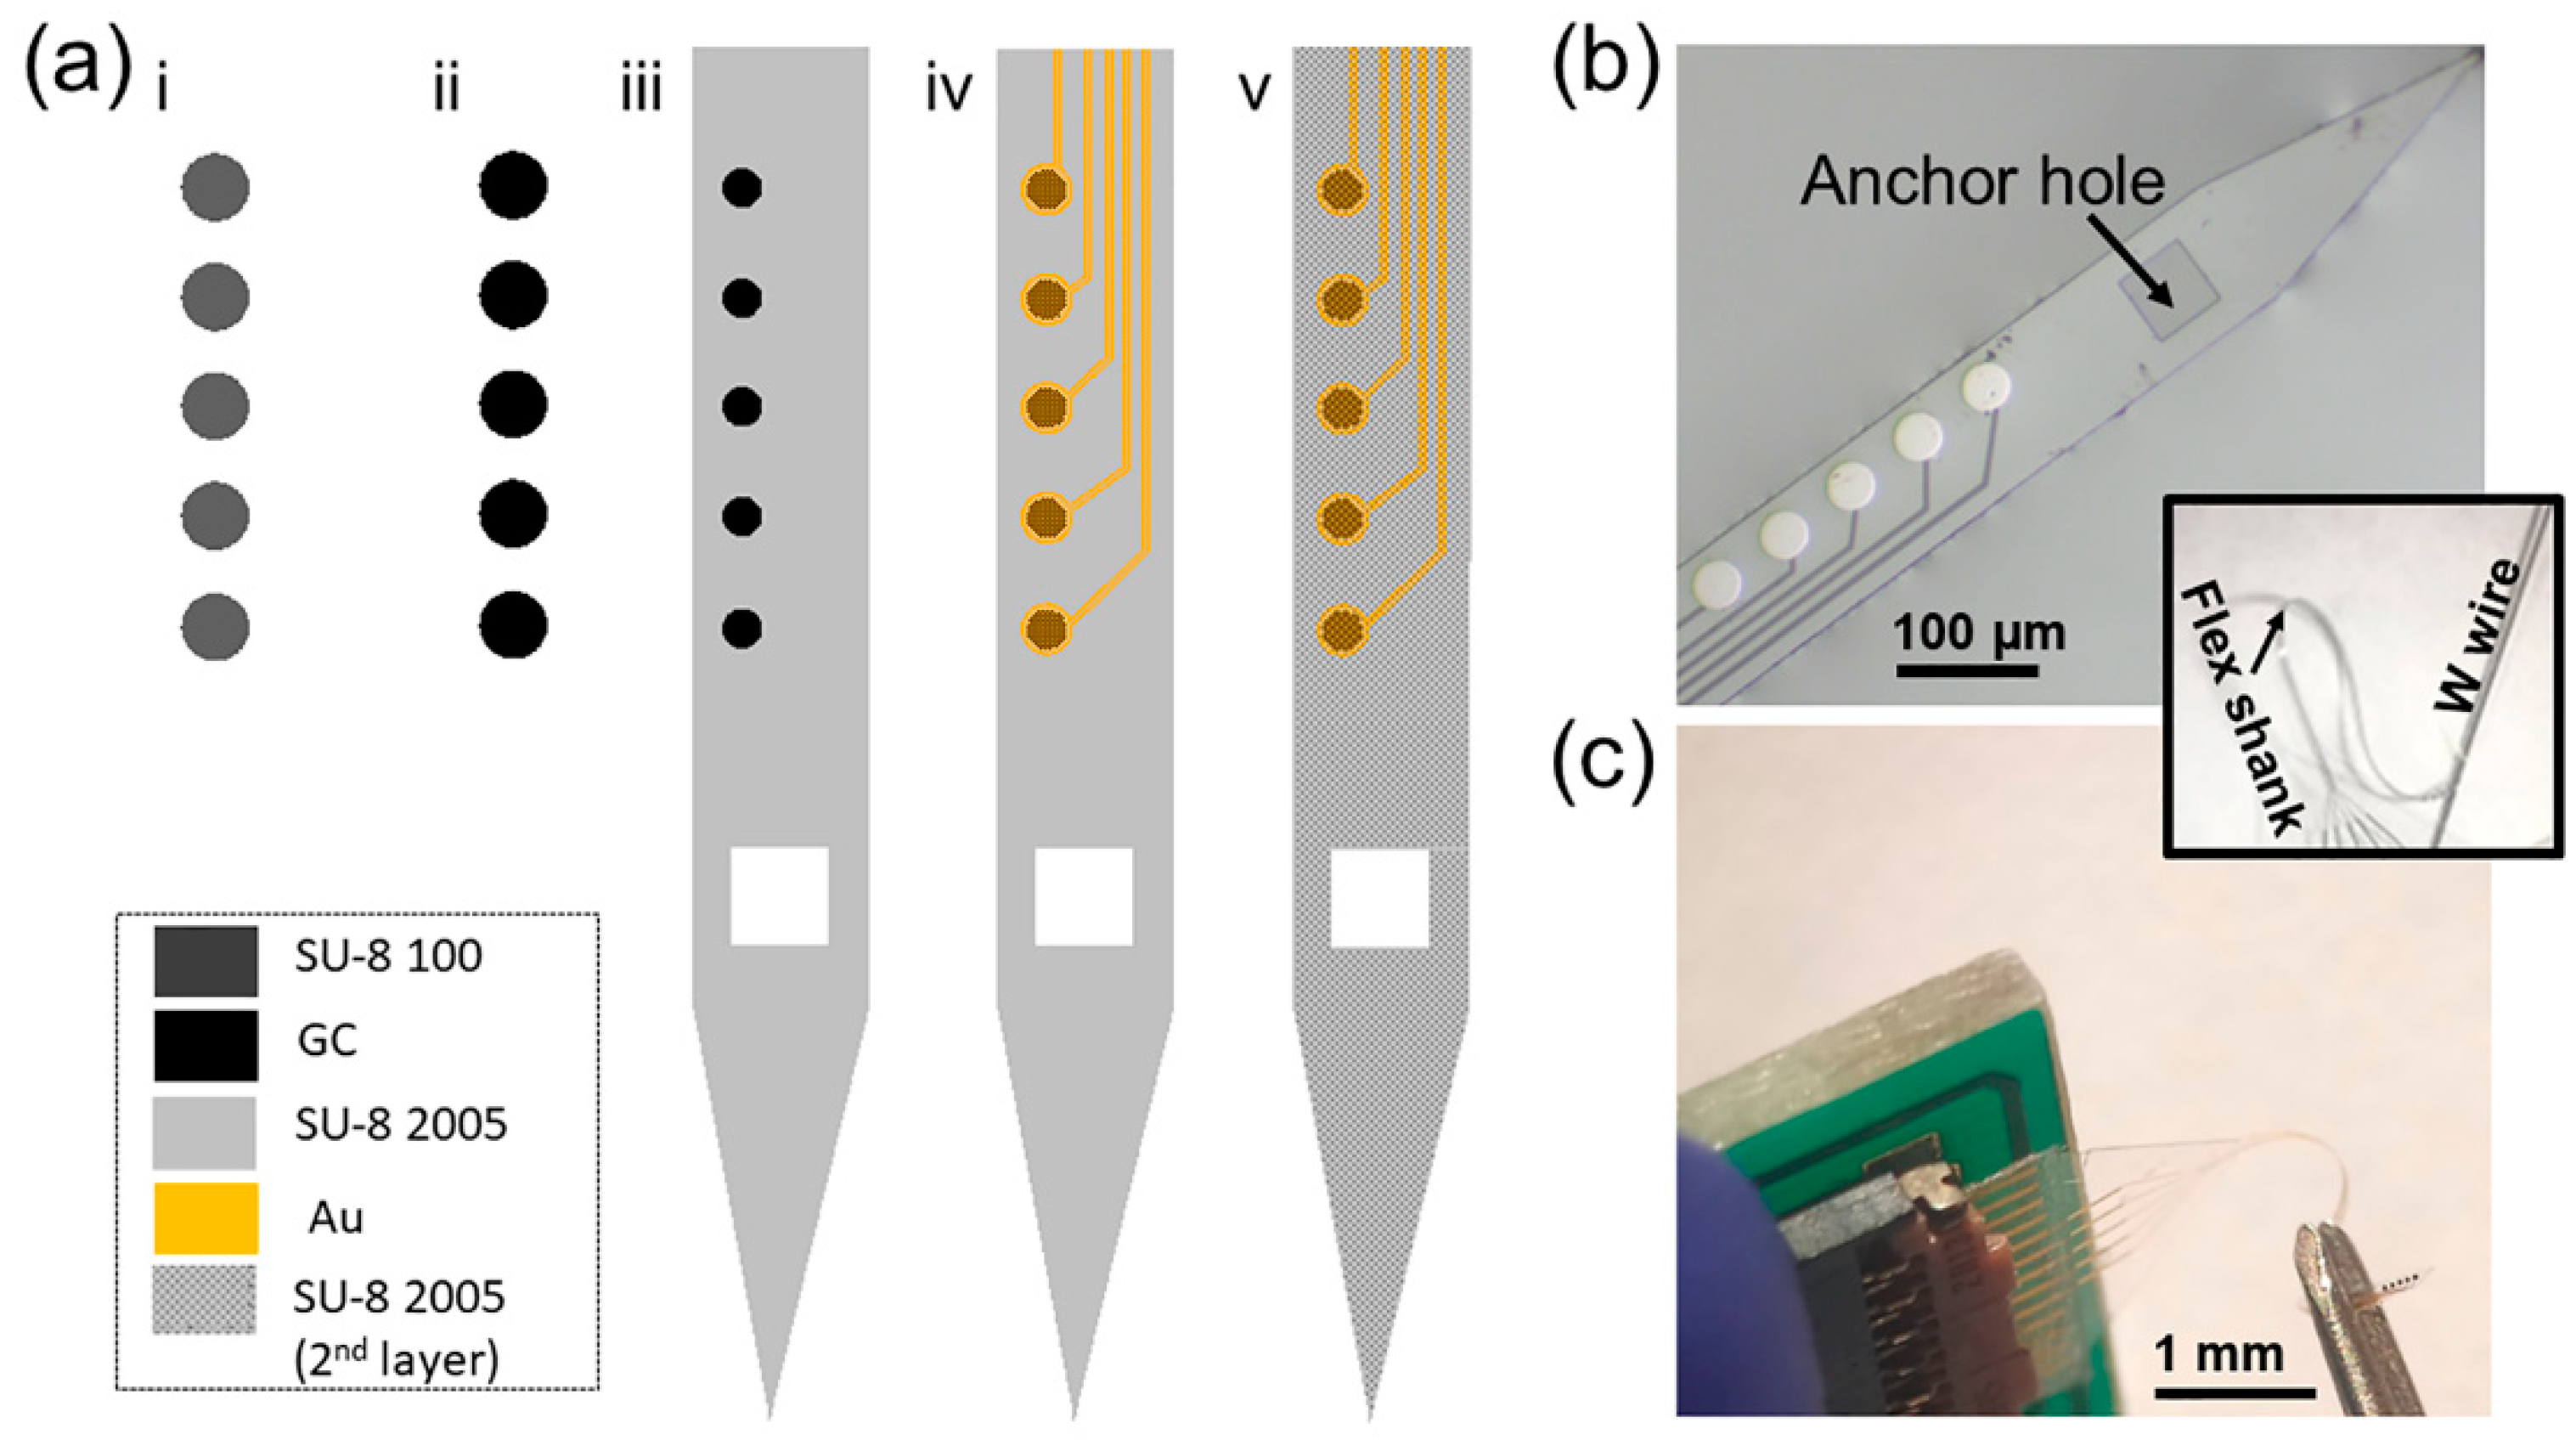
Abstract
:1. Introduction
2. Materials and Methods
2.1. GC MEA Fabrication
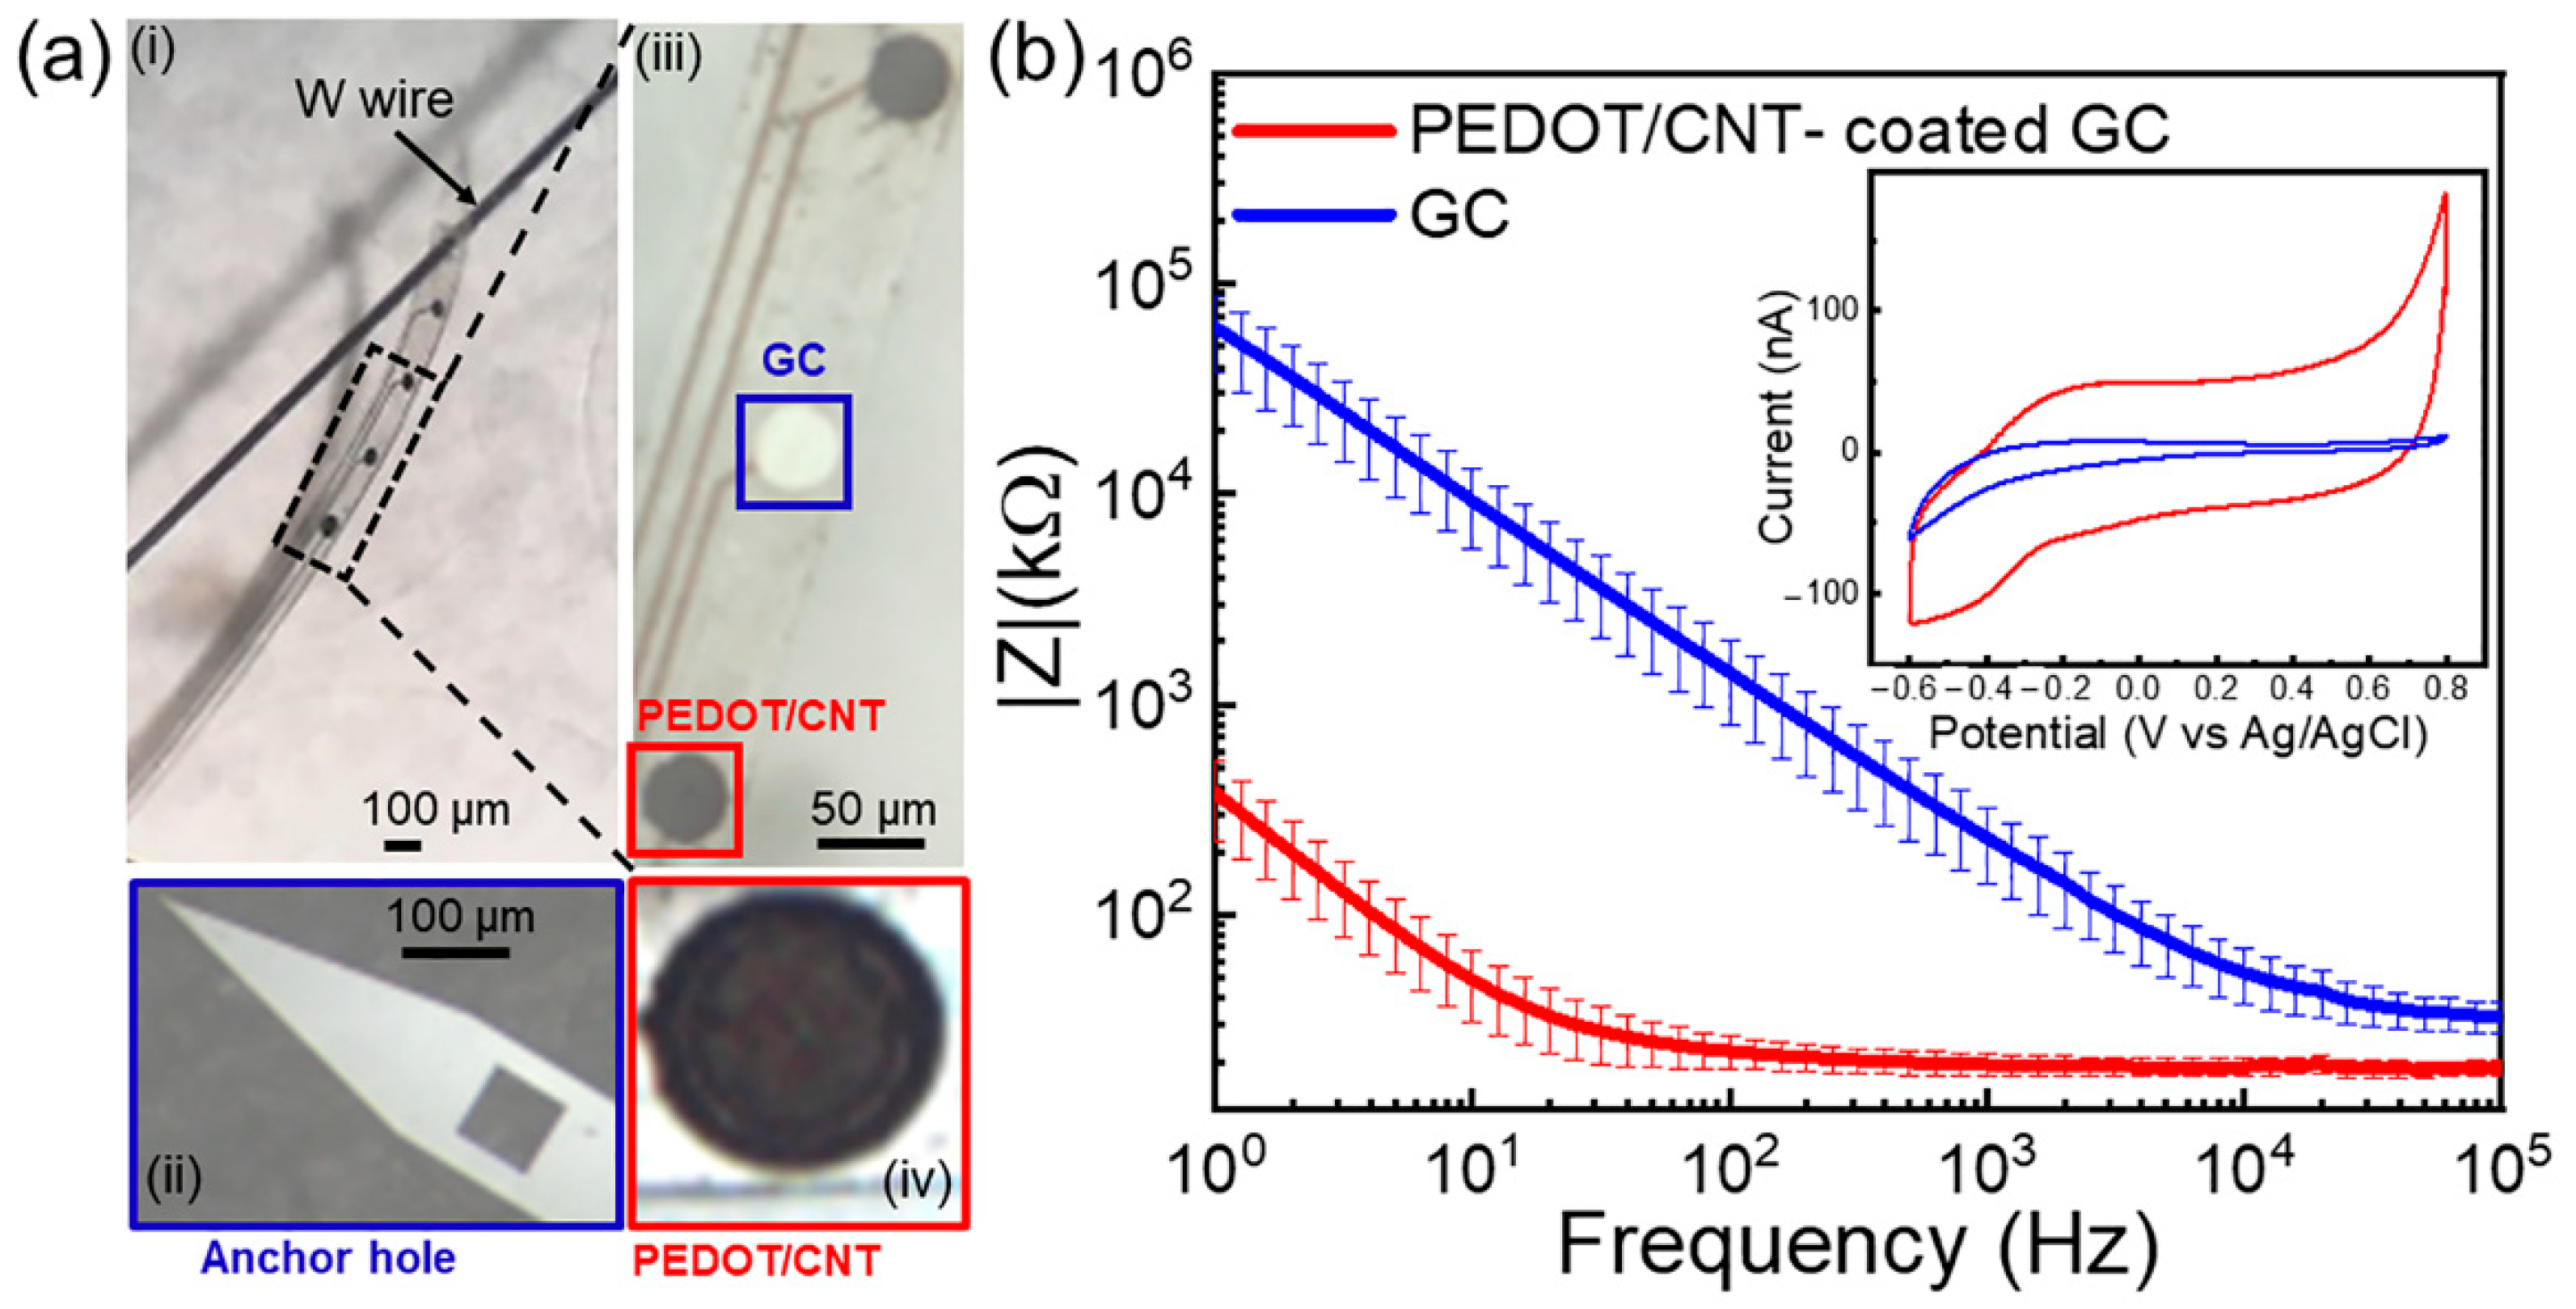
2.2. PEDOT/CNT Coating and Electrochemical Characterization
2.3. SWV In Vitro Calibration
2.4. FSCV In Vitro Calibration
2.5. In Vivo Procedures
3. Results and Discussion
3.1. GC MEA Fabrication
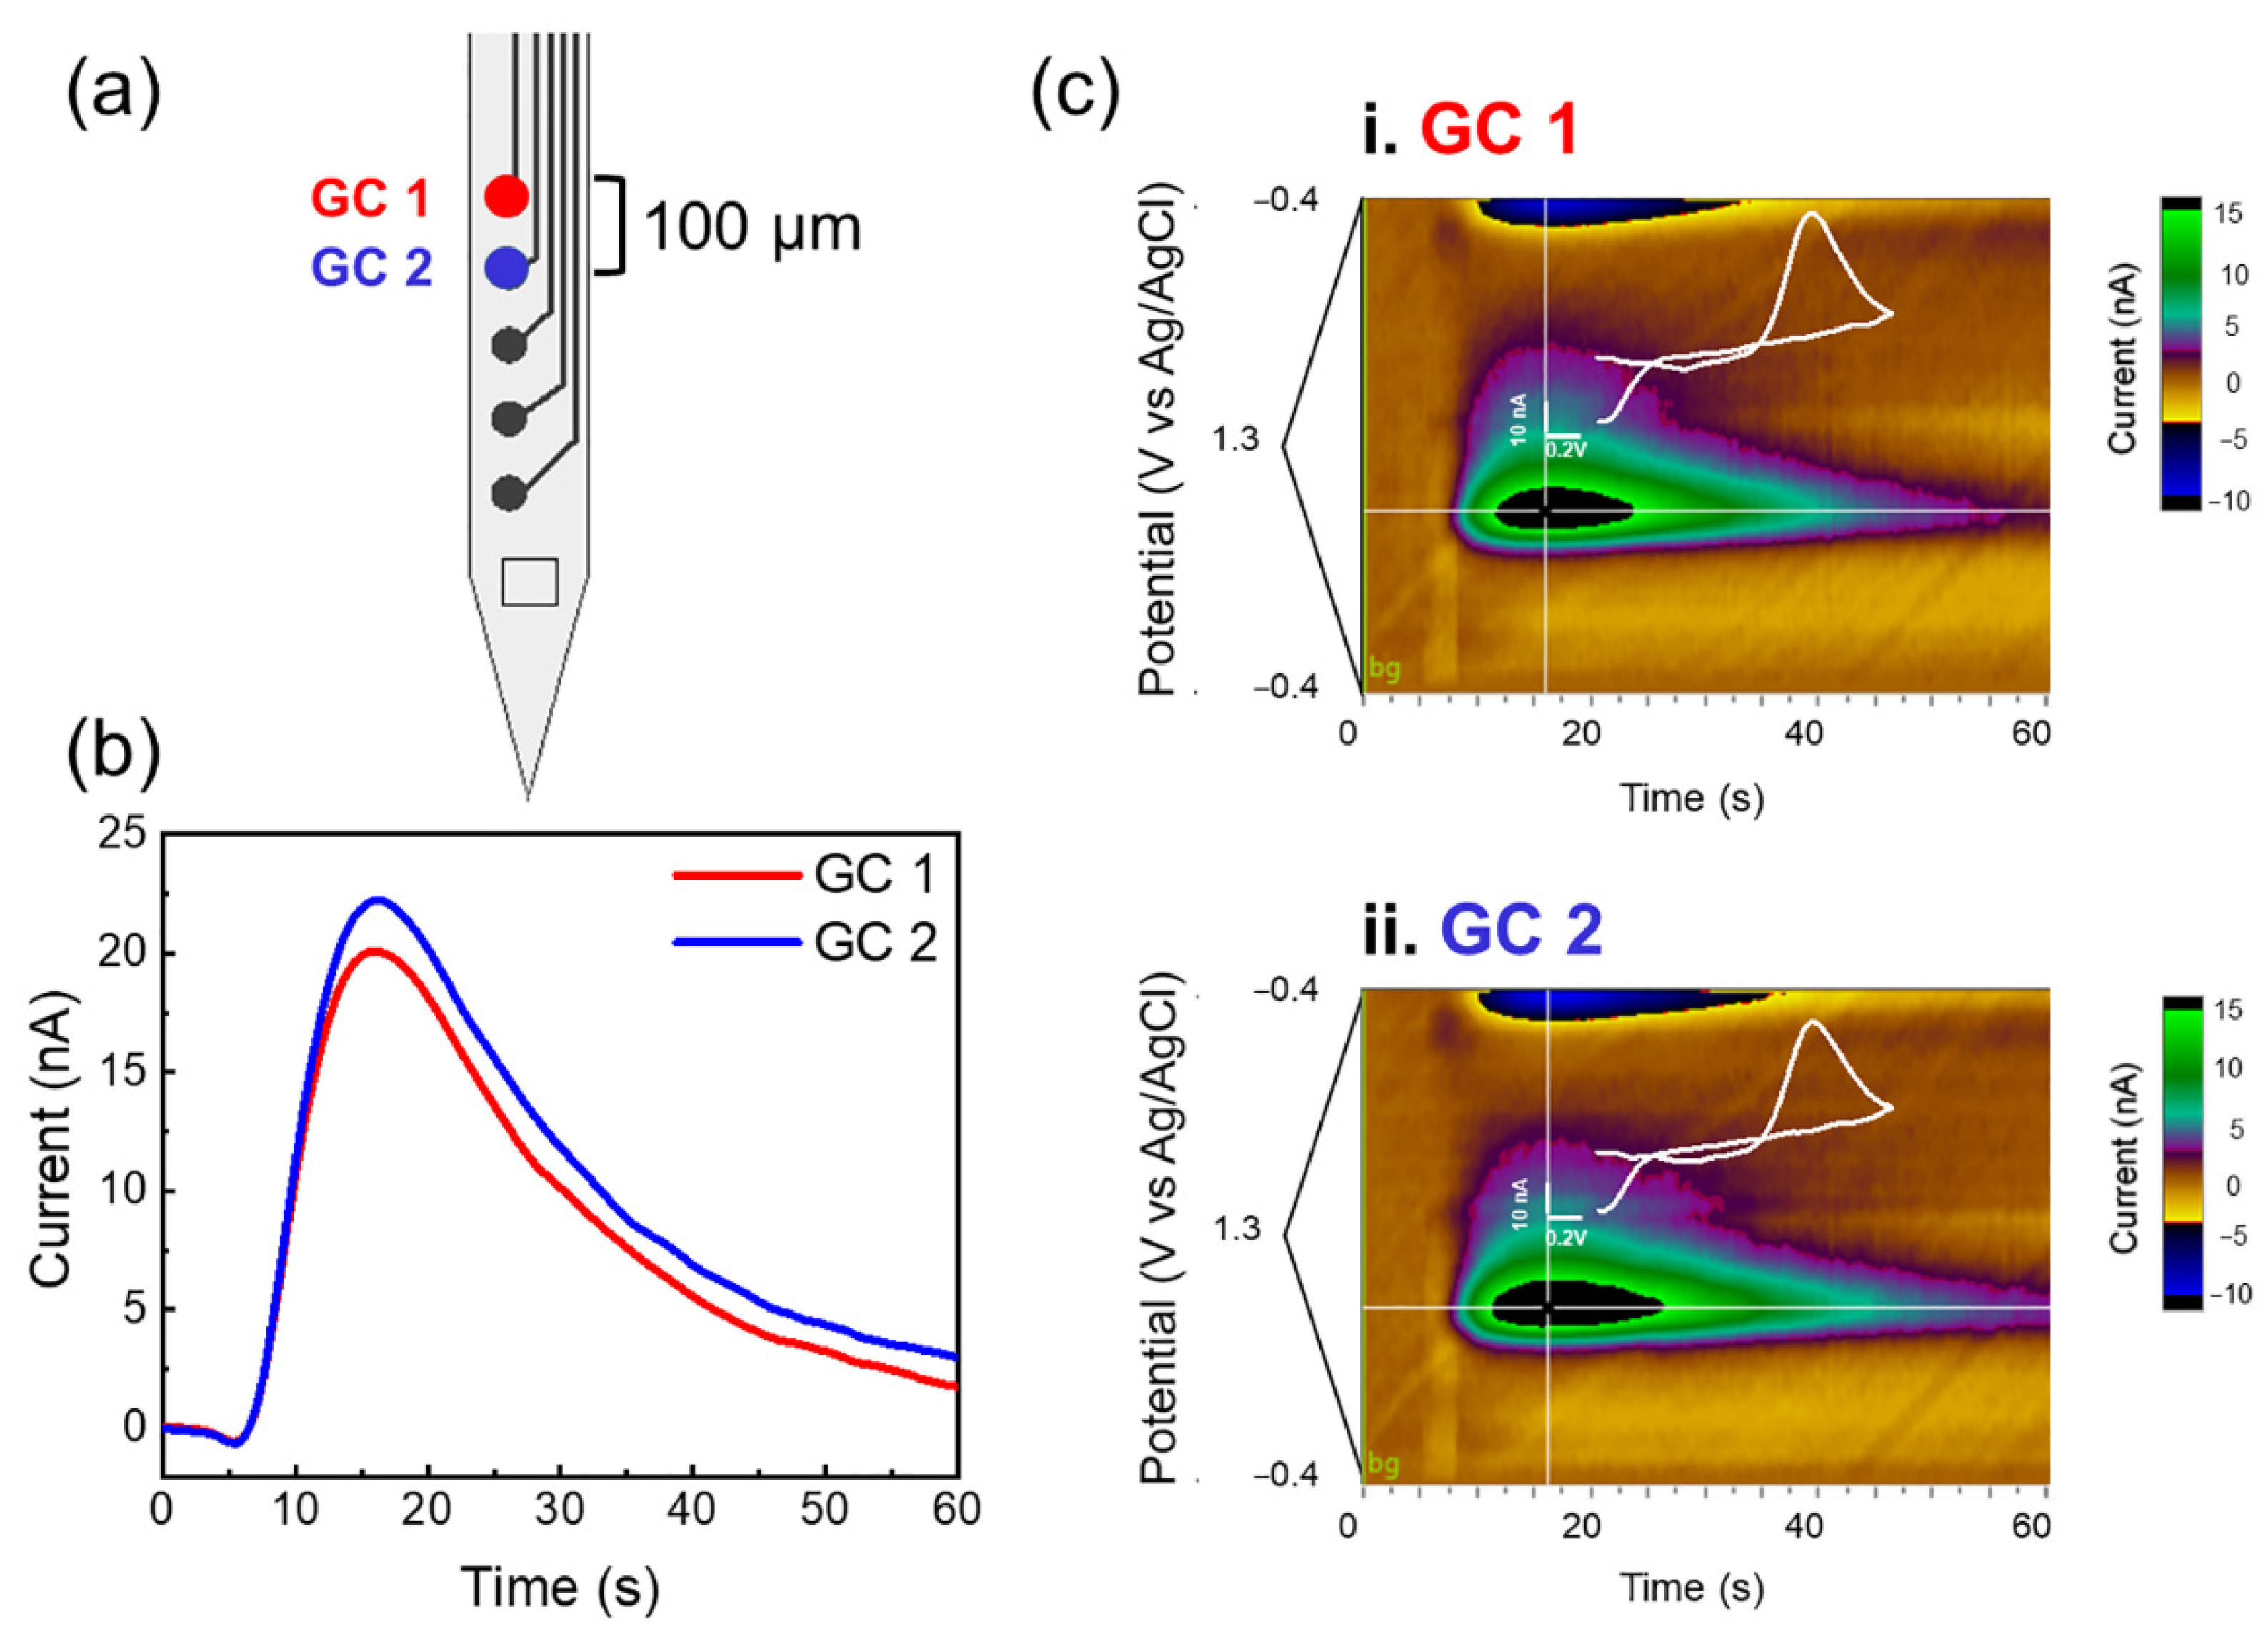
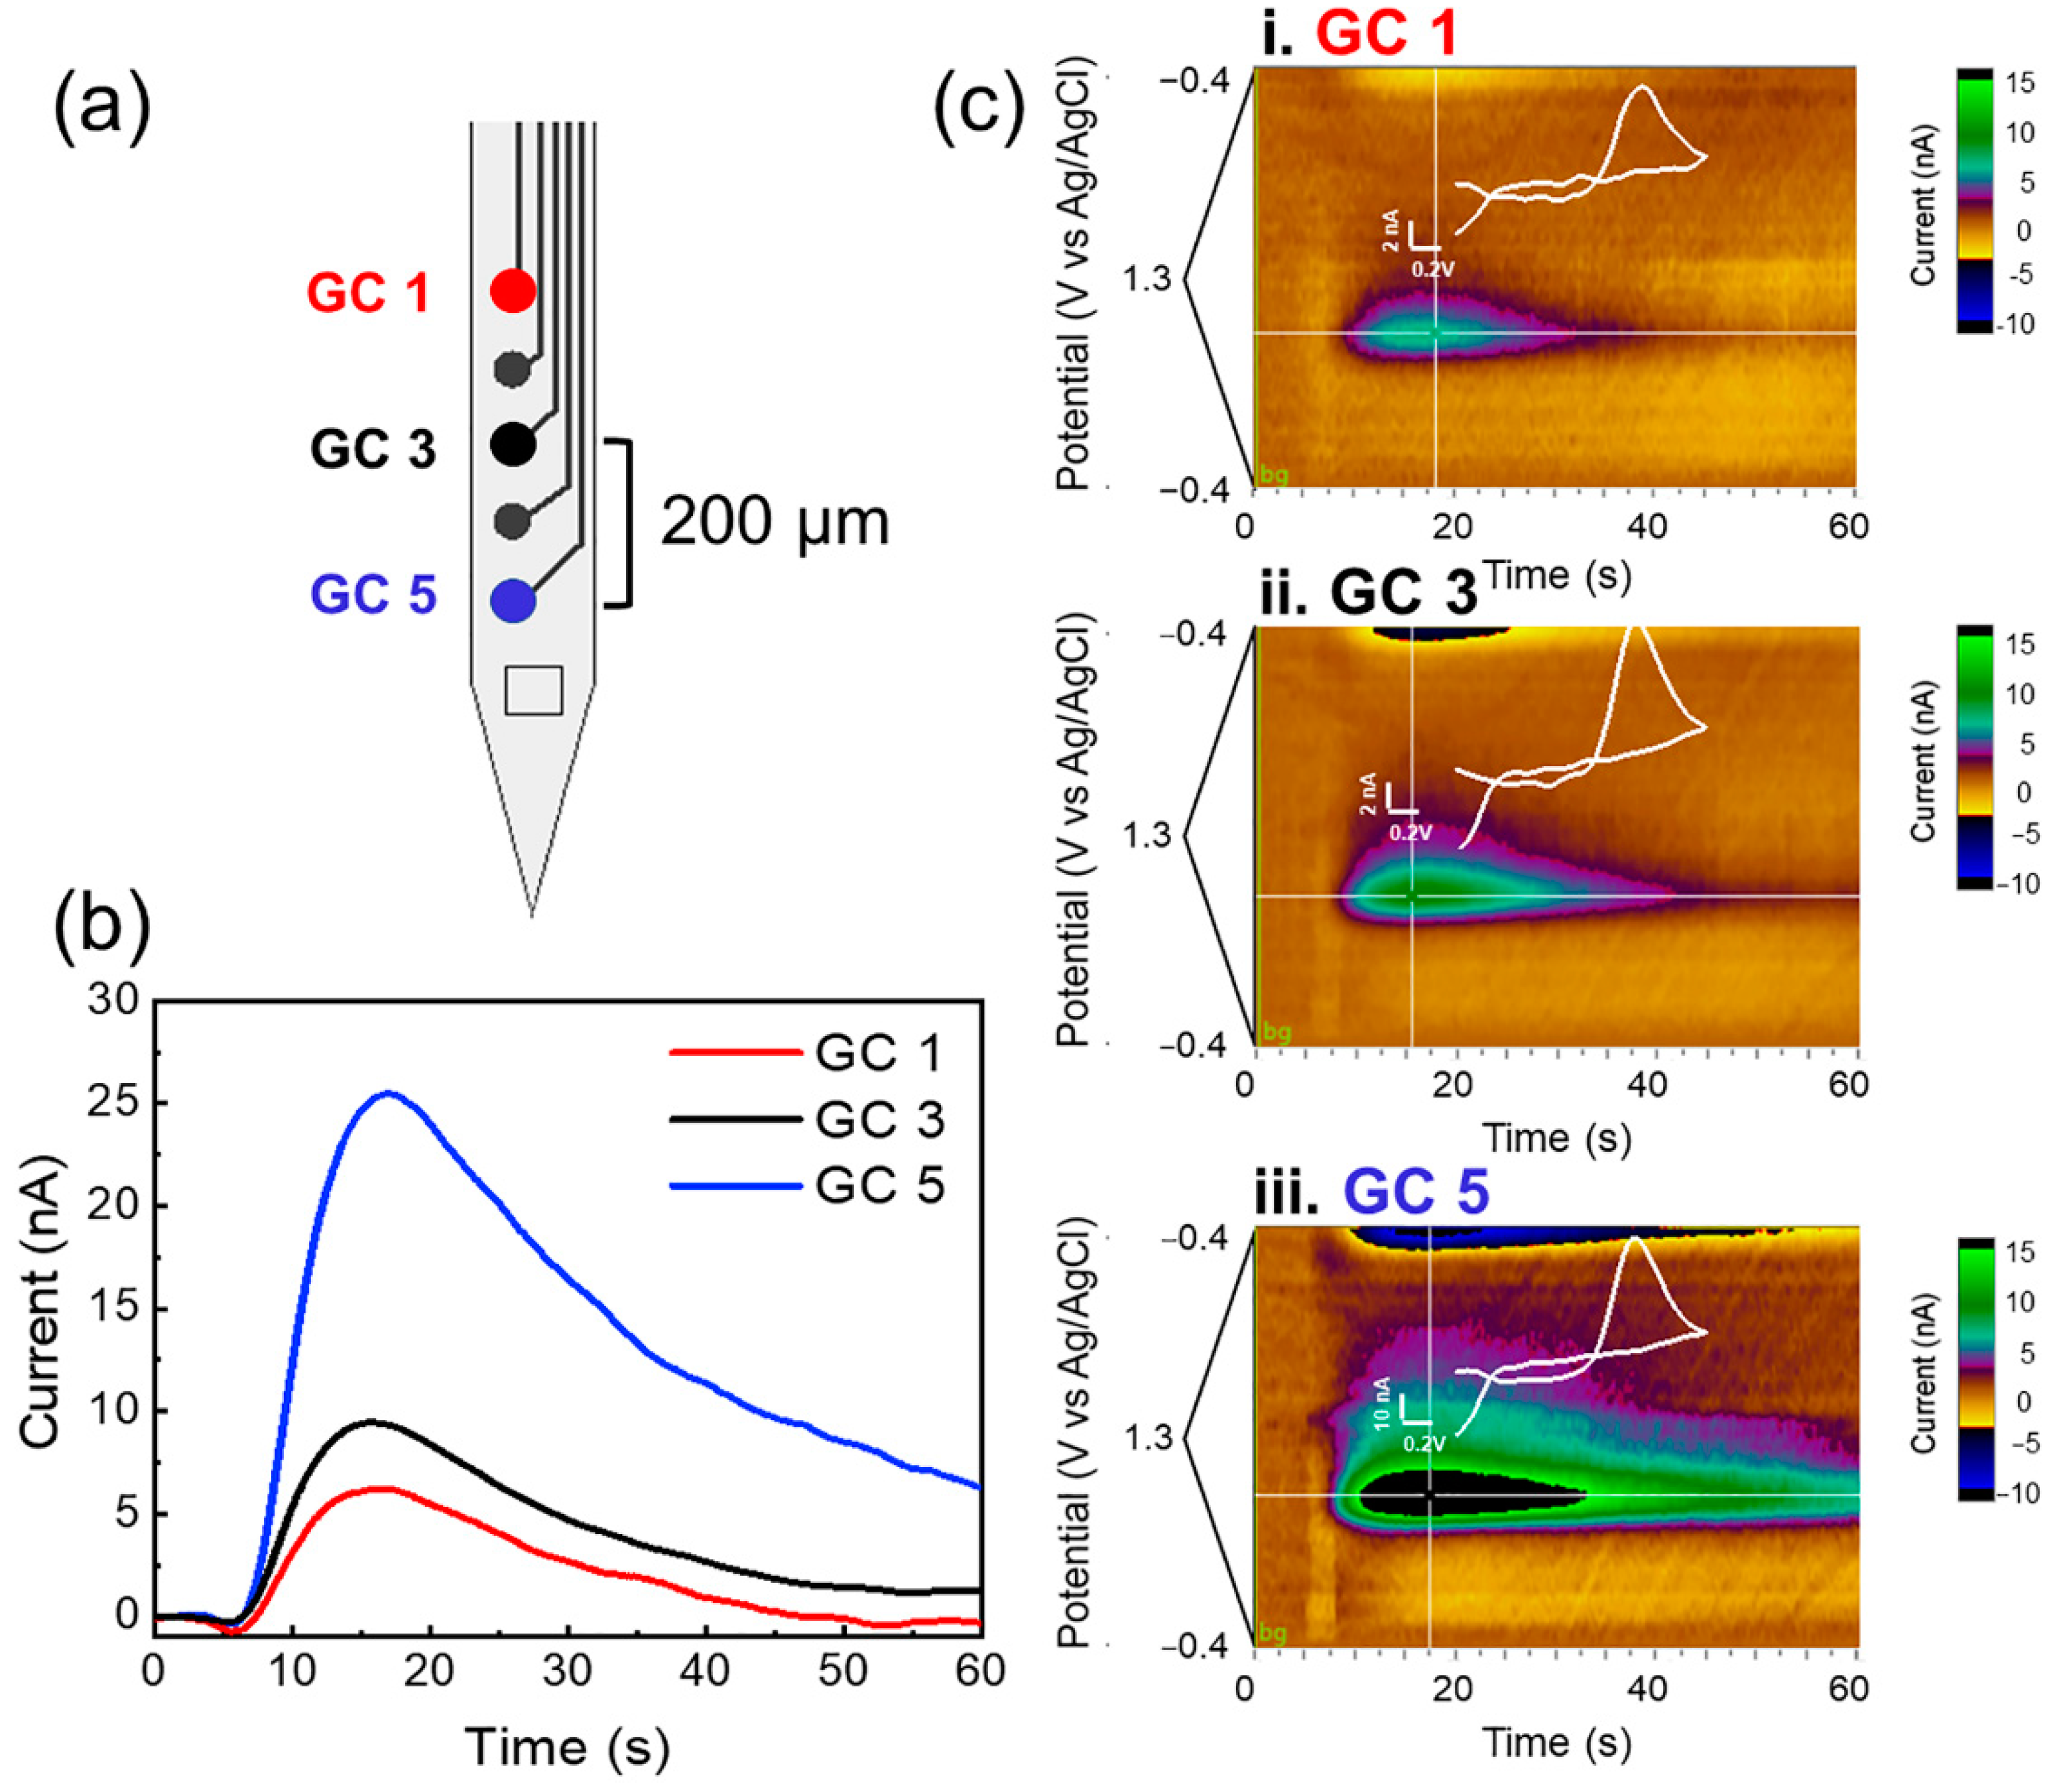
3.2. FSCV Capability of GC MEAs
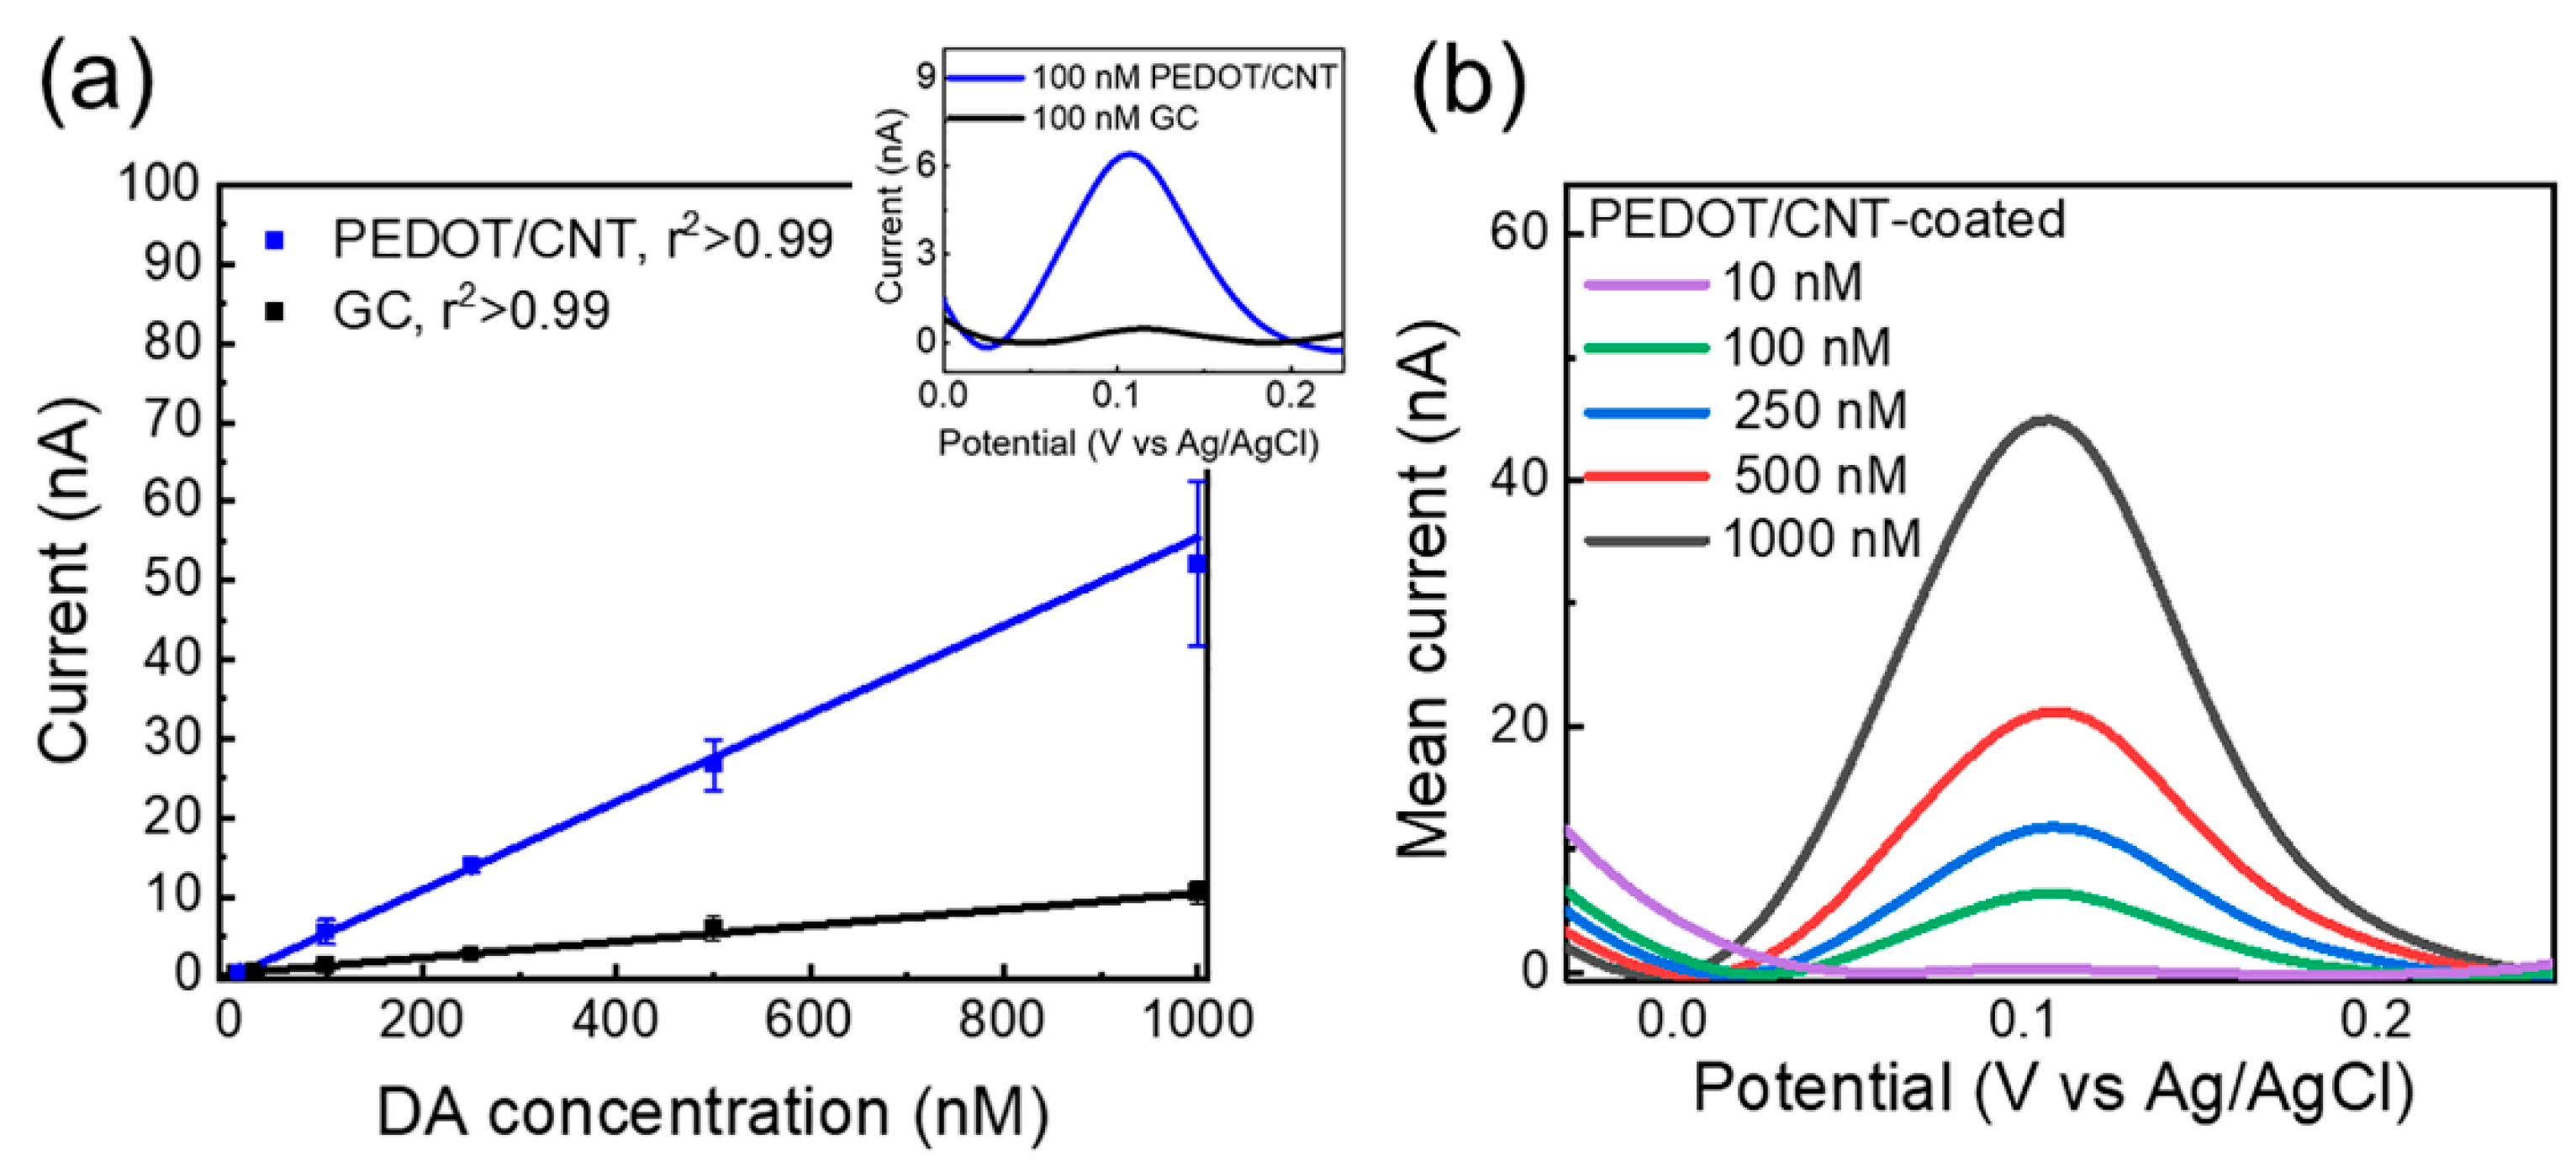
3.3. PEDOT/CNT Coating Enable Tonic DA Detection Using SWV
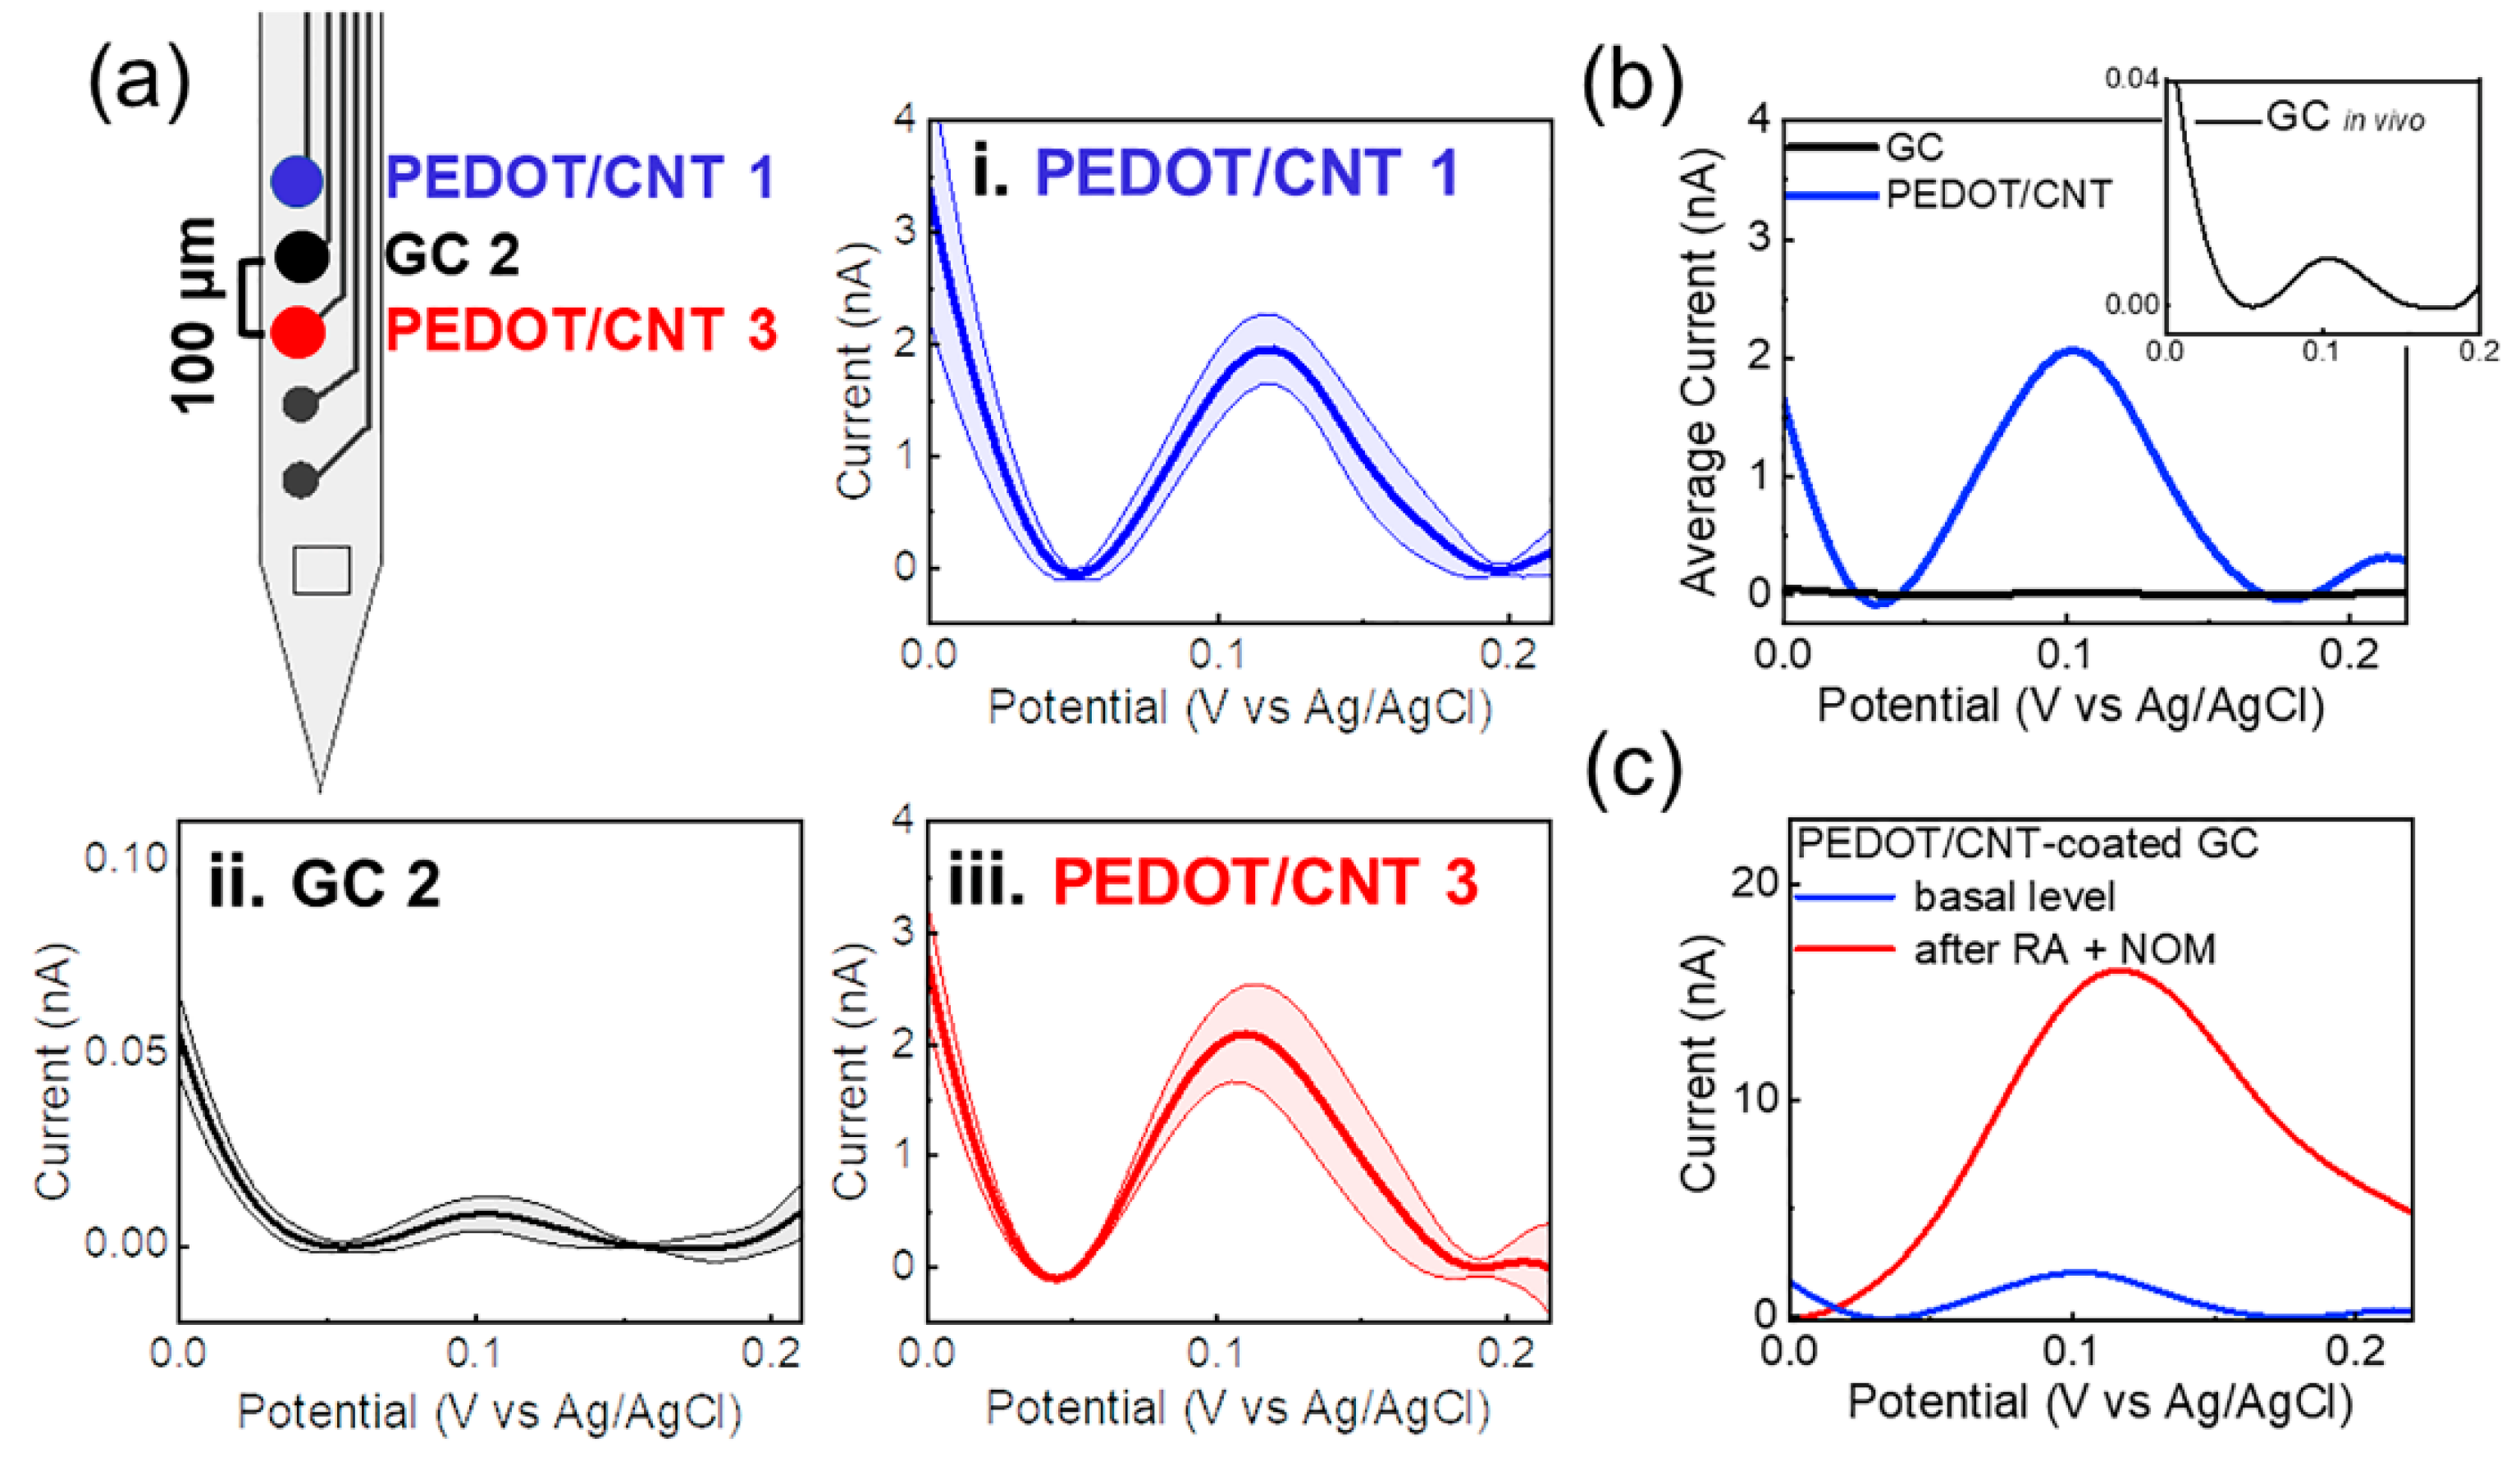
3.4. PEDOT/CNT-Coated GC MEAs Enable Multichannel Tonic DA Detection Using SWV
4. Conclusions
Supplementary Materials
Author Contributions
Funding
Institutional Review Board Statement
Informed Consent Statement
Data Availability Statement
Acknowledgments
Conflicts of Interest
References
- Ott, T.; Nieder, A. Dopamine and cognitive control in prefrontal cortex. Trends Cogn. Sci. 2019, 23, 213–234. [Google Scholar] [CrossRef] [PubMed]
- Nieoullon, A. Dopamine and the regulation of cognition and attention. Prog. Neurobiol. 2002, 67, 53–83. [Google Scholar] [CrossRef]
- Cools, R. Role of Dopamine in the motivational and cognitive control of behavior. Neuroscience 2008, 14, 381–395. [Google Scholar] [CrossRef] [PubMed]
- Aristieta, A.; Gittis, A. Distinct globus pallidus circuits regulate motor and cognitive functions. Trends Neurosci. 2021, 44, 597–599. [Google Scholar] [CrossRef]
- Dunigan, A.I.; Roseberry, A.G. Actions of feeding-related peptides on the mesolimbic dopamine system in regulation of natural and drug rewards. Addict. Neurosci. 2022, 2, 100011. [Google Scholar] [CrossRef]
- Wise, R.A.; Rompre, P.-P. Brain dopamine and reward. Ann. Rev. Psychol. 1989, 40, 191–225. [Google Scholar] [CrossRef]
- Panigrahi, B.; Martin, K.A.; Li, Y.; Graves, A.R.; Vollmer, A.; Olson, L.; Mensh, B.D.; Karpova, A.Y.; Dudman, J.T. Dopamine is required for the neural representation and control of movement vigor. Cell 2015, 162, 1418–1430. [Google Scholar] [CrossRef] [Green Version]
- Barter, J.W.; Eli, S.; Elu, D.; Bartholomew, R.A.; Rossi, M.; Shoemaker, C.T.; Esalas-Meza, D.; Egaidis, E.; Yin, H.H. Beyond reward prediction errors: The role of dopamine in movement kinematics. Front. Integr. Neurosci. 2015, 9, 39. [Google Scholar] [CrossRef] [Green Version]
- Groves, P.M. A theory of the functional organization of the neostriatum and the neostriatal control of voluntary movement. Brain Res. Rev. 1983, 5, 109–132. [Google Scholar] [CrossRef]
- Grace, A.A. Dysregulation of the dopamine system in the pathophysiology of schizophrenia and depression. Nat. Rev. Neurosci. 2016, 17, 524–532. [Google Scholar] [CrossRef]
- Zhang, L.; Doyon, W.M.; Clark, J.J.; Phillips, P.; Dani, J.A. Controls of tonic and phasic dopamine transmission in the dorsal and ventral striatum. Mol. Pharmacol. 2009, 76, 396–404. [Google Scholar] [CrossRef] [PubMed] [Green Version]
- Grace, A.A. The tonic/phasic model of dopamine system regulation and its implications for understanding alcohol and psychostimulant craving. Addiction 2000, 95, 119–128. [Google Scholar] [CrossRef] [PubMed]
- Grace, A. Phasic versus tonic dopamine release and the modulation of dopamine system responsivity: A hypothesis for the etiology of schizophrenia. Neuroscience 1991, 41, 1–24. [Google Scholar] [CrossRef]
- Höglinger, G.U.; Rizk, P.; Muriel, M.P.; Duyckaerts, C.; Oertel, W.H.; Caillé, I.; Hirsch, E.C. Dopamine depletion impairs precursor cell proliferation in Parkinson disease. Nat. Neurosci. 2004, 7, 726–735. [Google Scholar] [CrossRef] [PubMed]
- Lotharius, J.; Brundin, P. Pathogenesis of Parkinson’s disease: Dopamine, vesicles and α-synuclein. Nat. Rev. Neurosci. 2002, 3, 932–942. [Google Scholar] [CrossRef]
- Howes, O.; Kapur, S. The dopamine hypothesis of schizophrenia: Version III--The final common pathway. Schizophr. Bull. 2009, 35, 549–562. [Google Scholar] [CrossRef] [Green Version]
- Seeman, P. Dopamine receptors and the dopamine hypothesis of schizophrenia. Synapse 1987, 1, 133–152. [Google Scholar] [CrossRef]
- Di Chiara, G.J.D. The role of dopamine in drug abuse viewed from the perspective of its role in motivation. Drug. Alcohol Depend. 1995, 38, 95–137. [Google Scholar] [CrossRef]
- Botticelli, L.; Di Bonaventura, E.M.; Del Bello, F.; Giorgioni, G.; Piergentili, A.; Romano, A.; Quaglia, W.; Cifani, C.; Di Bonaventura, M.V.M. Underlying susceptibility to eating disorders and drug abuse: Genetic and pharmacological aspects of dopamine D4 receptors. Nutrients 2020, 12, 2288. [Google Scholar] [CrossRef]
- Wise, R.A.; Robble, M.A.J. Dopamine and addiction. Annu. Rev. Psychol. 2020, 71, 79–106. [Google Scholar] [CrossRef]
- Bello, N.T.; Hajnal, A. Dopamine and binge eating behaviors. Pharmacol. Biochem. Behav. 2010, 97, 25–33. [Google Scholar] [CrossRef] [PubMed] [Green Version]
- Frieling, H.; Römer, K.D.; Scholz, S.; Mittelbach, F.; Wilhelm, J.; De Zwaan, M.; Jacoby, G.E.; Kornhuber, J.; Hillemacher, T.; Bleich, S. Epigenetic dysregulation of dopaminergic genes in eating disorders. Int. J. Eat. Disord. 2010, 43, 577–583. [Google Scholar] [CrossRef] [PubMed]
- Volkow, N.D.; Wang, G.-J.; Maynard, L.; Jayne, M.; Fowler, J.S.; Zhu, W.; Logan, J.; Gatley, S.J.; Ding, Y.-S.; Wong, C.; et al. Brain dopamine is associated with eating behaviors in humans. Int. J. Eat. Disord. 2003, 33, 136–142. [Google Scholar] [CrossRef] [PubMed]
- Denys, D.; Zohar, J.; Westenberg, H.G.M. The role of dopamine in obsessive-compulsive disorder: Preclinical and clinical evidence. J. Clin. Psychiatry 2004, 65, 11–17. [Google Scholar] [PubMed]
- Koo, M.-S.; Kim, E.-J.; Roh, D.; Kim, C.-H. Role of dopamine in the pathophysiology and treatment of obsessive–compulsive disorder. Expert Rev. Neurother. 2010, 10, 275–290. [Google Scholar] [CrossRef]
- Denys, D.; van der Wee, N.; Janssen, J.; De Geus, F.; Westenberg, H.G. Low level of dopaminergic D2 receptor binding in obsessive-compulsive disorder. Biol. Psychiatry 2004, 55, 1041–1045. [Google Scholar] [CrossRef]
- Grace, A.A. The tonic/phasic model of dopamine system regulation: Its relevance for understanding how stimulant abuse can alter basal ganglia function. Drug Alcohol Depend. 1995, 37, 111–129. [Google Scholar] [CrossRef]
- Budygin, E.A.; Bass, C.E.; Grinevich, V.P.; Deal, A.L.; Bonin, K.D.; Weiner, J.L. Opposite consequences of tonic and phasic increases in accumbal dopamine on alcohol-seeking behavior. iScience 2020, 23, 100877. [Google Scholar] [CrossRef] [Green Version]
- Buse, J.; Schoenefeld, K.; Münchau, A.; Roessner, V. Neuromodulation in Tourette syndrome: Dopamine and beyond. Neurosci. Biobehav. Rev. 2013, 37, 1069–1084. [Google Scholar] [CrossRef]
- Denys, D.; de Vries, F.; Cath, D.; Figee, M.; Vulink, N.; Veltman, D.J.; van der Doef, T.F.; Boellaard, R.; Westenberg, H.; van Balkom, A.; et al. Dopaminergic activity in Tourette syndrome and obsessive-compulsive disorder. Eur. Neuropsychopharmacol. 2013, 23, 1423–1431. [Google Scholar] [CrossRef] [Green Version]
- Marklund, P.; Larsson, A.; Elgh, A.; Linder, J.; Riklund, K.A.; Forsgren, L.; Nyberg, L. Temporal dynamics of basal ganglia under-recruitment in Parkinson’s disease: Transient caudate abnormalities during updating of working memory. Brain 2009, 132, 336–346. [Google Scholar] [CrossRef] [PubMed] [Green Version]
- Rafi, H.; Zestos, A.G. Review—Recent advances in FSCV detection of neurochemicals via waveform and carbon microelectrode modification. J. Electrochem. Soc. 2021, 168, 057520. [Google Scholar] [CrossRef] [PubMed]
- Robinson, D.; Venton, B.J.; Heien, M.L.; Wightman, R.M. Detecting subsecond dopamine release with fast-scan cyclic voltammetry in vivo. Clin. Chem. 2003, 49, 1763–1773. [Google Scholar] [CrossRef] [PubMed] [Green Version]
- Saylor, R.A.; Hersey, M.; West, A.; Buchanan, A.M.; Berger, S.N.; Nijhout, H.F.; Reed, M.C.; Best, J.; Hashemi, P. In vivo hippocampal serotonin dynamics in male and female mice: Determining effects of acute Escitalopram using fast scan cyclic voltammetry. Front. Neurosci. 2019, 13, 362. [Google Scholar] [CrossRef]
- Taylor, I.M.; Jaquins-Gerstl, A.; Sesack, S.R.; Michael, A.C. Domain-dependent effects of DAT inhibition in the rat dorsal striatum. J. Neurochem. 2012, 122, 283–294. [Google Scholar] [CrossRef]
- Taylor, I.M.; Nesbitt, K.M.; Walters, S.H.; Varner, E.L.; Shu, Z.; Bartlow, K.M.; Jaquins-Gerstl, A.S.; Michael, A.C. Kinetic diversity of dopamine transmission in the dorsal striatum. J. Neurochem. 2015, 133, 522–531. [Google Scholar] [CrossRef] [Green Version]
- Jacobs, C.B.; Ivanov, I.N.; Nguyen, M.D.; Zestos, A.G.; Venton, B.J. High temporal resolution measurements of dopamine with carbon nanotube yarn microelectrodes. Anal. Chem. 2014, 86, 5721–5727. [Google Scholar] [CrossRef] [Green Version]
- Keithley, R.B.; Takmakov, P.; Bucher, E.S.; Belle, A.M.; Owesson-White, C.A.; Park, J.; Wightman, R.M. Higher sensitivity dopamine measurements with faster-scan cyclic voltammetry. Anal. Chem. 2011, 83, 3563–3571. [Google Scholar] [CrossRef] [Green Version]
- Oh, Y.; Park, C.; Kim, D.H.; Shin, H.; Kang, Y.M.; DeWaele, M.; Lee, J.; Min, H.-K.; Blaha, C.D.; Bennet, K.E.; et al. Monitoring in vivo changes in tonic extracellular dopamine level by charge-balancing multiple waveform fast-scan cyclic voltammetry. Anal. Chem. 2016, 88, 10962–10970. [Google Scholar] [CrossRef]
- Wood, K.M.; Hashemi, P. Fast-scan cyclic voltammetry analysis of dynamic serotonin reponses to acute escitalopram. ACS Chem. Neurosci. 2013, 4, 715–720. [Google Scholar] [CrossRef] [Green Version]
- Swamy, B.E.K.; Venton, B.J. Carbon nanotube-modified microelectrodes for simultaneous detection of dopamine and serotonin in vivo. Analyst 2007, 132, 876–884. [Google Scholar] [CrossRef] [PubMed]
- Meunier, C.J.; McCarty, G.S.; Sombers, L.A. Drift subtraction for fast-scan cyclic voltammetry using double-waveform partial-least-squares regression. Anal. Chem. 2019, 91, 7319–7327. [Google Scholar] [CrossRef] [PubMed]
- DeWaele, M.; Oh, Y.; Park, C.; Kang, Y.M.; Shin, H.; Blaha, C.D.; Bennet, K.E.; Kim, I.Y.; Lee, K.H.; Jang, D.P. A baseline drift detrending technique for fast scan cyclic voltammetry. Analyst 2017, 142, 4317–4321. [Google Scholar] [CrossRef] [PubMed]
- Guida, F.; De Gregorio, D.; Palazzo, E.; Ricciardi, F.; Boccella, S.; Belardo, C.; Iannotta, M.; Infantino, R.; Formato, F.; Marabese, I.; et al. Behavioral, biochemical and electrophysiological changes in spared nerve injury model of neuropathic pain. Int. J. Mol. Sci. 2020, 21, 3396. [Google Scholar] [CrossRef]
- Zestos, A.; Kennedy, R.T. Microdialysis coupled with LC-MS/MS for in vivo neurochemical monitoring. AAPS J. 2017, 19, 1284–1293. [Google Scholar] [CrossRef]
- Bungay, P.M.; Newton-Vinson, P.; Isele, W.; Garris, P.A.; Justice, J.B., Jr. Microdialysis of dopamine interpreted with quantitative model incorporating probe implantation trauma. J. Neurochem. 2003, 86, 932–946. [Google Scholar] [CrossRef] [Green Version]
- Gardner, E.L.; Chen, J.; Paredes, W. Overview of chemical sampling techniques. J. Neurosci. Methods 1993, 48, 173–197. [Google Scholar] [CrossRef]
- Kennedy, R.T.; Watson, C.J.; Haskins, W.E.; Powell, D.H.; Strecker, R.E. In vivo neurochemical monitoring by microdialysis and capillary separations. Curr. Opin. Chem. Biol. 2002, 6, 659–665. [Google Scholar] [CrossRef]
- Krebs-Kraft, D.; Frantz, K.; Parent, M. In Vivo Microdialysis: A Method for Sampling Extracellular Fluid in Discrete Brain Regions. In Handbook of Neurochemistry and Molecular Neurobiology: Practical Neurochemistry Methods; Lajtha, A., Baker, G., Eds.; Springer: New, York, NY, USA, 2007; pp. 219–256. [Google Scholar]
- Yang, H.; Peters, J.L.; Michael, A.C. Coupled effects of mass transfer and uptake kinetics on in vivo microdialysis of dopamine. J. Neurochem. 2002, 71, 684–692. [Google Scholar] [CrossRef]
- Yang, H.; Thompson, A.B.; McIntosh, B.J.; Altieri, S.C.; Andrews, A.M. Physiologically relevant changes in serotonin resolved by fast microdialysis. ACS Chem. Neurosci. 2013, 4, 790–798. [Google Scholar] [CrossRef] [Green Version]
- Chefer, V.I.; Thompson, A.C.; Zapata, A.; Shippenberg, T.S. Overview of brain microdialysis. Curr. Protoc. Neurosci. 2009, 47, 7.1.1–7.1.28. [Google Scholar] [CrossRef] [PubMed] [Green Version]
- Beyene, A.G.; Yang, S.J.; Landry, M.P. Tools and trends for probing brain neurochemistry. J. Vac. Sci. Technol. A: Vacuum, Surfaces Films 2019, 37, 040802. [Google Scholar] [CrossRef] [PubMed] [Green Version]
- Di Chiara, G.; Tanda, G.; Carboni, E. Estimation of in-vivo neurotransmitter release by brain microdialysis: The issue of validity. Behav. Pharmacol. 1996, 7, 640–657. [Google Scholar] [CrossRef] [PubMed]
- Jaquins-Gerstl, A.; Michael, A.C. A review of the effects of FSCV and microdialysis measurements on dopamine release in the surrounding tissue. Analyst 2015, 140, 3696–3708. [Google Scholar] [CrossRef] [Green Version]
- Atcherley, C.W.; Laude, N.D.; Parent, K.L.; Heien, M.L. Fast-scan controlled-adsorption voltammetry for the quantification of absolute concentrations and adsorption dynamics. Langmuir 2013, 29, 14885–14892. [Google Scholar] [CrossRef]
- Atcherley, C.W.; Wood, K.M.; Parent, K.L.; Hashemi, P.; Heien, M.L. The coaction of tonic and phasic dopamine dynamics. Chem. Commun. 2014, 51, 2235–2238. [Google Scholar] [CrossRef] [Green Version]
- Johnson, J.A.; Rodeberg, N.T.; Wightman, R.M. Measurement of basal neurotransmitter levels using convolution-based nonfaradaic current removal. Anal. Chem. 2018, 90, 7181–7189. [Google Scholar] [CrossRef]
- Schwerdt, H.N.; Zhang, E.; Kim, M.J.; Yoshida, T.; Stanwicks, L.; Amemori, S.; Dagdeviren, H.E.; Langer, R.; Cima, M.J.; Graybiel, A.M. Cellular-scale probes enable stable chronic subsecond monitoring of dopamine neurochemicals in a rodent model. Commun. Biol. 2018, 1, 144. [Google Scholar] [CrossRef] [Green Version]
- Schwerdt, H.N.; Shimazu, H.; Amemori, K.-I.; Amemori, S.; Tierney, P.L.; Gibson, D.J.; Hong, S.; Yoshida, T.; Langer, R.; Cima, M.J.; et al. Long-term dopamine neurochemical monitoring in primates. Proc. Natl. Acad. Sci. USA 2017, 114, 13260–13265. [Google Scholar] [CrossRef] [Green Version]
- Obien, M.E.J.; Deligkaris, K.; Ebullmann, T.; Bakkum, D.J.; Frey, U. Revealing neuronal function through microelectrode array recordings. Front. Neurosci. 2015, 8, 423. [Google Scholar] [CrossRef] [Green Version]
- FeiLi, D.; Schuettler, M.; Doerge, T.; Kammer, S.; Hoffmann, K.P.; Stieglitz, T. Flexible organic field effect transistors for biomedical microimplants using polyimide and parylene C as substrate and insulator layers. J. Micromech. Microeng. 2006, 16, 1555–1561. [Google Scholar] [CrossRef]
- Rubehn, B.; Wolff, S.B.E.; Tovote, P.; Lüthi, A.; Stieglitz, T. A polymer-based neural microimplant for optogenetic applications: Design and first in vivo study. Lab a Chip 2013, 13, 579–588. [Google Scholar] [CrossRef] [PubMed]
- Rutherford, E.C.; Pomerleau, F.; Huettl, P.; Strömberg, I.; Gerhardt, G.A. Chronic second-by-second measures of l-glutamate in the central nervous system of freely moving rats. J. Neurochem. 2007, 102, 712–722. [Google Scholar] [CrossRef] [PubMed] [Green Version]
- Edell, D.; Toi, V.; McNeil, V.; Clark, L. Factors influencing the biocompatibility of insertable silicon microshafts in cerebral cortex. IEEE Trans. Biomed. Eng. 1992, 39, 635–643. [Google Scholar] [CrossRef]
- Szarowski, D.; Andersen, M.; Retterer, S.; Spence, A.; Isaacson, M.; Craighead, H.; Turner, J.; Shain, W. Brain responses to micro-machined silicon devices. Brain Res. 2003, 983, 23–35. [Google Scholar] [CrossRef]
- Kozai, T.D.Y.; Jaquins-Gerstl, A.S.; Vazquez, A.L.; Michael, A.C.; Cui, X.T. Brain tissue responses to neural implants impact signal sensitivity and intervention strategies. ACS Chem. Neurosci. 2015, 6, 48–67. [Google Scholar] [CrossRef] [Green Version]
- Engstrom, R.C.; Wightman, R.M.; Kristensen, E.W. Diffusional distortion in the monitoring of dynamic events. Anal. Chem. 1988, 60, 652–656. [Google Scholar] [CrossRef]
- Kawagoe, K.; Garris, P.; Wiedemann, D.; Wightman, R. Regulation of transient dopamine concentration gradients in the microenvironment surrounding nerve terminals in the rat striatum. Neuroscience 1992, 51, 55–64. [Google Scholar] [CrossRef]
- Schwerdt, H.N.; Kim, M.; Karasan, E.; Amemori, S.; Homma, D.; Shimazu, H.; Yoshida, T.; Langer, R.; Graybiel, A.M.; Cima, M.J. Subcellular electrode arrays for multisite recording of dopamine in vivo. In Proceedings of the 2017 IEEE 30th International Conference on Micro Electro Mechanical Systems (MEMS), Las Vegas, NV, USA, 22–26 January 2017. [Google Scholar]
- Agorelius, J.; Tsanakalis, F.; Friberg, A.; Thorbergsson, P.T.; Pettersson, L.M.E.; Schouenborg, J. An array of highly flexible electrodes with a tailored configuration locked by gelatin during implantation—Initial evaluation in cortex cerebri of awake rats. Front. Neurosci. 2015, 9, 331. [Google Scholar] [CrossRef]
- Castagnola, E.; Maiolo, L.; Maggiolini, E.; Minotti, A.; Marrani, M.; Maita, F.; Pecora, A.; Angotzi, G.N.; Ansaldo, A.; Fadiga, L.; et al. Ultra-flexible and brain-conformable micro-electrocorticography device with low impedance PEDOT-carbon nanotube coated microelectrodes. In Proceedings of the 2013 6th International IEEE/EMBS Conference on Neural Engineering (NER), San Diego, CA, USA, 6–8 November 2013; pp. 927–930. [Google Scholar] [CrossRef]
- Nimbalkar, S.; Castagnola, E.; Balasubramani, A.; Scarpellini, A.; Samejima, S.; Khorasani, A.; Boissenin, A.; Thongpang, S.; Moritz, C.; Kassegne, S. Ultra-capacitive carbon neural probe allows simultaneous long-term electrical stimulations and high-resolution neurotransmitter detection. Sci. Rep. 2018, 8, 6958. [Google Scholar] [CrossRef] [Green Version]
- Liu, J. Syringe Injectable Electronics. In Biomimetics Through Nanoelectronics; Springer: Cham, Switzerland, 2018. [Google Scholar] [CrossRef]
- Luan, L.; Wei, X.; Zhao, Z.; Siegel, J.J.; Potnis, O.; Tuppen, C.A.; Lin, S.; Kazmi, S.; Fowler, R.A.; Holloway, S.; et al. Ultraflexible nanoelectronic probes form reliable, glial scar–free neural integration. Sci. Adv. 2017, 3, e1601966. [Google Scholar] [CrossRef] [PubMed] [Green Version]
- Zhao, Z.; Li, X.; He, F.; Wei, X.; Lin, S.; Xie, C. Parallel, minimally-invasive implantation of ultra-flexible neural electrode arrays. J. Neural Eng. 2019, 16, 035001. [Google Scholar] [CrossRef] [PubMed]
- Puthongkham, P.; Venton, B.J. Recent advances in fast-scan cyclic voltammetry. Analyst 2019, 145, 1087–1102. [Google Scholar] [CrossRef] [PubMed]
- Yang, C.; Denno, M.E.; Pyakurel, P.; Venton, B.J. Recent trends in carbon nanomaterial-based electrochemical sensors for biomolecules: A review. Anal. Chim. Acta 2015, 887, 17–37. [Google Scholar] [CrossRef] [PubMed] [Green Version]
- McCreery, R.L. Advanced carbon electrode materials for molecular electrochemistry. Chem. Rev. 2008, 108, 2646–2687. [Google Scholar] [CrossRef] [PubMed]
- Vomero, M.; Castagnola, E.; Ciarpella, F.; Maggiolini, E.; Goshi, N.; Zucchini, E.; Carli, S.; Fadiga, L.; Kassegne, S.; Ricci, D. Highly stable glassy carbon interfaces for long-term neural stimulation and low-noise recording of brain activity. Sci. Rep. 2017, 7, 40332. [Google Scholar] [CrossRef] [Green Version]
- Zachek, M. Development of Carbon-MEMS Based Device for the In Vivo Electrochemical Detection of Neurotransmitter Fluctuations; ProQuest: Ann Arbor, MI, USA, 2010. [Google Scholar]
- Castagnola, E.; Vahidi, N.W.; Nimbalkar, S.; Rudraraju, S.; Thielk, M.; Zucchini, E.; Cea, C.; Carli, S.; Gentner, T.Q.; Ricci, D.; et al. In vivo dopamine detection and single unit recordings using intracortical glassy carbon microelectrode arrays. MRS Adv. 2018, 3, 1629–1634. [Google Scholar] [CrossRef]
- Kassegne, S.; Vomero, M.; van Niekerk, P.; Hirabayashi, M. Glassy Carbon Microelectrodes for Neural Signal Sensing and Stimulation. In Book 2 Carbon-The Next Silicon?-Applications; Momentum Press: New York, NY, USA, 2016; pp. 101–122. [Google Scholar]
- Devi, M.; Vomero, M.; Fuhrer, E.; Castagnola, E.; Gueli, C.; Nimbalkar, S.; Hirabayashi, M.; Kassegne, S.; Stieglitz, T.; Sharma, S. Carbon-based neural electrodes: Promises and challenges. J. Neural Eng. 2021, 18, 041007. [Google Scholar] [CrossRef]
- Castagnola, E.; Thongpang, S.; Hirabayashi, M.; Nava, G.; Nimbalkar, S.; Nguyen, T.; Lara, S.; Oyawale, A.; Bunnell, J.; Moritz, C.; et al. Glassy carbon microelectrode arrays enable voltage-peak separated simultaneous detection of dopamine and serotonin using fast scan cyclic voltammetry. Analyst 2021, 146, 3955–3970. [Google Scholar] [CrossRef]
- Ansaldo, A.; Castagnola, E.; Maggiolini, E.; Fadiga, L.; Ricci, D. Superior electrochemical performance of carbon nanotubes directly grown on sharp microelectrodes. ACS Nano 2011, 5, 2206–2214. [Google Scholar] [CrossRef]
- Yang, C.; Jacobs, C.B.; Nguyen, M.D.; Ganesana, M.; Zestos, A.G.; Ivanov, I.N.; Puretzky, A.A.; Rouleau, C.M.; Geohegan, D.B.; Venton, B.J. Carbon nanotubes grown on metal microelectrodes for the detection of dopamine. Anal. Chem. 2015, 88, 645–652. [Google Scholar] [CrossRef] [PubMed]
- Kassegne, S.; Vomero, M.; Gavuglio, R.; Hirabayashi, M.; Özyilmaz, E.; Nguyen, S.; Rodriguez, J.; Özyilmaz, E.; Niekerk, N.; Khosla, A. Electrical impedance, electrochemistry, mechanical stiffness, and hardness tunability in glassy carbon MEMS μECoG electrodes. Microelectron. Eng. 2015, 133, 36–44. [Google Scholar] [CrossRef]
- Jurkiewicz, K.; Pawlyta, M.; Zygadło, D.; Chrobak, D.; Duber, S.; Wrzalik, R.; Ratuszna, A.; Burian, A. Evolution of glassy carbon under heat treatment: Correlation structure–mechanical properties. J. Mater. Sci. 2017, 53, 3509–3523. [Google Scholar] [CrossRef] [Green Version]
- Sharma, S.; Kumar, C.S.; Korvink, J.G.; Kübel, C. Evolution of glassy carbon microstructure: In situ transmission electron microscopy of the pyrolysis process. Sci. Rep. 2018, 8, 1–12. [Google Scholar] [CrossRef] [PubMed] [Green Version]
- Vomero, M.; van Niekerk, P.; Nguyen, V.; Gong, N.; Hirabayashi, M.; Cinopri, A.; Logan, K.; Moghadasi, A.; Varma, P.; Kassegne, S. A novel pattern transfer technique for mounting glassy carbon microelectrodes on polymeric flexible substrates. J. Micromechanics Microengineering 2016, 26, 25018. [Google Scholar] [CrossRef]
- Bard, A.J.; Faulkner, L.R.; White, H.S. Electrochemical Methods: Fundamentals and Applications; John Wiley & Sons: Hoboken, NJ, USA, 2022. [Google Scholar]
- Taylor, I.M.; Patel, N.A.; Freedman, N.C.; Castagnola, E.; Cui, X.T. Direct in vivo electrochemical detection of resting dopamine using Poly (3, 4-ethylenedioxythiophene)/Carbon Nanotube functionalized microelectrodes. Anal. Chem. 2019, 91, 12917–12927. [Google Scholar] [CrossRef]
- Kozai, T.D.Y.; Catt, K.; Du, Z.; Na, K.; Srivannavit, O.; Haque, R.-U.M.; Seymour, J.; Wise, K.D.; Yoon, E.; Cui, X.T. Chronic In vivo evaluation of PEDOT/CNT for stable neural recordings. IEEE Trans. Biomed. Eng. 2015, 63, 111–119. [Google Scholar] [CrossRef] [Green Version]
- Luo, X.; Weaver, C.L.; Zhou, D.D.; Greenberg, R.; Cui, X.T. Highly stable carbon nanotube doped poly(3,4-ethylenedioxythiophene) for chronic neural stimulation. Biomaterials 2011, 32, 5551–5557. [Google Scholar] [CrossRef] [Green Version]
- Rose, T.; Robblee, L. Electrical stimulation with Pt electrodes. VIII. Electrochemically safe charge injection limits with 0.2 ms pulses (neuronal application). IEEE Trans. Biomed. Eng. 1990, 37, 1118–1120. [Google Scholar] [CrossRef]
- Castagnola, E.; Robbins, E.M.; Woeppel, K.M.; McGuier, M.; Golabchi, A.; Taylor, I.M.; Michael, A.C.; Cui, X.T. Real-time fast scan cyclic voltammetry detection and quantification of exogenously administered melatonin in mice brain. Front. Bioeng. Biotechnol. 2020, 8, 602216. [Google Scholar] [CrossRef]
- Taylor, I.M.; Robbins, E.M.; Catt, K.A.; Cody, P.A.; Happe, C.L.; Cui, X.T. Enhanced dopamine detection sensitivity by PEDOT/graphene oxide coating on in vivo carbon fiber electrodes. Biosens. Bioelectron. 2017, 89, 400–410. [Google Scholar] [CrossRef] [PubMed] [Green Version]
- Walters, S.H.; Robbins, E.M.; Michael, A.C. Kinetic diversity of striatal dopamine: Evidence from a novel protocol for voltammetry. ACS Chem. Neurosci. 2016, 7, 662–667. [Google Scholar] [CrossRef] [PubMed]
- Robinson, J.D.; Howard, C.D.; Pastuzyn, E.D.; Byers, D.L.; Keefe, K.A.; Garris, P.A. Methamphetamine-induced neurotoxicity disrupts pharmacologically evoked dopamine transients in the dorsomedial and dorsolateral striatum. Neurotox. Res. 2014, 26, 152–167. [Google Scholar] [CrossRef] [PubMed] [Green Version]
- Wu, Q.; Reith, M.E.A.; Kuhar, M.J.; Carroll, F.I.; Garris, P.A. Preferential increases in nucleus accumbens dopamine after systemic cocaine administration are caused by unique characteristics of dopamine neurotransmission. J. Neurosci. 2001, 21, 6338–6347. [Google Scholar] [CrossRef] [Green Version]
- Castagnola, E.; Garg, R.; Rastogi, S.K.; Cohen-Karni, T.; Cui, X.T. 3D fuzzy graphene microelectrode array for dopamine sensing at sub-cellular spatial resolution. Biosens. Bioelectron. 2021, 191, 113440. [Google Scholar] [CrossRef]
- Collins, A.L.; Saunders, B.T. Heterogeneity in striatal dopamine circuits: Form and function in dynamic reward seeking. J. Neurosci. Res. 2020, 98, 1046–1069. [Google Scholar] [CrossRef]
- Lammel, S.; Lim, B.K.; Malenka, R.C. Reward and aversion in a heterogeneous midbrain dopamine system. Neuropharmacology 2014, 76, 351–359. [Google Scholar] [CrossRef] [Green Version]
- Mao, Z.; Davis, R.L. Eight different types of dopaminergic neurons innervate the Drosophila mushroom body neuropil: Anatomical and physiological heterogeneity. Front. Neural Circuits 2009, 3, 5. [Google Scholar] [CrossRef] [Green Version]
- Orazem, M.E.; Tribollet, B. Electrochemical Impedance Spectroscopy; John Wiley & Sons: Hoboken, NJ, USA, 2008; pp. 383–389. [Google Scholar]
- Cogan, S.F. Neural Stimulation and Recording Electrodes. Annu. Rev. Biomed. Eng. 2008, 10, 275–309. [Google Scholar] [CrossRef] [Green Version]
- Seaton, B.T.; Heien, M.L. Biocompatible reference electrodes to enhance chronic electrochemical signal fidelity in vivo. Anal. Bioanal. Chem. 2021, 413, 6689–6701. [Google Scholar] [CrossRef]
- Robbins, E.M.; Castagnola, E.; Cui, X.T. Accurate and Stable Chronic Voltammetric Measurements in the Brain Enabled by a Replaceable Subcutaneous Reference Electrode. Available online: https://ssrn.com/abstract=3985174 (accessed on 14 December 2021). [CrossRef]
- Seaton, B.T.; Hill, D.F.; Cowen, S.L.; Heien, M.L. Mitigating the effects of electrode biofouling-induced impedance for improved long-term electrochemical measurements in vivo. Anal. Chem. 2020, 92, 6334–6340. [Google Scholar] [CrossRef] [PubMed]
- Hanssen, B.; Siraj, S.; Wong, D.K. Recent strategies to minimise fouling in electrochemical detection systems. Rev. Anal. Chem. 2016, 35, 1–28. [Google Scholar] [CrossRef]
- Yang, C.; Trikantzopoulos, E.; Jacobs, C.B.; Venton, B.J. Evaluation of carbon nanotube fiber microelectrodes for neurotransmitter detection: Correlation of electrochemical performance and surface properties. Anal. Chim. Acta 2017, 965, 1–8. [Google Scholar] [CrossRef] [PubMed] [Green Version]
- Puthongkham, P.; Yang, C.; Venton, B.J. Carbon nanohorn-modified carbon fiber microelectrodes for dopamine detection. Electroanalysis 2018, 30, 1073–1081. [Google Scholar] [CrossRef] [PubMed]


Publisher’s Note: MDPI stays neutral with regard to jurisdictional claims in published maps and institutional affiliations. |
© 2022 by the authors. Licensee MDPI, Basel, Switzerland. This article is an open access article distributed under the terms and conditions of the Creative Commons Attribution (CC BY) license (https://creativecommons.org/licenses/by/4.0/).
Share and Cite
Castagnola, E.; Robbins, E.M.; Wu, B.; Pwint, M.Y.; Garg, R.; Cohen-Karni, T.; Cui, X.T. Flexible Glassy Carbon Multielectrode Array for In Vivo Multisite Detection of Tonic and Phasic Dopamine Concentrations. Biosensors 2022, 12, 540. https://doi.org/10.3390/bios12070540
Castagnola E, Robbins EM, Wu B, Pwint MY, Garg R, Cohen-Karni T, Cui XT. Flexible Glassy Carbon Multielectrode Array for In Vivo Multisite Detection of Tonic and Phasic Dopamine Concentrations. Biosensors. 2022; 12(7):540. https://doi.org/10.3390/bios12070540
Chicago/Turabian StyleCastagnola, Elisa, Elaine M. Robbins, Bingchen Wu, May Yoon Pwint, Raghav Garg, Tzahi Cohen-Karni, and Xinyan Tracy Cui. 2022. "Flexible Glassy Carbon Multielectrode Array for In Vivo Multisite Detection of Tonic and Phasic Dopamine Concentrations" Biosensors 12, no. 7: 540. https://doi.org/10.3390/bios12070540