Recent Advances in Inflammatory Diagnosis with Graphene Quantum Dots Enhanced SERS Detection

 , ,
, ,  , ,
, ,
Abstract
:1. Introduction
2. Graphene Quantum Dot
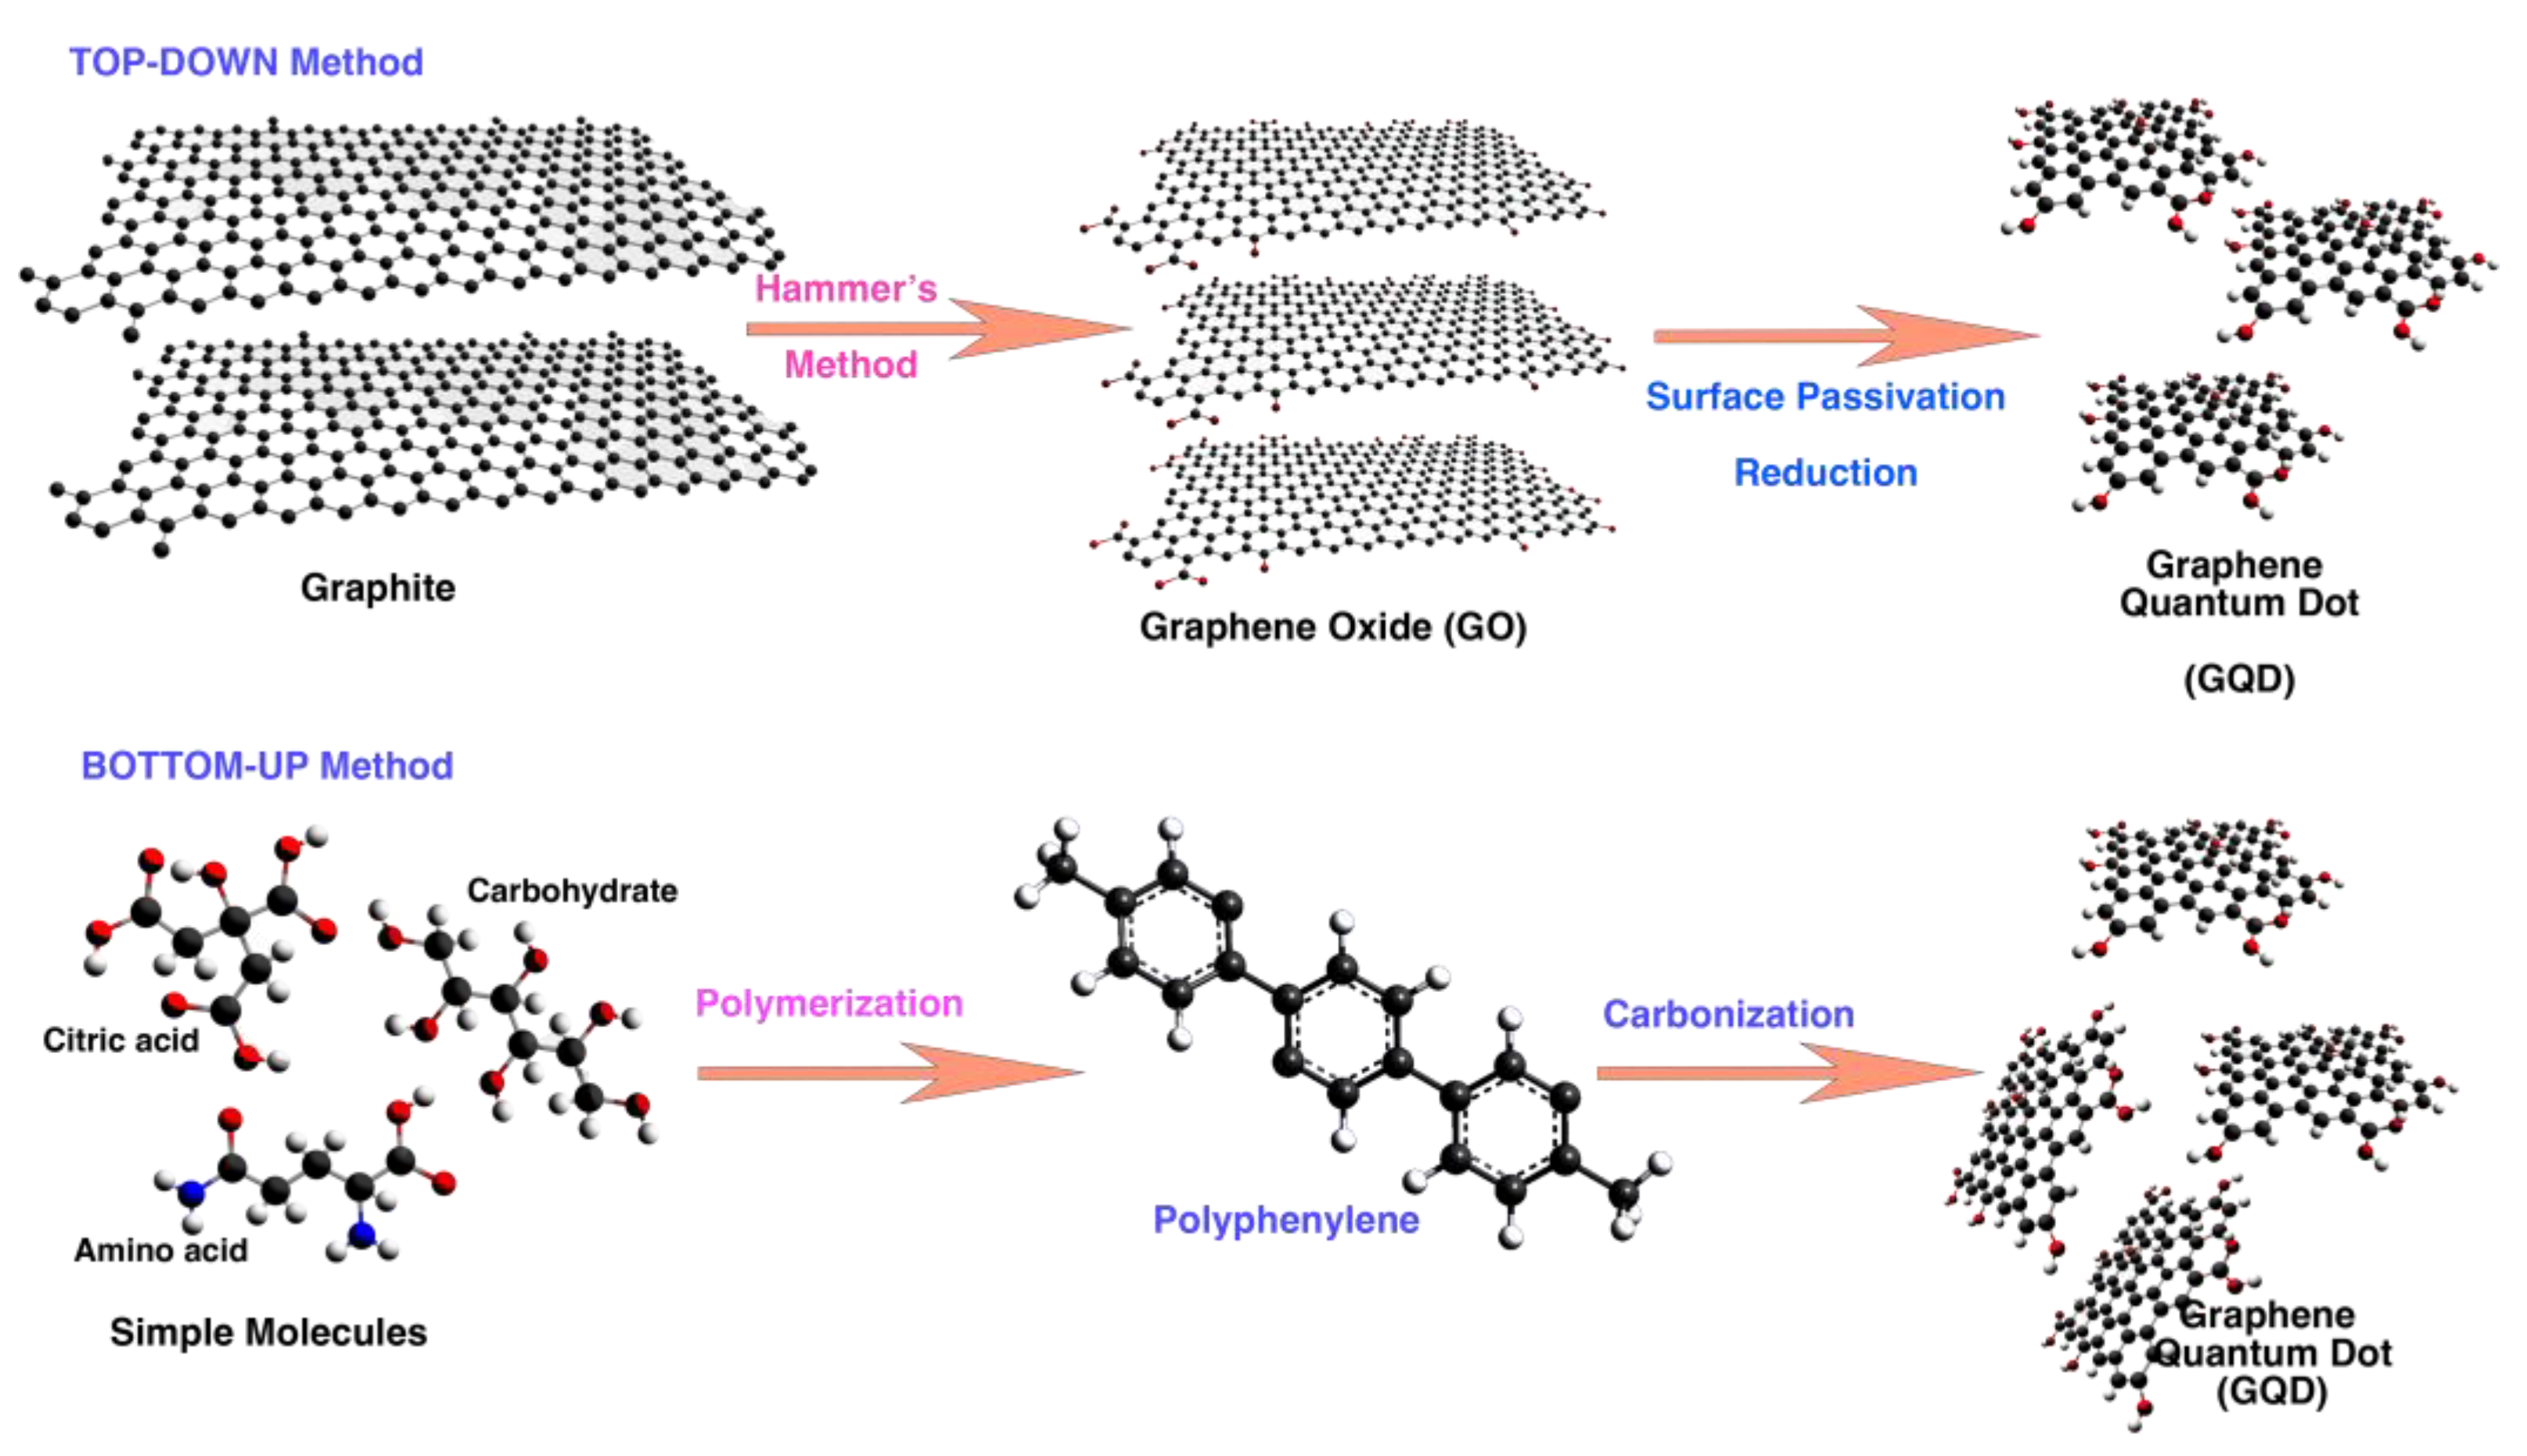
2.1. Method of Synthesis GQD
2.2. Plasma Synthesis of GQDs
2.3. Method of Bioactivation
2.3.1. Bioactive Carbon Sources
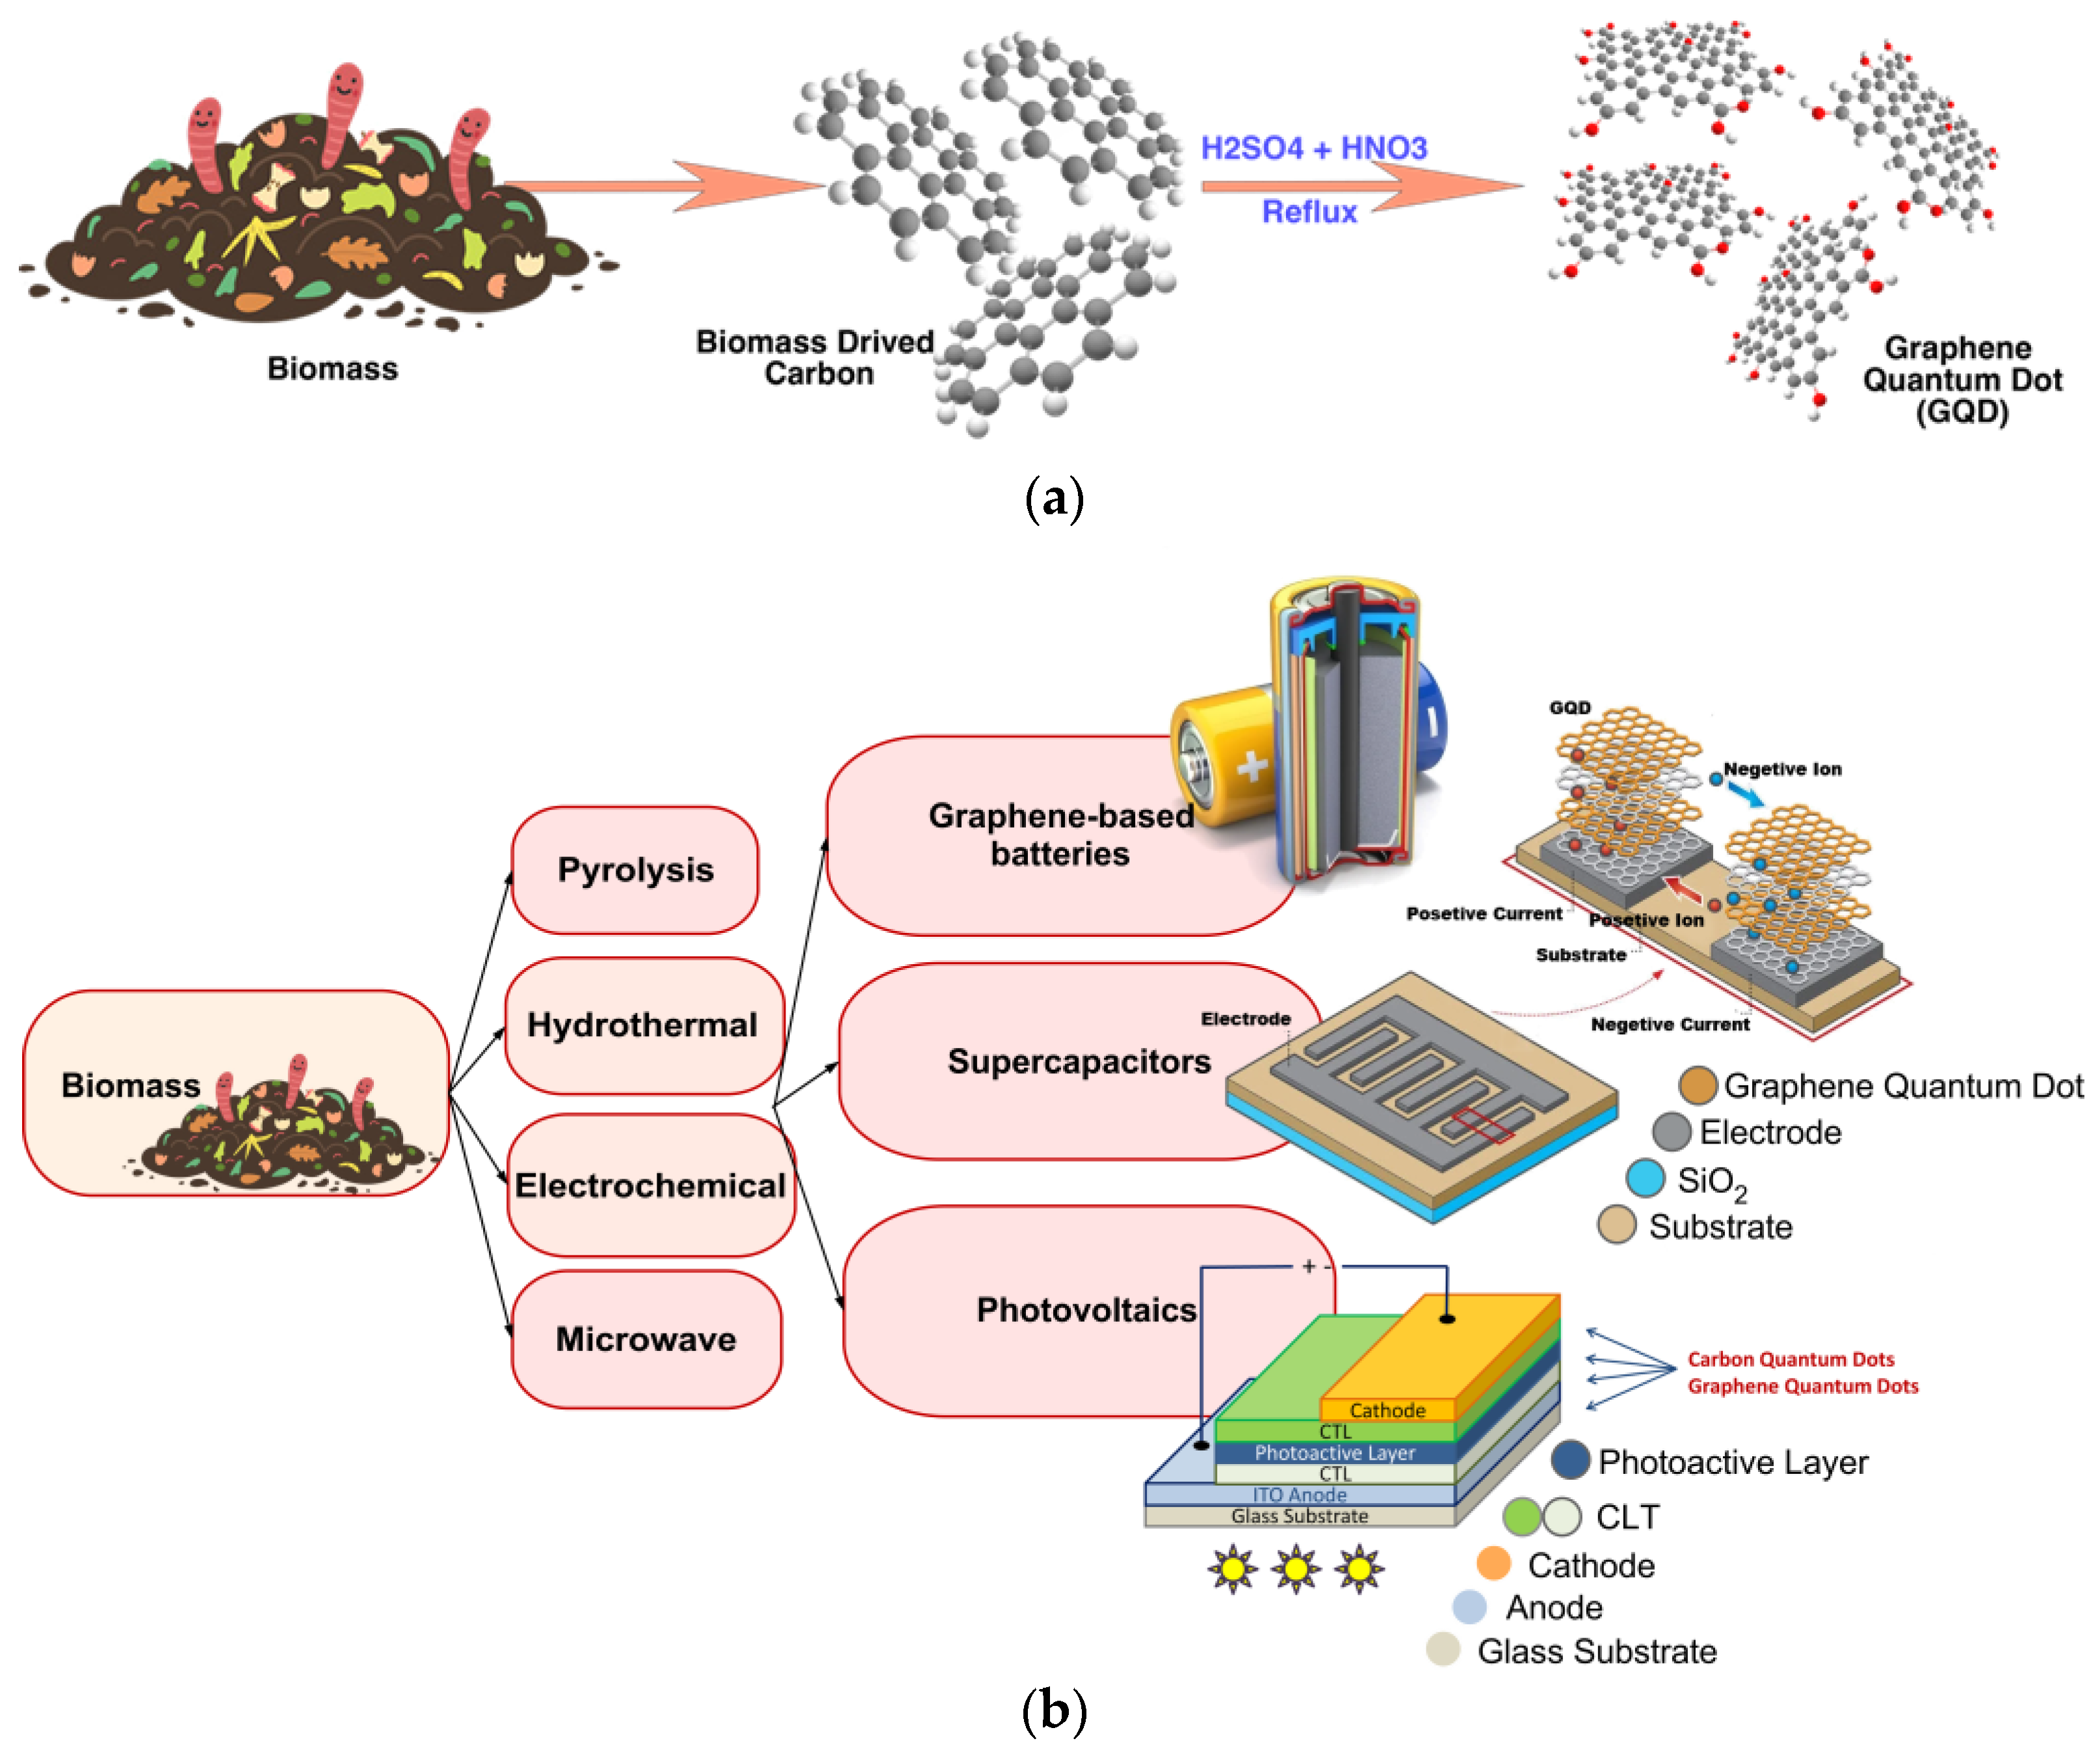
2.3.2. Biomass-Waste Derived GQD
2.3.3. Biologically Active Agents
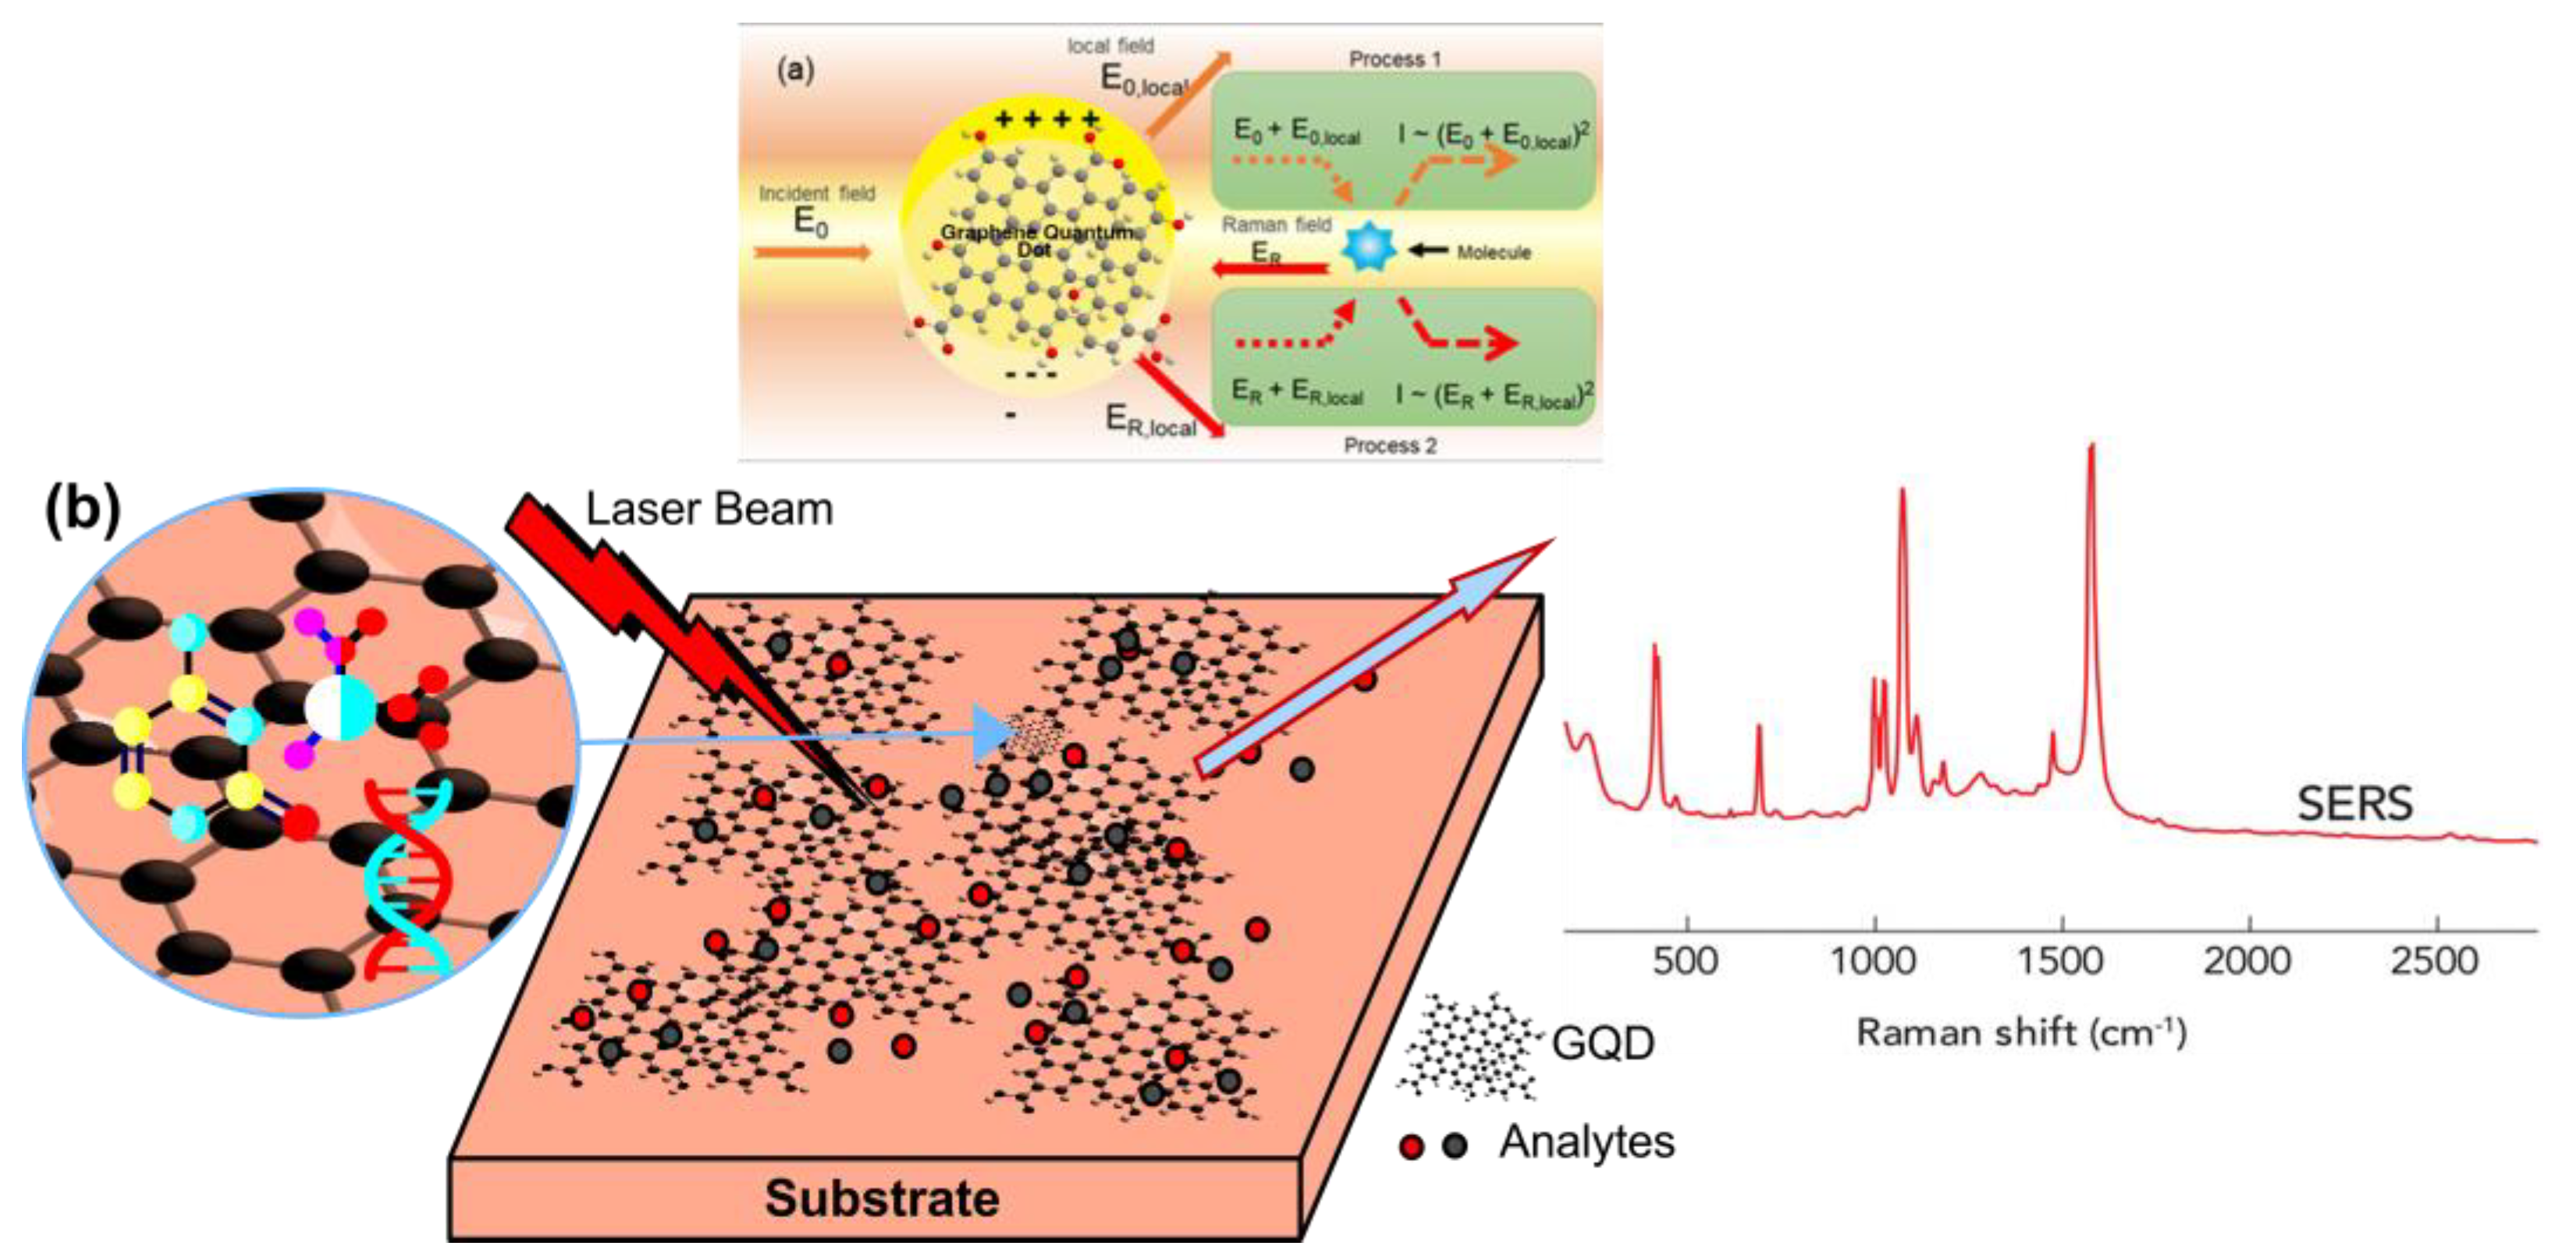
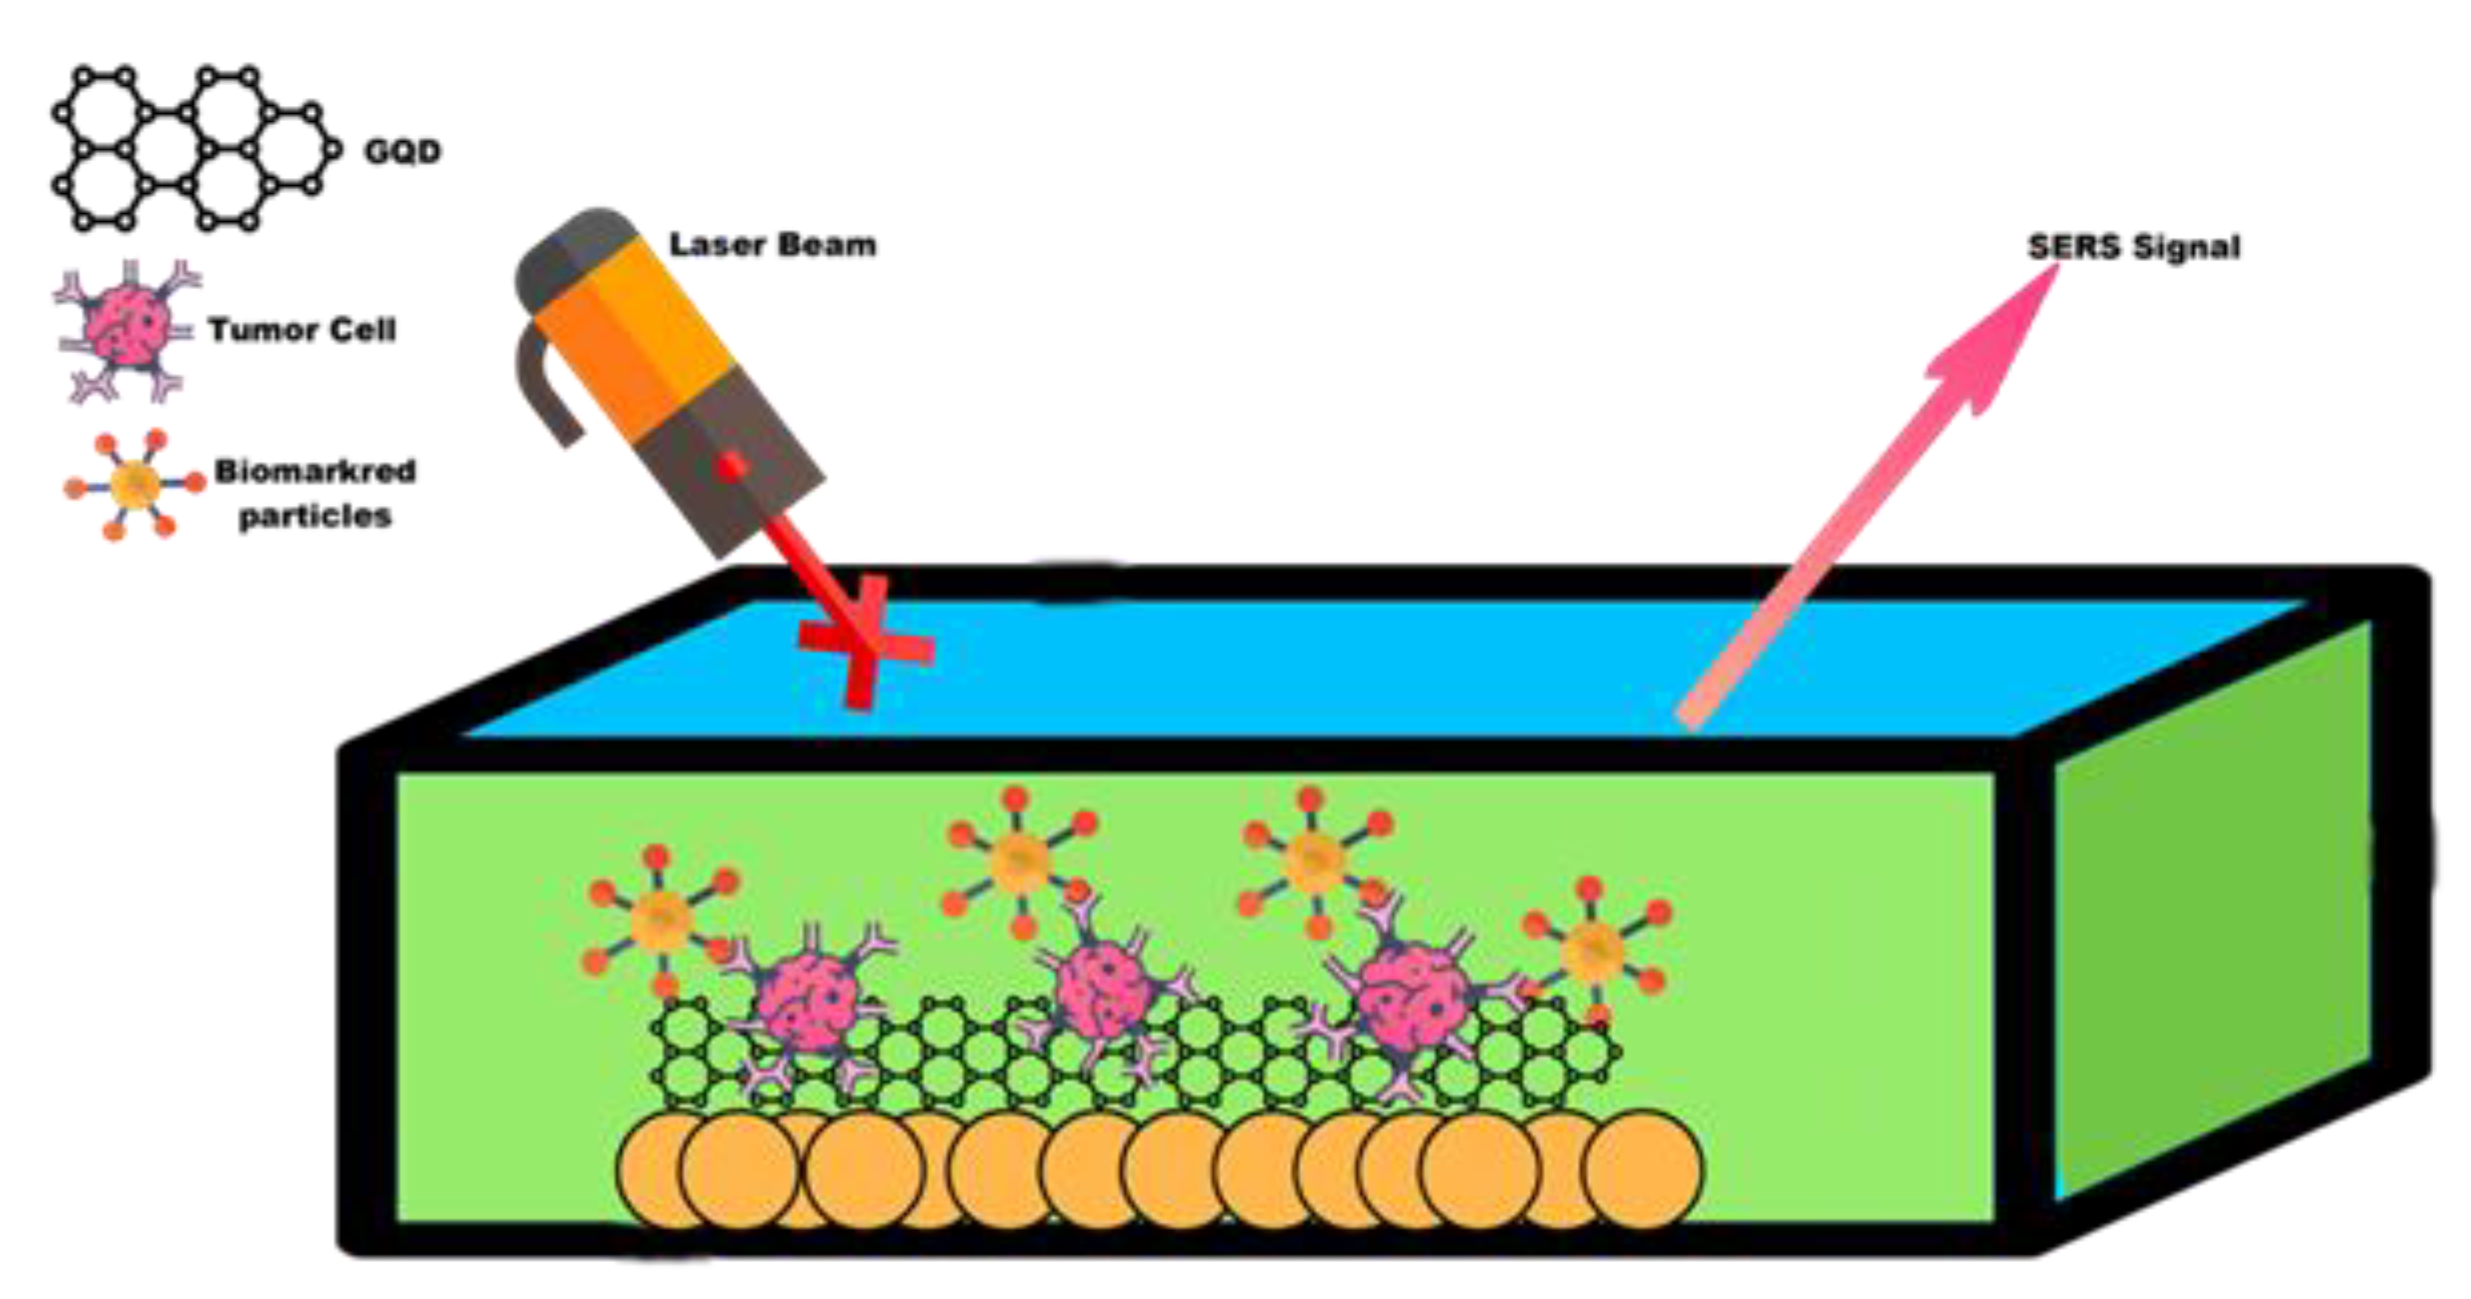
3. SERS GQD
4. Detection Mechanisms of SERS
5. Inflammatory Biomarkers
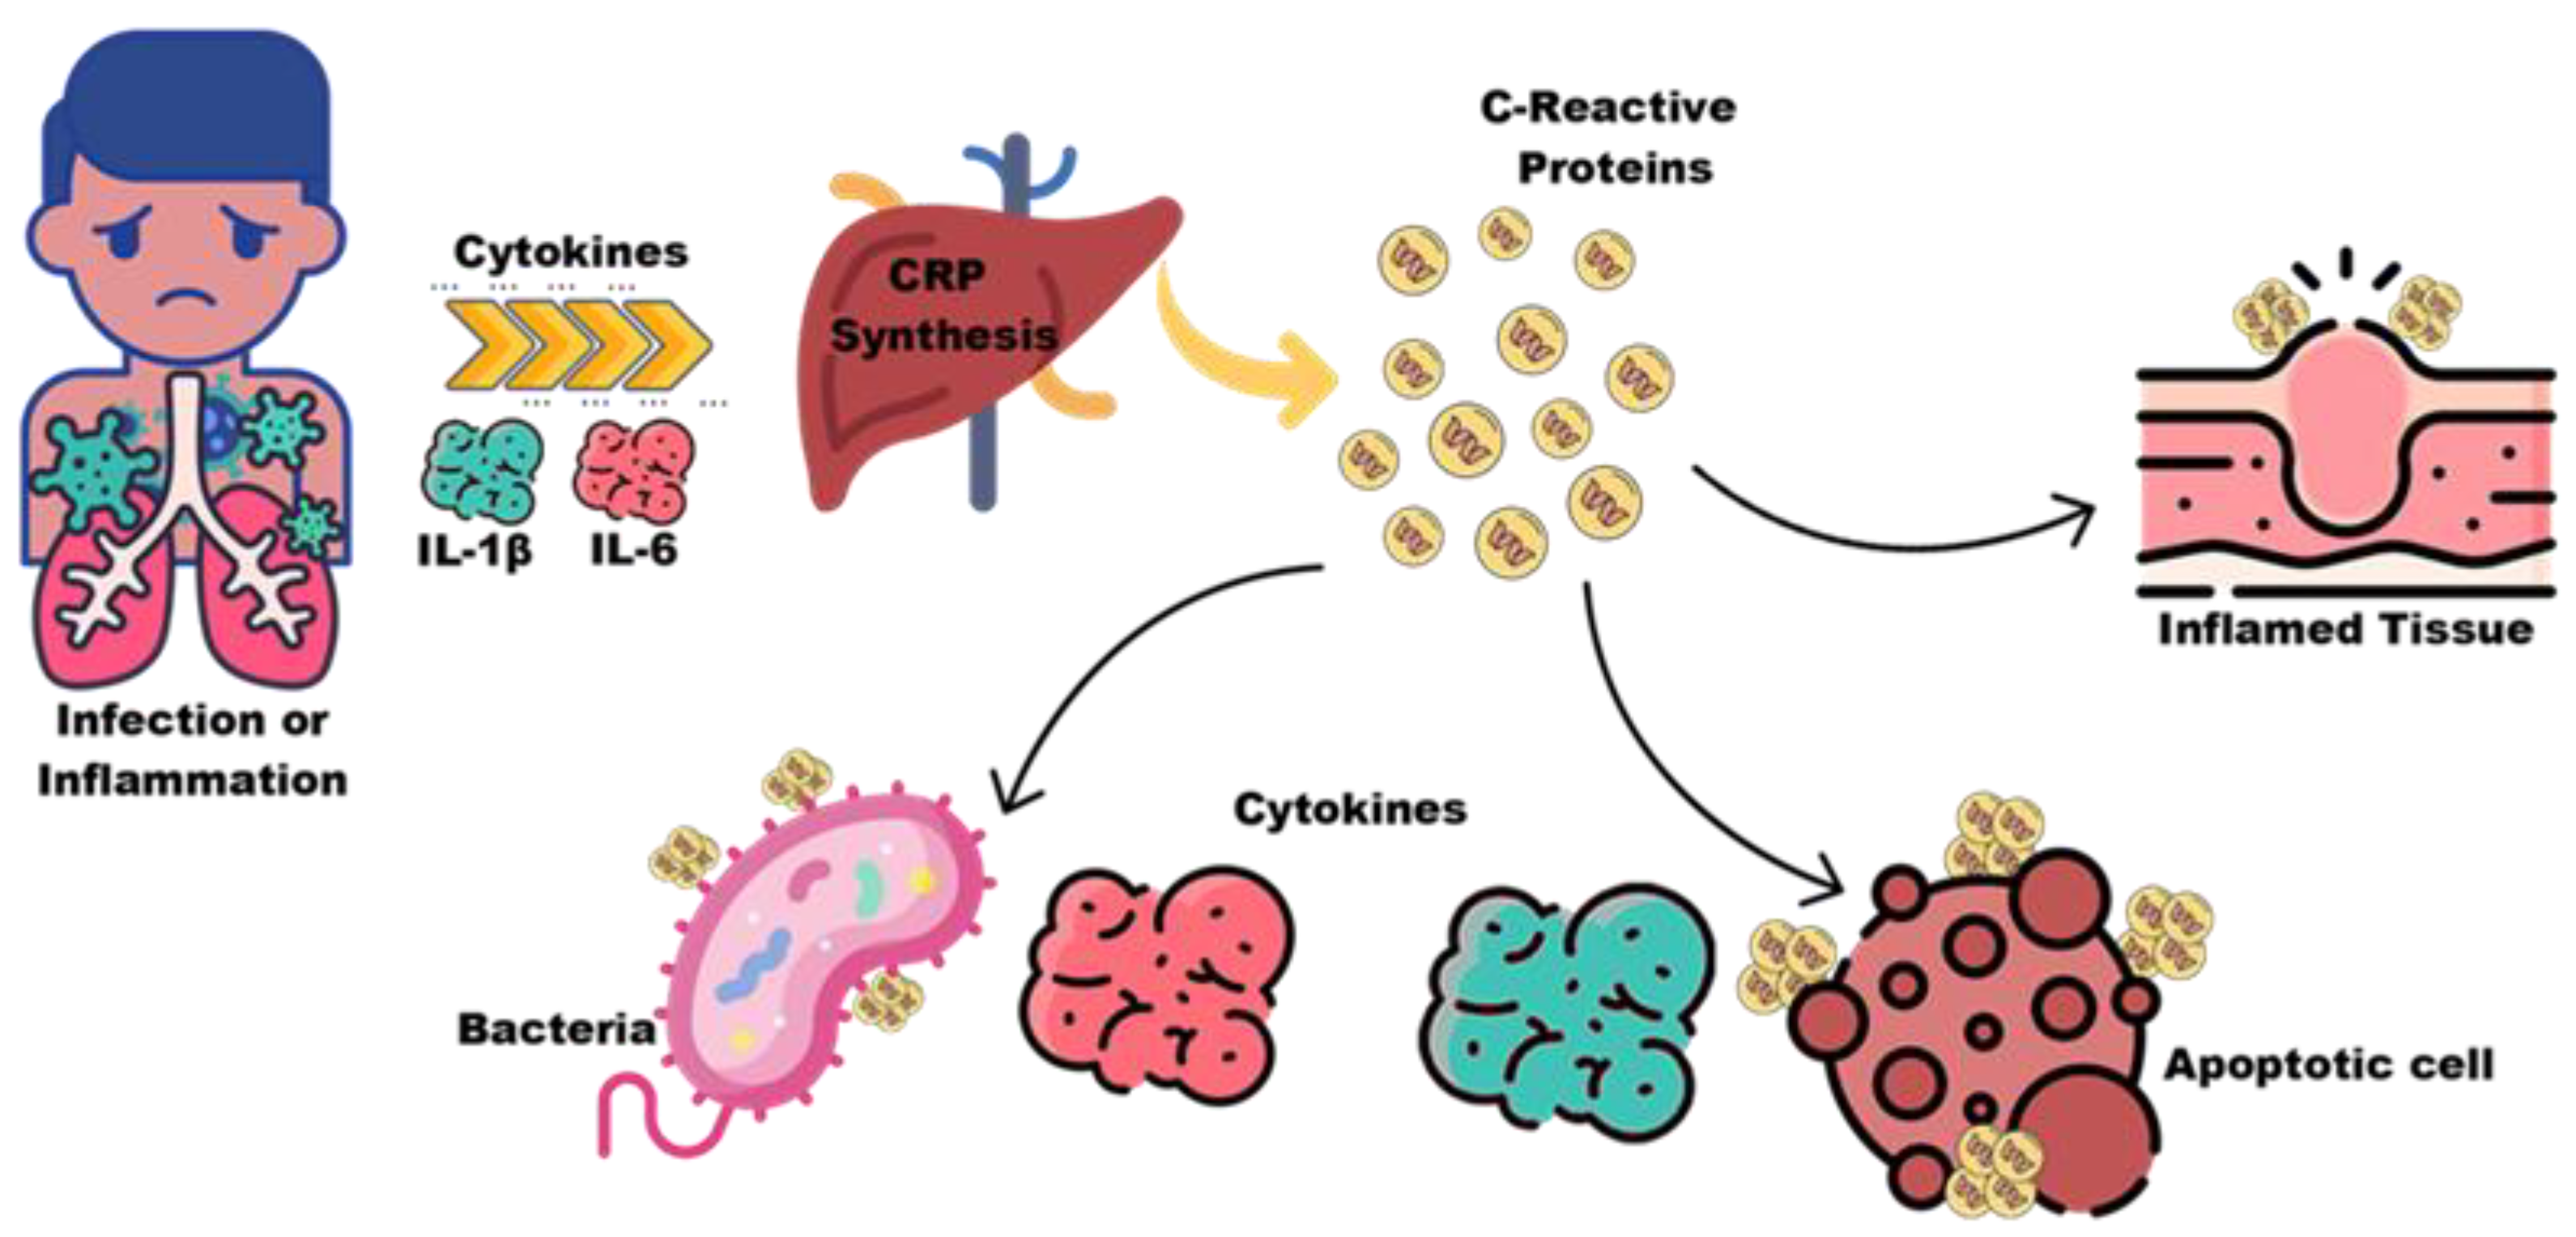
5.1. C-Reactive Protein and Cytokines
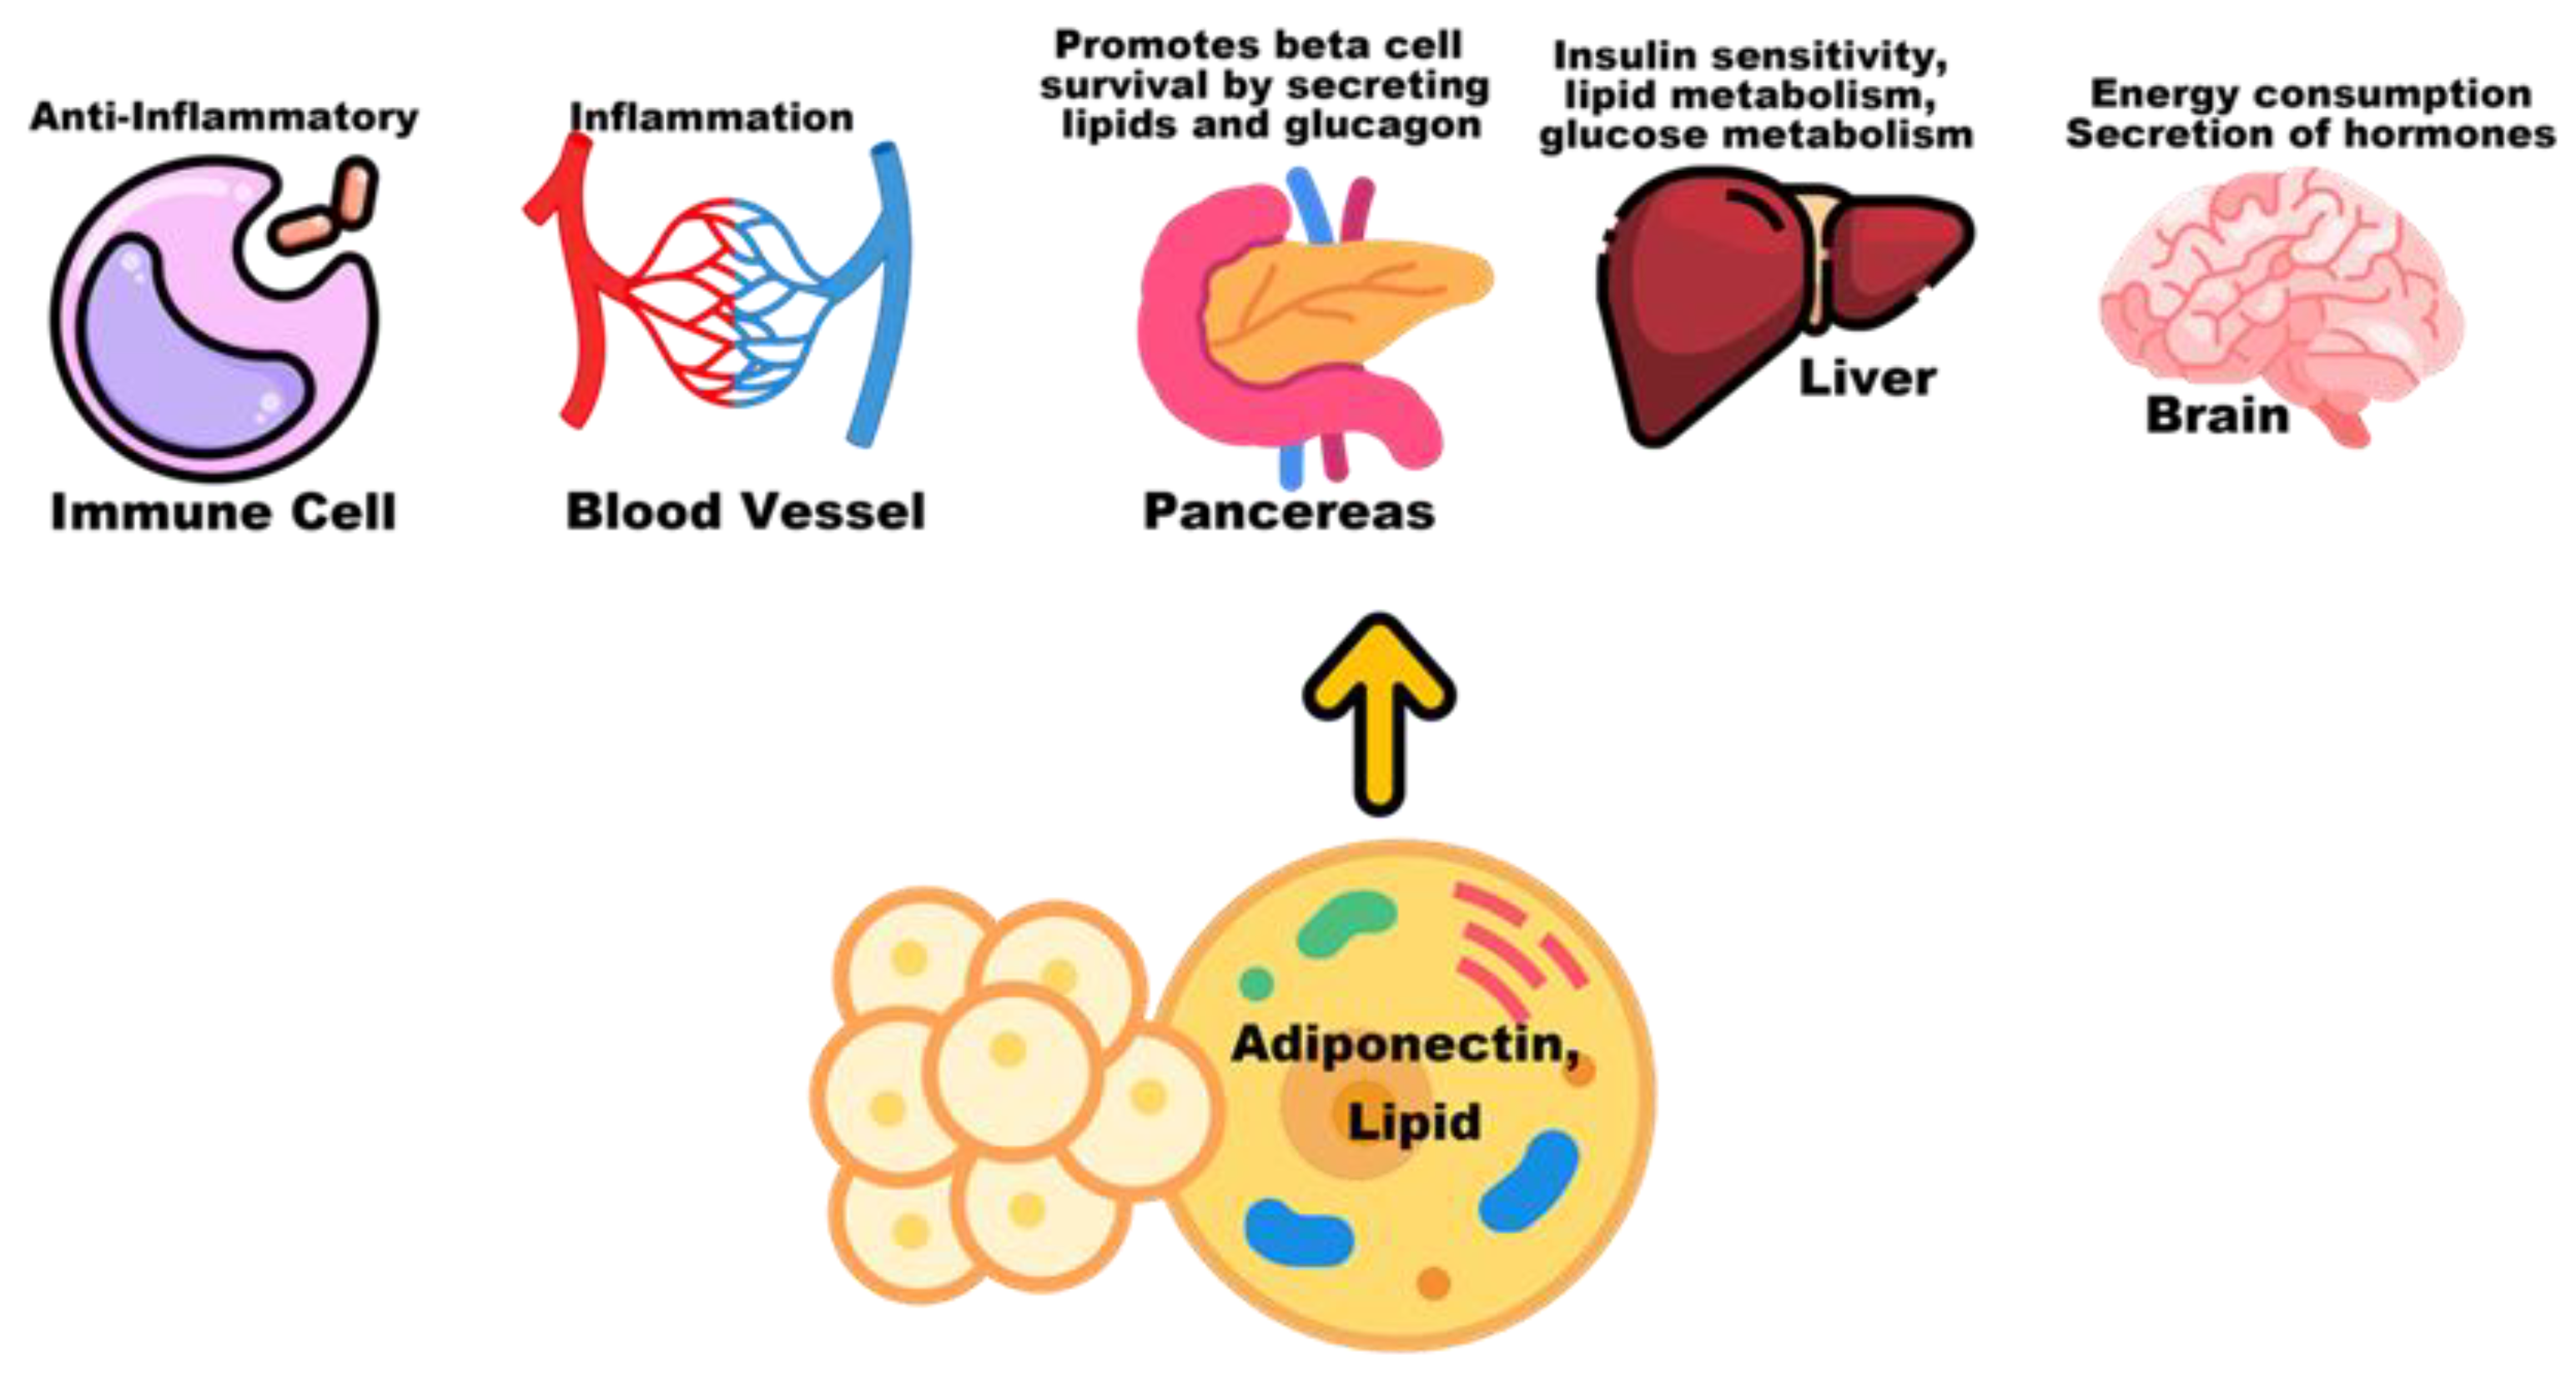
5.2. Adiponectin and Lipids
5.3. Raman Spectrum of the Inflammatory Biomarkers
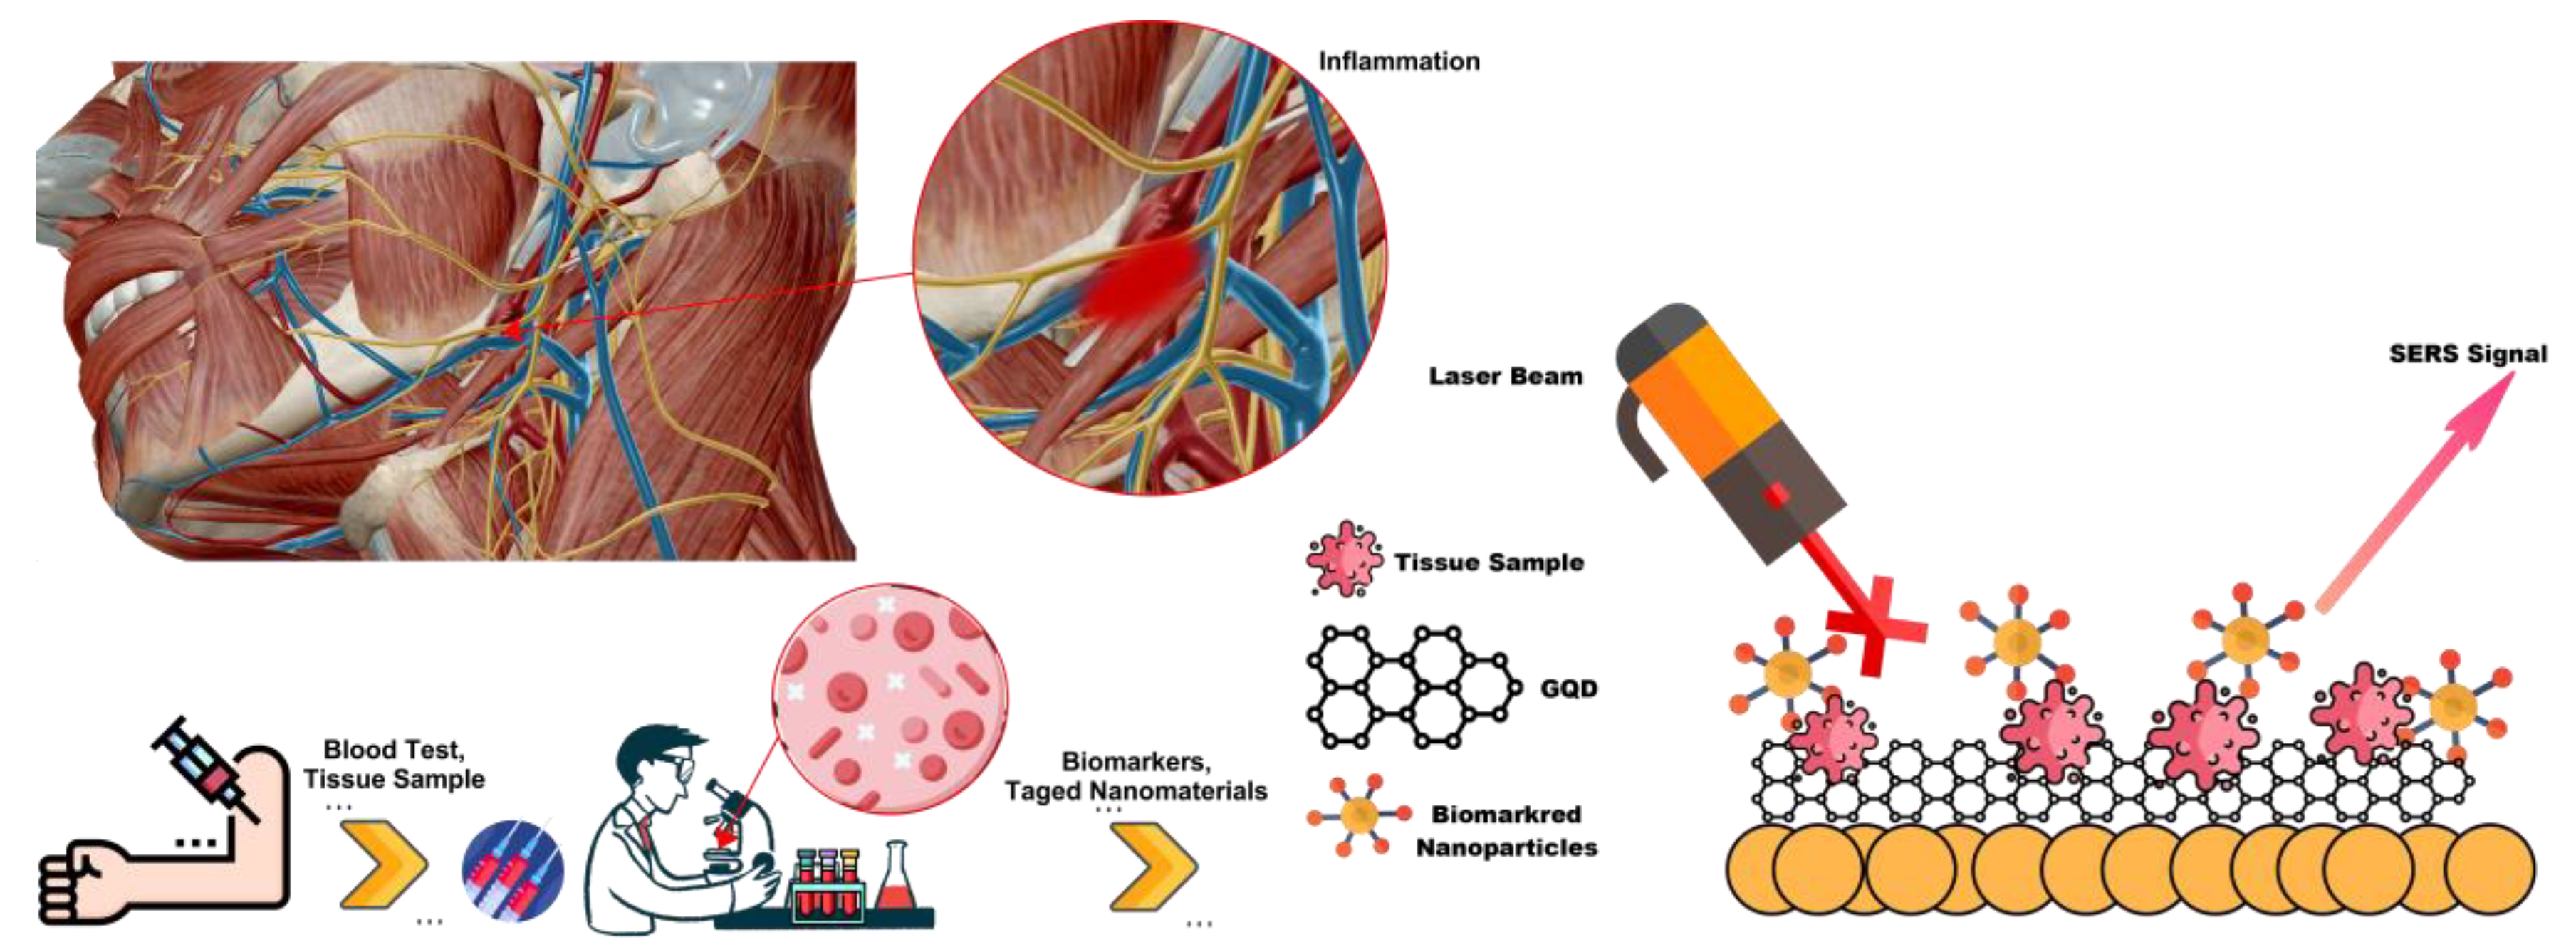
6. Detection of Inflammatory
7. Perspectives
8. Conclusions
Author Contributions
Funding
Institutional Review Board Statement
Informed Consent Statement
Data Availability Statement
Conflicts of Interest
References
- Khan, S.; Nisar, M.; Rehman, W.; Khan, R.; Nasir, F. Anti-inflammatory study on crude methanol extract and different fractions of Eremostachys laciniata. Pharm. Biol. 2010, 48, 1115–1118. [Google Scholar] [CrossRef] [PubMed] [Green Version]
- Stewart, F.; Akleyev, A.; Hauer-Jensen, M.; Hendry, J.; Kleiman, N.; Macvittie, T.; Aleman, B.; Edgar, A.; Mabuchi, K.; Muirhead, C. ICRP publication 118: ICRP statement on tissue reactions and early and late effects of radiation in normal tissues and organs–threshold doses for tissue reactions in a radiation protection context. Ann. ICRP 2012, 41, 1–322. [Google Scholar] [CrossRef] [PubMed]
- Kalashgarani, M.Y.; Babapoor, A. Application of nano-antibiotics in the diagnosis and treatment of infectious diseases. Adv. Appl. NanoBio-Technol. 2022, 3, 22–35. [Google Scholar]
- Mousavi, S.M.; Hashemi, S.A.; Amani, A.M.; Saed, H.; Jahandideh, S.; Mojoudi, F. Polyethylene terephthalate/acryl butadiene styrene copolymer incorporated with oak shell, potassium sorbate and egg shell nanoparticles for food packaging applications: Control of bacteria growth, physical and mechanical properties. Polym. Renew. Resour. 2017, 8, 177–196. [Google Scholar] [CrossRef]
- Fairweather, D. Atherosclerosis and Inflammatory Heart Disease. In Immunotoxicity, Immune Dysfunction, and Chronic Disease; Springer: Berlin/Heidelberg, Germany, 2012; pp. 271–289. [Google Scholar]
- Pascoal, A.; Estevinho, M.M.; Choupina, A.; Sousa-Pimenta, M.; Estevinho, L.M. An overview of the bioactive compounds, therapeutic properties and toxic effects of apitoxin. Food Chem. Toxicol. 2019, 134, 1–11. [Google Scholar] [CrossRef] [PubMed]
- Alipour, A.; Kalashgarani, M.Y. Nano Protein and Peptides for Drug Delivery and Anticancer Agents. Adv. Appl. NanoBio-Technol. 2022, 3, 60–64. [Google Scholar]
- Mousavi, S.M.; Hashemi, S.A.; Esmaeili, H.; Amani, A.M.; Mojoudi, F. Synthesis of Fe3O4 nanoparticles modified by oak shell for treatment of wastewater containing Ni (II). Acta Chim. Slov. 2018, 65, 750–756. [Google Scholar] [CrossRef] [PubMed] [Green Version]
- Mc-Namara, D.; Mayeux, P. Nonopiate analgesics and anti-inflammatory drugs. In Principles of Pharmacology: Basic Concepts and Clinical Applications, 3rd ed.; Int. Thomson Publ. Co., Chapman Hall: Pacific Grove, CA, USA, 1995; pp. 1160–1178. [Google Scholar]
- Mousavi, S.; Hashemi, S.; Gholami, A.; Kalashgarani, M.; Vijayakameswara Rao, N.; Omidifar, N.; Hsiao, W.; Lai, C.; Chiang, W. Plasma-Enabled Smart Nano Exosome Platform as Emerging Immunopathogenesis for Clinical Viral Infection. Pharmaceutics 2022, 14, 1054. [Google Scholar] [CrossRef]
- Xie, R.; Wang, Z.; Zhou, W.; Liu, Y.; Fan, L.; Li, Y.; Li, X. Graphene quantum dots as smart probes for biosensing. Anal. Methods 2016, 8, 4001–4016. [Google Scholar] [CrossRef]
- Kazemi, K.; Ghahramani, Y.; Kalashgrani, M.Y. Nano biofilms: An emerging biotechnology applications. Adv. Appl. NanoBio-Technol. 2022, 3, 8–15. [Google Scholar]
- Farshbaf, M.; Davaran, S.; Rahimi, F.; Annabi, N.; Salehi, R.; Akbarzadeh, A. Carbon quantum dots: Recent progresses on synthesis, surface modification and applications. Artif. Cells Nanomed. Biotechnol. 2018, 46, 1331–1348. [Google Scholar] [CrossRef]
- Mousavi, S.M.; Hashemi, S.A.; Kalashgrani, M.Y.; Gholami, A.; Omidifar, N.; Babapoor, A.; Vijayakameswara Rao, N.; Chiang, W.-H. Recent Advances in Plasma-Engineered Polymers for Biomarker-Based Viral Detection and Highly Multiplexed Analysis. Biosensors 2022, 12, 286. [Google Scholar] [CrossRef] [PubMed]
- Lee, B.-C.; Lee, J.Y.; Kim, J.; Yoo, J.M.; Kang, I.; Kim, J.-J.; Shin, N.; Kim, D.J.; Choi, S.W.; Kim, D. Graphene quantum dots as anti-inflammatory therapy for colitis. Sci. Adv. 2020, 6, eaaz2630. [Google Scholar] [CrossRef]
- Mousavi, S.; Arjmand, O.; Hashemi, S.; Banaei, N. Modification of the epoxy resin mechanical and thermal properties with silicon acrylate and montmorillonite nanoparticles. Polym. Renew. Resour. 2016, 7, 101–113. [Google Scholar] [CrossRef]
- Qian, X.-M.; Nie, S.M. Single-molecule and single-nanoparticle SERS: From fundamental mechanisms to biomedical applications. Chem. Soc. Rev. 2008, 37, 912–920. [Google Scholar] [CrossRef] [PubMed]
- Gubala, V.; Harris, L.F.; Ricco, A.J.; Tan, M.X.; Williams, D.E. Point of care diagnostics: Status and future. Anal. Chem. 2012, 84, 487–515. [Google Scholar] [CrossRef]
- Bonaccorso, F.; Colombo, L.; Yu, G.; Stoller, M.; Tozzini, V.; Ferrari, A.C.; Ruoff, R.S.; Pellegrini, V. Graphene, related two-dimensional crystals, and hybrid systems for energy conversion and storage. Science 2015, 347, 1246501. [Google Scholar] [CrossRef]
- Tian, L.; Tadepalli, S.; Fei, M.; Morrissey, J.J.; Kharasch, E.D.; Singamaneni, S. Off-resonant gold superstructures as ultrabright minimally invasive surface-enhanced Raman scattering (SERS) probes. Chem. Mater. 2015, 27, 5678–5684. [Google Scholar] [CrossRef]
- Ma, Y.; Promthaveepong, K.; Li, N. Chemical sensing on a single SERS particle. ACS Sens. 2017, 2, 135–139. [Google Scholar] [CrossRef]
- Huang, C.W.; Hao, Y.W.; Nyagilo, J.; Dave, D.P.; Xu, L.F.; Sun, X.K. Porous hollow gold nanoparticles for cancer SERS imaging. In Journal of Nano Research; Trans Tech Publications Ltd.: Bäch SZ, Switzerland, 2010; pp. 137–148. [Google Scholar]
- Pinkhasova, P.; Puccio, B.; Chou, T.; Sukhishvili, S.; Du, H. Noble metal nanostructure both as a SERS nanotag and an analyte probe. Chem. Commun. 2012, 48, 9750–9752. [Google Scholar] [CrossRef]
- Emami-Meibodi, M.; Parsaeian, M.; Amraei, R.; Banaei, M.; Anvari, F.; Tahami, S.; Vakhshoor, B.; Mehdizadeh, A.; Nejad, N.F.; Shirmardi, S. An experimental investigation of wastewater treatment using electron beam irradiation. Radiat. Phys. Chem. 2016, 125, 82–87. [Google Scholar] [CrossRef]
- Amani, A.M.; Hashemi, S.A.; Mousavi, S.M.; Abrishamifar, S.M.; Vojood, A. Electric field induced alignment of carbon nanotubes: Methodology and outcomes. In Carbon Nanotubes-Recent Progress; IntechOpen: London, UK, 2017. [Google Scholar]
- Mousavi, S.M.; Hashemi, S.A.; Jahandideh, S.; Baseri, S.; Zarei, M.; Azadi, S. Modification of phenol novolac epoxy resin and unsaturated polyester using sasobit and silica nanoparticles. Polym. Renew. Resour. 2017, 8, 117–132. [Google Scholar] [CrossRef]
- Xu, W.; Ling, X.; Xiao, J.; Dresselhaus, M.S.; Kong, J.; Xu, H.; Liu, Z.; Zhang, J. Surface enhanced Raman spectroscopy on a flat graphene surface. Proc. Natl. Acad. Sci. USA 2012, 109, 9281–9286. [Google Scholar] [CrossRef] [Green Version]
- Mousavi, S.M.; Zarei, M.; Hashemi, S.A.; Ramakrishna, S.; Chiang, W.-H.; Lai, C.W.; Gholami, A.; Omidifar, N.; Shokripour, M. Asymmetric membranes: A potential scaffold for wound healing applications. Symmetry 2020, 12, 1100. [Google Scholar] [CrossRef]
- Cheng, H.; Zhao, Y.; Fan, Y.; Xie, X.; Qu, L.; Shi, G. Graphene-quantum-dot assembled nanotubes: A new platform for efficient Raman enhancement. Acs Nano 2012, 6, 2237–2244. [Google Scholar] [CrossRef]
- Mehrabani, J.; Mousavi, S.; Noaparast, M. Evaluation of the replacement of NaCN with Acidithiobacillus ferrooxidans in the flotation of high-pyrite, low-grade lead–zinc ore. Sep. Purif. Technol. 2011, 80, 202–208. [Google Scholar] [CrossRef]
- Hashemi, S.A.; Mousavi, S.M. Effect of bubble based degradation on the physical properties of Single Wall Carbon Nanotube/Epoxy Resin composite and new approach in bubbles reduction. Compos. Part A Appl. Sci. Manuf. 2016, 90, 457–469. [Google Scholar] [CrossRef]
- Zheng, X.T.; Ananthanarayanan, A.; Luo, K.Q.; Chen, P. Glowing graphene quantum dots and carbon dots: Properties, syntheses, and biological applications. Small 2015, 11, 1620–1636. [Google Scholar] [CrossRef]
- Xu, X.; Ray, R.; Gu, Y.; Ploehn, H.J.; Gearheart, L.; Raker, K.; Scrivens, W.A. Electrophoretic analysis and purification of fluorescent single-walled carbon nanotube fragments. J. Am. Chem. Soc. 2004, 126, 12736–12737. [Google Scholar] [CrossRef]
- Ju, S.-Y.; Kopcha, W.P.; Papadimitrakopoulos, F. Brightly fluorescent single-walled carbon nanotubes via an oxygen-excluding surfactant organization. Science 2009, 323, 1319–1323. [Google Scholar] [CrossRef]
- Guo, X.; Wang, C.-F.; Yu, Z.-Y.; Chen, L.; Chen, S. Facile access to versatile fluorescent carbon dots toward light-emitting diodes. Chem. Commun. 2012, 48, 2692–2694. [Google Scholar] [CrossRef]
- Mousavi, S.M.; Hashemi, S.A.; Zarei, M.; Bahrani, S.; Savardashtaki, A.; Esmaeili, H.; Lai, C.W.; Mazraedoost, S.; Abassi, M.; Ramavandi, B. Data on cytotoxic and antibacterial activity of synthesized Fe3O4 nanoparticles using Malva sylvestris. Data Brief 2020, 28, 104929. [Google Scholar] [CrossRef]
- Michalet, X.; Pinaud, F.F.; Bentolila, L.A.; Tsay, J.M.; Doose, S.; Li, J.J.; Sundaresan, G.; Wu, A.; Gambhir, S.; Weiss, S. Quantum dots for live cells, in vivo imaging, and diagnostics. Science 2005, 307, 538–544. [Google Scholar] [CrossRef] [Green Version]
- Mousavi, S.; Esmaeili, H.; Arjmand, O.; Karimi, S.; Hashemi, S. Biodegradation study of nanocomposites of phenol novolac epoxy/unsaturated polyester resin/egg shell nanoparticles using natural polymers. J. Mater. 2015, 2015, 131957. [Google Scholar] [CrossRef] [Green Version]
- Yu, S.-J.; Kang, M.-W.; Chang, H.-C.; Chen, K.-M.; Yu, Y.-C. Bright fluorescent nanodiamonds: No photobleaching and low cytotoxicity. J. Am. Chem. Soc. 2005, 127, 17604–17605. [Google Scholar] [CrossRef]
- Baker, S.N.; Baker, G.A. Luminescent carbon nanodots: Emergent nanolights. Angew. Chem. Int. Ed. 2010, 49, 6726–6744. [Google Scholar] [CrossRef]
- Loh, K.P.; Bao, Q.; Eda, G.; Chhowalla, M. Graphene oxide as a chemically tunable platform for optical applications. Nat. Chem. 2010, 2, 1015–1024. [Google Scholar] [CrossRef]
- Mousavi, S.; Aghili, A.; Hashemi, S.; Goudarzian, N.; Bakhoda, Z.; Baseri, S. Improved morphology and properties of nanocomposites, linear low density polyethylene, ethylene-co-vinyl acetate and nano clay particles by electron beam. Polym. Renew. Resour. 2016, 7, 135–153. [Google Scholar] [CrossRef]
- Wang, C.-F.; Sun, X.-Y.; Su, M.; Wang, Y.-P.; Lv, Y.-K. Electrochemical biosensors based on antibody, nucleic acid and enzyme functionalized graphene for the detection of disease-related biomolecules. Analyst 2020, 145, 1550–1562. [Google Scholar] [CrossRef]
- Lin, L.; Rong, M.; Luo, F.; Chen, D.; Wang, Y.; Chen, X. Luminescent graphene quantum dots as new fluorescent materials for environmental and biological applications. TrAC Trends Anal. Chem. 2014, 54, 83–102. [Google Scholar] [CrossRef]
- Peng, J.; Gao, W.; Gupta, B.K.; Liu, Z.; Romero-Aburto, R.; Ge, L.; Song, L.; Alemany, L.B.; Zhan, X.; Gao, G. Graphene quantum dots derived from carbon fibers. Nano Lett. 2012, 12, 844–849. [Google Scholar] [CrossRef]
- Lu, J.; Yeo, P.S.E.; Gan, C.K.; Wu, P.; Loh, K.P. Transforming C60 molecules into graphene quantum dots. Nat. Nanotechnol. 2011, 6, 247–252. [Google Scholar] [CrossRef]
- Sreeprasad, T.; Rodriguez, A.A.; Colston, J.; Graham, A.; Shishkin, E.; Pallem, V.; Berry, V. Electron-tunneling modulation in percolating network of graphene quantum dots: Fabrication, phenomenological understanding, and humidity/pressure sensing applications. Nano Lett. 2013, 13, 1757–1763. [Google Scholar] [CrossRef]
- Ye, R.; Xiang, C.; Lin, J.; Peng, Z.; Huang, K.; Yan, Z.; Cook, N.P.; Samuel, E.L.; Hwang, C.-C.; Ruan, G. Coal as an abundant source of graphene quantum dots. Nat. Commun. 2013, 4, 2943. [Google Scholar] [CrossRef]
- Yan, Y.; Chen, J.; Li, N.; Tian, J.; Li, K.; Jiang, J.; Liu, J.; Tian, Q.; Chen, P. Systematic bandgap engineering of graphene quantum dots and applications for photocatalytic water splitting and CO2 reduction. ACS Nano 2018, 12, 3523–3532. [Google Scholar] [CrossRef]
- Shin, Y.; Park, J.; Hyun, D.; Yang, J.; Lee, J.-H.; Kim, J.-H.; Lee, H. Acid-free and oxone oxidant-assisted solvothermal synthesis of graphene quantum dots using various natural carbon materials as resources. Nanoscale 2015, 7, 5633–5637. [Google Scholar] [CrossRef]
- Zhang, Y.; Li, K.; Ren, S.; Dang, Y.; Liu, G.; Zhang, R.; Zhang, K.; Long, X.; Jia, K. Coal-derived graphene quantum dots produced by ultrasonic physical tailoring and their capacity for Cu (II) detection. ACS Sustain. Chem. Eng. 2019, 7, 9793–9799. [Google Scholar] [CrossRef]
- Bacon, M.; Bradley, S.J.; Nann, T. Graphene quantum dots. Part. Part. Syst. Charact. 2014, 31, 415–428. [Google Scholar] [CrossRef]
- Shen, J.; Zhu, Y.; Chen, C.; Yang, X.; Li, C. Facile preparation and upconversion luminescence of graphene quantum dots. Chem. Commun. 2011, 47, 2580–2582. [Google Scholar] [CrossRef]
- Li, Y.; Hu, Y.; Zhao, Y.; Shi, G.; Deng, L.; Hou, Y.; Qu, L. An electrochemical avenue to green-luminescent graphene quantum dots as potential electron-acceptors for photovoltaics. Adv. Mater. 2011, 23, 776–780. [Google Scholar] [CrossRef]
- Lee, E.; Ryu, J.; Jang, J. Fabrication of graphene quantum dots via size-selective precipitation and their application in upconversion-based DSSCs. Chem. Commun. 2013, 49, 9995–9997. [Google Scholar] [CrossRef]
- Dong, Y.; Shao, J.; Chen, C.; Li, H.; Wang, R.; Chi, Y.; Lin, X.; Chen, G. Blue luminescent graphene quantum dots and graphene oxide prepared by tuning the carbonization degree of citric acid. Carbon 2012, 50, 4738–4743. [Google Scholar] [CrossRef]
- Wu, Z.L.; Gao, M.X.; Wang, T.T.; Wan, X.Y.; Zheng, L.L.; Huang, C.Z. A general quantitative pH sensor developed with dicyandiamide N-doped high quantum yield graphene quantum dots. Nanoscale 2014, 6, 3868–3874. [Google Scholar] [CrossRef]
- Kumar, S.; Aziz, S.T.; Girshevitz, O.; Nessim, G.D. One-step synthesis of N-doped graphene quantum dots from chitosan as a sole precursor using chemical vapor deposition. J. Phys. Chem. C 2018, 122, 2343–2349. [Google Scholar] [CrossRef]
- Kurniawan, D.; Chiang, W.-H. Microplasma-enabled colloidal nitrogen-doped graphene quantum dots for broad-range fluorescent pH sensors. Carbon 2020, 167, 675–684. [Google Scholar] [CrossRef]
- Kurniawan, D.; Anjali, B.A.; Setiawan, O.; Ostrikov, K.K.; Chung, Y.G.; Chiang, W.-H. Microplasma Band Structure Engineering in Graphene Quantum Dots for Sensitive and Wide-Range pH Sensing. ACS Appl. Mater. Interfaces 2021, 14, 1670–1683. [Google Scholar] [CrossRef]
- Ding, Z.; Li, F.; Wen, J.; Wang, X.; Sun, R. Gram-scale synthesis of single-crystalline graphene quantum dots derived from lignin biomass. Green Chem. 2018, 20, 1383–1390. [Google Scholar] [CrossRef]
- Kurniawan, D.; Weng, R.-J.; Setiawan, O.; Ostrikov, K.K.; Chiang, W.-H. Microplasma nanoengineering of emission-tuneable colloidal nitrogen-doped graphene quantum dots as smart environmental-responsive nanosensors and nanothermometers. Carbon 2021, 185, 501–513. [Google Scholar] [CrossRef]
- Dong, Y.; Chen, C.; Zheng, X.; Gao, L.; Cui, Z.; Yang, H.; Guo, C.; Chi, Y.; Li, C.M. One-step and high yield simultaneous preparation of single-and multi-layer graphene quantum dots from CX-72 carbon black. J. Mater. Chem. 2012, 22, 8764–8766. [Google Scholar] [CrossRef]
- Pan, D.; Guo, L.; Zhang, J.; Xi, C.; Xue, Q.; Huang, H.; Li, J.; Zhang, Z.; Yu, W.; Chen, Z. Cutting sp 2 clusters in graphene sheets into colloidal graphene quantum dots with strong green fluorescence. J. Mater. Chem. 2012, 22, 3314–3318. [Google Scholar] [CrossRef]
- Li, L.L.; Ji, J.; Fei, R.; Wang, C.Z.; Lu, Q.; Zhang, J.R.; Jiang, L.P.; Zhu, J.J. A facile microwave avenue to electrochemiluminescent two-color graphene quantum dots. Adv. Funct. Mater. 2012, 22, 2971–2979. [Google Scholar] [CrossRef]
- Chen, S.; Liu, J.-W.; Chen, M.-L.; Chen, X.-W.; Wang, J.-H. Unusual emission transformation of graphene quantum dots induced by self-assembled aggregation. Chem. Commun. 2012, 48, 7637–7639. [Google Scholar] [CrossRef]
- Shinde, D.B.; Pillai, V.K. Electrochemical preparation of luminescent graphene quantum dots from multiwalled carbon nanotubes. Chem. –A Eur. J. 2012, 18, 12522–12528. [Google Scholar] [CrossRef]
- Tang, L.; Ji, R.; Cao, X.; Lin, J.; Jiang, H.; Li, X.; Teng, K.S.; Luk, C.M.; Zeng, S.; Hao, J. Deep ultraviolet photoluminescence of water-soluble self-passivated graphene quantum dots. ACS Nano 2012, 6, 5102–5110. [Google Scholar] [CrossRef]
- Liu, R.; Wu, D.; Feng, X.; Müllen, K. Bottom-up fabrication of photoluminescent graphene quantum dots with uniform morphology. J. Am. Chem. Soc. 2011, 133, 15221–15223. [Google Scholar] [CrossRef]
- Mangolini, L.; Thimsen, E.; Kortshagen, U. High-yield plasma synthesis of luminescent silicon nanocrystals. Nano Lett. 2005, 5, 655–659. [Google Scholar] [CrossRef]
- Knipping, J.; Wiggers, H.; Rellinghaus, B.; Roth, P.; Konjhodzic, D.; Meier, C. Synthesis of high purity silicon nanoparticles in a low pressure microwave reactor. J. Nanosci. Nanotechnol. 2004, 4, 1039–1044. [Google Scholar] [CrossRef]
- Sankaran, R.M.; Holunga, D.; Flagan, R.C.; Giapis, K.P. Synthesis of blue luminescent Si nanoparticles using atmospheric-pressure microdischarges. Nano Lett. 2005, 5, 537–541. [Google Scholar] [CrossRef] [Green Version]
- Kortshagen, U. Nonthermal plasma synthesis of semiconductor nanocrystals. J. Phys. D Appl. Phys. 2009, 42, 113001. [Google Scholar] [CrossRef]
- Pi, X.; Kortshagen, U. Nonthermal plasma synthesized freestanding silicon–germanium alloy nanocrystals. Nanotechnology 2009, 20, 295602. [Google Scholar] [CrossRef]
- Pi, X.; Gresback, R.; Liptak, R.; Campbell, S.; Kortshagen, U. Doping efficiency, dopant location, and oxidation of Si nanocrystals. Appl. Phys. Lett. 2008, 92, 123102. [Google Scholar] [CrossRef]
- Ni, Z.; Pi, X.; Ali, M.; Zhou, S.; Nozaki, T.; Yang, D. Freestanding doped silicon nanocrystals synthesized by plasma. J. Phys. D Appl. Phys. 2015, 48, 314006. [Google Scholar] [CrossRef]
- Pereira, R.; Almeida, A. Doped semiconductor nanoparticles synthesized in gas-phase plasmas. J. Phys. D Appl. Phys. 2015, 48, 314005. [Google Scholar] [CrossRef]
- Pi, X.; Yu, T.; Yang, D. Water-Dispersible Silicon-Quantum-Dot-Containing Micelles Self-Assembled from an Amphiphilic Polymer. Part. Part. Syst. Charact. 2014, 31, 751–756. [Google Scholar] [CrossRef]
- Mangolini, L.; Kortshagen, U. Plasma-assisted synthesis of silicon nanocrystal inks. Adv. Mater. 2007, 19, 2513–2519. [Google Scholar] [CrossRef]
- Mousavi, S.M.; Hashemi, S.A.; Kalashgrani, M.Y.; Omidifar, N.; Bahrani, S.; Vijayakameswara Rao, N.; Babapoor, A.; Gholami, A.; Chiang, W.-H. Bioactive Graphene Quantum Dots Based Polymer Composite for Biomedical Applications. Polymers 2022, 14, 617. [Google Scholar] [CrossRef] [PubMed]
- Pignatello, R. Biomaterials Science and Engineering; BoD–Books on Demand: Norderstedt, Germany, 2011. [Google Scholar]
- Horst, F.H.; da Silva Rodrigues, C.V.; Carvalho, P.H.P.R.; Leite, A.M.; Azevedo, R.B.; Neto, B.A.; Corrêa, J.R.; Garcia, M.P.; Alotaibi, S.; Henini, M. From cow manure to bioactive carbon dots: A light-up probe for bioimaging investigations, glucose detection and potential immunotherapy agent for melanoma skin cancer. RSC Adv. 2021, 11, 6346–6352. [Google Scholar] [CrossRef] [PubMed]
- Mousavi, S.M.; Hashemi, S.A.; Ramakrishna, S.; Esmaeili, H.; Bahrani, S.; Koosha, M.; Babapoor, A. Green synthesis of supermagnetic Fe3O4–MgO nanoparticles via Nutmeg essential oil toward superior anti-bacterial and anti-fungal performance. J. Drug Deliv. Sci. Technol. 2019, 54, 101352. [Google Scholar] [CrossRef]
- Han, Y.; Zhang, F.; Zhang, J.; Shao, D.; Wang, Y.; Li, S.; Lv, S.; Chi, G.; Zhang, M.; Chen, L. Bioactive carbon dots direct the osteogenic differentiation of human bone marrow mesenchymal stem cells. Colloids Surf. B Biointerfaces 2019, 179, 1–8. [Google Scholar] [CrossRef]
- Seyed, M.M. Unsaturated polyester resins modified with cresol novolac epoxy and silica nanoparticles: Processing and mechanical properties. Int. J. Chem. Pet. Sci. (IJCPS) 2016, 5, 13–26. [Google Scholar]
- Abbas, A.; Mariana, L.T.; Phan, A.N. Biomass-waste derived graphene quantum dots and their applications. Carbon 2018, 140, 77–99. [Google Scholar] [CrossRef] [Green Version]
- Kalita, H.; Mohapatra, J.; Pradhan, L.; Mitra, A.; Bahadur, D.; Aslam, M. Efficient synthesis of rice based graphene quantum dots and their fluorescent properties. RSC Adv. 2016, 6, 23518–23524. [Google Scholar] [CrossRef]
- Roy, P.; Periasamy, A.P.; Chuang, C.; Liou, Y.-R.; Chen, Y.-F.; Joly, J.; Liang, C.-T.; Chang, H.-T. Plant leaf-derived graphene quantum dots and applications for white LEDs. New J. Chem. 2014, 38, 4946–4951. [Google Scholar] [CrossRef]
- Nirala, N.R.; Khandelwal, G.; Kumar, B.; Prakash, R.; Kumar, V. One step electro-oxidative preparation of graphene quantum dots from wood charcoal as a peroxidase mimetic. Talanta 2017, 173, 36–43. [Google Scholar] [CrossRef]
- Suryawanshi, A.; Biswal, M.; Mhamane, D.; Gokhale, R.; Patil, S.; Guin, D.; Ogale, S. Large scale synthesis of graphene quantum dots (GQDs) from waste biomass and their use as an efficient and selective photoluminescence on–off–on probe for Ag+ ions. Nanoscale 2014, 6, 11664–11670. [Google Scholar] [CrossRef]
- Wang, L.; Li, W.; Wu, B.; Li, Z.; Wang, S.; Liu, Y.; Pan, D.; Wu, M. Facile synthesis of fluorescent graphene quantum dots from coffee grounds for bioimaging and sensing. Chem. Eng. J. 2016, 300, 75–82. [Google Scholar] [CrossRef]
- Lagarón, J.-M. Multifunctional and nanoreinforced polymers for food packaging. In Multifunctional and Nanoreinforced Polymers for Food Packaging; Elsevier: Amsterdam, The Netherlands, 2011; pp. 1–28. [Google Scholar]
- Wang, J.; Zhang, H.; Wang, F.; Ai, X.; Huang, D.; Liu, G.; Mi, P. Enzyme-responsive polymers for drug delivery and molecular imaging. In Stimuli Responsive Polymeric Nanocarriers for Drug Delivery Applications, Volume 1; Elsevier: Amsterdam, The Netherlands, 2018; pp. 101–119. [Google Scholar]
- Hung, L.X.; Bassène, P.D.; Thang, P.N.; Loan, N.T.; de Marcillac, W.D.; Dhawan, A.R.; Feng, F.; Esparza-Villa, J.U.; Hien, N.T.T.; Liem, N.Q. Near-infrared emitting CdTeSe alloyed quantum dots: Raman scattering, photoluminescence and single-emitter optical properties. RSC Adv. 2017, 7, 47966–47974. [Google Scholar] [CrossRef] [Green Version]
- Valappil, M.O.; Pillai, V.K.; Alwarappan, S. Spotlighting graphene quantum dots and beyond: Synthesis, properties and sensing applications. Appl. Mater. Today 2017, 9, 350–371. [Google Scholar] [CrossRef]
- Kleinman, S.L.; Frontiera, R.R.; Henry, A.-I.; Dieringer, J.A.; Van Duyne, R.P. Creating, characterizing, and controlling chemistry with SERS hot spots. Phys. Chem. Chem. Phys. 2013, 15, 21–36. [Google Scholar] [CrossRef]
- Nie, S.; Emory, S.R. Probing single molecules and single nanoparticles by surface-enhanced Raman scattering. Science 1997, 275, 1102–1106. [Google Scholar] [CrossRef]
- Kneipp, K.; Wang, Y.; Kneipp, H.; Perelman, L.T.; Itzkan, I.; Dasari, R.R.; Feld, M.S. Single molecule detection using surface-enhanced Raman scattering (SERS). Phys. Rev. Lett. 1997, 78, 1667. [Google Scholar] [CrossRef] [Green Version]
- Zhang, W.; Li, C.; Gao, K.; Lu, F.; Liu, M.; Li, X.; Zhang, L.; Mao, D.; Gao, F.; Huang, L. Surface-enhanced Raman spectroscopy with Au-nanoparticle substrate fabricated by using femtosecond pulse. Nanotechnology 2018, 29, 205301. [Google Scholar] [CrossRef]
- Chang, T.-H.; Chang, Y.-C.; Chen, C.-M.; Chuang, K.-W.; Chou, C.-M. A facile method to directly deposit the large-scale Ag nanoparticles on a silicon substrate for sensitive, uniform, reproducible and stable SERS substrate. J. Alloys Compd. 2019, 782, 887–892. [Google Scholar] [CrossRef]
- Wu, H.; Luo, Y.; Hou, C.; Huo, D.; Zhou, Y.; Zou, S.; Zhao, J.; Lei, Y. Flexible bipyramid-AuNPs based SERS tape sensing strategy for detecting methyl parathion on vegetable and fruit surface. Sens. Actuators B Chem. 2019, 285, 123–128. [Google Scholar] [CrossRef]
- Fazio, E.; Neri, F.; Savasta, S.; Spadaro, S.; Trusso, S. Surface-enhanced Raman scattering of SnO2 bulk material and colloidal solutions. Phys. Rev. B 2012, 85, 195423. [Google Scholar] [CrossRef] [Green Version]
- Doğan, İ.; Gresback, R.; Nozaki, T.; van de Sanden, M. Analysis of temporal evolution of quantum dot surface chemistry by surface-enhanced Raman scattering. Sci. Rep. 2016, 6, 29508. [Google Scholar] [CrossRef] [Green Version]
- Milekhin, A.G.; Sveshnikova, L.; Duda, T.; Surovtsev, N.V.; Adichtchev, S.; Zahn, D.R. Surface enhanced Raman scattering by CdS quantum dots. JETP Lett. 2008, 88, 799–801. [Google Scholar] [CrossRef]
- Stadelmann, K.; Elizabeth, A.; Sabanés, N.M.; Domke, K.F. The SERS signature of PbS quantum dot oxidation. Vib. Spectrosc. 2017, 91, 157–162. [Google Scholar] [CrossRef] [Green Version]
- Hugall, J.T.; Baumberg, J.J.; Mahajan, S. Surface-enhanced Raman spectroscopy of CdSe quantum dots on nanostructured plasmonic surfaces. Appl. Phys. Lett. 2009, 95, 141111. [Google Scholar] [CrossRef] [Green Version]
- Lee, Y.-b.; Ho Lee, S.; Lee, S.; Lee, H.; Kim, J.; Joo, J. Surface enhanced Raman scattering effect of CdSe/ZnS quantum dots hybridized with Au nanowire. Appl. Phys. Lett. 2013, 102, 033109. [Google Scholar] [CrossRef]
- Sheremet, E.; Milekhin, A.; Rodriguez, R.; Weiss, T.; Nesterov, M.; Rodyakina, E.; Gordan, O.; Sveshnikova, L.; Duda, T.; Gridchin, V. Surface-and tip-enhanced resonant Raman scattering from CdSe nanocrystals. Phys. Chem. Chem. Phys. 2015, 17, 21198–21203. [Google Scholar] [CrossRef] [PubMed] [Green Version]
- Bak, S.; Kim, D.; Lee, H. Graphene quantum dots and their possible energy applications: A review. Curr. Appl. Phys. 2016, 16, 1192–1201. [Google Scholar] [CrossRef]
- Panyathip, R.; Sucharitakul, S.; Phaduangdhitidhada, S.; Ngamjarurojana, A.; Kumnorkaew, P.; Choopun, S. Surface Enhanced Raman Scattering in Graphene Quantum Dots Grown via Electrochemical Process. Molecules 2021, 26, 5484. [Google Scholar] [CrossRef] [PubMed]
- Ostrovskaya, L.Y. Characterization of different carbon nanomaterials promising for biomedical and sensor applications by the wetting method. Powder Metall. Met. Ceram. 2003, 42, 1–8. [Google Scholar] [CrossRef]
- Ling, X.; Xie, L.; Fang, Y.; Xu, H.; Zhang, H.; Kong, J.; Dresselhaus, M.S.; Zhang, J.; Liu, Z. Can graphene be used as a substrate for Raman enhancement? Nano Lett. 2010, 10, 553–561. [Google Scholar] [CrossRef] [PubMed]
- Gulzar, A.; Yang, P.; He, F.; Xu, J.; Yang, D.; Xu, L.; Jan, M.O. Bioapplications of graphene constructed functional nanomaterials. Chem. -Biol. Interact. 2017, 262, 69–89. [Google Scholar] [CrossRef]
- Kumar, S.; Tokunaga, K.; Namura, K.; Fukuoka, T.; Suzuki, M. Experimental evidence of a twofold electromagnetic enhancement mechanism of surface-enhanced Raman scattering. J. Phys. Chem. C 2020, 124, 21215–21222. [Google Scholar] [CrossRef]
- Lu, Y.; Lin, L.; Ye, J. Human metabolite detection by surface-enhanced Raman spectroscopy. Mater. Today Bio 2022, 13, 100205. [Google Scholar] [CrossRef]
- Pearson, B.; Wang, P.; Mills, A.; Pang, S.; McLandsborough, L.; He, L. Innovative sandwich assay with dual optical and SERS sensing mechanisms for bacterial detection. Anal. Methods 2017, 9, 4732–4739. [Google Scholar] [CrossRef]
- Fateixa, S.; Nogueira, H.I.; Trindade, T. Hybrid nanostructures for SERS: Materials development and chemical detection. Phys. Chem. Chem. Phys. 2015, 17, 21046–21071. [Google Scholar] [CrossRef]
- Sharma, B.; Frontiera, R.R.; Henry, A.-I.; Ringe, E.; Van Duyne, R.P. SERS: Materials, applications, and the future. Mater. Today 2012, 15, 16–25. [Google Scholar] [CrossRef]
- Ngo, H.T.; Wang, H.-N.; Fales, A.M.; Vo-Dinh, T. Plasmonic SERS biosensing nanochips for DNA detection. Anal. Bioanal. Chem. 2016, 408, 1773–1781. [Google Scholar] [CrossRef] [PubMed]
- Ganesh, S.; Venkatakrishnan, K.; Tan, B. Quantum scale organic semiconductors for SERS detection of DNA methylation and gene expression. Nat. Commun. 2020, 11, 1135. [Google Scholar] [CrossRef] [PubMed] [Green Version]
- Saviñon-Flores, F.; Méndez, E.; López-Castaños, M.; Carabarin-Lima, A.; López-Castaños, K.A.; González-Fuentes, M.A.; Méndez-Albores, A. A review on SERS-based detection of human virus infections: Influenza and coronavirus. Biosensors 2021, 11, 66. [Google Scholar] [CrossRef]
- Rajender, G.; Giri, P. Formation mechanism of graphene quantum dots and their edge state conversion probed by photoluminescence and Raman spectroscopy. J. Mater. Chem. C 2016, 4, 10852–10865. [Google Scholar] [CrossRef]
- Aronson, J.K. Biomarkers and surrogate endpoints. Br. J. Clin. Pharmacol. 2005, 59, 491. [Google Scholar] [CrossRef] [PubMed] [Green Version]
- Tanaka, T.; Tanaka, M.; Tanaka, T.; Ishigamori, R. Biomarkers for colorectal cancer. Int. J. Mol. Sci. 2010, 11, 3209–3225. [Google Scholar] [CrossRef] [Green Version]
- Vaughan, L. Biomarkers in acute medicine. Medicine 2017, 45, 150–156. [Google Scholar] [CrossRef]
- Mousavi, S.M.; Low, F.W.; Hashemi, S.A.; Lai, C.W.; Ghasemi, Y.; Soroshnia, S.; Savardashtaki, A.; Babapoor, A.; Pynadathu Rumjit, N.; Goh, S.M. Development of graphene based nanocomposites towards medical and biological applications. Artif. Cells Nanomed. Biotechnol. 2020, 48, 1189–1205. [Google Scholar] [CrossRef]
- McCormick, T.; Martin, K.; Hehenberger, M. The Evolving Role of Biomarkers: Focusing on Patients from Research to Clinical Practice; IBM Global Business Services: Pyrmont, NSW, Australia, 2007; Volume 4, pp. 1–20. [Google Scholar]
- Mayeux, R. Biomarkers: Potential uses and limitations. NeuroRx 2004, 1, 182–188. [Google Scholar] [CrossRef]
- Gârban, Z.; Avacovici, A.; Gârban, G.; Ghibu, G.; Velciov, A.B.; Pop, C.I. Biomarkers: Theoretical aspects and applicative peculiarities note i. general characteristics of biomarkers. Agroaliment. Process Technol 2005, 11, 139–146. [Google Scholar]
- Hashemi, S.A.; Mousavi, S.M.; Faghihi, R.; Arjmand, M.; Rahsepar, M.; Bahrani, S.; Ramakrishna, S.; Lai, C.W. Superior X-ray radiation shielding effectiveness of biocompatible polyaniline reinforced with hybrid graphene oxide-iron tungsten nitride flakes. Polymers 2020, 12, 1407. [Google Scholar] [CrossRef] [PubMed]
- Polivka, J.; Krakorova, K.; Peterka, M.; Topolcan, O. Current status of biomarker research in neurology. EPMA J. 2016, 7, 14. [Google Scholar] [CrossRef] [PubMed] [Green Version]
- Tietjen, G.E.; Khubchandani, J. Vascular biomarkers in migraine. Cephalalgia 2015, 35, 95–117. [Google Scholar] [CrossRef]
- Tietjen, G.E.; Khubchandani, J.; Herial, N.A.; Shah, K. Adverse childhood experiences are associated with migraine and vascular biomarkers. Headache: J. Head Face Pain 2012, 52, 920–929. [Google Scholar] [CrossRef]
- Durham, P.; Papapetropoulos, S. Biomarkers associated with migraine and their potential role in migraine management. Headache J. Head Face Pain 2013, 53, 1262–1277. [Google Scholar] [CrossRef]
- Hashemi, S.A.; Mousavi, S.M.; Naderi, H.R.; Bahrani, S.; Arjmand, M.; Hagfeldt, A.; Chiang, W.-H.; Ramakrishna, S. Reinforced polypyrrole with 2D graphene flakes decorated with interconnected nickel-tungsten metal oxide complex toward superiorly stable supercapacitor. Chem. Eng. J. 2021, 418, 129396. [Google Scholar] [CrossRef]
- Ishizaki, K.; Takeshima, T.; Fukuhara, Y.; Araki, H.; Nakaso, K.; Kusumi, M.; Nakashima, K. Increased plasma transforming growth factor-β1 in migraine. Headache J. Head Face Pain 2005, 45, 1224–1228. [Google Scholar] [CrossRef]
- Kurth, T.; Ridker, P.; Buring, J. Migraine and biomarkers of cardiovascular disease in women. Cephalalgia 2008, 28, 49–56. [Google Scholar] [CrossRef]
- Song, C.; Guo, S.; Jin, S.; Chen, L.; Jung, Y.M. Biomarkers determination based on surface-enhanced Raman scattering. Chemosensors 2020, 8, 118. [Google Scholar] [CrossRef]
- Li, Y.; Liu, X.; Guo, J.; Zhang, Y.; Guo, J.; Wu, X.; Wang, B.; Ma, X. Simultaneous detection of inflammatory biomarkers by SERS nanotag-based lateral flow assay with portable cloud Raman spectrometer. Nanomaterials 2021, 11, 1496. [Google Scholar] [CrossRef] [PubMed]
- Ranjan, R.; Esimbekova, E.N.; Kratasyuk, V.A. Rapid biosensing tools for cancer biomarkers. Biosens. Bioelectron. 2017, 87, 918–930. [Google Scholar] [CrossRef]
- Chen, R.; Du, X.; Cui, Y.; Zhang, X.; Ge, Q.; Dong, J.; Zhao, X. Vertical flow assay for inflammatory biomarkers based on nanofluidic channel array and SERS nanotags. Small 2020, 16, 2002801. [Google Scholar] [CrossRef]
- Liu, H.; Gao, X.; Xu, C.; Liu, D. SERS Tags for Biomedical Detection and Bioimaging. Theranostics 2022, 12, 1870. [Google Scholar] [CrossRef] [PubMed]
- Singh, S.; Deshmukh, A.; Chaturvedi, P.; Krishna, C.M. In vivo Raman spectroscopic identification of premalignant lesions in oral buccal mucosa. J. Biomed. Opt. 2012, 17, 105002. [Google Scholar] [CrossRef] [PubMed]
- Hamza, T.H.; Zabetian, C.P.; Tenesa, A.; Laederach, A.; Montimurro, J.; Yearout, D.; Kay, D.M.; Doheny, K.F.; Paschall, J.; Pugh, E. Common genetic variation in the HLA region is associated with late-onset sporadic Parkinson’s disease. Nat. Genet. 2010, 42, 781–785. [Google Scholar] [CrossRef]
- Araujo, D.; Lapchak, P. Induction of immune system mediators in the hippocampal formation in Alzheimer’s and Parkinson’s diseases: Selective effects on specific interleukins and interleukin receptors. Neuroscience 1994, 61, 745–754. [Google Scholar] [CrossRef]
- Maddon, P.J.; Dalgleish, A.G.; McDougal, J.S.; Clapham, P.R.; Weiss, R.A.; Axel, R. The T4 gene encodes the AIDS virus receptor and is expressed in the immune system and the brain. Cell 1986, 47, 333–348. [Google Scholar] [CrossRef]
- Maffia, P.; Zinselmeyer, B.H.; Ialenti, A.; Kennedy, S.; Baker, A.H.; McInnes, I.B.; Brewer, J.M.; Garside, P. Images in cardiovascular medicine: Multiphoton microscopy for three-dimensional imaging of lymphocyte recruitment into apolipoprotein-E-deficient mouse carotid artery. Circulation 2007, 115, e326–e328. [Google Scholar] [CrossRef] [Green Version]
- Gabriel, S.E. The epidemiology of rheumatoid arthritis. Rheum. Dis. Clin. N. Am. 2001, 27, 269–281. [Google Scholar] [CrossRef]
- Ortolano, F.; Maffia, P.; Dever, G.; Hutchison, S.; Benson, R.; Millington, O.; De Simoni, M.; Bushell, T.; Garside, P.; Carswell, H. Imaging T-cell movement in the brain during experimental cerebral malaria. Parasite Immunol. 2009, 31, 147–150. [Google Scholar] [CrossRef]
- Fumagalli, S.; Coles, J.A.; Ejlerskov, P.; Ortolano, F.; Bushell, T.J.; Brewer, J.M.; De Simoni, M.-G.; Dever, G.; Garside, P.; Maffia, P. In vivo real-time multiphoton imaging of T lymphocytes in the mouse brain after experimental stroke. Stroke 2011, 42, 1429–1436. [Google Scholar] [CrossRef] [PubMed] [Green Version]
- Theer, P.; Denk, W. On the fundamental imaging-depth limit in two-photon microscopy. JOSA A 2006, 23, 3139–3149. [Google Scholar] [CrossRef] [PubMed]
- Zipfel, W.R.; Williams, R.M.; Christie, R.; Nikitin, A.Y.; Hyman, B.T.; Webb, W.W. Live tissue intrinsic emission microscopy using multiphoton-excited native fluorescence and second harmonic generation. Proc. Natl. Acad. Sci. USA 2003, 100, 7075–7080. [Google Scholar] [CrossRef] [Green Version]
- Patterson, G.H.; Piston, D.W. Photobleaching in two-photon excitation microscopy. Biophys. J. 2000, 78, 2159–2162. [Google Scholar] [CrossRef] [Green Version]
- König, K. Multiphoton microscopy in life sciences. J. Microsc. 2000, 200, 83–104. [Google Scholar]
- McQueenie, R.; Stevenson, R.; Benson, R.; MacRitchie, N.; McInnes, I.; Maffia, P.; Faulds, K.; Graham, D.; Brewer, J.; Garside, P. Detection of inflammation in vivo by surface-enhanced Raman scattering provides higher sensitivity than conventional fluorescence imaging. Anal. Chem. 2012, 84, 5968–5975. [Google Scholar] [CrossRef]
- Zavaleta, C.L.; Smith, B.R.; Walton, I.; Doering, W.; Davis, G.; Shojaei, B.; Natan, M.J.; Gambhir, S.S. Multiplexed imaging of surface enhanced Raman scattering nanotags in living mice using noninvasive Raman spectroscopy. Proc. Natl. Acad. Sci. USA 2009, 106, 13511–13516. [Google Scholar]
- Maiti, K.K.; Dinish, U.; Fu, C.Y.; Lee, J.-J.; Soh, K.-S.; Yun, S.-W.; Bhuvaneswari, R.; Olivo, M.; Chang, Y.-T. Development of biocompatible SERS nanotag with increased stability by chemisorption of reporter molecule for in vivo cancer detection. Biosens. Bioelectron. 2010, 26, 398–403. [Google Scholar]
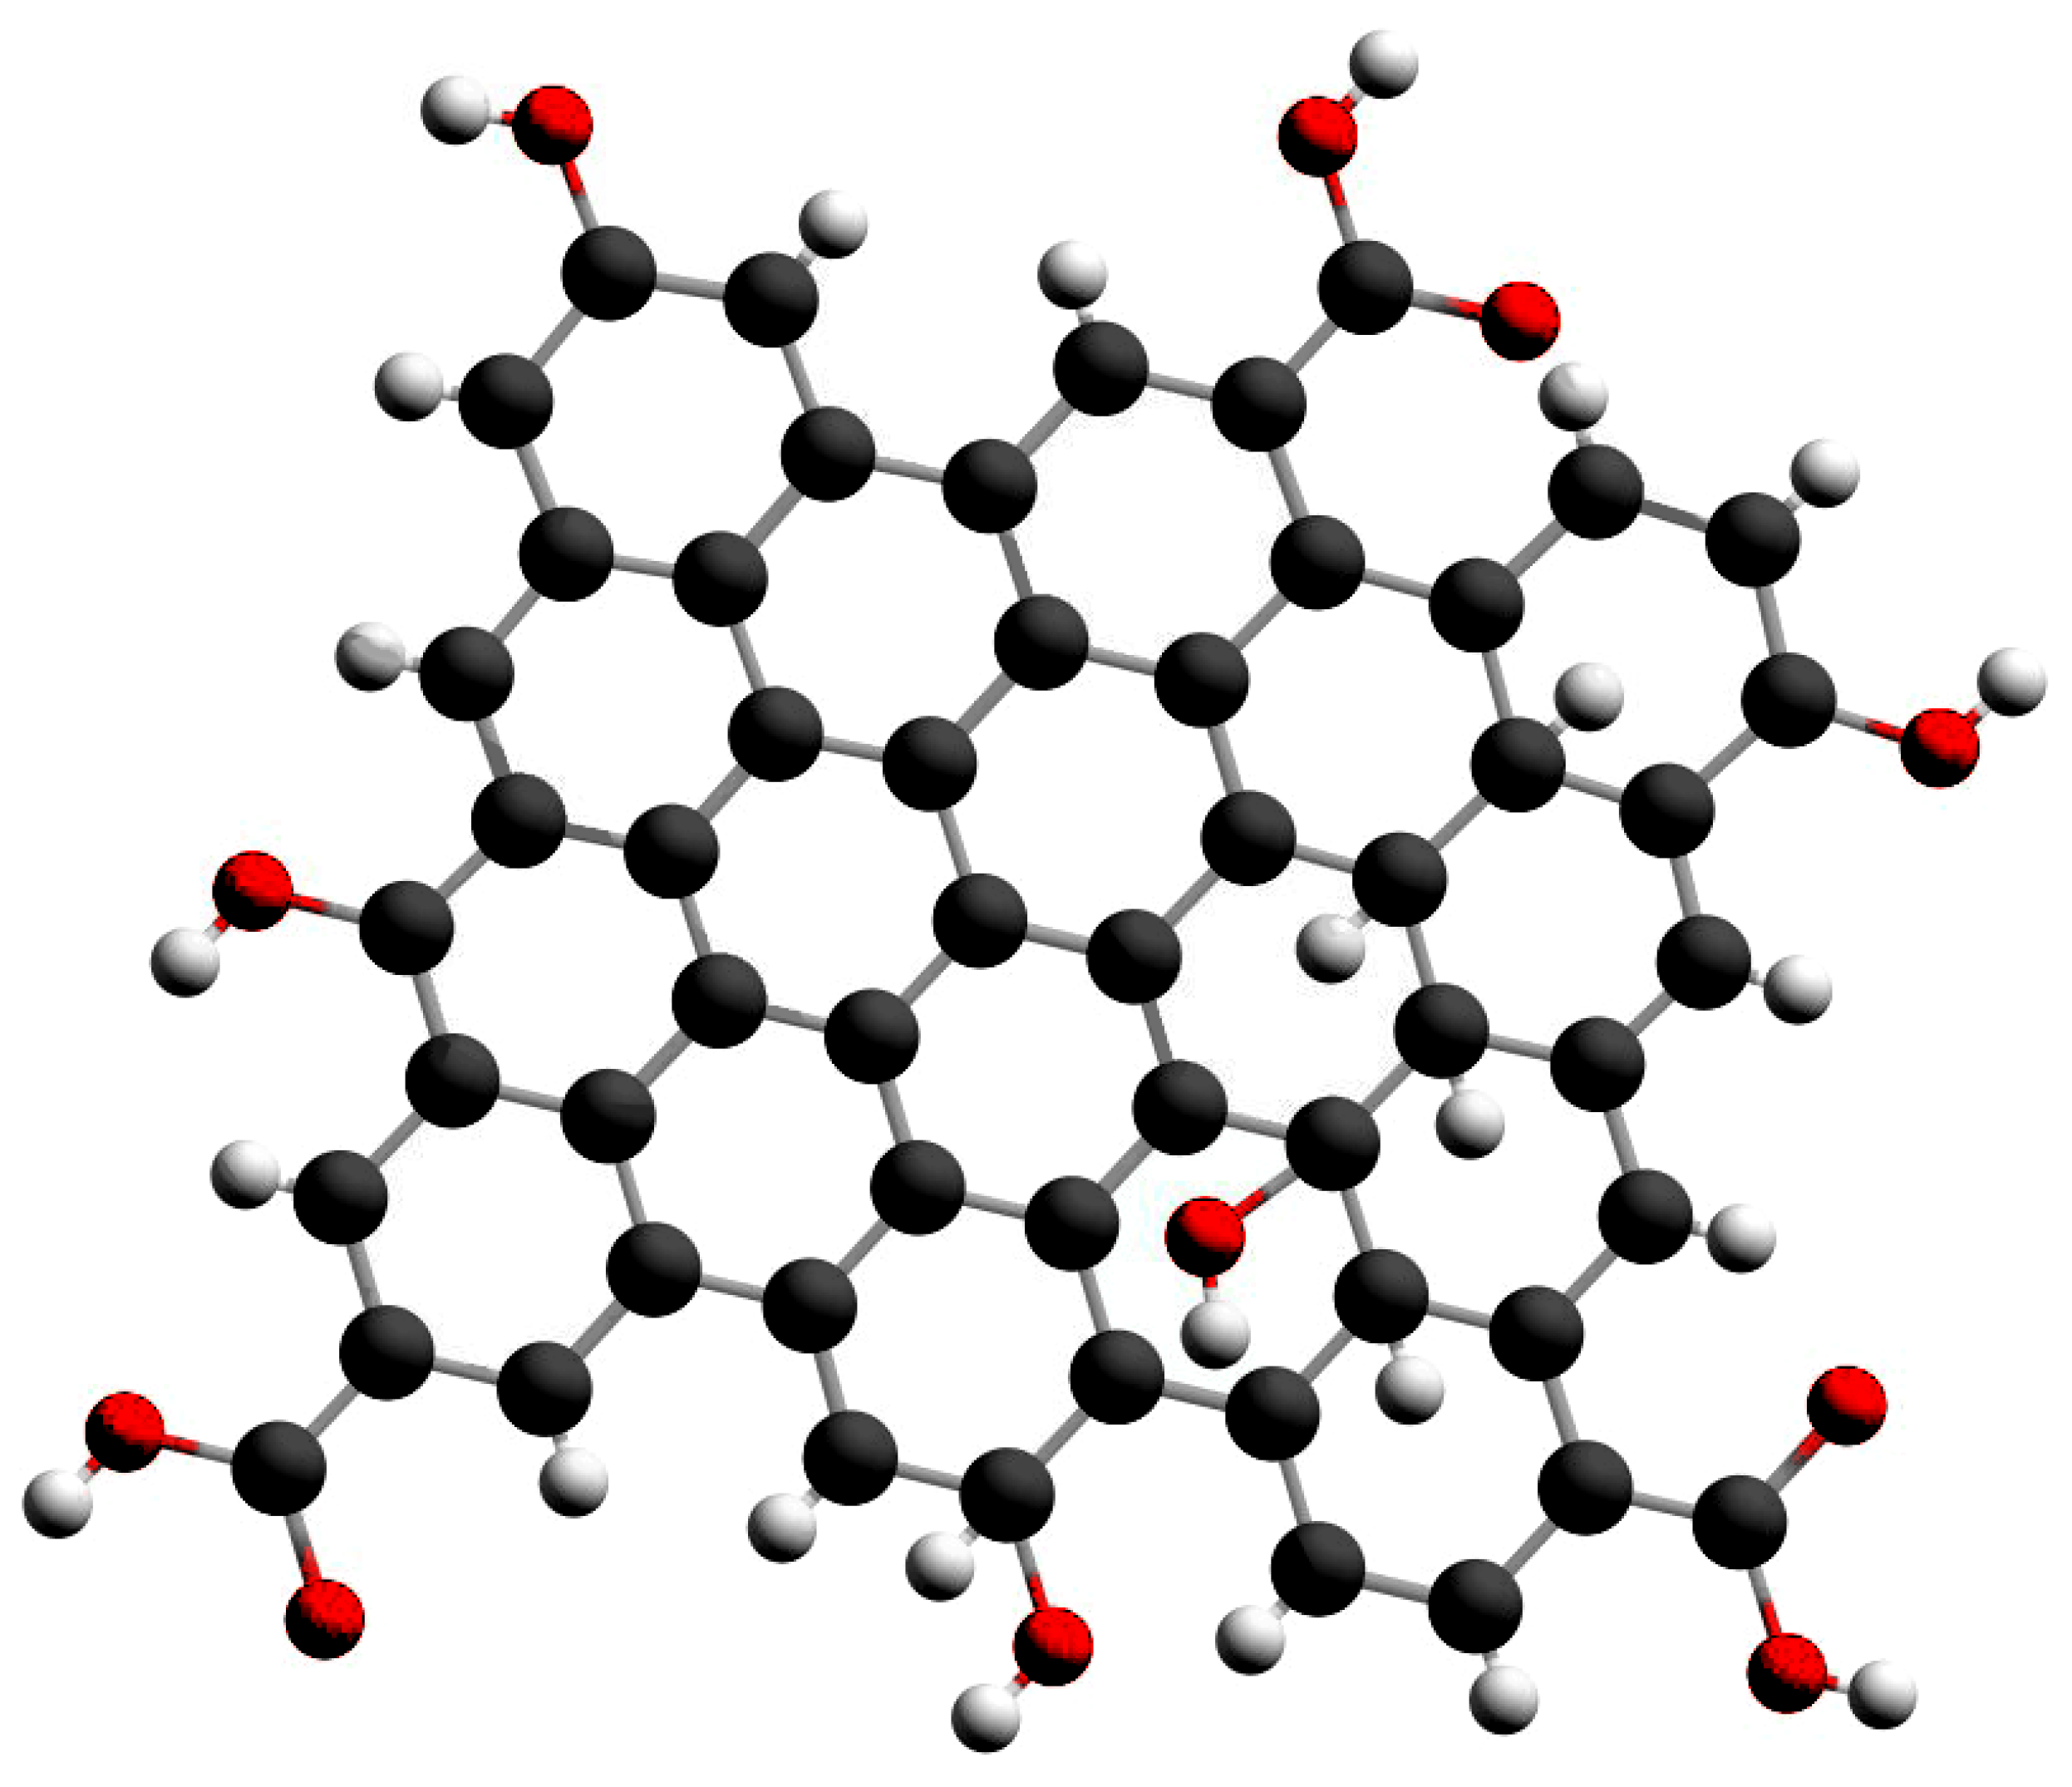
 : Carbon,
  : Hydrogen,
  : Oxygen).


| Subgroup | Initial Material | Size (nm) | Quantum Efficiency | Ref. | |
|---|---|---|---|---|---|
| Top-down | Acid oxidation | Carbon black | 15 | 44.5 | [63] |
| Hydrothermal | Graphene oxide | 5–13 | 5 | [64] | |
| Solvothermal | Graphene oxide | 3–5 | 1.6 | [65] | |
| Microwave | Graphene oxide | 2–7 | 8 | [66] | |
| Ultrasound waves | Graphene | 3–5 | - | [54] | |
| Electrochemical | Graphite | 5–10 | - | [67] | |
| Bottom-up | Pyrolysis of the precursor | Glucose | 1.65–21 | - | [68] |
| Catalytic opening of the cage | Fullerene 60 | 2.7–10 | 15–30 | [46] | |
| Pyrolysis | Hexa benzo chromen | ~60 | - | [69] |
| Precursor | Product | Preparation Approach | Size (nm) | Ref. |
|---|---|---|---|---|
| Rice grains | GQDs | Pyrolysis | 2–6.5 | [87] |
| Fenugreek leaf extract | GQDs | Pyrolysis and hydrothermal treatment | 3–10 | [88] |
| Wood charcoal | GQDs | Electrochemical oxidation | 3–6 | [89] |
| Neem leaves | GQDs, Am-GQDs | Pyrolysis and hydrothermal treatments | 5–6 | [90] |
| Coffee grounds | GQDs, PEIGQDs | Hydrothermal treatment | 1.88 (GQDs)2.67 (PEIGQDs) | [91] |
Publisher’s Note: MDPI stays neutral with regard to jurisdictional claims in published maps and institutional affiliations. |
© 2022 by the authors. Licensee MDPI, Basel, Switzerland. This article is an open access article distributed under the terms and conditions of the Creative Commons Attribution (CC BY) license (https://creativecommons.org/licenses/by/4.0/).
Share and Cite
Mousavi, S.M.; Hashemi, S.A.; Yari Kalashgrani, M.; Kurniawan, D.; Gholami, A.; Rahmanian, V.; Omidifar, N.; Chiang, W.-H. Recent Advances in Inflammatory Diagnosis with Graphene Quantum Dots Enhanced SERS Detection. Biosensors 2022, 12, 461. https://doi.org/10.3390/bios12070461
Mousavi SM, Hashemi SA, Yari Kalashgrani M, Kurniawan D, Gholami A, Rahmanian V, Omidifar N, Chiang W-H. Recent Advances in Inflammatory Diagnosis with Graphene Quantum Dots Enhanced SERS Detection. Biosensors. 2022; 12(7):461. https://doi.org/10.3390/bios12070461
Chicago/Turabian StyleMousavi, Seyyed Mojtaba, Seyyed Alireza Hashemi, Masoomeh Yari Kalashgrani, Darwin Kurniawan, Ahmad Gholami, Vahid Rahmanian, Navid Omidifar, and Wei-Hung Chiang. 2022. "Recent Advances in Inflammatory Diagnosis with Graphene Quantum Dots Enhanced SERS Detection" Biosensors 12, no. 7: 461. https://doi.org/10.3390/bios12070461