Double Competitive Immunodetection of Small Analyte: Realization for Highly Sensitive Lateral Flow Immunoassay of Chloramphenicol

 ,
,  and
and 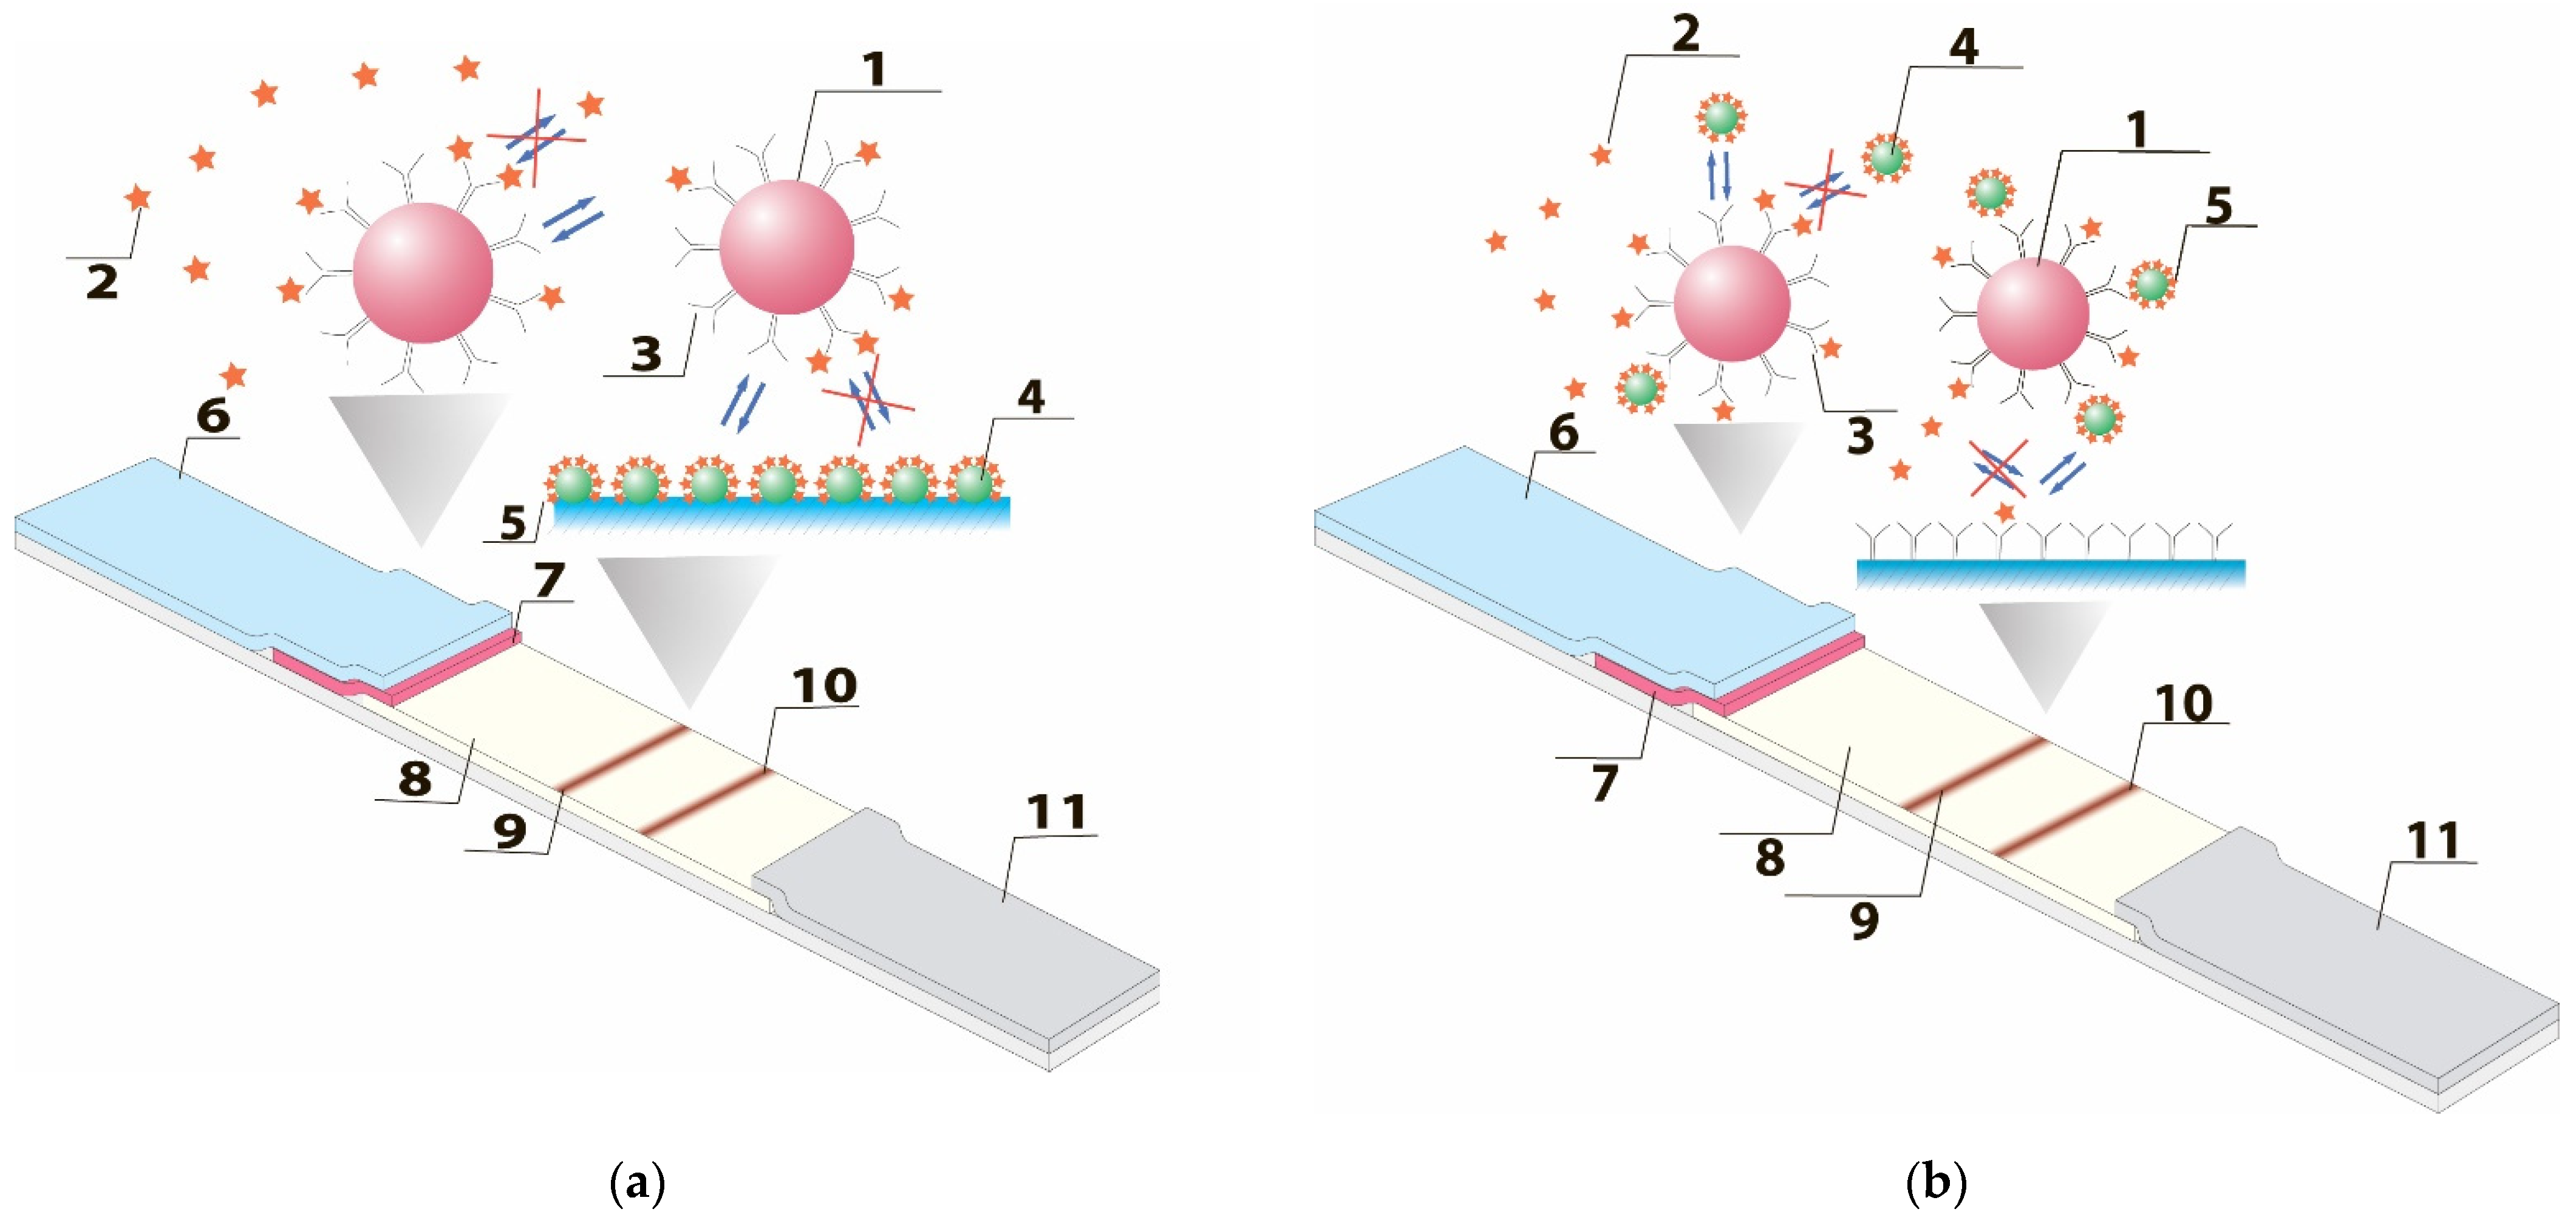
Abstract
:1. Introduction
2. Materials and Methods
2.1. Reagents and Materials
2.2. Equipment
2.3. Synthesis of Hapten-Protein Conjugates
2.4. Synthesis of Gold Nanoparticles (GNP) and Their Conjugates with Monoclonal Antibodies to CAP
2.5. Assembling of Test Strips for LFIA
2.6. Lateral Flow Assay of CAP
3. Results
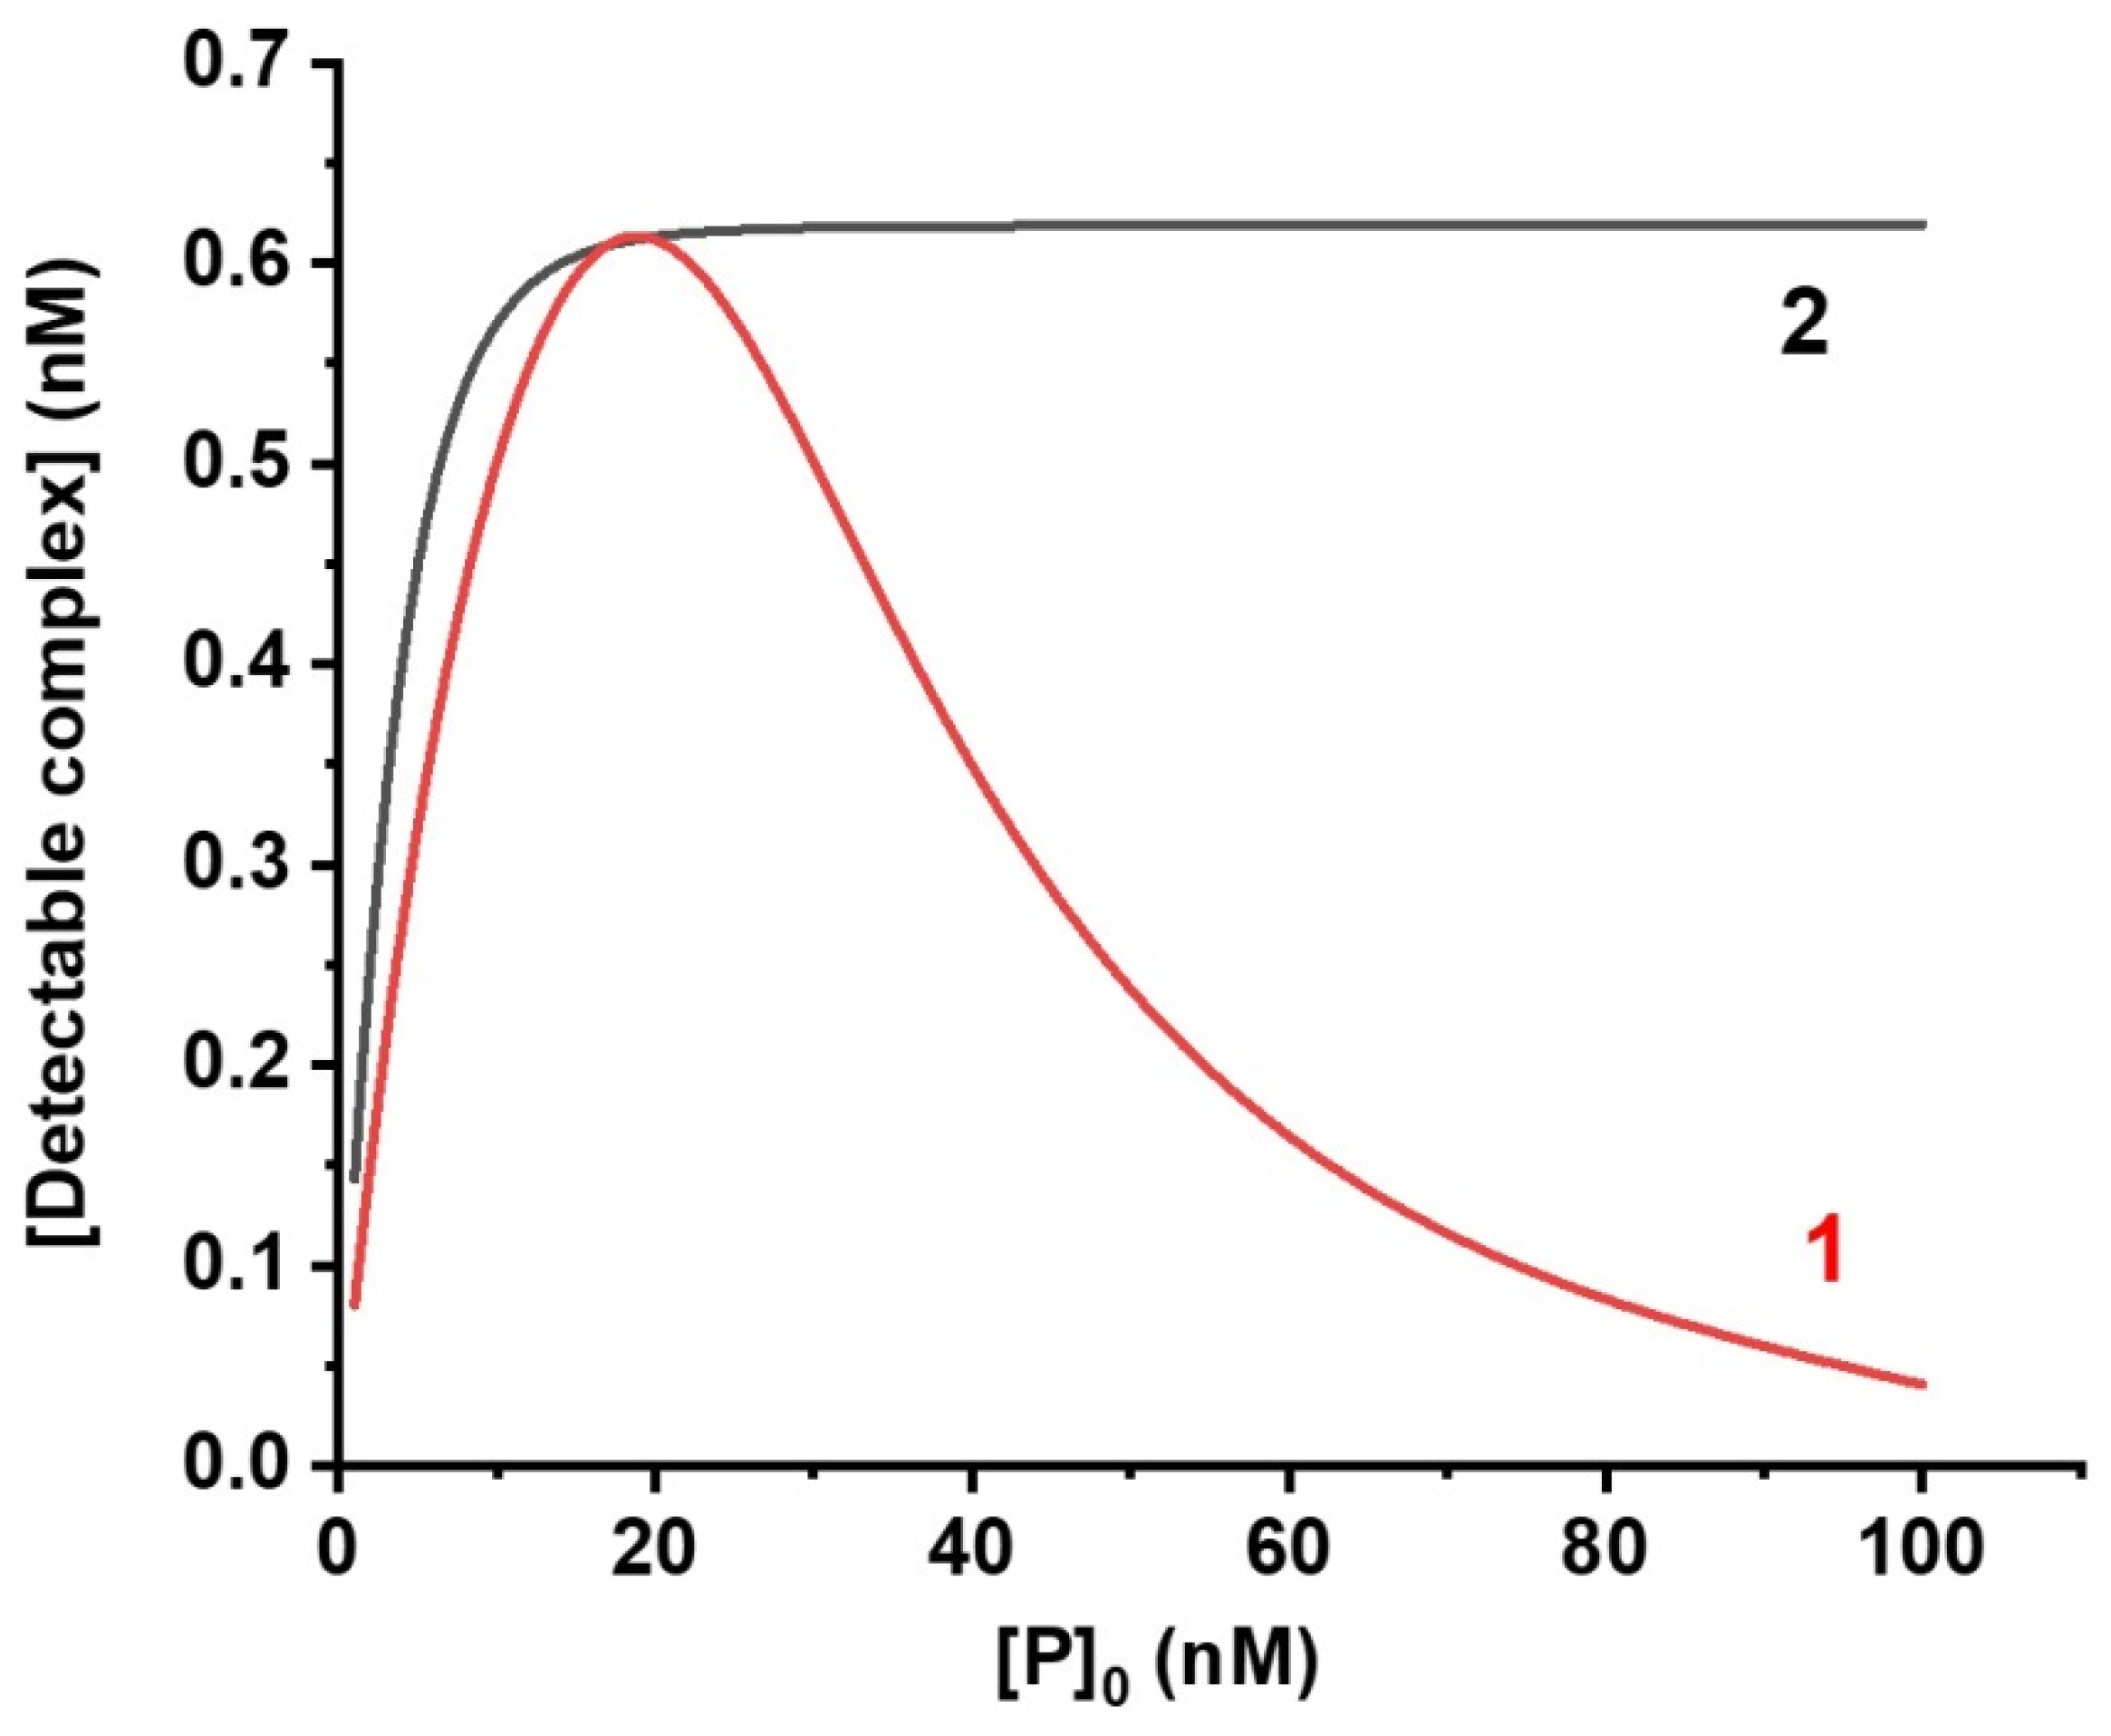
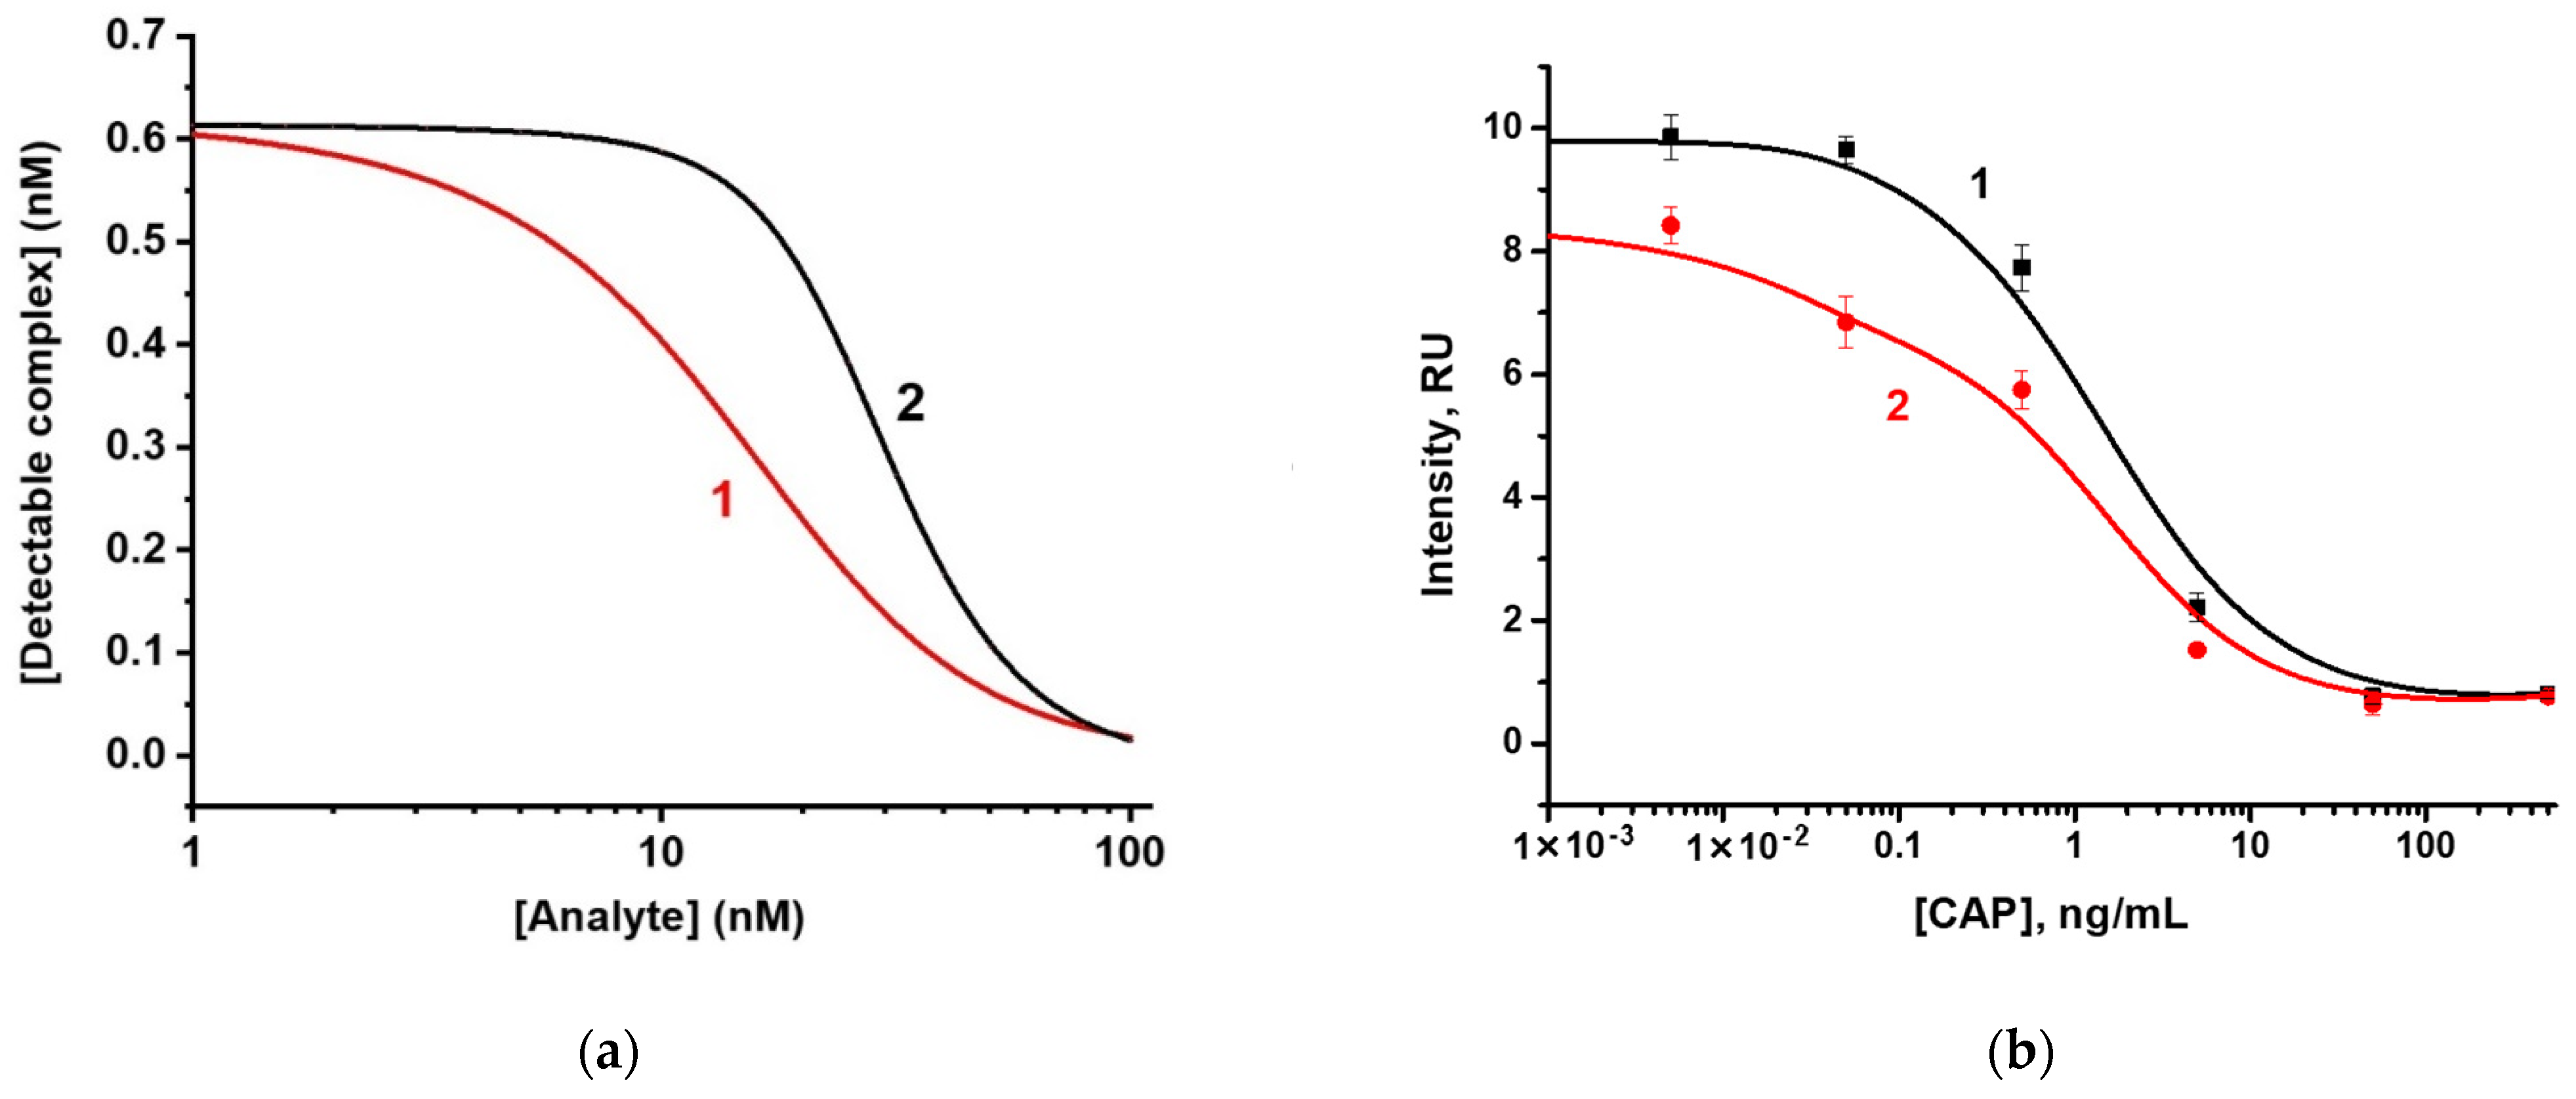
3.1. Mathematical Description of Competitive LFIA Schemes
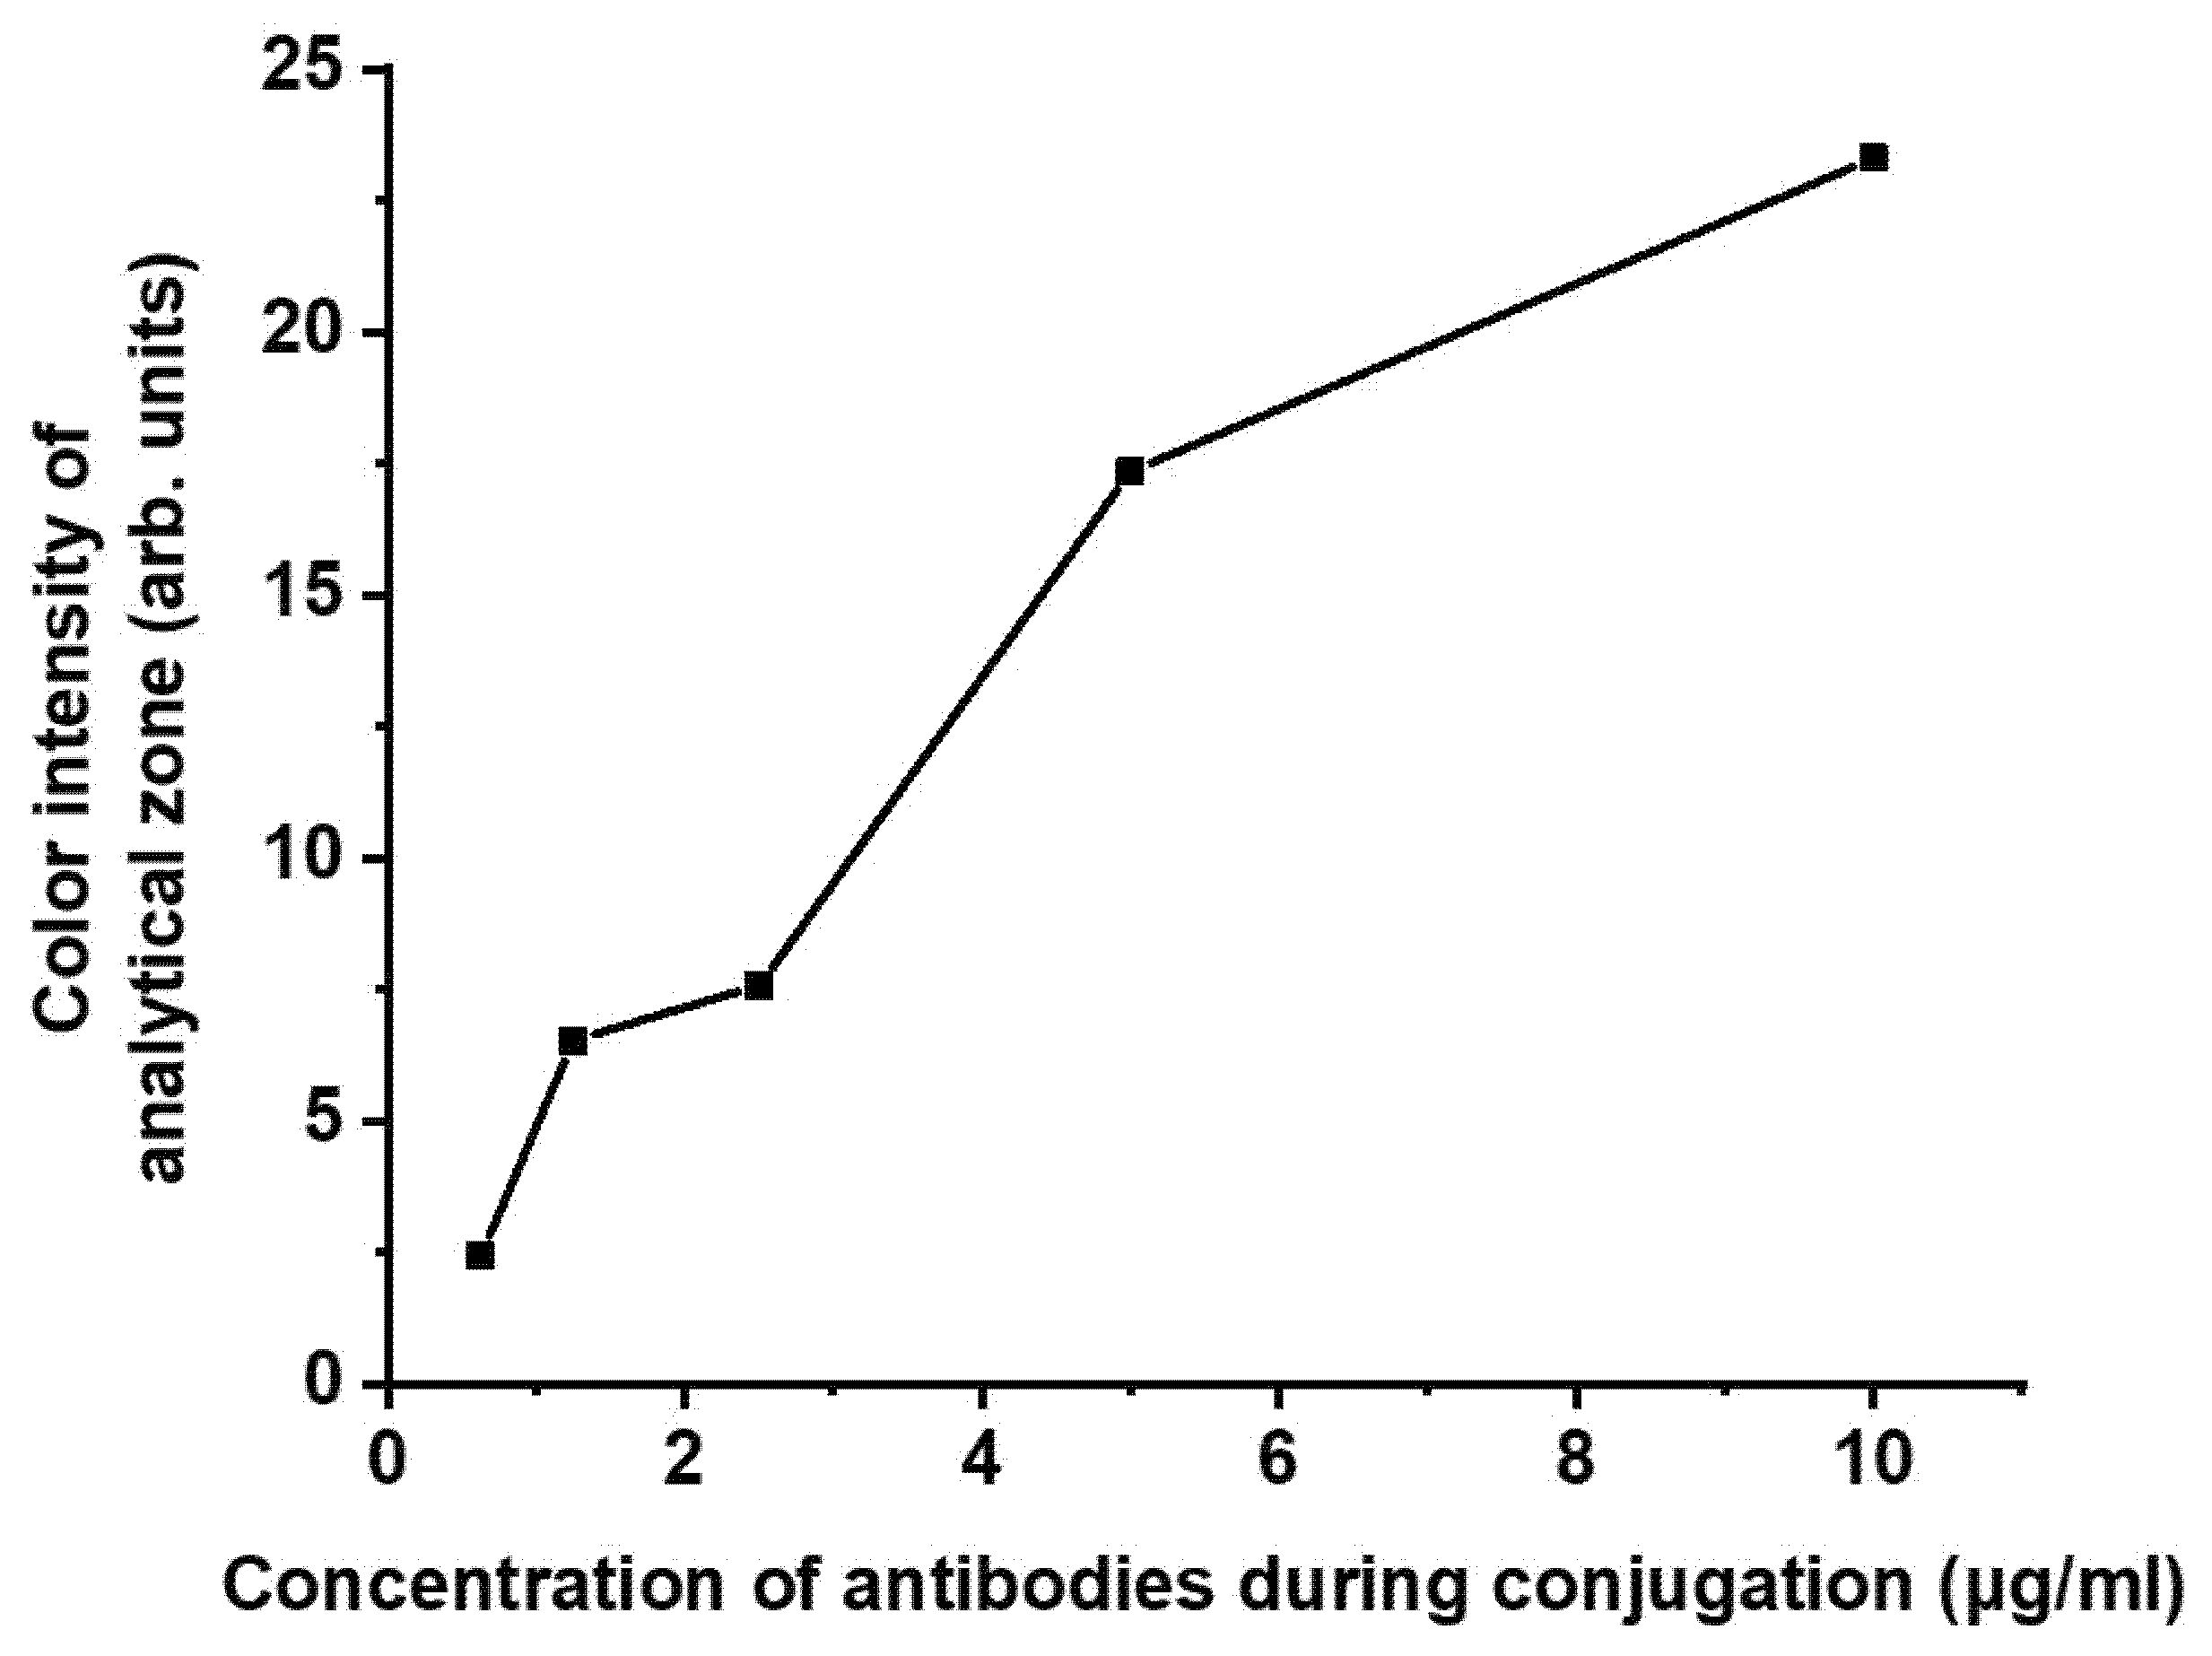
3.2. Optimization of LFIA Parameters to Perform Assay of CAP
3.3. Assessment of the Developed Double Competitive LFIA in Honey Samples
4. Conclusions
Supplementary Materials
Author Contributions
Funding
Institutional Review Board Statement
Informed Consent Statement
Data Availability Statement
Conflicts of Interest
References
- Syedmoradi, L.; Daneshpour, M.; Alvandipour, M.; Gomez, F.A.; Hajghassem, H.; Omidfar, K. Point of care testing: The impact of nanotechnology. Biosens. Bioelectron. 2017, 87, 373–387. [Google Scholar] [CrossRef] [PubMed]
- Quesada-González, D.; Merkoçi, A. Nanoparticle-based lateral flow biosensors. Biosens. Bioelectron. 2015, 73, 47–63. [Google Scholar] [CrossRef] [PubMed] [Green Version]
- Anfossi, L.; Di Nardo, F.; Cavalera, S.; Giovannoli, C.; Baggiani, C. Multiplex Lateral Flow Immunoassay: An Overview of Strategies towards High-throughput Point-of-Need Testing. Biosensors 2018, 9, 2. [Google Scholar] [CrossRef] [PubMed] [Green Version]
- Li, F.; You, M.; Li, S.; Hu, J.; Liu, C.; Gong, Y.; Yang, H.; Xu, F. Paper-based point-of-care immunoassays: Recent advances and emerging trends. Biotechnol. Adv. 2020, 39, 107442. [Google Scholar] [CrossRef]
- Mak, W.C.; Beni, V.; Turner, A.P.F. Lateral-flow technology: From visual to instrumental. Trends Anal. Chem. 2016, 79, 297–305. [Google Scholar] [CrossRef]
- Foysal, K.H.; Seo, S.E.; Kim, M.J.; Kwon, O.S.; Chong, J.W. Analyte Quantity Detection from Lateral Flow Assay Using a Smartphone. Sensors 2019, 19, 4812. [Google Scholar] [CrossRef] [Green Version]
- Ngom, B.; Guo, Y.; Wang, X.; Bi, D. Development and application of lateral flow test strip technology for detection of infectious agents and chemical contaminants: A review. Anal. Bioanal. Chem. 2010, 397, 1113–1135. [Google Scholar] [CrossRef]
- Anfossi, L.; Baggiani, C.; Giovannoli, C.; D’Arco, G.; Giraudi, G. Lateral-flow immunoassays for mycotoxins and phycotoxins: A review. Anal. Bioanal. Chem. 2013, 405, 467–480. [Google Scholar] [CrossRef]
- Krska, R.; Molinelli, A. Rapid test strips for analysis of mycotoxins in food and feed. Anal. Bioanal. Chem. 2009, 393, 67–71. [Google Scholar] [CrossRef]
- Qriouet, Z.; Qmichou, Z.; Bouchoutrouch, N.; Mahi, H.; Cherrah, Y.; Sefrioui, H. Analytical Methods Used for the Detection and Quantification of Benzodiazepines. J. Anal. Methods Chem. 2019, 2019, 2035492. [Google Scholar] [CrossRef] [Green Version]
- Peng, P.; Liu, C.; Li, Z.; Xue, Z.; Mao, P.; Hu, J.; Xu, F.; Yao, C.; You, M. Emerging ELISA derived technologies for in vitro diagnostics. Trend. Anal. Chem. 2022, 152, 116605. [Google Scholar] [CrossRef]
- Katis, I.N.; He, P.J.W.; Eason, R.W.; Sones, C.L. Improved sensitivity and limit-of-detection of lateral flow devices using spatial constrictions of the flow-path. Biosens. Bioelectron. 2018, 113, 95–100. [Google Scholar] [CrossRef] [PubMed]
- Gordon, J.; Michel, G. Analytical Sensitivity Limits for Lateral Flow Immunoassays. Clin. Chem. 2008, 54, 1250–1251. [Google Scholar] [CrossRef] [PubMed] [Green Version]
- Zherdev, A.V.; Dzantiev, B.B. Ways to Reach Lower Detection Limits of Lateral Flow Immunoassays. In Rapid Test-Advances in Design, Format and Diagnostic Applications; Anfossi, L., Ed.; IntechOpen: London, UK, 2018; pp. 9–43. [Google Scholar]
- Liu, Y.; Zhan, L.; Qin, Z.; Sackrison, J.; Bischof, J.C. Ultrasensitive and Highly Specific Lateral Flow Assays for Point-of-Care Diagnosis. ACS Nano 2021, 15, 3593–3611. [Google Scholar] [CrossRef]
- Bishop, J.D.; Hsieh, H.V.; Gasperino, D.J.; Weigl, B.H. Sensitivity enhancement in lateral flow assays: A systems perspective. Lab Chip 2019, 19, 2486–2499. [Google Scholar] [CrossRef] [Green Version]
- Cheung, S.F.; Cheng, S.K.L.; Kamei, D.T. Paper-Based Systems for Point-of-Care Biosensing. SLAS Technol. 2015, 20, 316–333. [Google Scholar] [CrossRef] [Green Version]
- He, W.; You, M.; Li, Z.; Cao, L.; Xu, F.; Li, F.; Li, A. Upconversion nanoparticles-based lateral flow immunoassay for point-of-care diagnosis of periodontitis. Sens. Actuat. B Chem. 2021, 334, 129637. [Google Scholar] [CrossRef]
- Liu, A.; Anfossi, L.; Shen, L.; Li, C.; Wang, X. Non-competitive immunoassay for low-molecular-weight contaminant detection in food, feed and agricultural products: A mini-review. Trends Food Sci. Technol. 2018, 71, 181–187. [Google Scholar] [CrossRef]
- Li, Y.; Zhang, G.; Mao, X.; Yang, S.; Ruyck, K.D.; Wu, Y. High Sensitivity Immunoassays for Small Molecule Compounds Detection–Novel Noncompetitive Immunoassay Designs. Trends Anal. Chem. 2018, 103, 198–208. [Google Scholar]
- Ueda, H. Open sandwich immunoassay: A novel immunoassay approach based on the interchain interaction of an antibody variable region. J. Biosci. Bioeng. 2002, 94, 614–619. [Google Scholar] [CrossRef]
- Bacanlı, M.; Başaran, N. Importance of antibiotic residues in animal food. Food Chem. Toxicol. 2019, 125, 462–466. [Google Scholar] [CrossRef] [PubMed]
- Tufa, T. Veterinary Drug Residues in Food-animal Products: Its Risk Factors and Potential Effects on Public Health. J. Vet. Sci. Technol. 2015, 7, 1000285. [Google Scholar]
- Al-Waili, N.; Salom, K.; Al-Ghamdi, A.; Ansari, M.J. Antibiotic, pesticide, and microbial contaminants of honey: Human health hazards. Sci. World J. 2012, 2012, 930849. [Google Scholar] [CrossRef] [Green Version]
- Byzova, N.A.; Zvereva, E.A.; Zherdev, A.V.; Eremin, S.A.; Dzantiev, B.B. Rapid pretreatment-free immunochromatographic assay of chloramphenicol in milk. Talanta 2010, 81, 843–848. [Google Scholar] [CrossRef] [PubMed]
- Frens, G. Controlled Nucleation for the Regulation of the Particle Size in Monodisperse Gold Suspensions. Nat. Phys. Sci. 1973, 241, 20–22. [Google Scholar] [CrossRef]
- Zvereva, E.A.; Byzova, N.A.; Sveshnikov, P.G.; Zherdev, A.V.; Dzantiev, B.B. Cut-off on demand: Adjustment of the threshold level of an immunochromatographic assay for chloramphenicol. Anal. Methods 2015, 7, 6378–6384. [Google Scholar] [CrossRef]
- Uhrovčík, J. Strategy for determination of LOD and LOQ values–Some basic aspects. Talanta 2014, 119, 178–180. [Google Scholar] [CrossRef]
- Bahadır, E.B.; Sezgintürk, M.K. Lateral flow assays: Principles, designs and labels. Trends Anal. Chem. 2016, 82, 286–306. [Google Scholar] [CrossRef]
- Sotnilov, D.V.; Byzova, N.A.; Zvereva, E.A.; Bartosh, A.V.; Zherdev, A.V.; Dzantiev, B.B. Mathematical modeling of immunochromatographic test systems in a competitive format: Analytical and numerical approaches. Biochem. Eng. J. 2020, 164, 107763. [Google Scholar] [CrossRef]
- EC. EC Commission Decision 2003/181/EC of 13 March 2003 Amending Decision 2002/657/EC as Regards the Setting of Maximum Residual Permisable Limits (MRPLs) for Certain Residues in Food of Animal Origin; EC: Brussels, Belgium, 2002. [Google Scholar]


Publisher’s Note: MDPI stays neutral with regard to jurisdictional claims in published maps and institutional affiliations. |
© 2022 by the authors. Licensee MDPI, Basel, Switzerland. This article is an open access article distributed under the terms and conditions of the Creative Commons Attribution (CC BY) license (https://creativecommons.org/licenses/by/4.0/).
Share and Cite
Sotnikov, D.V.; Barshevskaya, L.V.; Bartosh, A.V.; Zherdev, A.V.; Dzantiev, B.B. Double Competitive Immunodetection of Small Analyte: Realization for Highly Sensitive Lateral Flow Immunoassay of Chloramphenicol. Biosensors 2022, 12, 343. https://doi.org/10.3390/bios12050343
Sotnikov DV, Barshevskaya LV, Bartosh AV, Zherdev AV, Dzantiev BB. Double Competitive Immunodetection of Small Analyte: Realization for Highly Sensitive Lateral Flow Immunoassay of Chloramphenicol. Biosensors. 2022; 12(5):343. https://doi.org/10.3390/bios12050343
Chicago/Turabian StyleSotnikov, Dmitriy V., Lyubov V. Barshevskaya, Anastasia V. Bartosh, Anatoly V. Zherdev, and Boris B. Dzantiev. 2022. "Double Competitive Immunodetection of Small Analyte: Realization for Highly Sensitive Lateral Flow Immunoassay of Chloramphenicol" Biosensors 12, no. 5: 343. https://doi.org/10.3390/bios12050343