Microfluidic One-Pot Digital Droplet FISH Using LNA/DNA Molecular Beacons for Bacteria Detection and Absolute Quantification

 , , , , and
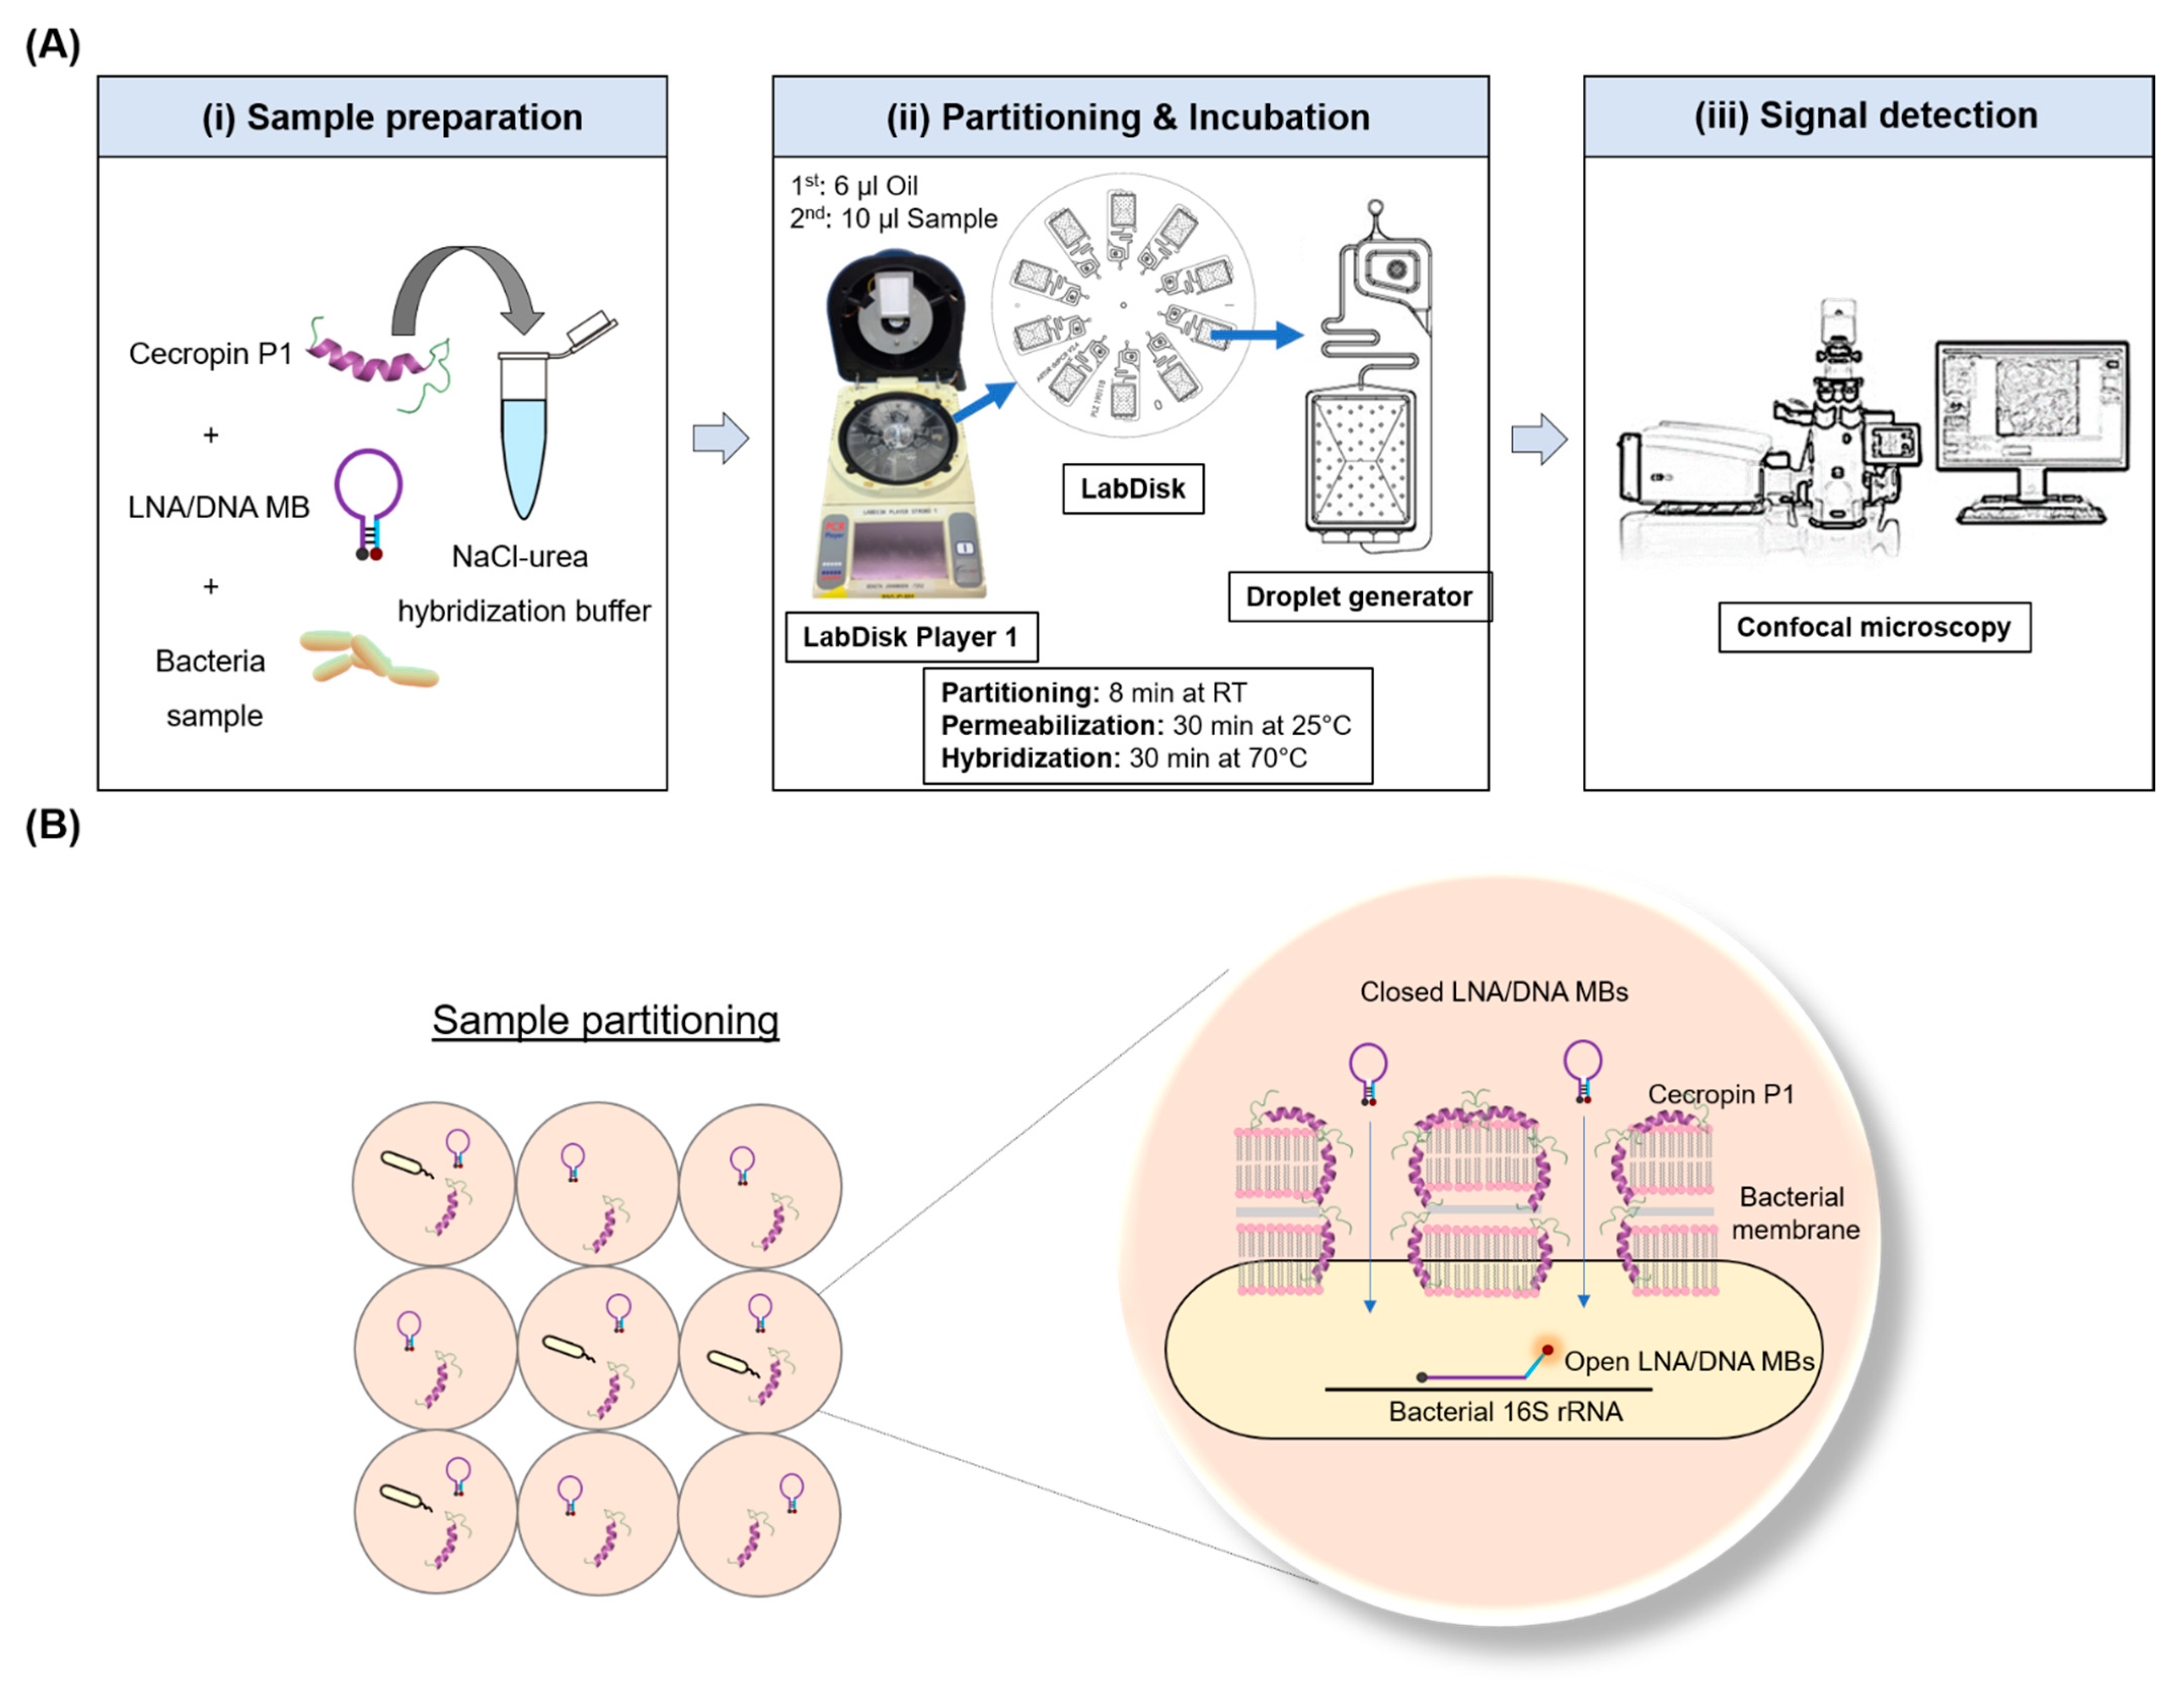
Abstract
:1. Introduction
2. Materials and Methods
2.1. Bacteria Cultivation
2.2. LNA/DNA MB Design
2.3. Microfluidic One-Pot Digital Droplet-FISH Workflow on a LabDisk
2.4. Detection of Single Bacteria in Droplets and Data Processing for Absolute Quantification
3. Results and Discussion
3.1. Microfluidic One-Pot Digital Droplet-FISH Assay
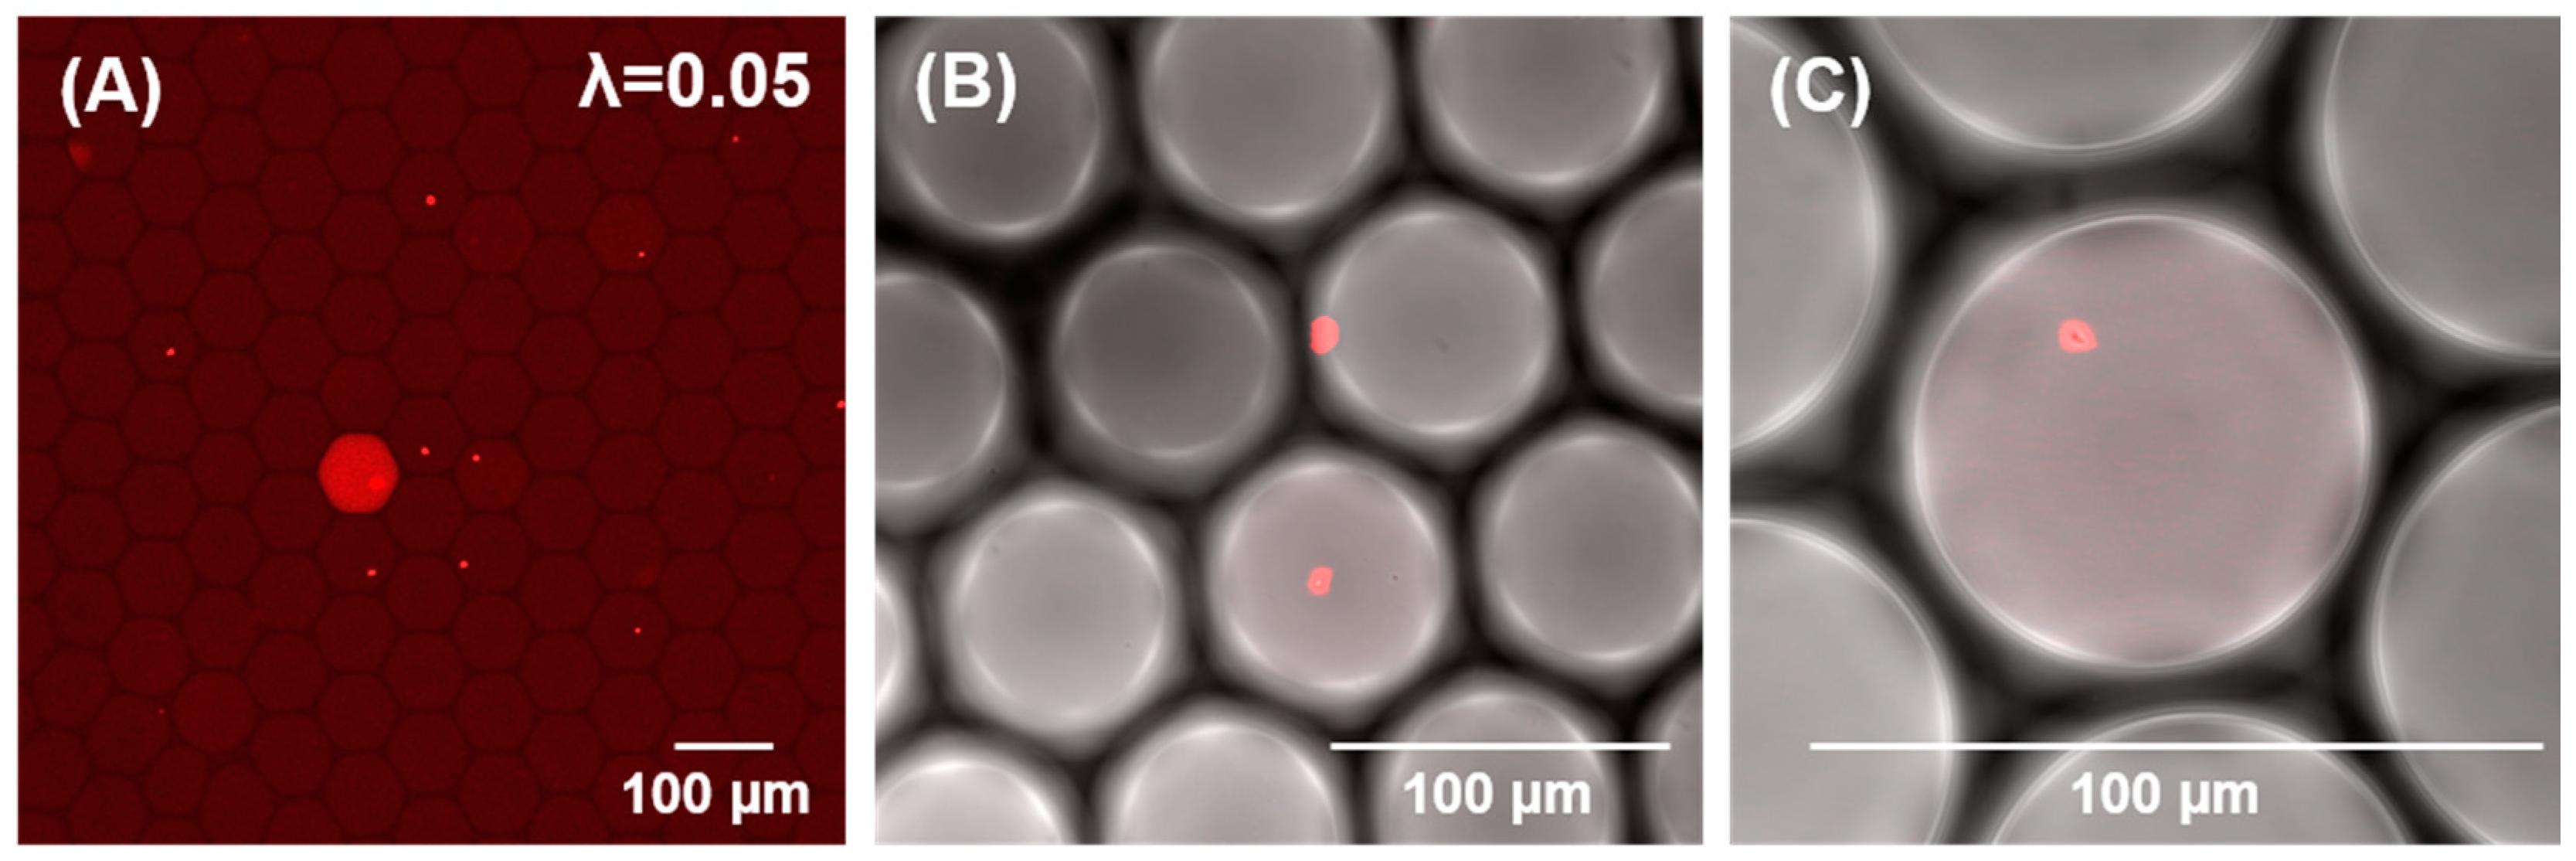
3.2. Microfluidic One-Pot Digital Droplet-FISH Assay for Bacteria Detection at the Single Cell Level
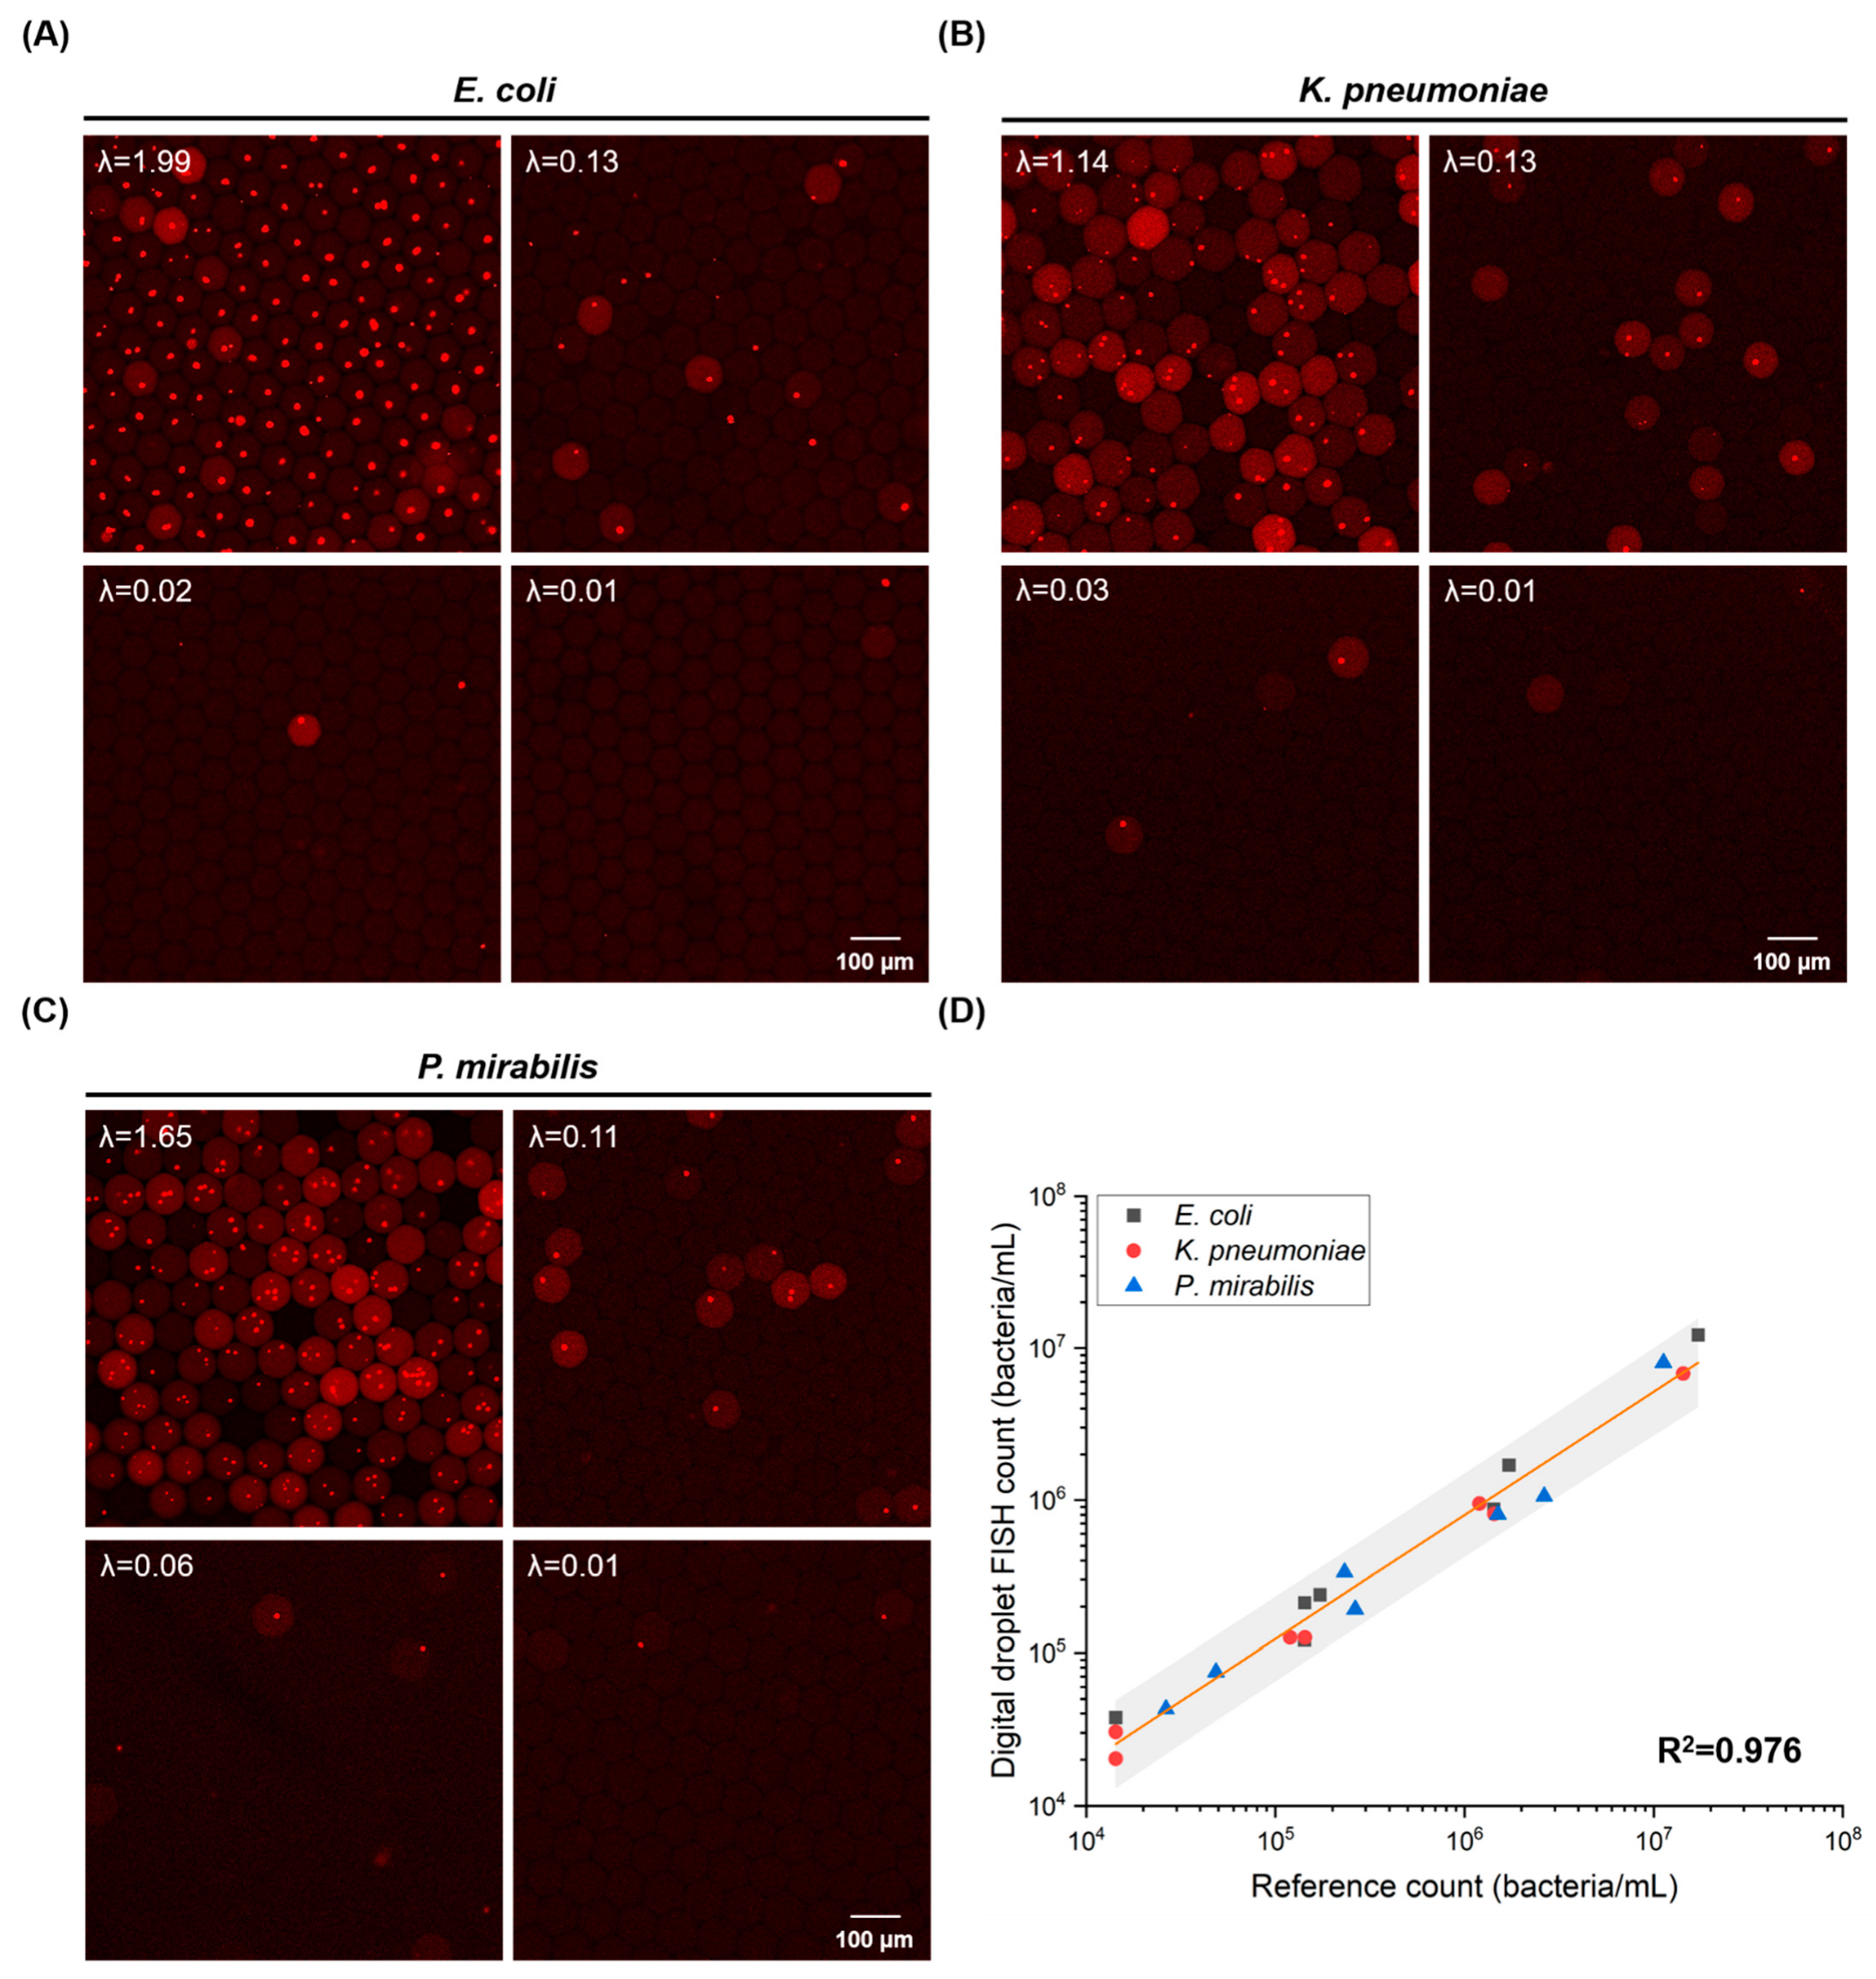
3.3. Absolute Quantification of Bacteria by Microfluidic One-Pot Digital Droplet-FISH Assay
4. Conclusions
Supplementary Materials
Author Contributions
Funding
Institutional Review Board Statement
Informed Consent Statement
Data Availability Statement
Acknowledgments
Conflicts of Interest
References
- Jorgensen, J.H.; Ferraro, M.J. Antimicrobial susceptibility testing: A review of general principles and contemporary practices. Clin. Infect. Dis. 2009, 49, 1749–1755. [Google Scholar] [CrossRef] [PubMed]
- Mara, D.D.; Horan, N.J. Handbook of Water and Wastewater Microbiology; Academic Press: Amsterdam, London, 2003; ISBN 0-12-470100-0. [Google Scholar]
- Gracias, K.S.; McKillip, J.L. A review of conventional detection and enumeration methods for pathogenic bacteria in food. Can. J. Microbiol. 2004, 50, 883–890. [Google Scholar] [CrossRef] [PubMed] [Green Version]
- Deshmukh, R.A.; Joshi, K.; Bhand, S.; Roy, U. Recent developments in detection and enumeration of waterborne bacteria: A retrospective minireview. Microbiologyopen 2016, 5, 901–922. [Google Scholar] [CrossRef] [Green Version]
- Miller, J.H. Experiments in Molecular Genetics; Cold Spring Harbor Laboratory Press: Cold Spring Harbor, NY, USA, 1972; ISBN 0879691069. [Google Scholar]
- Gilchrist, J.E.; Campbell, J.E.; Donnelly, C.B.; Peeler, J.T.; Delaney, J.M. Spiral plate method for bacterial determination. Appl. Microbiol. 1973, 25, 244–252. [Google Scholar] [CrossRef]
- Sohier, D.; Pavan, S.; Riou, A.; Combrisson, J.; Postollec, F. Evolution of microbiological analytical methods for dairy industry needs. Front. Microbiol. 2014, 5, 16. [Google Scholar] [CrossRef] [PubMed] [Green Version]
- Li, L.; Mendis, N.; Trigui, H.; Oliver, J.D.; Faucher, S.P. The importance of the viable but non-culturable state in human bacterial pathogens. Front. Microbiol. 2014, 5, 258. [Google Scholar] [CrossRef] [Green Version]
- Ramírez-Castillo, F.Y.; Loera-Muro, A.; Jacques, M.; Garneau, P.; Avelar-González, F.J.; Harel, J.; Guerrero-Barrera, A.L. Waterborne pathogens: Detection methods and challenges. Pathogens 2015, 4, 307–334. [Google Scholar] [CrossRef]
- Lyons, S.R.; Griffen, A.L.; Leys, E.J. Quantitative real-time PCR for Porphyromonas gingivalis and total bacteria. J. Clin. Microbiol. 2000, 38, 2362–2365. [Google Scholar] [CrossRef]
- Ilha, E.C.; Scariot, M.C.; Treml, D.; Pereira, T.P.; Sant′Anna, E.S.; Prudêncio, E.S.; Arisi, A.C.M. Comparison of real-time PCR assay and plate count for Lactobacillus paracasei enumeration in yoghurt. Ann. Microbiol 2016, 66, 597–606. [Google Scholar] [CrossRef]
- Oliveira, J.M.; Cunha, Â.S.; Almeida, A.P.; Castilho, F.B.; Pereira, M.J. Comparison of Methodologies for the Extraction of Bacterial DNA from Mussels—Relevance for Food Safety. Food Anal. Methods 2013, 6, 201–209. [Google Scholar] [CrossRef]
- Tian, W.; Zhang, Z.; Liu, D.; Zhou, T.; Shen, Q.; Shen, B. An optimized DNA extraction and purification method from dairy manure compost for genetic diversity analysis. World J. Microbiol. Biotechnol. 2013, 29, 815–823. [Google Scholar] [CrossRef] [PubMed]
- Maurer, J.J. Rapid detection and limitations of molecular techniques. Annu. Rev. Food Sci. Technol. 2011, 2, 259–279. [Google Scholar] [CrossRef] [PubMed] [Green Version]
- Theron, J.; Eugene Cloete, T.; Kwaadsteniet, M.d. Current molecular and emerging nanobiotechnology approaches for the detection of microbial pathogens. Crit. Rev. Microbiol. 2010, 36, 318–339. [Google Scholar] [CrossRef] [PubMed]
- Hartley, M.G.; Ralph, E.; Norville, I.H.; Prior, J.L.; Atkins, T.P. Comparison of PCR and viable count as a method for enumeration of bacteria in an A/J mouse aerosol model of Q fever. Front. Microbiol. 2019, 10, 1552. [Google Scholar] [CrossRef] [PubMed] [Green Version]
- Takahashi, H.; Saito, R.; Miya, S.; Tanaka, Y.; Miyamura, N.; Kuda, T.; Kimura, B. Development of quantitative real-time PCR for detection and enumeration of Enterobacteriaceae. Int. J. Food Microbiol. 2017, 246, 92–97. [Google Scholar] [CrossRef] [PubMed]
- Amann, R.I.; Binder, B.J.; Olson, R.J.; Chisholm, S.W.; Devereux, R.; Stahl, D.A. Combination of 16S rRNA-targeted oligonucleotide probes with flow cytometry for analyzing mixed microbial populations. Appl. Environ. Microbiol. 1990, 56, 1919–1925. [Google Scholar] [CrossRef] [Green Version]
- Amann, R.; Fuchs, B.M. Single-cell identification in microbial communities by improved fluorescence in situ hybridization techniques. Nat. Rev. Microbiol. 2008, 6, 339–348. [Google Scholar] [CrossRef]
- Rohde, A.; Hammerl, J.A.; Appel, B.; Dieckmann, R.; Al Dahouk, S. FISHing for bacteria in food--a promising tool for the reliable detection of pathogenic bacteria? Food Microbiol. 2015, 46, 395–407. [Google Scholar] [CrossRef] [Green Version]
- Muthukrishnan, T.; Govender, A.; Dobretsov, S.; Abed, R. Evaluating the reliability of counting bacteria using epifluorescence microscopy. JMSE 2017, 5, 4. [Google Scholar] [CrossRef] [Green Version]
- Cadena-Herrera, D.; Esparza-De Lara, J.E.; Ramírez-Ibañez, N.D.; López-Morales, C.A.; Pérez, N.O.; Flores-Ortiz, L.F.; Medina-Rivero, E. Validation of three viable-cell counting methods: Manual, semi-automated, and automated. Biotechnol. Rep. 2015, 7, 9–16. [Google Scholar] [CrossRef] [Green Version]
- Nunez, R. Flow cytometry: Principles and instrumentation. Curr. Issues Mol. Biol. 2001, 3, 39–45. [Google Scholar] [PubMed]
- Gasol, J.M.; Del Giorgio, P.A. Using flow cytometry for counting natural planktonic bacteria and understanding the structure of planktonic bacterial communities. Sci. Mar. 2000, 64, 197–224. [Google Scholar] [CrossRef] [Green Version]
- Hsieh, K.; Zec, H.C.; Chen, L.; Kaushik, A.M.; Mach, K.E.; Liao, J.C.; Wang, T.-H. Simple and precise counting of viable bacteria by resazurin-amplified picoarray detection. Anal. Chem. 2018, 90, 9449–9456. [Google Scholar] [CrossRef] [PubMed]
- Scheler, O.; Pacocha, N.; Debski, P.R.; Ruszczak, A.; Kaminski, T.S.; Garstecki, P. Optimized droplet digital CFU assay (ddCFU) provides precise quantification of bacteria over a dynamic range of 6 logs and beyond. Lab Chip 2017, 17, 1980–1987. [Google Scholar] [CrossRef] [Green Version]
- Cui, X.; Ren, L.; Shan, Y.; Wang, X.; Yang, Z.; Li, C.; Xu, J.; Ma, B. Smartphone-based rapid quantification of viable bacteria by single-cell microdroplet turbidity imaging. Analyst 2018, 143, 3309–3316. [Google Scholar] [CrossRef]
- Pacocha, N.; Scheler, O.; Nowak, M.M.; Derzsi, L.; Cichy, J.; Garstecki, P. Direct droplet digital PCR (dddPCR) for species specific, accurate and precise quantification of bacteria in mixed samples. Anal. Methods 2019, 11, 5730–5735. [Google Scholar] [CrossRef]
- Kao, Y.-T.; Kaminski, T.S.; Postek, W.; Guzowski, J.; Makuch, K.; Ruszczak, A.; von Stetten, F.; Zengerle, R.; Garstecki, P. Gravity-driven microfluidic assay for digital enumeration of bacteria and for antibiotic susceptibility testing. Lab Chip 2020, 20, 54–63. [Google Scholar] [CrossRef] [Green Version]
- Collins, D.J.; Neild, A.; deMello, A.; Liu, A.-Q.; Ai, Y. The Poisson distribution and beyond: Methods for microfluidic droplet production and single cell encapsulation. Lab Chip 2015, 15, 3439–3459. [Google Scholar] [CrossRef]
- Higgins, O.; Clancy, E.; Cormican, M.; Boo, T.W.; Cunney, R.; Smith, T.J. Evaluation of an Internally Controlled Multiplex Tth Endonuclease Cleavage Loop-Mediated Isothermal Amplification (TEC-LAMP) Assay for the Detection of Bacterial Meningitis Pathogens. Int. J. Mol. Sci. 2018, 19. [Google Scholar] [CrossRef] [Green Version]
- Zheng, J.; Yang, R.; Shi, M.; Wu, C.; Fang, X.; Li, Y.; Li, J.; Tan, W. Rationally designed molecular beacons for bioanalytical and biomedical applications. Chem. Soc. Rev. 2015, 44, 3036–3055. [Google Scholar] [CrossRef]
- Rane, T.D.; Zec, H.C.; Puleo, C.; Lee, A.P.; Wang, T.-H. Droplet microfluidics for amplification-free genetic detection of single cells. Lab Chip 2012, 12, 3341–3347. [Google Scholar] [CrossRef] [PubMed] [Green Version]
- Mach, K.E.; Kaushik, A.M.; Hsieh, K.; Wong, P.K.; Wang, T.-H.; Liao, J.C. Optimizing peptide nucleic acid probes for hybridization-based detection and identification of bacterial pathogens. Analyst 2019, 144, 1565–1574. [Google Scholar] [CrossRef] [PubMed]
- Bakhtiar, R. Peptide nucleic acids: Deoxyribonucleic acid mimics with a peptide backbone. Biochem. Educ. 1998, 26, 277–280. [Google Scholar] [CrossRef]
- Egholm, M.; Buchardt, O.; Christensen, L.; Behrens, C.; Freier, S.M.; Driver, D.A.; Berg, R.H.; Kim, S.K.; Norden, B.; Nielsen, P.E. PNA hybridizes to complementary oligonucleotides obeying the Watson-Crick hydrogen-bonding rules. Nature 1993, 365, 566–568. [Google Scholar] [CrossRef]
- Yang, C.J.; Wang, L.; Wu, Y.; Kim, Y.; Medley, C.D.; Lin, H.; Tan, W. Synthesis and investigation of deoxyribonucleic acid/locked nucleic acid chimeric molecular beacons. Nucleic Acids Res. 2007, 35, 4030–4041. [Google Scholar] [CrossRef] [PubMed] [Green Version]
- Braasch, D.A.; Corey, D.R. Locked nucleic acid (LNA): Fine-tuning the recognition of DNA and RNA. Chem. Biol. 2001, 8, 1–7. [Google Scholar] [CrossRef] [Green Version]
- Silverman, A.P.; Kool, E.T. Oligonucleotide Probes for RNA-Targeted Fluorescence In Situ Hybridization. In Advances in Clinical Chemistry; Makowski, G.S., Ed.; Elsevier/Academic Press: Amsterdam, The Netherlands, 2006; pp. 79–115. ISBN 9780123737038. [Google Scholar]
- Wang, L.; Yang, C.J.; Medley, C.D.; Benner, S.A.; Tan, W. Locked nucleic acid molecular beacons. J. Am. Chem. Soc. 2005, 127, 15664–15665. [Google Scholar] [CrossRef]
- Schlenker, F.; Kipf, E.; Borst, N.; Paust, N.; Zengerle, R.; von Stetten, F.; Juelg, P.; Hutzenlaub, T. Centrifugal microfluidic integration of 4-plex ddPCR demonstrated by the quantification of cancer-associated point mutations. Processes 2021, 9, 97. [Google Scholar] [CrossRef]
- Schuler, F.; Siber, C.; Hin, S.; Wadle, S.; Paust, N.; Zengerle, R.; von Stetten, F. Digital droplet LAMP as a microfluidic app on standard laboratory devices. Anal. Methods 2016, 8, 2750–2755. [Google Scholar] [CrossRef] [Green Version]
- Schindelin, J.; Arganda-Carreras, I.; Frise, E.; Kaynig, V.; Longair, M.; Pietzsch, T.; Preibisch, S.; Rueden, C.; Saalfeld, S.; Schmid, B.; et al. Fiji: An open-source platform for biological-image analysis. Nat. Methods 2012, 9, 676–682. [Google Scholar] [CrossRef] [Green Version]
- Stender, H.; Fiandaca, M.; Hyldig-Nielsen, J.J.; Coull, J. PNA for rapid microbiology. J. Microbiol. Methods 2002, 48, 1–17. [Google Scholar] [CrossRef]
- Basu, A.S. Digital Assays Part I: Partitioning statistics and digital PCR. SLAS Technol. 2017, 22, 369–386. [Google Scholar] [CrossRef] [PubMed] [Green Version]
- Terekhov, S.S.; Smirnov, I.V.; Stepanova, A.V.; Bobik, T.V.; Mokrushina, Y.A.; Ponomarenko, N.A.; Belogurov, A.A.; Rubtsova, M.P.; Kartseva, O.V.; Gomzikova, M.O.; et al. Microfluidic droplet platform for ultrahigh-throughput single-cell screening of biodiversity. Proc. Natl. Acad. Sci. USA 2017, 114, 2550–2555. [Google Scholar] [CrossRef] [Green Version]
- Brogden, K.A. Antimicrobial peptides: Pore formers or metabolic inhibitors in bacteria? Nat. Rev. Microbiol. 2005, 3, 238–250. [Google Scholar] [CrossRef]
- Arcidiacono, S.; Soares, J.W.; Meehan, A.M.; Marek, P.; Kirby, R. Membrane permeability and antimicrobial kinetics of cecropin P1 against Escherichia coli. J. Pept. Sci. 2009, 15, 398–403. [Google Scholar] [CrossRef] [PubMed]
- Li, J.; Koh, J.-J.; Liu, S.; Lakshminarayanan, R.; Verma, C.S.; Beuerman, R.W. Membrane active antimicrobial peptides: Translating mechanistic insights to design. Front. Neurosci. 2017, 11, 73. [Google Scholar] [CrossRef] [Green Version]
- Lockey, T.D.; Ourth, D.D. Formation of pores in Escherichia coli cell membranes by a cecropin isolated from hemolymph of Heliothis virescens larvae. Eur. J. Biochem. 1996, 236, 263–271. [Google Scholar] [CrossRef]
- Kalwarczyk, T.; Tabaka, M.; Holyst, R. Biologistics--diffusion coefficients for complete proteome of Escherichia coli. Bioinformatics 2012, 28, 2971–2978. [Google Scholar] [CrossRef] [PubMed]
- Lima, J.F.; Maia, P.; T Magalhães, B.; Cerqueira, L.; Azevedo, N.F. A comprehensive model for the diffusion and hybridization processes of nucleic acid probes in fluorescence in situ hybridization. Biotechnol. Bioeng. 2020, 117, 3212–3223. [Google Scholar] [CrossRef]
- Lyu, Y.; Fitriyanti, M.; Narsimhan, G. Nucleation and growth of pores in 1,2-Dimyristoyl-sn-glycero-3-phosphocholine (DMPC) / cholesterol bilayer by antimicrobial peptides melittin, its mutants and cecropin P1. Colloids Surf. B Biointerfaces 2019, 173, 121–127. [Google Scholar] [CrossRef]
- Zwirglmaier, K. Fluorescence in situ hybridisation (FISH)--the next generation. FEMS Microbiol. Lett. 2005, 246, 151–158. [Google Scholar] [CrossRef] [PubMed] [Green Version]
- Boman, H.G.; Agerberth, B.; Boman, A. Mechanisms of action on Escherichia coli of cecropin P1 and PR-39, two antibacterial peptides from pig intestine. Infect. Immun. 1993, 61, 2978–2984. [Google Scholar] [CrossRef] [PubMed] [Green Version]
- Ben-David, A.; Davidson, C.E. Estimation method for serial dilution experiments. J. Microbiol. Methods 2014, 107, 214–221. [Google Scholar] [CrossRef] [PubMed] [Green Version]
- Kreutz, J.E.; Munson, T.; Huynh, T.; Shen, F.; Du, W.; Ismagilov, R.F. Theoretical design and analysis of multivolume digital assays with wide dynamic range validated experimentally with microfluidic digital PCR. Anal. Chem. 2011, 83, 8158–8168. [Google Scholar] [CrossRef] [PubMed] [Green Version]
- Schuler, F.; Trotter, M.; Geltman, M.; Schwemmer, F.; Wadle, S.; Domínguez-Garrido, E.; López, M.; Cervera-Acedo, C.; Santibáñez, P.; von Stetten, F.; et al. Digital droplet PCR on disk. Lab Chip 2016, 16, 208–216. [Google Scholar] [CrossRef] [PubMed] [Green Version]
- Schulz, M.; Ruediger, J.; Landmann, E.; Bakheit, M.; Frischmann, S.; Rassler, D.; Homann, A.R.; von Stetten, F.; Zengerle, R.; Paust, N. High dynamic range digital assay enabled by dual-volume centrifugal step emulsification. Anal. Chem. 2021, 93, 2854–2860. [Google Scholar] [CrossRef] [PubMed]
- Debski, P.R.; Gewartowski, K.; Sulima, M.; Kaminski, T.S.; Garstecki, P. Rational design of digital assays. Anal. Chem. 2015, 87, 8203–8209. [Google Scholar] [CrossRef]
- Todd, E.C.; Szabo, R.A.; Peterkin, P.; Sharpe, A.N.; Parrington, L.; Bundle, D.; Gidney, M.A.; Perry, M.B. Rapid hydrophobic grid membrane filter-enzyme-labeled antibody procedure for identification and enumeration of Escherichia coli O157 in foods. Appl. Environ. Microbiol. 1988, 54, 2536–2540. [Google Scholar] [CrossRef] [Green Version]
- Lin, X.; Huang, X.; Zhu, Y.; Urmann, K.; Xie, X.; Hoffmann, M.R. Asymmetric membrane for digital detection of single bacteria in milliliters of complex water samples. ACS Nano 2018, 12, 10281–10290. [Google Scholar] [CrossRef]
- Parsley, L.C.; Newman, M.M.; Liles, M.R. Fluorescence in situ hybridization of bacterial cell suspensions. Cold Spring Harb. Protoc. 2010, 2010. [Google Scholar] [CrossRef]
- Sami, M.A.; Tayyab, M.; Parikh, P.; Govindaraju, H.; Hassan, U. A modular microscopic smartphone attachment for imaging and quantification of multiple fluorescent probes using machine learning. Analyst 2021, 146, 2531–2541. [Google Scholar] [CrossRef] [PubMed]
- Zhu, Z. Design, Synthesis, Purification, and Characterization of Molecular Beacons. In Molecular Beacons; Yang, C.J., Ed.; Springer: Berlin/Heidelberg, Germany, 2013; pp. 1–17. [Google Scholar]
- Tsourkas, A.; Behlke, M.A.; Rose, S.D.; Bao, G. Hybridization kinetics and thermodynamics of molecular beacons. Nucleic Acids Res. 2003, 31, 1319–1330. [Google Scholar] [CrossRef] [PubMed] [Green Version]
- Lehnert, M.; Kipf, E.; Schlenker, F.; Borst, N.; Zengerle, R.; von Stetten, F. Fluorescence signal-to-noise optimisation for real-time PCR using universal reporter oligonucleotides. Anal. Methods 2018, 10, 3444–3454. [Google Scholar] [CrossRef] [Green Version]
- Sinigaglia, C.; Thiel, D.; Hejnol, A.; Houliston, E.; Leclère, L. A safer, urea-based in situ hybridization method improves detection of gene expression in diverse animal species. Dev. Biol. 2018, 434, 15–23. [Google Scholar] [CrossRef]
- Lawson, T.S.; Connally, R.E.; Vemulpad, S.; Piper, J.A. Dimethyl formamide-free, urea-NaCl fluorescence in situ hybridization assay for Staphylococcus aureus. Lett. Appl. Microbiol. 2012, 54, 263–266. [Google Scholar] [CrossRef] [PubMed]
- Huang, Q.; Liu, Z.; Liao, Y.; Chen, X.; Zhang, Y.; Li, Q. Multiplex fluorescence melting curve analysis for mutation detection with dual-labeled, self-quenched probes. PLoS ONE 2011, 6, e19206. [Google Scholar] [CrossRef]
- Klappenbach, J.A.; Saxman, P.R.; Cole, J.R.; Schmidt, T.M. rrndb: The Ribosomal RNA Operon Copy Number Database. Nucleic Acids Res. 2001, 29, 181–184. [Google Scholar] [CrossRef] [Green Version]
- Větrovský, T.; Baldrian, P. The variability of the 16S rRNA gene in bacterial genomes and its consequences for bacterial community analyses. PLoS ONE 2013, 8, e57923. [Google Scholar] [CrossRef] [Green Version]
- Zhang, B.; Maimaiti, Y.; Liu, C.; Li, J.; Wang, H.; Lin, H.; Deng, Z.; Lu, X.; Zhang, X. Direct detection of Staphylococcus aureus in positive blood cultures through molecular beacon-based fluorescence in situ hybridization. J. Microbiol. Methods 2019, 159, 34–41. [Google Scholar] [CrossRef]
- Silahtaroglu, A.N.; Tommerup, N.; Vissing, H. FISHing with locked nucleic acids (LNA): Evaluation of different LNA/DNA mixmers. Mol. Cell. Probes 2003, 17, 165–169. [Google Scholar] [CrossRef]


Publisher’s Note: MDPI stays neutral with regard to jurisdictional claims in published maps and institutional affiliations. |
© 2022 by the authors. Licensee MDPI, Basel, Switzerland. This article is an open access article distributed under the terms and conditions of the Creative Commons Attribution (CC BY) license (https://creativecommons.org/licenses/by/4.0/).
Share and Cite
Kao, Y.-T.; Calabrese, S.; Borst, N.; Lehnert, M.; Lai, Y.-K.; Schlenker, F.; Juelg, P.; Zengerle, R.; Garstecki, P.; von Stetten, F. Microfluidic One-Pot Digital Droplet FISH Using LNA/DNA Molecular Beacons for Bacteria Detection and Absolute Quantification. Biosensors 2022, 12, 237. https://doi.org/10.3390/bios12040237
Kao Y-T, Calabrese S, Borst N, Lehnert M, Lai Y-K, Schlenker F, Juelg P, Zengerle R, Garstecki P, von Stetten F. Microfluidic One-Pot Digital Droplet FISH Using LNA/DNA Molecular Beacons for Bacteria Detection and Absolute Quantification. Biosensors. 2022; 12(4):237. https://doi.org/10.3390/bios12040237
Chicago/Turabian StyleKao, Yu-Ting, Silvia Calabrese, Nadine Borst, Michael Lehnert, Yu-Kai Lai, Franziska Schlenker, Peter Juelg, Roland Zengerle, Piotr Garstecki, and Felix von Stetten. 2022. "Microfluidic One-Pot Digital Droplet FISH Using LNA/DNA Molecular Beacons for Bacteria Detection and Absolute Quantification" Biosensors 12, no. 4: 237. https://doi.org/10.3390/bios12040237