Article

Au Nanoparticles (NPs) Decorated Co Doped ZnO Semiconductor (Co400-ZnO/Au) Nanocomposites for Novel SERS Substrates

The Education Ministry Key Lab of Resource Chemistry and Shanghai Frontiers Science Center of Biomimetic Catalysis, Shanghai Normal University, Shanghai 200234, China
*
Authors to whom correspondence should be addressed.
These authors contributed equally to this work.
Biosensors 2022, 12(12), 1148; https://doi.org/10.3390/bios12121148
Submission received: 7 November 2022 / Revised: 30 November 2022 / Accepted: 1 December 2022 / Published: 8 December 2022
(This article belongs to the Topic Advances in Optical Sensors)

Abstract

:
Au nanoparticles were decorated on the surface of Co-doped ZnO with a certain ratio of Co2+/Co3+ to obtain a novel semiconductor-metal composite. The optimal substrate, designated as Co400-ZnO/Au, is beneficial to the promotion of separation efficiency of electron and hole in a semiconductor excited under visible laser exposure, which the enhances localized surface plasmon resonance (LSPR) of the Au nanoparticles. As an interesting finding, during Co doping, quantum dots of ZnO are generated, which strengthen the strong semiconductor metal interaction (SSSMI) effect. Eventually, the synergistic effect effectively advances the surface enhancement Raman scattering (SERS) performance of Co400-ZnO/Au composite. The enhancement mechanism is addressed in-depth by morphologic characterization, UV-visible, X-ray diffraction, photoluminescence, X-ray photoelectron spectroscopy, density functional theory, and finite difference time domain (FDTD) simulations. By using Co400-ZnO/Au, SERS detection of Rhodamine 6G presents a limit of detection (LOD) of 1 × 10⁻⁹ M. As a real application, the Co400-ZnO/Au-based SERS method is utilized to inspect tyramine in beer and the detectable concentration of 1 × 10⁻⁸ M is achieved. In this work, the doping strategy is expected to realize a quantum effect, triggering a SSSMI effect for developing promising SERS substrates in future.

1. Introduction

The surface-enhanced Raman scattering (SERS) technique has superior sensitivity and affords the molecular fingerprint information of a target sample adsorbed or approaching on the surfaces of noble nanostructures (Ag, Au, and Cu), which has been widely explored in the fields of biological, pharmaceutical, contaminant, and toxin detections [1,2]. Two acceptable dominant enhancement mechanisms are the charge transfer (CT) process [3,4] and the localized surface plasmon resonance (LSPR) field, which is connection with incident laser lines [5,6]. In the literature, the greatest enhancement factor that has been reported is 1014, due to specific molecules located within the gaps of neighbor Ag nanoparticles, namely LSPR hot spots [7]. Nevertheless, metallic nanoparticles expose some shortcomings such as instability, expensive cost, and limited excitation wavelength [8].
As an alternative, more attention has been focused on the possibility of semiconductor materials as SERS substrates, owing to their chemical and mechanical stabilities, such as being less-poisonousness, having high photo-efficiency, and better resistance to the environment [9]. However, most semiconductors with nanostructures only contribute an enhancement factor for Raman scattering below 105 [10,11]. For further improving the SERS feature of semiconductors, morphology optimization, element doping, and the composites with noble metals were investigated [12,13,14,15,16]. Amongst these, the metal and semiconductor composites exhibit the best merits because of the strong semiconductor metal interaction (SSMI) effect. Therefore, further systematical exploration of enhancement mechanisms for composites is important to design a promising SERS substrate for actual detection.
In this work, considering the similar ionic radius between Co2+ and Zn2+ ions, Co element with an optimized ratio of Co2+/Co3+ was doped in ZnO (designated as Co-ZnO), which achieved broad adsorption of the visible spectrum based on the Dopant effect [17,18]. Interestingly, when Co was doped into ZnO, quantum dots of ZnO were generated. After gold nanoparticles (Au NPs) were decorated on the surface of Co-ZnO (designated as Co-ZnO/Au), the composite showed strengthened a strong semiconductor and metal interaction (SSSMI) effect. Additionally, electron immigration increased in the interface of the metal and semiconductor, which resulted in remarkable enhancement of the LSPR effect over the whole composite. Density functional theory (DFT) and finite difference time domain (FDTD) simulations were conducted to understand the quantum-effect-advanced synergistic enhancement principle. As a real application case, by using optimal Co-ZnO/Au substrate, SERS detection of tyramine (Tyr), a kind of bioamines produced in the food-digestion process, was performed. It exhibited high detection sensitivities, with the limit of detection being around 1 × 10⁻⁸ mol/L.

2. Experimental Section

2.1. Reagents and Materials

Sodium hydroxide (NaOH), cobalt(II) acetate (C4H6CoO4), ammonium bicarbonate (NH4HCO3), tyramine (≥98%), and ZnNO3·6H2O were purchased from Sigma-Aldrich (St. Louis, MO, USA). Chloroauric acid (HAuCl4·4H2O) was bought from Sinopharm Chemical Reagent (Shanghai, China). Rhodamine 6G (R6G) was obtained from Adamas Reagent (Shanghai, China). All chemicals and reagents were of analytical grade. Ultrapure water (18.2 MΩ cm) was used throughout all experiments. Glassware was embathed in aqua regia and then thoroughly rinsed with ultrapure water. Canned beer (Tsingtao, Qingdao, China) was obtained from a supermarket.

2.2. Synthesis of ZnO/Au

First, 0.2 g zinc acetate was dispersed in 70 mL ultrapure water by ultrasonic wave for 30 min. A total of 10 mL of NaOH solution (2 mol/L) was added to the zinc acetate solution under constant agitation. The above solution was transferred to a reaction kettle and then put into an oven for the reaction (160 °C, 20 h). After natural cooling to room temperature, the sample was washed several times with ultrapure water to remove residual ions and molecules, and dried under a 70° vacuum. About 0.015 g of ZnO was dissolved in 25 mL of ultrapure water and heated to boiling under stirring. Finally, 1 mL of 10−3 M HAuCl4 solution was injected for 30 min under agitation until the solution turned purplish-red to obtain ZnO/Au.

2.3. Synthesis of Co-ZnO

Co-doped ZnO was synthesized as follows: following standard procedure, ZnNO3·6H2O (0.40 g) and C4H6CoO4 with different amounts including 0, 40, 120, 200, 280, 400, 480, and 600 mg were dissolved in 10 mL ultrapure water at room temperature. After 8 mL NaOH (0.5 mol L−1) was added, the suspension was stirred for 40 min, after which 2.4 g NH4HCO3 was added and stirred until it completely dissolved. The suspension was then dried at 60 °C for 10 h. The product was calcined in a corundum crucible with a cover at 500 °C for 2 h, followed by rapid cooling to room temperature to yield the Co-ZnO product. The obtained products were, respectively, marked as Co40-ZnO, Co120-ZnO, Co200-ZnO, Co280-ZnO, Co400-ZnO, Co480-ZnO, and Co600-ZnO.

2.4. Synthesis of Co400-ZnO/Au

A total of 0. 02 g of Co400-ZnO was dispersed in 25 mL ultrapure water, and heated to a boiling while constantly stirring. Then, 5 mL of 5% HAuCl4 solution was injected under stirring for 30 min until the solution turned brown-red to obtain Co400-ZnO/Au successfully. After cooling to room temperature naturally, Co400-ZnO/Au was washed with ultrapure water several times to remove residual ions and molecules, and dried at 70 °C under vacuum.

2.5. SERS Measurement

For SERS detection, the analyte solution was mixed with Co400-ZnO/Au nanocomposite suspension by a volume ratio of 1:2. Raman test was conducted by using 633 nm laser with power at 5 mW and a collection time of 3 s with 2 accumulations.

2.6. Instrumentation

UV-vis spectra were collected by a UV-vis spectrophotometer (SHIMADZU, UV-1800, Kyoto, Japan). The morphologies of SERS substrates were taken by a JEM-2100EXII transmission electron microscope (JEOL Co., Ltd., Tokyo, Japan), operating at 200 kV. The high-angle annular dark-field scanning transmission electron microscopy (HAADF-STEM) images and elemental mapping of SERS substrates were acquired on a Tecnai G2 S-Twin F20 field-emission transmission electron microscope (FEI, Hillsboro, OR, USA). X-ray photoelectron spectroscopy (XPS) (model PHI 5000, Versa Probe, NEC Corporation, Tokyo, Japan) was performed to identify the chemical composition of Co-ZnO/Au. X-ray diffraction (XRD) analysis was conducted on D/Max-2000 VPC (RIGAKU, Tokyo, Japan). Raman experiment was performed by using a confocal laser Raman system (Super LabRamII, Jobin Yvon, Longjumeau, France). HPLC-MS results were collected by a Q EXACTIVE PLUS HPLC-MS spectrometer (Thermo Scientific, Waltham, MA, USA).

2.7. Calculation Methods

The density of states (DOS) of ZnO and Co-doped ZnO were calculated by first-principle calculation based on density functional theory (DFT). The pseudopotentials and the starting DFT calculation were performed based on the Perdew–Burke–Ernzerhof (PBE) exchange-correlation functional. The plane-wave cutoff energy was set to 340 eV, and the Monkhorst-Pack method with a k-points mesh of 4 × 4 × 2 was used to sample the Brillouin-zone.
The electric field strengths of ZnO, Co400-ZnO, and Co-ZnO/Au were calculated by using a finite difference time domain (FDTD) method. The grid precision for FDTD simulation was 2 nm in the X, Y, and Z directions, and the time step was set at 200 fs. Periodic boundary conditions were applied in both the X and Y directions, while perfect matching layer boundary conditions in the Z direction were conducted. The plane-wave source propagated along the z-axis at incident wavelengths including 532, 633, and 785 nm on the nanoparticles.

3. Results and Discussion

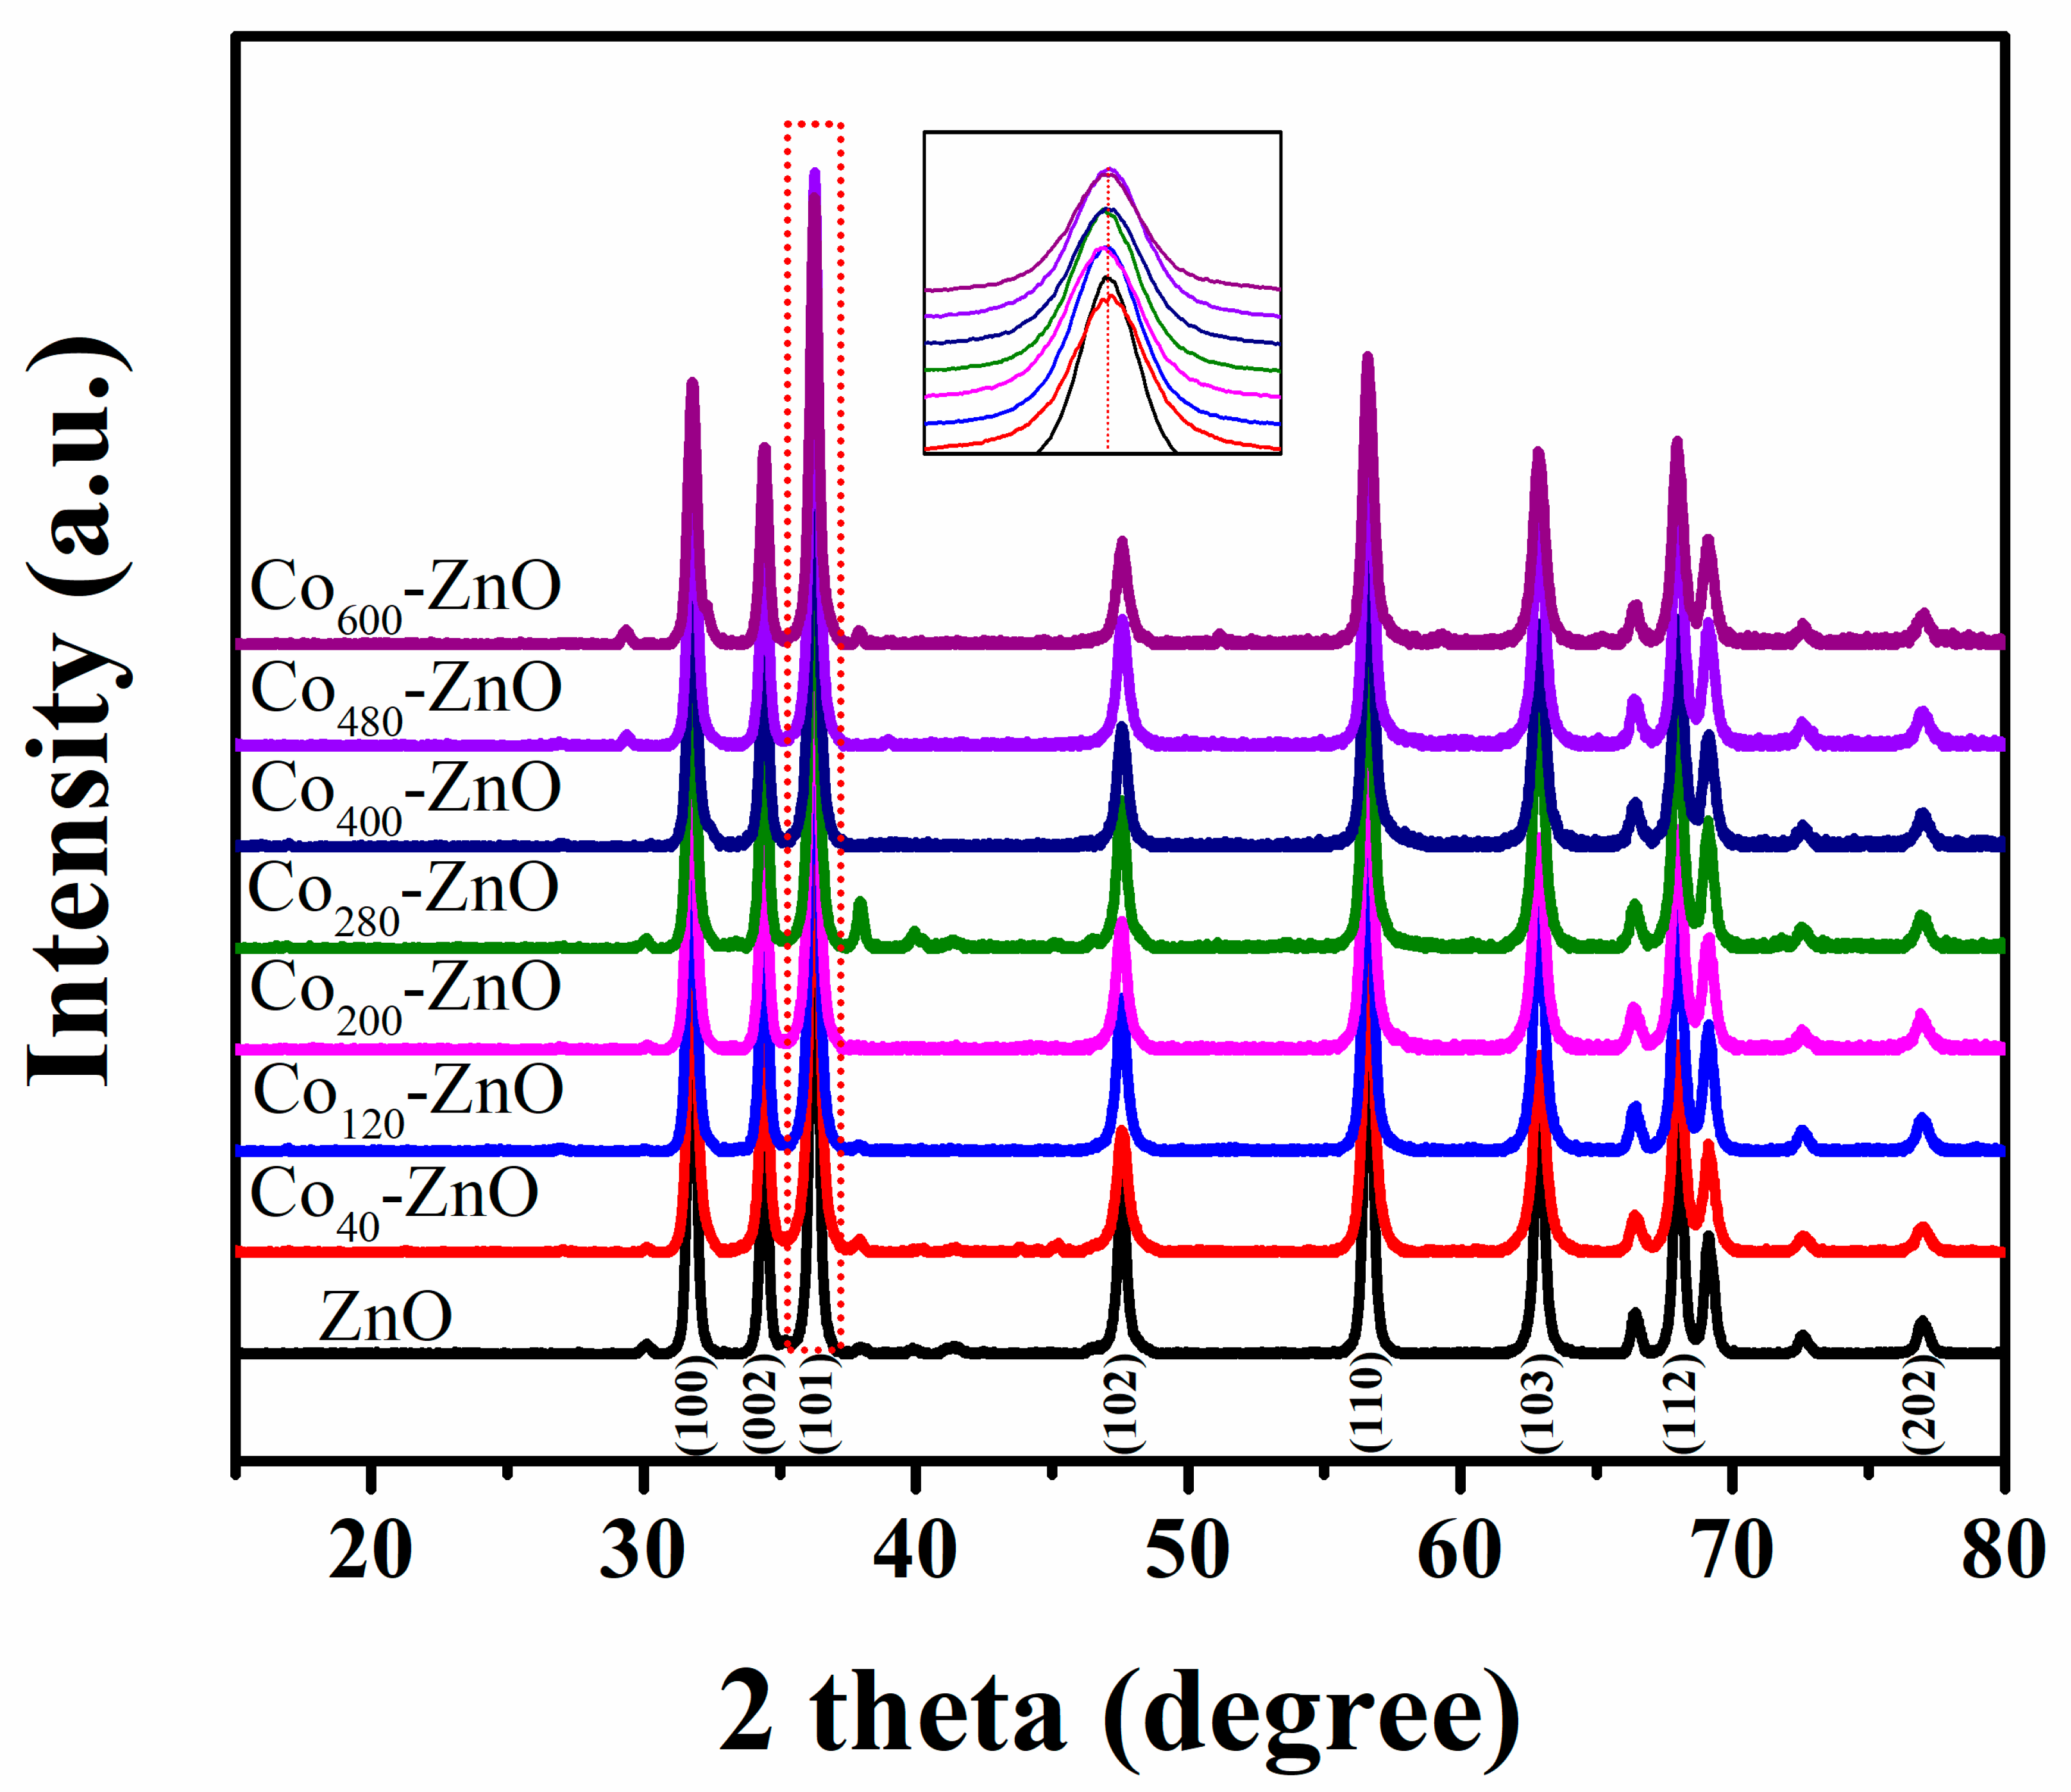
3.1. Characterization of Co-ZnO

The ionic radius of Co2+ (0.72 Å) is similar to that of Zn2+ (0.74 Å). Therefore, Co element can be easily doped into a ZnO lattice to substitute the position of Zn2+ ions, which avoids lattice mismatch to an extent [19,20]. In addition, the rich electronic states of Co element benefit the optimization of the magnetic, electrical, and optical properties of ZnO [21]. Consequently, the elevated impurity level caused by Co dopant shortens the energy gap of ZnO and simultaneously improves the charge-carrier separation due to creating many electron traps [22]. Herein, first, we tuned the amount of Co element in ZnO to improve SERS performance of the resultant composite. As depicted in Figure S1 of Supplementary Material, with an increasing amount of Co dopant, the color of composite ZnO materials changes from white to dark greenish. This is due to the high spin state Co2+ 3d7 (4F) involving d–d transition for oxygen coordination in tetrahedral symmetry [23,24]. In Figure 1, the XRD patterns of different Co-ZnO substrates display their wurtzite structures in good agreement with the JCPDS 36-1451. There being no obvious change in diffraction peaks of Co-ZnO substrates indicates that the amorphous Co oxides have a slight effect on the crystal structure of ZnO [25]. Clearly, in Figure S2 and Table S1, the crystallite size (D), micro strain (ε), and dislocation density (ρ) of Co doping inhibiting crystallite growth of ZnO results in a size decrease in Co-ZnO composite, which shows a connection between their differences in ionic radii and valence states [26,27]. The small size of Co-ZnO increases the surface area and boundaries, which accelerates the carrier mobility [28,29]. Additionally, elevating the amount of Co doped in ZnO initially increases the strain, resulting in alteration of the lattice constant of the composite, which is proven by the visualization of the broadened XRD peaks and slight position shifts [30,31].
XPS analysis was performed to investigate the elemental composition and chemical state. In the survey spectrum of ZnO (Figure S3), two significant peaks, centered at 1021.18 and 1044.08 eV, are attributed to the binding energies of core-level Zn 2p3/2 and Zn 2p1/2, respectively. The fitted O 1s spectrum in the ZnO matrix resolves into both peaks at 530.28 and 531.28 eV, which are, respectively, ascribed to O2- ions associated with Zn2+ ions and O2− ions in oxygen-deficient regions [32]. Obviously, in Figure S4 and Tables S2 and S3, for Co400-ZnO, after Co doping, the binding energy position and intensity changes in Zn2+ and O arise from the alternation of electron density around Zn2+ [33,34].
UV-vis diffuse absorption spectra provided the evidence for the substitution of Co in the ZnO lattice. In Figure S5, ZnO, when alone, showed an adsorption band at 392 nm. In the case of Co-ZnO, the red shift of the band edge (marked with the arrow in Figure S6) indicates the decrease in band gap energy [35]. Detailed information involving the band gap (Eg) was estimated by Tauc formula, [36] and the optical absorption edge (nm) of pure ZnO and Co-ZnO samples is tabulated in Table S4. Co400-ZnO presents the highest absorption edge at 479 nm and the broadest visible absorption region, which peaked at 567, 612, and 654 nm, corresponding to the d–d transitions of the Co ions, [18] showing that visible light excitation in the solar spectrum could generate more electron–hole pairs within Co400-ZnO [37,38].
In Figure S7 and Table S4, compared with ZnO, the CT process between d electrons of the Co element and the conduction band (CB) or valence band (VB) of ZnO decreases the band gap for Co-ZnO composites, and Co400-ZnO has the lowest band gap. The diagram of VB-XPS spectra for the band structure evolution of Co-doped ZnO samples are given in Figures S8 and S9. The ease degree of electrons jumping from the VB to the CB is closely dependent on the band gap width [39,40]. In Figure S10, the corresponding calculated density of states (DOS) is consistent with the experiment results. The VB width of Co-ZnO is slightly increased compared to ZnO alone, implying mobility enhancement of the hole. Identically, the broadened CB also suggests the accelerating electron mobility [41,42].
Photoluminescence (PL), as a direct method for estimating the recombination rate of photo generated charge pairs in the crystal structure, is related to lattice defects and surface states [43]. High intensity in the PL signal indicates a rapid recombination rate of charge carriers, resulting in poor SERS performance [44]. The PL emission spectra of the samples were recorded by using an excitation wavelength of 233 nm. In Figure S11, comparably, the lowest PL signal from Co400-ZnO samples can be attributed to the coexistence of Co3+ and Co2+, with the ratio of 0.9578 greatly inhibiting the recombination between electron–hole pairs.
The chemical structure of the Co-ZnO composites was also studied by the Fourier transform infrared (FTIR) method. In Figure S12, for pristine ZnO, the FTIR bands at 1438, 1649, and 3450 cm−1 belong to -OH deforming, O-H stretching, and -OH stretching, respectively [45]. After Co-doping, the FTIR bands regarding ZnO vibrations shift to a low wavenumber because of a partial electron transfer between ZnO and Co [46]. One of the possible principles is that defects produced in ZnO by introducing Co could act as electron traps and become an intermediate state of electron transfer bridge [47,48], which would improve photon-induced charge transfer (CT) and the photo-generated charge carrier separation efficiency.
The Raman spectra of R6G (10−6 M) on Co-ZnO/Au substrates in Figure S13 indicate that the resultant optimal Co400-ZnO could greatly improve the separation efficiency of electron and hole under visible light excitation. Furthermore, the Co400-ZnO/Au composite, as the SERS substrate, exhibits a long-term stability and remarkable detection sensitivity.
The photon-induced charge-transfer mechanism of Co-ZnO is shown in Figure S14A. Obviously, for ZnO alone, the visible light hardly excites the electrons from the VB to CB because of the large band gap between the highest occupied molecular orbital (HOMO) and the lowest unoccupied molecular orbital (LUMO) level of the target molecules. In the case of Co-ZnO, the narrowed band gaps would benefit electronic transitions from the VB of ZnO to the surface state energy level (Ess) [49,50], and the electrons would then be injected into the LUMO of the adsorbed molecules.
A conceivable energy level diagram with the carrier transfer mechanism is displayed in Figure S14B. The Co2+ ion is unstable owing to easy loss of d7 electronic configuration to Co3+ (d7). In detail, Co2+ tends to transform electrons to the surface absorbed oxygen (Equation (2)) [51] and, simultaneously, to the formation of superoxide (⋅O2). The Co3+ tends to convert to Co2+ (Equation (3)) by capturing the photo-induced electrons. In the case of a low amount of Co dopant, the occurrence of Co2+ ions as electron traps enhances the separation of electron and hole. However, at a higher concentration of Co dopant, with the ratio of Co2+/Co3+ decreasing, the availability of electron traps descends due to excessive Co3+ ions with vacancies as novel centers, facilitating the recombination of electrons and holes.
ZnO + hv → e − CB + h+ VB
Co2+ + O2 → Co3+ + ⋅O2
Co3+ + e − CB → Co2+
In all, the due ratio of Co2+/Co3+ in Co400-ZnO composite correspondingly resulted in the smallest grain size, the narrowest band gap, the lowest PL intensities, and superior light absorption capability. As mentioned above, the CT mechanism of Co400-ZnO composite is the dominant contribution to the following superior Raman enhancement of target molecules. Therefore, Co400-ZnO was chosen to prepare Co400-ZnO/Au as the next SERS substrate.

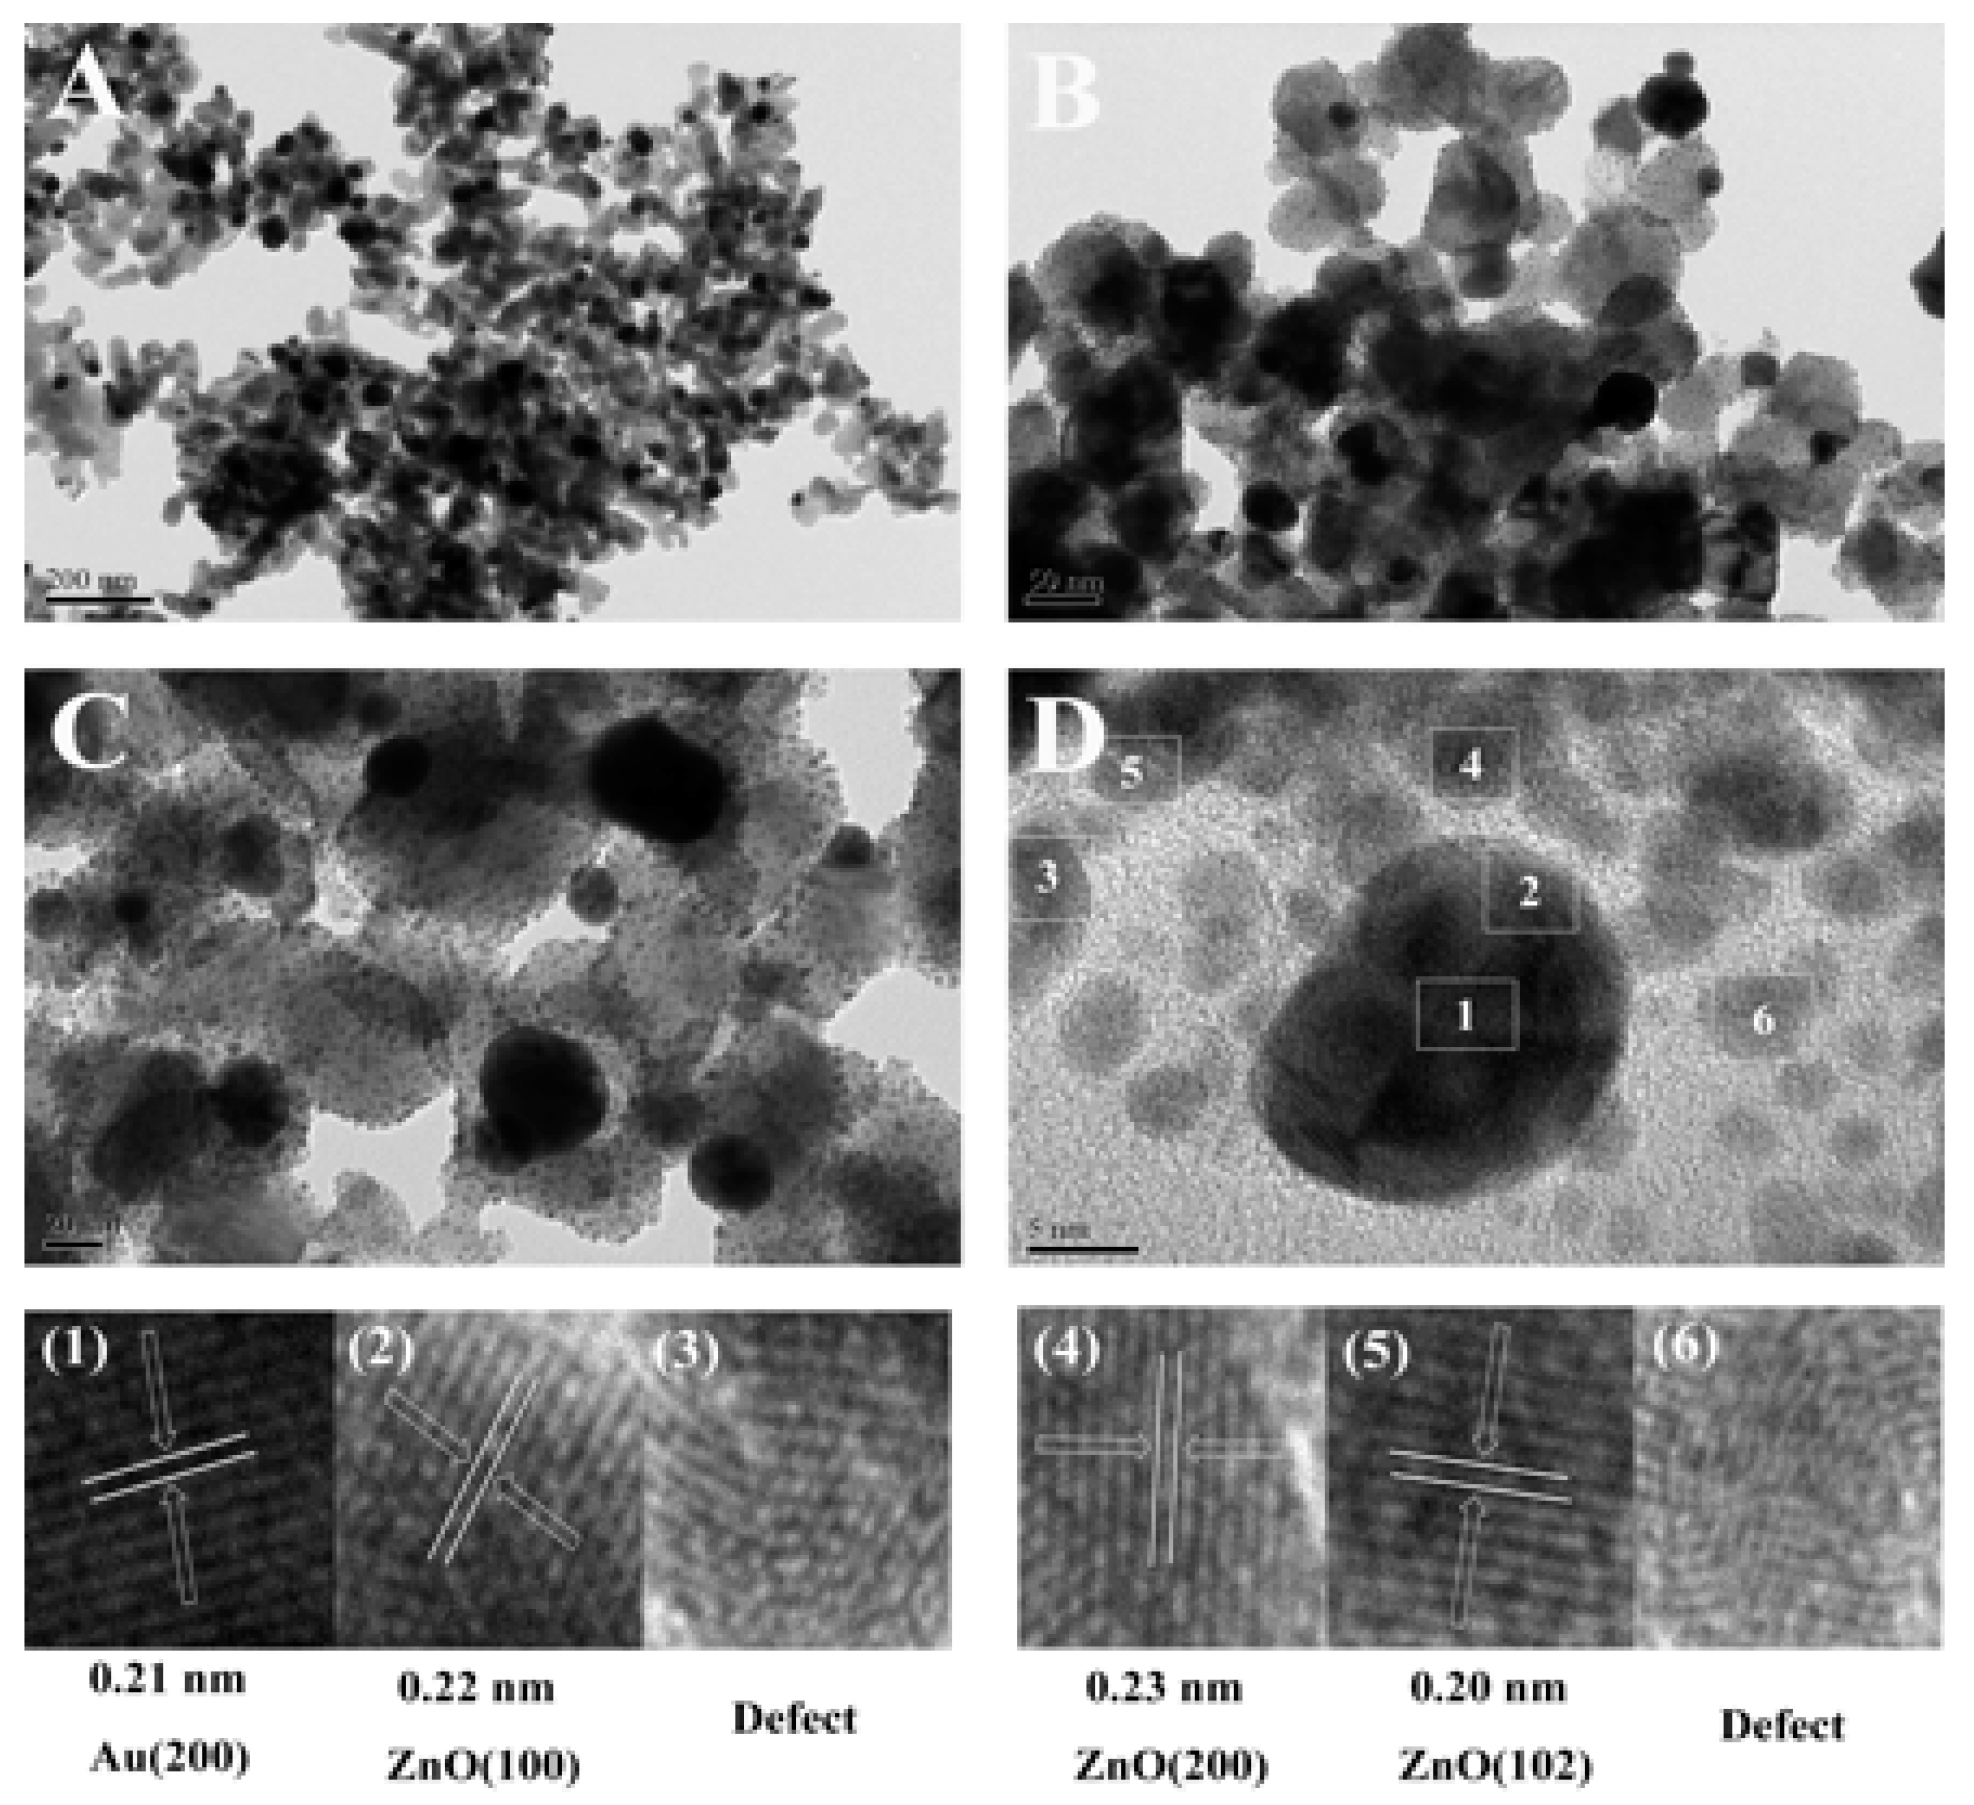
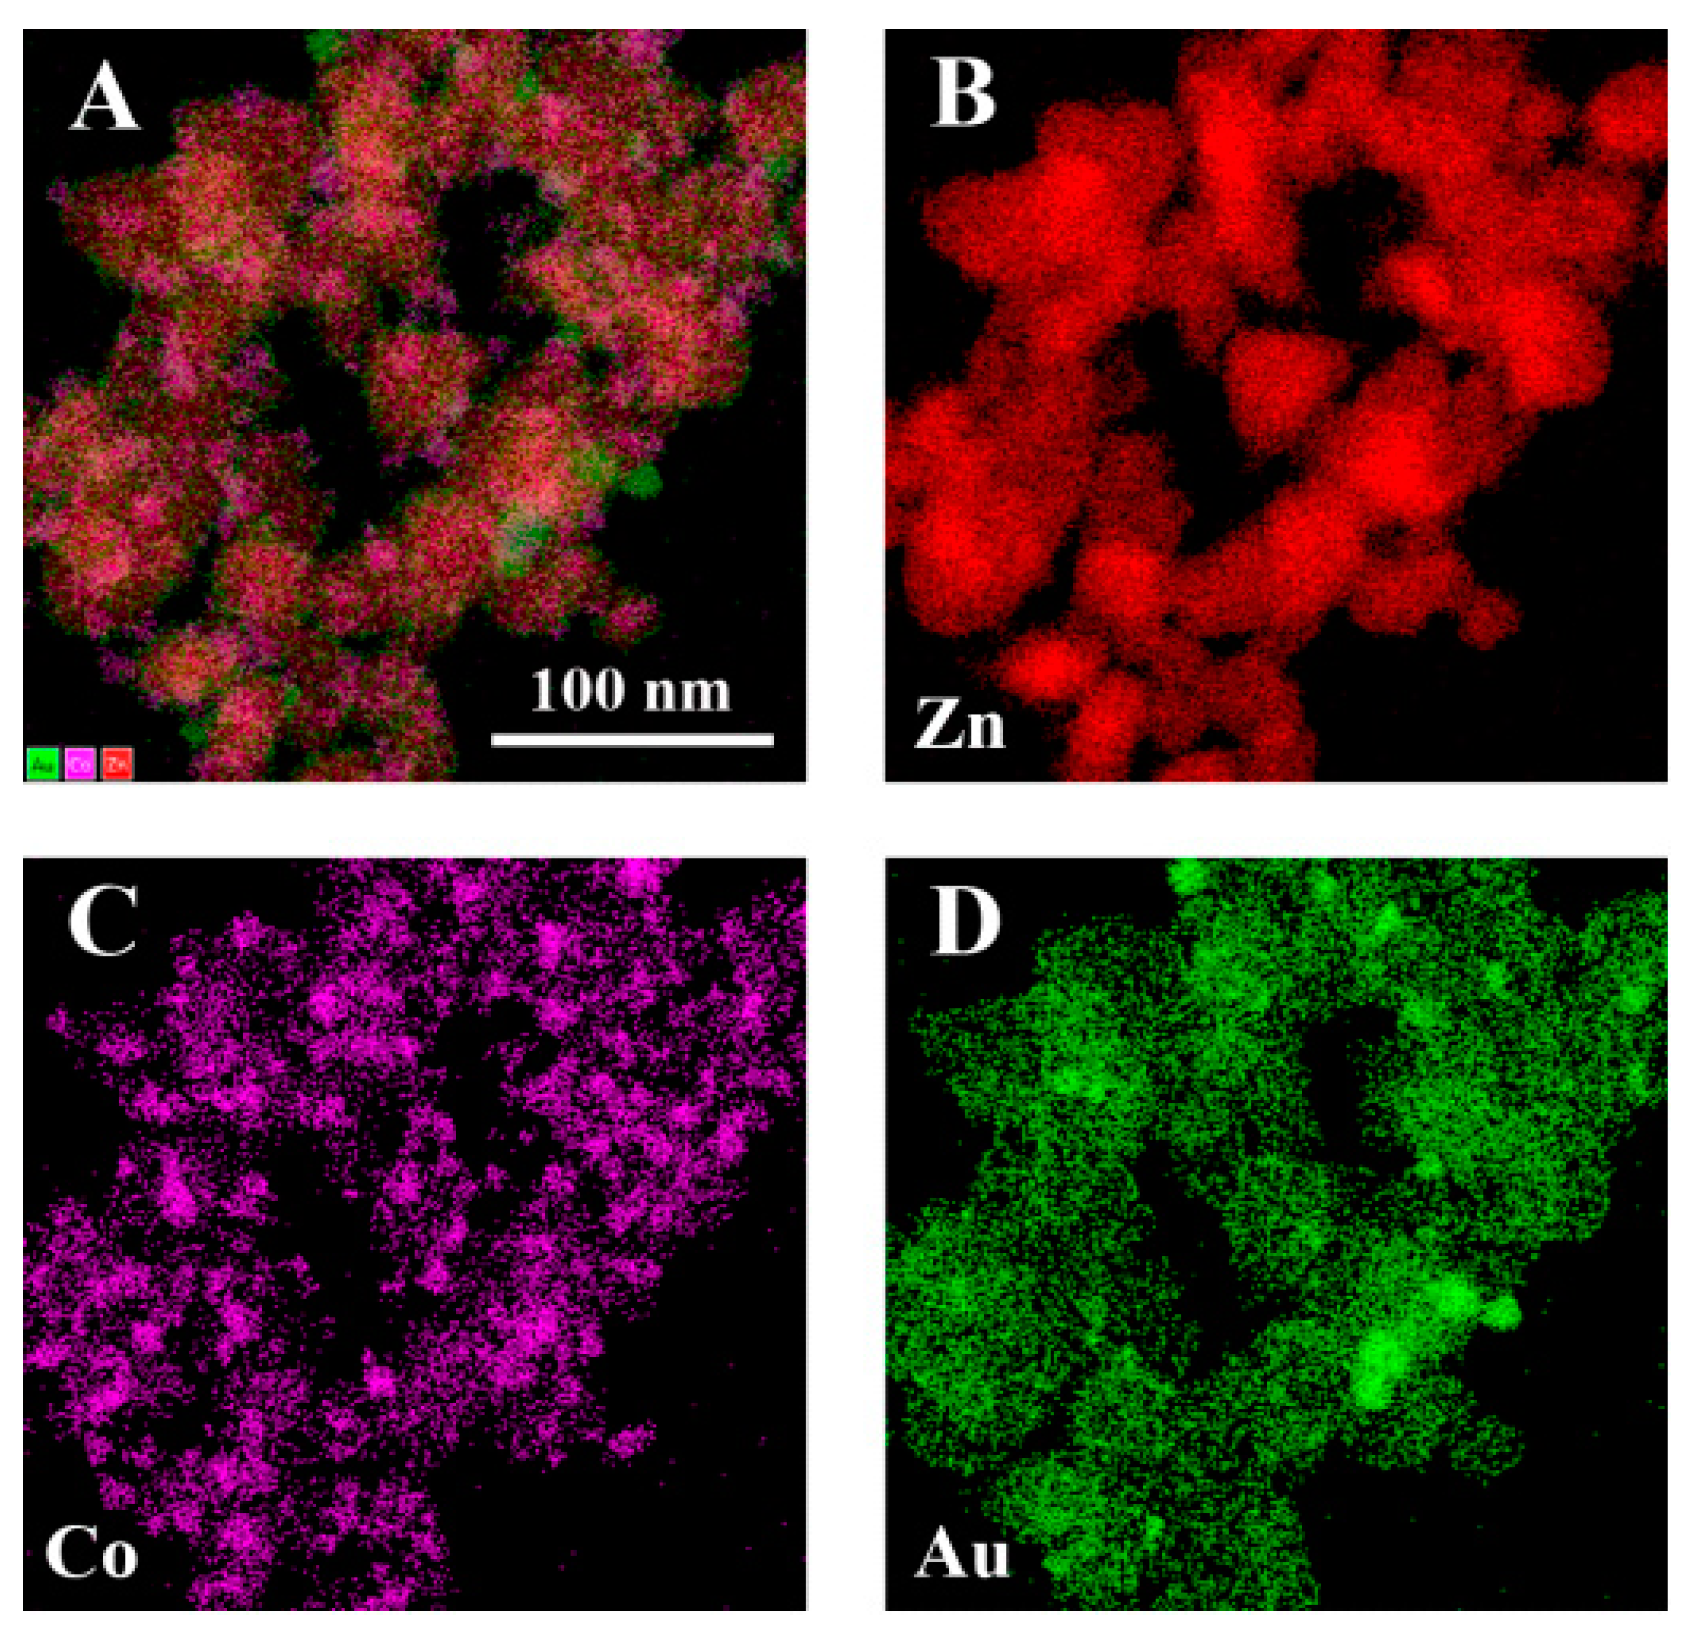
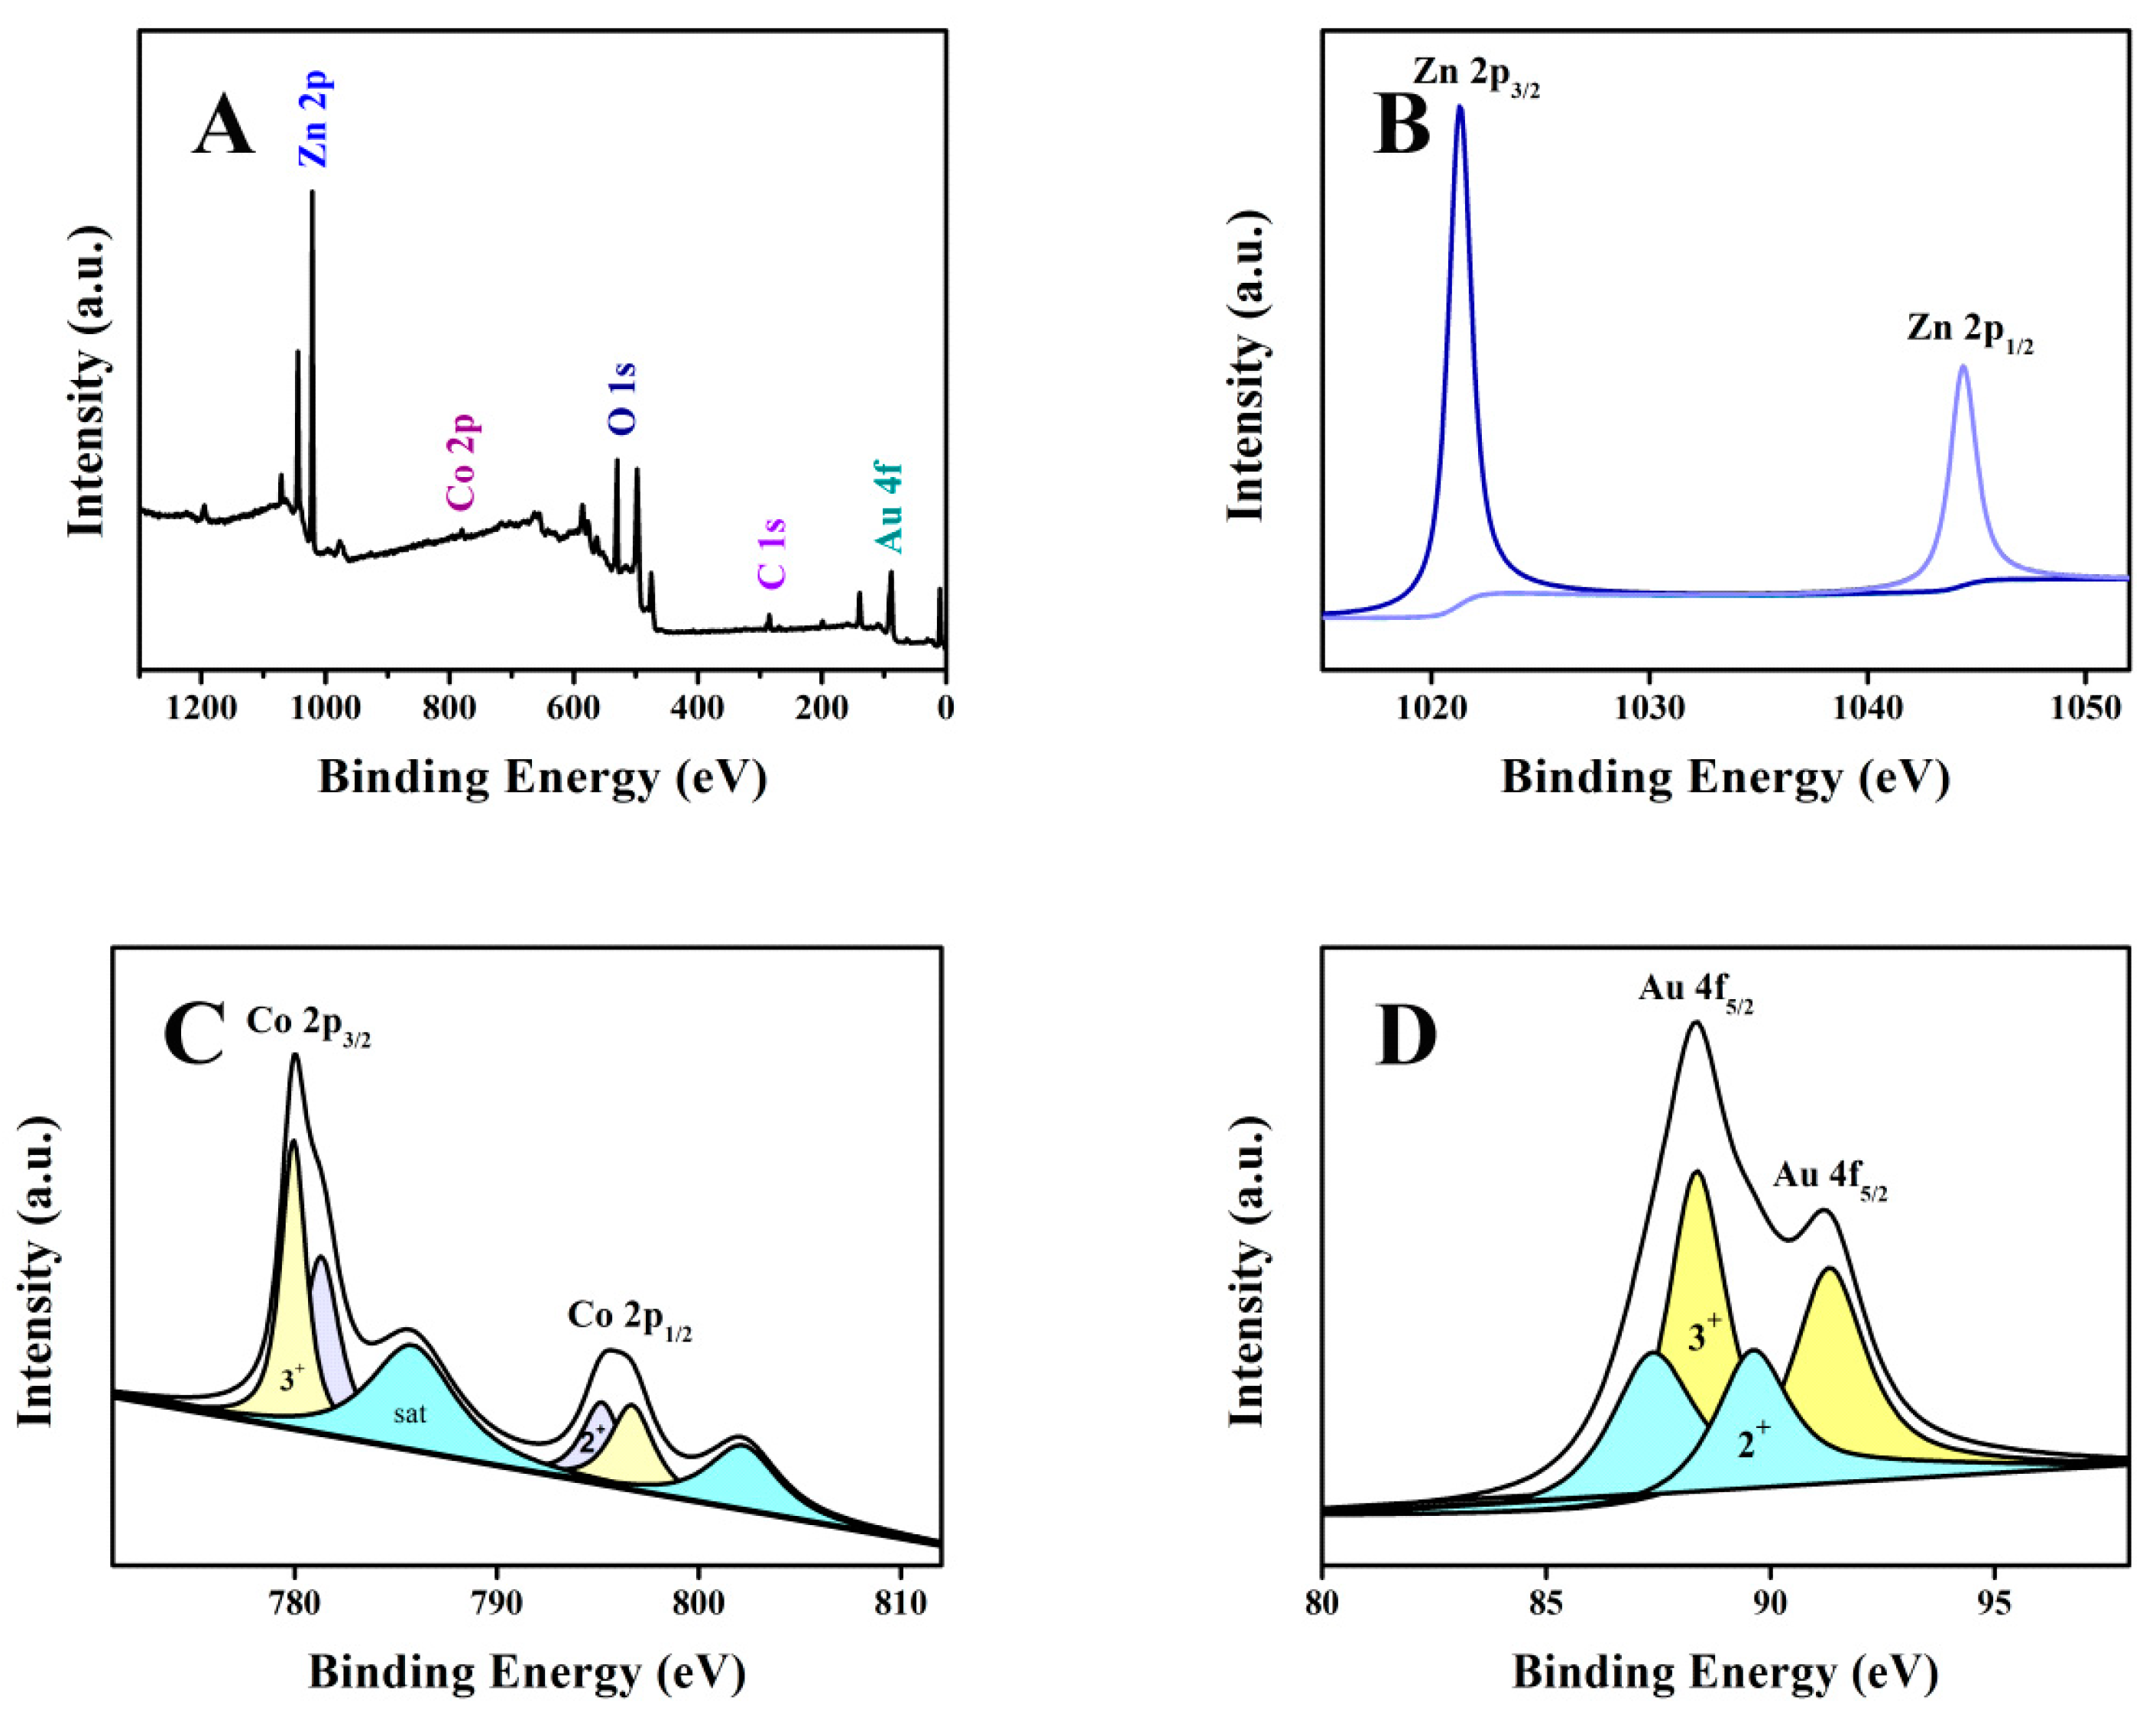
3.2. Characterization of Co-ZnO/Au

UV-vis diffuse spectra of Co400-ZnO and Co400-ZnO/Au (Figure S15) show successful preparation of Co400-ZnO/Au substrate due to the occurrence of a SPR band at 523 nm from Au nanoparticles. The hydrothermal preparation protocol was employed to synthesize a three-dimensional Co400-ZnO/Au composite. SEM and TEM images (Figure S16) reveal that the morphology of Co400-ZnO is cylindrical and the Co400-ZnO/Au is a Coral-shaped porous structure. In Figure S17, compared with Co400-ZnO, broadened XRD patterns for Co400-ZnO/Au at 31.66° and 34.22° with a slight shift indicate the partial incorporation of Au element into the crystal lattice of Co400-ZnO [52]. Owing to the fact that the Fermi energy of ZnO is lower than Co and Au, the modification of gold species changes the charge distribution and, then, the electron transfer on the surface, to achieve balance state [53]. As a result, a remark of numerous free electrons on the boundaries between metal and semiconductors is conducive to enlarging the localized SPR (LSPR) effect [41,54]. The detailed band structure distributions of the Co400-ZnO and Co400-ZnO/Au are illustrated in Figure 2.
In Figure 3D, the lattice spacing merits of ZnO indicate the presence of stacking faults and defects. Clearly, in Figure S18, there are a large amount of quantum dots (QDs) of ZnO, ranging from 2.3 to 3.3 nm, generated in the Co400-ZnO/Au composite, which should contribute to the quantum confinement effect [55]. According to the Hamiltonian of semiconductors, in the presence of ZnO QDs, very high mobility of charge carriers leads to the fusing of exciton and plasmon resonances [56].
The corresponding energy-dispersive X-ray (EDX) elemental mapping images (Figure 4) and TEM-EDS results (Figure S19) of Co400-ZnO/Au were recorded to confirm the uniform distribution of the Co, Zn, and Au elements.
On the other hand, QDs with many defects and a lack of long-range atomic order [57,58] further strengthen the strong semiconductor metal interaction (SSSMI) effect within Co400-ZnO/Au composite. The HRTEM images demonstrate that the particles tightly contacted to form an interfacial hetero junction, efficiently retard the recombination of photo-generated electron/hole pairs, reduce the photo-generated charge diffusion length [59,60], and augment the exposure area of active sites. Therefore, quantum confinement inducing the SSSMI effect enabled Co400-ZnO/Au to provide a greater SERS effect.
In the XPS results, shown in Figure 5A and in Table S5, compared with ZnO and Co400-ZnO, the binding energies of Zn, O, and Co in Co400-ZnO/Au shift, demonstrating the intra-atomic CT process [61]. In Figure 5B, for the XPS spectrum of Zn2p in Co400-ZnO/Au, the binding energies of Zn 2p3/2 and Zn 2p1/2 present at 1021.3 and 1044.3 eV, respectively [62]. Notably, the binding energy of Zn 2p in Co400-ZnO/Au showed a positive shift of 0.31 eV in comparison to 1044.08 eV of Zn 2p in Co400-ZnO (Figure S3), further proving the strengthened strong semiconductor metal interaction (SSSMI) effect between ZnO and Au NPs [63]. In Figure 5C, a faint Co2p central peak appears in the span from 775 to 800 eV. In detail, two binding energies of Co2p3/2 and Co2p1/2 orbitals were located at 781.2 and 796.7 eV, respectively. A jolting companion peak at 786 eV is indicated as Co2+ [64,65]. In Figure 5D, for Co400-ZnO/Au, XPS bands at 87.38 and 88.38 eV, corresponding to electronic states of Au2+ (minor amount) and Au3+ (high amount), hint at the abundant free electrons in the composite. Additionally, the binding energy of the Au4f5/2 in the composite centered at 88.38 eV, shifts (the standard XPS peak of Au4f5/2 positioned at 87.4 eV), which is also due to the SSSMI effect [66]. The electron exchange between Au3+ and Co2+ ions is given as follows:
Au3+ + Co2+ = Au2+ + Co3+

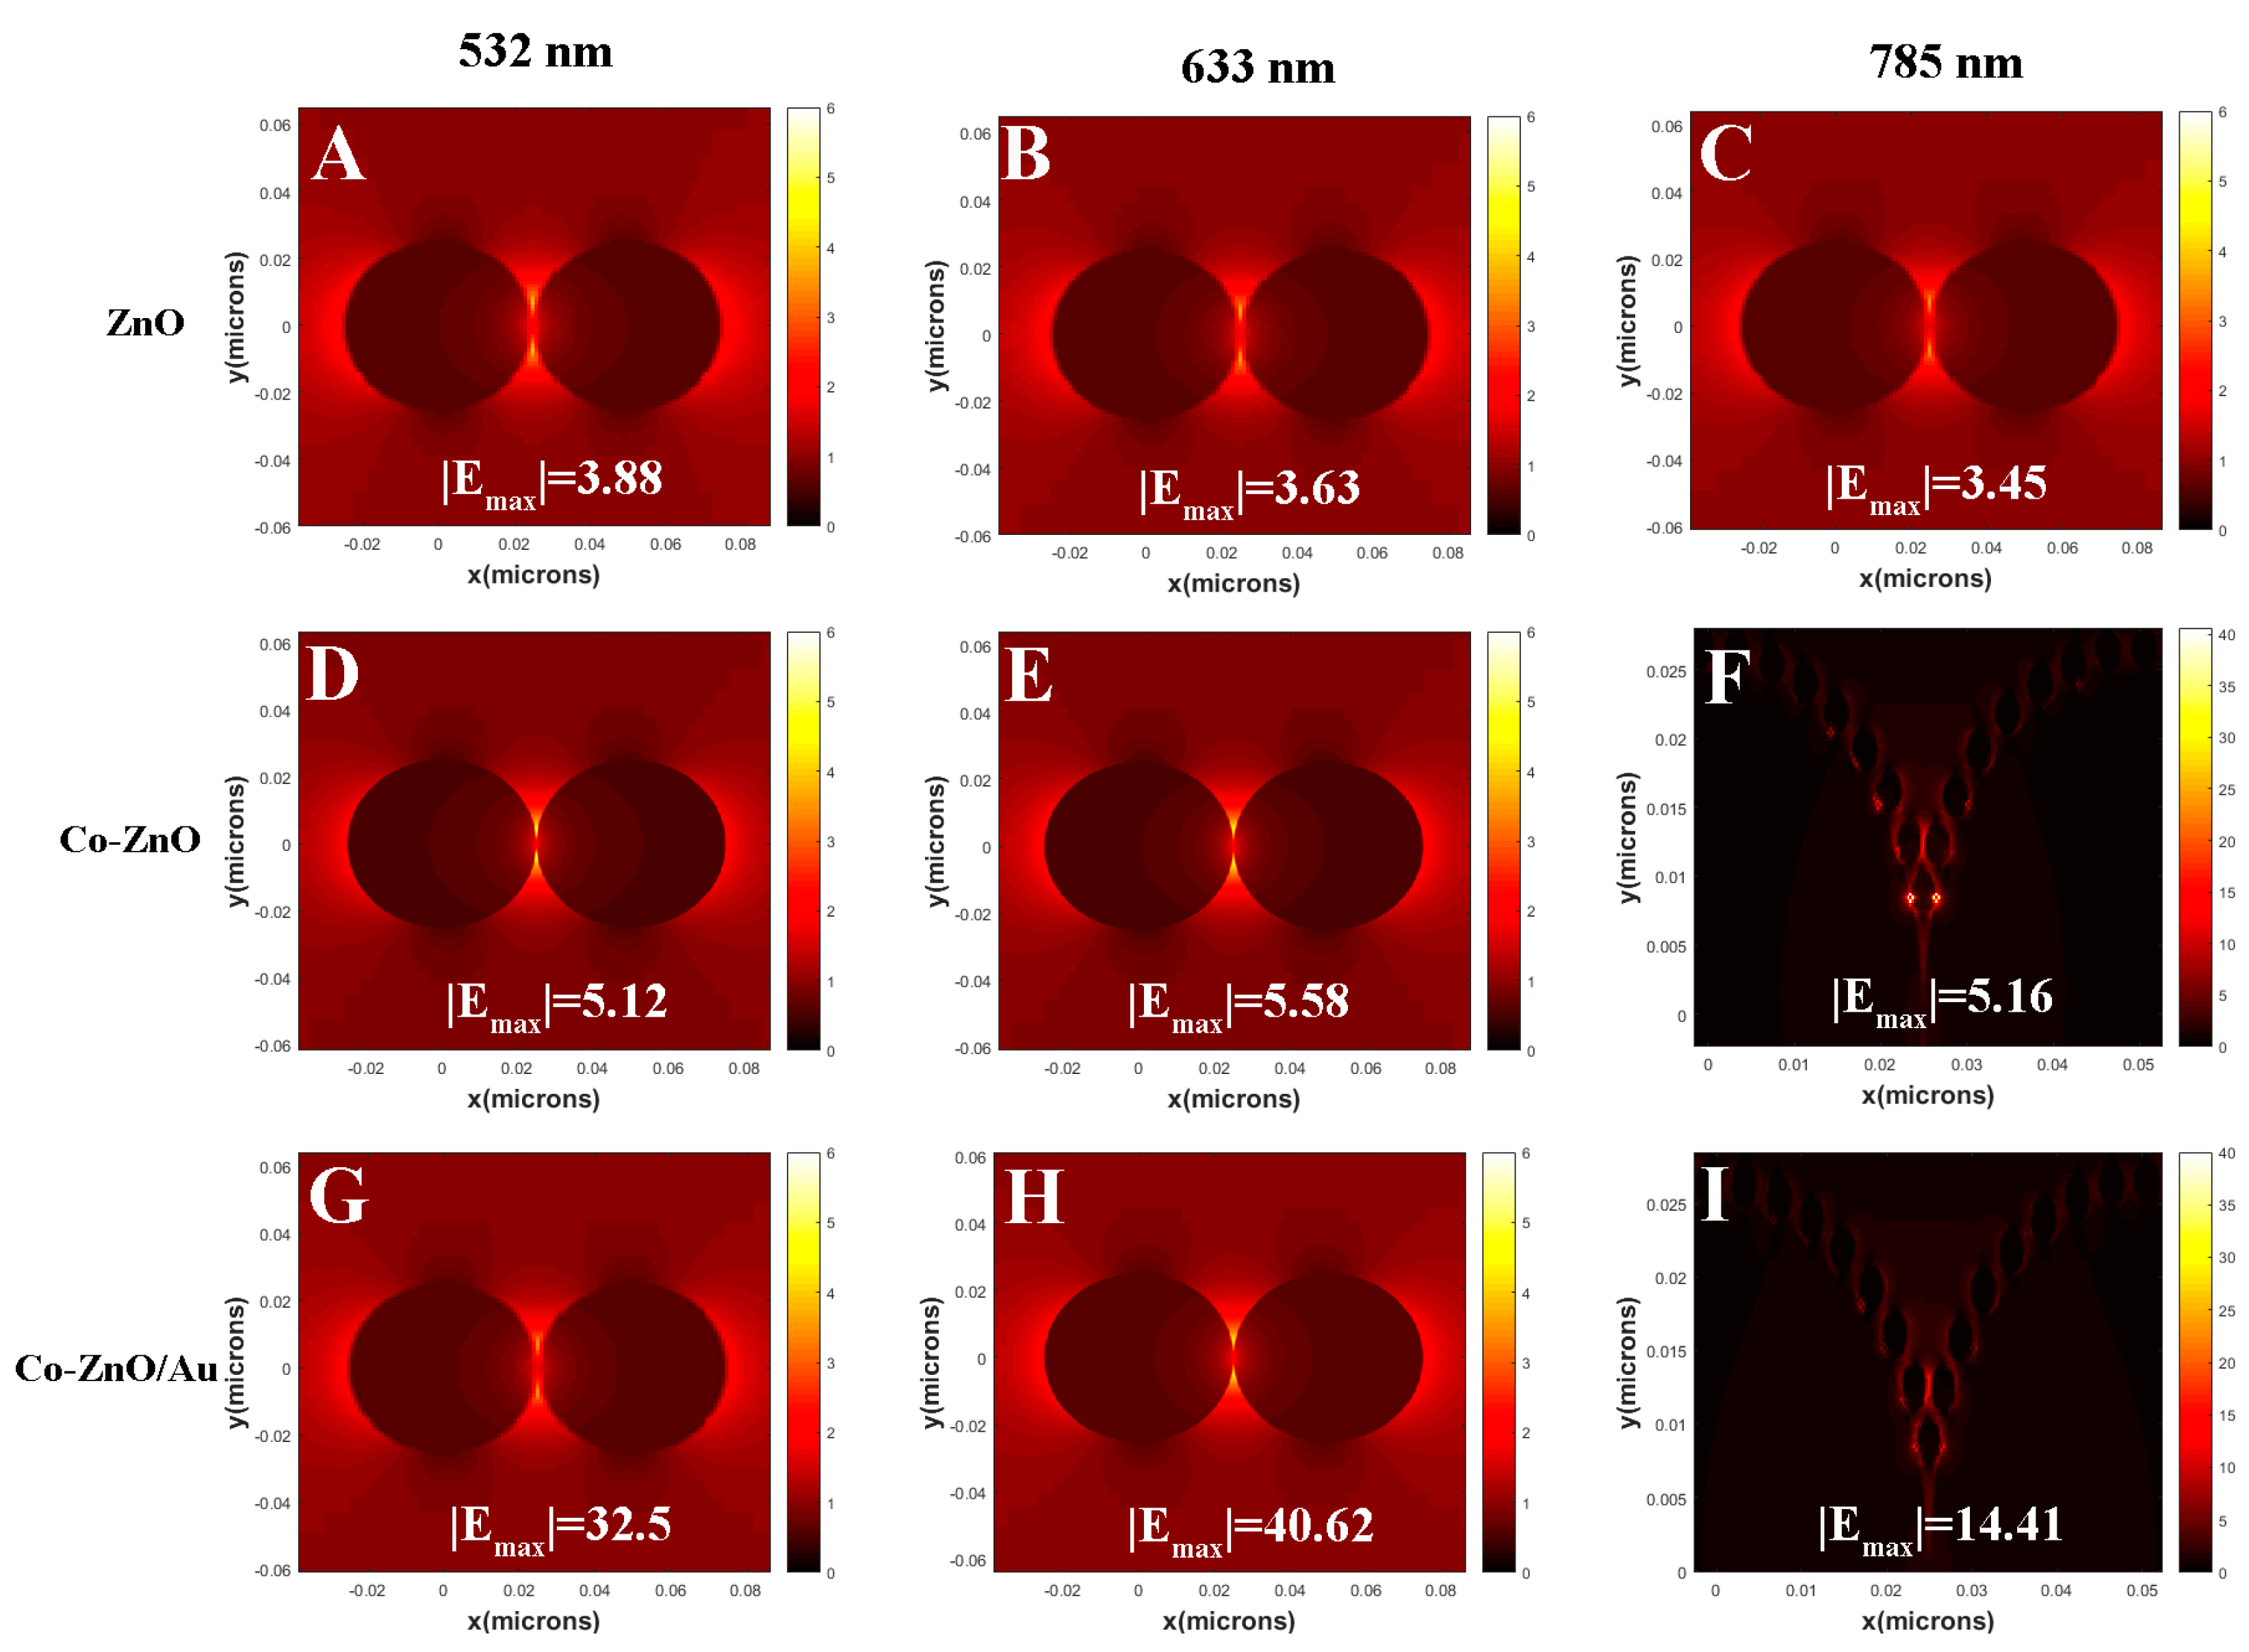
3.3. Simulation of Electromagnetic Field Enhancement

The FDTD simulation was used to simulate the surface electric field distribution of ZnO, Co-ZnO, and Co-ZnO/Au under exposure to lasers at 532, 633, and 785 nm. As shown in Figure 6, under irradiation with a 633 nm laser, the electric field enhancement factor of Co-ZnO can reach about six at the gap of neighboring nanoparticles, which is due to the Co doping effectively changing the photoelectric properties in comparison with the case of ZnO alone.
When it comes to Co-ZnO/Au, the SSSMI effect between ZnO QDs and AuNPs contributes to a great enhancement of the electric field, and an enhancement factor approximately equal to 40 could be reached, which is seven-fold greater than Co400-ZnO, shown Figure S20. Figure S20 shows the concentration-dependent SERS spectra of R6G solutions recorded on Co400-ZnO. Clearly, Co400-ZnO, due to the CT mechanism, could also contribute to the Raman signal enhancement of target molecules, to an extent.
The FDTD simulation is validated by the SERS results of 10−7 mol/L R6G acquired on Co400-ZnO/Au under different irradiations with 532, 633, and 785 nm lasers. Clearly shown in Figure S21, the matching of the 633 nm laser to the electromagnetic resonance absorption of the Co400-ZnO/Au substrate contributes the greatest SERS signal [67]. As shown in Figure S22A, by using Co400-ZnO/Au, the limit of detection (LOD, determined on the ratio of the signal to noise (S/N) equaling to 3) for R6G is 1 × 10⁻⁹ mol/L.

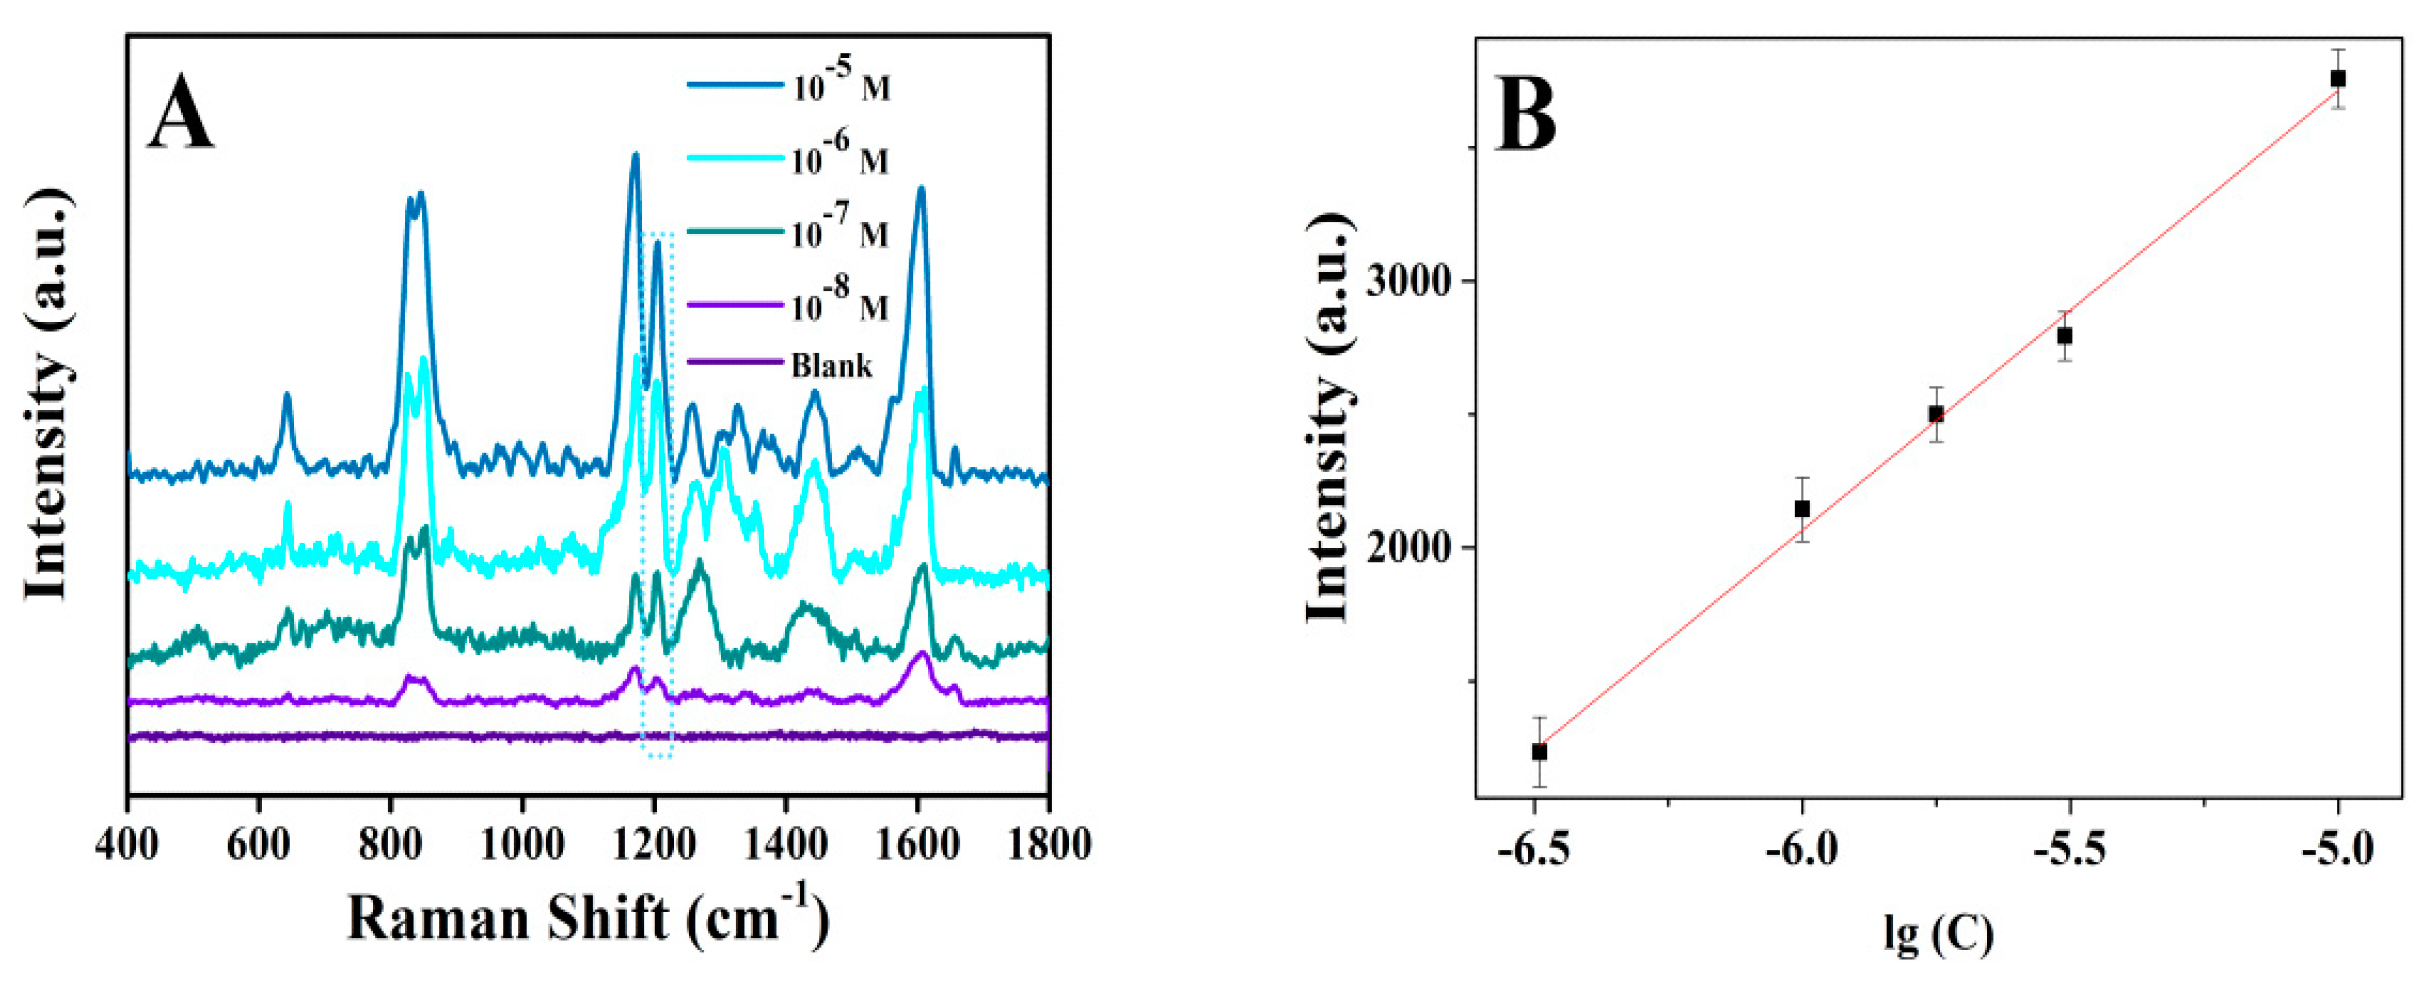
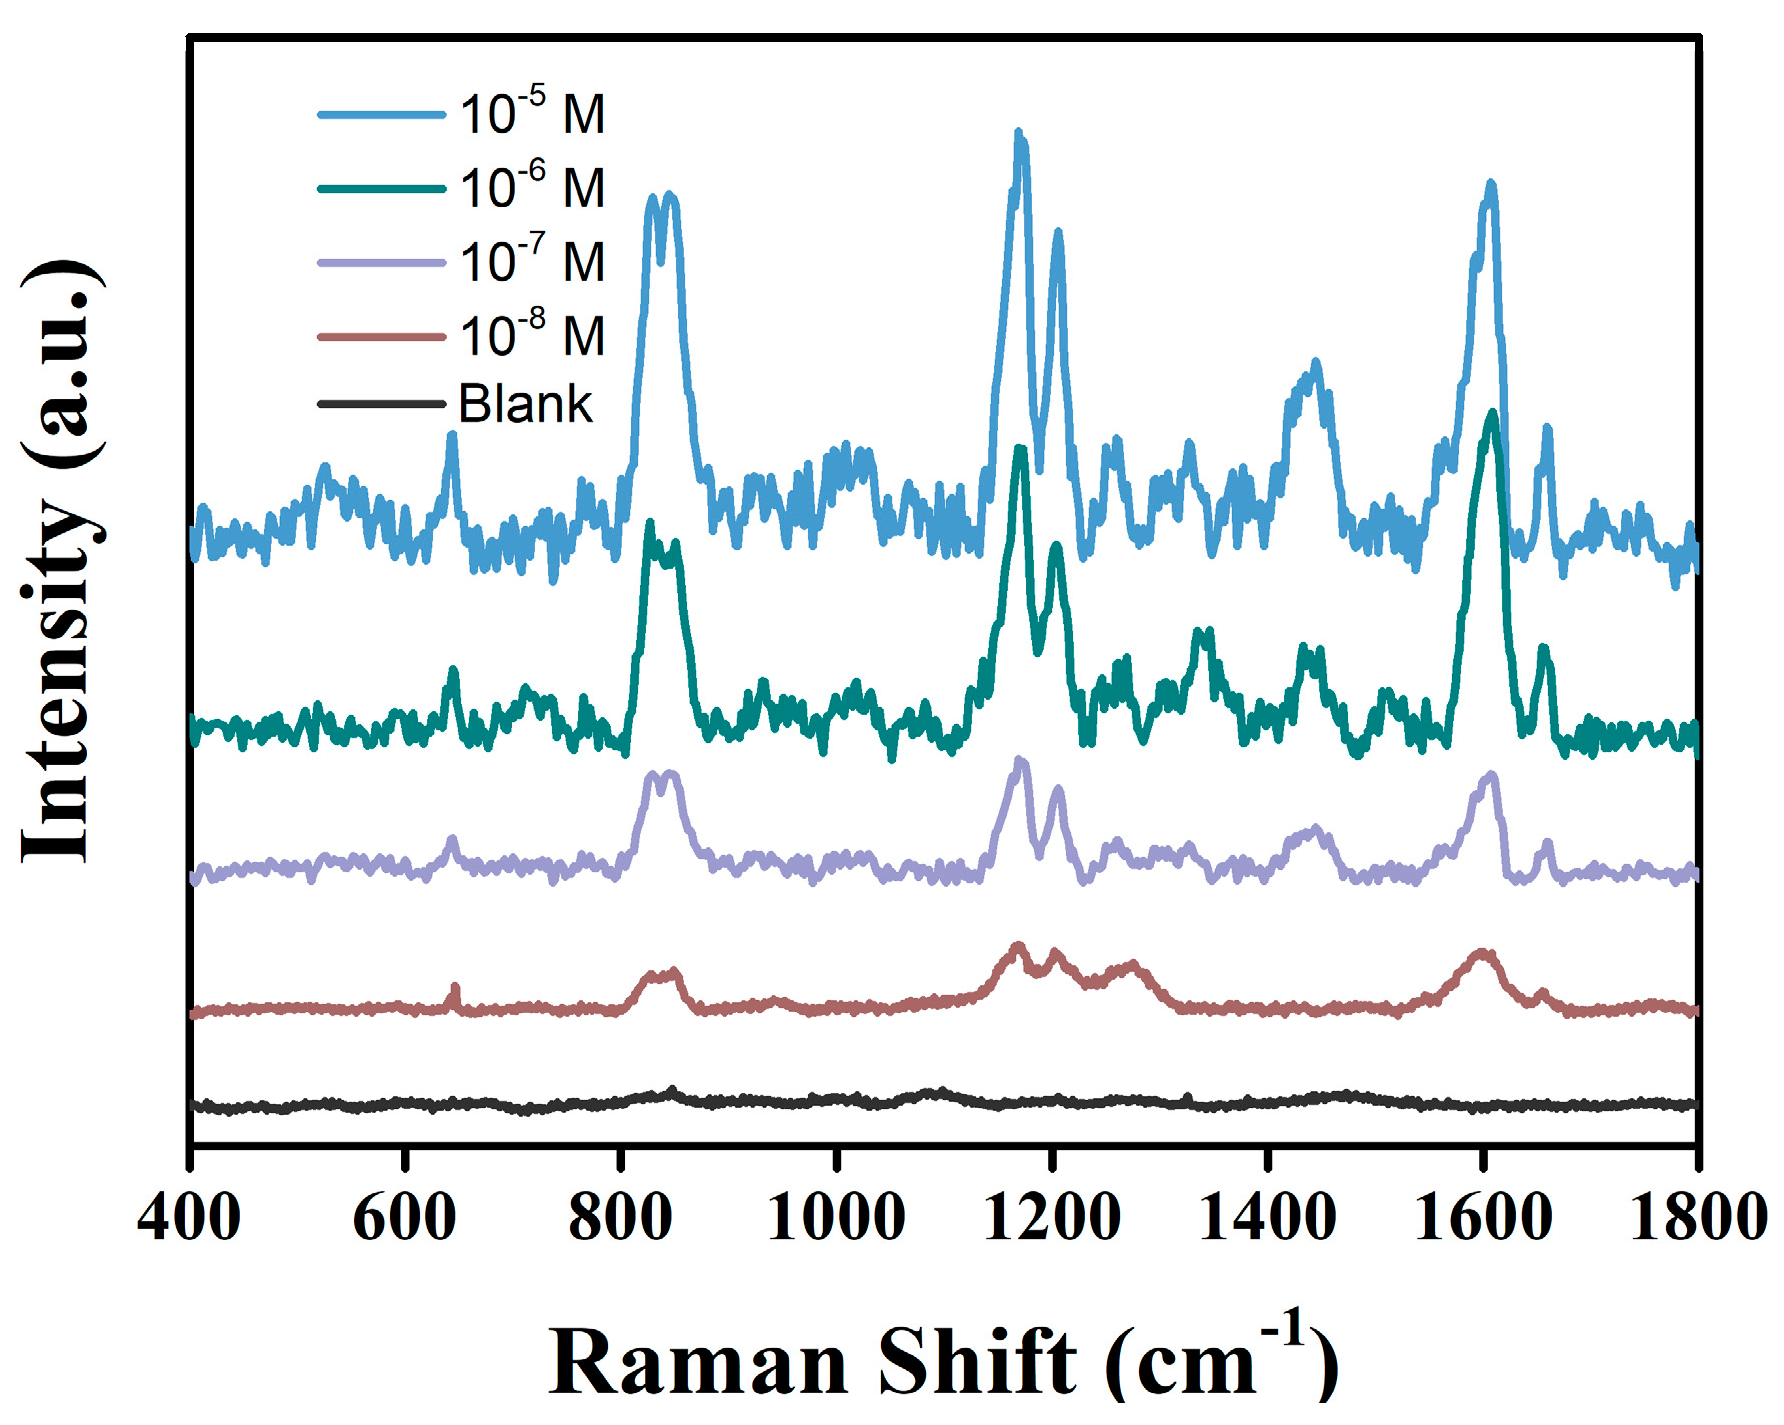
3.4. Co400-ZnO/Au-Based SERS Detection of Tyr

Tyramine (Tyr), as one of bioamines, is commonly produced in food and beverage as a consequence of microorganism fermentation and decomposition processes [68]. Overdose of Tyr from food stuffs taken by a person results in various adverse physiological effects such as hypertension, rash, cardiac palpitation, intracerebral hemorrhage, and even death in some severe cases [69]. The European Union poses a maximum limitation of Tyr content of 100–800 mg/kg in foods. Routinely, liquid chromatographic-fluorescence detectors (LC-FLD) [70] and liquid chromatographic-mass spectrometry (LC-MS) [71] are employed to analyze Try residue in foods. However, LC-based methods suffer from tedious sample pre-concentration, reagent-consumption, and the need for well- training persons.
As shown in Figure S22B, Co400-ZnO/Au has the strongest Raman enhancement effect for Try. Concentration-dependent SERS spectra of Tyr, using Co400-ZnO/Au, are shown in Figure 7A and the normal Raman spectrum of powder Tyr is also given in Figure S23. Figure 7B shows a linearity concentration relationship ranging from 1.0 × 10⁻⁸ to 1 × 10⁻⁵ mol/L, with the correlation coefficient of 0.9838 based on the characteristic band intensity at 1208 cm−1. Tyr, with a concentration at 1 × 10⁻⁸ M, could be detectable, which meets the detection sensitivity requirement of the EU for total tyrosine content in foods. In Figure S24, the relative standard derivation (RSD) of the SERS intensities at 613 cm−1 recorded from 20 randomly selected points on Co400-ZnO/Au substrate is 8.05%, which indicates a reasonable signal uniformity. After storage in ambient conditions for 70 days, the Raman signal recorded on Co400-ZnO/Au substrate kept 90% of its level of signal intensity obtained on freshly prepared substrate, exhibiting excellent shelf-time (Figure S25). We can obtain reproducible SERS spectra of R6G (10−6 M) on the three batches prepared Co400-ZnO/Au substrates in Figure S26.
As shown in Figure 8, in beer, tyramine at concentration as low as 1 × 10⁻⁸ M can be detected. As shown in Table 1, the relative standard deviation is 0.29~5.05%, and the reasonable recovery is 91.20~107.15%. In Table 2, compared with the other assays for Tyr in the literature, the Co400-ZnO/Au-based SERS method shows a good sensitivity.

4. Conclusions

In summary, the resultant optimal Co400-ZnO could reasonably improve the separation efficiency of electron and hole under visible light excitation. Furthermore, the Co400-ZnO/Au composite was prepared as an SERS substrate, which exhibited a long-term stability and a remarkable detection sensitivity for R6G with the LOD being as low as 1 × 10⁻⁹ M. Based on XPS characterization, DFT simulation, and FDTD theoretical exploration, this promising SERS effect can be attributed to the doping of Co to generate ZnO semiconductor with many defects accompanying the formation of certain QDs, triggering SSSMI between ZnO QDs and AuNPs. The synergistic effect boosted the huge localized electromagnetic field. As a real application case, by using Co400-ZnO/Au-based SERS assay, the lowest detectable concentration was 1 × 10⁻⁸ M. In this work, an effort was made to explore whether the composite of noble metal and semiconductor quantum dots could be developed as the excellent SERS substrate for trace detection.

Supplementary Materials

The following supporting information can be downloaded at: https://www.mdpi.com/article/10.3390/bios12121148/s1. Figure S1: The digital pictures of the as-prepared different percent of Co-doped ZnO samples; Figure S2: (a) Crystallite size and (b) micro strain and dislocation density for all the samples investigated in this study (from 1 to 8: ZnO, Co40-ZnO, Co120-ZnO, Co200-ZnO, Co280-ZnO, Co400-ZnO, Co480-ZnO, Co600-ZnO, respectively); Figure S3: (A) XPS survey spectrum of ZnO, (B) and (C) XPS spectra of Zn 2p and O for ZnO; Figure S4: XPS spectra of (A) XPS survey spectrum of Co400-ZnO, (B) Zn 2p (C) Co 2p, and (D) O 1s for Co400-ZnO; Figure S5: UV-vis diffusion reflectance spectra of Au(A) and ZnO/Au(B) samples; Figure S6: UV-vis diffusion reflectance spectra of ZnO and Co-ZnO samples; Figure S7: Band gaps for the as-prepared different percent of Co-doped ZnO samples; Figure S8: VB-XPS spectra of Co-doped ZnO samples; Figure S9: Schematic band structure evolution of Co-doped ZnO samples; Figure S10: The density state of (A) pristine ZnO and (B) Co substitution in ZnO lattice. The dotted lines at energy zero represent the Fermi level; Figure S11: PL spectra at the excitation wavelength of 233 nm of ZnO and Co- doped ZnO samples; Figure S12: FTIR spectra of ZnO and Co-doped ZnO samples; Figure S13: The Raman spectra of R6G(10−6 M) on Co-ZnO/Au substrates; Figure S14: Band structure of the ZnO (A) and change in the band structure of ZnO by Co dopant; Figure S15: UV-vis diffusion reflectance spectra of Co400-ZnO and Co400-ZnO/Au samples; Figure S16: (A,B) TEM images of Co400-ZnO. (C) SEM image of Co400-ZnO. (D) SEM image of Co-ZnO/Au; Figure S17: XRD patterns of ZnO, Co400-ZnO, and Co400-ZnO/Au. (A) Wide-angle patterns and (B) Selected-angle patterns; Figure S18: Size distribution of ZnO quantum dots in Co400-ZnO/Au; Figure S19: TEM-EDS result of Co-ZnO/Au; Figure S20: Concentration-dependent SERS spectra of R6G solutions recorded on Co400-ZnO; Figure S21: SERS spectra of R6G (10−7) recorded on Co400-ZnO/Au under different irradiations with 532, 633, and 785 nm lasers; Figure S22: (A) SERS spectra of R6G molecules adsorbed onto Co-ZnO/Au. (B) SERS spectra of Tyr (1 × 10⁻⁸ M) on Co-ZnO/Au, ZnO/Au, and Au NPs; Figure S23: Normal Raman spectrum of powder Tyramine; Figure S24: (A) SERS spectra of R6G (10−6 M) recorded from 20 randomly- selected points on Co400-ZnO/Au. (B) The statistic on Raman Intensities of R6 G (10−6 M) recorded from 20 randomly- selected points on Co400-ZnO/Au; Figure S25: Raman intensities of R6G (10−6 M) by using Co400-ZnO/Au monitored during storage in ambient condition for 90 days; Figure S26: The SERS spectra of R6G (10−6 M) recorded on the three batches of Co400-ZnO/Au substrate; Table S1: Summary of Crystallite size (D), Dislocation density (ρ), and Micro strain (ε); Table S2:. Binding energy (BE) of Co in Co-ZnO samples; Table S3: Binding energy (BE) of Zn and O in Cox-ZnO samples; Table S4: The band gap (Eg) and optical absorption edge (nm) of pure ZnO and Co-ZnO samples; Table S5: Binding energy (BE) of ZnO, Co400-ZnO and Co400-ZnO/Au.

Author Contributions

Program provider, H.Y.; design of the experiments, H.Y. and Y.Z.; data interpretation, H.Y., X.G. and Y.W.; data collection, Y.Z. and X.Z.; figures, Y.Z., Z.M. and X.Z.; tables, Y.Z. and X.Z.; data analysis, Y.Z., X.Z., Z.M., X.G. and Y.W.; draft writing, X.Z.; sample resource and program management, X.G.; program administration and validation, X.G.; investigation, Y.W. writing and editing, H.Y. All authors have read and agreed to the published version of the manuscript.

Funding

This work is supported by the National Natural Science Foundation of China (no. 21475088).

Institutional Review Board Statement

Not applicable.

Informed Consent Statement

Not applicable.

Data Availability Statement

The data that support the findings of this study are available from the corresponding author upon reasonable request.

Acknowledgments

This work is supported by the National Natural Science Foundation of China (no. 21475088), Shanghai Key Laboratory of Rare Earth Functional Materials, International Joint Laboratory on Resource Chemistry, Shanghai Engineering Research Center of Green Energy Chemical Engineering, and Shanghai Municipal Education Committee Key Laboratory of Molecular Imaging Probes and Sensors.

Conflicts of Interest

The authors declare no conflict of interest.

References

  1. Yang, Y.; Li, Z.Y.; Yamaguchi, K.; Tanemura, M.; Huang, Z.; Jiang, D.; Chen, Y.; Zhou, F.; Nogami, M. Controlled fabrication of silver nanoneedles array for SERS and their application in rapid detection of narcotics. Nanoscale 2012, 4, 2663–2669. [Google Scholar] [CrossRef] [PubMed]
  2. Chen, A.; DePrince, A.E.; Demortiere, A.; Joshi-Imre, A.; Shevchenko, E.V.; Gray, S.K.; Welp, U.; Vlasko-Vlasov, V.K. Self-assembled large Au nanoparticle arrays with regular hot spots for SERS. Small 2011, 7, 2365–2371. [Google Scholar] [CrossRef] [PubMed]
  3. Sun, M.; Fang, Y.; Yang, Z.; Xu, H. Chemical and electromagnetic mechanisms of tip-enhanced Raman scattering. Phys. Chem. Chem. Phys. 2009, 11, 9412–9419. [Google Scholar] [CrossRef] [PubMed]
  4. He, Z.; Voronine, D.V.; Sinyukov, A.M.; Liege, Z.N.; Birmingham, B.; Sokolov, A.V.; Zhang, Z. Scully MO Tip-Enhanced Raman Scattering on Bulk MoS2 Substrate. IEEE J. Sel. Top. Quantum Electron. 2017, 23, 113–118. [Google Scholar] [CrossRef]
  5. Jeong, D.H.; Suh, J.S.; Moskovits, M. Enhanced photochemistry of 2-aminopyridine adsorbed on silver colloid surfaces. J. Raman. Spectrosc. 2001, 32, 1026–1031. [Google Scholar] [CrossRef]
  6. Zhao, X.; Liu, S.; Li, Y.; Chen, M. DFT study of chemical mechanism of pre-SERS spectra in Pyrazine-metal complex and metal-Pyrazine-metal junction. Spectrochim. Acta. Part A 2010, 75, 794–798. [Google Scholar] [CrossRef]
  7. Guerrini, L.; Graham, D. Molecularly-mediated assemblies of plasmonic nanoparticles for Surface-Enhanced Raman Spectroscopy applications. Chem. Soc. Rev. 2012, 41, 7085–7107. [Google Scholar] [CrossRef]
  8. Vigderman, L.; Khanal, B.P.; Zubarev, E.R. Functional gold nanorods: Synthesis, self-assembly, and sensing applications. Adv. Mater. 2012, 24, 4811–4841. [Google Scholar] [CrossRef]
  9. Zhai, Y.; Zheng, Y.; Ma, Z.; Cai, Y.; Wang, F.; Guo, X.; Wen, Y.; Yang, H. Synergistic Enhancement Effect for Boosting Raman Detection Sensitivity of Antibiotics. ACS Sens. 2019, 4, 2958–2965. [Google Scholar] [CrossRef]
  10. Qi, D.; Lu, L.; Wang, L.; Zhang, J. Improved SERS sensitivity on plasmon-free TiO2 photonic microarray by enhancing light-matter coupling. J. Am. Chem. Soc. 2014, 136, 9886–9889. [Google Scholar] [CrossRef]
  11. Alessandri, I.; Lombardi, J.R. Enhanced Raman Scattering with Dielectrics. Chem. Rev. 2016, 116, 14921–14981. [Google Scholar] [CrossRef]
  12. Cong, S.; Yuan, Y.; Chen, Z.; Hou, J.; Yang, M.; Su, Y.; Zhang, Y.; Li, L.; Li, Q.; Geng, F.; et al. Noble metal-comparable SERS enhancement from semiconducting metal oxides by making oxygen vacancies. Nat. Commun. 2015, 6, 7800. [Google Scholar] [CrossRef] [PubMed] [Green Version]
  13. Wang, X.; Shi, W.; Jin, Z.; Huang, W.; Lin, J.; Ma, G.; Li, S.; Guo, L. Remarkable SERS Activity Observed from Amorphous ZnO Nanocages. Angew. Chem. Int. Ed. Engl. 2017, 56, 9851–9855. [Google Scholar] [CrossRef] [PubMed]
  14. Lin, J.; Shang, Y.; Li, X.; Yu, J.; Wang, X.; Guo, L. Ultrasensitive SERS Detection by Defect Engineering on Single Cu2O Superstructure Particle. Adv. Mater. 2017, 29, 1604797. [Google Scholar] [CrossRef] [PubMed]
  15. Wang, X.; Shi, W.; She, G.; Mu, L. Using Si and Ge nanostructures as substrates for surface-enhanced Raman scattering based on photoinduced charge transfer mechanism. J. Am. Chem. Soc. 2011, 133, 16518–16523. [Google Scholar] [CrossRef] [PubMed]
  16. Lin, J.; Hao, W.; Shang, Y.; Wang, X.; Qiu, D.; Ma, G.; Chen, C.; Li, S.; Guo, L. Direct Experimental Observation of Facet-Dependent SERS of Cu2O Polyhedra. Small 2018, 14, 1703274. [Google Scholar] [CrossRef]
  17. Zong, Y.; Sun, Y.; Meng, S.; Wang, Y.; Xing, H.; Li, X.; Zheng, X. Doping effect and oxygen defects boost room temperature ferromagnetism of Co-doped ZnO nanoparticles: Experimental and theoretical studies. RSC. Adv. 2019, 9, 23012–23020. [Google Scholar] [CrossRef] [Green Version]
  18. Bhat, S.V.; Deepak, F.L. Tuning the bandgap of ZnO by substitution with Mn2+, Co2+ and Ni2+. Solid State Commun. 2005, 135, 345–347. [Google Scholar] [CrossRef]
  19. Zhong, M.; Wu, W.; Wu, H.; Guo, S. A facile way to regulating room-temperature ferromagnetic interaction in Co-doped ZnO diluted magnetic semiconductor by reduced graphene oxide coating. J. Alloys Compd. 2018, 765, 69–74. [Google Scholar] [CrossRef]
  20. Da Silva, R.T.; Mesquita, A.; De Zevallos, A.O.; Chiaramonte, T.; Gratens, X.; Chitta, V.A.; Morbec, J.M.; Rahman, G.; Garcia-Suarez, V.M.; Doriguetto, A.C.; et al. Multifunctional nanostructured Co-doped ZnO: Co spatial distribution and correlated magnetic properties. Phys. Chem. Chem. Phys. 2018, 20, 20257–20269. [Google Scholar] [CrossRef]
  21. Shukla, P.; Tiwari, S.; Joshi, S.R.; Akshay, V.R.; Vasundhara, M.; Varma, S.; Singh, J.; Chanda, A. Investigation on structural, morphological and optical properties of Co-doped ZnO thin films. Phys. B Condens. Matter 2018, 550, 303–310. [Google Scholar] [CrossRef]
  22. Reddy, I.N.; Reddy, C.V.; Shim, J.; Akkinepally, B.; Cho, M.; Yoo, K.; Kim, D. Excellent visible-light driven photocatalyst of (Al, Ni) co-doped ZnO structures for organic dye degradation. Catal. Today 2020, 340, 277–285. [Google Scholar] [CrossRef]
  23. Lim, S.W.; Hwang, D.K.; Myoung, J.M. Observation of optical properties related to room-temperature ferromagnetism in co-sputtered Zn12xCoxO thin fifilms. Solid State Commun. 2003, 125, 231–235. [Google Scholar] [CrossRef]
  24. Liu, X.C.; Shi, E.W.; Chen, Z.Z.; Zhang, H.W.; Song, L.X.; Wang, H.; Yao, S.D. Structural, optical and magnetic properties of Co-doped ZnO films. J. Cryst. Growth. 2006, 296, 135–140. [Google Scholar] [CrossRef]
  25. Zhou, X.; Luo, C.; Luo, M.; Wang, Q.; Wang, J.; Liao, Z.; Chen, Z.; Chen, Z. Understanding the synergetic effect from foreign metals in bimetallic oxides for PMS activation: A common strategy to increase the stoichiometric efficiency of oxidants. Chem. Eng. J. 2020, 381, 122587. [Google Scholar] [CrossRef]
  26. Iqbal, A.; Zakria, M.; Mahmood, A. Structural and spectroscopic analysis of wurtzite (ZnO)1−x(Sb2O3)x composite semiconductor. Prog. Nat. Sci. Mater. Int. 2015, 25, 131–136. [Google Scholar] [CrossRef] [Green Version]
  27. Hankare, P.P.; Chate, P.A.; Sathe, D.J.; Chavan, P.A.; Bhuse, V.M. Effect of thermal annealing on properties of zinc selenide thin films deposited by chemical bath deposition. J. Mater. Sci. Mater. Electron. 2008, 20, 374–379. [Google Scholar] [CrossRef]
  28. Mani, G.K.; Rayappan, J.B.B. Influence of copper doping on structural, optical and sensing properties of spray deposited zinc oxide thin films. J. Alloys Compd. 2014, 582, 414–419. [Google Scholar] [CrossRef]
  29. Iqbal, J.; Jan, T.; Ronghai, Y. Effect of Co doping on morphology, optical and magnetic properties of ZnO1-D nanostructures. J. Mater. Sci. Mater. Electron. 2013, 24, 4393–4398. [Google Scholar] [CrossRef]
  30. Bu, I.Y. Sol–gel production of Cu/Al co-doped zinc oxide: Effect of Al co-doping concentration on its structure and optoelectronic properties. Superlattices Microstruct. 2014, 76, 115–124. [Google Scholar] [CrossRef]
  31. Mardani, H.R.; Forouzani, M.; Ziari, M.; Biparva, P. Visible light photo-degradation of methylene blue over Fe or Cu promoted ZnO nanoparticles. Spectrochim. Acta. A Mol. Biomol. Spectrosc. 2015, 141, 27–33. [Google Scholar] [CrossRef]
  32. Chen, M.; Wang, X.; Yu, Y.H.; Pei, Z.L.; Bai, X.D.; Sun, C.; Huang, R.F.; Wen, L.S. Intrinsic limit of electrical properties of transparent conductive oxide films. Appl. Surf. Sci. 2000, 30, 2538–2548. [Google Scholar] [CrossRef]
  33. Prabakaran, S.; Nisha, K.D.; Harish, S.; Archana, J.; Navaneethan, M.; Ponnusamy, S.; Muthamizhchelvan, C.; Ikeda, H.; Hayakawa, Y. Synergistic effect and enhanced electrical properties of TiO2/SnO2/ZnO nanostructures as electron extraction layer for solar cell application. Appl. Surf. Sci. 2019, 498, 143702. [Google Scholar] [CrossRef]
  34. Bharti, B.; Kumar, S.; Lee, H.N.; Kumar, R. Formation of oxygen vacancies and Ti3+ state in TiO2 thin film and enhanced optical properties by air plasma treatment. Sci. Rep. 2016, 6, 32355. [Google Scholar] [CrossRef] [PubMed] [Green Version]
  35. Yang, C.; Qin, J.; Xue, Z.; Ma, M.; Zhang, X.; Liu, R. Rational design of carbon-doped TiO2 modified g-C3N4 via in-situ heat treatment for drastically improved photocatalytic hydrogen with excellent photostability. Nano Energy 2017, 41, 1–9. [Google Scholar] [CrossRef]
  36. Shah, N.S.; Khan, J.A.; Sayed, M.; Khan, Z.U.H.; Rizwan, A.D.; Muhammad, N.; Boczkaj, G.; Murtaza, B.; Imran, M.; Khan, H.M. Solar light driven degradation of norfloxacin using as-synthesized Bi3+ and Fe2+ co-doped ZnO with the addition of HSO5−: Toxicities and degradation pathways investigation. Chem. Eng. J. Adv. 2018, 351, 841–855. [Google Scholar] [CrossRef]
  37. Tian, N.; Zhang, Y.; Li, X.; Xiao, K.; Du, X.; Dong, F.; Waterhouse, G.I.N.; Zhang, T.; Huang, H. Precursor-reforming protocol to 3D mesoporous g-C3 N4 established by ultrathin self-doped nanosheets for superior hydrogen evolution. Nano Energy 2017, 38, 72–81. [Google Scholar] [CrossRef]
  38. Cai, X.; Zhang, J.; Fujitsuka, M.; Majima, T. Graphitic-C3N4 hybridized N-doped La2Ti2O7 two-dimensional layered composites as efficient visible-light-driven photocatalyst. Appl. Catal. B. 2017, 202, 191–198. [Google Scholar] [CrossRef] [Green Version]
  39. Wang, X.; Sun, M.; Murugananthan, M.; Zhang, Y.; Zhang, L. Electrochemically self-doped WO3/TiO2 nanotubes for photocatalytic degradation of volatile organic compounds. Appl. Catal. B. 2020, 260, 118205. [Google Scholar] [CrossRef]
  40. Yan, J.; Wang, T.; Wu, G.; Dai, W.; Guan, N.; Li, L.; Gong, J. Tungsten oxide single crystal nanosheets for enhanced multichannel solar light harvesting. Adv. Mater. 2015, 27, 1580–1586. [Google Scholar] [CrossRef]
  41. Zhang, Q.; Li, X.; Yi, W.; Li, W.; Bai, H.; Liu, J.; Xi, G. Plasmonic MoO2 Nanospheres as a Highly Sensitive and Stable Non-Noble Metal Substrate for Multicomponent Surface-Enhanced Raman Analysis. Anal. Chem. 2017, 89, 11765–11771. [Google Scholar] [CrossRef]
  42. Xue, X.; Ruan, W.; Yang, L.; Ji, W.; Xie, Y.; Chen, L.; Song, W.; Zhao, B.; Lombardi, J.R. Surface-enhanced Raman scattering of molecules adsorbed on Co-doped ZnO nanoparticles. J. Raman. Spectrosc. 2012, 43, 61–64. [Google Scholar] [CrossRef]
  43. Liu, R.; Zhang, Y.; Duan, L.; Zhao, X. Effect of Fe2+/Fe3+ ratio on photocatalytic activities of Zn1-Fe O nanoparticles fabricated by the auto combustion method. Ceram. Int. 2020, 46, 1–7. [Google Scholar] [CrossRef]
  44. Yang, D.; Zhang, Y.; Zhang, S.; Cheng, Y.; Wu, Y.; Cai, Z.; Wang, X.; Shi, J.; Jiang, Z. Coordination between Electron Transfer and Molecule Diffusion through a Bioinspired Amorphous Titania Nanoshell for Photocatalytic Nicotinamide Cofactor Regeneration. ACS Catal. 2019, 9, 11492–11501. [Google Scholar] [CrossRef]
  45. Chithira, P.R.; Theresa John, T. Correlation among oxygen vacancy and doping concentration in controlling the properties of cobalt doped ZnO nanoparticles. J. Magn. Magn. Mater. 2020, 496, 165928. [Google Scholar] [CrossRef]
  46. Gao, H.; Yang, H.; Xu, J.; Zhang, S.; Li, J. Strongly Coupled g-C3 N4 Nanosheets-Co3O4 Quantum Dots as 2D/0D Heterostructure Composite for Peroxymonosulfate Activation. Small 2018, 14, 1801353. [Google Scholar] [CrossRef]
  47. Yang, L.; Qin, X.; Gong, M.; Jiang, X.; Yang, M.; Li, X.; Li, G. Improving surface-enhanced Raman scattering properties of TiO2 nanoparticles by metal Co doping. Spectrochim. Acta Part A Mol. Biomol. Spectrosc. 2014, 123, 224–229. [Google Scholar] [CrossRef]
  48. Yang, L.; Zhang, Y.; Ruan, W.; Zhao, B.; Xu, W.; Lombardi, J.R. Improved surface-enhanced Raman scattering properties of TiO2 nanoparticles by Zn dopant. J. Raman. Spectrosc. 2009, 48, 721–726. [Google Scholar] [CrossRef]
  49. Larsen, A.G.; Holm, A.H.; Roberson, M.; Daasbjerg, K. Substituent Effects on the Oxidation and Reduction Potentials of Phenylthiyl Radicals in Acetonitrile. J. Am. Chem. Soc. 2001, 123, 1723–1729. [Google Scholar] [CrossRef]
  50. Bai, X.; Wang, E.G.; Gao, P.; Wang, Z. Measuring the Work Function at a Nanobelt Tip and at a Nanoparticle Surface. Nano Lett. 2003, 3, 1147–1150. [Google Scholar] [CrossRef]
  51. Zhu, J.; Zheng, W.; He, B.; Zhang, J.; Anpo, M. Characterization of Fe–TiO2 photocatalysts synthesized by hydrothermal method and their photocatalytic reactivity for photodegradation of XRG dye diluted in water. J. Mol. Catal. A Chem. 2004, 216, 35–43. [Google Scholar] [CrossRef]
  52. Wu, T.; Zhu, X.; Xing, Z.; Mou, S.; Li, C.; Qiao, Y.; Liu, Q.; Luo, Y.; Shi, X.; Zhang, Y. Greatly Improving Electrochemical N2 Reduction over TiO2 Nanoparticles by Iron Doping. Angew. Chem. Int. Ed. Engl. 2019, 58, 18449–18453. [Google Scholar] [CrossRef] [PubMed]
  53. Brus, L. Noble Metal Nanocrystals: Plasmon Electron Transfer Photochemistry and Single-Molecule Raman Spectroscopy. Accounts. Chem. Res. 2008, 41, 1742–1749. [Google Scholar] [CrossRef] [PubMed]
  54. Misra, M.; Kapur, P.; Nayak, M.K.; Singla, M. Synthesis and visible photocatalytic activities of a Au@Ag@ZnO triple layer coreshell nanostructure. New J. Chem. 2014, 38, 4197–4203. [Google Scholar] [CrossRef]
  55. Haldavnekar, R.; Venkatakrishnan, K.; Tan, B. Non plasmonic semiconductor quantum SERS probe as a pathway for in vitro cancer detection. Nat. Commun. 2018, 9, 3065. [Google Scholar] [CrossRef] [PubMed] [Green Version]
  56. Naik, G.V.; Boltasseva, A. Semiconductors for plasmonics and metamaterials. Phys. Status Solidi (RRL)–Rapid Res. Lett. 2010, 4, 295–297. [Google Scholar] [CrossRef] [Green Version]
  57. Kandi, D.; Martha, S.; Thirumurugan, A.; Parida, K.M. Modification of BiOI Microplates with CdS QDs for Enhancing Stability, Optical Property, Electronic Behavior toward Rhodamine B Decolorization, and Photocatalytic Hydrogen Evolution. J. Phys. Chem. C. 2017, 121, 4834–4849. [Google Scholar] [CrossRef]
  58. Kandi, D.; Martha, S.; Thirumurugan, A.; Parida, K.M. CdS QDs-Decorated Self-Doped gamma-Bi2MoO6: A Sustainable and Versatile Photocatalyst toward Photoreduction of Cr(VI) and Degradation of Phenol. ACS Omega 2017, 2, 9040–9056. [Google Scholar] [CrossRef] [Green Version]
  59. Xiong, W.; Zhao, Q.; Li, X.; Wang, L. Multifunctional Plasmonic Co-Doped Fe2O3@polydopamine-Au for Adsorption, Photocatalysis, and SERS-based Sensing. Part. Part. Syst. Charact. 2016, 33, 602–609. [Google Scholar] [CrossRef]
  60. Yong-ning, H.; Shi-guang, S.; Wuyuan, C.; Xin, L.; Chang-chun, Z.; Xun, H. Investigation of luminescence properties of ZnO nanowires at room temperature. Microelectron. J. 2009, 40, 517–519. [Google Scholar] [CrossRef]
  61. Corro, G.; Flores, J.A.; Pacheco-Aguirre, F.; Pal, U.; Banuelos, F.; Torralba, R.; Olivares-Xometl, O. Effect of the Electronic State of Cu, Ag, and Au on Diesel Soot Abatement: Performance of Cu/ZnO, Ag/ZnO, and Au/ZnO Catalysts. ACS Omega 2019, 4, 5795–5804. [Google Scholar] [CrossRef] [PubMed] [Green Version]
  62. Busgen, T.; Hilgendorff, M.; Irsen, S. Colloidal Cobalt-Doped ZnO Nanorods: Synthesis, Structural, and Magnetic Properties. J. Phys. Chem. C. 2008, 112, 2412–2417. [Google Scholar] [CrossRef]
  63. Zhang, J.; Liu, X.; Wu, S.; Cao, B.; Zheng, S. One-pot synthesis of Au-supported ZnO nanoplates with enhanced gas sensor performance. Sens. Actuators B 2012, 169, 61–66. [Google Scholar] [CrossRef]
  64. Deka, S.; Joy, P.A. Electronic structure and ferromagnetism of polycrystalline Zn1−xCoxO (0 ≤ x ≤ 0.15). Solid State Commun. 2005, 134, 665–669. [Google Scholar] [CrossRef]
  65. Kim, K.-C.; Kim, E.-K.; Kim, Y.-S. Growth and physical properties of sol–gel derived Co doped ZnO thin film. Superlattices Microstruct. 2007, 42, 246–250. [Google Scholar] [CrossRef]
  66. Wu, H.; Pan, S.; Poeppelmeier, K.R.; Li, H.; Jia, D.; Chen, Z.; Fan, X.; Yang, Y.; Rondinelli, J.M.; Luo, H. K3B6O10Cl: A new structure analogous to perovskite with a large second harmonic generation response and deep UV absorption edge. J. Am. Chem. Soc. 2011, 133, 7786–7790. [Google Scholar] [CrossRef] [PubMed]
  67. Yang, L.; Peng, Y.; Yang, Y.; Liu, J.; Huang, H.; Yu, B.; Zhao, J.; Lu, Y.; Huang, Z.; Li, Z. A Novel Ultra-Sensitive Semiconductor SERS Substrate Boosted by the Coupled Resonance Effect. Adv. Sci. 2019, 6, 1900310. [Google Scholar] [CrossRef] [Green Version]
  68. Ly, D.; Mayrhofer, S.; Schmidt, J.M.; Zitz, U.; Domig, K.J. Biogenic Amine Contents and Microbial Characteristics of Cambodian Fermented Foods. Foods 2020, 9, 198. [Google Scholar] [CrossRef] [Green Version]
  69. Rawles, D.D.; Flick, G.J.; Martin, R.E. Biogenic Amines in Fish and Shellfish. Adv. Food Nutr. Res. 1996, 39, 329–365. [Google Scholar] [CrossRef]
  70. Herrero, A.; Sanllorente, S.; Reguera, C.; Ortiz, M.C.; Sarabia, L.A. A new multiresponse optimization approach in combination with a D-Optimal experimental design for the determination of biogenic amines in fish by HPLC-FLD. Anal. Chim. Acta 2016, 945, 31–38. [Google Scholar] [CrossRef]
  71. Guo, K.; Ji, C.; Differentia, L.L. Differential 12C-/13C-Isotope Dansylation Labeling and Fast Liquid Chromatography/Mass Spectrometry for Absolute and Relative Quantification of the Metabolome. Anal. Chim. 2009, 81, 3919. [Google Scholar] [CrossRef] [PubMed]
  72. Lulinski, P.; Janczura, M.; Sobiech, M.; Giebultowicz, J. Magnetic Molecularly Imprinted Nano-Conjugates for Effective Extraction of Food Components-A Model Study of Tyramine Determination in Craft Beers. Int. J. Mol. Sci. 2021, 22, 9560. [Google Scholar] [CrossRef]
  73. Dong, F. Electrochemical non-enzymatic biosensor for tyramine detection in food based on silver-substituted ZnO nano-flower modified glassy carbon electrode. Int. J. Electrochem. Sci. 2021, 16, 210234. [Google Scholar] [CrossRef]
  74. Chakkarapani, L.D.; Brandl, M. Highly Sensitive Electrochemical Detection of Tyramine Using a Poly(Toluidine Blue)-Modified Carbon Screen-Printed Electrode. IEEE Sens. J. 2022, 22, 2974–2983. [Google Scholar] [CrossRef]
  75. Kaewjua, K.; Siangproh, W. A novel tyramine sensing-based polymeric L-histidine film-coated screen-printed graphene electrode: Capability for practical applications. Electrochim. Acta 2022, 419, 140388. [Google Scholar] [CrossRef]
Figure 1. XRD patterns of ZnO and Co-ZnO.
Biosensors 12 01148 g001
Figure 2. Proposed band structures of the Co400-ZnO (A) and Co400-ZnO/Au (B).
Biosensors 12 01148 g002
Figure 3. (AC) TEM images of Co400-ZnO/Au at different scales. (D) Representative high-resolution TEM images at the interface of Co400-ZnO/Au (the regions indexed below the TEM image correspond to the marked areas by numbers 1–6).
Biosensors 12 01148 g003
Figure 4. EDX elemental mappings of Co400-ZnO/Au: The overlaid image (A) from (BD), and Zn (B), Co (C), and Au (D).
Biosensors 12 01148 g004
Figure 5. XPS spectra of (A) XPS survey spectrum of Co400-ZnO/Au, (B) Zn 2p, (C) Co 2p, and (D) Au 4f for Co400-ZnO/Au.
Biosensors 12 01148 g005
Figure 6. Electromagnetic field enhancement of ZnO, Co−ZnO, and Co−ZnO/Au nanostructures by using finite difference time domain simulations: (AC) ZnO structure in xy axial under 532 nm laser; (DF) Co−ZnO structure in xy axial under 633 nm laser; (GI) ZnO structure in xy axial under 785 nm laser.
Biosensors 12 01148 g006
Figure 7. (A) Concentration-dependent SERS spectra of tyramine recorded on Co400-ZnO/Au substrate. (B) Calibration plot based on Raman intensity at 1208 cm−1.
Biosensors 12 01148 g007
Figure 8. Concentration-dependent SERS spectra of tyramine in beer on Co400−ZnO/Au substrate.
Biosensors 12 01148 g008
Table 1. Detection recovery of tyramine in Beer by Co400-ZnO/Au-based SERS.
SamplesADD
(umol/L)
SERS (M)
(umol/L)
Recovery
(%) ± SD
11010.23102.33 ± 1.03
210.91291.20 ± 5.05
30.3160.338107.15 ± 1.84
40.10.09595.50 ± 0.29
Table 2. Comparison with other methods for the determination of Tyramine.
MethodSubstratesLinear Range
(moL/L)
LOD
(moL/L)
Real
Sample
Reference
RamanCo400-ZnO/Au10−5–10−81 × 10−8BeerThis work
Molecularly ImprintedFe3O4@SiO2-MPS@MIP5.4 × 10−4–1 × 10−61.8 × 10−7Beer[72]
ElectrochemistryAg-substituted ZnO modified GCE9 × 10−4–1 × 10−62.72 × 10−7Beer[73]
Electrochemistrypoly-TB
modified carbon SPE
2.7 × 10⁻⁴–2 × 10−82 × 10−8-[74]
Electrochemistrypoly(His)/SPGE2 × 10−5–5 × 10−72.2 × 10−7Cheese[75]
Publisher’s Note: MDPI stays neutral with regard to jurisdictional claims in published maps and institutional affiliations.

