Alprazolam Detection Using an Electrochemical Nanobiosensor Based on AuNUs/Fe-Ni@rGO Nanocomposite

 , , and
Abstract
:1. Introduction
2. Materials and Methods
2.1. Chemicals
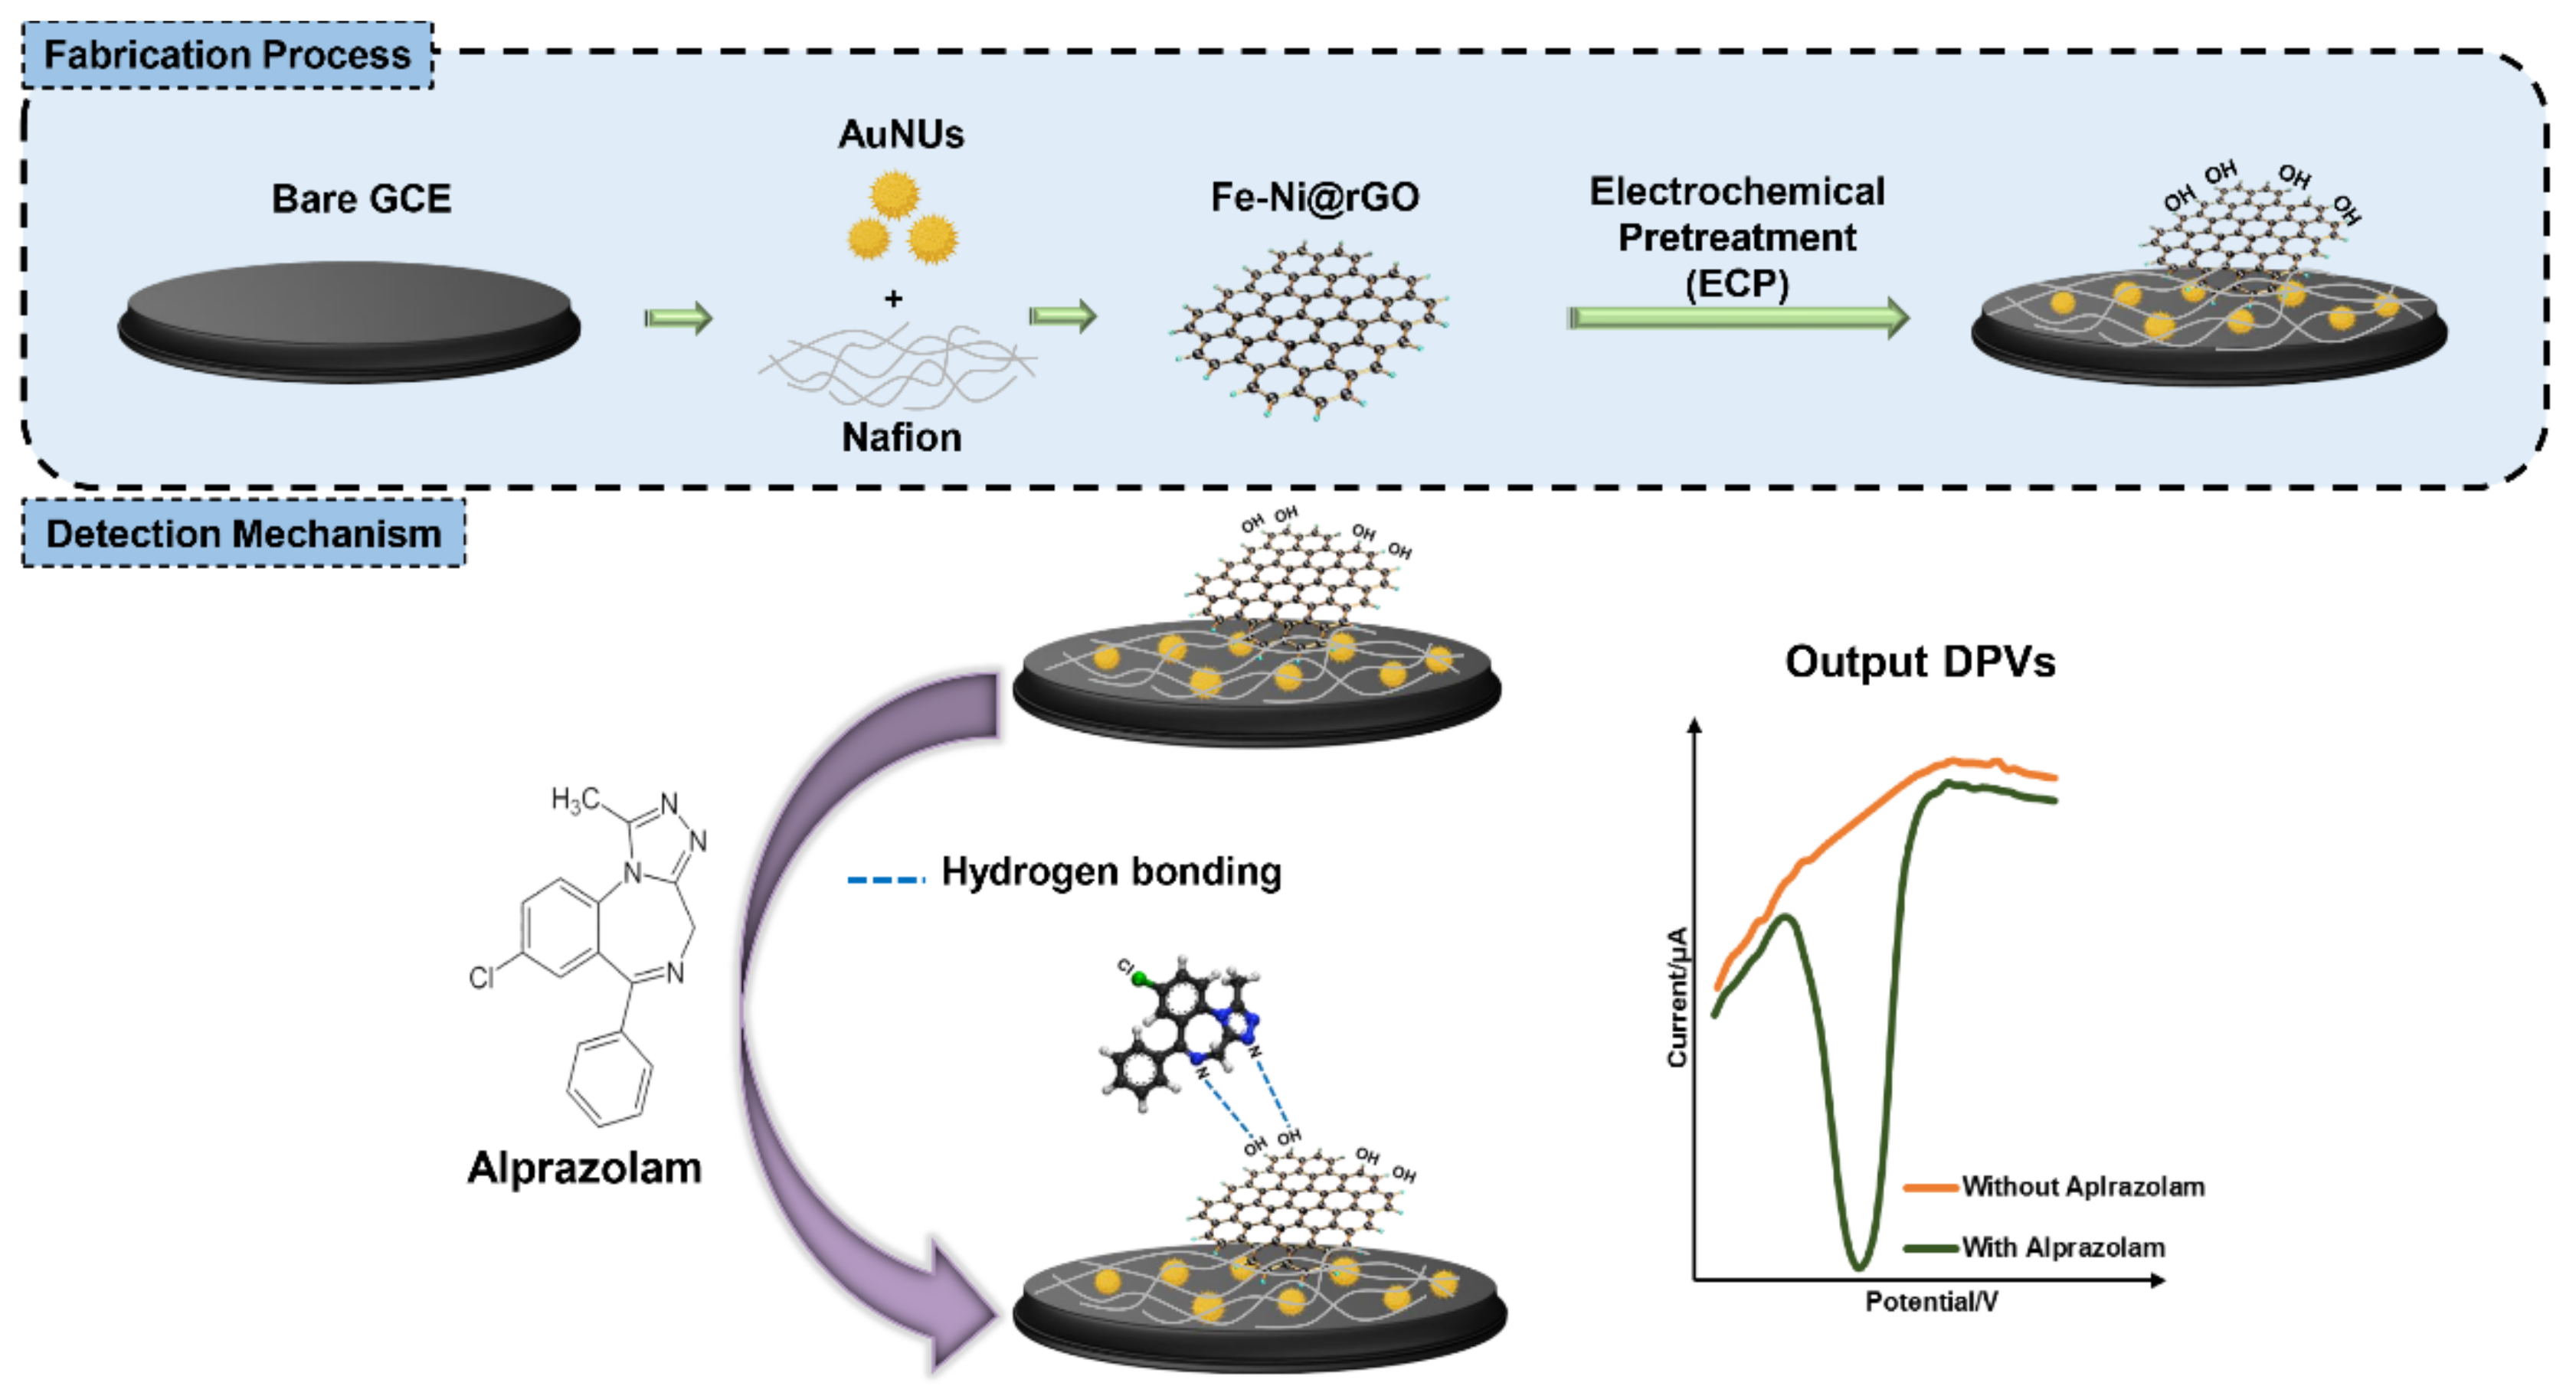
2.2. Electrode Surface Cleaning and Modification
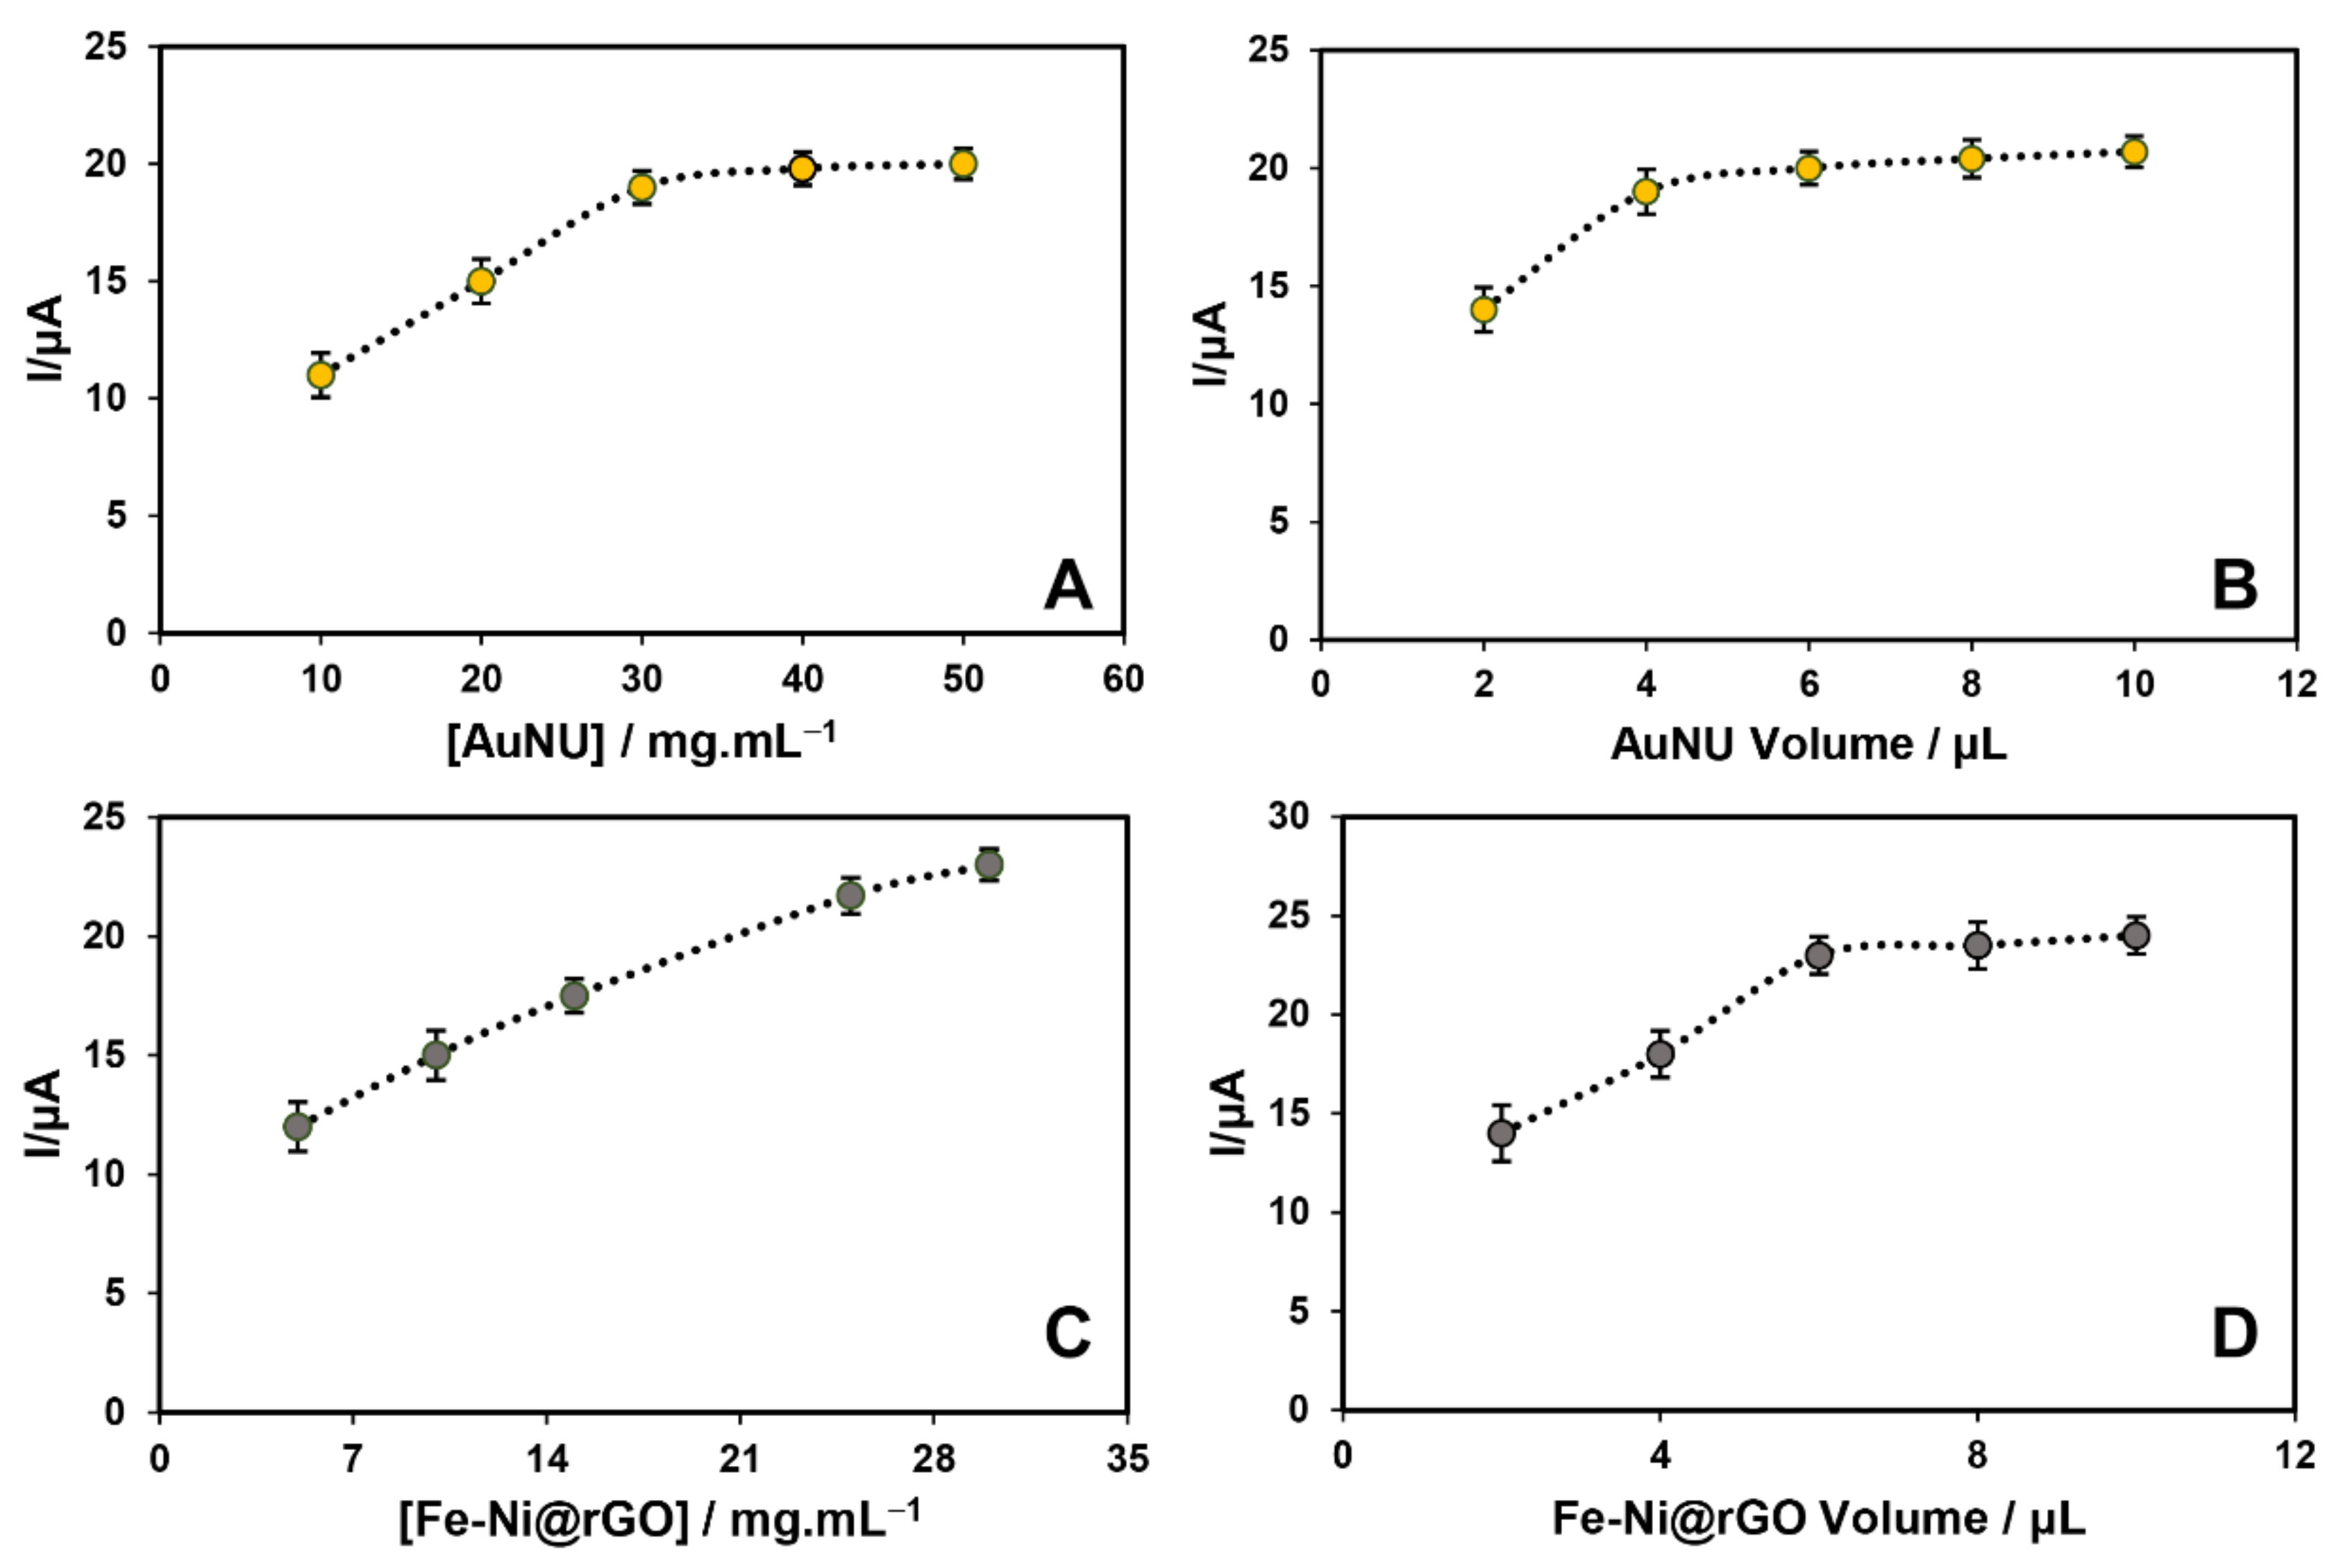
2.3. Optimization Method
2.4. Electrochemical Measurements
2.5. Characterization and Assessment Methods
3. Results and Discussion
3.1. Optimization Results
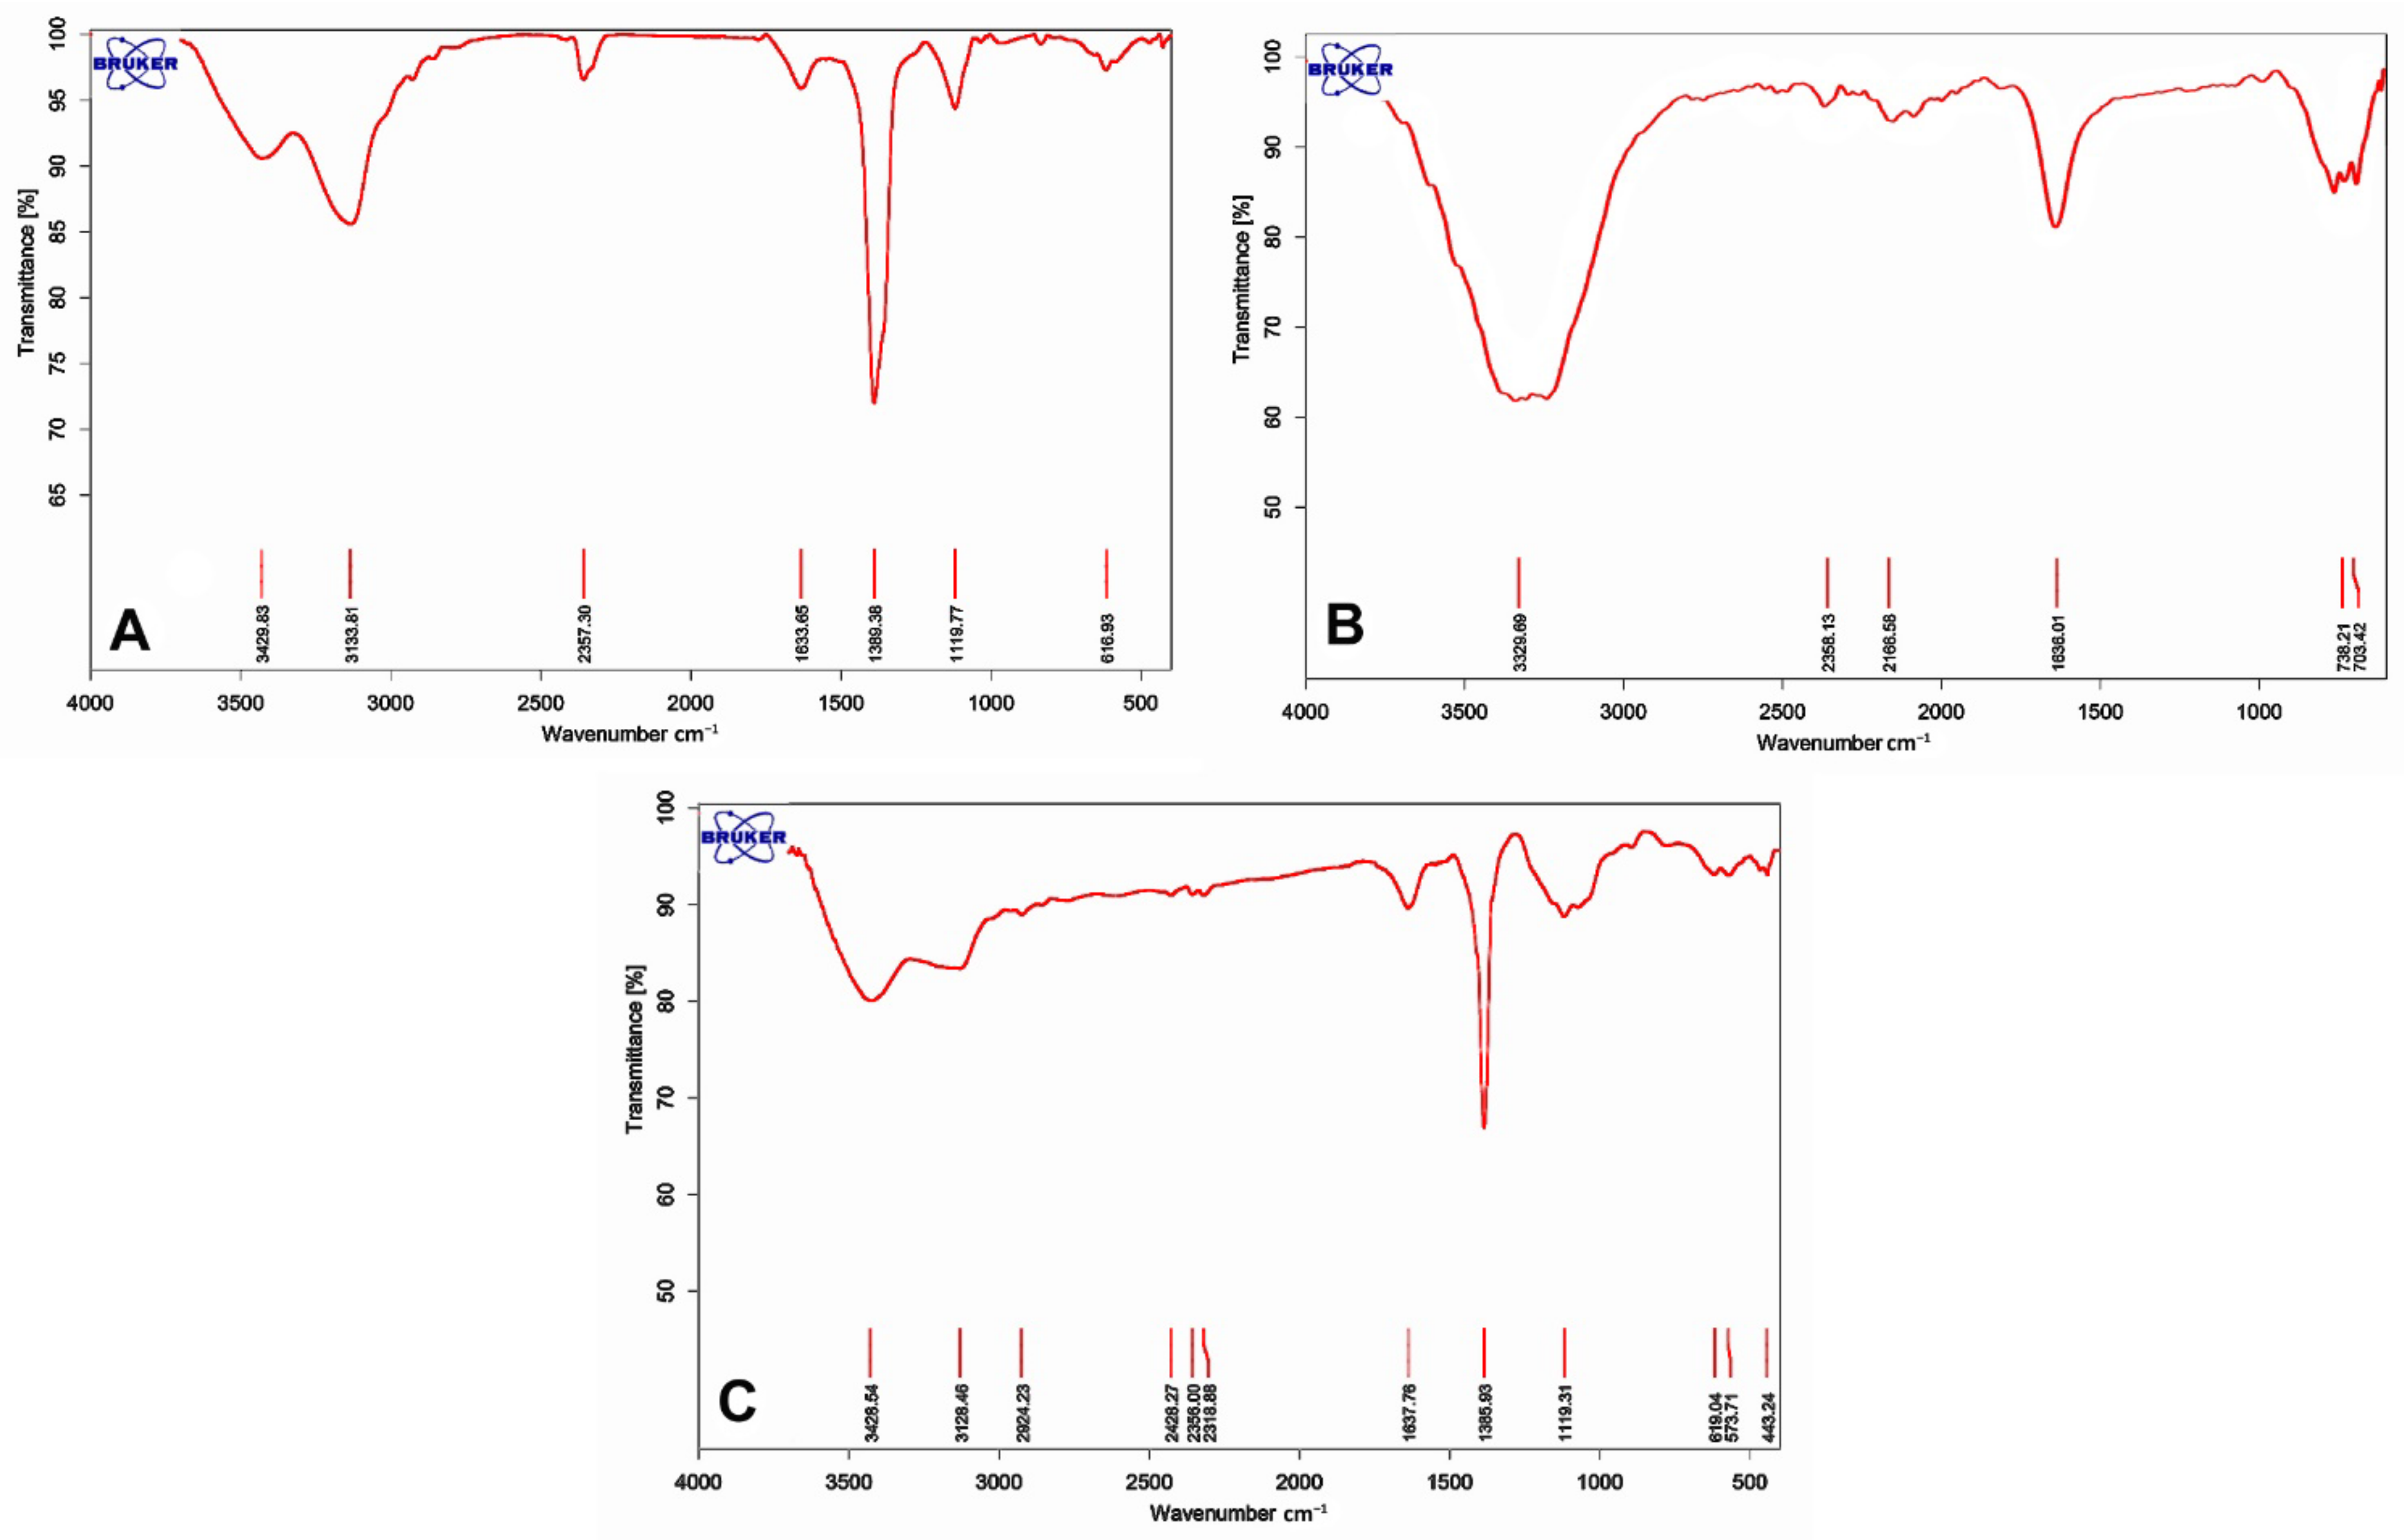
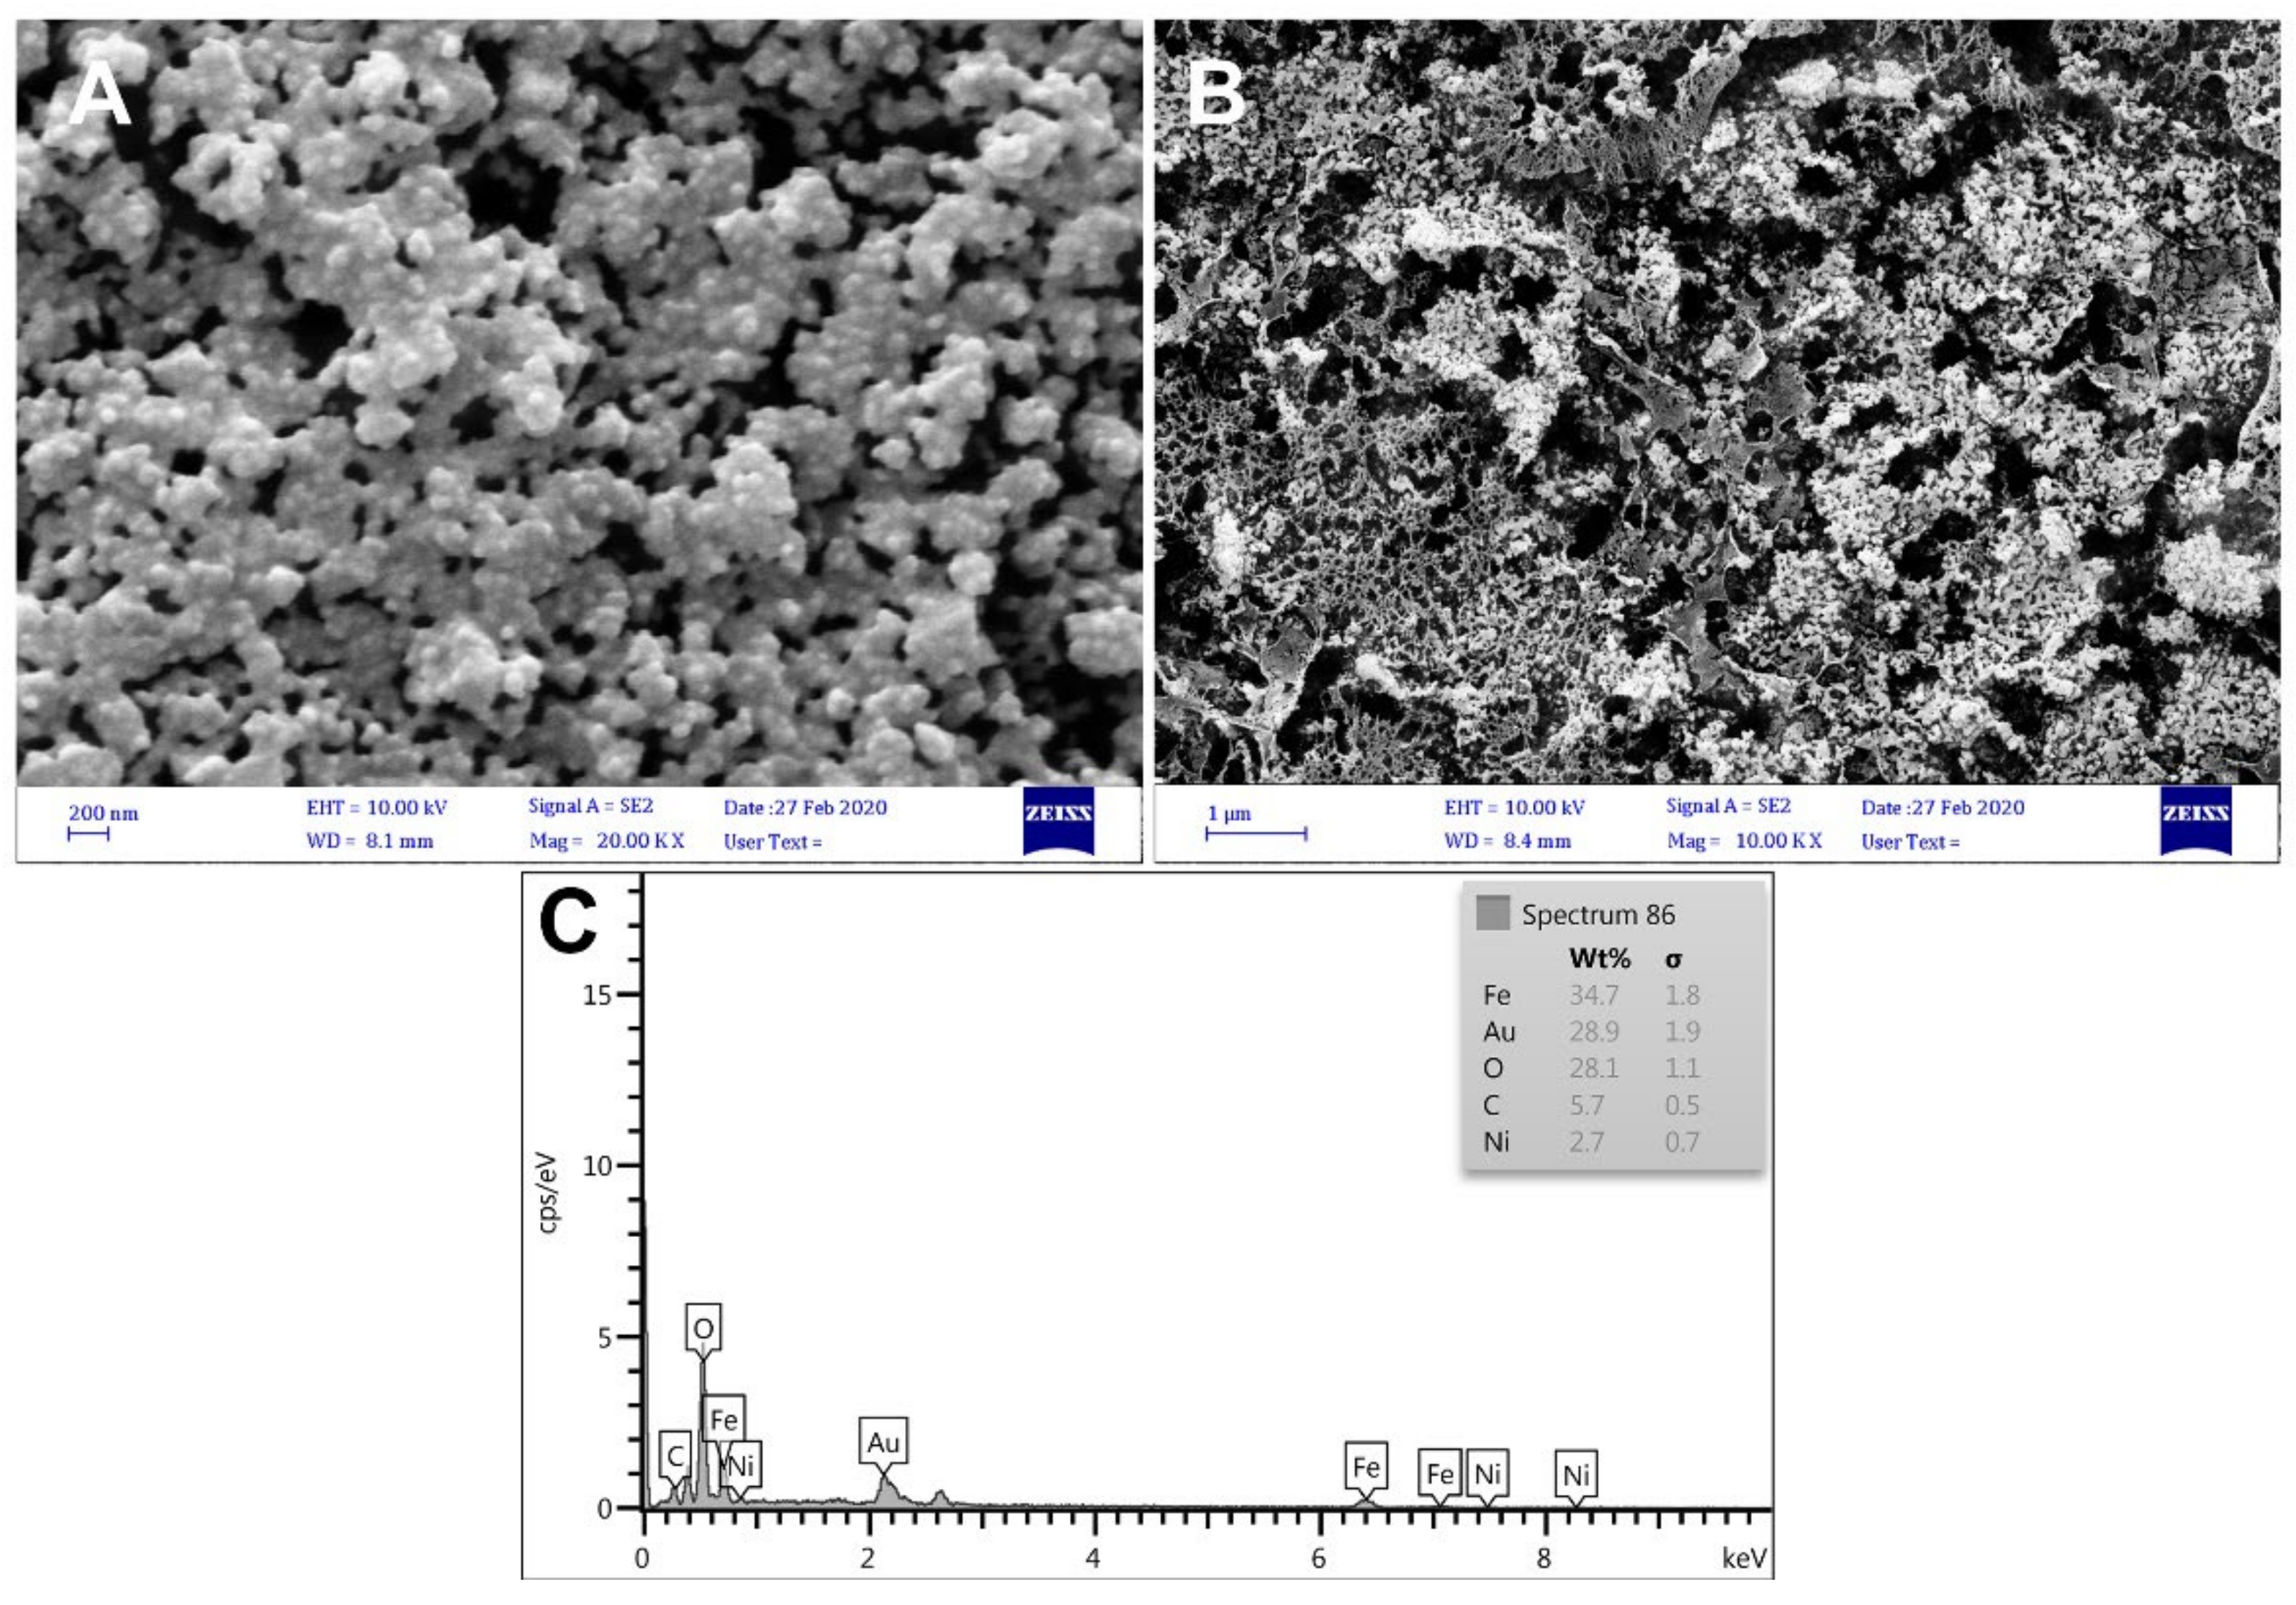
3.2. Characterization Results
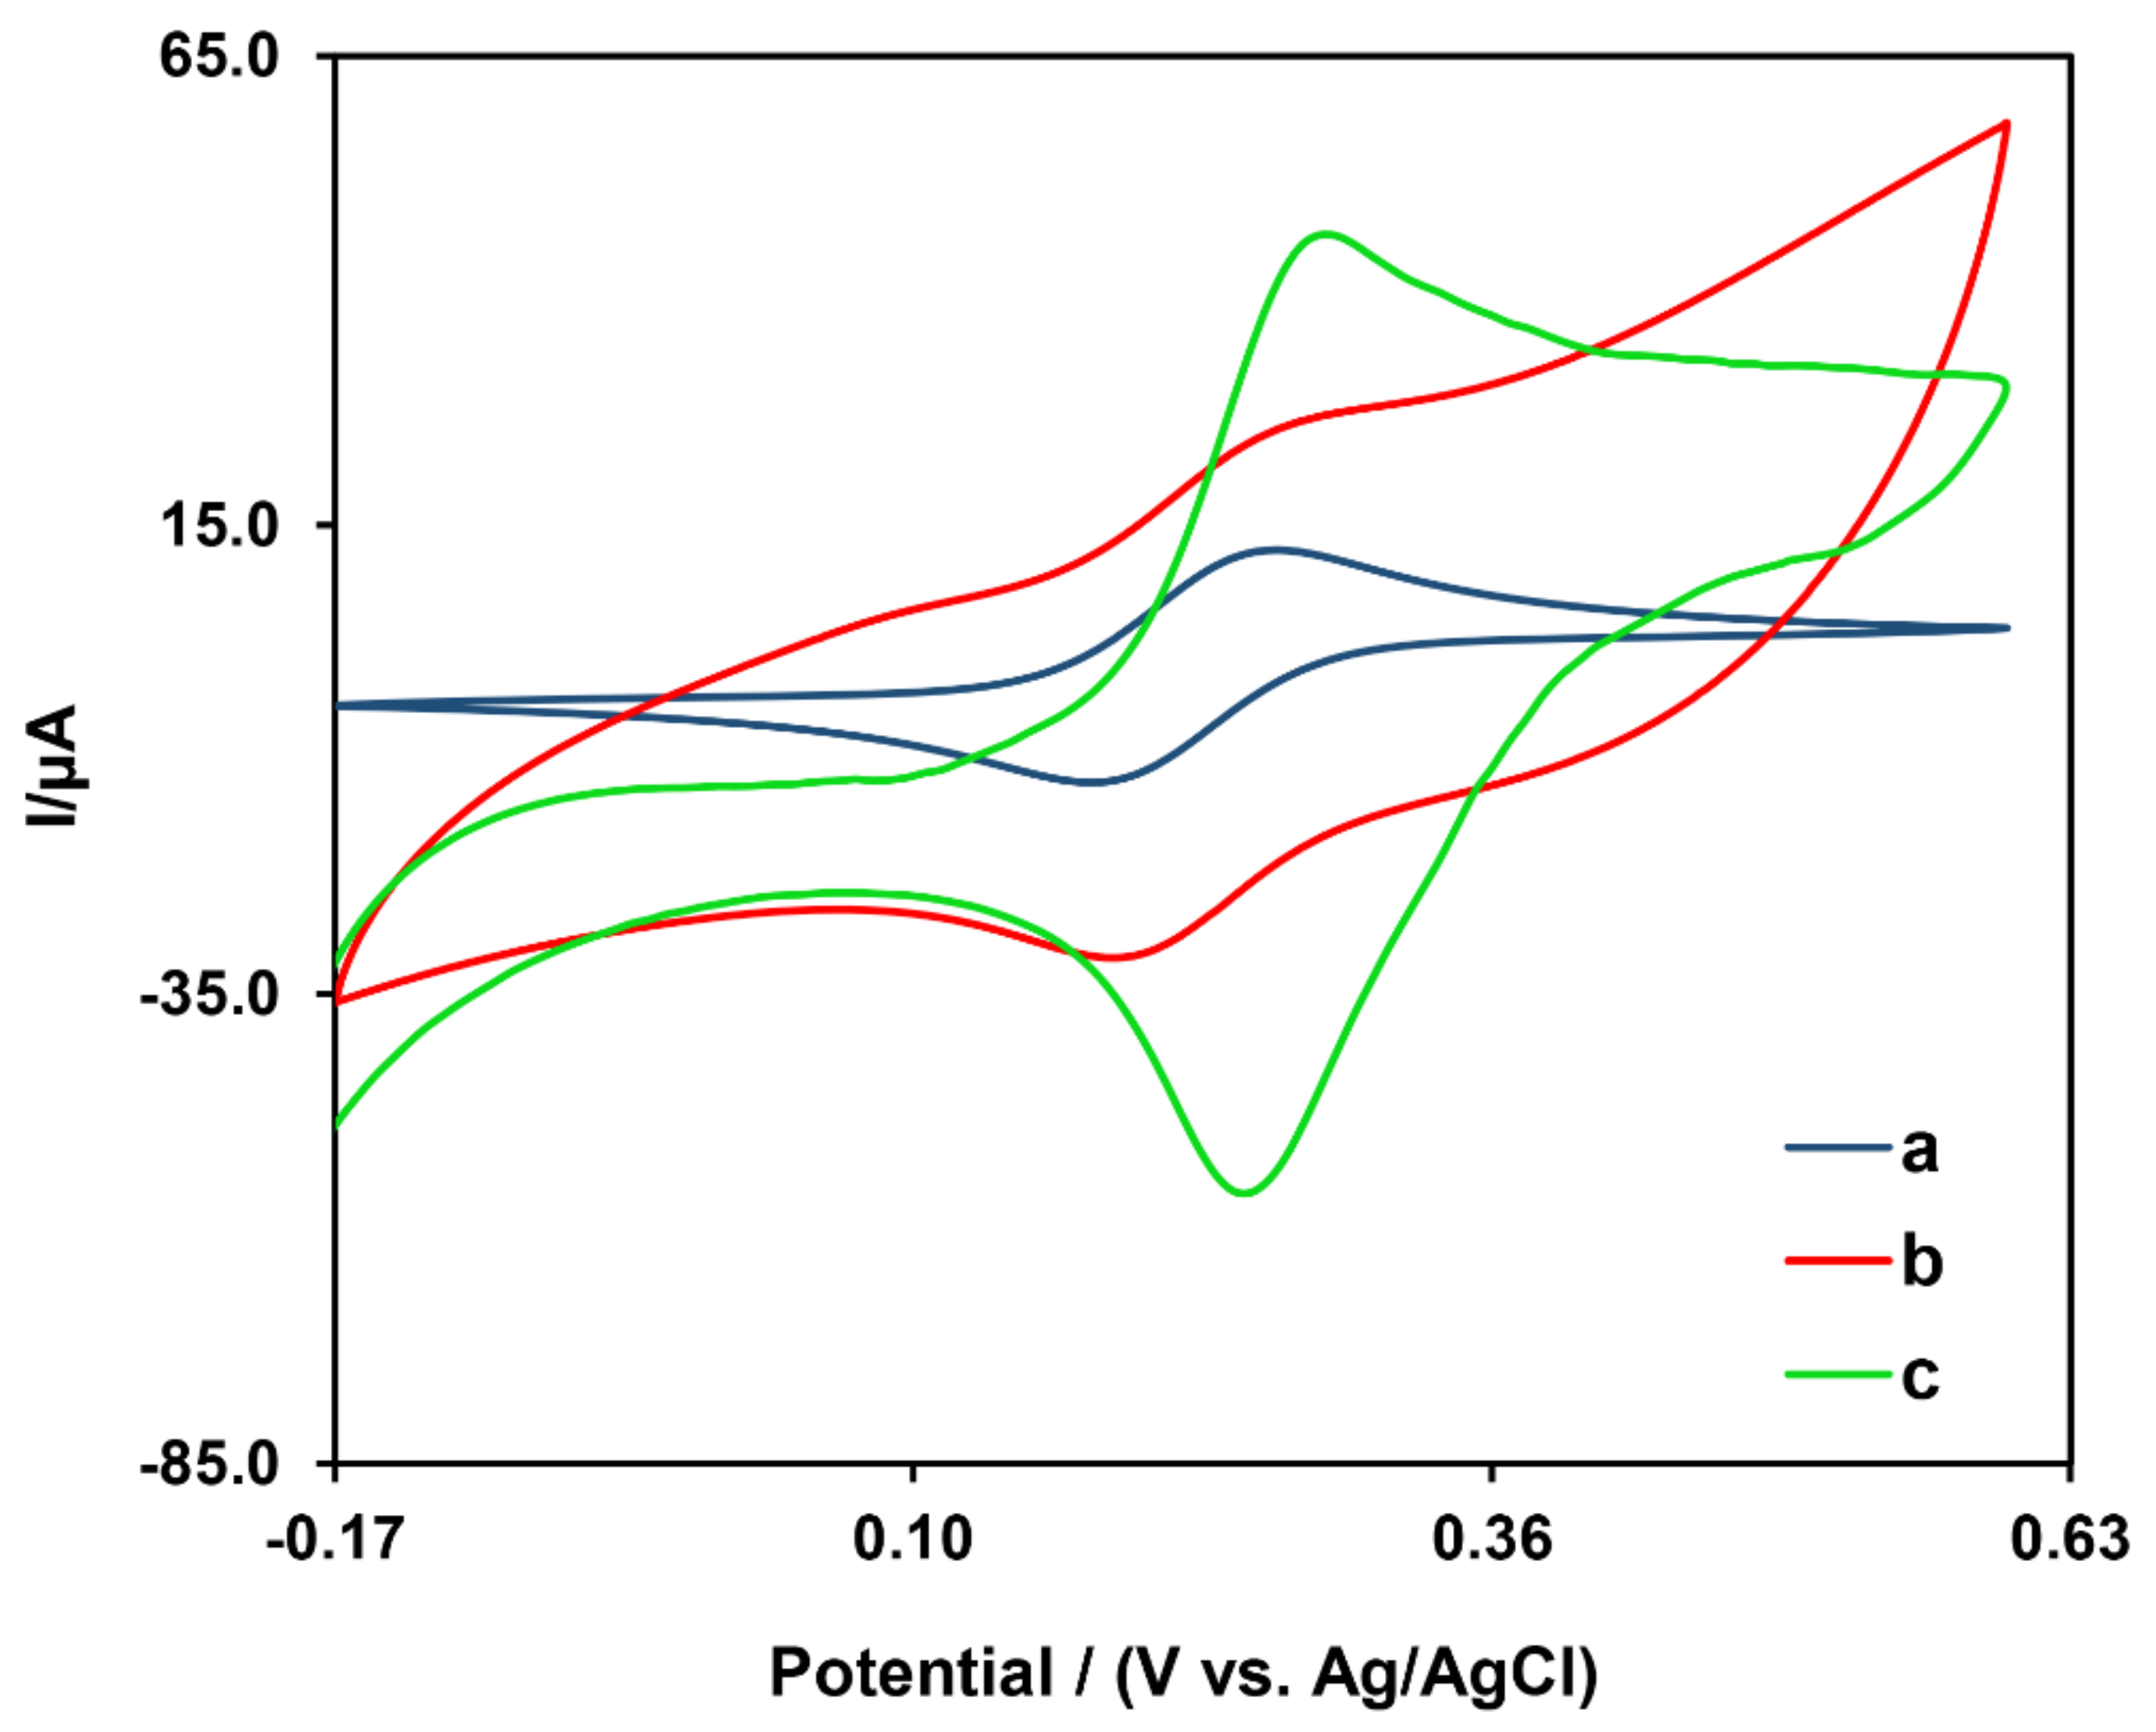
3.3. Electrochemical Behavior

| Electrode | Detection Method | Linear Range | LOD | Ref. |
|---|---|---|---|---|
| Electrochemical Methods | ||||
| GCE | EIS | 0.1 to 4 and 4 to 20 mg/L | 0.03 mg/L | [21] |
| Carbon paste electrode | DPV | [28] | ||
| Boron-doped diamond electrodes | DPV | 8 × 10⁻⁷–1 × 10⁻⁴ M | 6.4 × 10⁻⁷ M | [29] |
| PVC membrane and carbon paste electrodes | Potentiometric | PVC: 1.0 × 10⁻⁶–1.0 × 10⁻² M CPE: 1.0 × 10⁻⁶–1.0 × 10⁻² M | 1.0 × 10⁻⁶ M | [49] |
| Meniscus-modified silver solid amalgam electrode | DPV | 0.185–30.9 mg/L | 0.155 mg/L | [54] |
| Gold electrode | DPV SWV | DPV: 56–156 μM SWV: 73–192 μM | LLOQ of DPV: 56 μM LLOQ of SWV: 73 μM | [52] |
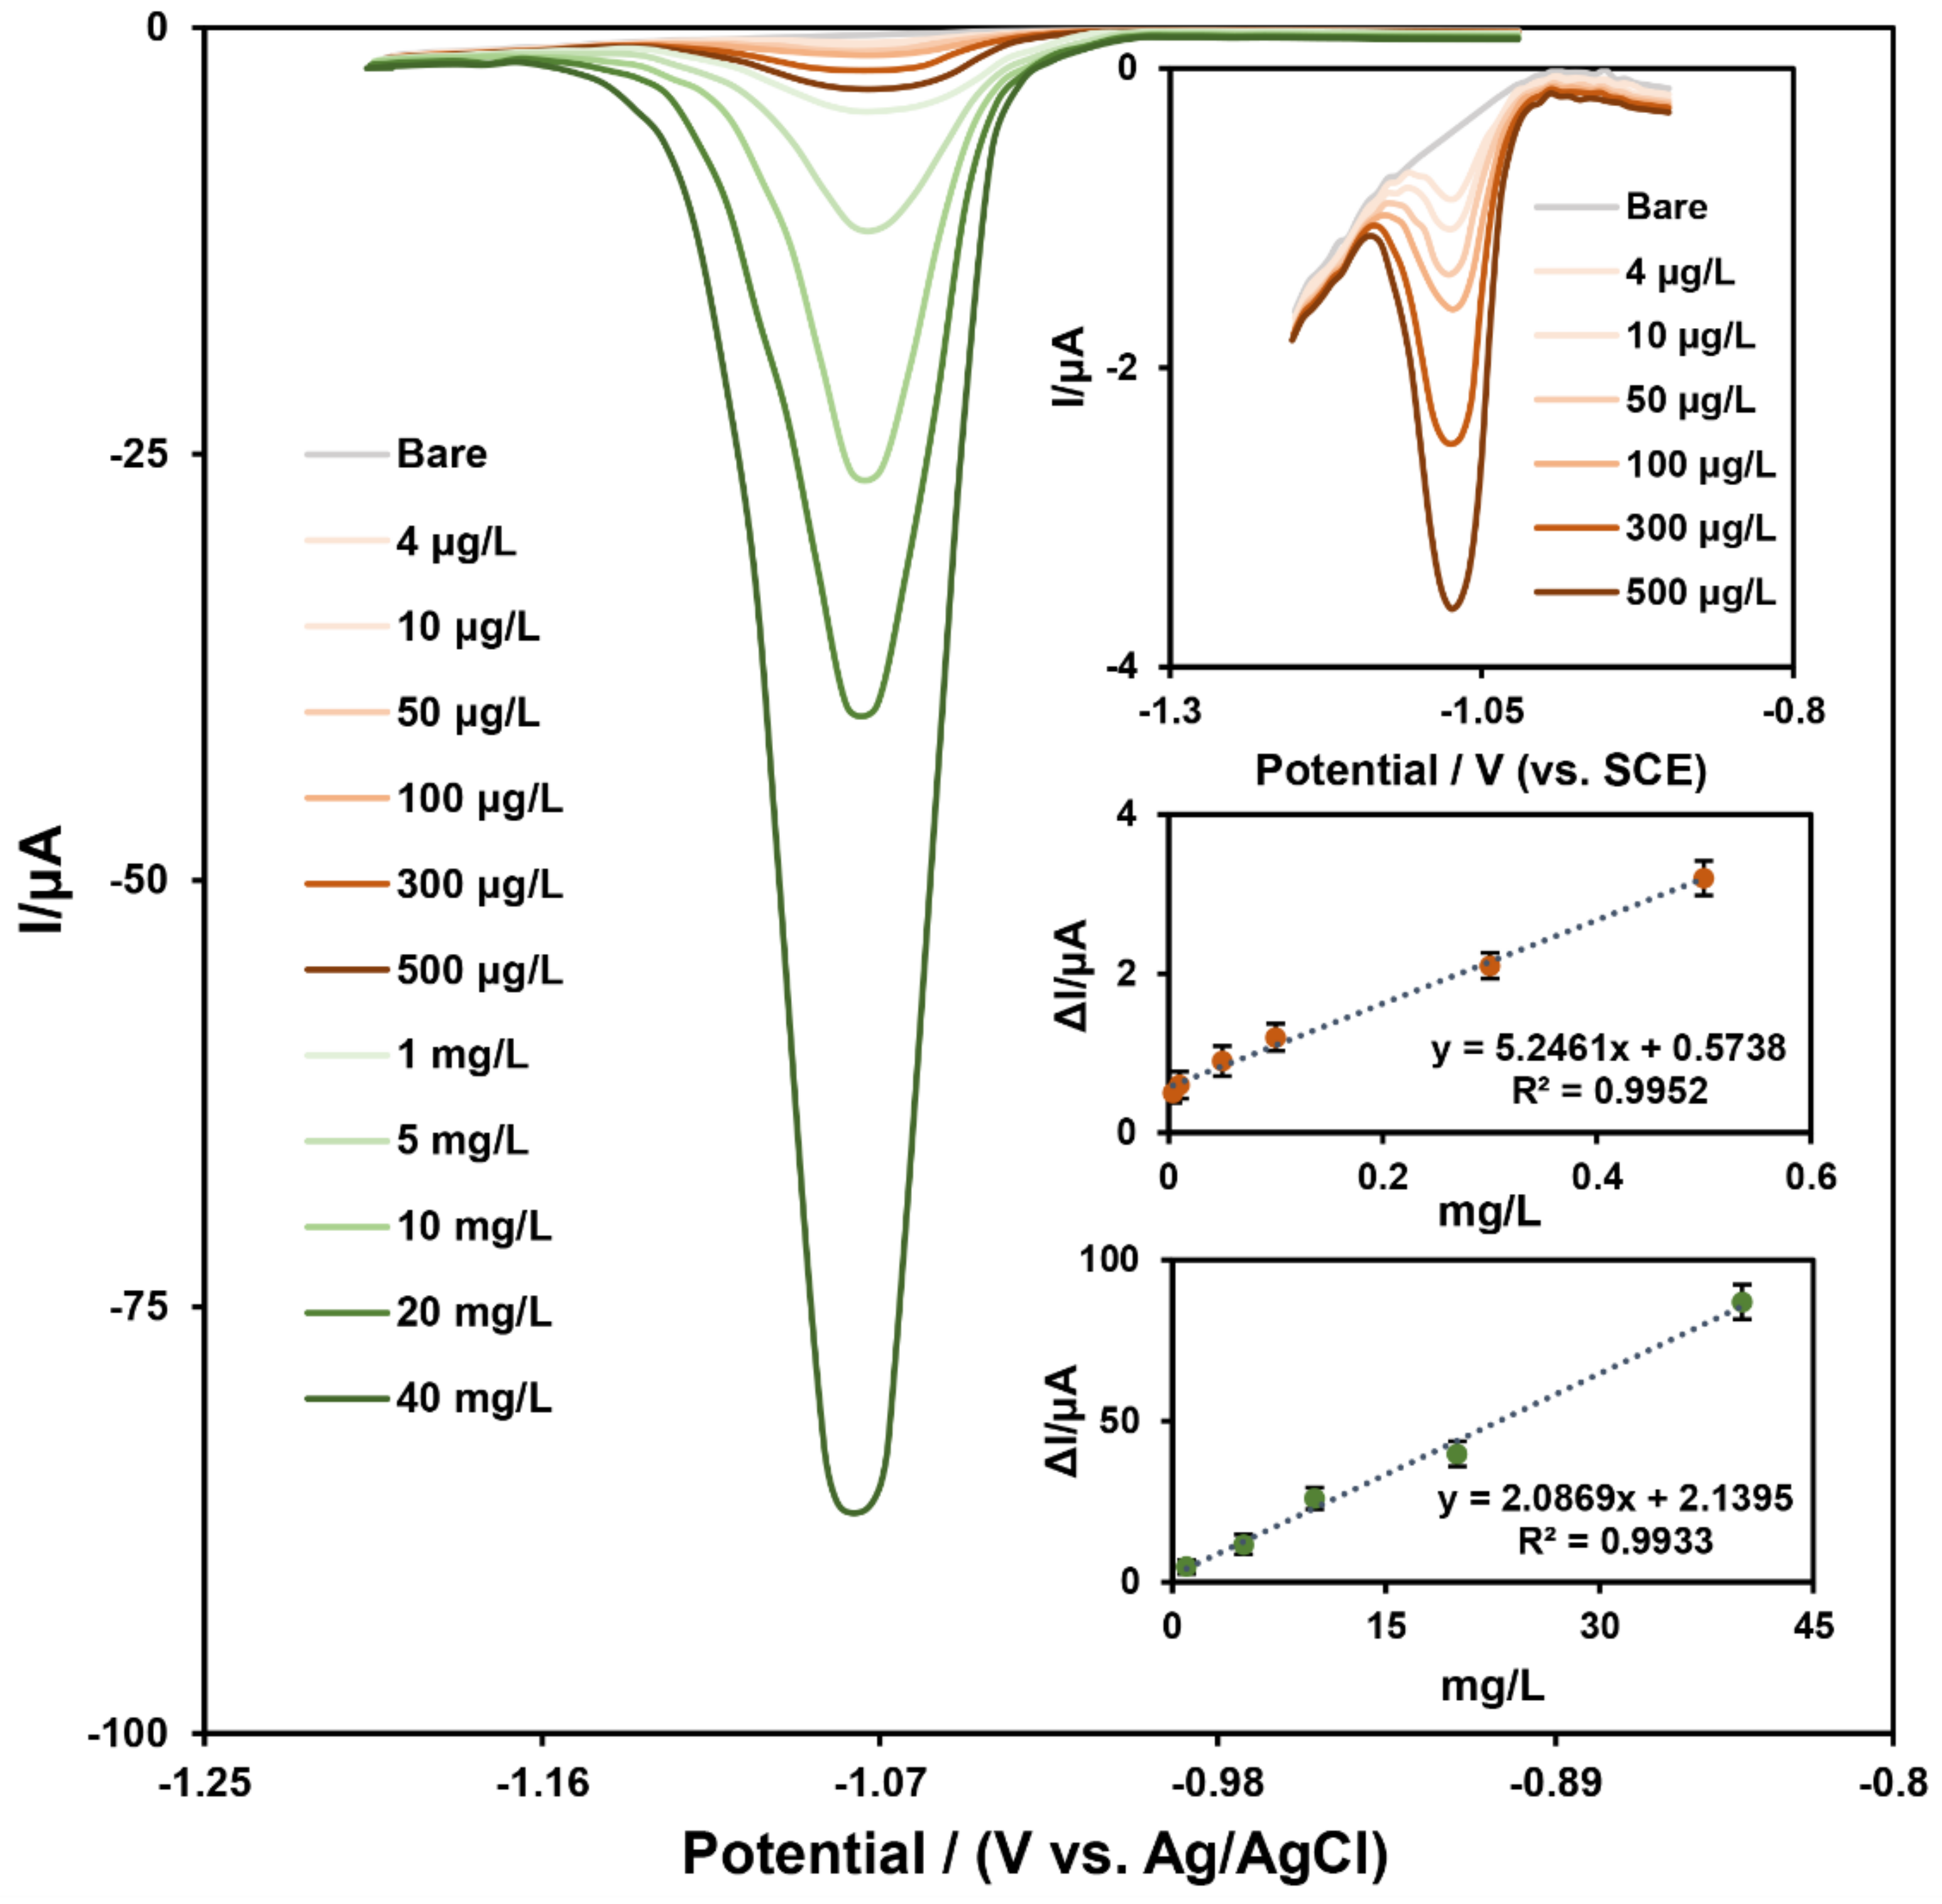
| GCE | DPV | 4 to 500 µg L−1 and 1 to 50 mg L−1 | 1 µg L−1 | This work |
| Other methods | ||||
| - | GC-MS | 50–1000 mg L−1 | 7.00 mg L−1 | [55] |
| - | GC-MS | 5–100 ng/mL | 1.25 ng/mL | [56] |
| - | UV visible spectrometry | 1.00–20.0 mg L−1 | 0.400 mg L−1 | [57] |
| - | HPLC | - | LOD: 0.01 ng/μL LQD: 0.03 ng/μL | [58] |
| - | HPLC | 18 to 200 ng/mL | 18 ng/ml | [53] |
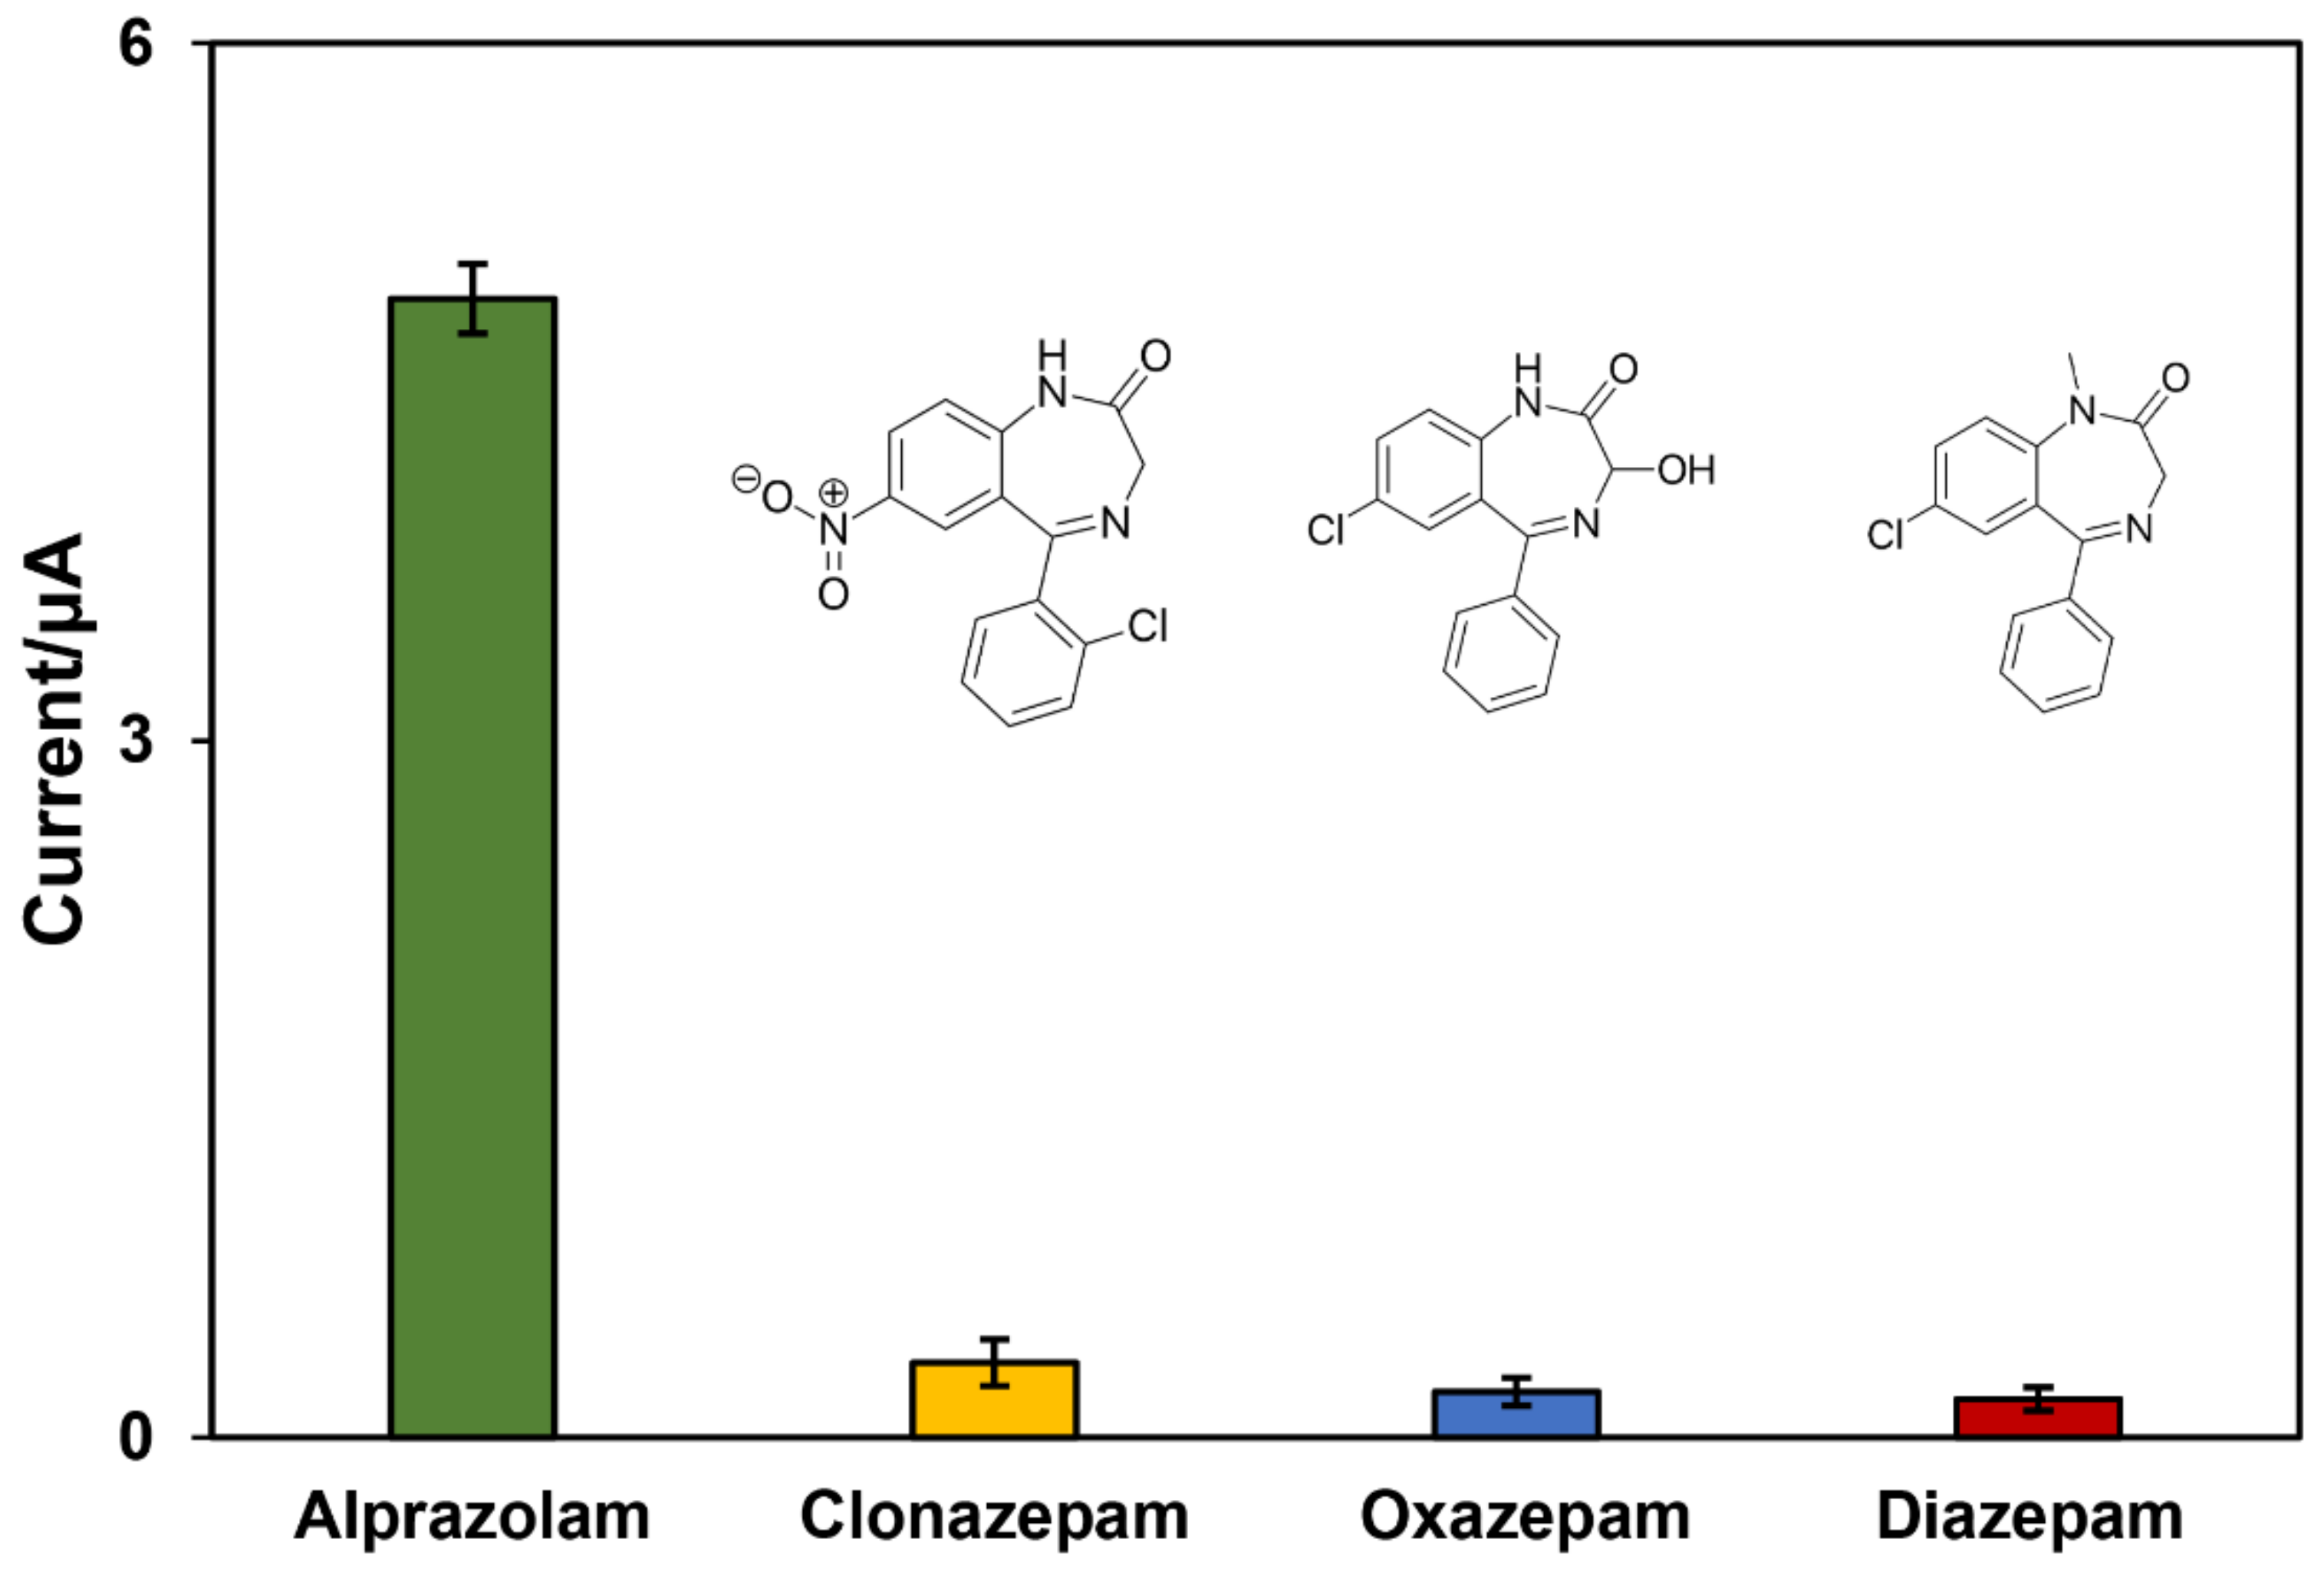
3.4. Reproducibility, Stability, and Selectivity
3.5. Real Sample
4. Conclusions
Supplementary Materials
Author Contributions
Funding
Institutional Review Board Statement
Informed Consent Statement
Data Availability Statement
Acknowledgments
Conflicts of Interest
References
- Griffin, C.E.; Kaye, A.M.; Bueno, F.R.; Kaye, A.D. Benzodiazepine pharmacology and central nervous system–mediated effects. Ochsner J. 2013, 13, 214–223. [Google Scholar] [PubMed]
- Wick, J. The history of benzodiazepines. Consult. Pharm. 2013, 28, 538–548. [Google Scholar] [CrossRef] [PubMed]
- Donoghue, J.; Lader, M. Usage of benzodiazepines: A review. Int. J. Psychiatry Clin. Pract. 2010, 14, 78–87. [Google Scholar] [CrossRef]
- Ait-Daoud, N.; Hamby, A.S.; Sharma, S.; Blevins, D. A Review of Alprazolam Use, Misuse, and Withdrawal. J. Addict. Med. 2017, 12, 4–10. [Google Scholar] [CrossRef] [Green Version]
- Sarangi, A.; McMahon, T.; Gude, J. Benzodiazepine Misuse: An Epidemic Within a Pandemic. Cureus 2021, 13, e15816. [Google Scholar] [CrossRef] [PubMed]
- Westbury, J.; Jackson, S.; Gee, P.; Peterson, G. An effective approach to decrease antipsychotic and benzodiazepine use in nursing homes: The RedUSe project. Int. Psychogeriatr. 2009, 22, 26–36. [Google Scholar] [CrossRef] [Green Version]
- Madhusoodanan, S.; Bogunovic, O.J. Safety of benzodiazepines in the geriatric population. Expert Opin. Drug Saf. 2004, 3, 485–493. [Google Scholar] [CrossRef]
- Madea, B.; Musshoff, F. Knock-out drugs: Their prevalence, modes of action, and means of detection. Dtsch. Ärzteblatt Int. 2009, 106, 341–347. [Google Scholar]
- Qriouet, Z.; Qmichou, Z.; Bouchoutrouch, N.; Mahi, H.; Cherrah, Y.; Sefrioui, H. Analytical methods used for the detection and quantification of benzodiazepines. J. Anal. Methods Chem. 2019, 2019, 2035492. [Google Scholar] [CrossRef] [Green Version]
- Papoutsis, I.I.; Athanaselis, S.A.; Nikolaou, P.D.; Pistos, C.M.; Spiliopoulou, C.A.; Maravelias, C.P. Development and validation of an EI-GC-MS method for the determination of benzodiazepine drugs and their metabolites in blood: Applications in clinical and forensic toxicology. J. Pharm. Biomed. Anal. 2010, 52, 609–614. [Google Scholar] [CrossRef]
- Karlonas, N.; Padarauskas, A.; Ramanavicius, A.; Ramanaviciene, A. Mixed-mode SPE for a multi-residue analysis of benzodiazepines in whole blood using rapid GC with negative-ion chemical ionization MS. J. Sep. Sci. 2013, 36, 1437–1445. [Google Scholar] [CrossRef] [PubMed]
- Di Corcia, D.; Lisi, S.; Pirro, V.; Gerace, E.; Salomone, A.; Vincenti, M. Determination of pharmaceutical and illicit drugs in oral fluid by ultra-high performance liquid chromatography–tandem mass spectrometry. J. Chromatogr. B 2013, 927, 133–141. [Google Scholar] [CrossRef]
- Piergiovanni, M.; Cappiello, A.; Famiglini, G.; Termopoli, V.; Palma, P. Determination of benzodiazepines in beverages using green extraction methods and capillary HPLC-UV detection. J. Pharm. Biomed. Anal. 2018, 154, 492–500. [Google Scholar] [CrossRef] [PubMed]
- Segura, M.; Barbosa, J.; Torrens, M.; Farré, M.; Castillo, C.; Segura, J.; de la Torre, R. Analytical methodology for the detection of benzodiazepine consumption in opioid-dependent subjects. J. Anal. Toxicol. 2001, 25, 130–136. [Google Scholar] [CrossRef] [PubMed] [Green Version]
- Molnár-Perl, I. Simultaneous quantitation of acids and sugars by chromatography: Gas or high-performance liquid chromatography? J. Chromatogr. A 1999, 845, 181–195. [Google Scholar] [CrossRef]
- French, D.; Stone, J.A.; Chang, J.S.; Wu, A.H. Choosing the right benzodiazepine assay: Impact on clinical decision making. Lab. Med. 2010, 41, 196–200. [Google Scholar] [CrossRef] [Green Version]
- Melanson, S.E.; Griggs, D.; Bixho, I.; Khaliq, T.; Flood, J.G. 7-Aminoclonazepam is superior to clonazepam for detection of clonazepam use in oral fluid by LC–MS/MS. Clin. Chim. Acta 2016, 455, 128–133. [Google Scholar] [CrossRef]
- Shweta, D.; Kesharvani, L.; Gupta, A.K.; Mishra, M.K. Analysis of Suspected Seized Sample of NDPS Drugs (Benzodiazepines) through GLC & TLC using Different Solvent System. Indian J. Forensic Med. Toxicol. 2015, 9, 150–154. [Google Scholar]
- Thangaduraia, S.; Dhanalakshmia, A.; Kannan, M. Separation and detection of certain benzodiazepines by thin-layer chromatography. Malays. J. Forensic Sci. 2013, 4, 47–53. [Google Scholar]
- Doctor, E.L.; McCord, B. Comparison of aggregating agents for the surface-enhanced Raman analysis of benzodiazepines. Analyst 2013, 138, 5926–5932. [Google Scholar] [CrossRef]
- Boonmee, W.; Samoson, K.; Yodrak, J.; Thiagchanya, A.; Phonchai, A.; Limbut, W. Adsorptive Cathodic Stripping Voltammetry for Quantification of Alprazolam. Molecules 2021, 26, 2958. [Google Scholar] [CrossRef] [PubMed]
- Amiri, M.; Imanzadeh, H.; Sefid-Sefidehkhan, Y. An Overview on Electrochemical Sensors Based on Nanomaterials for the Determination of Drugs of Abuse. Curr. Drug Deliv. 2021, 18, 162–183. [Google Scholar] [CrossRef] [PubMed]
- Wang, L.; Wang, T.; Zhuang, Q. Simple self-referenced ratiometric electrochemical sensor for dopamine detection using electrochemically pretreated glassy carbon electrode modified by acid-treated multiwalled carbon nanotube. J. Electroanal. Chem. 2019, 851, 113446. [Google Scholar] [CrossRef]
- Promsuwan, K.; Kanatharana, P.; Thavarungkul, P.; Limbut, W. Nitrite amperometric sensor for gunshot residue screening. Electrochim. Acta 2019, 331, 135309. [Google Scholar] [CrossRef]
- Promsuwan, K.; Kachatong, N.; Limbut, W. Simple flow injection system for non-enzymatic glucose sensing based on an electrode modified with palladium nanoparticles-graphene nanoplatelets/mullti-walled carbon nanotubes. Electrochim. Acta 2019, 320, 134621. [Google Scholar] [CrossRef]
- Promsuwan, K.; Thongtawat, J.; Limbut, W. Porous palladium-poly(3,4-ethylenedioxythiophene)-coated carbon microspheres/graphene nanoplatelet-modified electrode for flow-based-amperometric hydrazine sensor. Microchim. Acta 2020, 187, 539. [Google Scholar] [CrossRef]
- González-Sánchez, M.I.; Gómez-Monedero, B.; Agrisuelas, J.; Iniesta, J.; Valero, E. Highly activated screen-printed carbon electrodes by electrochemical treatment with hydrogen peroxide. Electrochem. Commun. 2018, 91, 36–40. [Google Scholar] [CrossRef]
- Samiec, P.; Navrátilová, Z. Electrochemical behaviour of bromazepam and alprazolam and their determination in the pharmaceutical tablets Lexaurin and Xanax on carbon paste electrode. Mon. Chem. Chem. Mon. 2017, 148, 449–455. [Google Scholar] [CrossRef]
- Samiec, P.; Švorc, Ľ.; Stanković, D.M.; Vojs, M.; Marton, M.; Navrátilová, Z. Mercury-free and modification-free electroanalytical approach towards bromazepam and alprazolam sensing: A facile and efficient assay for their quantification in pharmaceuticals using boron-doped diamond electrodes. Sens. Actuators B Chem. 2017, 245, 963–971. [Google Scholar] [CrossRef] [Green Version]
- Honeychurch, K.C. Review of Electroanalytical-Based Approaches for the Determination of Benzodiazepines. Biosensors 2019, 9, 130. [Google Scholar] [CrossRef] [Green Version]
- Malik, P.; Gupta, R.; Malik, V.; Ameta, R.K. Emerging nanomaterials for improved biosensing. Meas. Sens. 2021, 16, 100050. [Google Scholar] [CrossRef]
- Huang, X.; Zhu, Y.; Kianfar, E. Nano Biosensors: Properties, applications and electrochemical techniques. J. Mater. Res. Technol. 2021, 12, 1649–1672. [Google Scholar] [CrossRef]
- Stozhko, N.; Bukharinova, M.; Galperin, L.; Brainina, K. A Nanostructured Sensor Based on Gold Nanoparticles and Nafion for Determination of Uric Acid. Biosensors 2018, 8, 21. [Google Scholar] [CrossRef] [PubMed]
- Li, X.; Li, X.; Zhao, T.; Sun, L.; Aifantis, K.E.; Fan, Y.; Feng, Q.; Cui, F.; Watari, F. The applications of conductive nanomaterials in the biomedical field. J. Biomed. Mater. Res. Part A 2015, 104, 322–339. [Google Scholar] [CrossRef] [Green Version]
- Kauffman, D.R.; Sorescu, D.C.; Schofield, D.P.; Allen, B.L.; Jordan, K.D.; Star, A. Understanding the Sensor Response of Metal-Decorated Carbon Nanotubes. Nano Lett. 2010, 10, 958–963. [Google Scholar] [CrossRef] [PubMed]
- Hazra, S.K.; Basu, S. Graphene-Oxide Nano Composites for Chemical Sensor Applications. J. Carbon Res. 2016, 2, 12. [Google Scholar] [CrossRef]
- Imamura, G.; Minami, K.; Shiba, K.; Mistry, K.; Musselman, K.P.; Yavuz, M.; Yoshikawa, G.; Saiki, K.; Obata, S. Graphene Oxide as a Sensing Material for Gas Detection Based on Nanomechanical Sensors in the Static Mode. Chemosensors 2020, 8, 82. [Google Scholar] [CrossRef]
- Hernaez, M. Applications of Graphene-Based Materials in Sensors. Sensors 2020, 20, 3196. [Google Scholar] [CrossRef]
- Anas, N.A.A.; Fen, Y.W.; Omar, N.A.S.; Daniyal, W.M.E.M.M.; Ramdzan, N.S.M.; Saleviter, S. Development of Graphene Quantum Dots-Based Optical Sensor for Toxic Metal Ion Detection. Sensors 2019, 19, 3850. [Google Scholar] [CrossRef] [Green Version]
- Nurazzi, N.M.; Abdullah, N.; Demon, S.Z.; Halim, N.A.; Azmi, A.F.; Knight, V.F.; Mohamad, I.S. The frontiers of functionalized graphene-based nanocomposites as chemical sensors. Nanotechnol. Rev. 2021, 10, 330–369. [Google Scholar] [CrossRef]
- Alzate-Carvajal, N.; Luican-Mayer, A. Functionalized Graphene Surfaces for Selective Gas Sensing. ACS Omega 2020, 5, 21320–21329. [Google Scholar] [CrossRef]
- Murthy, H.A.; Kelele, K.G.; Ravikumar, C.R.; Nagaswarupa, H.P.; Tadesse, A.; Desalegn, T. Graphene-supported nanomaterials as electrochemical sensors: A mini review. Results Chem. 2021, 3, 100131. [Google Scholar] [CrossRef]
- Xiao, T.; Huang, J.; Wang, D.; Meng, T.; Yang, X. Au and Au-Based nanomaterials: Synthesis and recent progress in electrochemical sensor applications. Talanta 2019, 206, 120210. [Google Scholar] [CrossRef]
- Zareie, Z.; Nasirizadeh, N.; Mirjalili, M.; Rohani-moghadam, M.; Shirgholami, M. Highly sensitive and selective voltammetric detection of isoniazid drug based on graphene oxide-gold nanourchin-poly(aniline) nanocomposite. Measurement 2021, 189, 110431. [Google Scholar] [CrossRef]
- Liu, L.; Jiang, H.; Wang, X. Functionalized gold nanomaterials as biomimetic nanozymes and biosensing actuators. TrAC Trends Anal. Chem. 2021, 143, 116376. [Google Scholar] [CrossRef]
- Mansuriya, B.D.; Altintas, Z. Graphene Quantum Dot-Based Electrochemical Immunosensors for Biomedical Applications. Materials 2020, 13, 96. [Google Scholar] [CrossRef] [Green Version]
- Farzin, M.A.; Abdoos, H. A critical review on quantum dots: From synthesis toward applications in electrochemical biosensors for determination of disease-related biomolecules. Talanta 2020, 224, 121828. [Google Scholar] [CrossRef]
- Mynttinen, E.; Wester, N.; Lilius, T.; Kalso, E.; Koskinen, J.; Laurila, T. Simultaneous electrochemical detection of tramadol and O-desmethyltramadol with Nafion-coated tetrahedral amorphous carbon electrode. Electrochim. Acta 2018, 295, 347–353. [Google Scholar] [CrossRef] [Green Version]
- Ganjali, M.R.; Haji-Hashemi, H.; Faridbod, F.; Norouzi, P.; Qomi, M. Potentiometric determination of alprazolam based on carbon paste and PVC membrane electrodes. Int. J. Electrochem. Sci. 2012, 7, 1470–1481. [Google Scholar]
- Rodsud, S.; Limbut, W. A Simple Electrochemical Sensor Based on Graphene Nanoplatelets Modified Glassy Carbon Electrode (GrNPs/GCE) for Highly Sensitive Detection of Yohimbine (YOH). J. Electrochem. Soc. 2019, 166, B771–B779. [Google Scholar] [CrossRef]
- AOAC INTERNATIONAL guidelines for validation of botanical identification methods. J. AOAC Int. 2012, 95, 268–272. [CrossRef] [PubMed] [Green Version]
- Ashrafi, H.; Hassanpour, S.; Saadati, A.; Hasanzadeh, M.; Ansarin, K.; Ozkan, S.A.; Shadjou, N.; Jouyban, A. Sensitive detection and determination of benzodiazepines using silver nanoparticles-N-GQDs ink modified electrode: A new platform for modern pharmaceutical analysis. Microchem. J. 2019, 145, 1050–1057. [Google Scholar] [CrossRef]
- Hall, M.A.; Robinson, C.A.; Brissie, R.M. High-Performance Liquid Chromatography of Alprazolam in Postmortem Blood Using Solid-Phase Extraction. J. Anal. Toxicol. 1995, 19, 511–513. [Google Scholar] [CrossRef]
- Samiec, P.; Navrátilová, Z.; Fischer, J. Voltammetry of benzodiazepines on meniscus-modified silver solid amalgam electrode. Mon. Chem. Chem. Mon. 2016, 147, 127–134. [Google Scholar] [CrossRef]
- Acikkol, M.; Mercan, S.; Karadayi, S. Simultaneous Determination of Benzodiazepines and Ketamine from Alcoholic and Nonalcoholic Beverages by GC-MS in Drug Facilitated Crimes. Chromatographia 2009, 70, 1295. [Google Scholar] [CrossRef]
- Goldberger, B.A.; Chronister, C.W.; Merves, M.L. Quantitation of benzodiazepines in blood and urine using gas chromatography-mass spectrometry (GC-MS). Methods Mol. Biol. 2010, 603, 75–87. [Google Scholar] [PubMed]
- Sarfaraz, S.; Readdy, C.V.R.; Shareef, K.M.A. Method development, Validation and determination of Alprazolam in its pharmaceutical dosage by 2,3-dichloro 5,6-dicyano-1,4-benzoquinone. J. Chem. Pharm. Res. 2014, 6, 411–418. [Google Scholar]
- Samanidou, V.; Kaltzi, I.; Kabir, A.; Furton, K.G. Simplifying sample preparation using fabric phase sorptive extraction technique for the determination of benzodiazepines in blood serum by high-performance liquid chromatography. Biomed. Chromatogr. 2016, 30, 829–836. [Google Scholar] [CrossRef]


| Sample | Added | Found | Recovery% | RSD% |
|---|---|---|---|---|
| 1 | 10 μg/L | 9.4 (±0.4) μg/L | 94 | 1.7 |
| 2 | 100 μg/L | 102 (±0.8) μg/L | 102 | 0.9 |
| 3 | 1 mg/L | 0.98 (±0.03) mg/L | 98 | 0.8 |
| 4 | 20 mg/L | 21.1 (±0.2) mg/L | 105.5 | 1.2 |
Publisher’s Note: MDPI stays neutral with regard to jurisdictional claims in published maps and institutional affiliations. |
© 2022 by the authors. Licensee MDPI, Basel, Switzerland. This article is an open access article distributed under the terms and conditions of the Creative Commons Attribution (CC BY) license (https://creativecommons.org/licenses/by/4.0/).
Share and Cite
Sadrabadi, E.A.; Khosravi, F.; Benvidi, A.; Shiralizadeh Dezfuli, A.; Khashayar, P.; Khashayar, P.; Azimzadeh, M. Alprazolam Detection Using an Electrochemical Nanobiosensor Based on AuNUs/Fe-Ni@rGO Nanocomposite. Biosensors 2022, 12, 945. https://doi.org/10.3390/bios12110945
Sadrabadi EA, Khosravi F, Benvidi A, Shiralizadeh Dezfuli A, Khashayar P, Khashayar P, Azimzadeh M. Alprazolam Detection Using an Electrochemical Nanobiosensor Based on AuNUs/Fe-Ni@rGO Nanocomposite. Biosensors. 2022; 12(11):945. https://doi.org/10.3390/bios12110945
Chicago/Turabian StyleSadrabadi, Emadoddin Amin, Fatemeh Khosravi, Ali Benvidi, Amin Shiralizadeh Dezfuli, Pouria Khashayar, Patricia Khashayar, and Mostafa Azimzadeh. 2022. "Alprazolam Detection Using an Electrochemical Nanobiosensor Based on AuNUs/Fe-Ni@rGO Nanocomposite" Biosensors 12, no. 11: 945. https://doi.org/10.3390/bios12110945