Reversibly Migratable Fluorescent Probe for Precise and Dynamic Evaluation of Cell Mitochondrial Membrane Potentials

 , , and
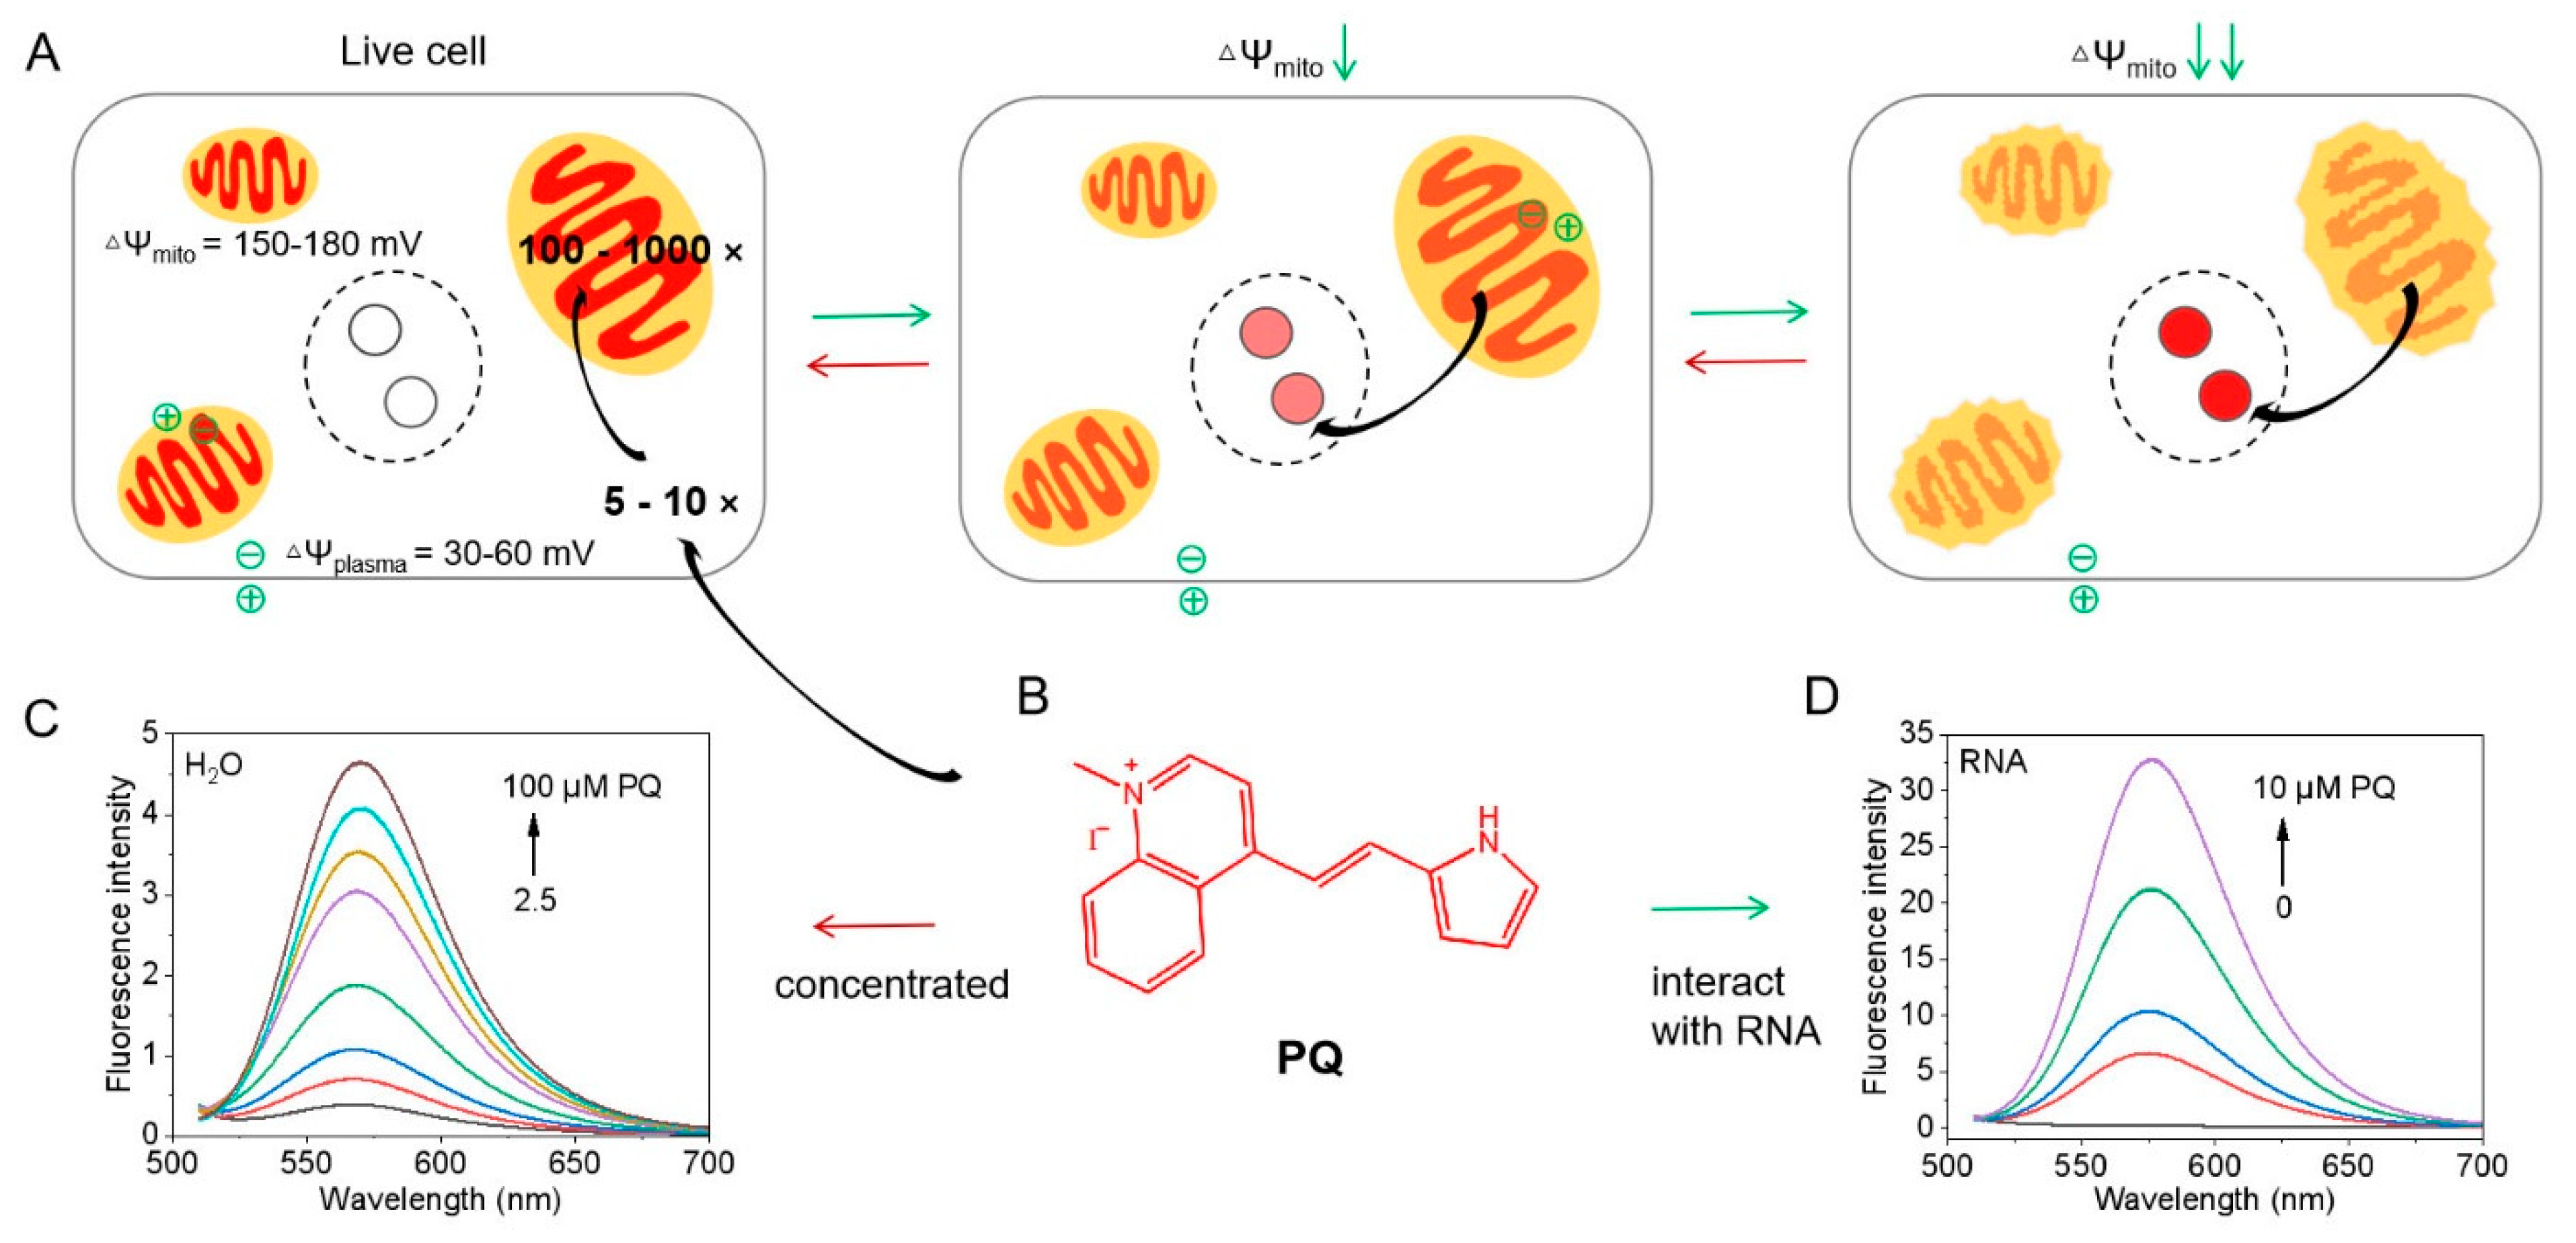
Abstract
:1. Introduction
2. Materials and Methods
2.1. Materials and Instruments
2.2. The Synthesis of PQ
2.3. RNase and DNase Digestion Experiments
2.4. Colocalization of PQ and MTDR
2.5. MMP Decrease Assay Using CCCP in Real-Time
2.6. Quantitative Analysis for PQ Translocation from Mitochondria
2.7. The Cytotoxicity of PQ
2.8. Image Analysis
3. Results
3.1. Photophysical Properties
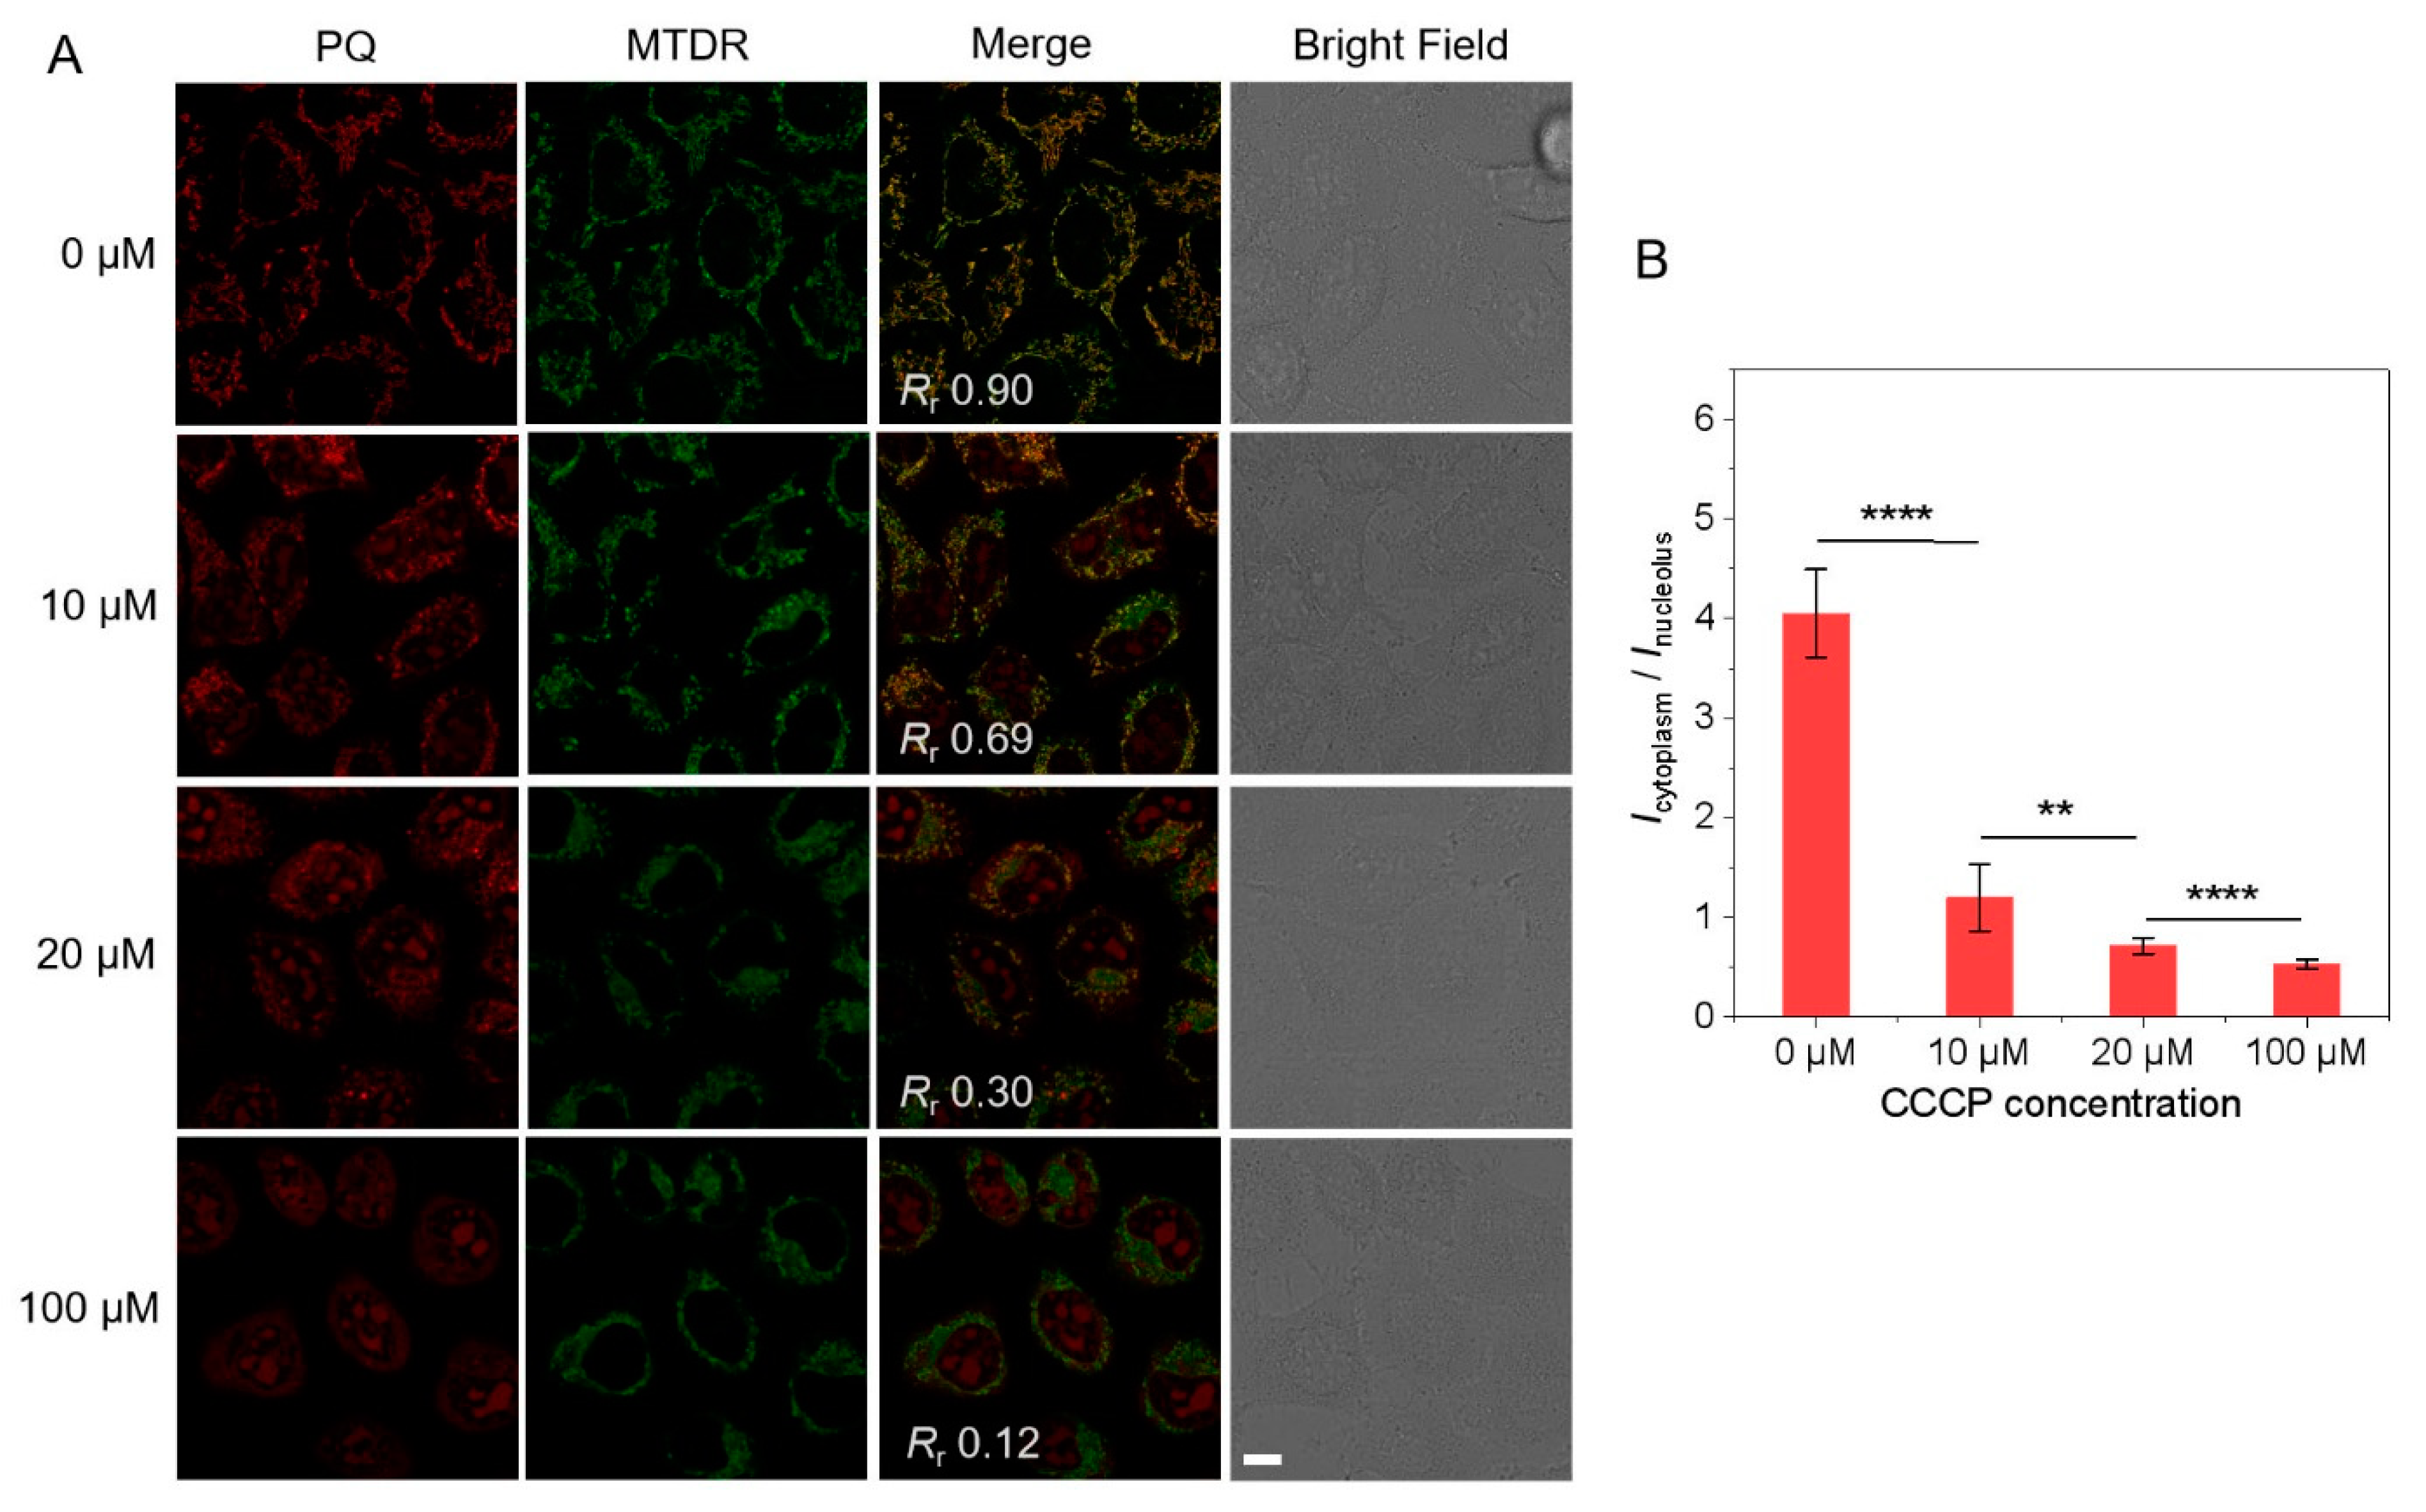
3.2. Colocalization with MTDR under Various MMP
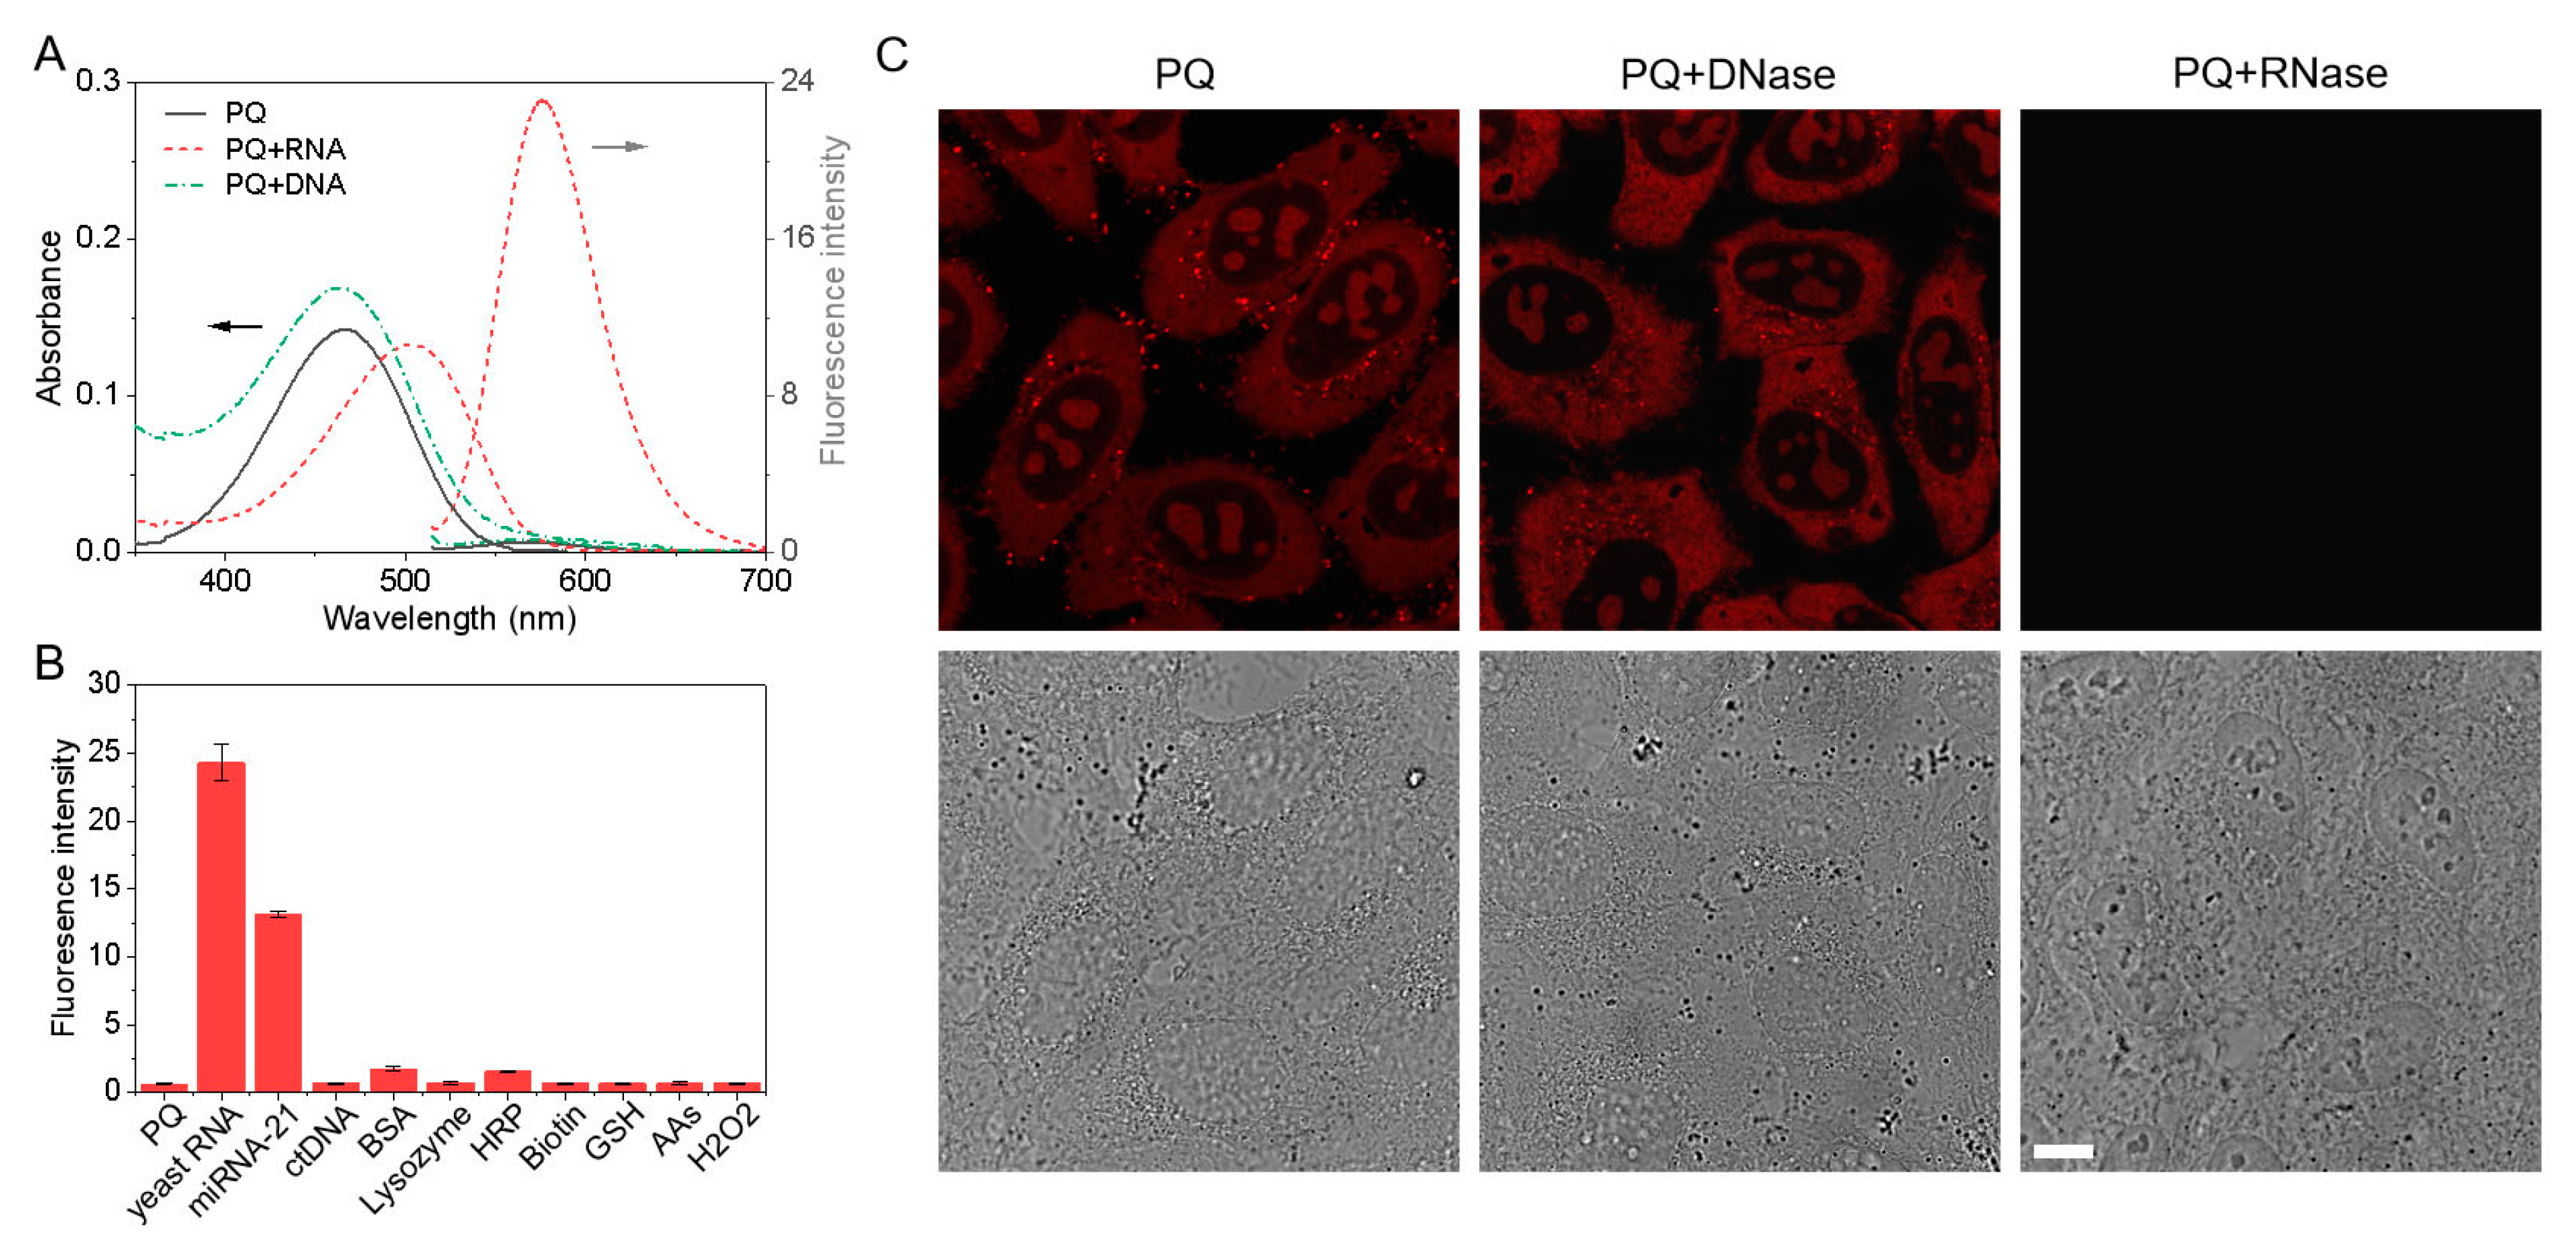
3.3. RNA Selectivity
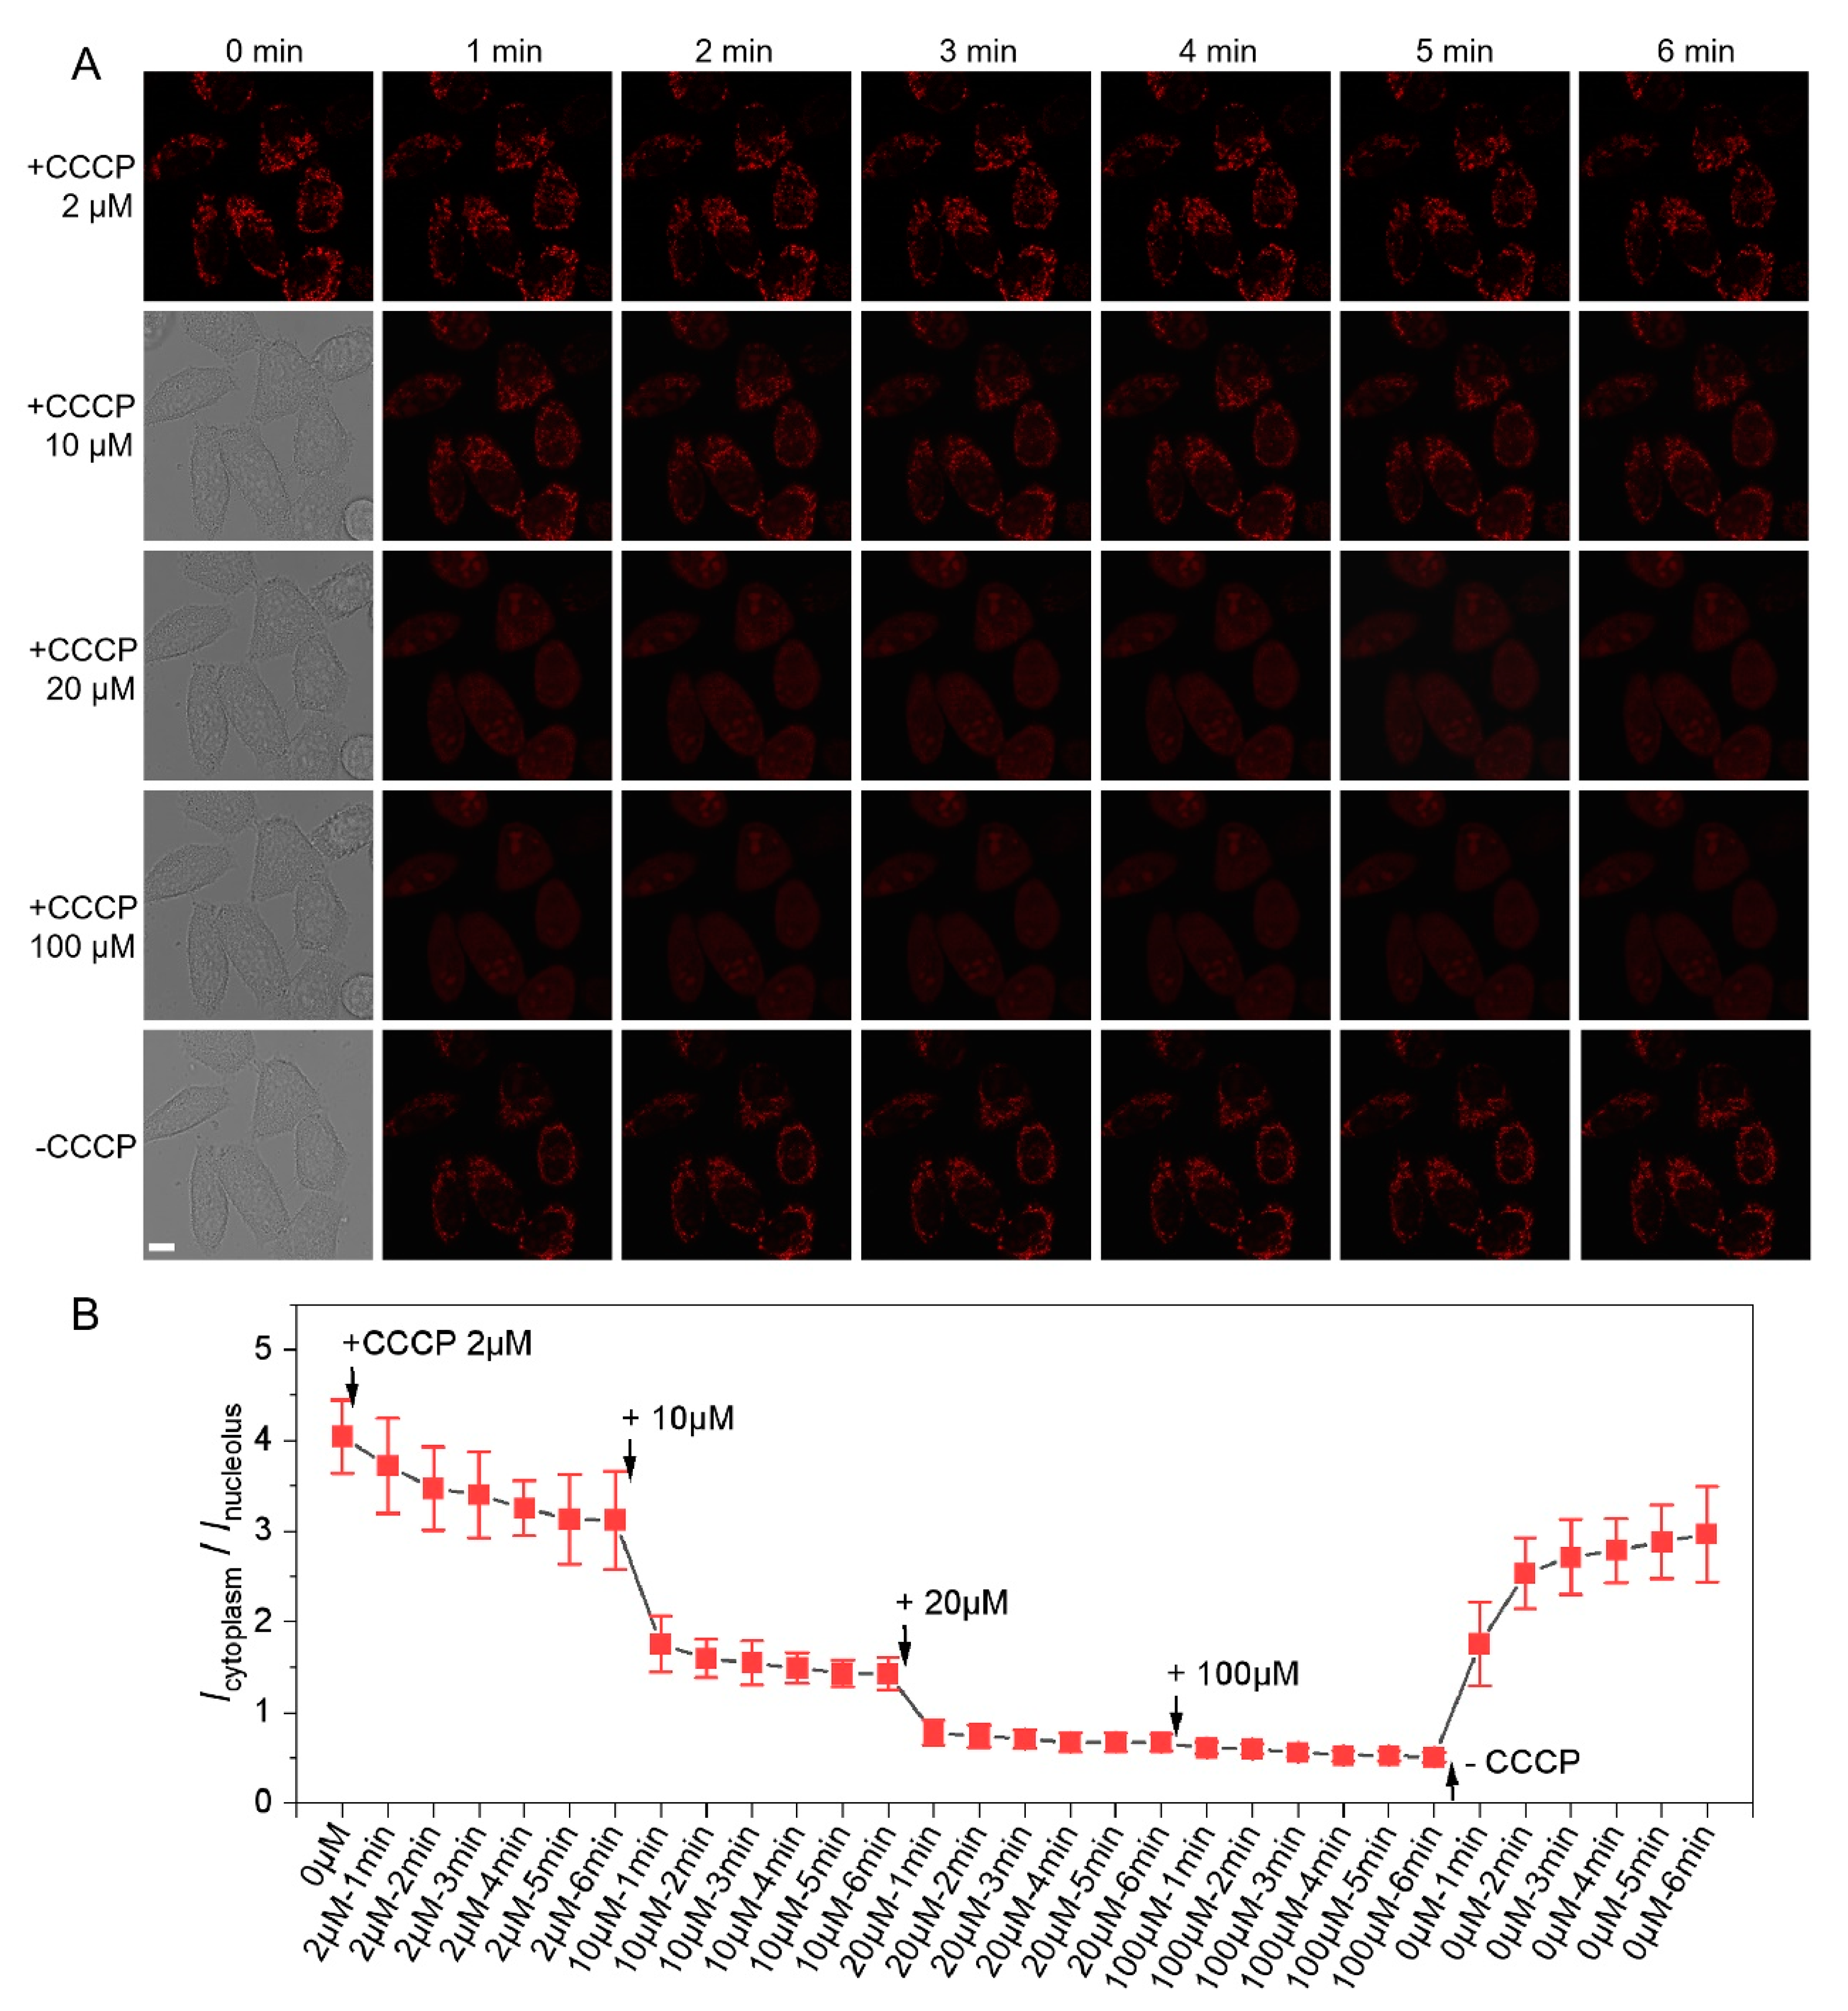
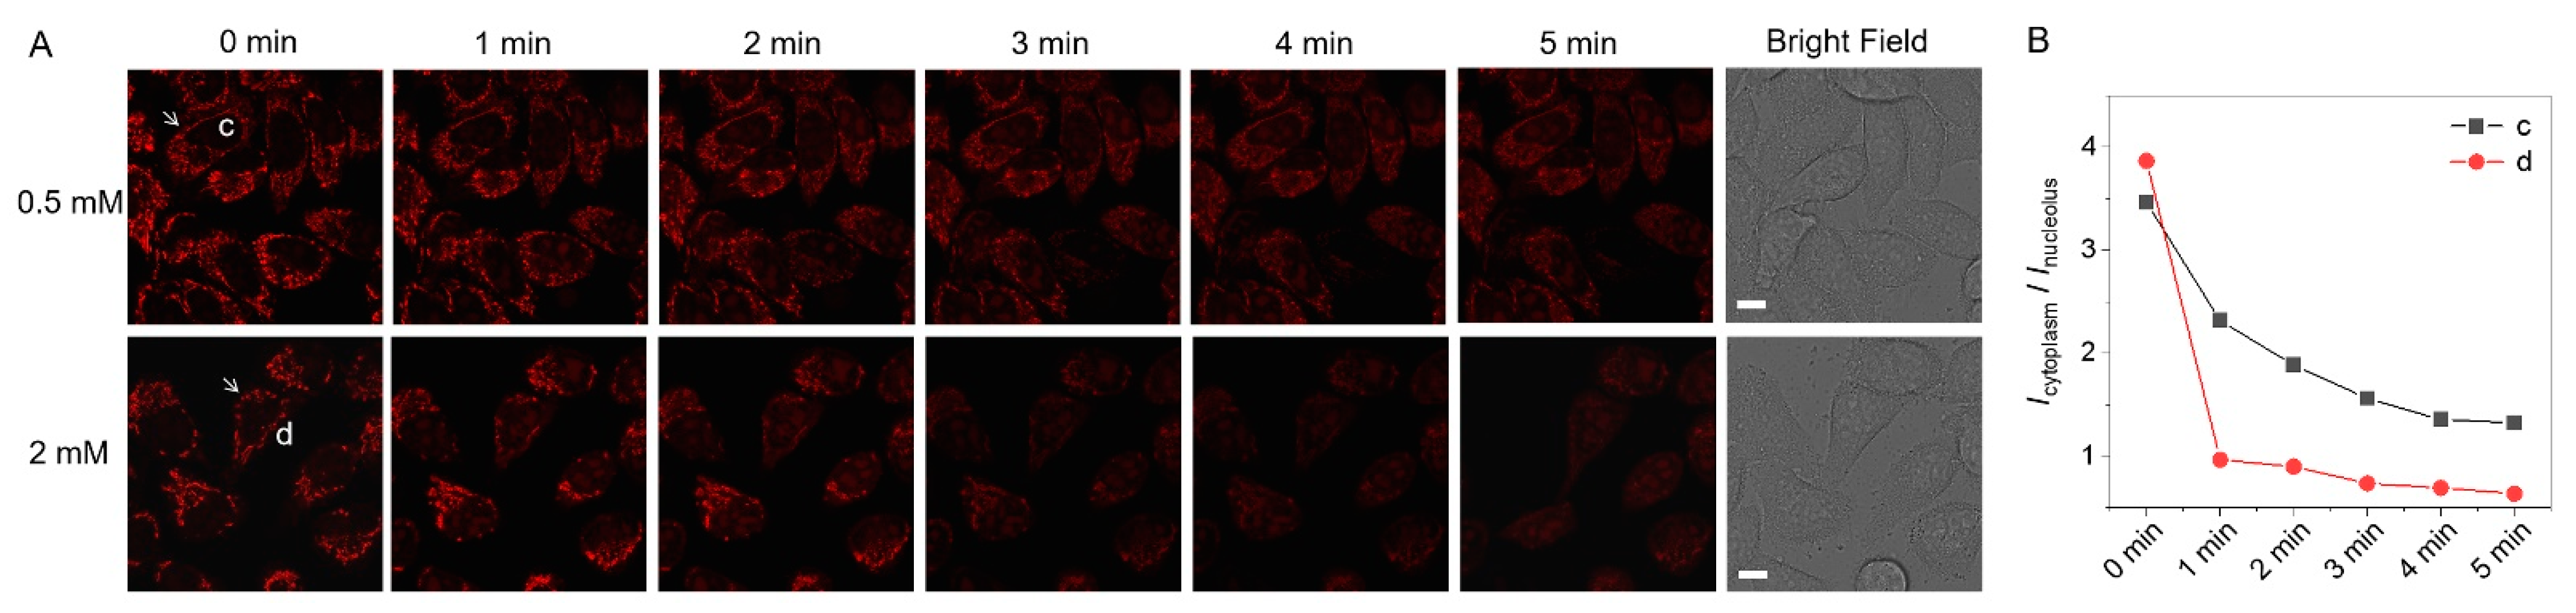
3.4. Dynamic and Precise MMP Evaluation of Cells with CCCP Treatment
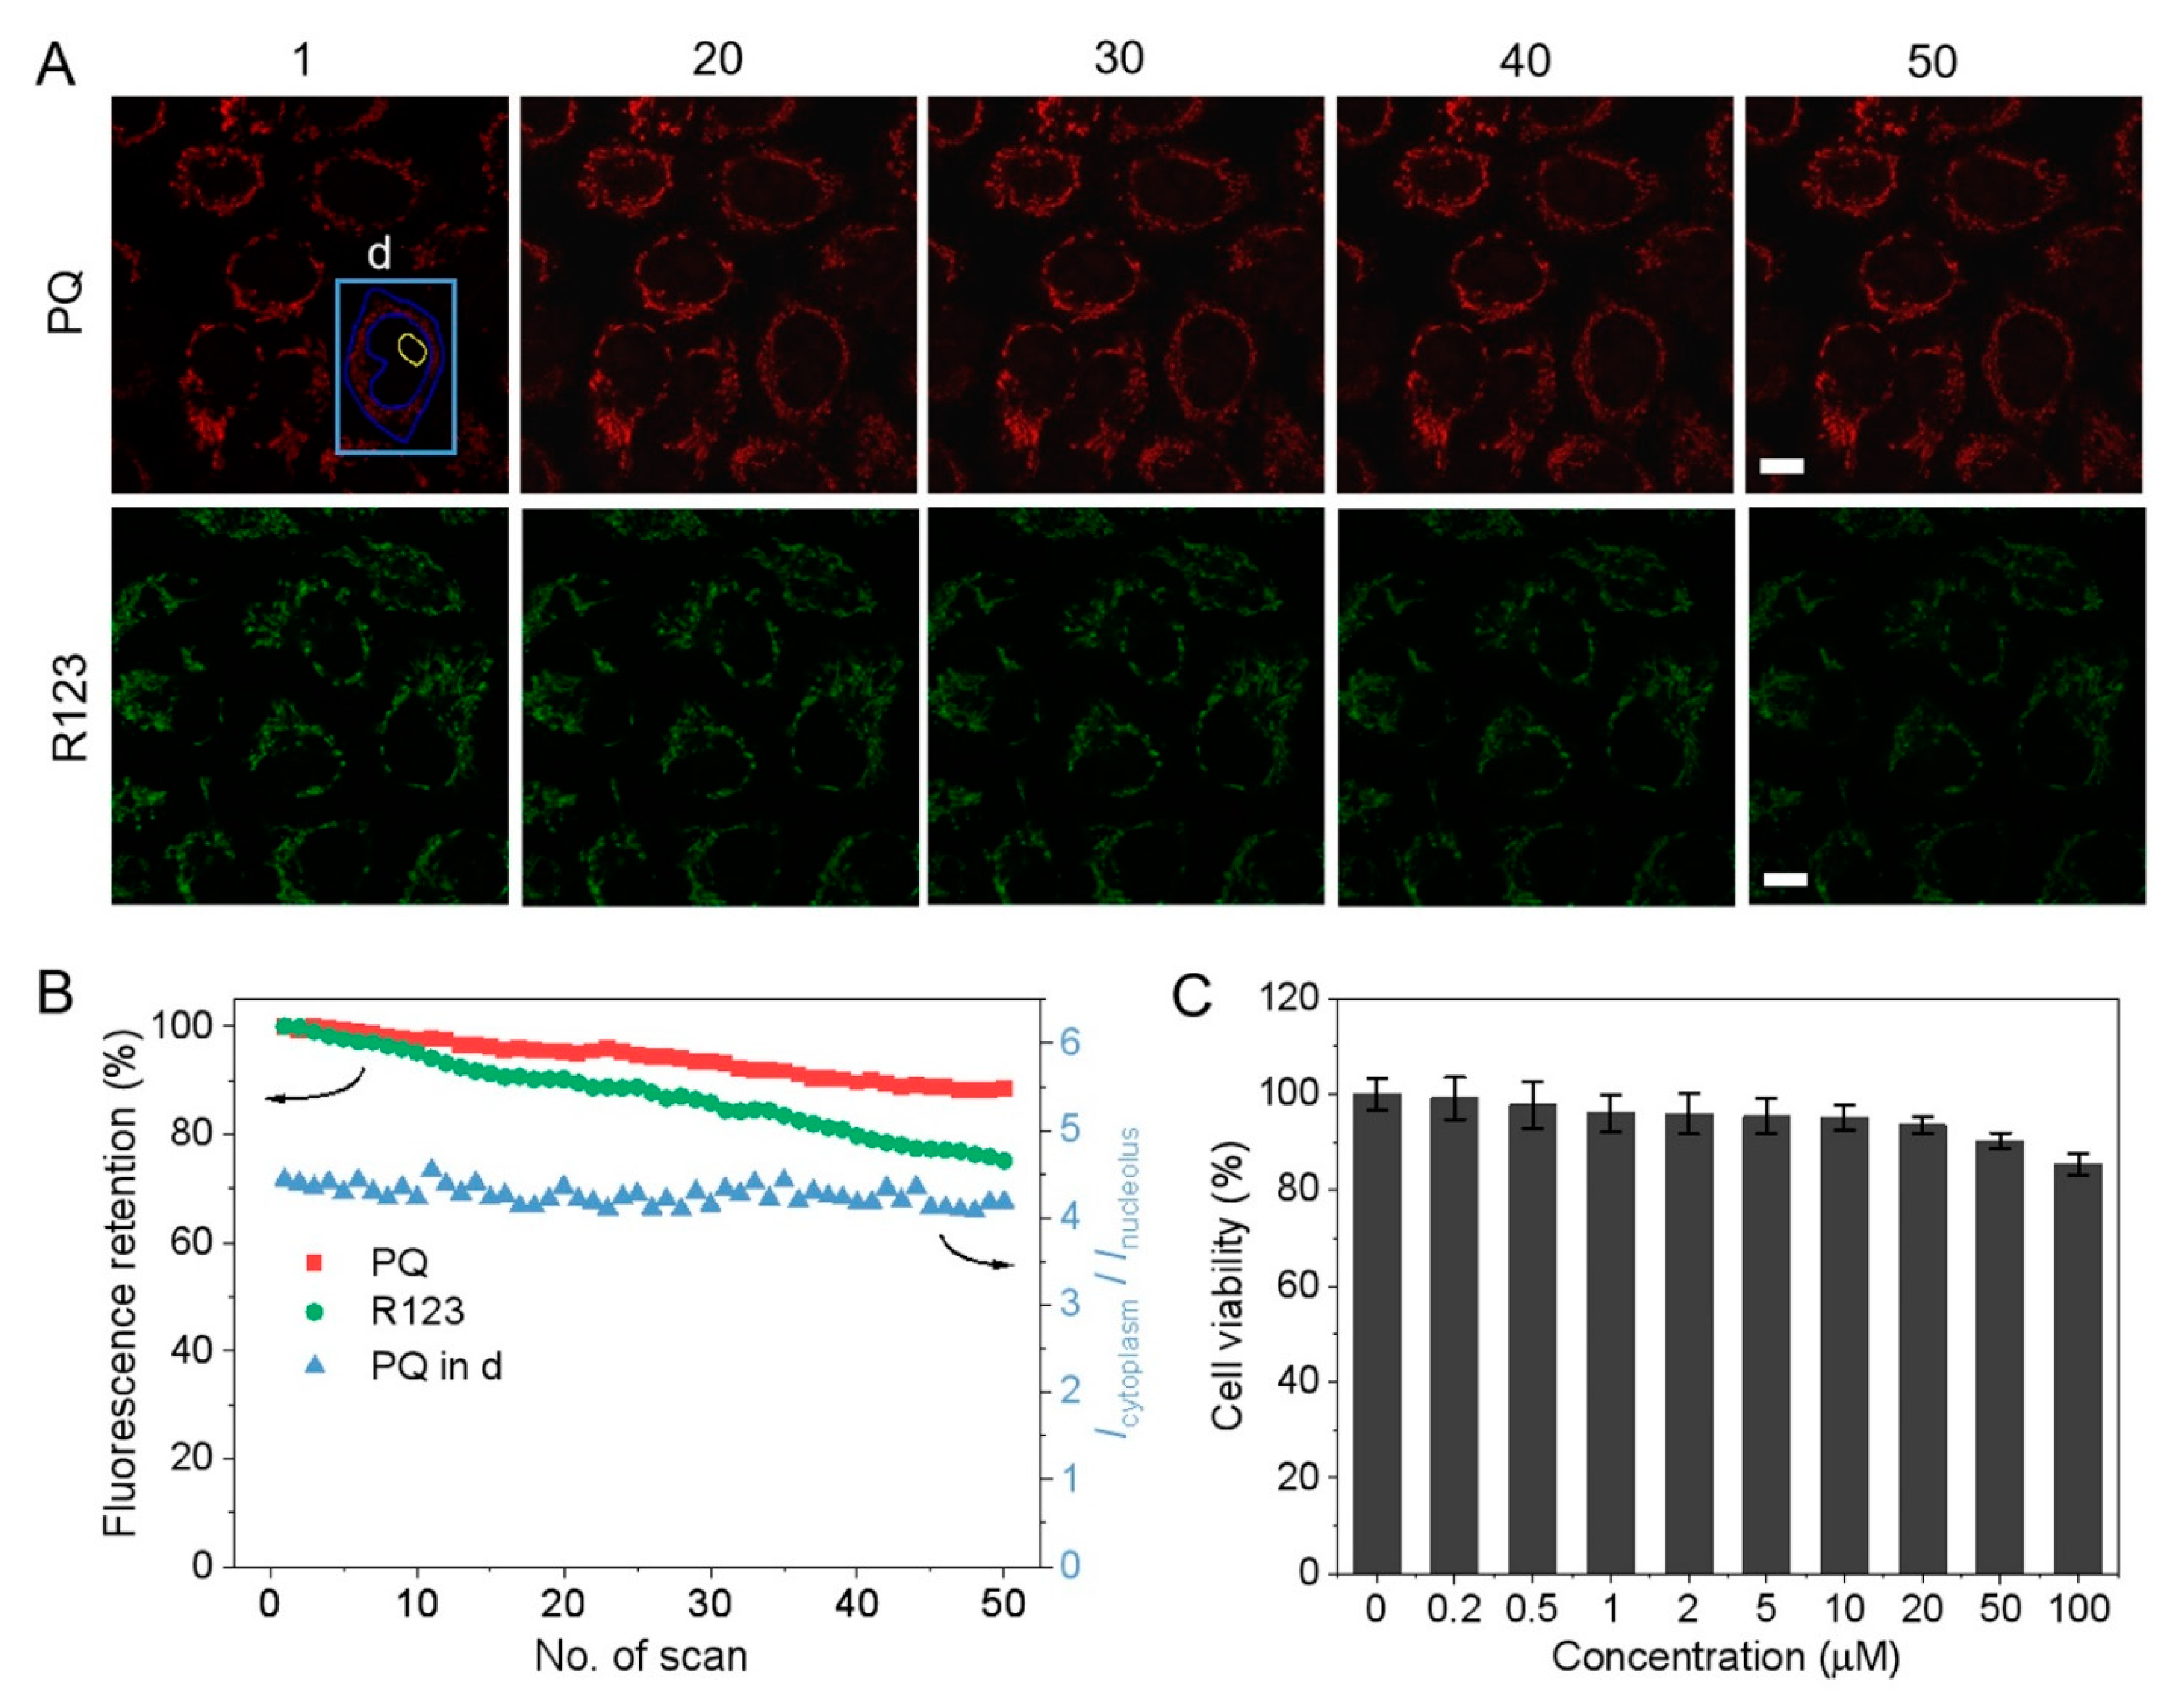
3.5. Photostability and Cytotoxicity
3.6. Dynamic MMP Monitoring in Oxidative Environments
4. Conclusions
Supplementary Materials
Author Contributions
Funding
Institutional Review Board Statement
Informed Consent Statement
Data Availability Statement
Conflicts of Interest
References
- Hüttemann, M.; Lee, I.; Pecinova, A.; Pecina, P.; Przyklenk, K.; Doan, J.W. Regulation of oxidative phosphorylation, the mitochondrial membrane potential, and their role in human disease. J. Bioenerg. Biomembr. 2008, 40, 445–456. [Google Scholar] [CrossRef] [PubMed]
- Palmeira, C.M.; Rolo, A.P. Mitochondrial membrane potential (ΔΨ) fluctuations associated with the metabolic states of mitochondria. In Mitochondrial Bioenergetics: Methods and Protocols; Palmeira, C.M., Moreno, A.J., Totowa, N.J., Eds.; Humana Press: Totowa, NJ, USA, 2012; pp. 89–101. [Google Scholar]
- Murphy, M.P. How mitochondria produce reactive oxygen species. Biochem. J. 2009, 417, 1–13. [Google Scholar] [CrossRef] [PubMed]
- Marchi, S.G.C.; Suski, J.M.; Agnoletto, C.; Bononi, A.; Bonora, M.; De Marchi, E.; Missiroli, S.; Patergnani, S.; Poletti, F.; Rimessi, A.; et al. Mitochondria-Ros crosstalk in the control of cell death and aging. J. Signal Transd. 2012, 2012, 329635. [Google Scholar] [CrossRef]
- Suski, J.M.; Lebiedzinska, M.; Bonora, M.; Pinton, P.; Duszynski, J.; Wieckowski, M.R. Relation between mitochondrial membrane potential and ROS formation. Methods Mol. Biol. 2012, 810, 183–205. [Google Scholar] [PubMed]
- Leaver, H.A.; Schou, A.C.; Rizzo, M.T.; Prowse, C.V. Calcium-sensitive mitochondrial membrane potential in human platelets and intrinsic signals of cell death. Platelets 2006, 17, 368–377. [Google Scholar] [CrossRef]
- Contreras, L.; Drago, I.; Zampese, E.; Pozzan, T. Mitochondria: The calcium connection. BBA-Bioenerg. 2010, 1797, 607–618. [Google Scholar] [CrossRef] [PubMed]
- Mbaya, E.; Oulès, B.; Caspersen, C.; Tacine, R.; Massinet, H.; Pennuto, M.; Chrétien, D.; Munnich, A.; Rötig, A.; Rizzuto, R.; et al. Calcium signalling-dependent mitochondrial dysfunction and bioenergetics regulation in respiratory chain Complex II deficiency. Cell Death Differ. 2010, 17, 1855–1866. [Google Scholar] [CrossRef]
- Vyssokikh, M.Y.; Holtze, S.; Averina, O.A.; Lyamzaev, K.G.; Panteleeva, A.A.; Marey, M.V.; Zinovkin, R.A.; Severin, F.F.; Skulachev, M.V.; Fasel, N.; et al. Mild depolarization of the inner mitochondrial membrane is a crucial component of an anti-aging program. Proc. Natl. Acad. Sci. USA 2020, 117, 6491–6501. [Google Scholar] [CrossRef]
- Frank, S.A.; Hurst, L.D. Mitochondria and male disease. Nature 1996, 383, 224. [Google Scholar] [CrossRef]
- Lin, M.T.; Beal, M.F. Mitochondrial dysfunction and oxidative stress in neurodegenerative diseases. Nature 2006, 443, 787–795. [Google Scholar] [CrossRef]
- Nunnari, J.; Suomalainen, A. Mitochondria: In sickness and in health. Cell 2012, 148, 1145–1159. [Google Scholar] [CrossRef] [PubMed]
- Yue, L.; Yao, H. Mitochondrial dysfunction in inflammatory responses and cellular senescence: Pathogenesis and pharmacological targets for chronic lung diseases. Br. J. Pharmacol. 2016, 173, 2305–2318. [Google Scholar] [CrossRef] [PubMed]
- Vringer, E.; Tait, S.W.G. Mitochondria and inflammation: Cell death heats up. Front. Cell Dev. Biol. 2019, 7, 100. [Google Scholar] [CrossRef] [PubMed]
- Picca, A.; Calvani, R. Cell death and inflammation: The role of mitochondria in health and disease. Cells 2021, 10, 537. [Google Scholar] [CrossRef]
- Wallace, D.C. Mitochondria and cancer. Nat. Rev. Cancer 2012, 12, 685–698. [Google Scholar] [CrossRef] [PubMed]
- Modica-Napolitano, J.S.; Aprille, J.R. Delocalized lipophilic cations selectively target the mitochondria of carcinoma cells. Adv. Drug Deliver. Rev. 2001, 49, 63–70. [Google Scholar] [CrossRef]
- Zhang, T.; Huo, F.; Zhang, W.; Cheng, F.; Yin, C. Development of near-infrared mitochondrial polarity fluorescent probe for evaluating mitophagy in mice heart and potential cancer diagnosis. Chem. Eng. J. 2022, 437, 135397. [Google Scholar] [CrossRef]
- Chen, X.; Chen, Q.; He, D.; Yang, S.; Yang, Y.; Qian, J.; Long, L.; Wang, K. Mitochondria targeted and immobilized ratiometric NIR fluorescent probe for investigating SO2 phytotoxicity in plant mitochondria. Sens. Actuators B-Chem. 2022, 370, 132433. [Google Scholar] [CrossRef]
- Johnson, L.V.; Walsh, M.L.; Bockus, B.J.; Chen, L.B. Monitoring of relative mitochondrial membrane potential in living cells by fluorescence microscopy. J. Cell Biol. 1981, 88, 526–535. [Google Scholar] [CrossRef]
- Baracca, A.; Sgarbi, G.; Solaini, G.; Lenaz, G. Rhodamine 123 as a probe of mitochondrial membrane potential: Evaluation of proton flux through F(0) during ATP synthesis. Biochim. Biophys. Acta 2003, 1606, 137–146. [Google Scholar] [CrossRef] [Green Version]
- Zielonka, J.; Joseph, J.; Sikora, A.; Hardy, M.; Ouari, O.; Vasquez-Vivar, J.; Cheng, G.; Lopez, M.; Kalyanaraman, B. Mitochondria-targeted triphenylphosphonium-based compounds: Syntheses, mechanisms of action, and therapeutic and diagnostic applications. Chem. Rev. 2017, 117, 10043–10120. [Google Scholar] [CrossRef] [PubMed]
- Perry, S.W.; Norman, J.P.; Barbieri, J.; Brown, E.B.; Gelbard, H.A. Mitochondrial membrane potential probes and the proton gradient: A practical usage guide. BioTechniques 2011, 50, 98–115. [Google Scholar] [CrossRef] [PubMed]
- Scaduto, R.C.; Grotyohann, L.W. Measurement of mitochondrial membrane potential using fluorescent rhodamine derivatives. Biophys. J. 1999, 76, 469–477. [Google Scholar] [CrossRef]
- Sivandzade, F.; Bhalerao, A.; Cucullo, L. Analysis of the mitochondrial membrane potential using the cationic JC-1 dye as a sensitive fluorescent probe. Bio. Protoc. 2019, 9, e3128. [Google Scholar] [CrossRef] [PubMed]
- Li, X.; Tian, M.; Zhang, G.; Zhang, R.; Feng, R.; Guo, L.; Yu, X.; Zhao, N.; He, X. Spatially dependent fluorescent probe for detecting different situations of mitochondrial membrane potential conveniently and efficiently. Anal. Chem. 2017, 89, 3335–3344. [Google Scholar] [CrossRef]
- Li, M.-Y.; Liu, Y.-H.; Li, K.; Zhang, H.; Shi, L.; Liu, X.-Y.; Yu, K.-K.; Yu, X.-Q. A mitochondria–nucleolus migration fluorescent probe for monitoring of mitochondrial membrane potential and identification of cell apoptosis. Anal. Methods 2019, 11, 5750–5754. [Google Scholar] [CrossRef]
- Manigrasso, J.; Marcia, M.; Vivo, M.D. Computer-aided design of RNA-targeted small molecules: A growing need in drug discovery. Chem 2021, 7, 2965–2988. [Google Scholar] [CrossRef]
- Song, G.; Sun, Y.; Liu, Y.; Wang, X.; Chen, M.; Miao, F.; Zhang, W.; Yu, X. Low molecular weight fluorescent probes with good photostability for imaging RNA-rich nucleolus and RNA in cytoplasm in living cells. Biomaterials 2014, 35, 2103–2112. [Google Scholar] [CrossRef]
- Satori, C.P.; Henderson, M.M.; Krautkramer, E.A.; Kostal, V.; Distefano, M.M.; Arriaga, E.A. Bioanalysis of eukaryotic organelles. Chem. Rev. 2013, 113, 2733–2811. [Google Scholar] [CrossRef]
- Song, G.; Yan, L.; Liao, Q.; Chen, W.; Tong, L.; Zeng, Y.; Chu, P.K.; Li, P.; Wang, H. Mitochondria/RNA cascade-targeted and fluorescence-switchable photosensitizer for photodynamic therapy augmentation and real-time efficacy self-monitoring. Sens. Actuators B-Chem. 2022, 369, 132260. [Google Scholar] [CrossRef]
- Lee, M.H.; Kim, J.S.; Sessler, J.L. Small molecule-based ratiometric fluorescence probes for cations, anions, and biomolecules. Chem. Soc. Rev. 2015, 44, 4185–4191. [Google Scholar] [CrossRef] [PubMed]
- Yao, L.; Zhang, S.; Wang, R.; Li, W.; Shen, F.; Yang, B.; Ma, Y. Highly efficient near-infrared organic light-emitting diode based on a butterfly-shaped donor–acceptor chromophore with strong solid-state fluorescence and a large proportion of radiative excitons. Angew. Chem. Int. Ed. 2014, 53, 2119–2123. [Google Scholar] [CrossRef] [PubMed]
- Padman, B.S.; Bach, M.; Lucarelli, G.; Prescott, M.; Ramm, G. The protonophore CCCP interferes with lysosomal degradation of autophagic cargo in yeast and mammalian cells. Autophagy 2013, 9, 1862–1875. [Google Scholar] [CrossRef] [PubMed]
- Lim, M.L.; Minamikawa, T.; Nagley, P. The protonophore CCCP induces mitochondrial permeability transition without cytochrome c release in human osteosarcoma cells. FEBS Lett. 2001, 503, 69–74. [Google Scholar] [CrossRef]
- Armitage, B.A. Cyanine dye–DNA interactions: Intercalation, groove binding, and aggregation. In DNA Binders and Related Subjects. Topics in Current Chemistry; Waring, M.J., Chaires, J.B., Eds.; Springer: Berlin/Heidelberg, Germany, 2005; pp. 55–76. [Google Scholar]
- Liu, Z.; Ren, Z.; Zhang, J.; Chuang, C.-C.; Kandaswamy, E.; Zhou, T.; Zuo, L. Role of ROS and nutritional antioxidants in human diseases. Front. Physiol. 2018, 9, 477. [Google Scholar] [CrossRef] [PubMed]
- Foret, M.K.; Lincoln, R.; Do Carmo, S.; Cuello, A.C.; Cosa, G. Connecting the “dots”: From free radical lipid autoxidation to cell pathology and disease. Chem. Rev. 2020, 120, 12757–12787. [Google Scholar] [CrossRef]
- Cameron, R.B.; Beeson, C.C.; Schnellmann, R.G. Development of therapeutics that induce mitochondrial biogenesis for the treatment of acute and chronic degenerative diseases. J. Med. Chem. 2016, 59, 10411–10434. [Google Scholar] [CrossRef] [Green Version]


Publisher’s Note: MDPI stays neutral with regard to jurisdictional claims in published maps and institutional affiliations. |
© 2022 by the authors. Licensee MDPI, Basel, Switzerland. This article is an open access article distributed under the terms and conditions of the Creative Commons Attribution (CC BY) license (https://creativecommons.org/licenses/by/4.0/).
Share and Cite
Song, G.; He, H.; Chen, W.; Lv, Y.; Chu, P.K.; Wang, H.; Li, P. Reversibly Migratable Fluorescent Probe for Precise and Dynamic Evaluation of Cell Mitochondrial Membrane Potentials. Biosensors 2022, 12, 798. https://doi.org/10.3390/bios12100798
Song G, He H, Chen W, Lv Y, Chu PK, Wang H, Li P. Reversibly Migratable Fluorescent Probe for Precise and Dynamic Evaluation of Cell Mitochondrial Membrane Potentials. Biosensors. 2022; 12(10):798. https://doi.org/10.3390/bios12100798
Chicago/Turabian StyleSong, Guofen, Haiwei He, Wanling Chen, Yuanliang Lv, Paul K. Chu, Huaiyu Wang, and Penghui Li. 2022. "Reversibly Migratable Fluorescent Probe for Precise and Dynamic Evaluation of Cell Mitochondrial Membrane Potentials" Biosensors 12, no. 10: 798. https://doi.org/10.3390/bios12100798