Article

A Core–Shell Au@TiO2 and Multi-Walled Carbon Nanotube-Based Sensor for the Electroanalytical Determination of H2O2 in Human Blood Serum and Saliva

by
Ayman Ali Saeed
1,
Mohammed Nooredeen Abbas
1,
Waheed Fathi El-Hawary
2,
Yousry Moustafa Issa
2 and
Baljit Singh
3,*
1
Applied Organic Chemistry Department, Chemical Industries Research Institute, National Research Centre (NRC), Dokki, Giza 12622, Egypt
2
Chemistry Department, Faculty of Science, Cairo University, Giza 12613, Egypt
3
MiCRA Biodiagnostics Technology Gateway & Centre of Applied Science for Health, Technological University Dublin (TU Dublin), D24 FKT9 Dublin 24, Ireland
*
Author to whom correspondence should be addressed.
Biosensors 2022, 12(10), 778; https://doi.org/10.3390/bios12100778
Submission received: 19 August 2022 / Revised: 14 September 2022 / Accepted: 15 September 2022 / Published: 20 September 2022
(This article belongs to the Special Issue Biosensing and Diagnosis)

Abstract

:
A hydrogen peroxide (H2O2) sensor was developed based on core–shell gold@titanium dioxide nanoparticles and multi-walled carbon nanotubes modified glassy carbon electrode (Au@TiO2/MWCNTs/GCE). Core–shell Au@TiO2 material was prepared and characterized using a scanning electron microscopy and energy dispersive X-ray analysis (SEM/EDX), transmission electron microscopy (TEM), atomic force microscopy (AFM), Raman spectroscopy, X-ray diffraction (XRD) and Zeta-potential analyzer. The proposed sensor (Au@TiO2/MWCNTs/GCE) was investigated electrochemically using cyclic voltammetry (CV) and electrochemical impedance spectroscopy (EIS). The analytical performance of the sensor was evaluated towards H2O2 using differential pulse voltammetry (DPV). The proposed sensor exhibited excellent stability and sensitivity with a linear concentration range from 5 to 200 µM (R2 = 0.9973) and 200 to 6000 µM (R2 = 0.9994), and a limit of detection (LOD) of 1.4 µM achieved under physiological pH conditions. The practicality of the proposed sensor was further tested by measuring H2O2 in human serum and saliva samples. The observed response and recovery results demonstrate its potential for real-world H2O2 monitoring. Additionally, the proposed sensor and detection strategy can offer potential prospects in electrochemical sensors development, indicative oxidative stress monitoring, clinical diagnostics, general cancer biomarker measurements, paper bleaching, etc.

Graphical Abstract

1. Introduction

Carbon nanomaterials, including single-walled carbon nanotubes (SWCNTs), multi-walled carbon nanotubes (MWCNTs), nanofibers, activated carbon and graphene, have unique properties such as chemical stability and durability, high electrical conductivity, mechanical strength and a high surface-to-volume ratio which collectively makes them an excellent choice for electrochemical sensors and biosensors development [1,2,3,4,5,6,7,8,9,10]. Carbon nanotubes (CNTs) are an excellent and promising option in fabricating electrochemical sensors owing to their remarkable electrical and thermal conductivity, high surface area, chemical stability and mechanical properties [11,12,13,14]. Metal nanoparticles, due to their excellent conductivity, surface area and remarkable electrocatalytic properties, are considered ideal candidates for the electrochemical detection of hydrogen peroxide (H2O2). They are capable of promoting electron transfer processes and offer abundant catalytic active sites during the H2O2 redox reaction. Carbon-based nanomaterials can be mixed with metal nanoparticles to create composites that have excellent synergistic features, which can improve the sensitivity and overall performance of the modified electrodes.
Core–shell nanomaterials (CSNs) are composite materials with a core–shell structure formed by an inner layer of one material (core) and an exterior layer of another material (shell) [15]. The shell materials are frequently chosen based on their nature and the targeted application. Many advantages can be achieved by carefully selecting shell material, including improved optical/electrical/magnetic properties, multifunctional capability, thermal stability or dispersibility of the materials, reduced precious material content and efficient use. In the core–shell structure, the size and kind of core are also crucial factors. The main advantage of CSNs is that the distinct properties of the core and shell can be combined in a single material, resulting in improved electrocatalytic activity and new physical and chemical properties that are inaccessible or unavailable from the individual components due to lack of this synergistic effect. In order to maintain the nanoparticles’ stability and chemical activity, the core material is also safeguarded against migration and aggregation. CSNs have been studied extensively for a variety of biological applications, including drug administration, cancer treatment, bioimaging, cell labelling, genetic engineering, methanol electrooxidation and so on [16,17]. Due to their higher surface area, superior catalytic activities and biocompatibility, CSNs have been exploited as signal amplifiers and considered promising electron modifiers to create novel sensing platforms, including electrochemical sensors and biosensors. The excellent features of CSNs make them ideal candidates for developing sensitive and novel electrochemical sensors [18,19,20,21,22,23,24,25,26].
Accurate, sensitive and reliable detection of H2O2 has received substantial attention in analytical applications due to the importance of H2O2 in various areas. Hydrogen peroxide is a common peroxide that is used in biological systems, medical diagnosis, environmental analysis, food and many other applications [27,28,29]. Furthermore, H2O2 as a member of reactive oxygen species (ROS), is considered one of the crucial oxidative stress biomarkers. The excessive level of H2O2 can cause a series of diseases such as Alzheimer’s, Parkinson’s, myocardial infarction, inflammatory lung diseases, cancer, etc. [30,31]. Therefore, it is essential to develop an effective method for rapid and reliable monitoring of H2O2 [32,33].
Several analytical methods have been developed for H2O2 determination, including spectrophotometry [34,35], chemiluminescence [36,37,38], fluorescence [39,40,41], chromatography [42,43] and electrochemical sensors [44,45,46,47,48,49,50,51,52,53,54,55,56,57,58,59,60,61,62,63,64,65]. However, due to the technical drawbacks of the traditional methods (low sensitivity and selectivity, laborious, time-consuming and complicated instrumentation), electrochemical sensors have received more attention due to their associated practical advantages, including high sensitivity, portability, simplicity, cost-effectiveness, rapid response time and ease of fabrication and operation. Electrochemical sensors for H2O2 determination are mainly based on enzymatic and non-enzymatic approaches, but due to drawbacks of enzymatic sensors such as instability (temperature, pH-related challenges), shelf-life and immobilization procedures, non-enzymatic sensors have received greater attention [44,45,46,47,48,49,50,51,52,53,54,55,56,57,58,59,60,61].
In this paper, we describe the fabrication of a hydrogen peroxide sensor based on modifying the surface of a glassy carbon electrode (GCE) with a gold@titanium dioxide (Au@TiO2) core–shell nanoparticle and multi-walled carbon nanotubes. The characterization of the core–shell material and fabricated electrode was investigated thoroughly, and the electroanalytical performance of the sensor was studied and discussed in detail. The proposed sensor exhibited excellent electroanalytical performance and electrocatalytic activity toward H2O2 reduction. The practicality of the proposed sensor was tested by measuring H2O2 in human serum and saliva samples which demonstrates its potential for H2O2 monitoring in real-world samples. Additionally, the proposed sensor and detection strategy may offer potential prospects in electrocatalysts and electrochemical sensors development, as well as in other applications, including indicative oxidative stress monitoring, clinical diagnostics, general cancer biomarker measurements, food processing, paper bleaching and environmental analysis.

2. Materials and Methods

2.1. Materials

Gold(III) chloride hydrate (HAuCl4.H2O), trisodium citrate and multi-walled carbon nanotubes (MWCNTs) were purchased from Sigma-Aldrich. Titanium(IV) tetraisopropoxide (TTIP, 98%) and sodium dodecyl sulphate (SDS, 85%) were purchased from ACROS ORGANICS. H2O2 (30%) was purchased from Advent Chembio Pvt. Ltd. Potassium ferricyanide was purchased from VEB Laborchemie Apolda, while potassium ferrocyanide was purchased from BDH.

2.2. Apparatus and Measurements

The cyclic voltammetry (CV), electrochemical impedance spectroscopy (EIS) and differential pulse voltammetry (DPV) measurements were performed using CH Instruments Inc. (CHI 660D). A glassy carbon electrode (GCE, 3 mm diameter) was used as a working electrode, while a platinum wire and an Ag/AgCl reference electrode (3 M KCl) were used as counter and reference electrodes, respectively. The experiments of electrochemical characterization were carried out in 5 mM [Fe(CN)6]3−/4− solution as a redox probe from +0.7 V to −0.4 V, while the different concentrations of H2O2 (5 to 6000 µM) were prepared in 0.1 M PBS saturated with N2.
Raman spectroscopy was carried out using WITec alpha300 R at 532 nm. Zeta potential was measured using Malvern Zetasizer zs. Transmission electron microscopy (TEM) images were recorded using a JEOL JEM-1230. Surface morphology characterization and identification were performed using scanning electron microscopy (SEM, TESCAN VEGA3) coupled with energy dispersive X-ray analysis (EDX, BRUKER) and an atomic force microscope (5600LS, Agilent, Santa Clara, CA, USA). X-ray diffraction (XRD) was performed using an X-ray diffractometer (BRUKER, D8 DISCOVER).

2.3. Synthesis of Gold Nanoparticles (AuNPs)

Gold(III) chloride solution (147 mM, 100 µL) was added to distilled water (50 mL) to prepare 0.01% (w/v) solution and heated until boiling. In total, 1% (w/v, 2 mL) trisodium citrate was added under vigorous stirring, and the color of the solution changed from pale yellow to blue and finally red. The solution was cooled to room temperature and stored at 4 °C. The final concentration of the as-prepared gold nanoparticles was 58 ppm.

2.4. Synthesis of Core–Shell AuNPs@TiO2 and AuNPs@TiO2/MWCNTs

Au@TiO2 was prepared by modifying the preparation methods mentioned in previous reports [66,67,68]. Au@TiO2 with different wt% of core Au (1.09, 2.17, 4.24, 8.14 and 11.74%) was prepared. For Au@TiO2 (8.14% Au), 20 mL of the prepared AuNPs stock solution was added dropwise to 20 mL of 0.1 mol/L SDS solution under vigorous stirring for 15 min. The mixture was centrifuged at 12,000 rpm for 10 min. The SDS-capped AuNPs were settled at the bottom of the centrifuge tube while the supernatant was removed. The SDS-capped AuNPs were washed three times with distilled water to remove the excess free SDS. In total, 50 µL of TTIP were mixed with 500 µL of isopropanol, and the mixture was added dropwise to the washed SDS-capped AuNPs under vigorous stirring. The formed precipitate was washed with ethanol and allowed to dry. The dried product was calcinated at 500 °C for 4 hrs. Then, 1 mg of AuNPs@TiO2 was suspended in 980 µL distilled water, and 20 µL of 1 mg/mL MWCNTs were added. Finally, the mixture was sonicated for 30 min.

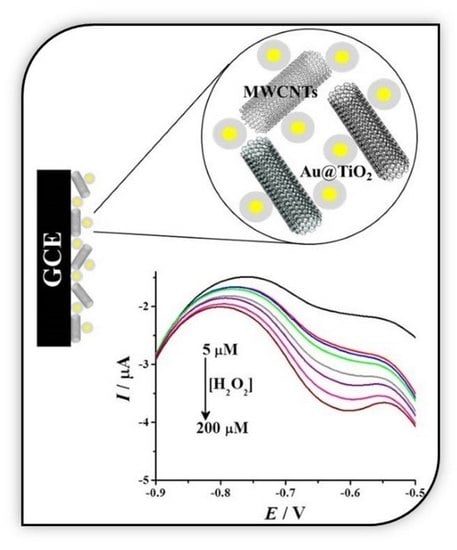
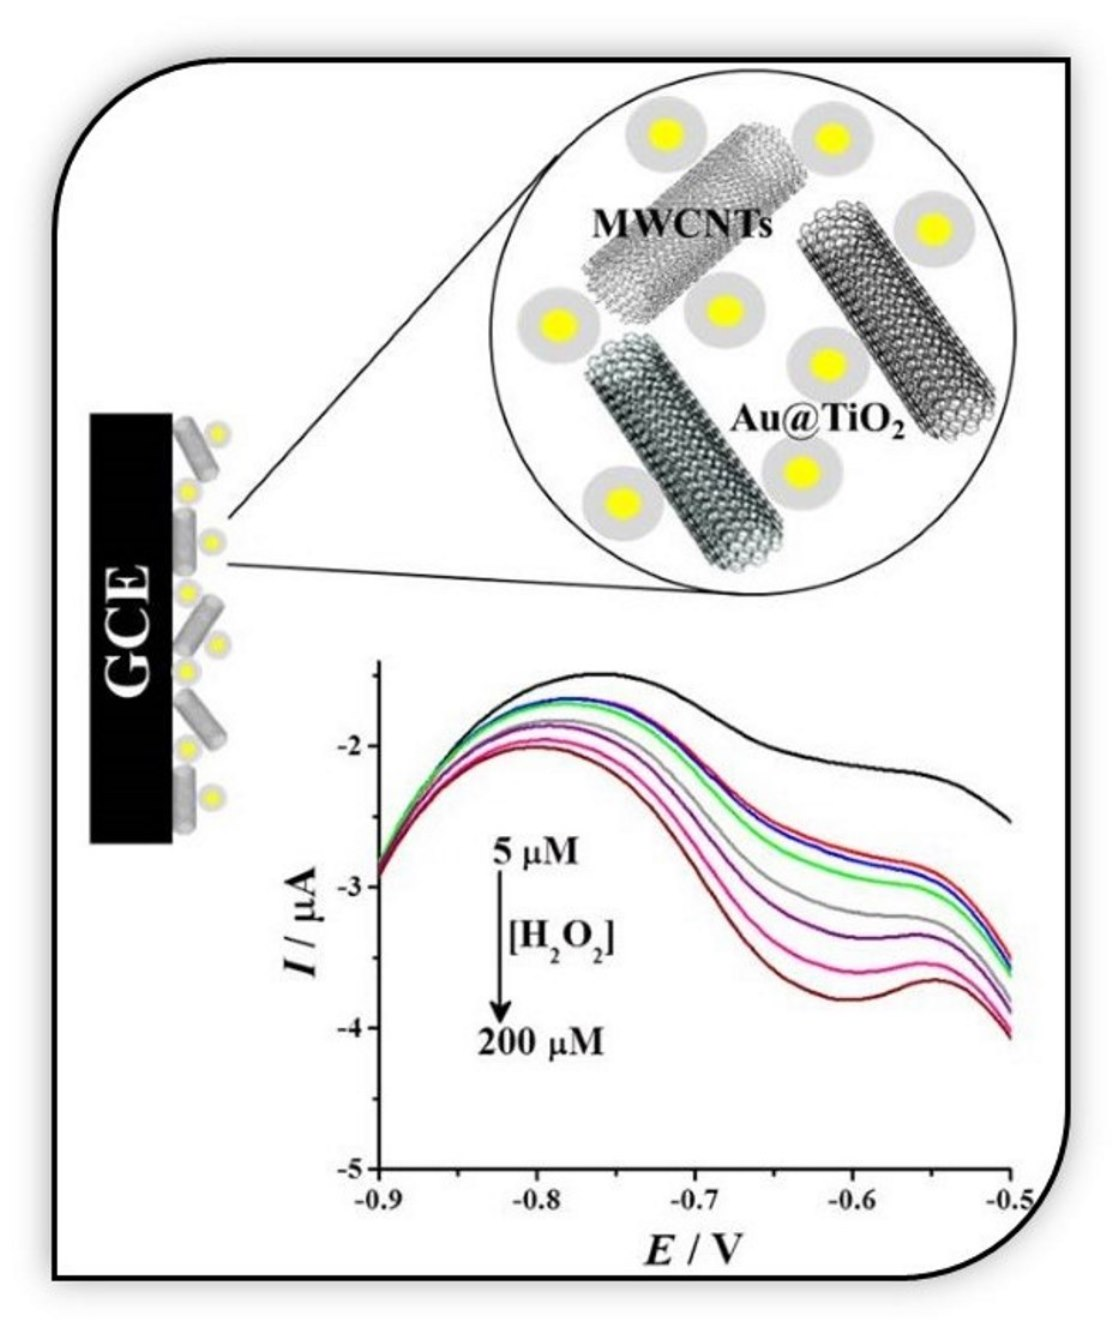
2.5. Fabrication of H2O2 Electrode (Au@TiO2/MWCNTs/GCE)

Before making the electrochemical measurements, glassy carbon working electrodes were polished using alumina powders (1.0, 0.3 and 0.05 µm size), followed by washing with acetone and finally with deionized water and dried at room temperature. The glassy carbon electrode was firstly activated by recording CV in 0.5 M H2SO4 from 1.4 to −0.2 V for 20 cycles at a scan rate of 0.1 V/s. The electrode was then washed with distilled water and allowed to dry. Then, 5 µL of the Au@TiO2/MWCNTs were drop-casted onto the electrode surface and allowed to dry at room temperature.

2.6. Real Sample Analysis

The proposed H2O2 sensor (Au@TiO2/MWCNTs/GCE) was tested for the determination of H2O2 in human serum and saliva samples. Three volunteers participated in this study, two males and one female, with different ages varying from 24 to 40 years. Saliva samples were collected in the morning, volunteers were asked to rinse their mouths with water for 1 min, and then samples were collected after 3 min. Collected saliva samples were centrifuged for three minutes at 4000 rpm in order to settle down any food residues, and clear saliva was diluted 10 times with 0.1 M PBS (pH 7.4) for analysis. For the serum analysis, a 10 mL sample was collected, and the blood was allowed to coagulate for 1 h, then centrifuged at 5000 rpm for 5 min, and finally, the upper serum layer was collected and diluted 20 times with PBS for analysis.

3. Results and Discussion

3.1. UV-Visible Spectroscopy

In order to ensure the success of Au@TiO2 preparation, UV-Visible absorption spectra were recorded for AuNPs, TiO2 and Au@TiO2. As shown in Figure 1, in the case of AuNPs, the spectrum showed the characteristic absorption peak at 524 nm. TiO2 nanoparticles are commonly used as an additive in most sunscreen formulations due to their broad absorption within the UVB and UVA region, with a maximum of 327.5 nm. The successful preparation of Au@TiO2 was accompanied and confirmed by the disappearance of the AuNPs peak, which is attributed to the complete coverage of the core (Au) by the TiO2 shell. Moreover, a slight blue shift was observed from 327.5 nm to 323.5 nm.

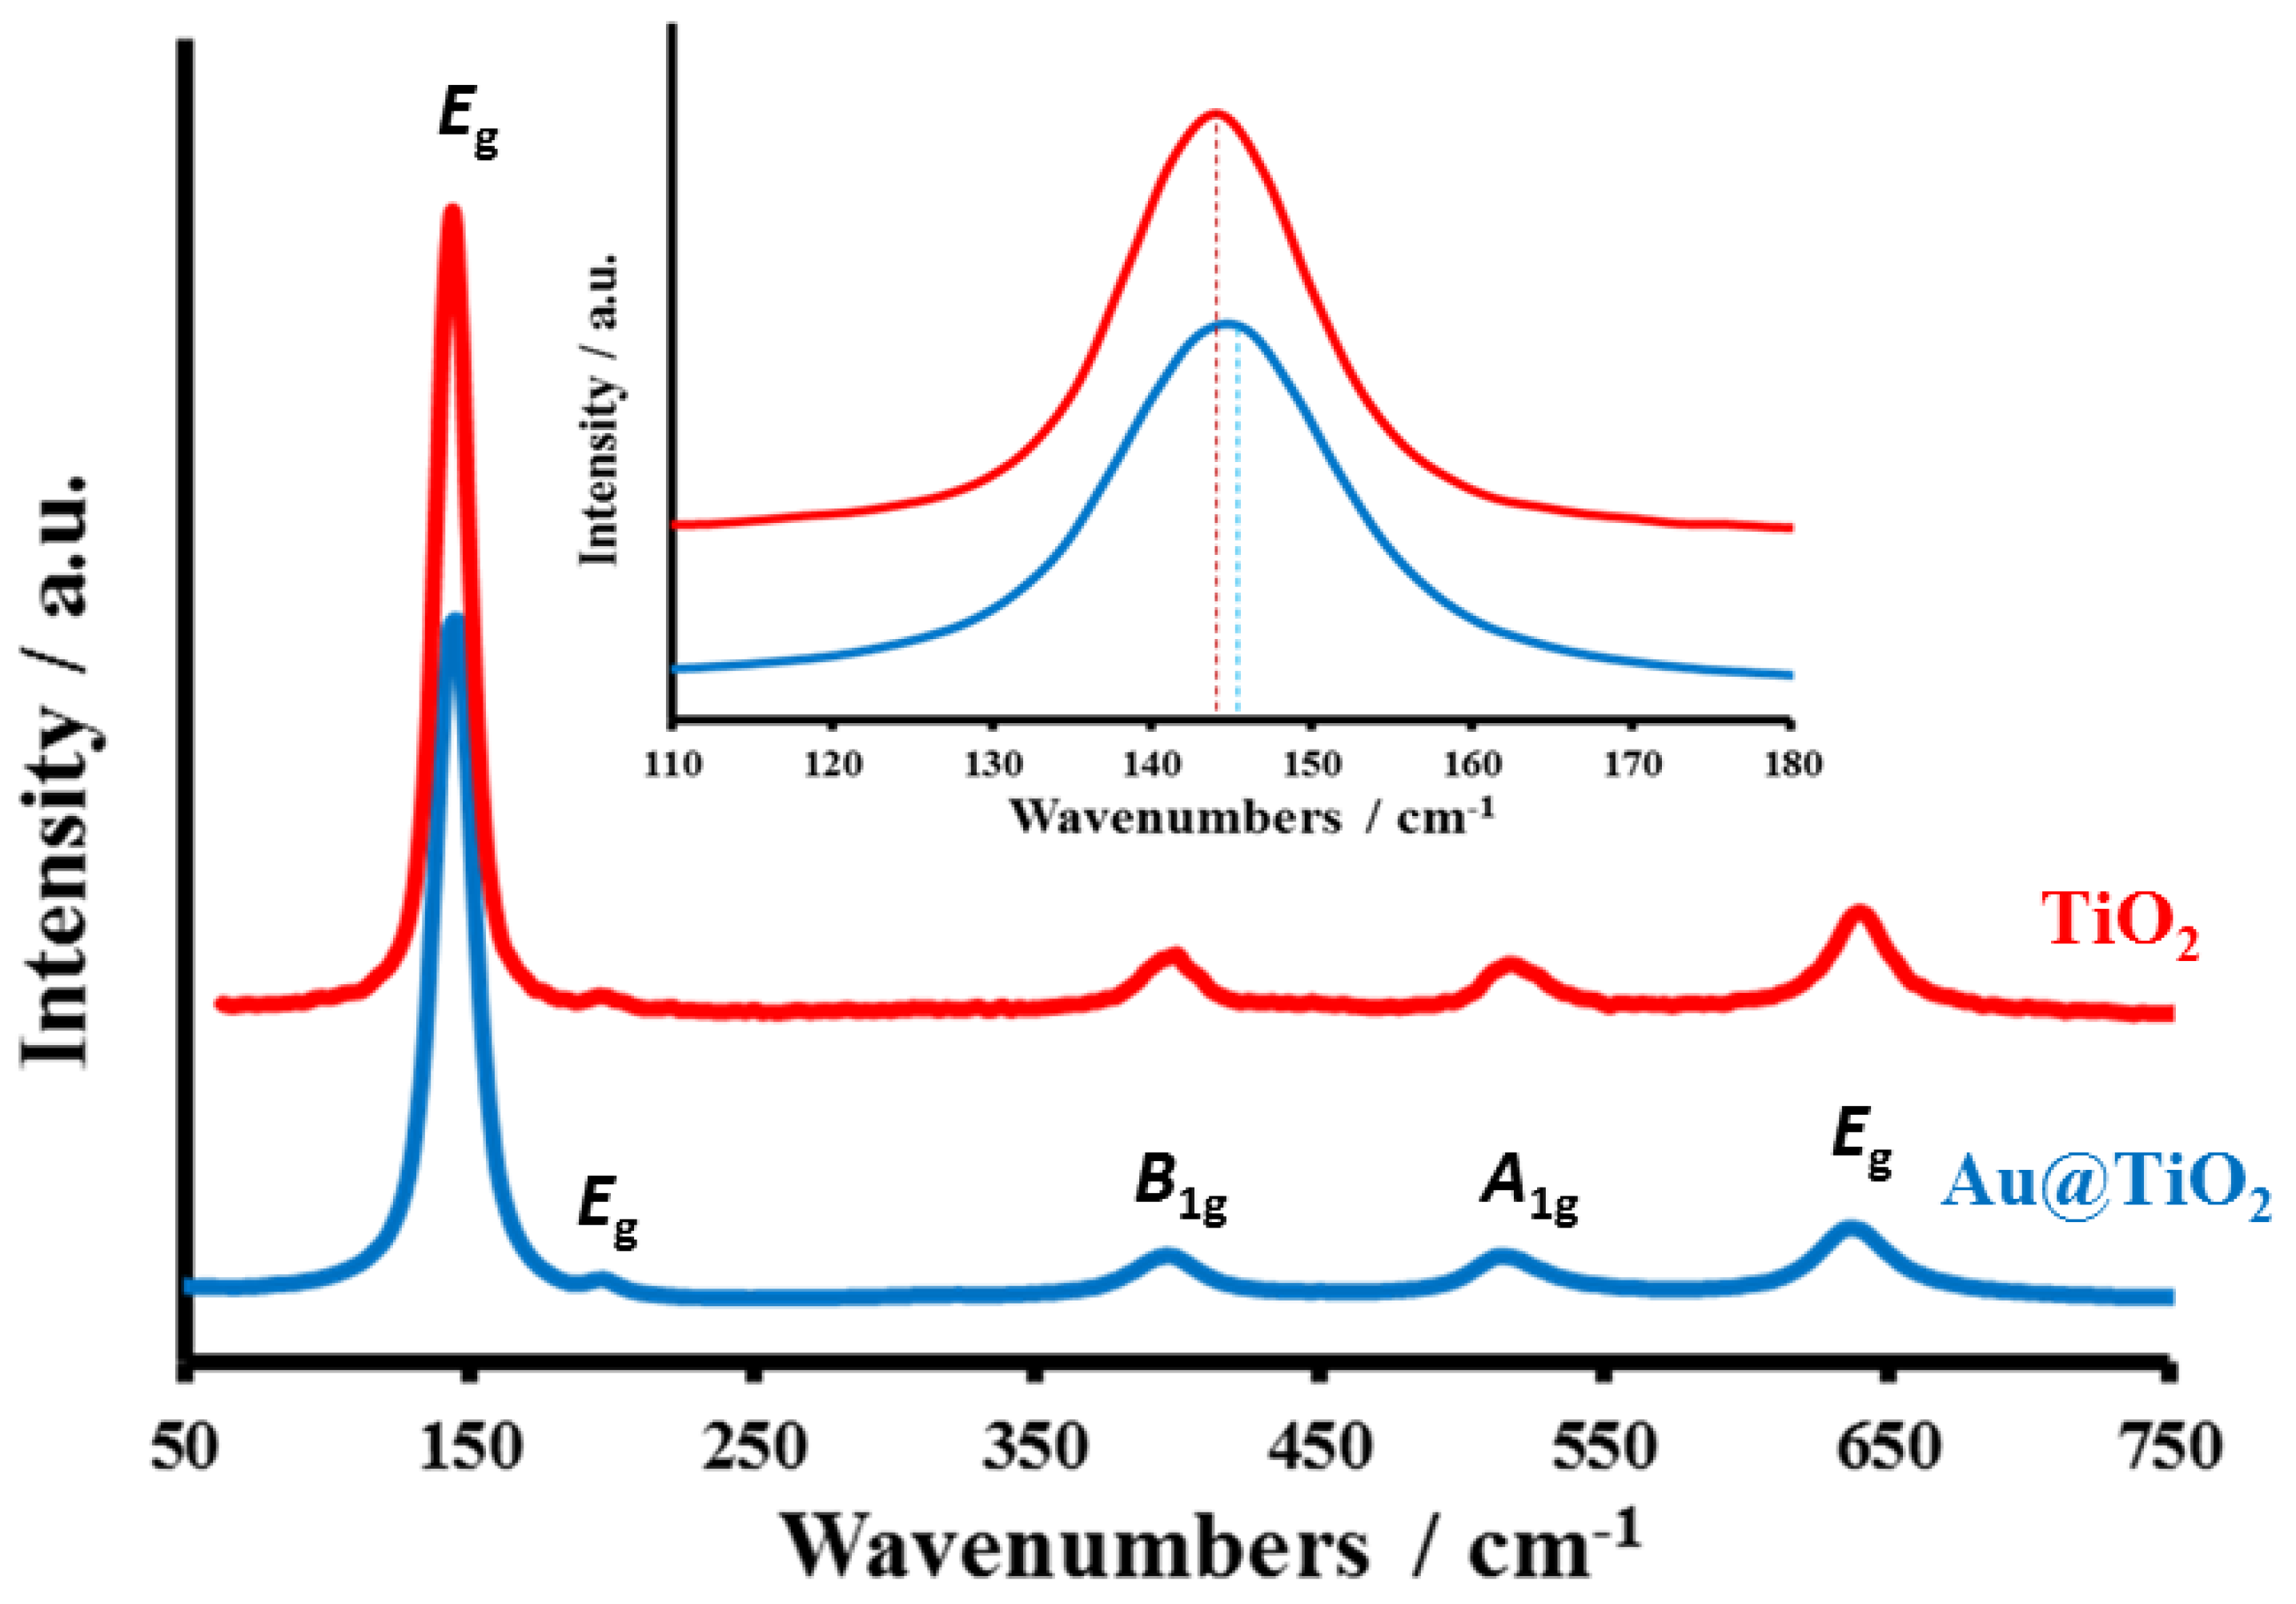
3.2. Raman Spectroscopy

The TiO2 and Au@TiO2 materials were characterized by Raman spectroscopy, and the associated spectra are shown in Figure 2. The existence of bands at 144 (Eg), 198 (Eg), 396 (B1g), 515 (A1g) and 638 (Eg) cm−1 are unquestionably linked to the TiO2 anatase phase [69,70,71]. In the case of Au@TiO2, the typical Eg peak of TiO2 at 144 cm−1 shifted to a higher wavenumber (146 cm−1), indicating more crystalline disorders in the anatase TiO2. These crystalline disorders, which developed at the point where Au and TiO2 came into contact, impact the vibrational frequency of anatase TiO2 and serve as traps for the produced photoelectrons.

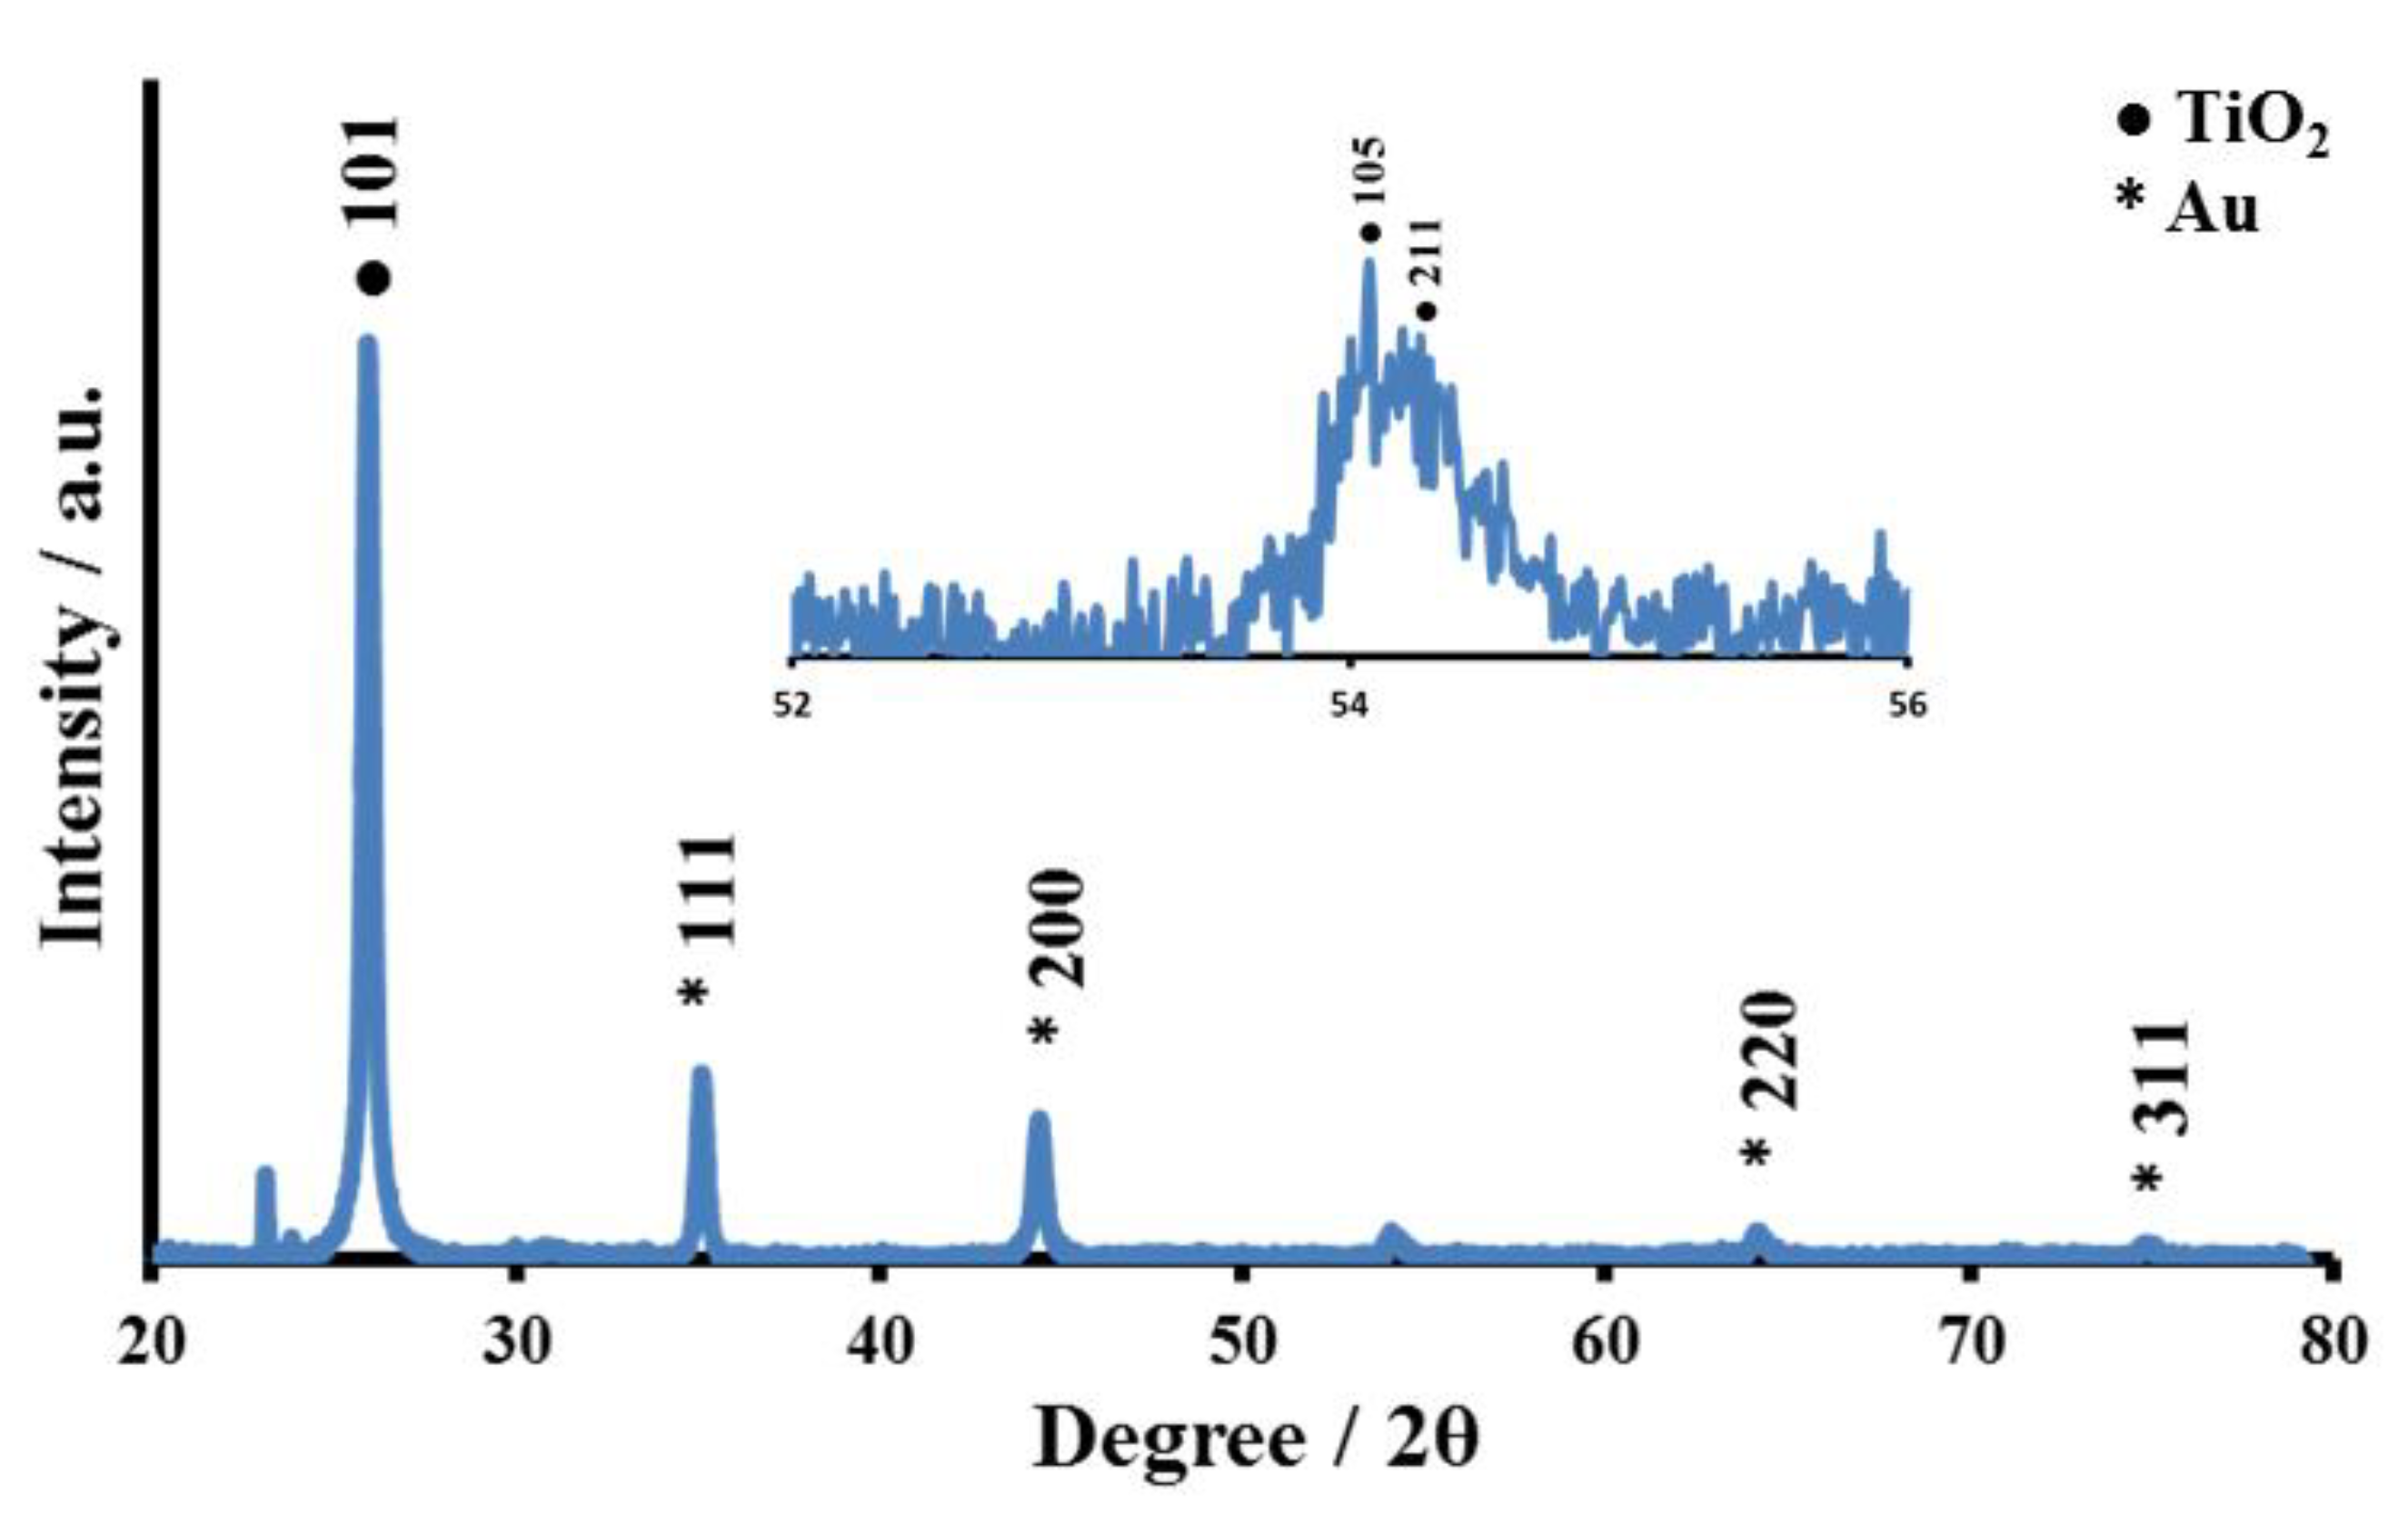
3.3. X-ray Diffraction (XRD)

The crystalline nature of the core–shell Au@TiO2 material was characterized by X-ray diffraction (XRD), as shown in Figure 3. The samples show two series of peaks, which can be attributed to the anatase-TiO2 and the face-centered-cubic Au. Planes (101), (200), (105) and (211) of anatase-TiO2 are responsible for the peaks at 2θ of 25.7°, 44.4°, 54.0° and 54.3°, while planes (111), (200), (220) and (311) of face-centered-cubic Au are associated with the remaining peaks at 2θ of 38.2°, 44.4°, 64.7° and 77.7°, in agreement with the literature [72].

3.4. Zeta-Potential Analyzer and Size Distribution

Higher zeta potential values indicate that the periphery surface charge of the nanoparticles is higher, which encourages repulsion and prevents the formation of aggregates, a sign of the stability of the core–shell nanoparticles. Au@TiO2 core–shell with different wt% of Au (1.09, 2.17, 4.24, 8.14 and 11.74%) were prepared, and their Zeta potentials were measured to evaluate the effect of the weight percent of the core gold on the surface charge and stability of the whole core–shell material. As seen in Figure 4, the increase in the weight percent of core gold is accompanied by a positive increase in the value of Zeta potential until it reaches nearly stable values between 4.24% and 8.14%. Therefore, we decided to use 8.14% of Au content in further studies.

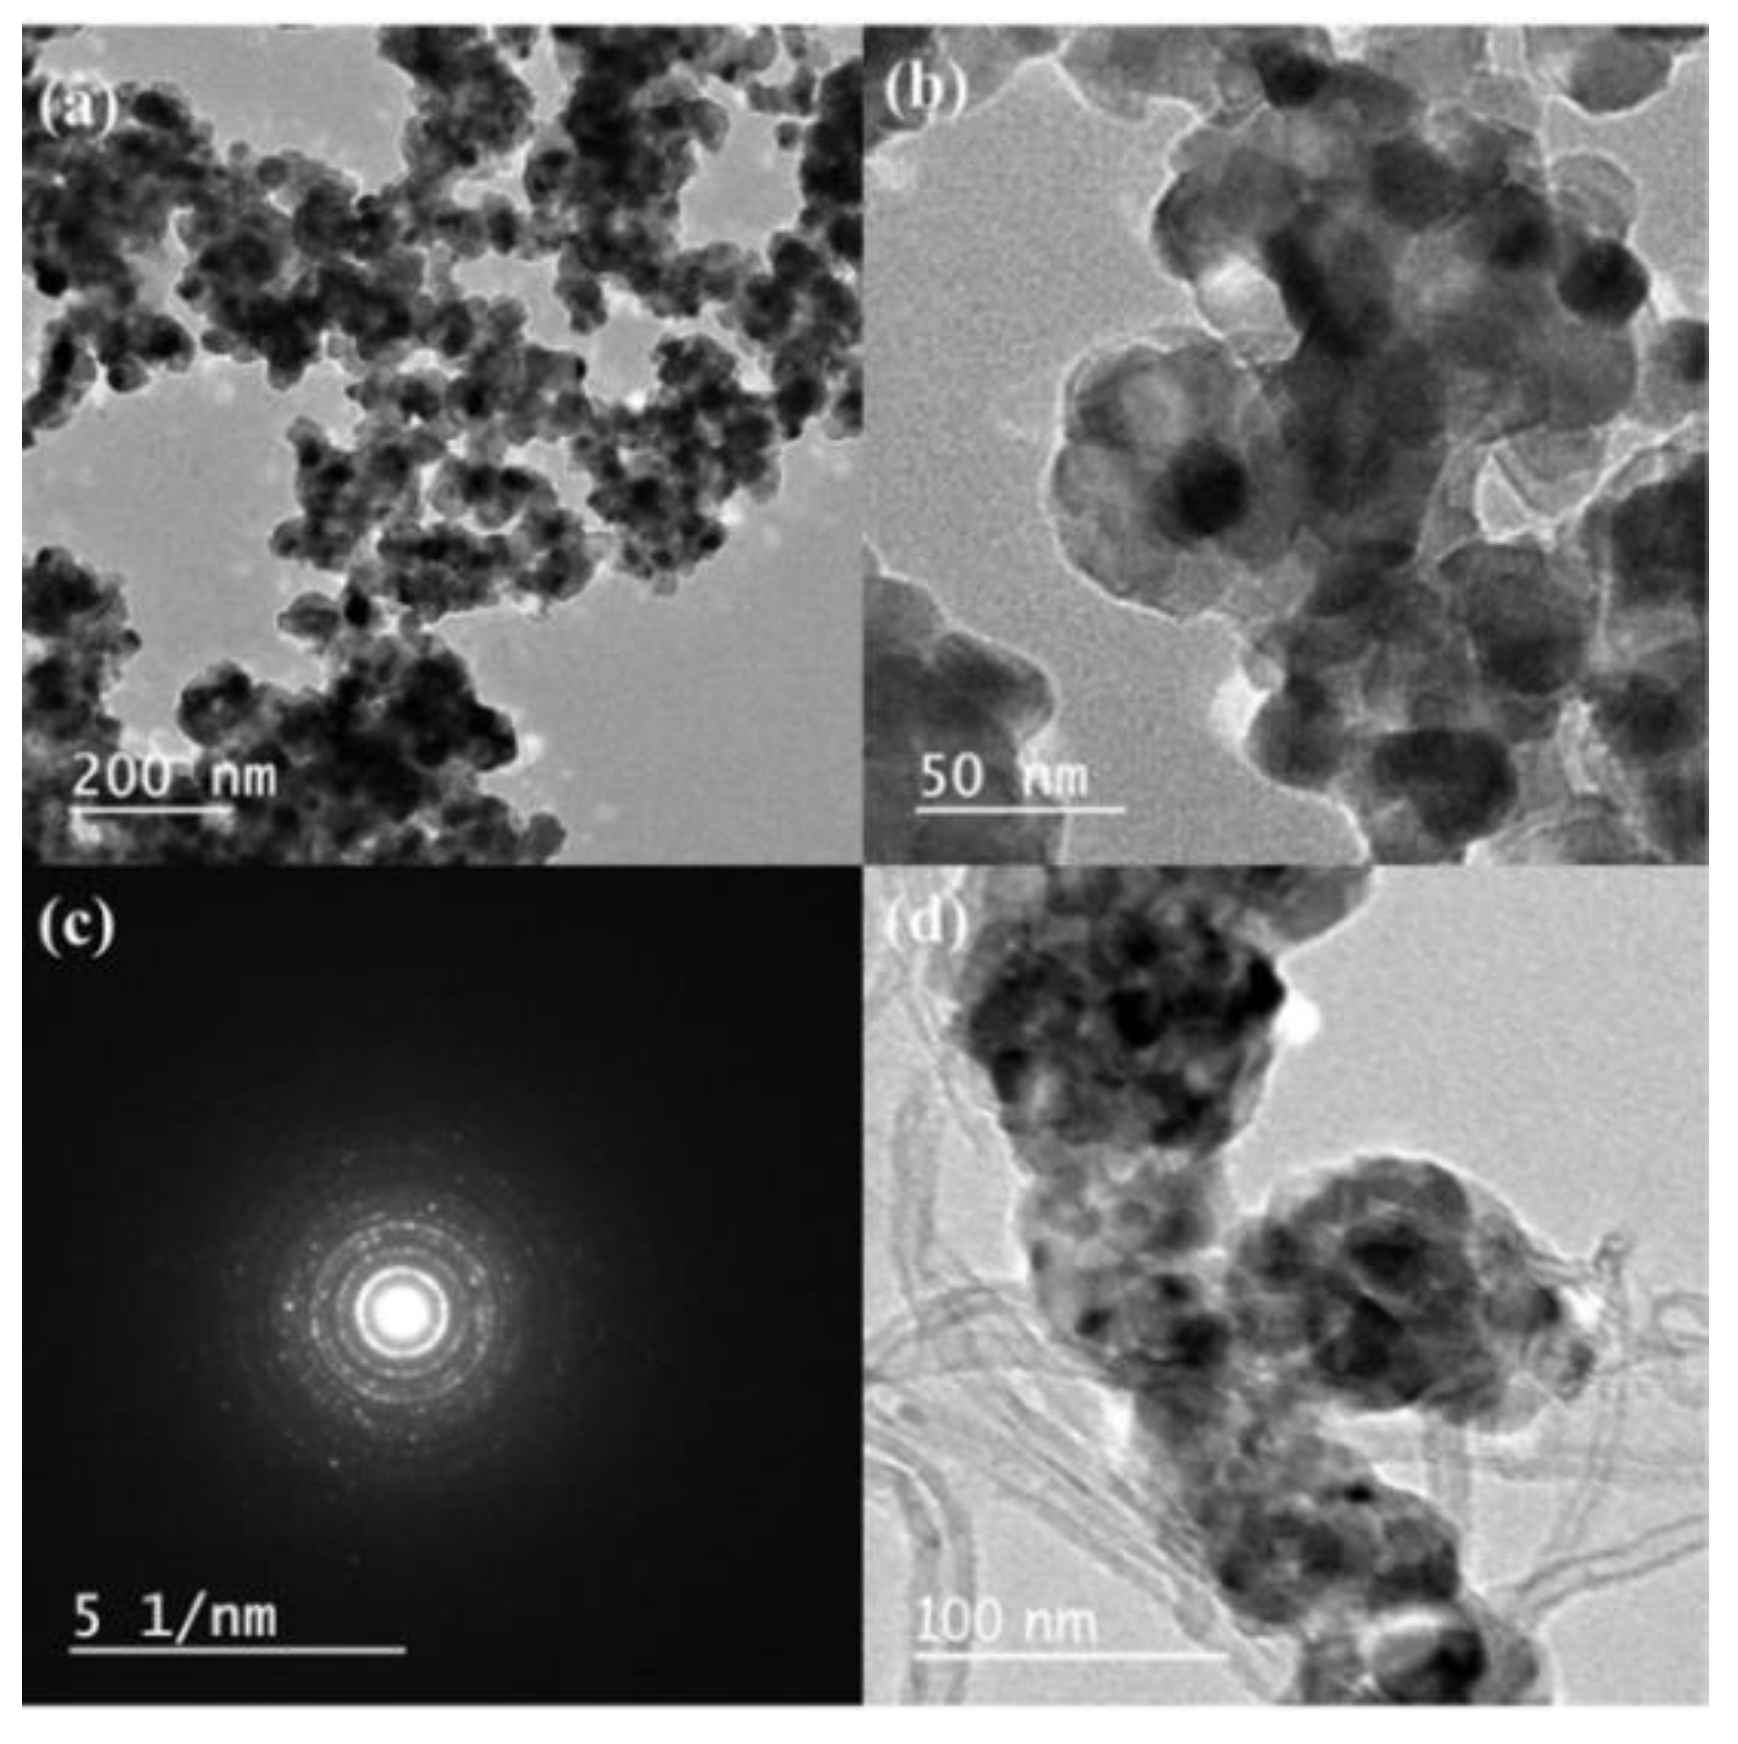
3.5. Transmission Electron Microscopy (TEM)

TEM analysis was performed to directly measure the size, size distribution and morphology of Au@TiO2 and Au@TiO2/MWCNTs, which are shown in Figure 5a–d. The spherical gold nanoparticles were observed as a dark core, with about 13–15 nm diameter, in the center and totally encapsulated by a brighter shell of TiO2. It can be observed that gold nanoparticles are well-dispersed and uniformly incorporated in the TiO2 matrix without any significant agglomeration. Figure 5c shows the selected area electron diffraction pattern, which agrees with the XRD data and reveals that the compositions of core–shell (Au and TiO2) reflect their signatures of crystal planes in the hybrid or composite form. The combination of MWCNTs with core–shell Au@TiO2 is confirmed and presented in Figure 5d.

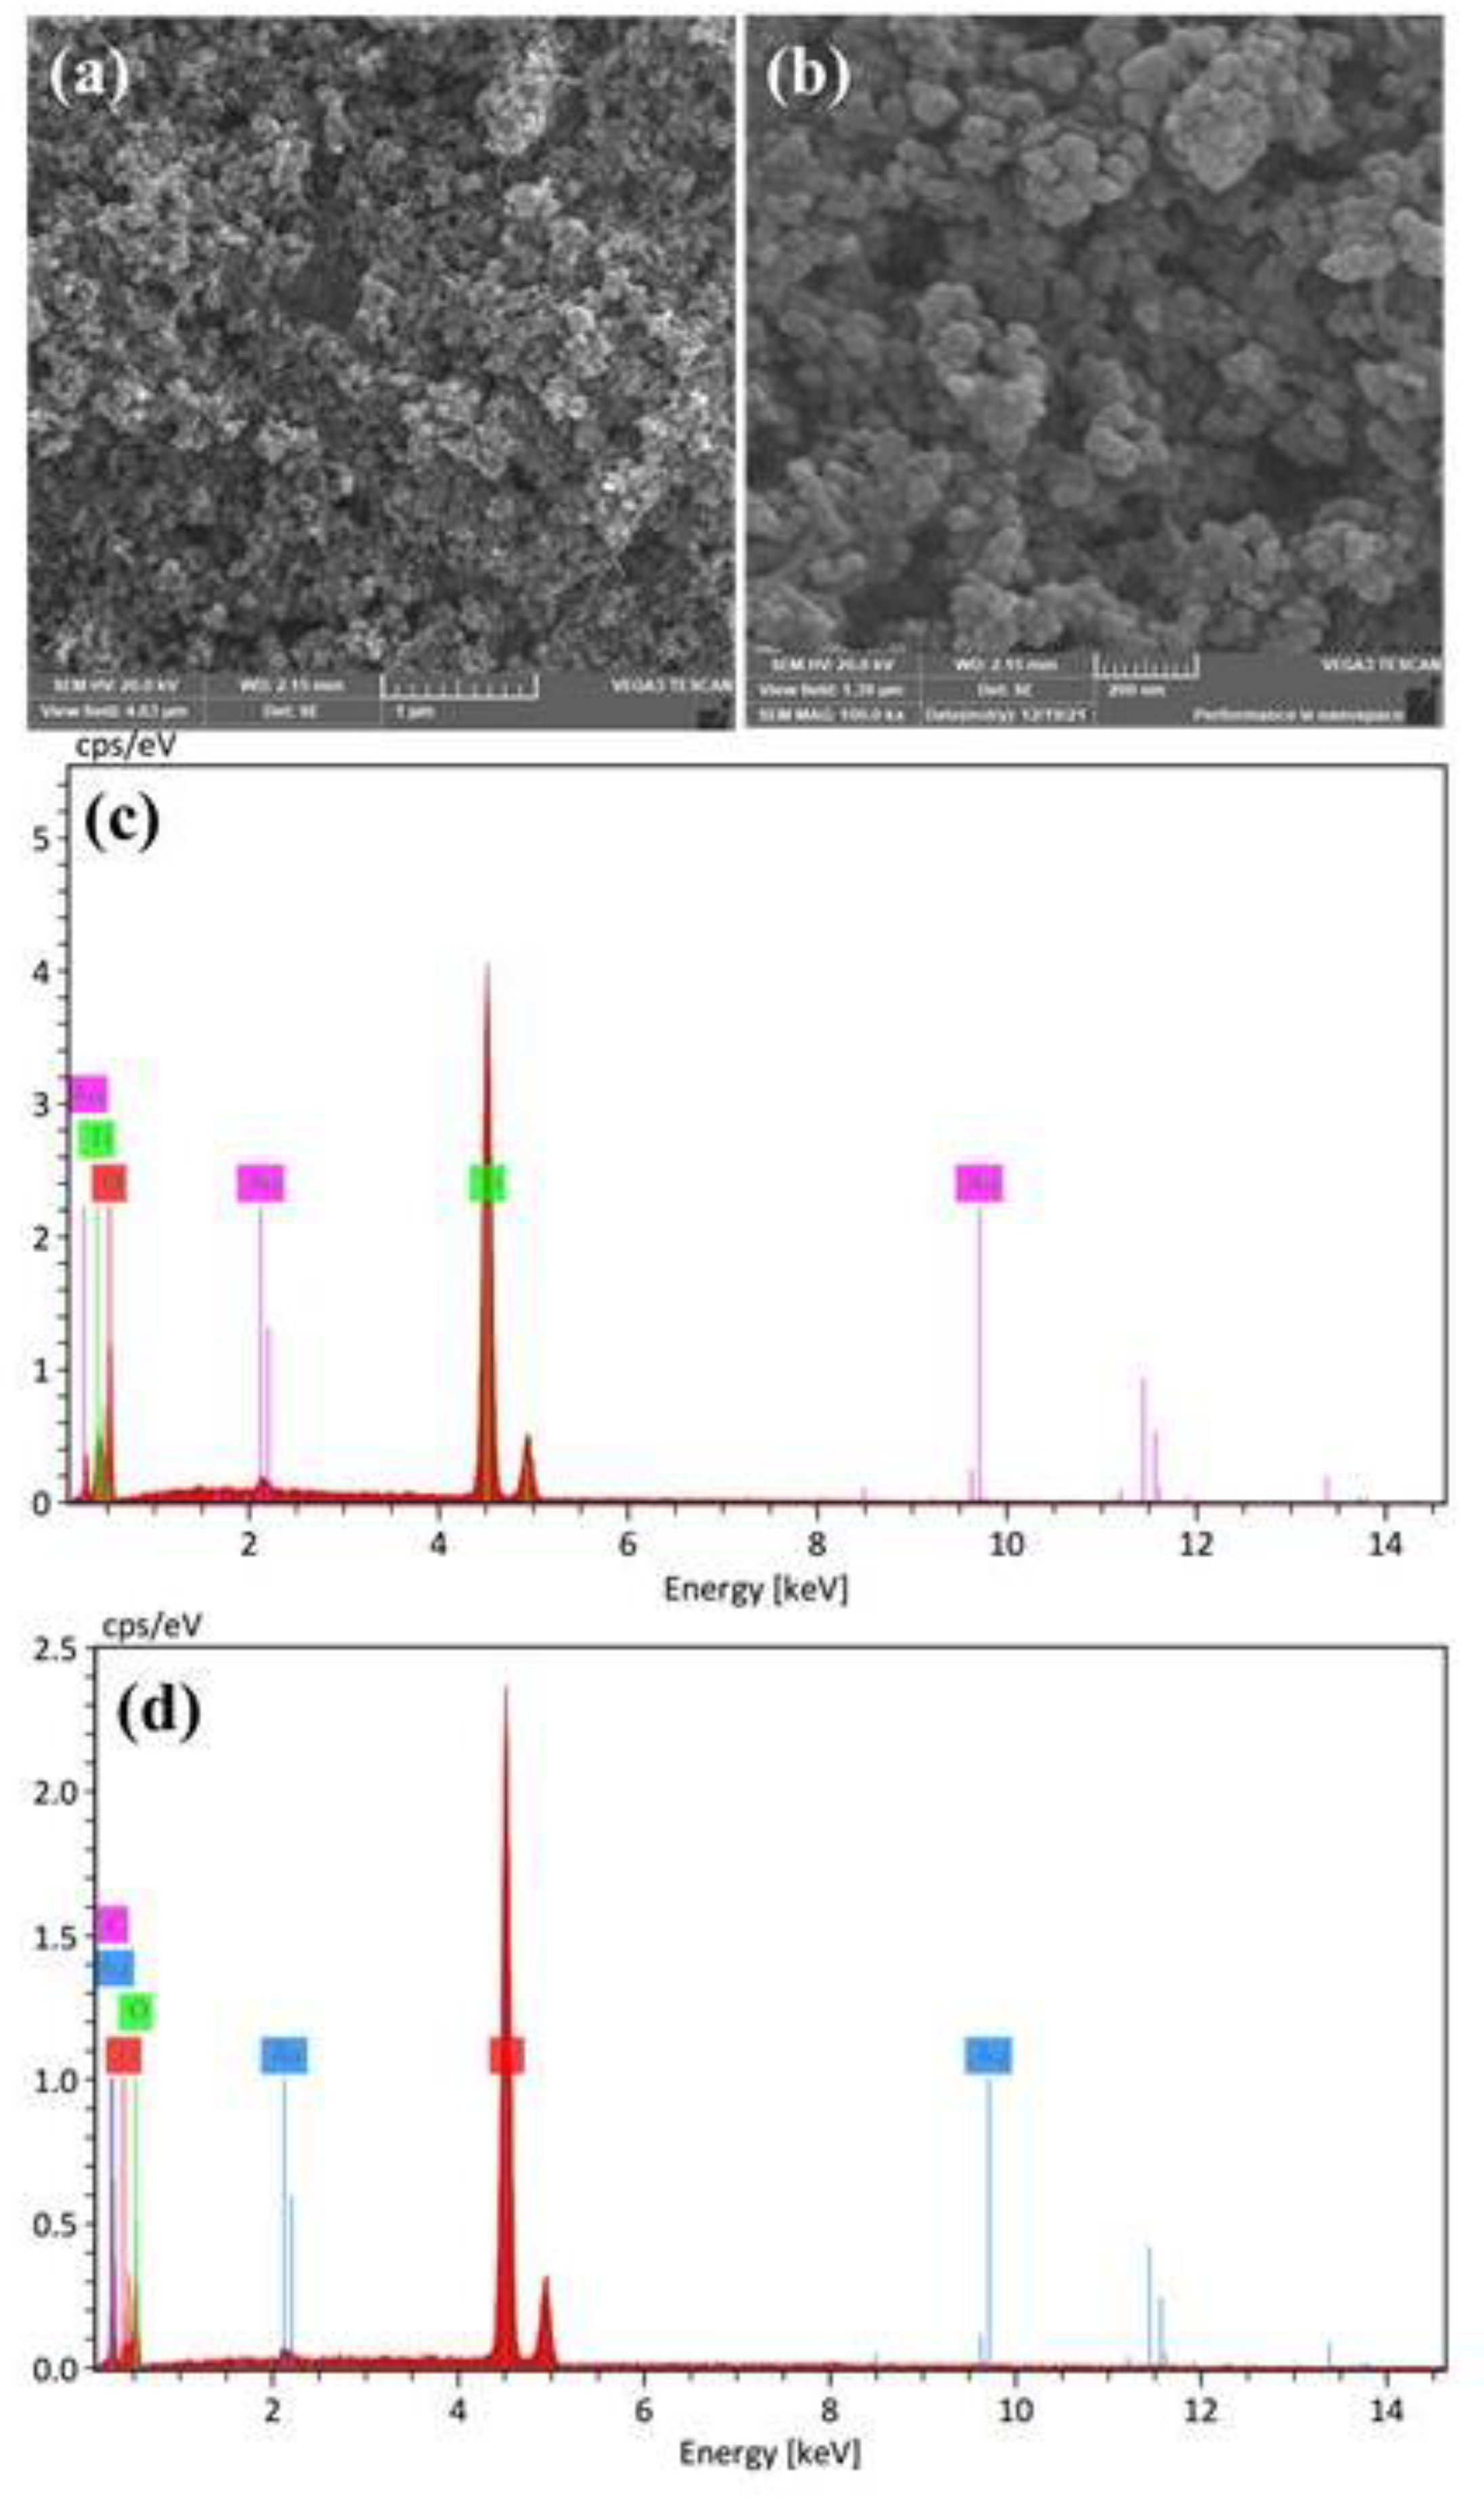
3.6. Scanning Electron Microscopy and Energy Dispersive X-ray Analysis (SEM and EDX)

SEM images were recorded in order to describe the surface morphology and distribution of the Au@TiO2 material. As shown in Figure 6a,b, the presence of spherical and uniformly distributed particles was observed with a size of approximately 30.29 nm (diameter). The modification of the electrode surface with such core–shell material promises a high surface area and better electrocatalytic activity. The elemental analysis for Au@TiO2 and Au@TiO2/MWCNT materials was performed, and EDX profiles are shown in Figure 6c,d. The EDX profile for Au@TiO2/MWCNT (Figure 6d) confirms the presence of Ti, O and Au and C with a weight percent of 39.88%, 46.92%, 7.76% and 5.45%, respectively. The Au amount observed from the EDX measurements is in approximate agreement with the theoretical value of 8.14%.

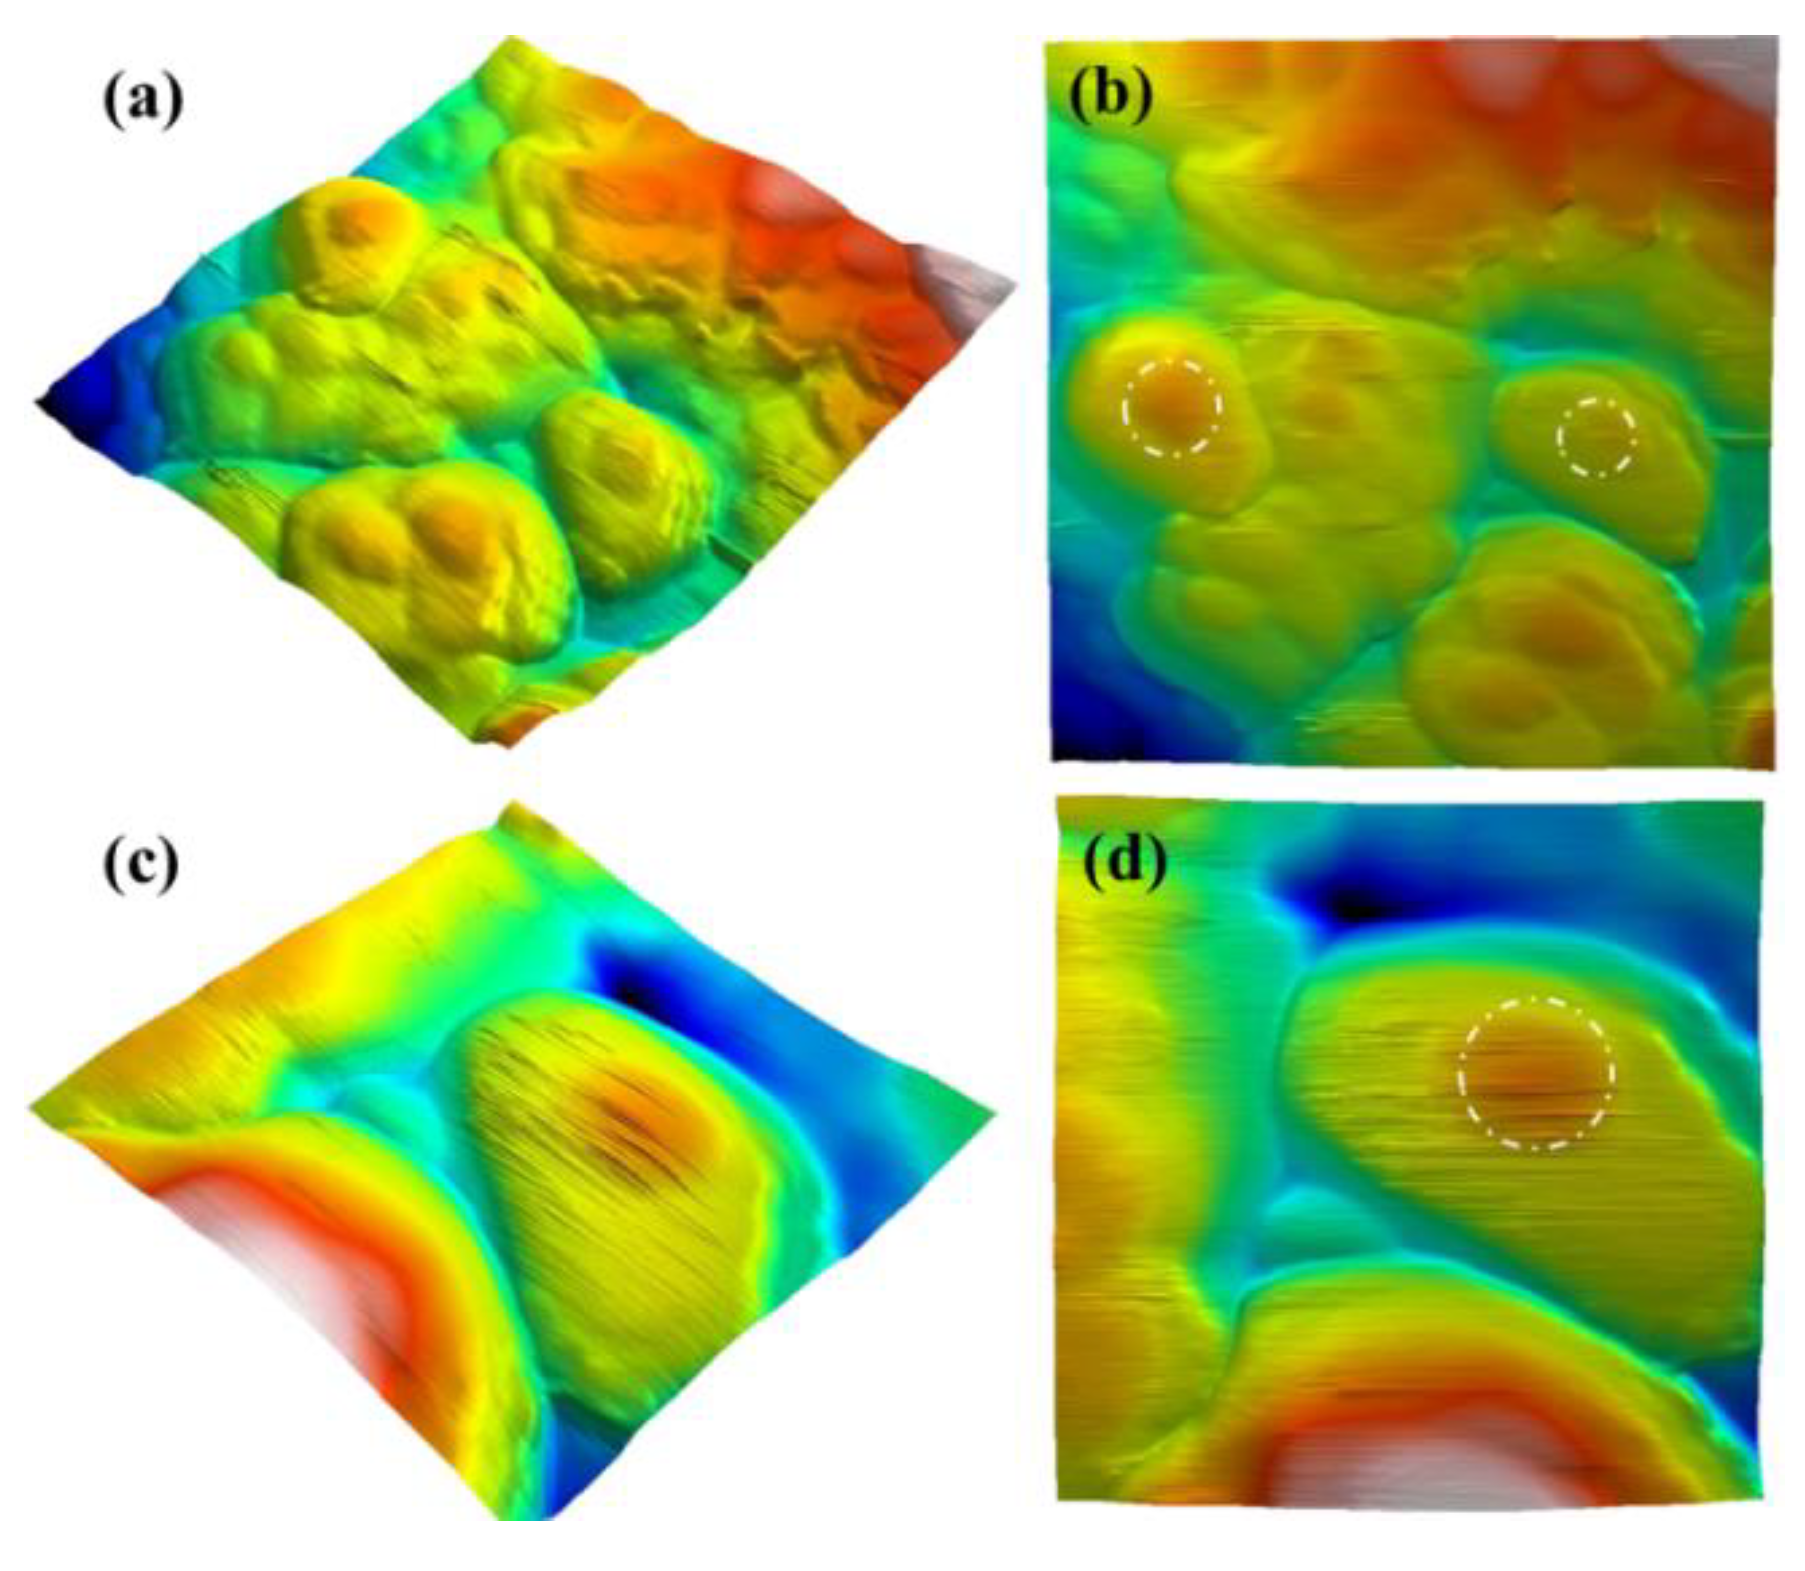
3.7. Atomic Force Microscopy (AFM)

AFM analysis was performed to characterize the surface morphology of the Au@TiO2-modified surface, and the images are shown in Figure 7. It is obvious that the topography of the core–shell-modified surface has a high surface roughness with a root mean square height (Sq) of 35.4 nm. As shown in Figure 7a,c, the 3D images confirm the success of the core–shell preparation process. Protrusions were observed in the TiO2 shell as the embedded gold nanoparticles in the core push the TiO2 shell out.

3.8. Cyclic Voltammetry

Cyclic voltammetry characterization (Figure 8 and Table 1) was performed by recording the voltammograms for various stages of electrode modification in 5 mM [Fe(CN)6]3−/4− (1:1) in 0.1 M KCl at a scan rate of 100 mV/s (potential window 0.7 to −0.4 V). The current response for the MWCNTs modified electrode (IOxi = 60.71 µA and IRed = −61.61 µA, ΔE = 129 mV) was improved very significantly compared to the bare GCE (IOxi = 45.83 µA, IRed = −44.61 µA, ΔE = 220 mV). This is attributed to the high conductivity of MWCNTs, which improve the electron transfer kinetics between the electrode surface and redox couple.
The drop-casting of the as-prepared core–shell Au@TiO2 material onto GCE also showed an increase in the current response (IOxi = 61.81 µA, IRed = −63.04 µA) with a decrease in ΔE value (126 mV) and this is attributed to the combined catalytic activity of TiO2 and Au. Au@TiO2/MWCNTs/GCE showed a much better current response compared to bare GCE, MWCNTs/GCE and Au@TiO2/GCE with IOxi = 69.77 µA, IRed = −69.56 µA and the lowest ΔE (115 mV) was observed. This improvement is attributed to the synergistic effect of the core–shell Au@TiO2 structure and the high electrical conductivity of MWCNTs.

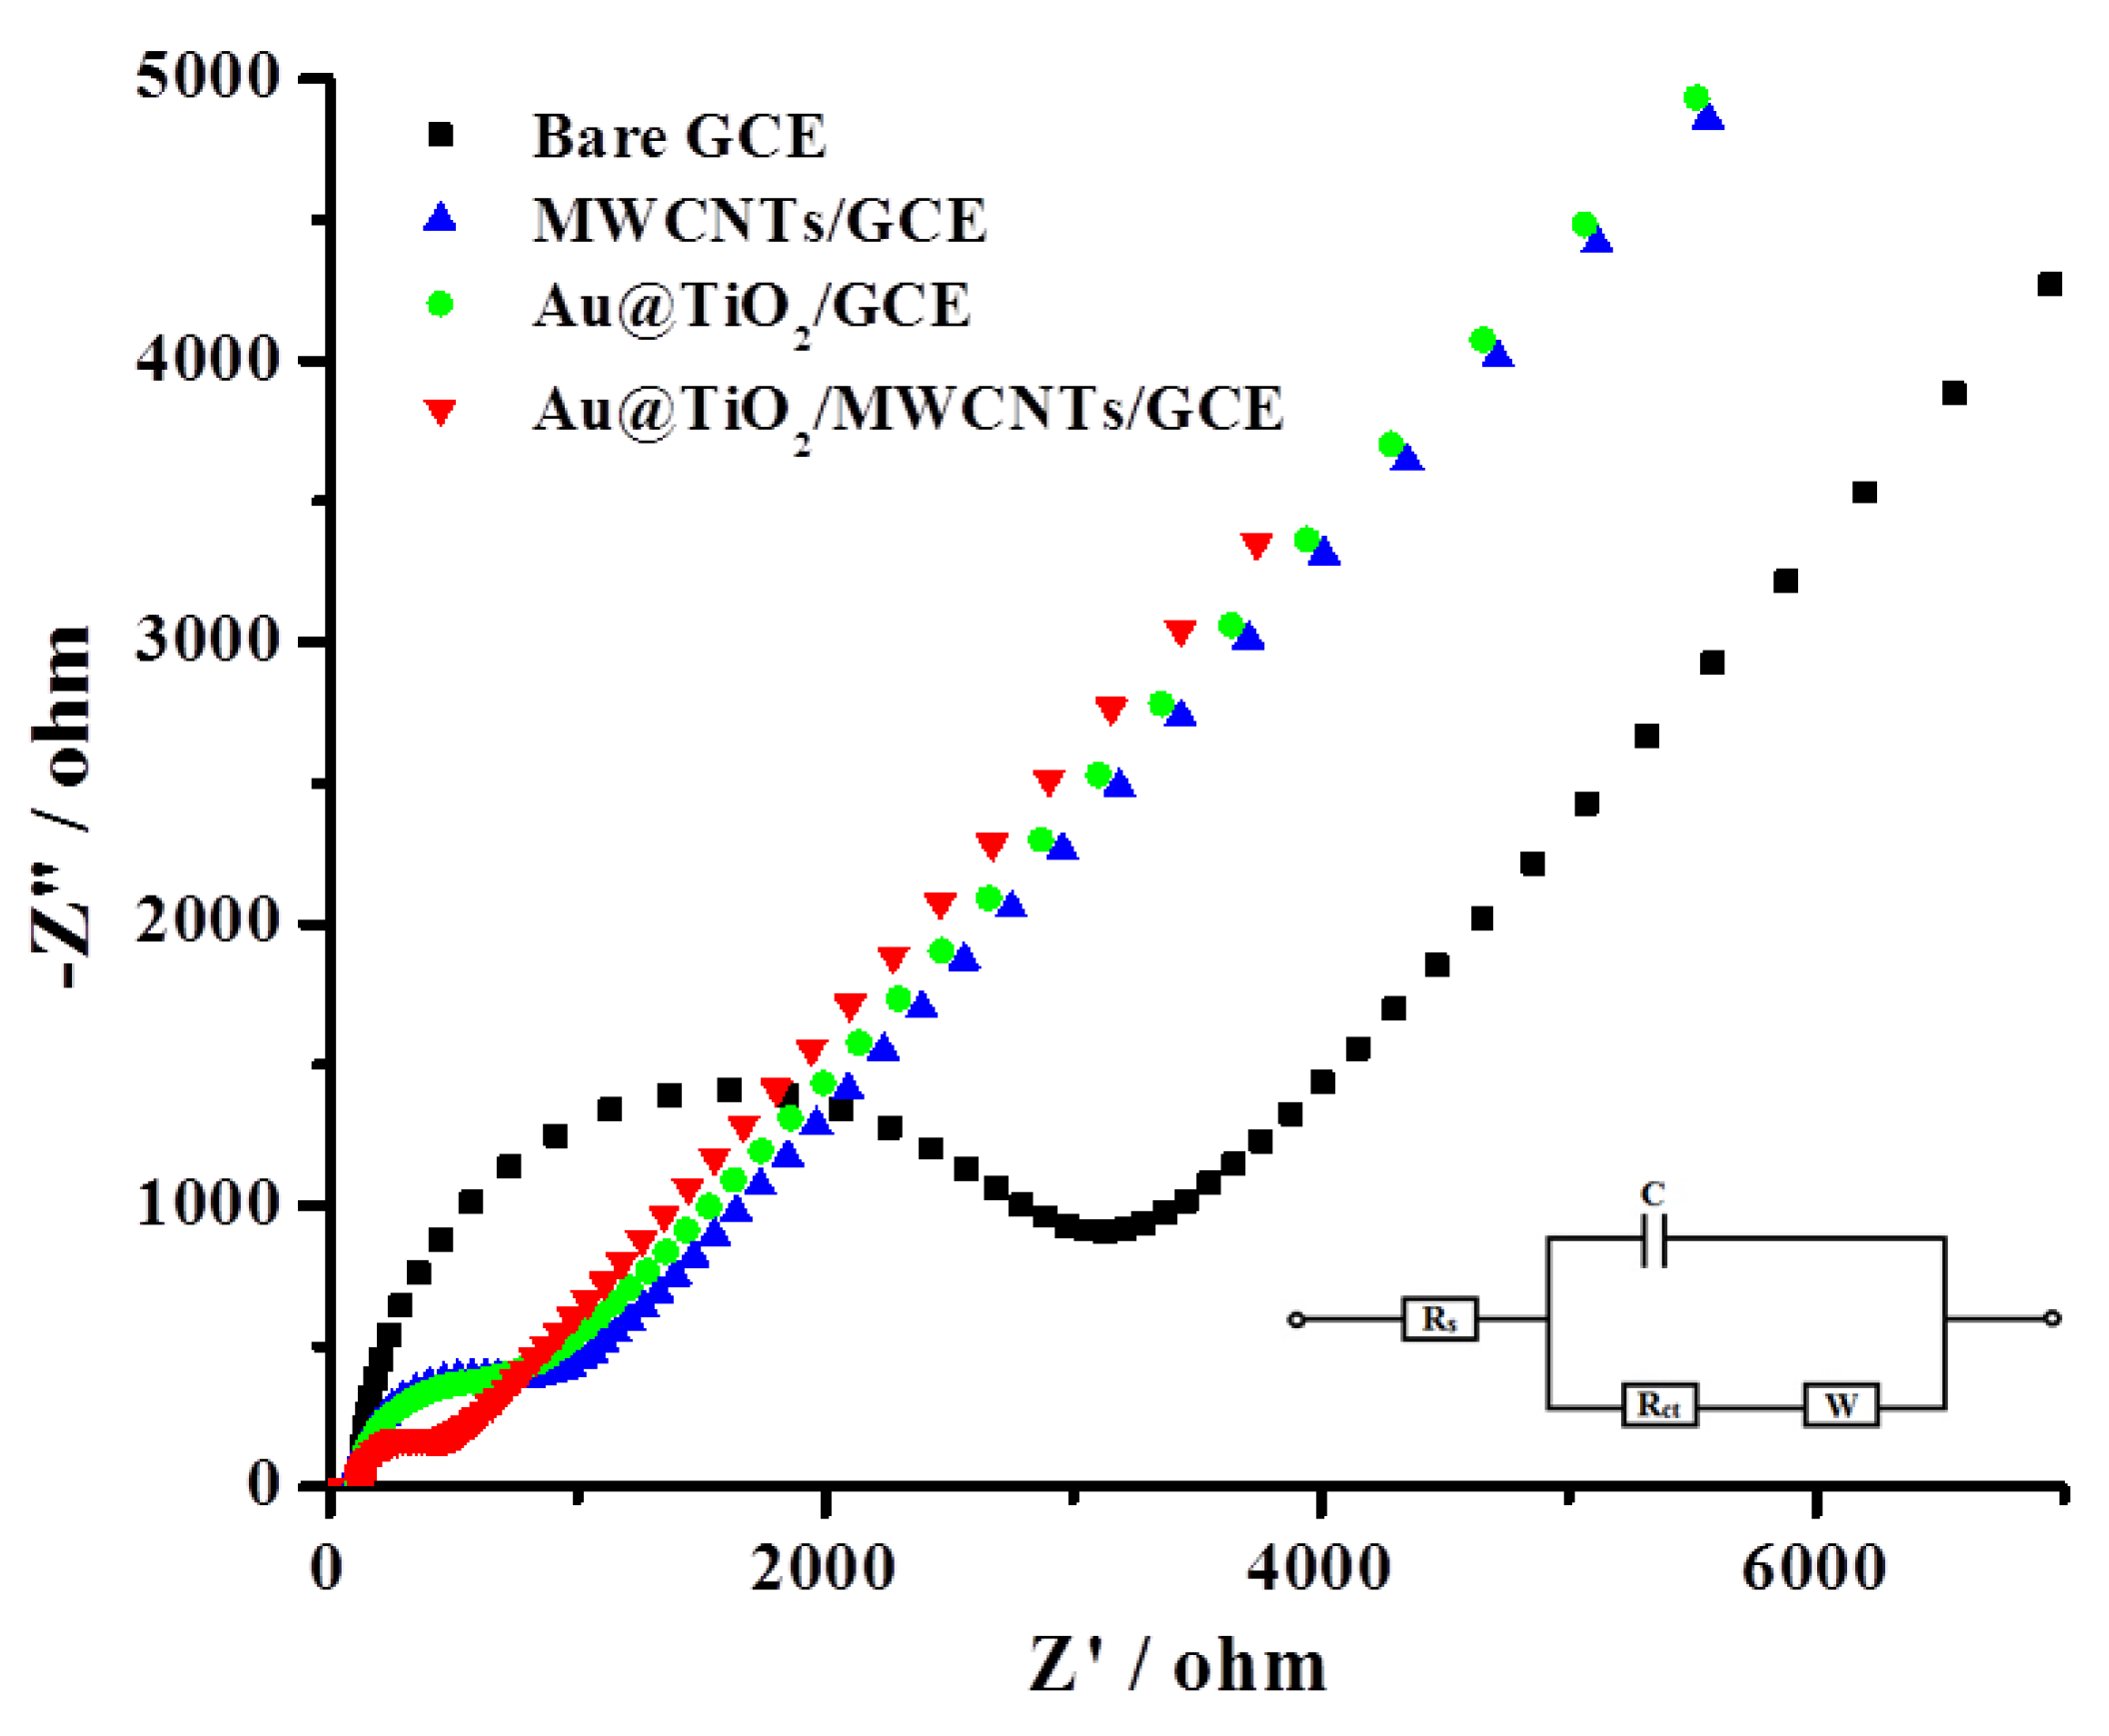
3.9. Electrochemical Impedance Spectroscopy

EIS analysis was performed and recorded in 5 mM [Fe(CN)6]3−/4− solution at 0.22 V with a frequency range from 0.1 Hz to 105 Hz (Figure 9 and Table 1) to support the cyclic voltammetry results and to confirm the Rct values which agree well with the voltammetry findings. The bare GCE showed an Rct of 2610 Ω, which was decreased very significantly (634 Ω) after modifying the GCE surface with MWCNTs. This is due to the reason that the electron process kinetics is faster due to the high electrical conductivity of MWCNTs, which ultimately facilitates the electron transfer and decreases the resistance. Au@TiO2-modified GCE also showed a decrease in the Rct value (529 Ω), but the proposed electrode material Au@TiO2/MWCNTs/GCE exhibited the best and lowest charge transfer resistance (281 Ω) among all the tested materials and is attributed to the synergistic effect of the core–shell Au@TiO2 nanostructure and high conductivity of MWCNTs.

3.10. Analytical Performance (H2O2 Sensing)

In order to confirm the synergistic effect on H2O2 sensing, DPVs were recorded in N2-saturated PBS for the different stages of electrode modification. As shown in Figure 10, the increase in the current response was 1.5 and 1.9 times in the case of MWCNTs/GCE and Au@TiO2/GCE, respectively, while an increase of 4.6 times was observed in the case of Au@TiO2/MWCNTs/GCE compared to the bare glassy carbon electrode.
The DPV response of the proposed electrode (Au@TiO2/MWCNTs/GCE) towards different H2O2 concentrations (PBS, pH 7.4) was recorded and shown in Figure 11. The reduction current of the hydrogen peroxide (at −0.62 V) increased with H2O2 concentration and showed a linear response from 5 to 200 µM (y = −0.0046x − 0.015) and from 200 to 6000 µM (y = −0.0074x + 0.7217) with coefficient of determination (R2) of 0.9973 and 0.9994, respectively. The calculated limit of detection (LOD) was 1.4 µM based on 3σ calculations. The analytical performance of the proposed sensor was compared to other relevant and reported results and is summarized in Table 2. It is clearly evident that the proposed sensor exhibited an excellent response in terms of linear range and detection limit.

3.10.1. Stability and Reproducibility of H2O2 Sensor

Stability is an important parameter to describe the performance of an electrochemical sensor. The stability of the Au@TiO2/MWCNTs/GCE sensor was investigated by measuring the current responses for different concentrations of H2O2 (20–1000 µM, Figure 12) after 50 days and compared with the initial response recorded. The current response for H2O2 after 50 days was found to be 97.1% of its initial response, and this reveals the acceptable stability and sufficient lifetime of the proposed sensor. The reproducibility of three freshly prepared Au@TiO2/MWCNTs/GCEs was tested by measuring the current responses of 200 µM H2O2, and the calculated %RSD was 4.63%.

3.10.2. Selectivity of H2O2 Sensor

Possible interferences which may occur during the determination of H2O2 in the biological samples were examined using the proposed sensor (Au@TiO2/MWCNTs/GCE). The interference study was performed by measuring the current response of 200 µM H2O2, and then the change in the current response was recorded in the presence of the common interferents (ascorbic acid, glucose, methionine, cysteine and uric acid) with 10-fold concentration (2 mM) compared to H2O2. As shown in Table 3, the effect of these interferents on H2O2 determination is expressed as a percentage recovery from the initial H2O2 current response (before the interferents were added). Even with such high concentrations of interferents (10-fold), the results reveal that the proposed sensor is quite selective towards H2O2.

3.11. Real Sample Analysis

The diluted real samples (human saliva and serum samples) were considered, and analysis was performed in triplicate for different concentrations of H2O2 by the standard addition method. The recovery values of the proposed sensor are shown in Table 4, which vary from 85.3 to 117.9%. The obtained results reveal that the proposed sensor exhibits a reliable response and excellent practicality for the electroanalytical determination of H2O2 in real biological samples.

4. Conclusions

An electrochemical non-enzymatic biosensor based on Au@TiO2 core–shell nanoparticles and muti-walled carbon nanotubes was developed and investigated for H2O2 determination. The success of the Au@TiO2 preparation process was confirmed and characterized by various techniques. The different electrode modification stages were electrochemically characterized using cyclic voltammetry and electrochemical impedance spectroscopy in 5 mM [Fe(CN)6]3−/4− in order to confirm the synergistic effect of Au@TiO2 and MWCNTs. The synergistic effect was further confirmed during differential pulse voltammetry analysis of H2O2 (300 µM) in 0.1 M N2-saturated PBS (pH 7.4). The analytical performance of the modified electrode (Au@TiO2/MWCNTs/GCE) was investigated by plotting the calibration curves of different concentrations of H2O2 varying from 5 to 6000 µM. The results showed that by increasing the H2O2 concentration, the reduction current of the hydrogen peroxide at −0.62 V increases, and the current values showed a linear response from 5 to 200 µM (R2 = 0.9973) and 200 to 6000 µM (R2 = 0.9994). The calculated limit of detection was 1.4 µM and attributed to the synergistic effect of Au@TiO2 and MWCNTs.
The proposed sensor exhibited good selectivity over the possible interferents (ascorbic acid, glucose, methionine, cysteine and uric acid at a 10-fold concentration level compared to H2O2). The lifetime of the sensor/electrode reached 50 days with a decrease of only 2.9% of the original response (current). The developed sensor was further tested for the determination of H2O2 in real biological samples (human serum and saliva) using the standard addition method. The observed response and recovery results support the potential of the proposed sensor for H2O2 monitoring in future real-world sample analysis.

Author Contributions

Conceptualization, M.N.A. and B.S.; methodology, A.A.S., M.N.A. and B.S.; software, A.A.S. and B.S.; validation, A.A.S., M.N.A. and B.S.; formal analysis, A.A.S.; investigation, A.A.S., M.N.A. and B.S.; resources, A.A.S., M.N.A., W.F.E.-H., Y.M.I. and B.S.; data curation, A.A.S., M.N.A. and B.S.; writing—original draft preparation, A.A.S., M.N.A. and B.S.; writing—review and editing, A.A.S., M.N.A., B.S., W.F.E.-H. and Y.M.I.; visualization, A.A.S. and B.S.; supervision, M.N.A., B.S., W.F.E.-H. and Y.M.I.; project administration, M.N.A.; funding acquisition, M.N.A. and A.A.S. All authors have read and agreed to the published version of the manuscript.

Funding

This research was partially funded by the National Research Centre (NRC, Egypt) as a PhD research support.

Informed Consent Statement

Informed consent was obtained from all subjects involved in the study.

Data Availability Statement

The data presented in this study are available on request from the corresponding author.

Acknowledgments

This paper is dedicated to the memory of Mohammed Nooredeen Abbas. We (authors) dedicate this paper to the memory of our friend ‘Mohammed Nooredeen Abbas’ (who passed away recently) and are grateful to him for his collaborative activities and contributions to the scientific community.

Conflicts of Interest

The authors declare no conflict of interest.

References

  1. Lan, L.; Yao, Y.; Ping, J.; Ying, Y. Recent advances in nanomaterial-based biosensors for antibiotics detection. Biosens. Bioelectron. 2017, 91, 504–514. [Google Scholar] [CrossRef]
  2. Teradal, N.L.; Jelinek, R. Carbon nanomaterials in biological studies and biomedicine. Adv. Healthc. Mater. 2017, 6, 1700574. [Google Scholar] [CrossRef]
  3. Porto, L.S.; Silva, D.N.; de Oliveira, A.E.F.; Pereira, A.C.; Borges, K.B. Carbon nanomaterials: Synthesis and applications to development of electrochemical sensors in determination of drugs and compounds of clinical interest. Rev. Anal. Chem. 2019, 38, 20190017. [Google Scholar] [CrossRef]
  4. Bobrinetskiy, I.I.; Knezevic, N.Z. Graphene-based biosensors for on-site detection of contaminants in food. Anal. Methods 2018, 10, 5061–5070. [Google Scholar] [CrossRef]
  5. Bounegru, A.V.; Apetrei, C. Carbonaceous nanomaterials employed in the development of electrochemical sensors based on screen-printing technique—A review. Catalysts 2020, 10, 680. [Google Scholar] [CrossRef]
  6. Kirchner, E.-M.; Hirsch, T. Recent developments in carbon-based two-dimensional materials: Synthesis and modification aspects for electrochemical sensors. Microchim. Acta 2020, 187, 441. [Google Scholar] [CrossRef]
  7. Kour, R.; Arya, S.; Young, S.-J.; Gupta, V.; Bandhoria, P.; Khosla, A. Recent advances in carbon nanomaterials as electrochemical biosensors. J. Electrochem. Soc. 2020, 167, 037555. [Google Scholar] [CrossRef]
  8. Pandey, H.; Khare, P.; Singh, S.; Singh, S.P. Carbon nanomaterials integrated molecularly imprinted polymers for biological sample analysis: A critical review. Mater. Chem. Phys. 2020, 239, 121966. [Google Scholar] [CrossRef]
  9. Wang, J. Carbon-nanotube based electrochemical biosensors: A review. Electroanal. Int. J. Devoted Fundam. Pract. Asp. Electroanal. 2005, 17, 7–14. [Google Scholar] [CrossRef]
  10. Nooredeen, N.M.; El-Ghaffar, A.; Darwish, W.; Elshereafy, E.; Radwan, A.; Abbas, M. Graphene oxide with covalently attached zinc monoamino-phthalocyanine coated graphite electrode as a potentiometric platform for citrate sensing in pharmaceutical preparations. J. Solid State Electrochem. 2015, 19, 2141–2154. [Google Scholar] [CrossRef]
  11. Zaporotskova, I.V.; Boroznina, N.P.; Parkhomenko, Y.N.; Kozhitov, L.V. Carbon nanotubes: Sensor properties. A review. Mod. Electron. Mater. 2016, 2, 95–105. [Google Scholar] [CrossRef]
  12. Norizan, M.N.; Moklis, M.H.; Demon, S.Z.N.; Halim, N.A.; Samsuri, A.; Mohamad, I.S.; Knight, V.F.; Abdullah, N. Carbon nanotubes: Functionalisation and their application in chemical sensors. RSC Adv. 2020, 10, 43704–43732. [Google Scholar] [CrossRef] [PubMed]
  13. Arlyapov, V.; Kharkova, A.; Kurbanaliyeva, S.; Kuznetsova, L.; Machulin, A.; Tarasov, S.; Melnikov, P.; Ponamoreva, O.; Alferov, V.; Reshetilov, A. Use of biocompatible redox-active polymers based on carbon nanotubes and modified organic matrices for development of a highly sensitive BOD biosensor. Enzym. Microb. Technol. 2021, 143, 109706. [Google Scholar] [CrossRef]
  14. Schroeder, V.; Savagatrup, S.; He, M.; Lin, S.; Swager, T.M. Carbon nanotube chemical sensors. Chem. Rev. 2018, 119, 599–663. [Google Scholar] [CrossRef] [PubMed]
  15. Wang, H.; Chen, L.; Feng, Y.; Chen, H. Exploiting core–shell synergy for nanosynthesis and mechanistic investigation. Acc. Chem. Res. 2013, 46, 1636–1646. [Google Scholar] [CrossRef]
  16. Core, R.G.C. Classes, Properties, Synthesis Mechanisms, Characterization, and Applications/Rajib Ghosh Chaudhuri, Santanu Paria. Chem. Rev. 2012, 112, 2373. [Google Scholar]
  17. Singh, B.; Seddon, B.; Dempsey, E.; Redington, W.; Dickinson, C. Porous Core-Shell Platinum-Silver Nanocatalyst for the Electrooxidation of Methanol. Electroanalysis 2015, 27, 135–143. [Google Scholar] [CrossRef]
  18. Krishnan, S.K.; Prokhorov, E.; Bahena, D.; Esparza, R.; Meyyappan, M. Chitosan-covered Pd@Pt core–shell nanocubes for direct electron transfer in electrochemical enzymatic glucose biosensor. ACS Omega 2017, 2, 1896–1904. [Google Scholar] [CrossRef]
  19. Li, M.; Wang, P.; Li, F.; Chu, Q.; Li, Y.; Dong, Y. An ultrasensitive sandwich-type electrochemical immunosensor based on the signal amplification strategy of mesoporous core–shell Pd@Pt nanoparticles/amino group functionalized graphene nanocomposite. Biosens. Bioelectron. 2017, 87, 752–759. [Google Scholar] [CrossRef]
  20. Wang, R.; Liu, W.-D.; Wang, A.-J.; Xue, Y.; Wu, L.; Feng, J.-J. A new label-free electrochemical immunosensor based on dendritic core-shell AuPd@ Au nanocrystals for highly sensitive detection of prostate specific antigen. Biosens. Bioelectron. 2018, 99, 458–463. [Google Scholar] [CrossRef]
  21. Zhang, X.; Li, Y.; Lv, H.; Feng, J.; Gao, Z.; Wang, P.; Dong, Y.; Liu, Q.; Zhao, Z. Sandwich-type electrochemical immunosensor based on Au@Ag supported on functionalized phenolic resin microporous carbon spheres for ultrasensitive analysis of α-fetoprotein. Biosens. Bioelectron. 2018, 106, 142–148. [Google Scholar] [CrossRef] [PubMed]
  22. Yang, F.; Yang, Z.; Zhuo, Y.; Chai, Y.; Yuan, R. Ultrasensitive electrochemical immunosensor for carbohydrate antigen 19-9 using Au/porous graphene nanocomposites as platform and Au@Pd core/shell bimetallic functionalized graphene nanocomposites as signal enhancers. Biosens. Bioelectron. 2015, 66, 356–362. [Google Scholar] [CrossRef] [PubMed]
  23. Xu, W.; Yi, H.; Yuan, Y.; Jing, P.; Chai, Y.; Yuan, R.; Wilson, G.S. An electrochemical aptasensor for thrombin using synergetic catalysis of enzyme and porous Au@Pd core–shell nanostructures for signal amplification. Biosens. Bioelectron. 2015, 64, 423–428. [Google Scholar] [CrossRef] [PubMed]
  24. Tabrizi, M.A.; Shamsipur, M.; Saber, R.; Sarkar, S.; Sherkatkhameneh, N. Flow injection amperometric sandwich-type electrochemical aptasensor for the determination of adenocarcinoma gastric cancer cell using aptamer-Au@Ag nanoparticles as labeled aptamer. Electrochim. Acta 2017, 246, 1147–1154. [Google Scholar] [CrossRef]
  25. Mazloum-Ardakani, M.; Hosseinzadeh, L.; Taleat, Z. Synthesis and electrocatalytic effect of Ag@Pt core–shell nanoparticles supported on reduced graphene oxide for sensitive and simple label-free electrochemical aptasensor. Biosens. Bioelectron. 2015, 74, 30–36. [Google Scholar] [CrossRef] [PubMed]
  26. Wang, M.; Hu, B.; Ji, H.; Song, Y.; Liu, J.; Peng, D.; He, L.; Zhang, Z. Aptasensor based on hierarchical core–shell nanocomposites of zirconium hexacyanoferrate nanoparticles and mesoporous mFe3O4@ mC: Electrochemical quantitation of epithelial tumor marker Mucin-1. Acs Omega 2017, 2, 6809–6818. [Google Scholar] [CrossRef]
  27. Bai, J.; Jiang, X. A facile one-pot synthesis of copper sulfide-decorated reduced graphene oxide composites for enhanced detecting of H2O2 in biological environments. Anal. Chem. 2013, 85, 8095–8101. [Google Scholar] [CrossRef]
  28. Rhee, S.G. H2O2, a necessary evil for cell signaling. Science 2006, 312, 1882–1883. [Google Scholar] [CrossRef]
  29. Wu, W.; Li, J.; Chen, L.; Ma, Z.; Zhang, W.; Liu, Z.; Cheng, Y.; Du, L.; Li, M. Bioluminescent probe for hydrogen peroxide imaging in vitro and in vivo. Anal. Chem. 2014, 86, 9800–9806. [Google Scholar] [CrossRef]
  30. Hang, T.; Xiao, S.; Yang, C.; Li, X.; Guo, C.; He, G.; Li, B.; Yang, C.; Chen, H.-j.; Liu, F.; et al. Hierarchical graphene/nanorods-based H2O2 electrochemical sensor with self-cleaning and anti-biofouling properties. Sens. Actuators B Chem. 2019, 289, 15–23. [Google Scholar] [CrossRef]
  31. Dong, Y.; Zheng, J. Environmentally friendly synthesis of Co-based zeolitic imidazolate framework and its application as H2O2 sensor. Chem. Eng. J. 2020, 392, 123690. [Google Scholar] [CrossRef]
  32. Shang, L.; Zeng, B.; Zhao, F. Fabrication of novel nitrogen-doped graphene–hollow AuPd nanoparticle hybrid films for the highly efficient electrocatalytic reduction of H2O2. ACS Appl. Mater. Interfaces 2015, 7, 122–128. [Google Scholar] [CrossRef] [PubMed]
  33. Yang, K.; Zhong, H.; Cheng, Z.; Li, X.; Zhang, A.; Li, T.; Zhang, Y.; Liu, G.; Qian, H. Magnetic Fe3O4 stacked sphere-like nanocomposite and its application as platform for H2O2 sensing. J. Electroanal. Chem. 2018, 814, 1–6. [Google Scholar] [CrossRef]
  34. Nagaraja, P.; Prakash, J.; Asha, S.; Bhaskara, B.; Kumar, S.A. Dibenzazepin hydrochloride as a new spectrophotometric reagent for determination of hydrogen peroxide in plant extracts. Environ. Monit. Assess. 2012, 184, 5983–5988. [Google Scholar] [CrossRef]
  35. Hoshino, M.; Kamino, S.; Doi, M.; Takada, S.; Mitani, S.; Yanagihara, R.; Asano, M.; Yamaguchi, T.; Fujita, Y. Spectrophotometric determination of hydrogen peroxide with osmium(VIII) and m-carboxyphenylfluorone. Spectrochim. Acta Part A Mol. Biomol. Spectrosc. 2014, 117, 814–816. [Google Scholar] [CrossRef]
  36. Jamil, L.A.; Faizullah, A.T.; Saleem, P.H. Flow Injection Analysis of Hydrogen Peroxide with Peroxyoxalate Chemiluminescence Detection. Sci. J. Univ. Zakho 2017, 5, 88–92. [Google Scholar] [CrossRef]
  37. Yu, D.; Wang, P.; Zhao, Y.; Fan, A. Iodophenol blue-enhanced luminol chemiluminescence and its application to hydrogen peroxide and glucose detection. Talanta 2016, 146, 655–661. [Google Scholar] [CrossRef]
  38. Wang, K.; Liu, Q.; Wu, X.-Y.; Guan, Q.-M.; Li, H.-N. Graphene enhanced electrochemiluminescence of CdS nanocrystal for H2O2 sensing. Talanta 2010, 82, 372–376. [Google Scholar] [CrossRef]
  39. Sasakura, K.; Hanaoka, K.; Shibuya, N.; Mikami, Y.; Kimura, Y.; Komatsu, T.; Ueno, T.; Terai, T.; Kimura, H.; Nagano, T. Development of a highly selective fluorescence probe for hydrogen sulfide. J. Am. Chem. Soc. 2011, 133, 18003–18005. [Google Scholar] [CrossRef]
  40. Xu, M.; Han, J.-M.; Wang, C.; Yang, X.; Pei, J.; Zang, L. Fluorescence ratiometric sensor for trace vapor detection of hydrogen peroxide. ACS Appl. Mater. Interfaces 2014, 6, 8708–8714. [Google Scholar] [CrossRef]
  41. Chang, J.; Li, H.; Hou, T.; Duan, W.; Li, F. Paper-based fluorescent sensor via aggregation induced emission fluorogen for facile and sensitive visual detection of hydrogen peroxide and glucose. Biosens. Bioelectron. 2018, 104, 152–157. [Google Scholar] [CrossRef] [PubMed]
  42. Tarvin, M.; McCord, B.; Mount, K.; Sherlach, K.; Miller, M.L. Optimization of two methods for the analysis of hydrogen peroxide: High performance liquid chromatography with fluorescence detection and high performance liquid chromatography with electrochemical detection in direct current mode. J. Chromatogr. A 2010, 1217, 7564–7572. [Google Scholar] [CrossRef] [PubMed]
  43. Hu, H.-C.; Jin, H.-J.; Chai, X.-S. Rapid determination of hydrogen peroxide in pulp bleaching effluents by headspace gas chromatography. J. Chromatogr. A 2012, 1235, 182–184. [Google Scholar] [CrossRef] [PubMed]
  44. Yu, G.; Wu, W.; Pan, X.; Zhao, Q.; Wei, X.; Lu, Q. High Sensitive and Selective Sensing of Hydrogen Peroxide Released from Pheochromocytoma Cells Based on Pt-Au Bimetallic Nanoparticles Electrodeposited on Reduced Graphene Sheets. Sensors 2015, 15, 2709–2722. [Google Scholar] [CrossRef]
  45. He, G.; Gao, F.; Li, W.; Li, P.; Zhang, X.; Yin, H.; Yang, B.; Liu, Y.; Zhang, S. Electrochemical sensing of H 2 O 2 released from living cells based on AuPd alloy-modified PDA nanotubes. Anal. Methods 2019, 11, 1651–1656. [Google Scholar] [CrossRef]
  46. Dai, H.; Lü, W.; Zuo, X.; Zhu, Q.; Pan, C.; Niu, X.; Liu, J.; Chen, H.; Chen, X. A novel biosensor based on boronic acid functionalized metal-organic frameworks for the determination of hydrogen peroxide released from living cells. Biosens. Bioelectron. 2017, 95, 131–137. [Google Scholar] [CrossRef]
  47. Xi, J.; Xie, C.; Zhang, Y.; Wang, L.; Xiao, J.; Duan, X.; Ren, J.; Xiao, F.; Wang, S. Pd nanoparticles decorated N-doped graphene quantum dots@N-doped carbon hollow nanospheres with high electrochemical sensing performance in cancer detection. ACS Appl. Mater. Interfaces 2016, 8, 22563–22573. [Google Scholar] [CrossRef]
  48. Baghayeri, M.; Alinezhad, H.; Tarahomi, M.; Fayazi, M.; Ghanei-Motlagh, M.; Maleki, B. A non-enzymatic hydrogen peroxide sensor based on dendrimer functionalized magnetic graphene oxide decorated with palladium nanoparticles. Appl. Surf. Sci. 2019, 478, 87–93. [Google Scholar] [CrossRef]
  49. Bozkurt, S.; Tosun, B.; Sen, B.; Akocak, S.; Savk, A.; Ebeoğlugil, M.F.; Sen, F. A hydrogen peroxide sensor based on TNM functionalized reduced graphene oxide grafted with highly monodisperse Pd nanoparticles. Anal. Chim. Acta 2017, 989, 88–94. [Google Scholar] [CrossRef]
  50. Mollarasouli, F.; Asadpour-Zeynali, K.; Campuzano, S.; Yáñez-Sedeño, P.; Pingarrón, J.M. Non-enzymatic hydrogen peroxide sensor based on graphene quantum dots-chitosan/methylene blue hybrid nanostructures. Electrochim. Acta 2017, 246, 303–314. [Google Scholar] [CrossRef]
  51. Shamkhalichenar, H.; Choi, J.-W. An inkjet-printed non-enzymatic hydrogen peroxide sensor on paper. J. Electrochem. Soc. 2017, 164, B3101–B3106. [Google Scholar] [CrossRef]
  52. Nia, P.M.; Woi, P.M.; Alias, Y. Facile one-step electrochemical deposition of copper nanoparticles and reduced graphene oxide as nonenzymatic hydrogen peroxide sensor. Appl. Surf. Sci. 2017, 413, 56–65. [Google Scholar]
  53. Aparicio-Martínez, E.; Ibarra, A.; Estrada-Moreno, I.A.; Osuna, V.; Dominguez, R.B. Flexible electrochemical sensor based on laser scribed Graphene/Ag nanoparticles for non-enzymatic hydrogen peroxide detection. Sens. Actuators B Chem. 2019, 301, 127101. [Google Scholar] [CrossRef]
  54. Li, B.; Song, H.-Y.; Deng, Z.-P.; Huo, L.-H.; Gao, S. Novel sensitive amperometric hydrogen peroxide sensor using layered hierarchical porous α-MoO3 and GO modified glass carbon electrode. Sens. Actuators B Chem. 2019, 288, 641–648. [Google Scholar] [CrossRef]
  55. Agrisuelas, J.; González-Sánchez, M.-I.; Valero, E. Hydrogen peroxide sensor based on in situ grown Pt nanoparticles from waste screen-printed electrodes. Sens. Actuators B Chem. 2017, 249, 499–505. [Google Scholar] [CrossRef]
  56. Al-Hardan, N.H.; Abdul Hamid, M.A.; Shamsudin, R.; Al-Khalqi, E.M.; Kar Keng, L.; Ahmed, N.M. Electrochemical hydrogen peroxide sensor based on macroporous silicon. Sensors 2018, 18, 716. [Google Scholar] [CrossRef]
  57. Li, H.; Zhao, H.; He, H.; Shi, L.; Cai, X.; Lan, M. Pt-Pd bimetallic nanocoral modified carbon fiber microelectrode as a sensitive hydrogen peroxide sensor for cellular detection. Sens. Actuators B Chem. 2018, 260, 174–182. [Google Scholar] [CrossRef]
  58. Sakthivel, M.; Sukanya, R.; Chen, S.-M.; Pandi, K.; Ho, K.-C. Synthesis and characterization of bimetallic nickel-cobalt chalcogenides (NiCoSe2, NiCo2S4, and NiCo2O4) for non-enzymatic hydrogen peroxide sensor and energy storage: Electrochemical properties dependence on the metal-to-chalcogen composition. Renew. Energy 2019, 138, 139–151. [Google Scholar] [CrossRef]
  59. Zhao, W.; Jin, J.; Wu, H.; Wang, S.; Fneg, C.; Yang, S.; Ding, Y. Electrochemical hydrogen peroxide sensor based on carbon supported Cu@Pt core-shell nanoparticles. Mater. Sci. Eng. C 2017, 78, 185–190. [Google Scholar] [CrossRef]
  60. Ghanei-Motlagh, M.; Hosseinifar, A. A novel amperometric hydrogen peroxide sensor based on gold nanoparticles supported on Fe3O4@polyethyleneimine. Int. J. Environ. Anal. Chem. 2020, 100, 591–601. [Google Scholar] [CrossRef]
  61. Han, L.; Tang, L.; Deng, D.; He, H.; Zhou, M.; Luo, L. A novel hydrogen peroxide sensor based on electrodeposited copper/cuprous oxide nanocomposites. Analyst 2019, 144, 685–690. [Google Scholar] [CrossRef] [PubMed]
  62. Ma, C.; Yang, C.; Zhang, M. A novel electrochemical hydrogen peroxide sensor based on AuNPs/n-type GaN electrode. Chem. Lett. 2020, 49, 656–658. [Google Scholar] [CrossRef]
  63. Banerjee, S.; Hossain, M.F.; Slaughter, G. A Highly Sensitive Non-Enzymatic Hydrogen Peroxide Sensor based on Palladium-Gold Nanoparticles. In Proceedings of the 2020 IEEE 15th International Conference on Nano/Micro Engineered and Molecular System (NEMS), San Diego, CA, USA, 27–30 September 2020; pp. 286–289. [Google Scholar]
  64. Wang, Z.; Xie, F.; Liu, Z.; Du, G.; Asiri, A.M.; Sun, X. High-performance non-enzyme hydrogen peroxide detection in neutral solution: Using a nickel borate nanoarray as a 3D electrochemical sensor. Chem. Eur. J. 2017, 23, 16179–16183. [Google Scholar] [CrossRef] [PubMed]
  65. Lee, S.; Lee, Y.J.; Kim, J.H.; Lee, G.-J. Electrochemical Detection of H2O2 Released from Prostate Cancer Cells Using Pt Nanoparticle-Decorated rGO–CNT Nanocomposite-Modified Screen-Printed Carbon Electrodes. Chemosensors 2020, 8, 63. [Google Scholar] [CrossRef]
  66. Oh, J.T.; Chowdhury, S.R.; Lee, T.L.; Misra, M. Synergetic influence of Au/Cu2O core-shells nanoparticle on optical, photo-electrochemical, and catalytic activities of Au/Cu2O/TiO2 nanocomposite. Dye. Pigment. 2019, 160, 936–943. [Google Scholar] [CrossRef]
  67. Chen, T.-M.; Xu, G.-Y.; Ren, H.; Zhang, H.; Tian, Z.-Q.; Li, J.-F. Synthesis of Au@TiO2 core–shell nanoparticles with tunable structures for plasmon-enhanced photocatalysis. Nanoscale Adv. 2019, 1, 4522–4528. [Google Scholar] [CrossRef]
  68. Goebl, J.; Joo, J.B.; Dahl, M.; Yin, Y. Synthesis of tailored Au@TiO2 core–shell nanoparticles for photocatalytic reforming of ethanol. Catal. Today 2014, 225, 90–95. [Google Scholar] [CrossRef]
  69. Sun, H.; He, Q.; Zeng, S.; She, P.; Zhang, X.; Li, J.; Liu, Z. Controllable growth of Au@TiO2 yolk–shell nanoparticles and their geometry parameter effects on photocatalytic activity. New J. Chem. 2017, 41, 7244–7252. [Google Scholar] [CrossRef]
  70. Wang, Y.; Yang, C.; Chen, A.; Pu, W.; Gong, J. Influence of yolk-shell Au@TiO2 structure induced photocatalytic activity towards gaseous pollutant degradation under visible light. Appl. Catal. B Environ. 2019, 251, 57–65. [Google Scholar] [CrossRef]
  71. Baba, K.; Bulou, S.; Quesada-Gonzalez, M.; Bonot, S.; Collard, D.; Boscher, N.D.; Choquet, P. Significance of a noble metal nanolayer on the UV and visible light photocatalytic activity of anatase TiO2 thin films grown from a scalable PECVD/PVD approach. ACS Appl. Mater. Interfaces 2017, 9, 41200–41209. [Google Scholar] [CrossRef]
  72. Sun, H.; He, Q.; She, P.; Zeng, S.; Xu, K.; Li, J.; Liang, S.; Liu, Z. One-pot synthesis of Au@TiO2 yolk-shell nanoparticles with enhanced photocatalytic activity under visible light. J. Colloid Interface Sci. 2017, 505, 884–891. [Google Scholar] [CrossRef] [PubMed]
Figure 1. UV-Visible absorption spectra of AuNPs, TiO2 and Au@TiO2 materials.
Biosensors 12 00778 g001
Figure 2. Raman spectra of the prepared TiO2 and Au@TiO2 (Au is 8.14%) materials.
Biosensors 12 00778 g002
Figure 3. X-ray diffraction pattern for the prepared core–shell Au@TiO2 material (Au = 8.14%).
Biosensors 12 00778 g003
Figure 4. Zeta potential of the prepared core−shell Au@TiO2 material with varying Au content (1.09, 2.17, 4.24, 8.14 and 11.74%).
Biosensors 12 00778 g004
Figure 5. TEM images of (a,b) Au@TiO2 with 8.14% Au; (c) selected area electron diffraction pattern; (d) TEM image of Au@TiO2/MWCNTs composite material.
Biosensors 12 00778 g005
Figure 6. SEM images of Au@TiO2 material (Au = 8.14%) at different magnifications; (a) 30 kx and (b) 100 kx. (c,d) EDX profiles for Au@TiO2 and Au@TiO2/MWCNT materials confirming the presence of elements as expected.
Biosensors 12 00778 g006
Figure 7. AFM images of the core–shell Au@TiO2 material; (a,c) 3D images and (b,d) plane images.
Biosensors 12 00778 g007
Figure 8. Cyclic voltammetric responses for bare GCE, MWCNTs/GCE, Au@TiO2/GCE and Au@TiO2/MWCNTs/GCE in 5 mM [Fe(CN)6]3−/4−/0.1 M KCl at a scan rate of 100 mV/s.
Biosensors 12 00778 g008
Figure 9. Nyquist plot for modified (labeled) and bare glassy carbon electrodes in 5 mM [Fe(CN)6]3−/4/0.1 M KCl. Insert shows the Randel circuit used for data fitting.
Biosensors 12 00778 g009
Figure 10. (a) Differential pulse voltammograms recorded in PBS (dashed lines) and 300 µM H2O2 (solid lines) for various stages of electrode modification, Bare GCE (black); MWCNTs/GCE (blue); Au@TiO2/GCE (green); Au@TiO2/MWCNTs/GCE (red). (b) Histogram represents the corresponding change in current values (ΔI).
Biosensors 12 00778 g010
Figure 11. Differential pulse voltammograms recorded using proposed sensor (Au@TiO2/MWCNTs/GCE towards different concentrations of H2O2 (a) 5 to 200 µM and (b) 200 to 6000 µM) in N2-saturated PBS (pH 7.4)). (c,d) Corresponding calibration curves from the current responses vs. H2O2 concentrations plot.
Biosensors 12 00778 g011
Figure 12. Stability study for the determination of H2O2 (20–1000 µM) after 50 days (red line) using the proposed sensor (Au@TiO2/MWCNTs/GCE) compared to the response observed initially (blue line).
Biosensors 12 00778 g012
Table 1. CV and EIS performance data for modified and bare electrodes in [Fe(CN)6]3−/4−.
ElectrodeIOxi (µA)E (mV)IRed (µA)E (mV)ΔE (mV)Rs (Ω)Rct (Ω)C (µF)W (mΩ)
Bare GCE45.83252−44.6132220128.426100.490.143
MWCNTs/GCE60.71223−61.6194129113.96340.910.167
Au@TiO2/GCE61.81213−63.0487126118.45291.130.149
Au@TiO2/MWCNTs/GCE69.77228−69.56113115124.82811.000.266
Table 2. Comparison of the proposed sensor with the recently reported H2O2 sensors.
Electrode MaterialLinear RangeLOD (µM)Ref.
GO-Fe3O4-PAMAM-Pd/GCE0.05–160 μM0.01[48]
Pd/TNM@rGOup to 12 mM0.0025[49]
GQDs-CS/MB/GCE1.0 µM–2.9 mM
2.9–11.78 mM
0.7[50]
Paper/CNTs/AgNPs1 μM–700 μM-[51]
CuNPs-rGOup to 18 mM601[52]
LSG-Ag0.1–10 mM7.9[53]
α-MoO3/GO/GCE0.92 μM–2.46 mM0.31[54]
PtNPs@SPCEs0–215 µM1.9 [55]
MPS electrode10 and 5000 μM4.35[56]
Pt-Pd/CFME5–3920 µM0.42[57]
NiCoSe2/GCE0.05 to 402 µM0.03[58]
Cu@Pt/C0.50 μM–32.56 mM0.15[59]
Fe3O4@PEI@AuNPs-GRE0.2–500.0 μM0.07[60]
Cu/Cu2O/FTO0.2–2000 μM0.04[61]
AuNPs/n-GaN40 µM–1 mM10[62]
Pd/AuNPs0.5–6 mM-[63]
Ni−Bi/CC0.1 μM–0.5 mM0.00085 [64]
PtNP/rGO–CNT/PtNP/SPCE25–1000 µM4.3[65]
Au@TiO2/MWCNTs/GCE5–200 µM and
200 µM–6 mM
1.4This work
PAMAM: Poly(amidoamine) dendrimer; TNM: tert-Nonyl mercaptan; GQDs: Graphene quantum dots; CS: Chitosan; MB: Methylene blue; LSG; Laser scribed graphene; SPCEs: Screen-printed carbon electrodes; MPS: Macroporous Silicon; CFME: Carbon fiber microelectrode; PEI: Polyethyleneimine; GRE: Graphite rod electrode; FTO: Fluorine doped tin oxide; CC: Carbon cloth.
Table 3. The H2O2 (200 µM) recovery data for the proposed electrode in the presence of common interferents (10-fold concentration, 2 mM).
Interferent
(10-Folds)
Recovery (%)
(n = 3)
Ascorbic acid89.11 ± 0.50
Glucose102.45 ± 0.87
Methionine96.21 ± 1.23
Cysteine105.65 ± 0.68
Uric acid97.31 ± 0.73
Table 4. Application of the proposed sensor Au@TiO2/MWCNTs/GCE for real sample analysis (human serum and saliva samples).
SampleAdded (µM)Found in Serum (µM)
(n = 3)
Recovery
(%)
Found in Saliva (µM)
(n = 3)
Recovery
(%)
12018.02 ± 0.9490.0918.33 ± 0.7191.63
4038.10 ± 0.8995.2438.28 ± 0.6095.71
6051.17 ± 0.7085.2970.74 ± 1.43117.90
22020.70 ± 1.20103.4821.30 ± 0.87106.52
4037.41 ± 0.6493.5343.98 ± 0.69109.95
6057.39 ± 0.5695.6563.85 ± 0.45106.41
32022.11 ± 0.88110.5422.76 ± 1.02113.80
4038.10 ± 1.0995.2439.63 ± 0.7099.08
6051.17 ± 0.7985.2968.30 ± 0.83113.84
Publisher’s Note: MDPI stays neutral with regard to jurisdictional claims in published maps and institutional affiliations.

