The Current State of Traumatic Brain Injury Biomarker Measurement Methods


Abstract
:1. Introduction
2. Traumatic Brain Injury Biofluid Biomarkers
3. Design Considerations for TBI Protein Biomarker Measurement Devices
- Usability Considerations
- ○
- Usable by untrained personnel;
- ○
- Functional in austere conditions (extreme temperature and humidity);
- ○
- Requires minimal hands-on time.
- Assay Considerations
- ○
- Requires minimal sample preparation;
- ○
- Assay performed on a drop (50 µL) of capillary whole blood obtained via a fingerstick;
- ○
- Simultaneous measurement of at least 2 and up to 10 biomarkers (multiplexing);
- ○
- Precise readings within the same run (intra-assay coefficient of variation (CV) ≤ 10%) and between runs (inter-assay CV ≤ 15%);
- ○
- Linear range extends across the concentrations of interest for a specific biomarker;
- ○
- Lower limit of detection (LLOD) is below the cutoff concentration used to distinguish a physiological concentration of a biomarker from a concentration indicative of TBI;
- ○
- Results obtained in less than 15 min (timeframe based on current clinical management workflows).
- Mass Production Considerations
- ○
- Reagents stable for a year or longer;
- ○
- Inexpensive to manufacture.
- Clinical Utility Considerations
- ○
- Portable;
- ○
- Accurately identifies patients with a TBI;
- ○
- Accurately identifies patients without a TBI.
4. Early-Stage Measurement Methods for Detection of TBI Protein Biomarkers
4.1. Electrochemical Detection
4.2. Optical Detection
4.3. Surface-Enhanced Raman Spectroscopy (SERS)
4.4. Surface Acoustic Wave (SAW)
5. Late-Stage Measurement Methods for Detection of TBI Protein Biomarkers
5.1. Banyan BTITM
5.2. Abbott i-STAT Alinity
5.3. Quanterix Simoa®
6. Discussion and Outlook
Author Contributions
Funding
Institutional Review Board Statement
Informed Consent Statement
Acknowledgments
Conflicts of Interest
References
- Mondello, S.; Muller, U.; Jeromin, A.; Streeter, J.; Hayes, R.L.; Wang, K.K. Blood-based diagnostics of traumatic brain injuries. Expert Rev. Mol. Diagn. 2011, 11, 65–78. [Google Scholar] [CrossRef] [Green Version]
- Sharma, R.; Laskowitz, D.T. Biomarkers in Traumatic Brain Injury. Curr. Neurol. Neurosci. Rep. 2012, 12, 560–569. [Google Scholar] [CrossRef]
- Dewan, M.C.; Rattani, A.; Gupta, S.; Baticulon, R.E.; Hung, Y.C.; Punchak, M.; Agrawal, A.; Adeleye, A.O.; Shrime, M.G.; Rubiano, A.M.; et al. Estimating the global incidence of traumatic brain injury. J. Neurosurg. 2019, 130, 1080–1097. [Google Scholar] [CrossRef] [Green Version]
- Centers for Disease Control and Prevention. Report to Congress on Traumatic Brain Injury in the United States: Epidemiology and Rehabilitation; National Center for Injury Prevention and Control: Atlanta, GA, USA, 2015; Volume 2, pp. 1–72.
- Kulbe, J.R.; Geddes, J.W. Current status of fluid biomarkers in mild traumatic brain injury. Exp. Neurol. 2016, 275, 334–352. [Google Scholar] [CrossRef] [Green Version]
- Peterson, A.B.; Xu, L.; Daugherty, J.; Breiding, M.J. Surveillance Report of Traumatic Brain Injury-Related Emergency Department Visits, Hospitalizations, and Deaths, United States, 2014. 2019. Available online: https://stacks.cdc.gov/view/cdc/78062 (accessed on 6 September 2021).
- Schneider, A.L.C.; Wang, D.; Gottesman, R.F.; Selvin, E. Prevalence of Disability Associated with Head Injury with Loss of Consciousness in Adults in the United States: A Population-Based Study. Neurology 2021, 97, e124–e135. [Google Scholar] [CrossRef]
- Mohamadpour, M.; Whitney, K.; Bergold, P.J. The importance of therapeutic time window in the treatment of traumatic brain injury. Front. Neurosci. 2019, 13, 1–10. [Google Scholar] [CrossRef] [Green Version]
- Sternbach, G.L. The Glasgow Coma Scale. J. Emerg. Med. 2000, 19, 67–71. [Google Scholar] [CrossRef]
- North, S.H.; Shriver-Lake, L.C.; Taitt, C.R.; Ligler, F.S. Rapid Analytical Methods for On-Site Triage for Traumatic Brain Injury. Annu. Rev. Anal. Chem. 2012, 5, 35–56. [Google Scholar] [CrossRef]
- Balestreri, M.; Czosnyka, M.; Chatfield, D.A.; Steiner, L.A.; Schmidt, E.A.; Smielewski, P.; Matta, B.; Pickard, J.D. Predictive value of Glasgow coma scale after brain trauma: Change in trend over the past ten years. J. Neurol. Neurosurg. Psychiatry 2004, 75, 161–162. [Google Scholar]
- Melnick, E.R.; Szlezak, C.M.; Bentley, S.K.; Dziura, J.D.; Kotlyar, S.; Post, L.A. CT overuse for mild traumatic brain injury. Jt. Comm. J. Qual. Patient Saf. 2012, 38, 483–489. [Google Scholar] [CrossRef]
- Group, F.-N.B.W. BEST (Biomarkers, Endpoints, and Other Tools) Resource [Internet]; Food and Drug Administration (US): Silver Spring, MD, USA, 2016.
- Siu, A.L. Screening for abnormal blood glucose and type 2 diabetes mellitus: U.S. preventive services task force recommendation statement. Ann. Intern. Med. 2015, 163, 861–868. [Google Scholar] [CrossRef] [PubMed] [Green Version]
- Roberts, S.G.; Blute, M.L.; Bergstralh, E.J.; Slezak, J.M.; Zincke, H. PSA doubling time as a predictor of clinical progression after biochemical failure following radical prostatectomy for prostate cancer. Mayo Clin. Proc. 2001, 76, 576–581. [Google Scholar] [CrossRef]
- Ledermann, J.; Harter, P.; Gourley, C.; Friedlander, M.; Vergote, I.; Rustin, G.; Scott, C.; Meier, W.; Shapira-Frommer, R.; Safra, T.; et al. Olaparib maintenance therapy in platinum-sensitive relapsed ovarian cancer. N. Engl. J. Med. 2012, 366, 1382–1392. [Google Scholar] [CrossRef] [PubMed] [Green Version]
- Okonkwo, D.O.; Puffer, R.C.; Puccio, A.M.; Yuh, E.L.; Yue, J.K.; Diaz-Arrastia, R.; Korley, F.K.; Wang, K.K.W.; Sun, X.; Taylor, S.R.; et al. Point-of-Care Platform Blood Biomarker Testing of Glial Fibrillary Acidic Protein versus S100 Calcium-Binding Protein B for Prediction of Traumatic Brain Injuries: A Transforming Research and Clinical Knowledge in Traumatic Brain Injury Study. J. Neurotrauma 2020, 37, 2460–2467. [Google Scholar] [CrossRef]
- Laroche, E.; Turgeon, A.F.; Boutin, A.; Mercier, E.; Lauzier, F.; Zarychanski, R.; Moore, L.; Granton, J.; Archambault, P.; Lamontagne, F.; et al. Predictive value of glial fibrillary acidic protein for prognosis in patients with moderate and severe traumatic brain injury: A systematic review and meta-analysis. Crit. Care 2012, 16, P298. [Google Scholar] [CrossRef] [Green Version]
- Yokobori, S.; Hosein, K.; Burks, S.; Sharma, I.; Gajavelli, S.; Bullock, R. Biomarkers for the clinical differential diagnosis in traumatic brain injury—A systematic review. CNS Neurosci. Ther. 2013, 19, 556–565. [Google Scholar] [CrossRef]
- Swift, A.; Heale, R.; Twycross, A. What are sensitivity and specificity? Evid. Based Nurs. 2020, 23, 2–4. [Google Scholar] [CrossRef] [Green Version]
- Di Battista, A.P.; Buonora, J.E.; Rhind, S.G.; Hutchison, M.G.; Baker, A.J.; Rizoli, S.B.; Diaz-Arrastia, R.; Mueller, G.P. Blood biomarkers in moderate-to-severe traumatic brain injury: Potential utility of a multi-marker approach in characterizing outcome. Front. Neurol. 2015, 6, 110. [Google Scholar] [CrossRef]
- Korley, F.K.; Yue, J.K.; Wilson, D.H.; Hrusovsky, K.; Diaz-Arrastia, R.; Ferguson, A.R.; Yuh, E.L.; Mukherjee, P.; Wang, K.K.W.; Valadka, A.B.; et al. Performance Evaluation of a Multiplex Assay for Simultaneous Detection of Four Clinically Relevant Traumatic Brain Injury Biomarkers. J. Neurotrauma 2018, 36, 182–187. [Google Scholar] [CrossRef]
- Korley, F.K.; Datwyler, S.A.; Jain, S.; Sun, X.; Beligere, G.; Chandran, R.; Marino, J.A.; McQuiston, B.; Zhang, H.; Caudle, K.L.; et al. Comparison of GFAP and UCH-L1 Measurements from Two Prototype Assays: The Abbott i-STAT and ARCHITECT Assays. Neurotrauma Rep. 2021, 2, 193–199. [Google Scholar] [CrossRef]
- Kahouadji, S.; Salamin, P.; Praz, L.; Coiffier, J.; Frochaux, V.; Durif, J.; Pereira, B.; Arlettaz, L.; Oris, C.; Sapin, V.; et al. S100B Blood Level Determination for Early Management of Ski-Related Mild Traumatic Brain Injury: A Pilot Study. Front. Neurol. 2020, 11, 856. [Google Scholar] [CrossRef]
- Wang, K.K.; Yang, Z.; Zhu, T.; Shi, Y.; Rubenstein, R.; Tyndall, J.A.; Manley, G.T. An update on diagnostic and prognostic biomarkers for traumatic brain injury. Expert Rev. Mol. Diagn. 2018, 18, 165–180. [Google Scholar] [CrossRef] [PubMed]
- Gan, Z.S.; Stein, S.C.; Swanson, R.; Guan, S.; Garcia, L.; Mehta, D.; Smith, D.H. Blood biomarkers for traumatic brain injury: A quantitative assessment of diagnostic and prognostic accuracy. Front. Neurol. 2019, 10, 446. [Google Scholar] [CrossRef]
- Slavoaca, D.; Muresanu, D.; Birle, C.; Rosu, O.V.; Chirila, I.; Dobra, I.; Jemna, N.; Strilciuc, S.; Vos, P. Biomarkers in traumatic brain injury: New concepts. Neurol. Sci. 2020, 41, 2033–2044. [Google Scholar] [CrossRef] [PubMed]
- Russell, C.; Ward, A.C.; Vezza, V.; Hoskisson, P.; Alcorn, D.; Steenson, D.P.; Corrigan, D.K. Development of a needle shaped microelectrode for electrochemical detection of the sepsis biomarker interleukin-6 (IL-6) in real time. Biosens. Bioelectron. 2019, 126, 806–814. [Google Scholar] [CrossRef]
- Kemmler, M.; Sauer, U.; Schleicher, E.; Preininger, C.; Brandenburg, A. Biochip point-of-care device for sepsis diagnostics. Sens. Actuators B Chem. 2014, 192, 205–215. [Google Scholar] [CrossRef]
- Fischer, S.K.; Williams, K.; Wang, L.; Capio, E.; Briman, M. Development of an IL-6 point-of-care assay: Utility for real-time monitoring and management of cytokine release syndrome and sepsis. Bioanalysis 2019, 11, 1777–1785. [Google Scholar] [CrossRef]
- Kochanek, P.M.; Verrier, J.D.; Wagner, A.K.; Jackson, E.K. The Many Roles of Adenosine in Traumatic Brain Injury. In Adenosine: A Key Link between Metabolism and Brain Activity; Masino, S., Boison, D., Eds.; Springer: New York, NY, USA, 2013; pp. 307–322. ISBN 978-1-4614-3903-5. [Google Scholar]
- Clark, R.S.B.; Carcillo, J.A.; Kochanek, P.M.; Obrist, W.D.; Jackson, E.K.; Mi, Z.; Wisneiwski, S.R.; Bell, M.J.; Marion, D.W. Cerebrospinal fluid adenosine concentration and uncoupling of cerebral blood flow and oxidative metabolism after severe head injury in humans. Neurosurgery 1997, 41, 1284–1292. [Google Scholar] [CrossRef] [PubMed]
- Gunawardhana, S.M.; Lunte, S.M. Continuous monitoring of adenosine and its metabolites using microdialysis coupled to microchip electrophoresis with amperometric detection. Anal. Methods 2018, 10, 3737–3744. [Google Scholar] [CrossRef]
- Gabbita, S.P.; Scheff, S.W.; Menard, R.M.; Roberts, K.; Fugaccia, I.; Zemlan, F.P. Cleaved-tau: A biomarker of neuronal damage after traumatic brain injury. J. Neurotrauma 2005, 22, 83–94. [Google Scholar] [CrossRef] [PubMed]
- Pandey, S.; Singh, K.; Sharma, V.; Pandey, D.; Jha, R.P.; Rai, S.K.; Chauhan, R.S.; Singh, R. A prospective pilot study on serum cleaved tau protein as a neurological marker in severe traumatic brain injury. Br. J. Neurosurg. 2017, 31, 356–363. [Google Scholar] [CrossRef]
- Khetani, S.; Singh, A.; Besler, B.; Butterworth, S.; Lijnse, T.; Loughery, K.; Smith, K.; Hosseini, E.; Narang, R.; Karan, K. μDrop: Multi-analyte portable electrochemical-sensing device for blood-based detection of cleaved tau and neuron filament light in traumatic brain injury patients. Biosens. Bioelectron. 2021, 178, 113033. [Google Scholar] [CrossRef] [PubMed]
- Xu, L.; Korley, F.; Puccio, A.; Ferguson, A.; Sun, S.; Mukherjee, P.; Wang, K.; Okonkwo, D.; Manley, G.; Jain, S.; et al. High-sensitivity C-reactive protein as a prognostic biomarker for traumatic brain injury (TBI): A TRACK-TBI Study (1550). Neurology 2020, 94, 1550. [Google Scholar]
- Su, S.-H.; Xu, W.; Li, M.; Zhang, L.; Wu, Y.-F.; Yu, F.; Hai, J. Elevated C-reactive protein levels may be a predictor of persistent unfavourable symptoms in patients with mild traumatic brain injury: A preliminary study. Brain Behav. Immun. 2014, 38, 111–117. [Google Scholar] [CrossRef] [PubMed]
- Xu, L.B.; Yue, J.K.; Korley, F.; Puccio, A.M.; Yuh, E.L.; Sun, X.; Rabinowitz, M.; Vassar, M.J.; Taylor, S.R.; Winkler, E.A. High-Sensitivity C-Reactive Protein Is a Prognostic Biomarker of Six-Month Disability after Traumatic Brain Injury: Results from the TRACK-TBI Study. J. Neurotrauma 2021, 38, 918–927. [Google Scholar] [CrossRef] [PubMed]
- Apori, A.A.; Herr, A.E. Homogeneous immunosubtraction integrated with sample preparation enabled by a microfluidic format. Anal. Chem. 2011, 83, 2691–2698. [Google Scholar] [CrossRef] [Green Version]
- Smith, R.; Chepisheva, M.; Cronin, T.; Seemungal, B.M. Diagnostic Approaches Techniques in Concussion/Mild Traumatic Brain Injury: Where are we? In Neurosensory Disorders in Mild Traumatic Brain Injury; Elsevier: Amsterdam, The Netherlands, 2019; pp. 247–277. [Google Scholar]
- Agostini, M.; Amato, F.; Vieri, M.L.; Greco, G.; Tonazzini, I.; Baroncelli, L.; Caleo, M.; Vannini, E.; Santi, M.; Signore, G. Glial-fibrillary-acidic-protein (GFAP) biomarker detection in serum-matrix: Functionalization strategies and detection by an ultra-high-frequency surface-acoustic-wave (UHF-SAW) lab-on-chip. Biosens. Bioelectron. 2021, 172, 112774. [Google Scholar] [CrossRef]
- Arya, S.K.; Pui, T.S.; Wong, C.C.; Kumar, S.; Rahman, A.R.A. Effects of the electrode size and modification protocol on a label-free electrochemical biosensor. Langmuir 2013, 29, 6770–6777. [Google Scholar] [CrossRef]
- Cardinell, B.A.; Addington, C.P.; Stabenfeldt, S.E.; La Belle, J.T. Multi-biomarker detection following traumatic brain injury. Crit. Rev. Biomed. Eng. 2019, 47, 193–206. [Google Scholar] [CrossRef]
- Huang, W.; Besar, K.; LeCover, R.; Dulloor, P.; Sinha, J.; Hardigree, J.F.M.; Pick, C.; Swavola, J.; Everett, A.D.; Frechette, J. Label-free brain injury biomarker detection based on highly sensitive large area organic thin film transistor with hybrid coupling layer. Chem. Sci. 2014, 5, 416–426. [Google Scholar] [CrossRef]
- Krausz, A.D.; Korley, F.K.; Burns, M.A. A Variable Height Microfluidic Device for Multiplexed Immunoassay Analysis of Traumatic Brain Injury Biomarkers. Biosensors 2021, 11, 320. [Google Scholar] [CrossRef]
- Ma, Y.; Xu, G.; Wei, F.; Cen, Y.; Song, Y.; Ma, Y.; Xu, X.; Shi, M.; Sohail, M.; Hu, Q. Carbon dots based immunosorbent assay for the determination of GFAP in human serum. Nanotechnology 2018, 29, 145501. [Google Scholar] [CrossRef] [PubMed]
- Rickard, J.J.S.; Di-Pietro, V.; Smith, D.J.; Davies, D.J.; Belli, A.; Oppenheimer, P.G. Rapid optofluidic detection of biomarkers for traumatic brain injury via surface-enhanced Raman spectroscopy. Nat. Biomed. Eng. 2020, 4, 610–623. [Google Scholar] [CrossRef] [PubMed]
- Song, J.; Dailey, J.; Li, H.; Jang, H.; Zhang, P.; Wang, J.T.; Everett, A.D.; Katz, H.E. Extended Solution Gate OFET-Based Biosensor for Label-Free Glial Fibrillary Acidic Protein Detection with Polyethylene Glycol-Containing Bioreceptor Layer. Adv. Funct. Mater. 2017, 27, 1606506. [Google Scholar] [CrossRef] [PubMed]
- Wang, T.; Fang, Y.; He, Z. Electrochemical Quantitative Detection of Glial Fibrillary Acidic Protein Based on Molecularly Imprinted Polymer Sensor. Int. J. Electrochem. Sci. 2017, 12, 7341–7350. [Google Scholar] [CrossRef]
- Guerriero, R.M.; Giza, C.C.; Rotenberg, A. Glutamate and GABA imbalance following traumatic brain injury. Curr. Neurol. Neurosci. Rep. 2015, 15, 27. [Google Scholar] [CrossRef] [PubMed]
- Leibowitz, A.; Boyko, M.; Shapira, Y.; Zlotnik, A. Blood glutamate scavenging: Insight into neuroprotection. Int. J. Mol. Sci. 2012, 13, 10041–10066. [Google Scholar] [CrossRef] [Green Version]
- Chamoun, R.; Suki, D.; Gopinath, S.P.; Goodman, J.C.; Robertson, C. Role of extracellular glutamate measured by cerebral microdialysis in severe traumatic brain injury. J. Neurosurg. 2010, 113, 564–570. [Google Scholar] [CrossRef]
- Halámek, J.; Windmiller, J.R.; Zhou, J.; Chuang, M.-C.; Santhosh, P.; Strack, G.; Arugula, M.A.; Chinnapareddy, S.; Bocharova, V.; Wang, J. Multiplexing of injury codes for the parallel operation of enzyme logic gates. Analyst 2010, 135, 2249–2259. [Google Scholar] [CrossRef]
- Zhou, N.; Windmiller, J.R.; Valdés-Ramírez, G.; Zhou, M.; Halámek, J.; Katz, E.; Wang, J. Enzyme-based NAND gate for rapid electrochemical screening of traumatic brain injury in serum. Anal. Chim. Acta 2011, 703, 94–100. [Google Scholar] [CrossRef]
- Maier, B.; Schwerdtfeger, K.; Mautes, A.; Holanda, M.; Müller, M.; Steudel, W.I.; Marzi, I. Differential release of interleukines 6, 8, and 10 in cerebrospinal fluid and plasma after traumatic brain injury. Shock 2001, 15, 421–426. [Google Scholar] [CrossRef] [PubMed]
- Morganti-Kossman, M.C.; Lenzlinger, P.M.; Hans, V.; Stahel, P.; Csuka, E.; Ammann, E.; Stocker, R.; Trentz, O.; Kossmann, T. Production of cytokines following brain injury: Beneficial and deleterious for the damaged tissue. Mol. Psychiatry 1997, 2, 133–136. [Google Scholar] [CrossRef] [Green Version]
- Kofanova, O.; Henry, E.; Aguilar Quesada, R.; Bulla, A.; Navarro Linares, H.; Lescuyer, P.; Shea, K.; Stone, M.; Tybring, G.; Bellora, C.; et al. IL8 and IL16 levels indicate serum and plasma quality. Clin. Chem. Lab. Med. 2018, 56, 1054–1062. [Google Scholar] [CrossRef] [Green Version]
- Carpenter, K.L.H.; Jalloh, I.; Hutchinson, P.J. Glycolysis and the significance of lactate in traumatic brain injury. Front. Neurosci. 2015, 9, 112. [Google Scholar] [CrossRef]
- Glenn, T.C.; Martin, N.A.; Horning, M.A.; McArthur, D.L.; Hovda, D.A.; Vespa, P.; Brooks, G.A. Lactate: Brain fuel in human traumatic brain injury: A comparison with normal healthy control subjects. J. Neurotrauma 2015, 32, 820–832. [Google Scholar] [CrossRef]
- Manesh, K.M.; Halámek, J.; Pita, M.; Zhou, J.; Tam, T.K.; Santhosh, P.; Chuang, M.-C.; Windmiller, J.R.; Abidin, D.; Katz, E. Enzyme logic gates for the digital analysis of physiological level upon injury. Biosens. Bioelectron. 2009, 24, 3569–3574. [Google Scholar] [CrossRef] [PubMed]
- Pita, M.; Zhou, J.; Manesh, K.M.; Halámek, J.; Katz, E.; Wang, J. Enzyme logic gates for assessing physiological conditions during an injury: Towards digital sensors and actuators. Sens. Actuators B Chem. 2009, 139, 631–636. [Google Scholar] [CrossRef]
- Bhardwaj, M.; Arora, B. Role of Serum Lactate Dehydrogenase in Isolated Head Injury. Indian J. Neurosurg. 2019, 8, 99–102. [Google Scholar] [CrossRef] [Green Version]
- Rao, C.J.; Shukla, P.K.; Mohanty, S.; Reddy, Y.J. Predictive value of serum lactate dehydrogenase in head injury. J. Neurol. Neurosurg. Psychiatry 1978, 41, 948–953. [Google Scholar] [CrossRef] [PubMed] [Green Version]
- Shannon, R.J.; van der Heide, S.; Carter, E.L.; Jalloh, I.; Menon, D.K.; Hutchinson, P.J.; Carpenter, K.L.H. Extracellular N-Acetylaspartate in Human Traumatic Brain Injury. J. Neurotrauma 2016, 33, 319–329. [Google Scholar] [CrossRef] [Green Version]
- Shahim, P.; Gren, M.; Liman, V.; Andreasson, U.; Norgren, N.; Tegner, Y.; Mattsson, N.; Andreasen, N.; Öst, M.; Zetterberg, H.; et al. Serum neurofilament light protein predicts clinical outcome in traumatic brain injury. Sci. Rep. 2016, 6, 36791. [Google Scholar] [CrossRef]
- Guzel, A.; Er, U.; Tatli, M.; Aluclu, U.; Ozkan, U.; Duzenli, Y.; Satici, O.; Guzel, E.; Kemaloglu, S.; Ceviz, A.; et al. Serum neuron-specific enolase as a predictor of short-term outcome and its correlation with Glasgow Coma Scale in traumatic brain injury. Neurosurg. Rev. 2008, 31, 439. [Google Scholar] [CrossRef]
- Gao, X.; Zheng, P.; Kasani, S.; Wu, S.; Yang, F.; Lewis, S.; Nayeem, S.; Engler-Chiurazzi, E.B.; Wigginton, J.G.; Simpkins, J.W. Paper-based surface-enhanced Raman scattering lateral flow strip for detection of neuron-specific enolase in blood plasma. Anal. Chem. 2017, 89, 10104–10110. [Google Scholar] [CrossRef]
- Li, D.; Yang, M.; Li, H.; Mao, L.; Wang, Y.; Sun, B. SERS based protocol using flow glass-hemostix for detection of neuron-specific enolase in blood plasma. New J. Chem. 2019, 43, 5925–5931. [Google Scholar] [CrossRef]
- Wang, Y.; Zhao, P.; Mao, L.; Hou, Y.; Li, D. Determination of brain injury biomarkers by surface-enhanced Raman scattering using hollow gold nanospheres. RSC Adv. 2018, 8, 3143–3150. [Google Scholar] [CrossRef] [Green Version]
- Mautes, A.E.; Müller, M.; Cortbus, F.; Schwerdtfeger, K.; Maier, B.; Holanda, M.; Nacimiento, A.; Marzi, I.; Steudel, W.I. Alterations of norepinephrine levels in plasma and CSF of patients after traumatic brain injury in relation to disruption of the blood-brain barrier. Acta Neurochir. (Wien) 2001, 143, 51–58. [Google Scholar] [CrossRef] [PubMed]
- Cardinell, B.A.; La Belle, J.T. Enzymatic detection of traumatic brain injury related biomarkers. In Biosensors and Biodetection; Springer: Berlin/Heidelberg, Germany, 2017; pp. 89–112. [Google Scholar]
- Haselwood, B.A.; La Belle, J.T. Development of electrochemical methods to enzymatically detect traumatic brain injury biomarkers. Biosens. Bioelectron. 2015, 67, 752–756. [Google Scholar] [CrossRef] [PubMed] [Green Version]
- Goyal, A.; Failla, M.D.; Niyonkuru, C.; Amin, K.; Fabio, A.; Berger, R.P.; Wagner, A.K. S100b as a prognostic biomarker in outcome prediction for patients with severe traumatic brain injury. J. Neurotrauma 2013, 30, 946–957. [Google Scholar] [CrossRef] [PubMed]
- Gao, X.; Boryczka, J.; Zheng, P.; Kasani, S.; Yang, F.; Engler-Chiurazzi, E.B.; Simpkins, J.W.; Wigginton, J.G.; Wu, N. A “hot spot”-enhanced paper lateral flow assay for ultrasensitive detection of traumatic brain injury biomarker S-100β in blood plasma. Biosens. Bioelectron. 2021, 177, 112967. [Google Scholar] [CrossRef]
- Han, L.; Ding, C.; Guo, Y.; Wang, Y.; Ding, Y. Sensitively detecting mTBI biomarker S100B by using peptide-modified ratiometric fluorescent C/AuNCs nanoprobe. Anal. Bioanal. Chem. 2020, 412, 3695–3702. [Google Scholar] [CrossRef]
- Kim, C.; Searson, P.C. Magnetic bead-quantum dot assay for detection of a biomarker for traumatic brain injury. Nanoscale 2015, 7, 17820–17826. [Google Scholar] [CrossRef] [PubMed] [Green Version]
- Shohami, E.; Ginis, I.; Hallenbeck, J.M. Dual role of tumor necrosis factor alpha in brain injury. Cytokine Growth Factor Rev. 1999, 10, 119–130. [Google Scholar] [CrossRef]
- Hayakata, T.; Shiozaki, T.; Tasaki, O.; Ikegawa, H.; Inoue, Y.; Toshiyuki, F.; Hosotubo, H.; Kieko, F.; Yamashita, T.; Tanaka, H.; et al. Changes in CSF S100B and cytokine concentrations in early-phase severe traumatic brain injury. Shock 2004, 22, 102–107. [Google Scholar] [CrossRef] [PubMed]
- Shahim, P.; Mattsson, N.; Macy, E.M.; Crimmins, D.L.; Ladenson, J.H.; Zetterberg, H.; Blennow, K.; Tegner, Y. Serum visinin-like protein-1 in concussed professional ice hockey players. Brain Inj. 2015, 29, 872–876. [Google Scholar] [CrossRef] [PubMed]
- Bradley-Whitman, M.A.; Roberts, K.N.; Abner, E.L.; Scheff, S.W.; Lynn, B.C.; Lovell, M.A. A novel method for the rapid detection of post-translationally modified visinin-like protein 1 in rat models of brain injury. Brain Inj. 2018, 32, 363–380. [Google Scholar] [CrossRef]
- Bogoslovsky, T.; Gill, J.; Jeromin, A.; Davis, C.; Diaz-arrastia, R. Fluid Biomarkers of Traumatic Brain Injury and Intended Context of Use. Diagnostics 2016, 6, 37. [Google Scholar] [CrossRef]
- Arya, S.K.; Wang, K.Y.; Wong, C.C.; Rahman, A.R.A. Anti-EpCAM modified LC-SPDP monolayer on gold microelectrode based electrochemical biosensor for MCF-7 cells detection. Biosens. Bioelectron. 2013, 41, 446–451. [Google Scholar] [CrossRef] [PubMed]
- Wang, J.; Katz, E. Digital Biosensors with Built-in Logic for Biomedical Applications. Isr. J. Chem. 2011, 51, 141–150. [Google Scholar] [CrossRef]
- Wang, J.; Katz, E. Digital biosensors with built-in logic for biomedical applications—Biosensors based on a biocomputing concept. Anal. Bioanal. Chem. 2010, 398, 1591–1603. [Google Scholar] [CrossRef]
- Sung, D.; Koo, J. A review of BioFET’s basic principles and materials for biomedical applications. Biomed. Eng. Lett. 2021, 11, 1–12. [Google Scholar] [CrossRef]
- Pankratova, N.; Jović, M.; Pfeifer, M.E. Electrochemical sensing of blood proteins for mild traumatic brain injury (mTBI) diagnostics and prognostics: Towards a point-of-care application. RSC Adv. 2021, 11, 17301–17319. [Google Scholar] [CrossRef]
- Langer, J.; Jimenez de Aberasturi, D.; Aizpurua, J.; Alvarez-Puebla, R.A.; Auguié, B.; Baumberg, J.J.; Bazan, G.C.; Bell, S.E.J.; Boisen, A.; Brolo, A.G. Present and future of surface-enhanced Raman scattering. ACS Nano 2019, 14, 28–117. [Google Scholar] [CrossRef] [Green Version]
- Pérez-Jiménez, A.I.; Lyu, D.; Lu, Z.; Liu, G.; Ren, B. Surface-enhanced Raman spectroscopy: Benefits, trade-offs and future developments. Chem. Sci. 2020, 11, 4563–4577. [Google Scholar] [CrossRef] [Green Version]
- Li, C.; Shah, K.A.; Narayan, R.K. Rapid detection of traumatic brain injury. Nat. Biomed. Eng. 2020, 4, 579–580. [Google Scholar] [CrossRef]
- Chen, Z.; Zhou, J.; Tang, H.; Liu, Y.; Shen, Y.; Yin, X.; Zheng, J.; Zhang, H.; Wu, J.; Shi, X. Ultrahigh-Frequency Surface Acoustic Wave Sensors with Giant Mass-Loading Effects on Electrodes. ACS Sens. 2020, 5, 1657–1664. [Google Scholar] [CrossRef] [PubMed]
- Agostini, M.; Greco, G.; Cecchini, M. Full-SAW microfluidics-based lab-on-a-chip for biosensing. IEEE Access 2019, 7, 70901–70909. [Google Scholar] [CrossRef]
- Banyan BTI Brain Trauma Indicator. Available online: http://banyanbio.com/assets/files/BanyanBTI_IFU_700027_v1.pdf (accessed on 7 July 2021).
- Bazarian, J.J.; Biberthaler, P.; Welch, R.D.; Lewis, L.M.; Barzo, P.; Bogner-Flatz, V.; Brolinson, P.G.; Büki, A.; Chen, J.Y.; Christenson, R.H. Serum GFAP and UCH-L1 for prediction of absence of intracranial injuries on head CT (ALERT-TBI): A multicentre observational study. Lancet Neurol. 2018, 17, 782–789. [Google Scholar] [CrossRef]
- Welch, R.D.; Ellis, M.; Lewis, L.M.; Ayaz, S.I.; Mika, V.H.; Millis, S.; Papa, L. Modeling the kinetics of serum glial fibrillary acidic protein, ubiquitin carboxyl-terminal hydrolase-L1, and S100B concentrations in patients with traumatic brain injury. J. Neurotrauma 2017, 34, 1957–1971. [Google Scholar] [CrossRef]
- Mondello, S.; Papa, L.; Buki, A.; Bullock, M.R.; Czeiter, E.; Tortella, F.C.; Wang, K.K.; Hayes, R.L. Neuronal and glial markers are differently associated with computed tomography findings and outcome in patients with severe traumatic brain injury: A case control study. Crit. Care 2011, 15, R156. [Google Scholar] [CrossRef] [Green Version]
- Papa, L.; Akinyi, L.; Liu, M.C.; Pineda, J.A.; Tepas, J.J., III; Oli, M.W.; Zheng, W.; Robinson, G.; Robicsek, S.A.; Gabrielli, A. Ubiquitin C-terminal hydrolase is a novel biomarker in humans for severe traumatic brain injury. Crit. Care Med. 2010, 38, 138. [Google Scholar] [CrossRef] [PubMed]
- Meier, T.B.; Nelson, L.D.; Huber, D.L.; Bazarian, J.J.; Hayes, R.L.; McCrea, M.A. Prospective assessment of acute blood markers of brain injury in sport-related concussion. J. Neurotrauma 2017, 34, 3134–3142. [Google Scholar] [CrossRef]
- Papa, L.; Brophy, G.M.; Welch, R.D.; Lewis, L.M.; Braga, C.F.; Tan, C.N.; Ameli, N.J.; Lopez, M.A.; Haeussler, C.A.; Mendez Giordano, D.I.; et al. Time Course and Diagnostic Accuracy of Glial and Neuronal Blood Biomarkers GFAP and UCH-L1 in a Large Cohort of Trauma Patients with and without Mild Traumatic Brain Injury. JAMA Neurol. 2016, 73, 551–560. [Google Scholar] [CrossRef] [PubMed] [Green Version]
- Welch, R.D.; Ayaz, S.I.; Lewis, L.M.; Unden, J.; Chen, J.Y.; Mika, V.H.; Saville, B.; Tyndall, J.A.; Nash, M.; Buki, A. Ability of serum glial fibrillary acidic protein, ubiquitin C-terminal hydrolase-L1, and S100B to differentiate normal and abnormal head computed tomography findings in patients with suspected mild or moderate traumatic brain injury. J. Neurotrauma 2016, 33, 203–214. [Google Scholar] [CrossRef]
- Diaz-Arrastia, R.; Wang, K.K.W.; Papa, L.; Sorani, M.D.; Yue, J.K.; Puccio, A.M.; McMahon, P.J.; Inoue, T.; Yuh, E.L.; Lingsma, H.F. Acute biomarkers of traumatic brain injury: Relationship between plasma levels of ubiquitin C-terminal hydrolase-L1 and glial fibrillary acidic protein. J. Neurotrauma 2014, 31, 19–25. [Google Scholar] [CrossRef] [PubMed]
- Okonkwo, D.O.; Yue, J.K.; Puccio, A.M.; Panczykowski, D.M.; Inoue, T.; McMahon, P.J.; Sorani, M.D.; Yuh, E.L.; Lingsma, H.F.; Maas, A.I.R. GFAP-BDP as an acute diagnostic marker in traumatic brain injury: Results from the prospective transforming research and clinical knowledge in traumatic brain injury study. J. Neurotrauma 2013, 30, 1490–1497. [Google Scholar] [CrossRef]
- Czeiter, E.; Mondello, S.; Kovacs, N.; Sandor, J.; Gabrielli, A.; Schmid, K.; Tortella, F.; Wang, K.K.W.; Hayes, R.L.; Barzo, P. Brain injury biomarkers may improve the predictive power of the IMPACT outcome calculator. J. Neurotrauma 2012, 29, 1770–1778. [Google Scholar] [CrossRef] [PubMed] [Green Version]
- Papa, L.; Lewis, L.M.; Falk, J.L.; Zhang, Z.; Silvestri, S.; Giordano, P.; Brophy, G.M.; Demery, J.A.; Dixit, N.K.; Ferguson, I. Elevated levels of serum glial fibrillary acidic protein breakdown products in mild and moderate traumatic brain injury are associated with intracranial lesions and neurosurgical intervention. Ann. Emerg. Med. 2012, 59, 471–483. [Google Scholar] [CrossRef] [Green Version]
- Papa, L.; Lewis, L.M.; Silvestri, S.; Falk, J.L.; Giordano, P.; Brophy, G.M.; Demery, J.A.; Liu, M.C.; Mo, J.; Akinyi, L. Serum levels of Ubiquitin C-terminal Hydrolase (UCH-L1) distinguish mild traumatic brain injury (TBI) from trauma controls and are elevated in mild and moderate TBI patients with intracranial lesions and neurosurgical intervention. J. Trauma Acute Care Surg. 2012, 72, 1335. [Google Scholar] [CrossRef] [Green Version]
- TBI Plasma Cartridge. Available online: https://www.pointofcare.abbott/us/en/offerings/istat/istat-test-cartridges/TBI-Plasma (accessed on 7 July 2021).
- Simoa Assay Kits. Available online: https://www.quanterix.com/simoa-assay-kits/?f_therapeutic_areas=neurology (accessed on 7 July 2021).
- Simoa N4PA Advantage Kit HD-1/HD-X Data Sheet. Available online: https://www.quanterix.com/wp-content/uploads/2020/12/Simoa_N4PA_Data_Sheet_HD-1_HD-X_DS-0074_rev7.pdf (accessed on 7 July 2021).
- Simoa NSE Discovery Kit HD-1/HD-X Data Sheet. Available online: https://www.quanterix.com/wp-content/uploads/2020/12/Simoa_NSE_Data_Sheet_HD-1_HD-X_Rev02.pdf (accessed on 7 July 2021).
- Chunyk, A.G.; Joyce, A.; Fischer, S.K.; Dysinger, M.; Mikulskis, A.; Jeromin, A.; Lawrence-Henderson, R.; Baker, D.; Yeung, D. A Multi-site In-depth Evaluation of the Quanterix Simoa from a User’s Perspective. AAPS J. 2018, 20, 10. [Google Scholar] [CrossRef]
- Tschiffely, A.E.; Statz, J.K.; Edwards, K.A.; Goforth, C.; Ahlers, S.T.; Carr, W.S.; Gill, J.M. Assessing a blast-related biomarker in an operational community: Glial fibrillary acidic protein in experienced breachers. J. Neurotrauma 2020, 37, 1091–1096. [Google Scholar] [CrossRef]
- Dickstein, D.L.; De Gasperi, R.; Sosa, M.A.G.; Perez-Garcia, G.; Short, J.A.; Sosa, H.; Perez, G.M.; Tschiffely, A.E.; Dams-O’Connor, K.; Pullman, M.Y. Brain and blood biomarkers of tauopathy and neuronal injury in humans and rats with neurobehavioral syndromes following blast exposure. Mol. Psychiatry 2020, 1–15. [Google Scholar] [CrossRef] [Green Version]
- Karlsson, M.; Yang, Z.; Chawla, S.; Delso, N.; Pukenas, B.; Elmér, E.; Hugerth, M.; Margulies, S.S.; Ehinger, J.; Hansson, M.J. Evaluation of Diffusion Tensor Imaging and Fluid Based Biomarkers in a Large Animal Trial of Cyclosporine in Focal Traumatic Brain Injury. J. Neurotrauma 2021, 38, 1870–1878. [Google Scholar] [CrossRef] [PubMed]
- Publications and Posters. Available online: https://www.quanterix.com/publications-posters/?f_assays=11560&f_therapeutic_areas=neurology (accessed on 7 July 2021).
- Evaluation of Automatic Class III Designation for Banyan Brain Trauma Indicator Decision Memorandum. Available online: https://www.accessdata.fda.gov/cdrh_docs/reviews/DEN170045.pdf (accessed on 7 July 2021).
- Banyan Provides Non-Exclusive License of Traumatic Brain Injury (TBI) Biomarkers to Abbott for Use on Its Core Laboratory Instruments. Available online: https://www.businesswire.com/news/home/20190404005161/en/Banyan-Non-Exclusive-License-Traumatic-Brain-Injury-TBI (accessed on 7 July 2021).
- 510(k) Substantial Equivalence Determination Decision Summary Assay Only. Available online: https://www.accessdata.fda.gov/cdrh_docs/reviews/K201778.pdf (accessed on 7 July 2021).
- Datwyler, S.; McQuiston, B.; Brate, E.; Ramp, J.; Pacenti, D. Improved Methods of Assessing GFAP Status in Patient Samples. Patent WO-2018067474-A1, 12 April 2018. [Google Scholar]
- Abbott Receives FDA 510(k) Clearance for the First Rapid Handheld Blood Test for Concussions. Available online: https://abbott.mediaroom.com/2021-01-11-Abbott-Receives-FDA-510-k-Clearance-for-the-First-Rapid-Handheld-Blood-Test-for-Concussions (accessed on 7 July 2021).
- Rissin, D.M.; Kan, C.W.; Campbell, T.G.; Howes, S.C.; Fournier, D.R.; Song, L.; Piech, T.; Patel, P.P.; Chang, L.; Rivnak, A.J.; et al. Single-molecule enzyme-linked immunosorbent assay detects serum proteins at subfemtomolar concentrations. Nat. Biotechnol. 2010, 28, 595–599. [Google Scholar] [CrossRef] [PubMed] [Green Version]
- Rissin, D.M.; Kan, C.W.; Song, L.; Rivnak, A.J.; Fishburn, M.W.; Shao, Q.; Piech, T.; Ferrell, E.P.; Meyer, R.E.; Campbell, T.G.; et al. Multiplexed single molecule immunoassays. Lab Chip 2013, 13, 2902–2911. [Google Scholar] [CrossRef]
- Wilson, D.H.; Rissin, D.M.; Kan, C.W.; Fournier, D.R.; Piech, T.; Campbell, T.G.; Meyer, R.E.; Fishburn, M.W.; Cabrera, C.; Patel, P.P.; et al. The Simoa HD-1 Analyzer: A Novel Fully Automated Digital Immunoassay Analyzer with Single-Molecule Sensitivity and Multiplexing. J. Lab. Autom. 2016, 21, 533–547. [Google Scholar] [CrossRef] [Green Version]
- Heller, A.; Feldman, B. Electrochemical Glucose Sensors and Their Applications in Diabetes Management. Chem. Rev. 2008, 108, 2482–2505. [Google Scholar] [CrossRef] [Green Version]
- Zetterberg, H.; Blennow, K. Fluid biomarkers for mild traumatic brain injury and related conditions. Nat. Rev. Neurol. 2016, 12, 563–574. [Google Scholar] [CrossRef]
- Krleza, J.L.; Dorotic, A.; Grzunov, A.; Maradin, M.; Croatian Society of Medical Biochemistry and Laboratory Medicine. Capillary blood sampling: National recommendations on behalf of the Croatian Society of Medical Biochemistry and Laboratory Medicine. Biochem. Med. 2015, 25, 335–358. [Google Scholar] [CrossRef]
- Kawata, K.; Liu, C.Y.; Merkel, S.F.; Ramirez, S.H.; Tierney, R.T.; Langford, D. Blood biomarkers for brain injury: What are we measuring? Neurosci. Biobehav. Rev. 2016, 68, 460–473. [Google Scholar] [CrossRef] [Green Version]
- Adrian, H.; Mårten, K.; Salla, N. Biomarkers of Traumatic Brain Injury: Temporal Changes in Body Fluids. eNeuro 2016, 3. [Google Scholar] [CrossRef] [Green Version]
- Thelin, E.P.; Zeiler, F.A.; Ercole, A.; Mondello, S.; Büki, A.; Bellander, B.-M.; Helmy, A.; Menon, D.K.; Nelson, D.W. Serial sampling of serum protein biomarkers for monitoring human traumatic brain injury dynamics: A systematic review. Front. Neurol. 2017, 8, 300. [Google Scholar] [CrossRef] [Green Version]
- Rezaii, P.G.; Grant, G.A.; Zeineh, M.M.; Richardson, K.J.; Coburn, M.L.; Bet, A.M.; Weber, A.; Jiang, B.; Li, Y.; Ubungen, K. Stability of Blood biomarkers of traumatic brain injury. J. Neurotrauma 2019, 36, 2407–2416. [Google Scholar] [CrossRef]
- Peacock, W.F., IV; Van Meter, T.E.; Mirshahi, N.; Ferber, K.; Gerwien, R.; Rao, V.; Sair, H.I.; Diaz-Arrastia, R.; Korley, F.K. Derivation of a three biomarker panel to improve diagnosis in patients with mild traumatic brain injury. Front. Neurol. 2017, 8, 641. [Google Scholar] [CrossRef] [Green Version]
- Thelin, E.; Al Nimer, F.; Frostell, A.; Zetterberg, H.; Blennow, K.; Nyström, H.; Svensson, M.; Bellander, B.-M.; Piehl, F.; Nelson, D.W. A serum protein biomarker panel improves outcome prediction in human traumatic brain injury. J. Neurotrauma 2019, 36, 2850–2862. [Google Scholar] [CrossRef] [Green Version]


| Biomarker | Physiological Concentration | Relevant Devices | |||
|---|---|---|---|---|---|
| Name | Abbreviation | Injury Information | Normal | Traumatic Brain Injury | |
| Adenosine | Ado | Severity [31] | 4–8 nM in CSF [32] | Severe TBI: 8–16 nM up to 100–800 nM in CSF [31] | Gunawardhana and Lunte [33] |
| Cleaved tau | C-tau | Neuronal damage (axons) [34] | 2.48–66.54 pg/mL in serum [35] | Severe TBI: 36.44–192.34 pg/mL in serum [35] | Khetani et al. [36] |
| C-reactive protein | CRP | Prognosis [37,38] | 0.642–2.785 mg/L in serum [39] | mTBI: 2.110–30.932 mg/L in serum [39] | Apori and Herr [40] |
| Glial Fibrillary Acidic Protein | GFAP | Astrocyte damage [41] | 7–20 pg/mL in plasma [17] | mTBI: 69–1196 pg/mL in plasma [17] | Agostini et al. [42] Arya et al. [43] Cardinell et al. [44] Huang et al. [45] Krausz et al. [46] Ma et al. [47] Rickard et al. [48] Song et al. [49] Wang et al. [50] |
| Glutamate | - | Neuronal damage (synapses) [51] | 0.3–2 µmol/L in brain extracellular fluid [52] | Severe TBI: >20 µmol/L in brain extracellular fluid [53] | Halámek et al. [54] Zhou et al. [55] |
| Interleukin-6 | IL-6 | Inflammation [56] | ≤1.8 pg/mL in serum [57] | Severe TBI: 0–1100 pg/mL in serum [57] | Krausz et al. [46] |
| Interleukin-8 | IL-8 | Inflammation [56] | ≤14.6 pg/mL in serum [58] | Severe TBI: 0–2400 pg/mL in serum [57] | Krausz et al. [46] |
| Lactate | - | Prognosis [59] | 6.7–13.9 mg/dL in whole blood [60] | Moderate to Severe TBI: 5.54–11.34 mg/dL in whole blood [60] | Manesh et al. [61] Pita et al. [62] |
| Lactate dehydrogenase | LDH | Severity [63] | 77.3–126.3 IU/L in serum [64] | mTBI: 152.24–247.58 IU/L in serum [64] | Zhou et al. [55] |
| N-acetylasparate | NAA | Neuronal damage [65] | 15.3–36.7 μmol/L in brain extracellular fluid [65] | Severe TBI: 8.8–19.1 μmol/L in brain extracellular fluid [65] | Rickard et al. [48] |
| Neurofilament light | NF-L | Axonal white matter damage [66] | 11–17 pg/mL in serum [66] | Severe TBI: 89–413 pg/mL in serum [66] | Khetani et al. [36] |
| Neuron Specific Enolase | NSE | Neuronal damage [67] | ≤0.15 µg/L in serum [67] | >0.15 µg/L in serum [67] | Cardinell et al. [44] Gao et al. [68] Li et al. [69] Wang et al. [70] |
| Norepinephrine | NE | Blood-brain barrier (BBB) disruption [71] | 185–275 pg/mL in plasma [71] | Severe TBI: >275 pg/mL in plasma [71] | Cardinell and La Belle [72] Halámek et al. [54] Haselwood and La Belle [73] Manesh et al. [61] Pita et al. [62] |
| S100 Calcium Binding Protein B | S100B | Astrocyte damage [74] | 0.06–0.13 µg/L in serum [17] | mTBI: 0.07–0.24 µg/L in serum [17] | Apori and Herr [40] Cardinell et al. [44] Gao et al. [75] Han et al. [76] Kim and Searson [77] Rickard et al. [48] Wang et al. [70] |
| Tumor Necrosis Factor α | TNF-α | Ischemia [78] | ≤4.4 pg/mL in serum [79] | Severe TBI: 0–157 pg/mL in serum [57] | Cardinell et al. [44] |
| Visinin-like protein 1 | VILIP-1 | Neuronal damage [80] | 21.7–195.3 pg/mL in serum a [80] | mTBI: 39.3–160.2 pg/mL in serum a [80] | Bradley-Whitman et al. [81] |
| Detection Technique | Biomarker(s) | Multiplex | Sample Type | Sample Volume | Analysis Time | Lower Limit of Detection (LLOD) | Range | Ref(s). |
|---|---|---|---|---|---|---|---|---|
| Electrochemical (EIS and Z-t) | NE | No | Buffer and 10% rabbit whole blood | 50 µL | ~90 s | EIS: 98 pg/mL Z-t: 8 pg/mL | 1–10,000 pg/mL | [72,73] |
| Electrochemical (EIS and Z-t) | GFAP NSE S100B TNF-α | No | Buffer and 5%, 12.5%, and 90% rat whole blood and plasma | 100 µL | ~33 s | Buffer: 2–5 pg/mL 90% whole blood: 14–67 pg/mL a | GFAP: 0.1–2800 pg/mL NSE: 1–25,000 pg/mL S100B: 1–10,000 TNF-α: 0.1–75 pg/mL | [44] |
| Electrochemical (EIS) | GFAP | No | Buffer | 15 µL or 60 µL | ~30 min | 1 pg/mL | 1 pg/mL–100 ng/mL | [43] |
| Electrochemical (Amperometric) | NE Lactate Glucose (AND and XOR logic gates) | Yes | Buffer | 1 mL | ~15 min | Glucose: 4 mM Lactate: 2 mM NE: 2.2 nM b | Glucose: 4–30 mM Lactate: 2–13 mM NE: 2.2 nM–3.5 µM b | [62] |
| Electrochemical (Amperometric) | NE Lactate Glucose (AND and IDENTITY logic gates) | Yes | Buffer | 1 mL | ~15 min | Glucose: 4 mM Lactate: 2 mM NE: 2.2 nM b | Glucose: 4–30 mM Lactate: 2–13 mM NE: 2.2 nM–3.5 µM b | [61] |
| Electrochemical (Chronoamperometric) | NE Glutamate | Yes | Buffer | 1 mL or 500 µL | ~5 min | Glutamate: 40 µM NE: 2.2 nM b | Glutamate: 40–140 µM NE: 2.2 nM–3.5 µM b | [54] |
| Electrochemical (Chronoamperometric) | Glutamate LDH | Yes | Buffer and human serum | 27 µL | ~15 s | Glutamate: 40 µM LDH: 0.15 U/mL b | Glutamate: 40–140 µM LDH: 0.15–1 U/mL b | [55] |
| Electrochemical (Amperometric) | Adenosine Hypoxanthine Guanosine Inosine | Yes | Buffer | ~1.5 µL c | ~85 s | Adenosine: 25 µM Hypoxanthine: 10 µM Guanosine: 25 µM Inosine: 33 µM | Adenosine: 75–400 µM Hypoxanthine: 20–100 µM Guanosine: 75–400 µM Inosine: 75–150 µM | [33] |
| Electrochemical (Amperometric) | C-tau NF-L | Yes d | Buffer and human serum | - | ~30 min | C-tau (buffer): 0.14 pg/mL C-tau (serum): 0.1 pg/mL NFL (buffer): 0.16 pg/mL NFL (serum): 0.11 pg/mL | Buffer: 1 pg/mL–1 µg/mL Serum: 10 pg/mL–100 ng/mL | [36] |
| Electrochemical (Amperometric) | GFAP | No | Buffer | - | - | 0.04 µg/mL | 0.2–10 µg/mL | [50] |
| SERS | NAA S100B GFAP | Yes e | Human plasma | ~50–100 µL f | ~2–3 min | NAA: 0.021 pg/mL (0.12 pM) S100B: 3.99 pg/mL (0.19 pM) GFAP: 3.35 pg/mL (0.02 pM) | 1 fM–100 nM | [48] |
| SERS | NSE | No | 80% human plasma and 20% PBS | 100 µL | ~30 min | 0.86 ng/mL | 1–75 ng/mL | [68] |
| SERS | S100B | No | 80% human plasma and 20% PBS | 100 µL | ~30 min | 5.0 pg/mL | 0.1–100 ng/mL | [75] |
| SERS | NSE | No | 80% human plasma and 20% PBS | - | ~30 min | 0.36 ng/mL | 0.5–85 ng/mL | [69] |
| SERS | NSE S100B | Yes | Human serum | - | - | NSE: 0.1 ng/mL S100B: 0.06 ng/mL | 0.2–22 ng/mL | [70] |
| SAW | GFAP | No | Buffer and bovine serum albumin | 200 µL | - | 35 pM (in bovine serum albumin) g | - | [42] |
| Electrochemical (FET) | GFAP | No | Buffer | 100 µL | ~30 min | 1 ng/mL | 0.8–400 ng/mL | [45] |
| Electrochemical (FET) | GFAP | No | Buffer | - | ~30 min | 1 ng/mL | 0.5–100 ng/mL | [49] |
| Optical Detection (Fluorescence) | S100B CRP | Yes | Ovalbumin and CSF | 5 µL | ~5 min | S100B (CSF): 65 nM CRP (CSF): 3.25 nM | S100B (ovalbumin): 30 pM–1 µM h | [40] |
| Optical Detection (Colorimetric) | VILIP-1 | No | Rat serum | 10 µL | ~20 min | 5.5 pg/mL | ~2–50 pg/mL i | [81] |
| Optical Detection (Fluorescence) | S100B | No | Human serum | 100 µL | ~1 h | 10 pg/mL | 0.1–3 ng/mL | [77] |
| Optical Detection (Fluorescence) | GFAP | No | Buffer and human serum | 200 µL | ~90 min | 25 pg/mL (buffer) | 0.1–8 ng/mL (buffer) | [47] |
| Optical Detection (Fluorescence) | S100B | No | Buffer and human serum | 40 µL | ~30 min | 0.01 µg/mL (buffer) | 0.03–1 µg/mL (buffer) | [76] |
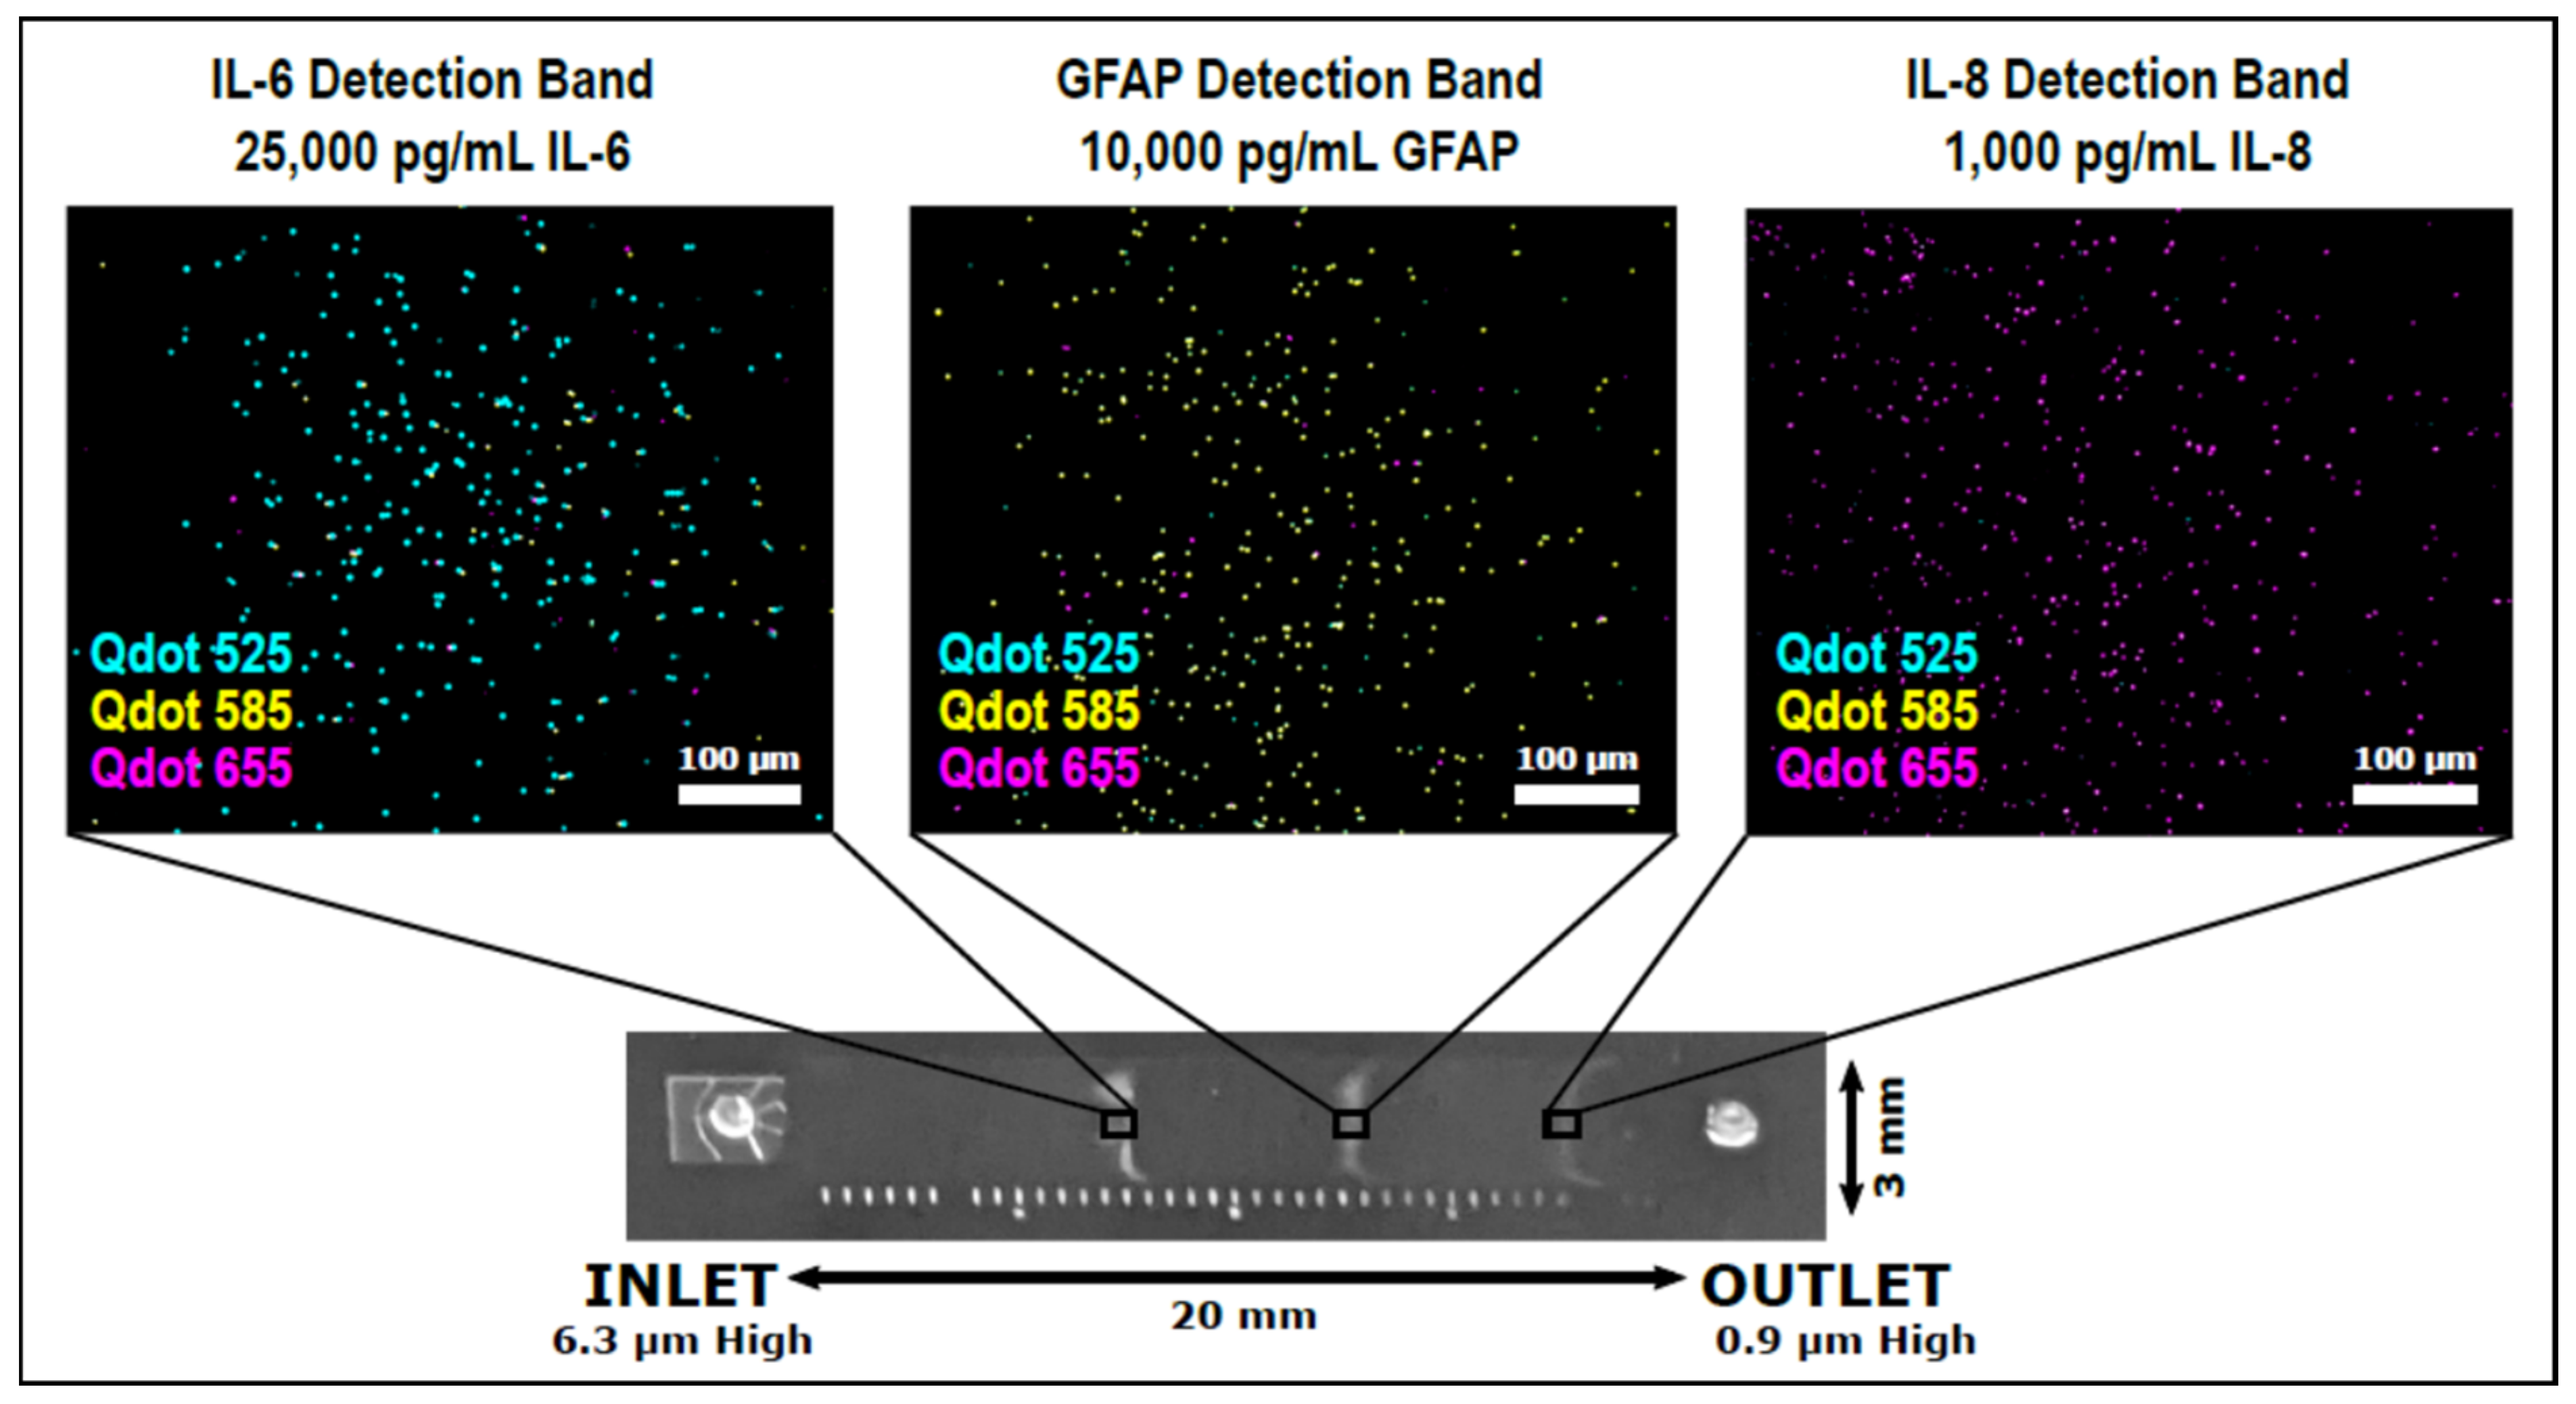
| Optical Detection (Fluorescence) | GFAP IL-6 IL-8 | Yes | Buffer, human serum, and human whole blood | 100 µL | ~40 min | GFAP (serum): 125 pg/mL IL-6 (buffer): 437 pg/mL IL-8 (buffer): 2 pg/mL | GFAP (serum and whole blood): 100–10,000 pg/mL IL-6 (buffer): 1000–25,000 pg/mL IL-8 (buffer): 10–1000 pg/mL | [46] |
| Device | Detection Technique | Biomarker(s) | Multiplex | Sample Type | Sample Volume | Analysis Time | Lower Limit of Quantitation (LLOQ) | Range | Clinical Studies |
|---|---|---|---|---|---|---|---|---|---|
| Banyan BTITM | Optical Detection (Chemiluminescence) | GFAP UCH-L1 | No | Human serum [93] | 250 µL [93] | >2 h [93] | GFAP: 10 pg/mL UCH-L1: 80 pg/mL [93] | GFAP: 10–320 pg/mL UCH-L1: 80–2560 pg/mL [93] | [94,95,96,97,98,99,100,101,102,103,104,105] |
| Abbott i-STAT Alinity | Electrochemical Detection (Amperometric) | GFAP UCH-L1 | Yes | Human plasma [106] | 20 µL [106] | 15 min [106] | GFAP: 23 pg/mL UCH-L1: 70 pg/mL [106] | GFAP: 30–10,000 pg/mL UCH-L1: 200–3200 pg/mL [106] | [17,23] |
| Quanterix Simoa® | Optical Detection (Fluorescence) | GFAP UCH-L1 Tau NF-L NSE [107] | Yes | Human CSF, serum, and plasma [108] | 100–152 µL [108,109] | 2 h and 30 min per 96-well plate [110] | GFAP: 0.467 pg/mL UCH-L1: 5.45 pg/mL Tau: 0.053 pg/mL NF-L: 0.241 pg/mL NSE: 9.88 pg/mL [108,109] | GFAP: 0–4000 pg/mL UCH-L1: 0–40 ng/mL Tau: 0–400 pg/mL NF-L: 0–2000 pg/mL NSE: 0–120 ng/mL [108,109] | [111,112,113,114] |
Publisher’s Note: MDPI stays neutral with regard to jurisdictional claims in published maps and institutional affiliations. |
© 2021 by the authors. Licensee MDPI, Basel, Switzerland. This article is an open access article distributed under the terms and conditions of the Creative Commons Attribution (CC BY) license (https://creativecommons.org/licenses/by/4.0/).
Share and Cite
Krausz, A.D.; Korley, F.K.; Burns, M.A. The Current State of Traumatic Brain Injury Biomarker Measurement Methods. Biosensors 2021, 11, 319. https://doi.org/10.3390/bios11090319
Krausz AD, Korley FK, Burns MA. The Current State of Traumatic Brain Injury Biomarker Measurement Methods. Biosensors. 2021; 11(9):319. https://doi.org/10.3390/bios11090319
Chicago/Turabian StyleKrausz, Alyse D., Frederick K. Korley, and Mark A. Burns. 2021. "The Current State of Traumatic Brain Injury Biomarker Measurement Methods" Biosensors 11, no. 9: 319. https://doi.org/10.3390/bios11090319