Trends in the Design of Intensity-Based Optical Fiber Biosensors (2010–2020)


Abstract
:1. Introduction
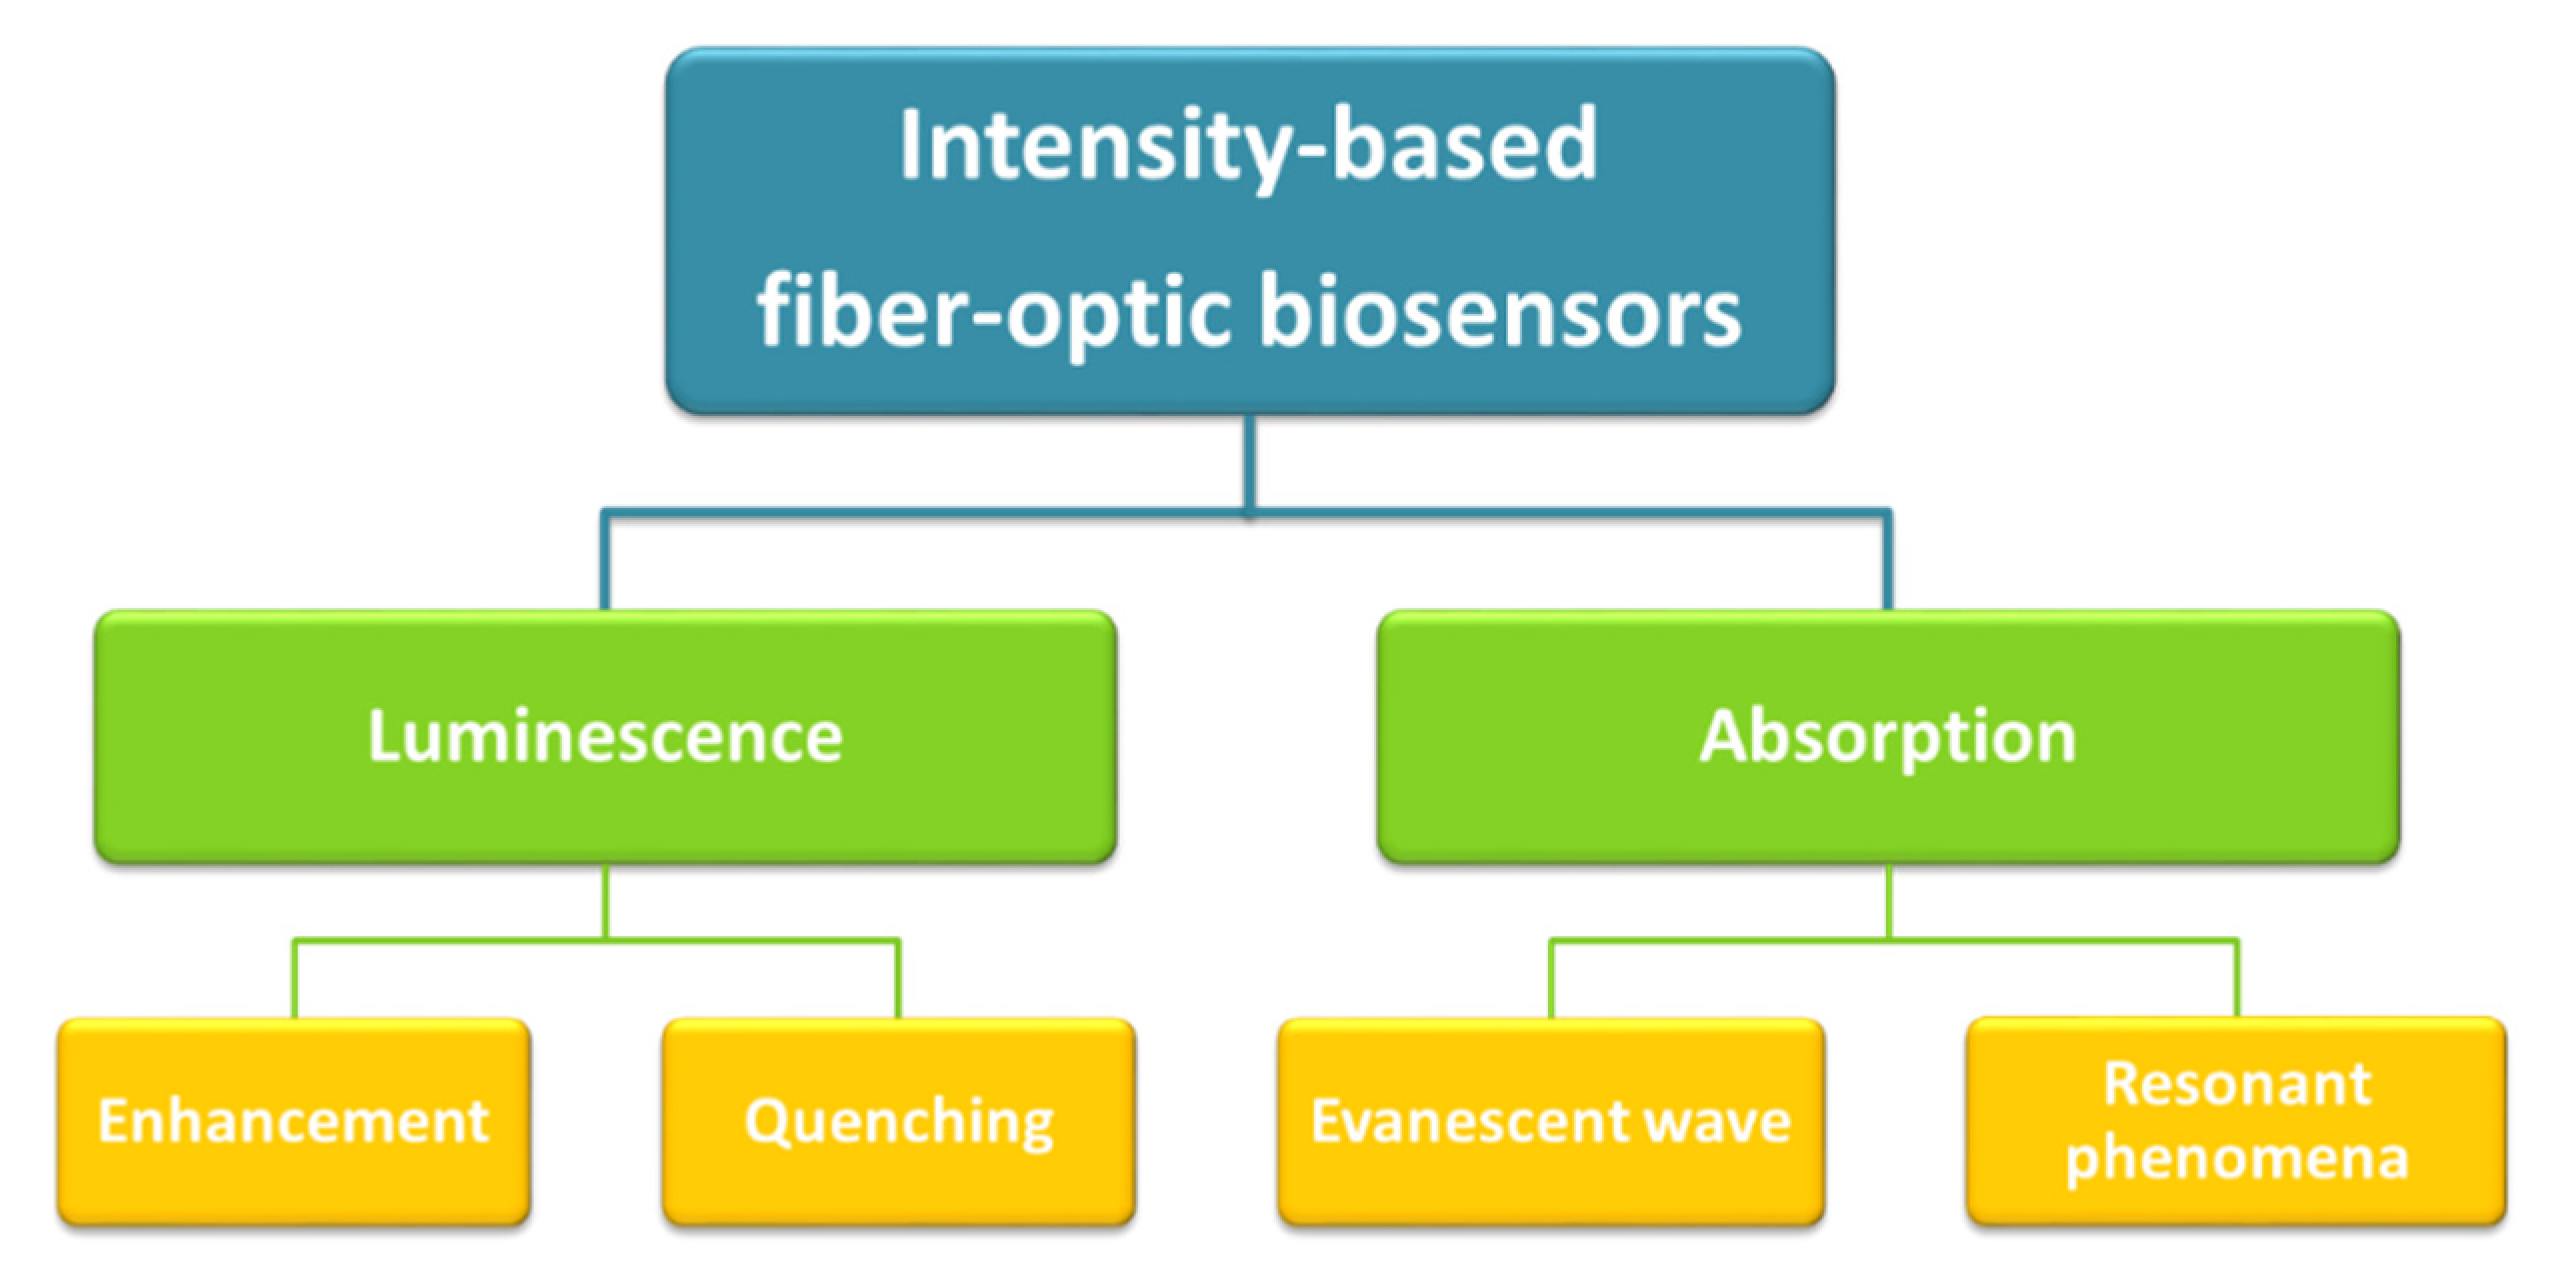
2. Intensity-Based Optical Detection Phenomena
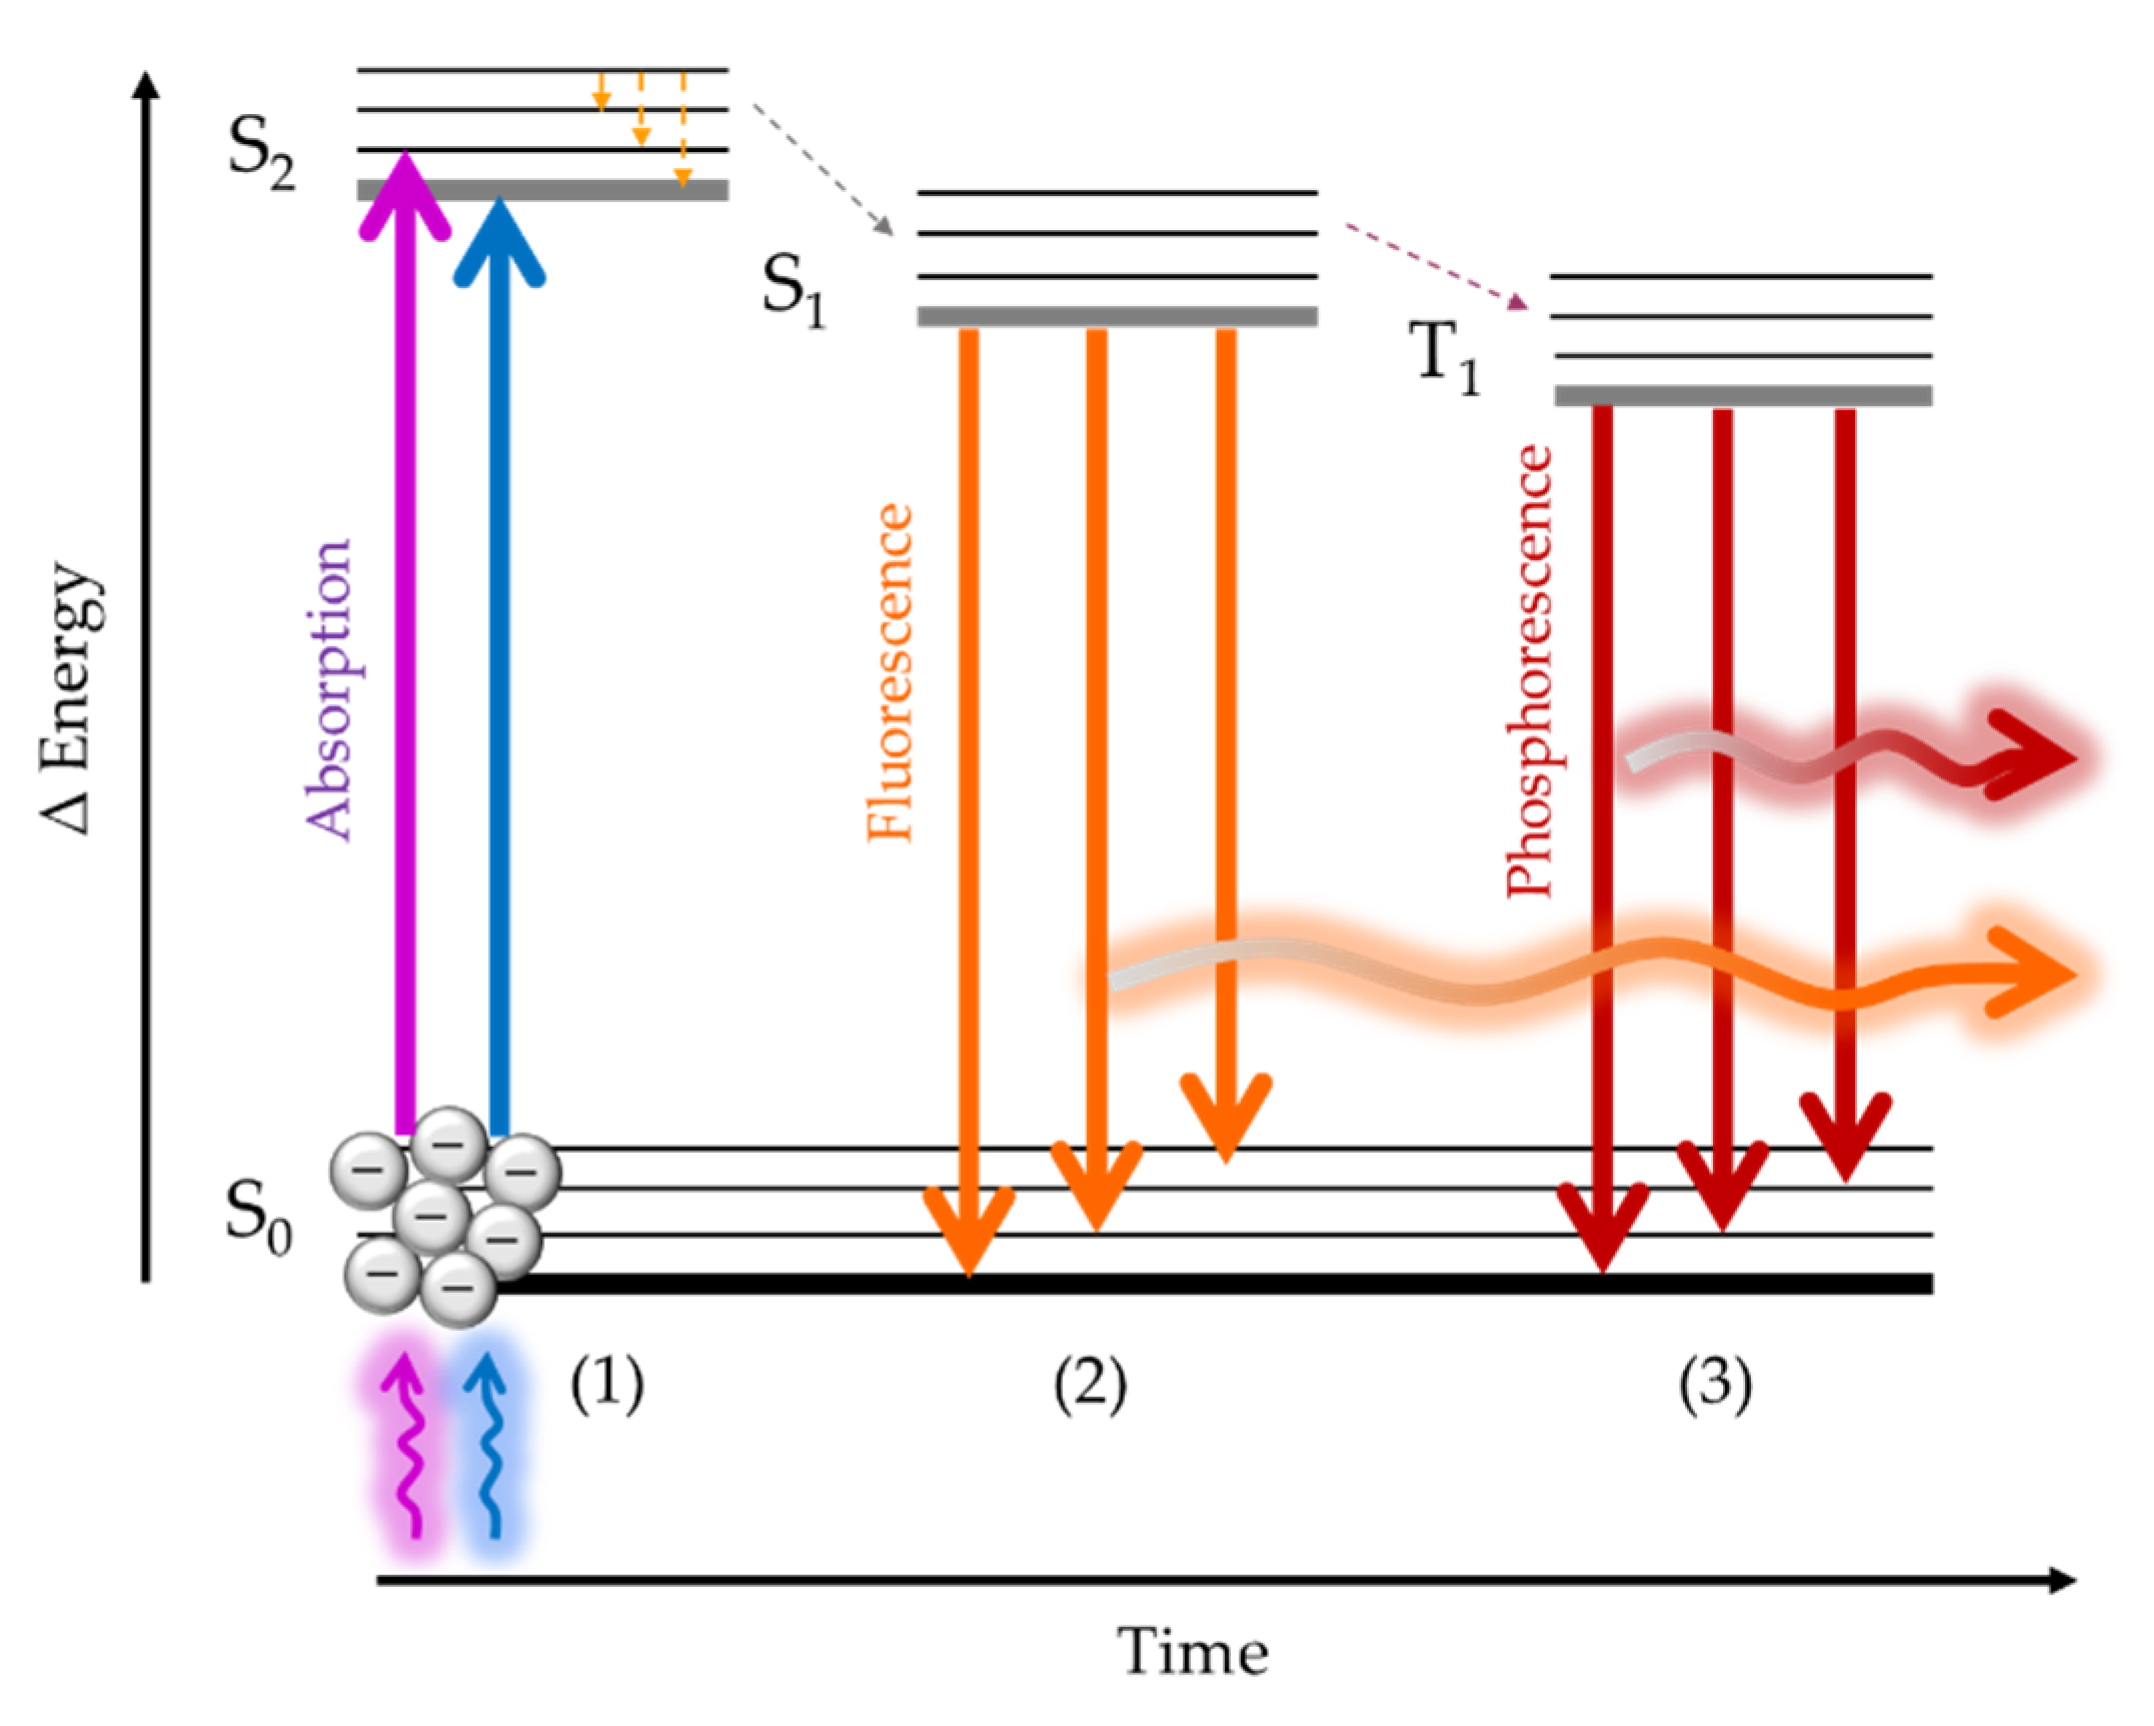
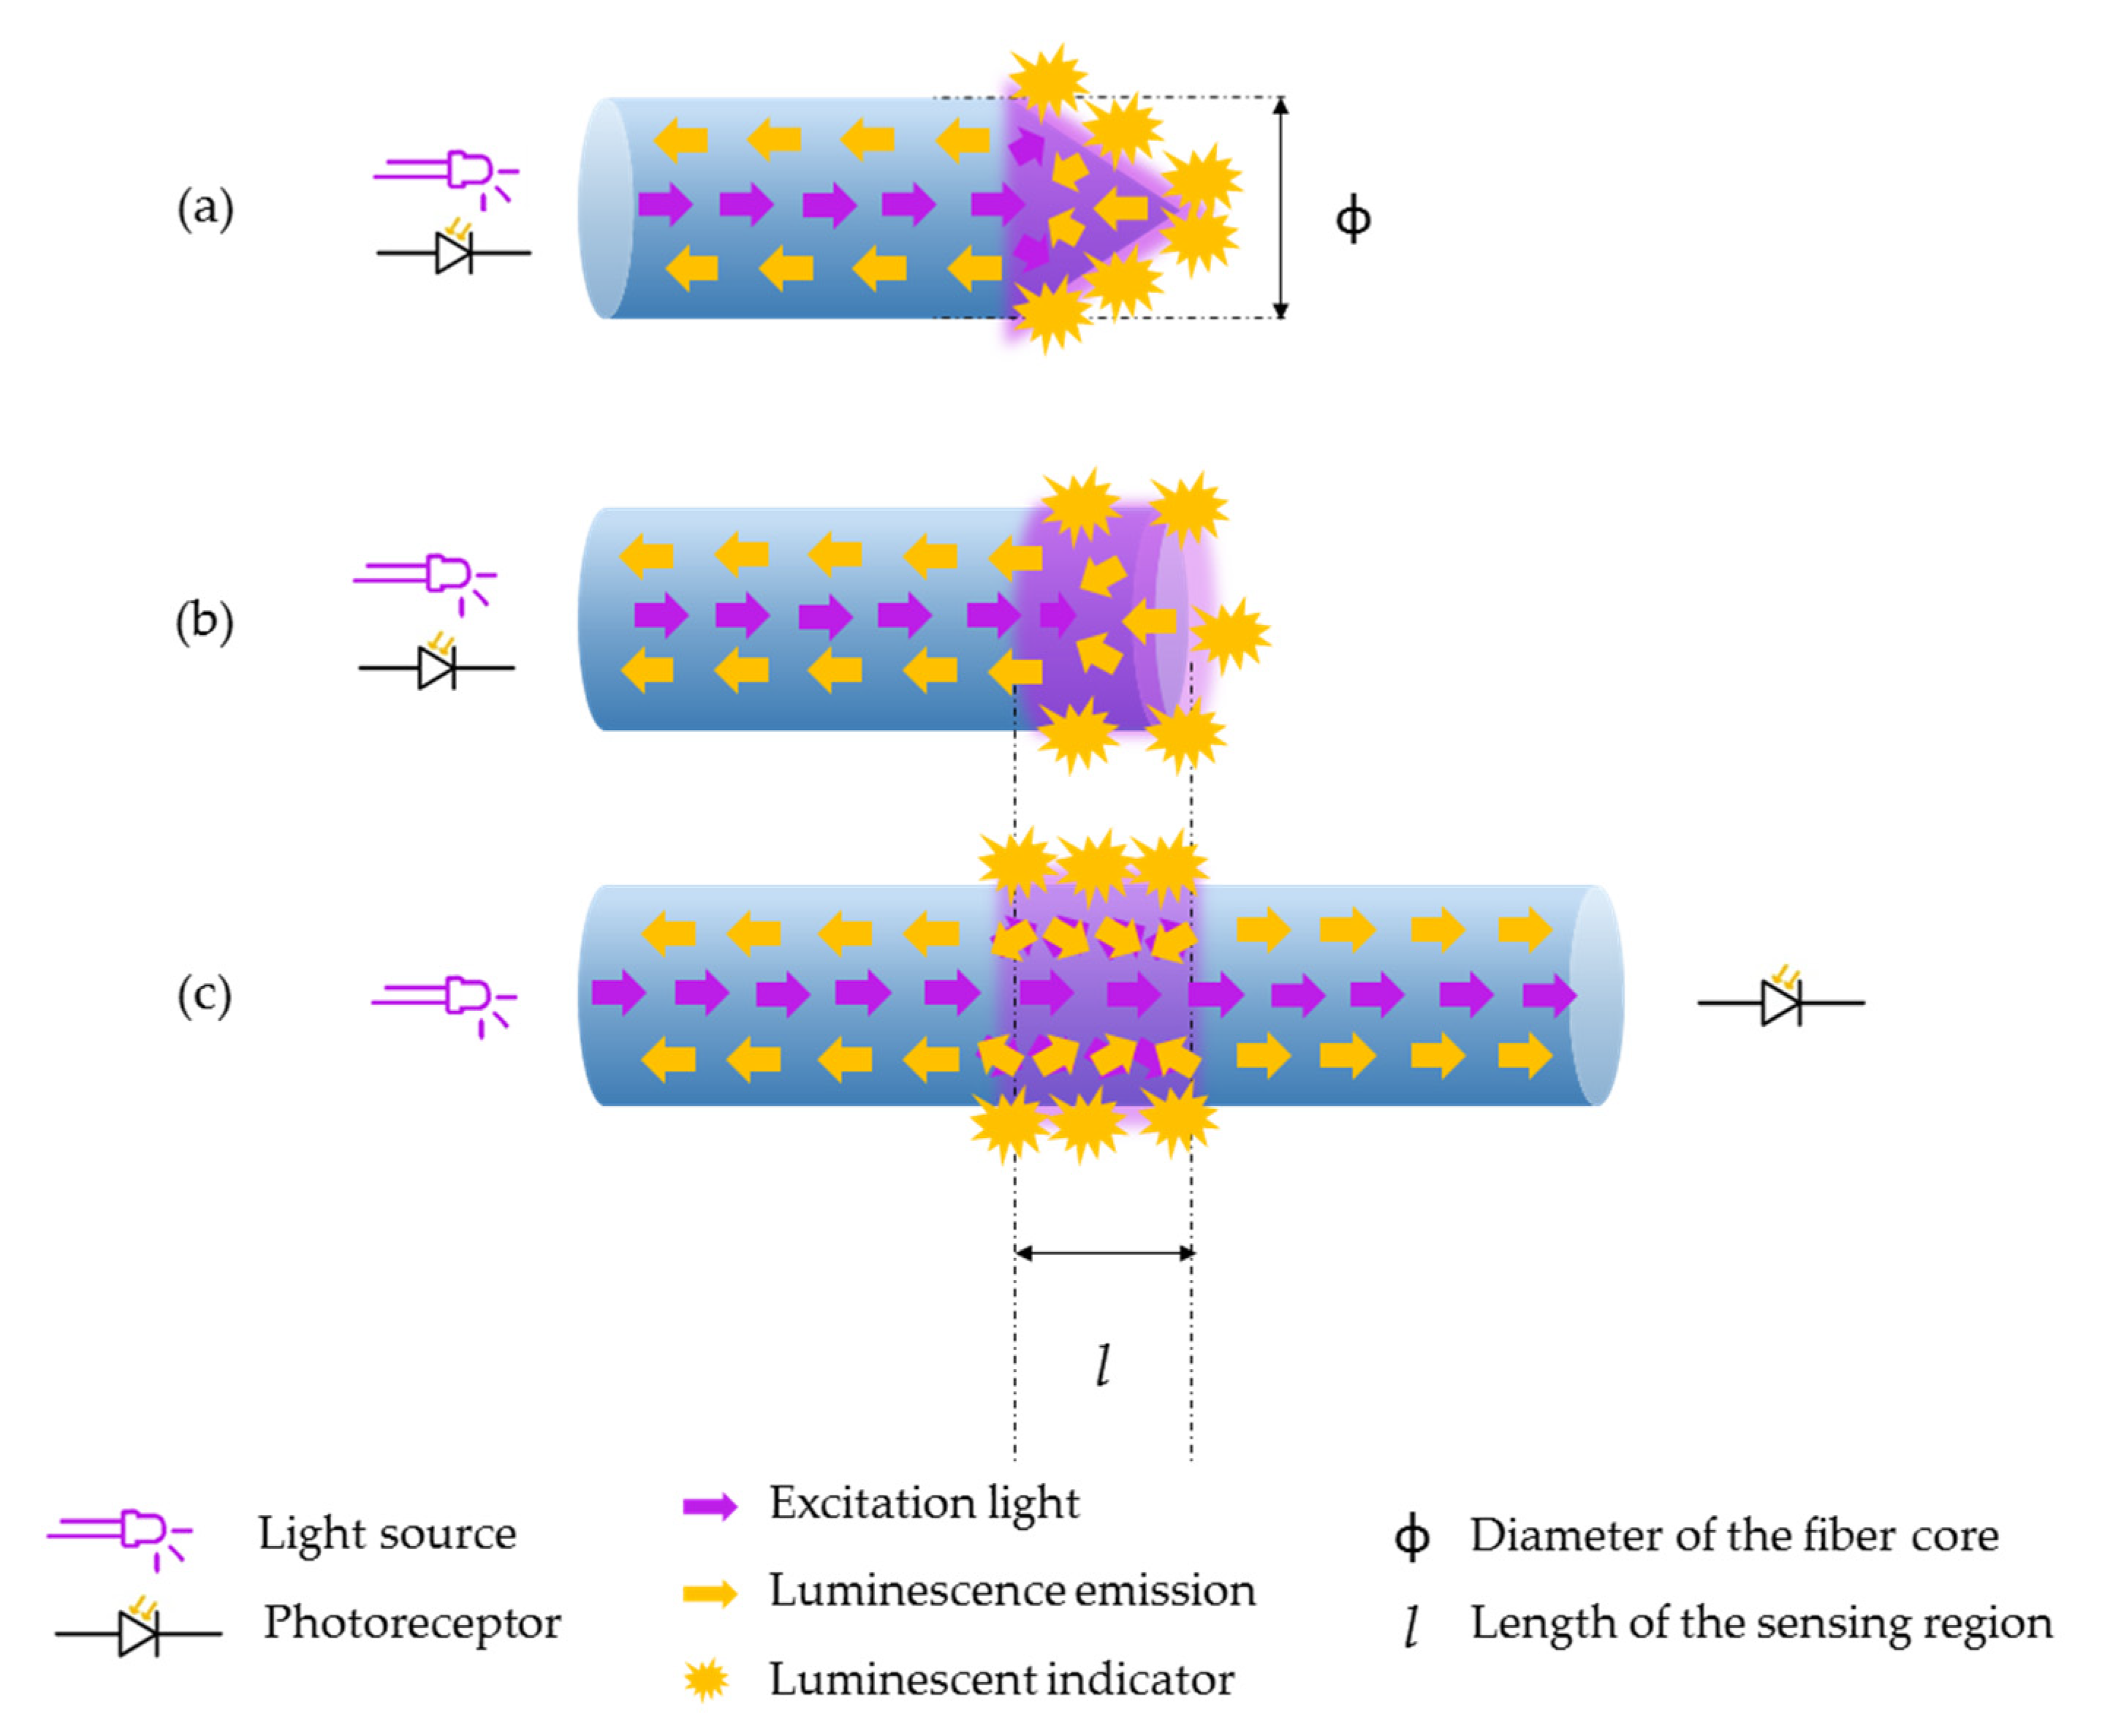
2.1. Luminescence
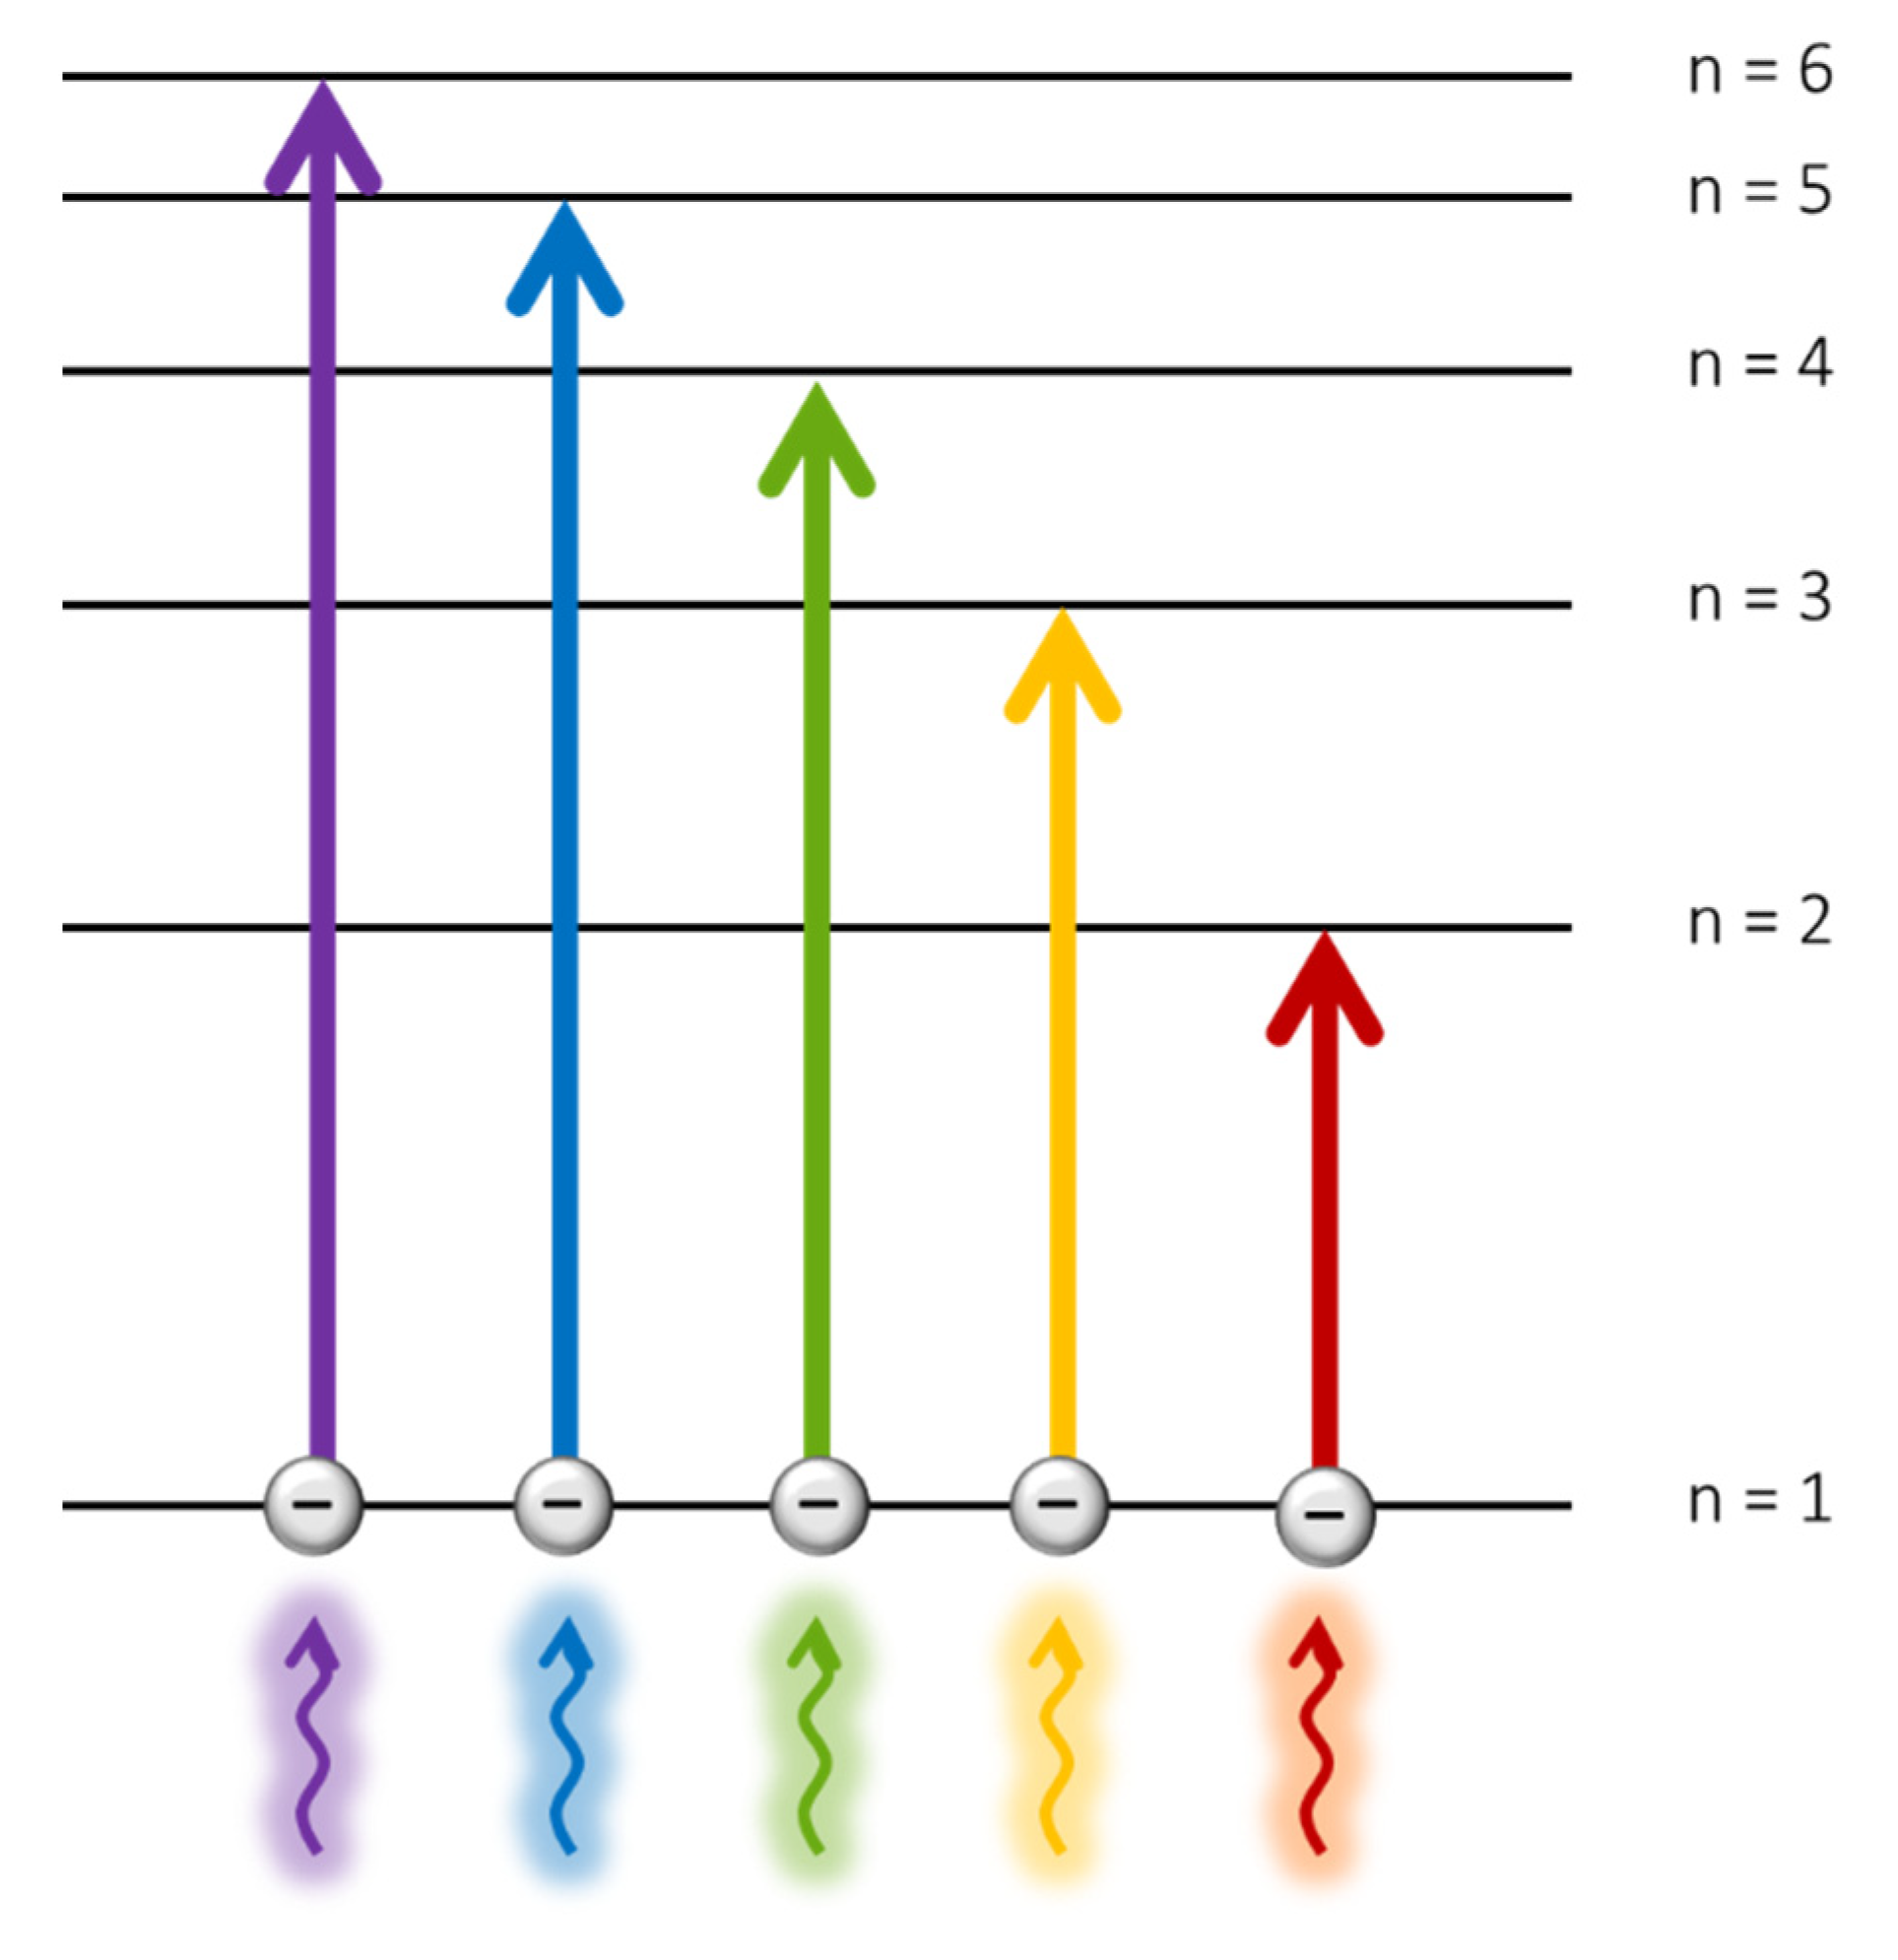
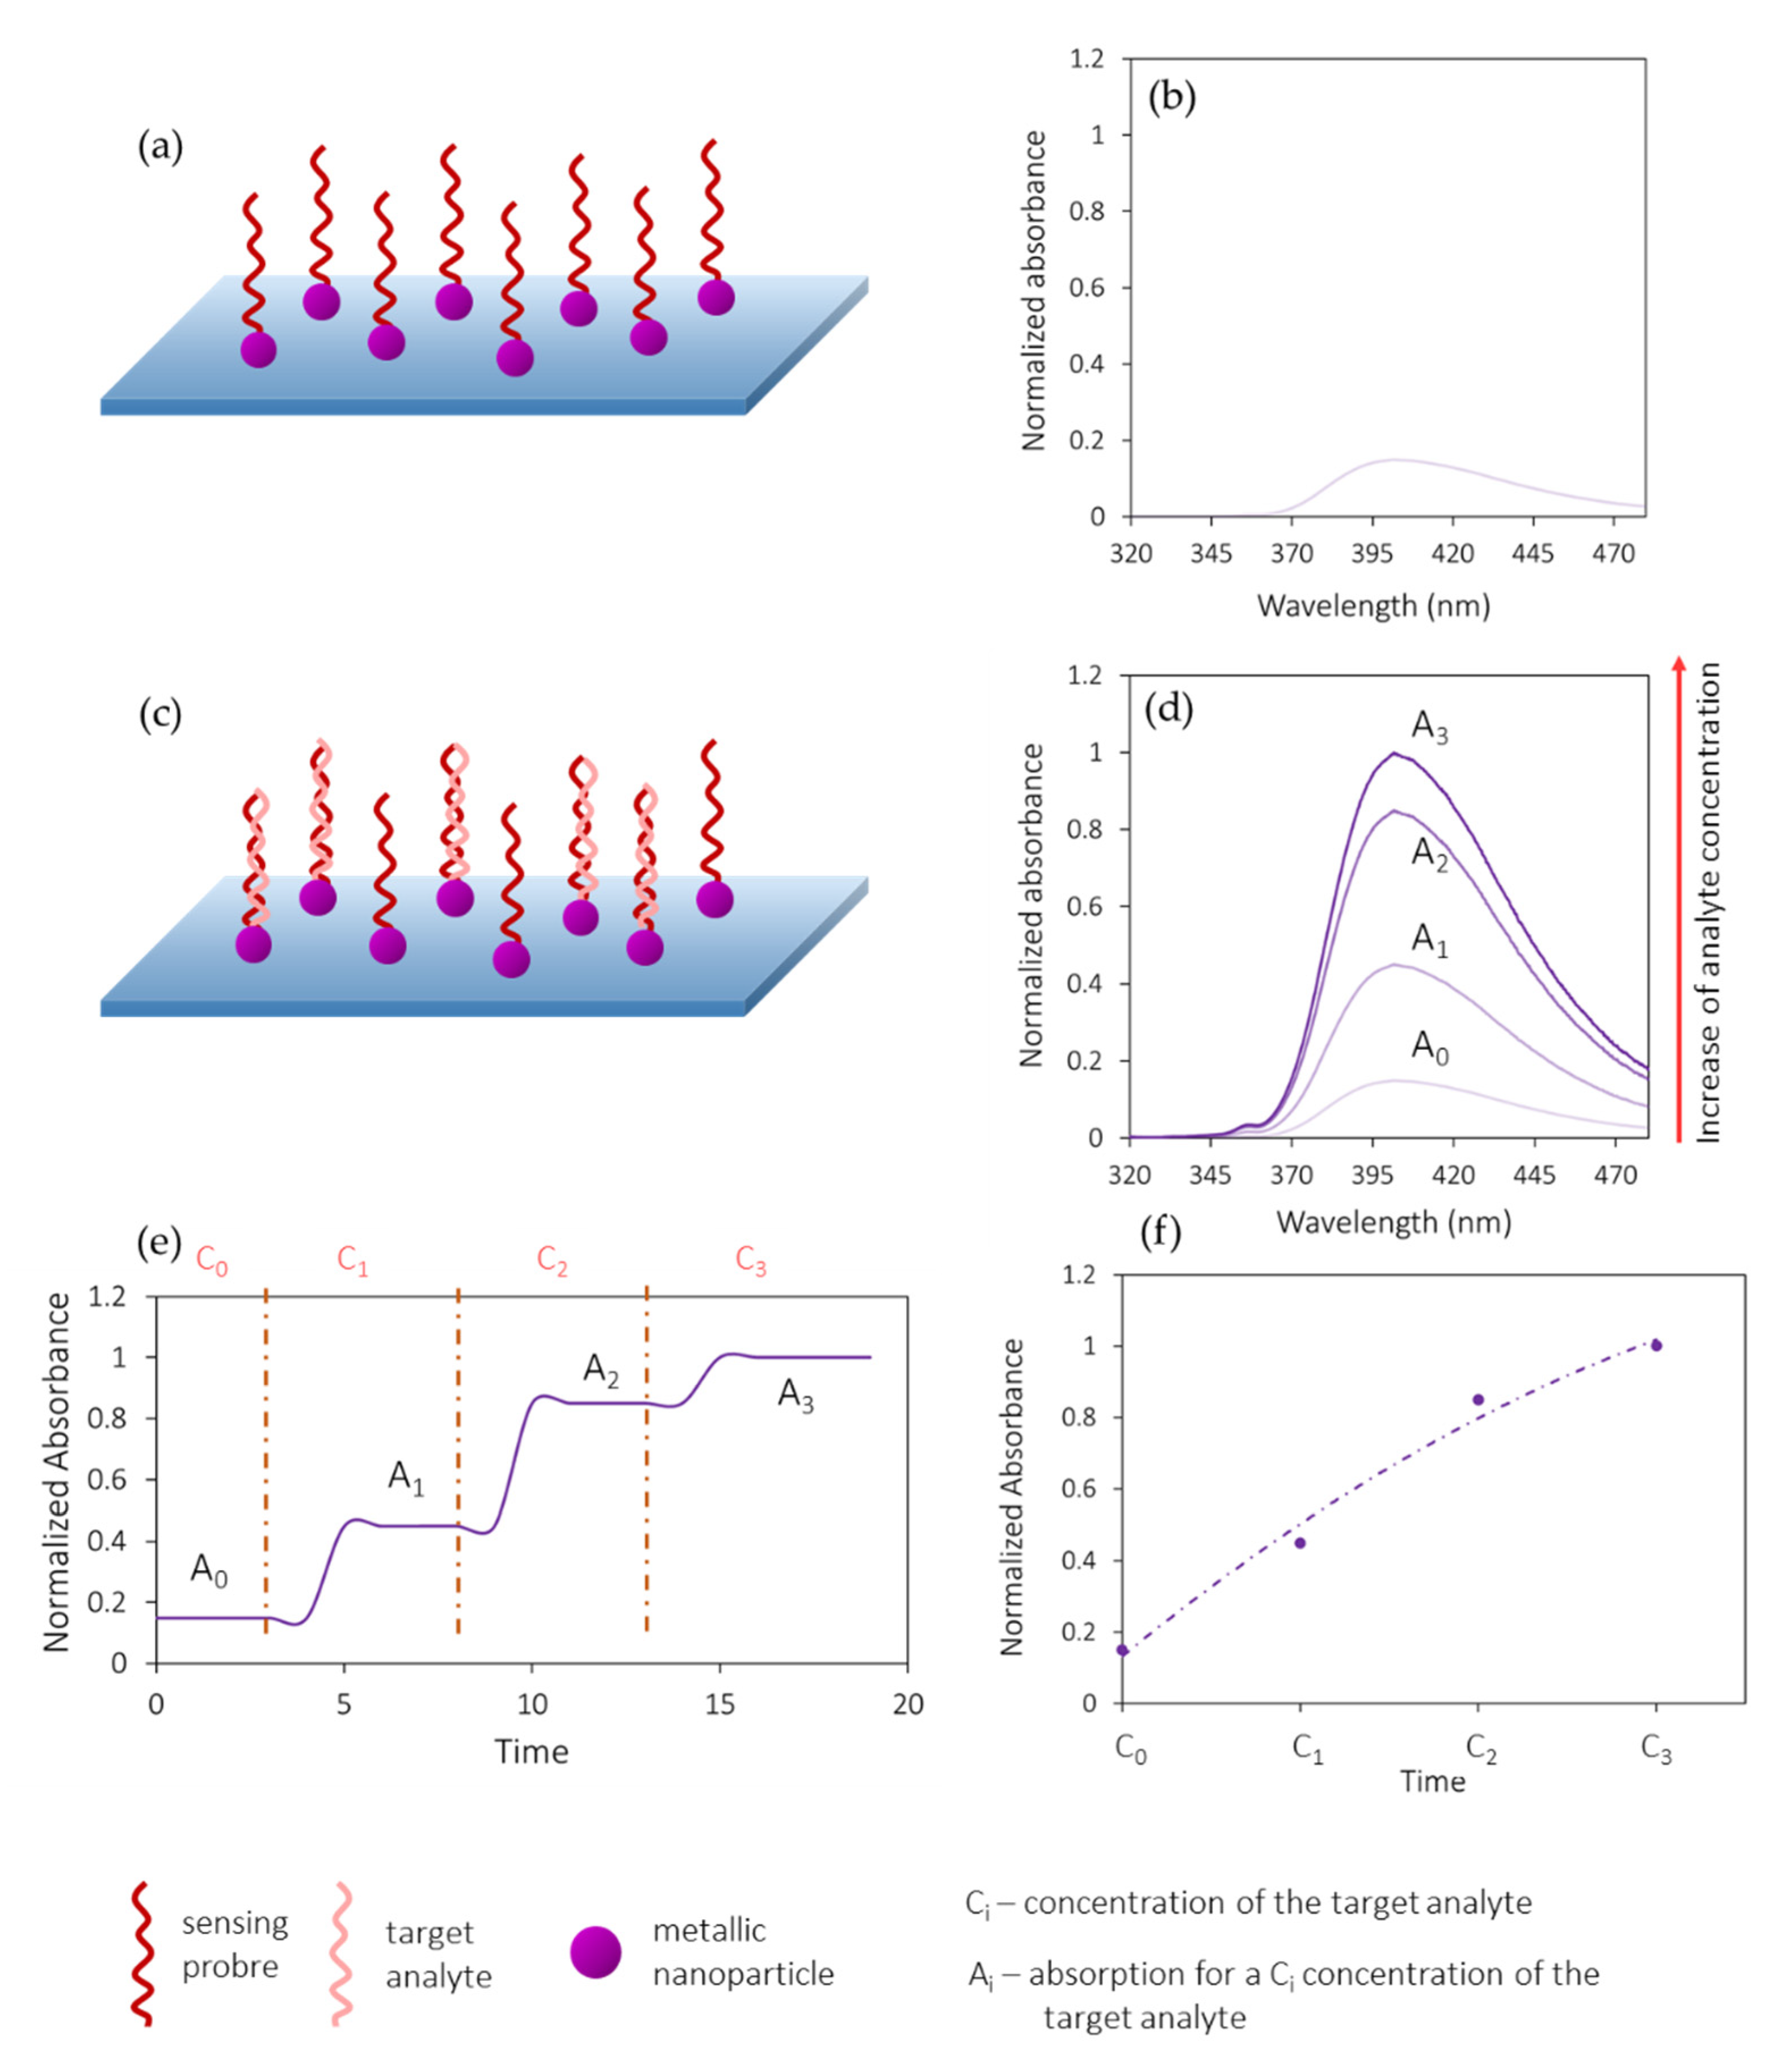
2.2. Absorption
3. Optical Parameters Analyzed
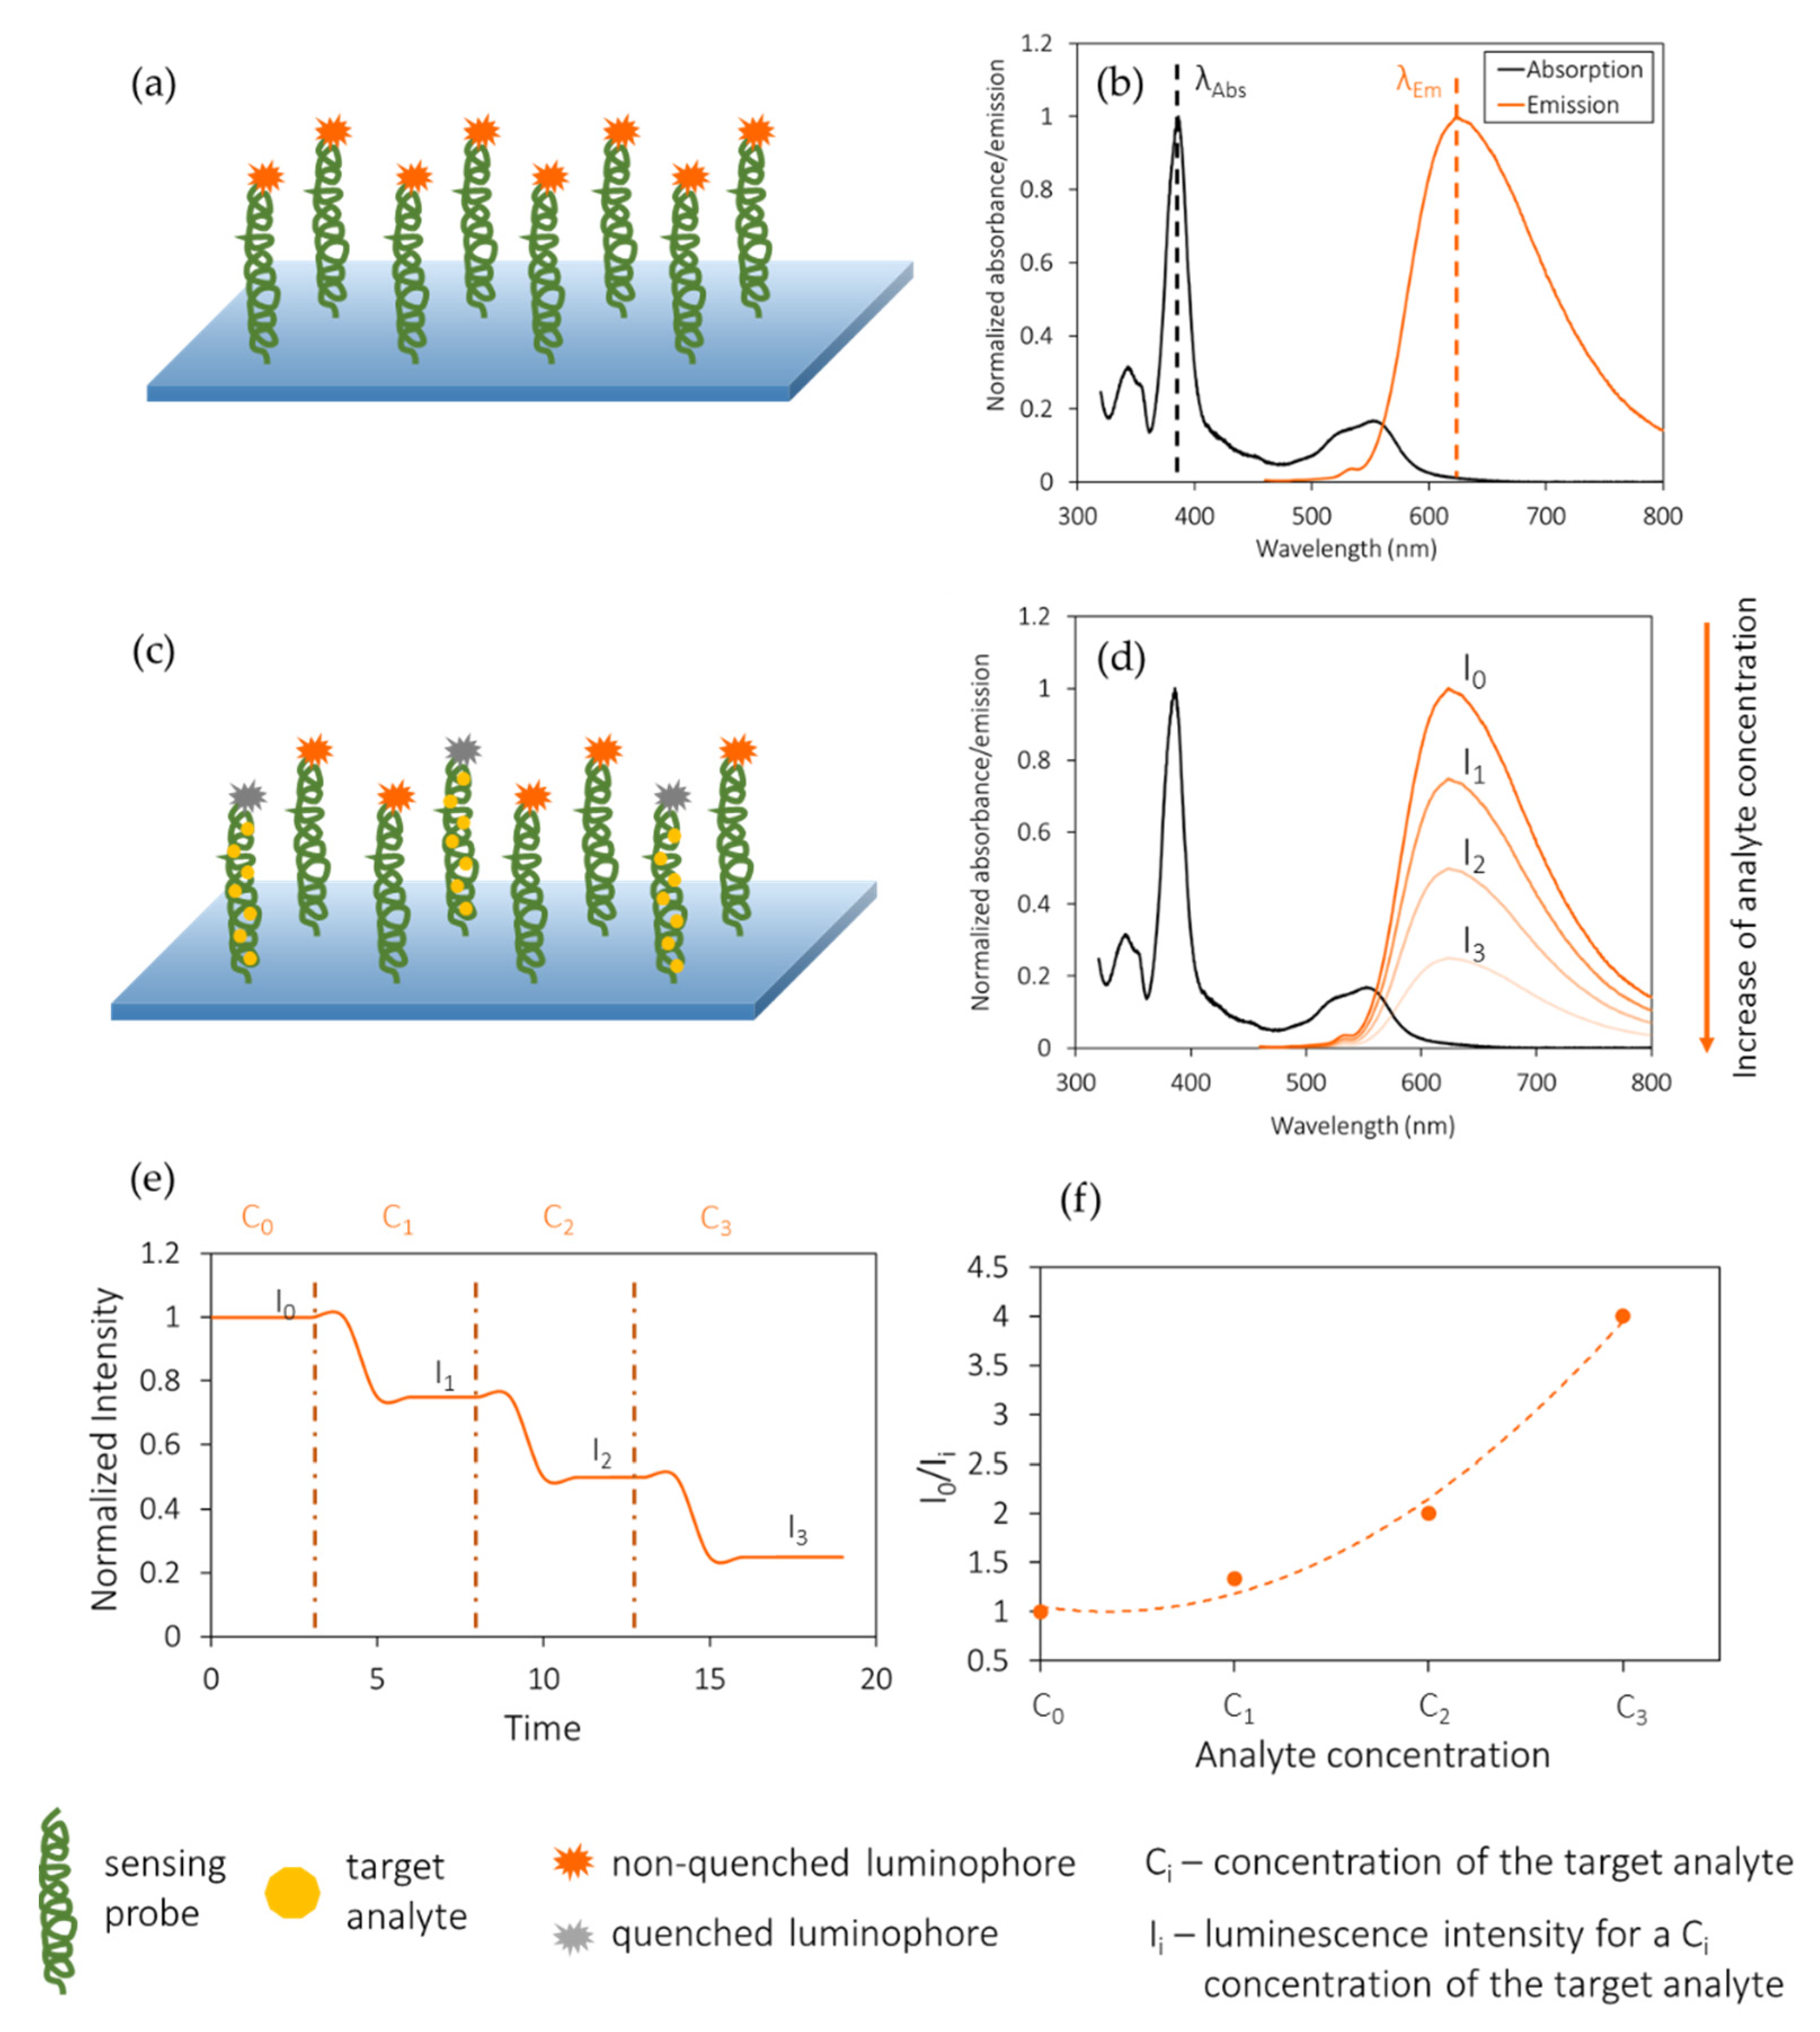
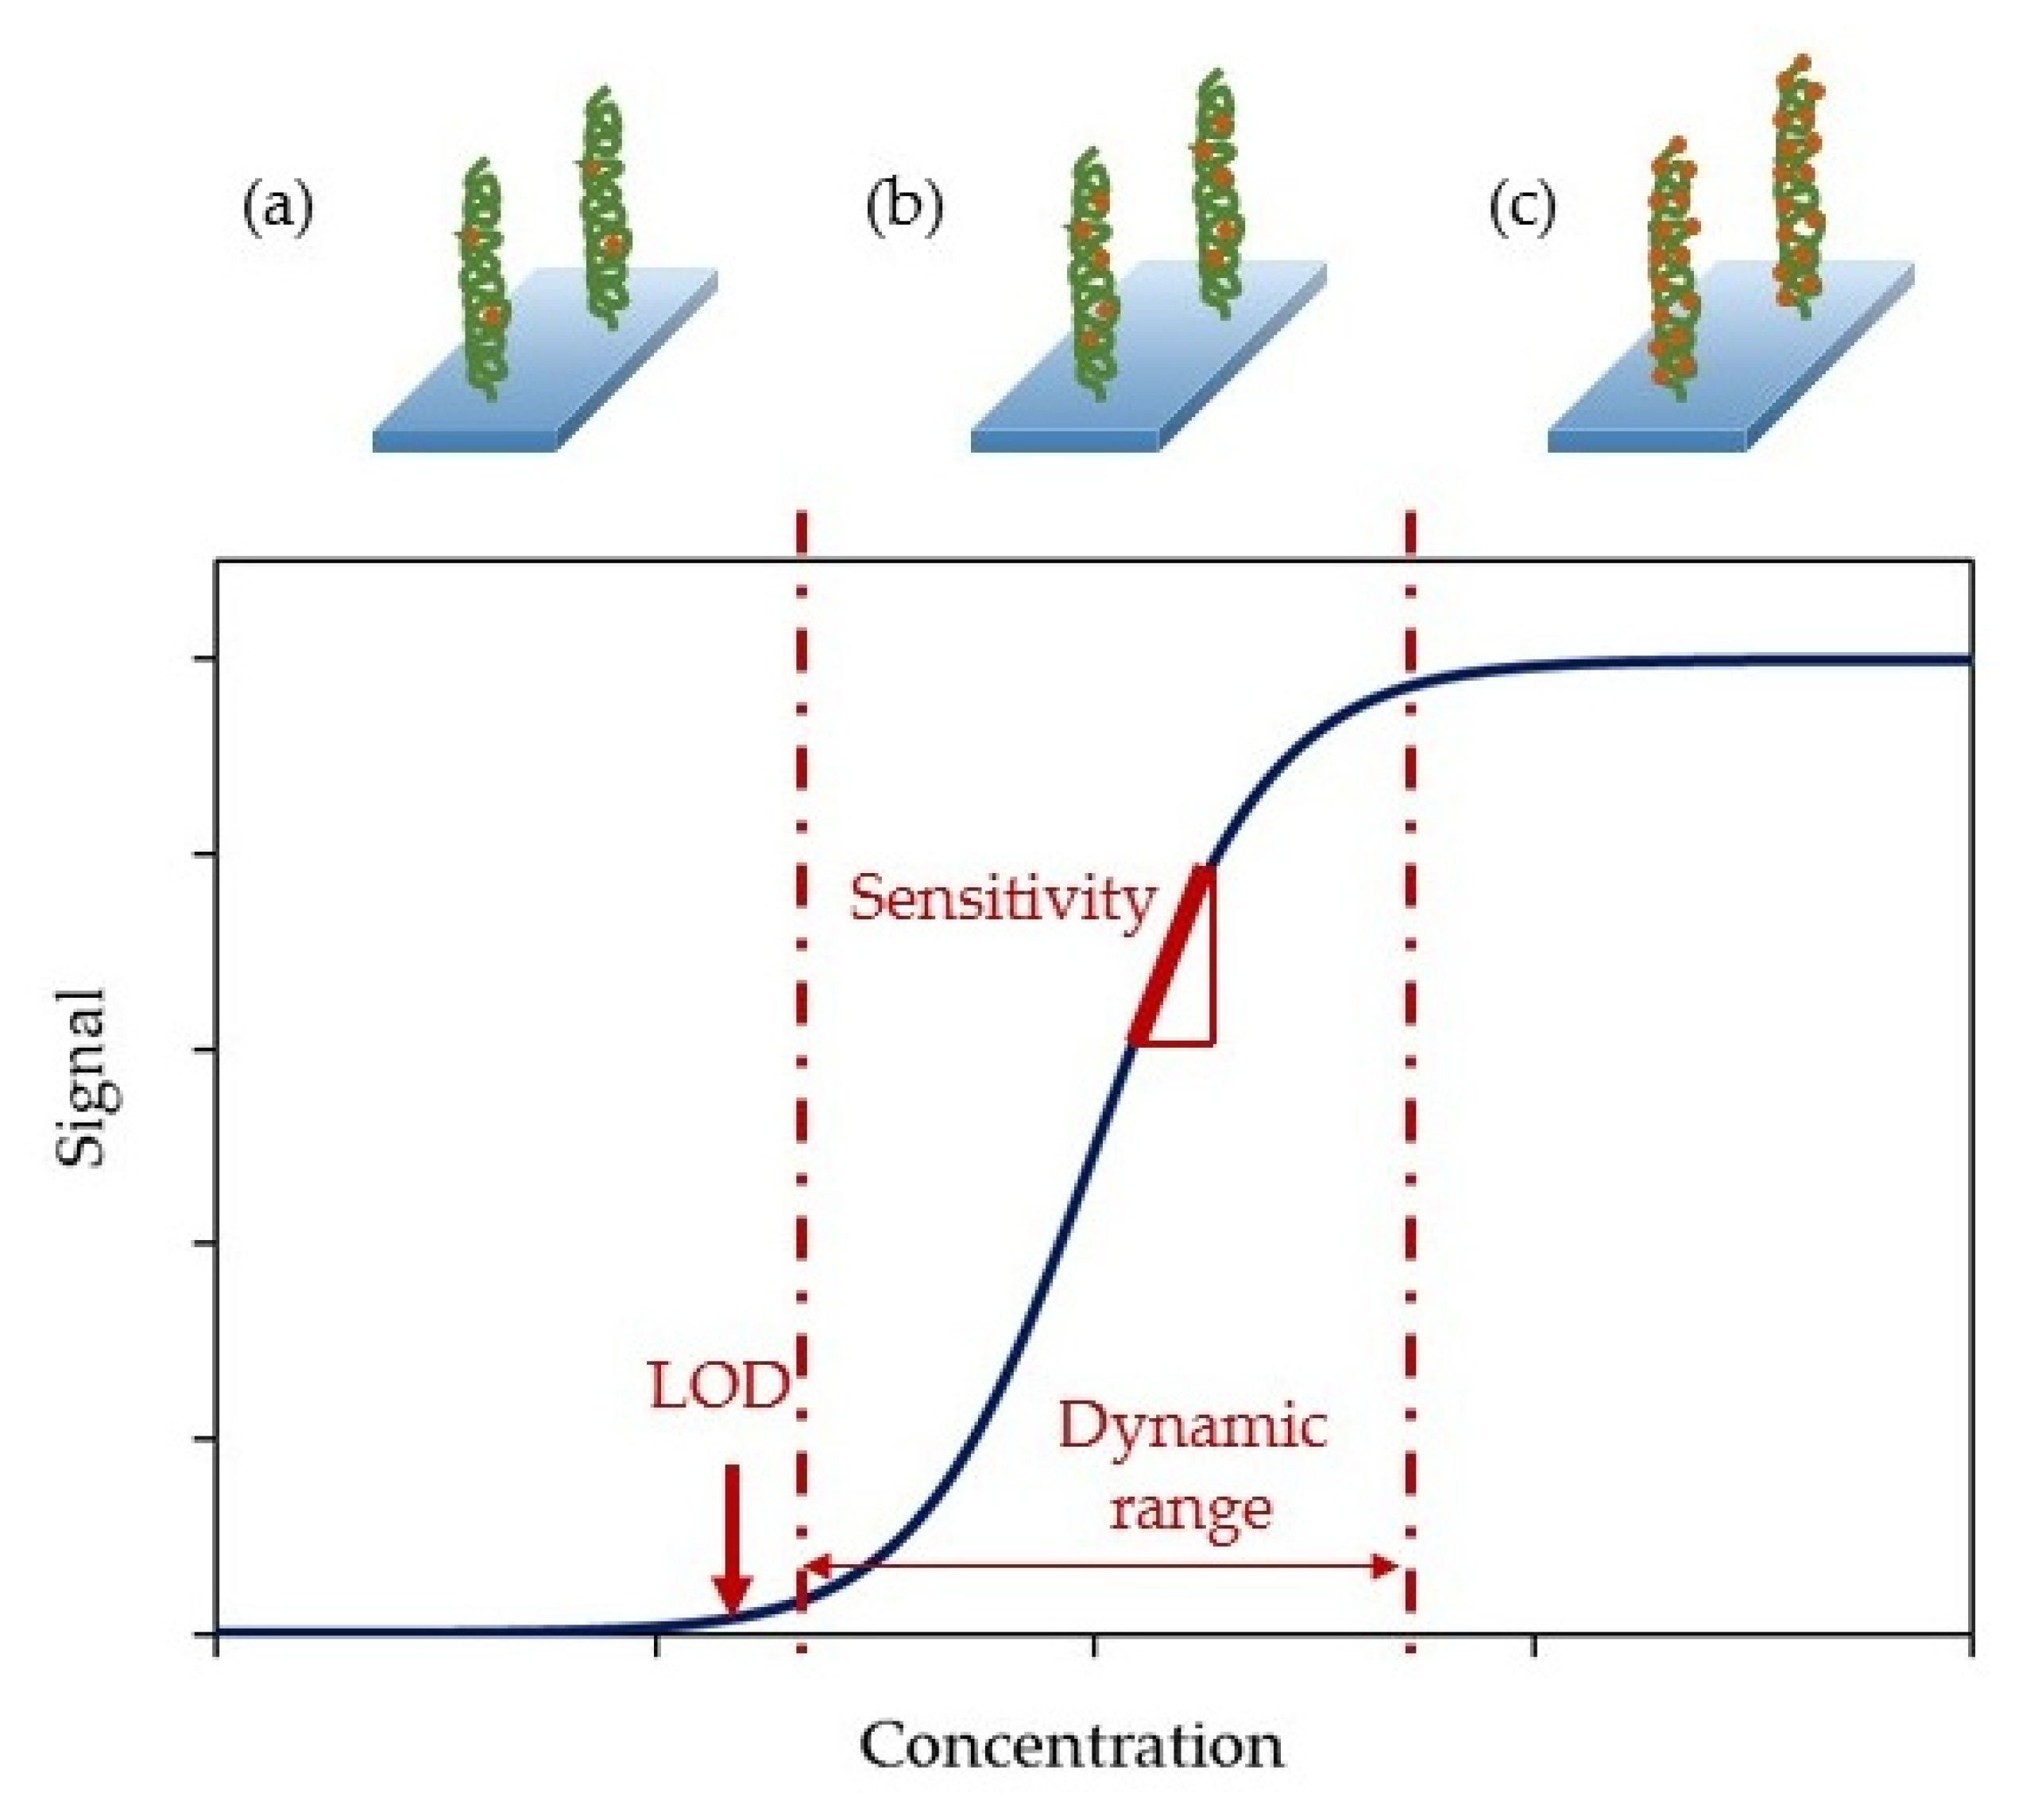
- Sensitivity: it is the slope of the calibration curve. That is, the ratio between the intensity (or absorbance) variation and the analyte concentration variation, typically measured at every point of the calibration curve. In the case of luminescence-based biosensors, the corresponding expression is given by (3), while for absorption-based biosensors, the intensity increment should be substituted by an absorption increment.while intensity and absorbance are always expressed in arbitrary units (AU), the analyte concentrations can be expressed in different units (mol/L, colony forming units (CFU), etc.) depending on the way the analyte concentration is measured. Moreover, the responses of the sensors tend not to be linear but sigmoidal. Normally, after taking the data it is typical to perform a data conditioning to logarithmic scales before calculating their sensitivities [51].
- Limit of detection (LOD): it is the lowest amount of analyte that can be detected but not necessarily quantitated by the sensor [52]. It is typically calculated as the mean of the values of the reference base line plus three times their standard deviation (4):where is the LOD of the sensor, corresponds to the average of the reference samples and is the standard deviation.
- Dynamic range: is the range of analyte concentrations between the limit of quantification (LOQ) and the upper limit. The first one is the minimum analyte concentration that can be detected and measured, while the second corresponds to the maximum concentration that the sensor can detect without being saturated.
- Cross-sensitivity: it is defined as its sensitivity towards other substances different from the target analyte [53]. As it is an indicator of the selectivity of a sensor, it is a key parameter when characterizing it.
- Resolution: it is the minimum change of the measured magnitude that can be detected [54].
- Detection media: apart from detecting biomolecules in standard conditions (i.e., ultrapure water or buffered solutions), biosensors should be capable of working in serum samples, real samples or, at least, solutions that mimic them.
- Regeneration: an effective manner of reducing the cost per test is the possibility of reusing the biosensors. Thus, regenerating the sensors surface has become of great interest and several mechanisms have been developed to reach this goal.
4. Classification and Discussion on Intensity-Based Optical Fiber Biosensors
4.1. Optical Fiber Biosensors Based on Luminescence
4.2. Absorption-Based Optical Fiber Sensors
5. Conclusions
Author Contributions
Funding
Institutional Review Board Statement
Informed Consent Statement
Data Availability Statement
Conflicts of Interest
References
- Falzone, L.; Salomone, S.; Libra, M. Evolution of cancer pharmacological treatments at the turn of the third millennium. Front. Pharmacol. 2018, 9. [Google Scholar] [CrossRef] [PubMed] [Green Version]
- Sieber, C.C.; Kiesswetter, E.; Kwetkat, A.; Heppner, H.J.; Schoene, D.; Freiberger, E. Prevention: Public Healthcare, Nutrition, Physical Activity, Vaccination. In Learning Geriatric Medicine; Springer International Publishing: Berlin, Germany, 2018; pp. 237–262. ISBN 978-3-319-61997-2. [Google Scholar]
- Kuchler, H. Start-ups focus on early-stage cancer diagnosis. Financial Times, 30 May 2019. [Google Scholar]
- Crosby, D.; Lyons, N.; Greenwood, E.; Harrison, S.; Hiom, S.; Moffat, J.; Quallo, T.; Samuel, E.; Walker, I. A roadmap for the early detection and diagnosis of cancer. Lancet Oncol. 2020, 21, 1397–1399. [Google Scholar] [CrossRef]
- English, P.B.; Olmedo, L.; Bejarano, E.; Lugo, H.; Murillo, E.; Seto, E.; Wong, M.; King, G.; Wilkie, A.; Meltzer, D.; et al. The imperial county community air monitoring network: A model for community-based environmental monitoring for public health action. Environ. Health Perspect. 2017, 125. [Google Scholar] [CrossRef] [PubMed] [Green Version]
- Lewis, J.M.; Vyas, A.D.; Qiu, Y.; Messer, K.S.; White, R.; Heller, M.J. Integrated analysis of exosomal protein biomarkers on alternating current electrokinetic chips enables rapid detection of pancreatic cancer in patient blood. ACS Nano 2018, 12, 3311–3320. [Google Scholar] [CrossRef]
- Monton, M.R.N.; Forsberg, E.M.; Brennan, J.D. Tailoring sol-gel-derived silica materials for optical biosensing. Chem. Mater. 2012, 24, 796–811. [Google Scholar] [CrossRef]
- Karim, F.; Bora, T.; Chaudhari, M.B.; Habib, K.; Mohammed, W.S.; Dutta, J. Optical fiber-based sensor for in situ monitoring of cadmium sulfide thin-film growth. Opt. Lett. 2013, 38, 5385–5388. [Google Scholar] [CrossRef] [PubMed]
- Khan, M.R.R.; Kang, B.-H.; Lee, S.-W.; Kim, S.-H.; Yeom, S.-H.; Lee, S.-H.; Kang, S.-W. Fiber-optic multi-sensor array for detection of low concentration volatile organic compounds. Opt. Express 2013, 21, 20119–20130. [Google Scholar] [CrossRef]
- Elosua, C.; Arregui, F.J.; Zamarreño, C.R.; Bariain, C.; Luquin, A.; Laguna, M.; Matias, I.R. Volatile organic compounds optical fiber sensor based on lossy mode resonances. Sens. Actuators B Chem. 2012, 173, 523–529. [Google Scholar] [CrossRef]
- Rivero, P.J.; Urrutia, A.; Goicoechea, J.; Arregui, F.J. Optical fiber humidity sensors based on Localized Surface Plasmon Resonance (LSPR) and Lossy-mode resonance (LMR) in overlays loaded with silver nanoparticles. Sens. Actuators B Chem. 2012, 173, 244–249. [Google Scholar] [CrossRef]
- Socorro-Leránoz, A.B.; Santano, D.; Villar, I.D.; Matias, I.R. Trends in the design of wavelength-based optical fibre biosensors (2008–2018). Biosens. Bioelectron. X 2019, 1, 100015. [Google Scholar] [CrossRef]
- Elosua, C.; Acha, N.D.; Hernaez, M.; Matias, I.R.; Arregui, F.J. Layer-by-Layer assembly of a water-insoluble platinum complex for optical fiber oxygen sensors. Sens. Actuators B Chem. 2015, 683–689. [Google Scholar] [CrossRef]
- Morris, M.C. Fluorescent biosensors—Probing protein kinase function in cancer and drug discovery. Biochim. Biophys. Acta Proteins Proteom. 2013, 1834, 1387–1395. [Google Scholar] [CrossRef] [PubMed]
- Rodríguez-Delgado, M.M.; Alemán-Nava, G.S.; Rodríguez-Delgado, J.M.; Dieck-Assad, G.; Martínez-Chapa, S.O.; Barceló, D.; Parra, R. Laccase-based biosensors for detection of phenolic compounds. TrAC Trends Anal. Chem. 2015, 74, 21–45. [Google Scholar] [CrossRef] [Green Version]
- Ruiz-Vega, G.; Soler, M.; Lechuga, L.M. Nanophotonic biosensors for point-of-care COVID-19 diagnostics and coronavirus surveillance. J. Phys. Photonics 2021, 3. [Google Scholar] [CrossRef]
- Elosua, C.; Arregui, F.J.; Villar, I.D.; Ruiz-Zamarreño, C.; Corres, J.M.; Bariain, C.; Goicoechea, J.; Hernaez, M.; Rivero, P.J.; Socorro, A.B.; et al. Micro and nanostructured materials for the development of optical fibre sensors. Sensors 2017, 17, 2312. [Google Scholar] [CrossRef] [PubMed] [Green Version]
- Acha, N.D.; Elia, V.; Delgado-Camon, A.; Arregui, F.J.; Elosua, C. Straightforward nano patterning on optical fiber for sensors development. Opt. Lett. 2020, 45, 3877–3880. [Google Scholar] [CrossRef]
- Miliutina, E.; Guselnikova, O.; Chufistova, S.; Kolska, Z.; Elashnikov, R.; Burtsev, V.; Postnikov, P.; Svorcik, V.; Lyutakov, O. Fast and all-optical hydrogen sensor based on gold-coated optical fiber functionalized with metal-organic framework layer. ACS Sens. 2019, 4, 3133–3140. [Google Scholar] [CrossRef]
- Sabri, N.; Aljunid, S.A.; Salim, M.S.; Fouad, S. Fiber Optic Sensors: Short Review and Applications. In Recent Trends in Physics of Material Science and Technology; Springer: Singapore, 2015; Volume 204. [Google Scholar]
- Wu, J.; Liu, J.; Li, S.; Peng, Z.; Xiao, Z.; Wang, X.; Yan, R.; Luo, J. Detection and analysis of nucleic acid in various biological samples of COVID-19 patients. Travel Med. Infect. Dis. 2020, 37. [Google Scholar] [CrossRef]
- Breault-Turcot, J.; Poirier-Richard, H.-P.; Couture, M.; Pelechacz, D.; Masson, J.-F. Single chip SPR and fluorescent ELISA assay of prostate specific antigen. Lab Chip 2015, 15, 4433–4440. [Google Scholar] [CrossRef]
- Margineanu, A. Biological Applications of Nanoparticles in Optical Microscopy. In Polymeric Nanomaterials in Nanotherapeutics; Elsevier: Amsterdam, The Netherlands, 2018; pp. 469–495. ISBN 9780128139325. [Google Scholar]
- Brambilla, D.; Sola, L.; Chiari, M. Advantageous antibody microarray fabrication through DNA-directed immobilization: A step toward use of extracellular vesicles in diagnostics. Talanta 2021, 222, 121542. [Google Scholar] [CrossRef]
- Aslan, K.; Gryczynski, I.; Malicka, J.; Matveeva, E.; Lakowicz, J.R.; Geddes, C.G. Metal-enhanced fluorescence: An emerging tool in biotechnology. Curr. Opin. Biotechnol. 2005, 16, 55–62. [Google Scholar] [CrossRef] [PubMed]
- Lakowicz, J.R. Principles of Fluorescence Spectroscopy; Springer Science & Business Media: Berlin, Germany, 2013. [Google Scholar]
- Lindon, J.C.; Tranter, G.E.; Koppenaal, D.W. Encyclopedia of Spectroscopy and Spectrometry; Academic Press: Cambridge, MA, USA, 2016; ISBN 9780128032244. [Google Scholar]
- Koehorst, R.B.M.; Spruijt, R.B.; Hemminga, M.A. Site-directed fluorescence labeling of a membrane protein with BADAN: Probing protein topology and local environment. Biophys. J. 2008, 94, 3945–3955. [Google Scholar] [CrossRef] [Green Version]
- Giannetti, A.; Barucci, A.; Cosi, F.; Pelli, S.; Tombelli, S.; Trono, C.; Baldini, F. Optical fiber nanotips coated with molecular beacons for DNA detection. Sensors 2015, 15, 9666–9680. [Google Scholar] [CrossRef] [PubMed] [Green Version]
- Taniguchi, M.; Saito, H.; Mitsubayashi, K. Repetitive immunosensor with a fiber-optic device and antibody-coated magnetic beads for semi-continuous monitoring of Escherichia coli O157:H7. Sensors 2017, 17, 2145. [Google Scholar] [CrossRef] [PubMed] [Green Version]
- Long, F.; Wu, S.; He, M.; Tong, T.; Shi, H. Ultrasensitive quantum dots-based DNA detection and hybridization kinetics analysis with evanescent wave biosensing platform. Biosens. Bioelectron. 2011, 26, 2390–2395. [Google Scholar] [CrossRef] [PubMed]
- Goicoechea, J.; Zamarreño, C.R.; Matias, I.R.; Arregui, F.J. Minimizing the photobleaching of self-assembled multilayers for sensor applications. Sens. Actuators B Chem. 2007, 126, 41–47. [Google Scholar] [CrossRef]
- Goicoechea, J.; Ruiz Zamarreño, C.; Matías, I.R.; Arregui, F.J. Study and Optimization of the Photobleaching in Self-Assembled Optical Fiber pH Sensors Based on HPTS Using DABCO Antifading Agent. In Optics InfoBase Conference Papers; Optical Society of America: Washington, DC, USA, 2006. [Google Scholar]
- Liebelt, B.D.; Finocchiaro, G.; Heimberger, A.B. Principles of Immunotherapy. In Handbook of Clinical Neurology; Elsevier: Berlin, Germany, 2016; Volume 134, pp. 163–181. ISBN 9780128029978. [Google Scholar]
- Algar, W.R.; Krull, U.J. Developing mixed films of immobilized oligonucleotides and quantum dots for the multiplexed detection of nucleic acid hybridization using a combination of fluorescence resonance energy transfer and direct excitation of fluorescence. Langmuir 2010, 26, 6041–6047. [Google Scholar] [CrossRef] [PubMed]
- Tiangco, C.; Fon, D.; Sardesai, N.; Kostov, Y.; Sevilla, F.; Rao, G.; Tolosa, L. Fiber optic biosensor for transdermal glucose based on the glucose binding protein. Sens. Actuators B Chem. 2017, 242, 569–576. [Google Scholar] [CrossRef]
- Wang, R.; Zhou, X.; Shi, H. Triple functional DNA-protein conjugates: Signal probes for Pb2+ using evanescent wave-induced emission. Biosens. Bioelectron. 2015, 74, 78–84. [Google Scholar] [CrossRef] [PubMed]
- Wang, C.W.; Manne, U.; Reddy, V.B.; Oelschlager, D.K.; Katkoori, V.R.; Grizzle, W.E.; Kapoor, R. Erratum: Development of combination tapered fiber-optic biosensor dip probe for quantitative estimation of interleukin-6 in serum samples. J. Biomed. Opt. 2011, 16. [Google Scholar] [CrossRef]
- Carraway, E.R.; Demas, J.N.; DeGraff, B.A.; Bacon, J.R. Photophysics and photochemistry of oxygen sensors based on luminescent transition-metal complexes. Anal. Chem. 1991, 63, 337–342. [Google Scholar] [CrossRef]
- Gehlen, M.H. The centenary of the Stern-Volmer equation of fluorescence quenching: From the single line plot to the SV quenching map. J. Photochem. Photobiol. C Photochem. Rev. 2020, 42. [Google Scholar] [CrossRef]
- Khan, S.; Newport, D.; Calvé, S.L. Gas detection using portable deep-uv absorption spectrophotometry: A review. Sensors 2019, 19, 5210. [Google Scholar] [CrossRef] [PubMed] [Green Version]
- Guan, L.; Tong, Y.; Li, J.; Li, D.; Wu, S. Research on ultraviolet-visible absorption spectrum preprocessing for water quality contamination detection. Optik 2018, 164, 277–288. [Google Scholar] [CrossRef]
- Dayakar, T.; Rao, K.V.; Bikshalu, K.; Rajendar, V.; Park, S.-H. Novel synthesis and structural analysis of zinc oxide nanoparticles for the non enzymatic glucose biosensor. Mater. Sci. Eng. C 2017, 75, 1472–1479. [Google Scholar] [CrossRef]
- Bhat, A.I.; Rao, G.P. Ultraviolet Absorption Spectra of Purified Virus Preparation. In Characterization of Plant Viruses; Springer Protocols Handbooks; Springer: Berlin, Germany, 2020; pp. 169–171. ISBN 978-1-0716-0334-5. [Google Scholar]
- ElBatal, F.H.; Hamdy, Y.M.; Marzouk, S.Y. UV-visible and infrared absorption spectra of transition metals-doped lead phosphate glasses and the effect of gamma irradiation. J. Non. Cryst. Solids 2009, 355, 2439–2447. [Google Scholar] [CrossRef]
- Zhang, X.; Cui, Z.; Cheng, Z.; Li, Y.; Xiao, H. Quantitative detection of H2S and CS2 mixed gases based on UV absorption spectrometry. RSC Adv. 2017, 7, 50889–50898. [Google Scholar] [CrossRef] [Green Version]
- Yan, Q.; Tao, S.; Toghiani, H. Optical fiber evanescent wave absorption spectrometry of nanocrystalline tin oxide thin films for selective hydrogen sensing in high temperature gas samples. Talanta 2009, 77, 953–961. [Google Scholar] [CrossRef]
- Debliquy, M.; Lahem, D.; Bueno-Martinez, A.; Ravet, G.; Renoirt, J.-M.; Caucheteur, C. Review of the Use of the Optical Fibers for Safety Applications in Tunnels and Car Parks: Pollution Monitoring, Fire and Explosive Gas Detection. In Sensing Technology: Current Status and Future Trends III; Springer: Cham, Germany, 2015; Volume 11. [Google Scholar]
- Ortega-Mendoza, J.G.; Padilla-Vivanco, A.; Toxqui-Quitl, C.; Zaca-Morán, P.; Villegas-Hernández, D.; Chávez, F. Optical fiber sensor based on localized surface plasmon resonance using silver nanoparticles photodeposited on the optical fiber end. Sensors 2014, 14, 18701–18710. [Google Scholar] [CrossRef] [Green Version]
- Jia, S.; Bian, C.; Sun, J.; Tong, J.; Xia, S. A wavelength-modulated localized surface plasmon resonance (LSPR) optical fiber sensor for sensitive detection of mercury(II) ion by gold nanoparticles-DNA conjugates. Biosens. Bioelectron. 2018, 114, 15–21. [Google Scholar] [CrossRef] [PubMed]
- Acha, N.D.; Elosúa, C.; Arregui, F.J. Development of an aptamer based luminescent optical fiber sensor for the continuous monitoring of HG2+ in Aqueous media. Sensors 2020, 20, 2372. [Google Scholar] [CrossRef] [Green Version]
- Shrivastava, A.; Gupta, V.B. Methods for the determination of limit of detection and limit of quantification of the analytical methods. Chron. Young Sci. 2011, 2, 21–25. [Google Scholar] [CrossRef]
- Anovadiya, A.P.; Barvaliya, M.J.; Patel, T.K.; Tripathi, C.B. Cross sensitivity between ciprofloxacin and levofloxacin for an immediate hypersensitivity reaction. J. Pharmacol. Pharmacother. 2011, 2, 187–188. [Google Scholar] [CrossRef] [Green Version]
- Matias, I.R.; Ikezawa, S.; Corres, J. (Eds.) Fiber Optic Sensors. Current Status and Future Possibilities; Springer: Berlin, Germany, 2017; ISBN 978-3-319-42624-2. [Google Scholar]
- Elosua, C.; Lopez-Torres, D.; Hernaez, M.; Matias, I.R.; Arregui, F.J. Comparative study of layer-by-layer deposition techniques for poly(sodium phosphate) and poly(allylamine hydrochloride). Nanoscale Res. Lett. 2013, 8, 539. [Google Scholar] [CrossRef] [PubMed] [Green Version]
- Anderson, G.P.; Golden, J.P.; Ligler, F.S. A fiber optic biosensor: Combination tapered fibers designed for improved signal acquisition. Biosens. Bioelectron. 1993, 8, 249–256. [Google Scholar] [CrossRef]
- Padmanabhan, S.; Shinoj, V.K.; Murukeshan, V.M.; Padmanabhan, P. Highly sensitive optical detection of specific protein in breast cancer cells using microstructured fiber in extremely low sample volume. J. Biomed. Opt. 2010, 15. [Google Scholar] [CrossRef] [Green Version]
- Tolosa, L.; Brown, S.; Rao, G.; Kostov, Y.; Tiangco, C.; Corson, E. A Noninvasive Fluorescent Biosensor for Transdermal Glucose. In Advanced Materials—TechConnect Briefs 2017; University of Maryland: College Park, MD, USA, 2017; Volume 3, pp. 243–246. [Google Scholar]
- Veselov, A.A.; Abraham, B.G.; Lemmetyinen, H.; Karp, M.T.; Tkachenko, N.V. Photochemical properties and sensor applications of modified yellow fluorescent protein (YFP) covalently attached to the surfaces of etched optical fibers (EOFs). Anal. Bioanal. Chem. 2012, 402, 1149–1158. [Google Scholar] [CrossRef]
- Lu, Y.; Li, X.; Zhang, L.; Yu, P.; Su, L.; Mao, L. Aptamer-based electrochemical sensors with aptamer-complementary DNA oligonucleotides as probe. Anal. Chem. 2008, 80, 1883–1890. [Google Scholar] [CrossRef]
- Yildirim, N.; Long, F.; He, M.; Shi, H.-C.; Gu, A.Z. A portable optic fiber aptasensor for sensitive, specific and rapid detection of bisphenol-A in water samples. Environ. Sci. Process. Impacts 2014, 16, 1379–1386. [Google Scholar] [CrossRef]
- Long, F.; Gao, C.; Shi, H.C.; He, M.; Zhu, A.N.; Klibanov, A.M.; Gu, A.Z. Reusable evanescent wave DNA biosensor for rapid, highly sensitive, and selective detection of mercury ions. Biosens. Bioelectron. 2011, 26, 4018–4023. [Google Scholar] [CrossRef]
- Yildirim, N.; Long, F.; He, M.; Gao, C.; Shi, H.-C.; Gu, A.Z. A portable DNAzyme-based optical biosensor for highly sensitive and selective detection of lead (II) in water sample. Talanta 2014, 129, 617–622. [Google Scholar] [CrossRef]
- Miyake, Y.; Togashi, H.; Tashiro, M.; Yamaguchi, H.; Oda, S.; Kudo, M.; Tanaka, Y.; Kondo, Y.; Sawa, R.; Fujimoto, T.; et al. MercuryII-mediated formation of thymine-HgII-thymine base pairs in DNA duplexes. J. Am. Chem. Soc. 2006, 128, 2172–2173. [Google Scholar] [CrossRef]
- Ono, A. Development of novel oligonucleotide-based sensors which are highly Hg(II) selective and are insensitive to other heavy metal ions. Nucleic Acids Symp. Ser. 2004, 48, 29–30. [Google Scholar] [CrossRef]
- Guo, L.; Yin, N.; Chen, G. Photoinduced electron transfer mediated by π-stacked thymine-Hg 2+-thymine base pairs. J. Phys. Chem. C 2011, 115, 4837–4842. [Google Scholar] [CrossRef]
- Ni, X.; Castanares, M.; Mukherjee, A.; Lupold, S.E. Nucleic acid aptamers: Clinical applications and promising new horizons. Curr. Med. Chem. 2011, 18, 4206–4214. [Google Scholar] [CrossRef]
- Kim, Y.S.; Jung, H.S.; Matsuura, T.; Lee, H.Y.; Kawai, T.; Gu, M.B. Electrochemical detection of 17β-estradiol using DNA aptamer immobilized gold electrode chip. Biosens. Bioelectron. 2007, 22, 2525–2531. [Google Scholar] [CrossRef] [PubMed]
- Yildirim, N.; Long, F.; Gao, C.; He, M.; Shi, H.-C.; Gu, A.Z. Aptamer-based optical biosensor for rapid and sensitive detection of 17β-estradiol in water samples. Environ. Sci. Technol. 2012, 46, 3288–3294. [Google Scholar] [CrossRef] [PubMed]
- Wang, C.W.; Manne, U.; Reddy, V.B.; Oelschlager, D.K.; Katkoori, V.R.; Grizzle, W.E.; Kapoor, R. Development of combination tapered fiber-optic biosensor dip probe for quantitative estimation of interleukin-6 in serum samples. J. Biomed. Opt. 2010, 15. [Google Scholar] [CrossRef] [PubMed]
- Chang, Y.-F.; Wang, S.-F.; Huang, J.C.; Su, L.-C.; Yao, L.; Li, Y.-C.; Wu, S.-C.; Chen, Y.M.A.; Hsieh, J.-P.; Chou, C. Detection of swine-origin influenza A (H1N1) viruses using a localized surface plasmon coupled fluorescence fiber-optic biosensor. Biosens. Bioelectron. 2010, 26, 1068–1073. [Google Scholar] [CrossRef] [PubMed]
- Tolosa, L.; Rao, G. The Glucose Binding Protein as Glucose Sensor. In Glucose Sensing; Springer: Boston, MA, USA, 2006; pp. 323–331. ISBN 978-0-387-33015-0. [Google Scholar]
- Long, F.; Li, W.; Song, D.; Han, X.; Zhou, Y.; Fang, S.; Xu, W.; Liu, J.; Zhu, A. Portable and automated fluorescence microarray biosensing platform for on-site parallel detection and early-warning of multiple pollutants. Talanta 2020, 210. [Google Scholar] [CrossRef]
- Xiao, R.; Rong, Z.; Long, F.; Liu, Q. Portable evanescent wave fiber biosensor for highly sensitive detection of Shigella. Spectrochim. Acta Part. A Mol. Biomol. Spectrosc. 2014, 132, 1–5. [Google Scholar] [CrossRef] [PubMed]
- Tang, Y.; Gu, C.; Wang, C.; Song, B.; Zhou, X.; Lou, X.; He, M. Evanescent wave aptasensor for continuous and online aminoglycoside antibiotics detection based on target binding facilitated fluorescence quenching. Biosens. Bioelectron. 2018, 102, 646–651. [Google Scholar] [CrossRef] [PubMed]
- Yildirim, N.; Long, F.; Gu, A.Z. Aptamer Based E-coli Detection in Waste Waters by Portable Optical Biosensor System. In Proceedings of the IEEE Annual Northeast Bioengineering Conference (NEBEC), Boston, MA, USA, 25–27 April 2014. [Google Scholar]
- Fang, S.; Song, D.; Zhu, A.; Long, F. Nanoporous layer fiber biosensing platform for real time culture- and separation-free detecting bacterial pathogens and measuring their susceptibility to antibiotics. Sens. Actuators B Chem. 2020, 325. [Google Scholar] [CrossRef]
- Wang, R.; Zhou, X.; Shi, H.; Luo, Y. T-T mismatch-driven biosensor using triple functional DNA-protein conjugates for facile detection of Hg2+. Biosens. Bioelectron. 2016, 78, 418–422. [Google Scholar] [CrossRef]
- Qiao, P.; Wang, X.-H.; Gao, S.; Yin, X.; Wang, Y.; Wang, P. Integration of black phosphorus and hollow-core anti-resonant fiber enables two-order magnitude enhancement of sensitivity for bisphenol A detection. Biosens. Bioelectron. 2020, 149. [Google Scholar] [CrossRef]
- Maas, M.B.; Maybery, G.H.C.; Perold, W.J.; Neveling, D.P.; Dicks, L.M.T. Borosilicate glass fiber-optic biosensor for the detection of Escherichia coli. Curr. Microbiol. 2018, 75, 150–155. [Google Scholar] [CrossRef] [PubMed]
- Long, F.; Zhu, A.; Zhou, X.; Wang, H.; Zhao, Z.; Liu, L.; Shi, H. Highly sensitive and selective optofluidics-based immunosensor for rapid assessment of Bisphenol A leaching risk. Biosens. Bioelectron. 2014, 55, 19–25. [Google Scholar] [CrossRef]
- Song, D.; Yang, R.; Wang, H.; Fang, S.; Liu, Y.; Long, F.; Zhu, A. Development of dual-color total internal reflection fluorescence biosensor for simultaneous quantitation of two small molecules and their affinity constants with antibodies. Biosens. Bioelectron. 2019, 126, 824–830. [Google Scholar] [CrossRef]
- Li, W.; Wang, H.; Yang, R.; Song, D.; Long, F.; Zhu, A. Integrated multichannel all-fiber optofluidic biosensing platform for sensitive and simultaneous detection of trace analytes. Anal. Chim. Acta 2018, 1040, 112–119. [Google Scholar] [CrossRef]
- Liu, J.; Xu, W.; Zhu, A.; Kang, H.; Cao, Y.; Long, F. Reusable optofluidic point-of-care testing platform with lyophilized specific antibody for fluorescence detection of cholylglycine in serum. Microchim. Acta 2020, 187. [Google Scholar] [CrossRef]
- Müller, A.J.; Knuth, M.; Nikolaus, K.S.; Krivánek, R.; Küster, F.; Hasslacher, C. First clinical evaluation of a new percutaneous optical fiber glucose sensor for continuous glucose monitoring in diabetes. J. Diabetes Sci. Technol. 2013, 7, 13–23. [Google Scholar] [CrossRef] [Green Version]
- Li, M.; Yang, R.; Yu, L. The Fiber Optic Biosensor for Noradrenaline Concentration Detection Based on CuPc Catalysis; Trans Tech Publications Ltd.: Bach, Switzerland, 2012; Volume 496, ISBN 9783037853931. [Google Scholar]
- Isarankura-Na-Ayudhya, C.; Tantimongcolwat, T.; Galla, H.-J.; Prachayasittikul, V. Fluorescent protein-based optical biosensor for copper ion quantitation. Biol. Trace Elem. Res. 2010, 134, 352–363. [Google Scholar] [CrossRef] [PubMed]
- Ding, L.; Huang, L.; Huang, J.; Zhong, Y.; Fan, D. A Novel Fiber Optic Biosensor for Nitric Oxide Determination Based on Vicinal Diaminobenzozcridine Fluorescent Probe. In Proceedings of the SPIE the International Society for Optical Engineering, Orlando, FL, USA, 5–9 April 2010; Volume 7673. [Google Scholar]
- Arakawa, T.; Aota, T.; Iitani, K.; Toma, K.; Iwasaki, Y.; Mitsubayashi, K. Skin ethanol gas measurement system with a biochemical gas sensor and gas concentrator toward monitoring of blood volatile compounds. Talanta 2020, 219. [Google Scholar] [CrossRef] [PubMed]
- Bidmanova, S.; Chaloupkova, R.; Damborsky, J.; Prokop, Z. Development of an enzymatic fiber-optic biosensor for detection of halogenated hydrocarbons. Anal. Bioanal. Chem. 2010, 398, 1891–1898. [Google Scholar] [CrossRef] [PubMed]
- Ahmad, M.; Hench, L.L. Effect of taper geometries and launch angle on evanescent wave penetration depth in optical fibers. Biosens. Bioelectron. 2005, 20, 1312–1319. [Google Scholar] [CrossRef]
- Punjabi, N.; Satija, J.; Mukherji, S. Evanescent Wave Absorption Based Fiber-Optic Sensor—Cascading of Bend and Tapered Geometry for Enhanced Sensitivity. In Sensing Technology: Current Status and Future Trends III; Springer: Cham, Germany, 2015; Volume 11. [Google Scholar]
- Gowri, A.; Sai, V.V.R. U-Bent Plastic Optical Fiber Based Plasmonic Biosensor for Nucleic Acid Detection. In Proceedings of the SPIE Optics + Optoelectronics, Prague, Czech Republic, 24–27 April 2017; Volume 10231. [Google Scholar]
- Ramakrishna, B.; Sai, V.V.R. Immunogold-Silver Staining (IGSS) Based U-Bent Fiberoptic Sandwich Biosensor. In Proceedings of the SPIE BioPhotonics Australasia, Adelaide, Australia, 16–19 October 2016; Volume 10013. [Google Scholar]
- Love, W.F.; Button, L.J. Optical Characteristics of Fiber Optic Evanescent Wave Sensors. In Biosensors with Fiberoptics; Humana Press: Totowa, NJ, USA, 1991; Volume 990, pp. 175–180. [Google Scholar] [CrossRef]
- Sai, V.V.R.; Kundu, T.; Deshmukh, C.; Titus, S.; Kumar, P.; Mukherji, S. Label-free fiber optic biosensor based on evanescent wave absorbance at 280 nm. Sens. Actuators B Chem. 2010, 143, 724–730. [Google Scholar] [CrossRef]
- Dhawangale, A.; Bharadwaj, R.; Mukherji, S.; Kundu, T. UV Photodiode Based Portable Fiber Optic Biosensor. In Proceedings of the 2010 International Conference on Systems in Medicine and Biology, Kharagpur, India, 16–18 December 2010; pp. 335–338. [Google Scholar]
- Kundu, T.; Sai, V.V.R.; Dutta, R.; Titas, S.; Kumar, P.; Mukherjee, S. Development of evanescent wave absorbance-based fibre-optic biosensor. Pramana J. Phys. 2010, 75, 1099–1113. [Google Scholar] [CrossRef]
- Kazuma, E.; Tatsuma, T. Localized surface plasmon resonance sensors based on wavelength-tunable spectral dips. Nanoscale 2014, 6, 2397–2405. [Google Scholar] [CrossRef] [Green Version]
- Punjabi, N.; Satija, J.; Mukherji, S. A Novel “Gold on Gold” Biosensing Scheme for an On-Fiber Immunoassay. In Proceedings of the SPIE—The International Society for Optical Engineering, Prague, Czech Republic, 13–16 April 2015; Volume 9506. [Google Scholar]
- Chiang, C.-Y.; Hsieh, M.-L.; Huang, K.-W.; Chau, L.-K.; Chang, C.-M.; Lyu, S.-R. Fiber-optic particle plasmon resonance sensor for detection of interleukin-1β in synovial fluids. Biosens. Bioelectron. 2010, 26, 1036–1042. [Google Scholar] [CrossRef]
- Xu, Y.; Luo, Z.; Chen, J.; Huang, Z.; Wang, X.; An, H.; Duan, Y. ω-shaped fiber-optic probe-based localized surface plasmon resonance biosensor for real-time detection of Salmonella typhimurium. Anal. Chem. 2018, 90, 13640–13646. [Google Scholar] [CrossRef] [PubMed]
- Anusha, J.R.; Fleming, A.T.; Kim, H.-J.; Kim, B.C.; Yu, K.-H.; Raj, C.J. Effective immobilization of glucose oxidase on chitosan submicron particles from gladius of Todarodes pacificus for glucose sensing. Bioelectrochemistry 2015, 104, 44–50. [Google Scholar] [CrossRef] [PubMed]
- Srivastava, S.K.; Arora, V.; Sapra, S.; Gupta, B.D. Localized surface plasmon resonance-based fiber optic u-shaped biosensor for the detection of blood glucose. Plasmonics 2012, 7, 261–268. [Google Scholar] [CrossRef]
- Li, K.; Liu, G.; Wu, Y.; Hao, P.; Zhou, W.; Zhang, Z. Gold nanoparticle amplified optical microfiber evanescent wave absorption biosensor for cancer biomarker detection in serum. Talanta 2014, 120, 419–424. [Google Scholar] [CrossRef] [PubMed]
- Idris, S.; Azeman, N.H.; Noor Azmy, N.A.; Ratnam, C.T.; Mahdi, M.A.; Bakar, A.A. Gamma irradiated Py/PVA for GOx immobilization on tapered optical fiber for glucose biosensing. Sens. Actuators B Chem. 2018, 273, 1404–1412. [Google Scholar] [CrossRef]
- Pahurkar, V.G.; Tamgadge, Y.S.; Gambhire, A.B.; Muley, G.G. Evanescent wave absorption based polyaniline cladding modified fiber optic intrinsic biosensor for glucose sensing application. Measurement 2015, 61, 9–15. [Google Scholar] [CrossRef]
- Punjabi, N.; Satija, J.; Mukherji, S. Augmenting Labeled Bioassay Sensitivity-Exploiting Nanogold Optical Properties on An optical Fiber Biosensor. In Optical Sensors; Optical Society of America: Washington, DC, USA, 2014. [Google Scholar]
- Chauhan, S.; Punjabi, N.; Sharma, D.; Mukherji, S. Evanescent wave absorption based S-shaped fiber-optic biosensor for immunosensing applications. Proc. Eng. 2016, 168, 117–120. [Google Scholar] [CrossRef]
- Ramakrishna, B.; Sai, V.V.R. Evanescent wave absorbance based U-bent fiber probe for immunobiosensor with gold nanoparticle labels. Sens. Actuators B Chem. 2016, 226, 184–190. [Google Scholar] [CrossRef]
- Bandaru, R.; Divagar, M.; Khanna, S.; Danny, C.G.; Gupta, S.; Janakiraman, V.; Sai, V.V.R. U-bent fiber optic plasmonic biosensor platform for ultrasensitive analyte detection. Sens. Actuators B Chem. 2020, 321. [Google Scholar] [CrossRef]
- Dash, S.P.; Patnaik, S.K.; Tripathy, S.K. Investigation of a low cost tapered plastic fiber optic biosensor based on manipulation of colloidal gold nanoparticles. Opt. Commun. 2019, 437, 388–391. [Google Scholar] [CrossRef]
- Chandra, S.; Dhawangale, A.; Mukherji, S. Hand-held optical sensor using denatured antibody coated electro-active polymer for ultra-trace detection of copper in blood serum and environmental samples. Biosens. Bioelectron. 2018, 110, 38–43. [Google Scholar] [CrossRef]
- Divagar, M.; Bandaru, R.; Janakiraman, V.; Sai, V.V.R. A plasmonic fiberoptic absorbance biosensor for mannose-capped lipoarabinomannan based tuberculosis diagnosis. Biosens. Bioelectron. 2020, 167. [Google Scholar] [CrossRef]
- Arcas, A.S.; Dutra, F.S.; Allil, R.C.S.B.; Werneck, M.M. Surface plasmon resonance and bending loss-based U-shaped plastic optical fiber biosensors. Sensors 2018, 18, 648. [Google Scholar] [CrossRef] [PubMed] [Green Version]
- Zibaii, M.I.; Latifi, H.; Arabsorkhi, M.; Kazemi, A.; Gholami, M.; Azar, M.K.; Hosseini, S.M. Biconical Tapered Optical Fiber Biosensor for Real-Time Monitoring of Bovine Serum Albumin at Femtogram/mL Levels on Antibodyimmobilized Tapered Fibers. In Proceedings of the SPIE–The International Society for Optical Engineering, Porto, Portugal, 8–10 September 2010; Volume 7653. [Google Scholar]
- Liang, G.; Zhao, Z.; Wei, Y.; Liu, K.; Hou, W.; Duan, Y. Plasma enhanced label-free immunoassay for alpha-fetoprotein based on a U-bend fiber-optic LSPR biosensor. RSC Adv. 2015, 5, 23990–23998. [Google Scholar] [CrossRef]
- Chiang, C.-Y.; Huang, T.-T.; Wang, C.-H.; Huang, C.-J.; Tsai, T.-H.; Yu, S.-N.; Chen, Y.-T.; Hong, S.-W.; Hsu, C.-W.; Chang, T.-C.; et al. Fiber optic nanogold-linked immunosorbent assay for rapid detection of procalcitonin at femtomolar concentration level. Biosens. Bioelectron. 2020, 151. [Google Scholar] [CrossRef] [PubMed]
- Yunianto, M.; Eka, D.; Permata, A.N.; Ariningrum, D.; Wahyuningsih, S.; Marzuki, A. Development and Testing of a Plastic Optical Fiber Grating Biosensor for Detection of Glucose in the Blood. In Proceedings of the IOP Conference Series: Materials Science and Engineering, Surakarta, Indonesia, 3–4 October 2016; IOP Publishing: Bristol, UK, 2017; Volume 176. [Google Scholar]
- Sharma, P.; Semwal, V.; Gupta, B.D. A highly selective LSPR biosensor for the detection of taurine realized on optical fiber substrate and gold nanoparticles. Opt. Fiber Technol. 2019, 52. [Google Scholar] [CrossRef]
- Botewad, S.N.; Pahurkar, V.G.; Muley, G.G. Fabrication and evaluation of evanescent wave absorption based polyaniline-cladding modified fiber optic urea biosensor. Opt. Fiber Technol. 2018, 40, 8–12. [Google Scholar] [CrossRef]
- Botewad, S.N.; Pahurkar, V.G.; Muley, G.G. Development and Study the Performance of PBA Cladding Modified Fiber Optic intrinsic Biosensor for Urea Detection. In AIP Conference Proceedings; AIP Publishing LLC.: Melville, NY, USA, 2016; Volume 1728, p. 020487. [Google Scholar]
- Botewad, S.N.; Pahurkar, V.G.; Muley, G.G.; Gaikwad, D.K.; Bodkhe, G.A.; Shirsat, M.D.; Pawar, P.P. PANI-ZnO cladding-modified optical fiber biosensor for urea sensing based on evanescent wave absorption. Front. Mater. 2020, 7. [Google Scholar] [CrossRef]
- Kumar, S.; Singh, R.; Zhu, G.; Yang, Q.; Zhang, X.; Cheng, S.; Zhang, B.; Kaushik, B.K.; Liu, F.-Z. Development of uric acid biosensor using gold nanoparticles and graphene oxide functionalized micro-ball fiber sensor probe. IEEE Trans. Nanobiosci. 2020, 19, 173–182. [Google Scholar] [CrossRef]
- Halkare, P.; Punjabi, N.; Wangchuk, J.; Kondabagil, K.; Mukherji, S. Detection of Bacteria Using Bacteriophage with Hollow Gold Nanostructures Immobilized Fiber Optic Sensor. In Proceedings of the SPIE—the International Society for Optical Engineering, Brussels, Belgium, 3–7 April 2016; Volume 9899. [Google Scholar]
- Prakashan, V.P.; Gejo, G.; Sanu, M.S.; Sajna, M.S.; Subin, T.; Biju, P.R.; Cyriac, J.; Unnikrishnan, N.V. Novel SPR based fiber optic sensor for vitamin A using Au@Ag core-shell nanoparticles doped SiO2-TiO2-ZrO2 ternary matrix. Appl. Surf. Sci. 2019, 484, 219–227. [Google Scholar] [CrossRef]
- Liu, Q.; Liu, Y.; Chen, S.; Wang, F.; Peng, W. A low-cost and portable dual-channel fiber optic surface plasmon resonance system. Sensors 2017, 17, 2797. [Google Scholar] [CrossRef] [PubMed] [Green Version]


| Target Analyte | Bioreceptor | OF Configuration | Stokes Shift (λabs–λem) | LOD | Dynamic Range | Sensitivity (S) (Slope) | Detection Media | Regeneration | Cross-Sensitivity | Ref. |
|---|---|---|---|---|---|---|---|---|---|---|
| Quantum Dots-labelled DNA strand | DNA strand | 600 µm-core tapered OF (Rx) | 300 nm (405 nm–705 nm) | 3.2 × 10⁻¹⁸ M | 1 × 10⁻¹⁰ M–2.5 × 10⁻⁹ M | - | PBS buffer (10 mM, pH 7.4) | SDS (pH 1.9) | - | [31] |
| DNA strand | Fluorophore-labelled DNA | 480 µm-core tapered OF (Rx) | 25 nm (644 nm–669 nm) | 5.7 × 10⁻¹⁰ M | 1 × 10⁻⁸ M–1 × 10⁻⁵ M | 55 AU/M from 10−8 M to 10−6 M 550 AU/M from 10−6 M to 10−5 M | Tris-HCl buffer (10 mM, pH 8) | 2mM HCl | - | [29] |
| DNA strand | Oligonucleotide strands | 45mm of 400 µm-core OF (Tx) | Green QDs: > 121 nm (407 nm–528 nm) Red QDs: > 211 nm (407 nm–618 nm) | - | 1 × 10⁻⁸ M–2 × 10⁻⁸ M | - | Tris-borate buffer pH 7.4 | - | No | [35] |
| DNA strand (Shigella) | Biotin-labelled DNA strand | 600 µm-core tapered OF (Rx) | 20 nm (683 nm–703 nm) | 10−10 M | 0–2.5 × 10⁻⁹ M | 931.14 AU/nM | 20 mM Tris–HCl, pH 8.0, 0.5 M MgCl2 | 0.5% SDS (pH 1.9) | - | [74] |
| DNA strands of Aminoglycoside antibiotics (AMGA) | DNA strand | 600 µm-core diameter (Rx) | Cy3: 14 nm (554 nm–568 nm) Cy5: 17 nm (649 nm–666 nm) | 2.6 × 10⁻⁸ M | 2 × 10⁻⁷ M–2 × 10⁻⁴ M | 0.0278 AU/µM | Tris-HCl buffer (10 mM), milk products | SDS solution | No | [75] |
| Target Analyte | Bioreceptor | OF Configuration | Stokes Shift (λabs–λem) | LOD | Dynamic Range | Sensitivity (S) (Slope) | Detection Media | Regeneration | Cross-Sensitivity | Ref. |
|---|---|---|---|---|---|---|---|---|---|---|
| Escherichia coli (E. coli) O157:H7 | DNA strand | 500 µm-core fiber (Tx) | 20 nm (683 nm–703 nm) | Lower than 10 CFU/mL | 10–105 CFU/mL | −12.557 (%/(CFU/mL)) at 37 °C. −10.796 (%/(CFU/mL)) at 30.8 °C | Real waste water samples | 5% SDS | Adenovirus, rotavirus and salmonella | [76] |
| E.coli O157: H7 aptamer | 225 μm of taper waist (Rx) | 20 nm (683 nm–703 nm) | 110 CFU/mL | 350–3 × 10⁶ CFU/mL | - | Sterilized samples of tap water, effluent of wastewater treatment plant and landscape water | From 80% to 110% | No | [77] | |
| S. typhimyrium | S. typhimyrium aptamer | 225 μm of taper waist (Rx) | 20 nm (683 nm–703 nm) | 210 CFU/mL | 450–7.8 × 10⁶ CFU/mL | −17.96 AU/log(CFU/mL) in blood diluted to a final blood concentration of 10% | Blood diluted to a final blood concentration of 10% | - | No | [77] |
| Hg2+ | T-rich oligodeoxyribonucleotide (ON) sequence | 600 µm-core diameter (Rx) | 20 nm (683 nm–703 nm) | 2.1 × 10⁻⁹ M Hg2+ (1 × 10⁻⁸ M cDNA) 5 × 10⁻⁹ M Hg2+ (2 × 10⁻⁸ M cDNA) | 0–6 × 10⁻⁷ M (1 × 10⁻⁸ M cDNA) 0–2 × 10⁻⁶ M (2 × 10⁻⁸ M cDNA) | - | MES buffer (0.01 M, pH 7), tap water, bottled water, and a wastewater treatment plant | 0.5% SDS solution (pH 1.9) | No | [62] |
| Hg2+ | T-rich oligodeoxyribonucleotide (ON) sequence | 1 mm-core diameter (Rx) | 86 nm (390 nm–476 nm) | 4.73 × 10⁻¹³ M Hg2+ in PBS9.03 × 10−13 M Hg2+ in ultrapure water | 5 × 10⁻¹² M–5 × 10⁻⁹ M Hg2+ in PBS. 1 × 10⁻¹² M–5 × 10⁻¹⁰ M Hg2+ in ultrapure water. 1 × 10⁻¹² M–1 × 10⁻¹⁰ M Hg2+ in tap water | 0.0582 Δ(I0/I)/log(Hg2+ (M)) in PBS0.0337. Δ(I0/I)/log(Hg2+ (M)) in ultrapure water. 0.0436 Δ(I0/I)/log(Hg2+ (M)) in tap water | PBS (0.01, pH 7.4), ultrapure water and tap water | 0.5% SDS solution | Negligible interference from heavy metal ions | [51] |
| Pb2+ | Cy5.5-labelled DNA strand | 600 µm-core diameter (Rx) | 20 nm (683 nm–703 nm) | 1 nM Pb2+ | 2 × 10⁻⁸ M–8 × 10⁻⁷ M Pb2+ | 19.23 × 10⁶ AU/(M Pb2+) | 0.1 M Na2HPO4·7H2O buffer, 0.2 M NaCl, 0.05% Tween-20, pH 7.2. Also tested in: bottled purified water, tap water, mineral spring water | 0.5% SDS (pH 1.9) | No | [37] |
| Pb2+ | DNA strand | 600 µm-core diameter (Rx) | 20 nm (683 nm–703 nm) | 1.03 × 10⁻⁹ M Pb2+ | 2–7.5 × 10⁻⁸ M (linear 2–5 × 10⁻⁸ M) | 5.721 × 10⁹ AU/M | NaHEPES (0.05 M, pH 7.26), tap water and effluent froms two wastewater treatment plants | 1% SDS (pH 1.9), PBS and 1 mg/mL BSA | No | [63] |
| Pb2+ | DNA strand | 600 µm-core diameter (Rx) | 35 nm (490 nm–525 nm) | 1.06 × 10⁻⁹ M Pb2+ | 7.5 × 10⁻⁸–10−9 M | 2.45 × 10⁹ NPA/M (NPA—Neat Peak Area) | MOPS buffer (0.01 M, pH 7.5), bottled, tap and pond water | - | No | [78] |
| Bisphenol A (BPA) | DNA strand | 600 µm-core diameter (Rx) | 20 nm (683 nm–703 nm) | 1.86 × 10⁻⁹ M (0.45 ng mL) Bisphenol A | 2 × 10⁻⁹ M–100 × 10−7 M | - | 0.1 M PBS buffer. Also tested in wastewater | 0.5% SDS | No | [61] |
| Cy3-labelled DNA strand | 200 μm-core hollow core anti-resonant fiber (HARF) with 13 μm-hole diameter | 14 nm (554 nm–568 nm) | 1.69 × 10⁻¹² M | 1 × 10⁻¹¹ M–1 × 10⁻⁹ M (linear from 1 × 10⁻¹¹ M to 6 × 10⁻¹⁰ M) | 1.27 × 10¹² AU/M (from 1 × 10⁻¹¹ M to 6 × 10⁻¹⁰ M) | Blood and environmental samples | 1 M urea | No (BPB and BPS studied) | [79] |
| Target Analyte | Bioreceptor | OF Configuration | Stokes Shift (λabs–λem) | LOD | Dynamic Range | Sensitivity (S) (Slope) | Detection Media | Regeneration | Cross-Sensitivity | Ref. |
|---|---|---|---|---|---|---|---|---|---|---|
| E. coli O157:H7 | Antibodies | 780 μm-core polystyrene fiber (Rx) | 17 nm (649 nm–666 nm) | 1 × 10³ cell/mL in buffer and milk | 1 × 10³–1 × 10⁷ cell/mL in buffer and in milk | - | PBS (pH 7.4, 10 mM) and milk | Ultrapure water | No | [30] |
| Antibodies | Borosilicate glass fiber (Tx) | 13 nm (627 nm–640 nm) | 3.0 × 10⁷ CFU/mL CFU = colony forming unit = number of bacteria | - | - | PBS buffer | - | - | [80] | |
| Estrogen receptor α protein from MCF-7 Breast carcinoma cells and MDA-MB 231 cells | Antibody (antiestrogen α) | Hollow core photonic crystal fiber (core diameter 6 ± 1 µm, cladding diameter of 122 ± 5 µm) (Tx) | Alexa Fluor 488: 35 nm (490 nm–525 nm) Alexa 555: 25 nm (555 nm–580 nm) | 20 pg ERα protein in 50 nL sample volume | - | - | Cell lysate | - | - | [57] |
| Interleukin-6 (IL-6) protein | Antibody | Tapered 600 µm-core OF (Rx) | 35 nm (490 nm–525 nm) | 5 × 10⁻¹² M | 5 × 10⁻¹² M–1.5 × 10⁻¹⁰ M | - | PBS and EA buffer, and serum samples | Ultrapure water | No | [70] |
| Swine-origin influenza A (H1N1) virus (S-OIV) hemagglutinin (HA) protein | Antibody | 1 mm-core OF (Tx) | 24 nm (633 nm–657 nm) | S-OIV HA protein: 13.9 pg/mL in PBS S-OIV isolates (original culture): 8.25 × 10⁴ copies/mL in PBS, 1.65 × 10⁵ copies/mL in mimic solution (human nasal mucosa) | 5–50 ng/mL S-OIV HA in PBS (linear) | - | PBS and human nasal mucosa | - | No | [71] |
| Bisphenol A (BPA) | Fluorescence-labeled anti-BPA antibodies | Tapered fiber: 225 µm-core, 15 mm length (Rx) | 20 nm (683 nm–703 nm) | 2.63 × 10⁻¹⁰ M | 2.19 × 10⁻⁹ M–4.38 × 10⁻⁷ M | 4.88 × 10⁷ AU/M | PBS (0.01 M, pH = 7.4) | 0.5% SDS (pH 1.9) | BPB | [81] |
| 2,4-Bisphenol-A (BPA) and 2,4-Dichlorophenoxyacetic acid (2,4-D) | Cy5.5 labeled anti-2,4-D antibody and Pacific Blue dye labeled anti-BPA antibody | 600 µm-core diameter (Rx) | Cy5.5: 20 nm (683 nm–703 nm) Pacific blue: 45 nm (410 nm–455 nm) | BPA: 2.98 × 10⁻¹¹ M 2,4-D: 1.45 × 10⁻¹¹ M | BPA: 7.45 × 10⁻¹¹ M–5.36 × 10⁻⁷ M 2,4-D: 4.07 × 10⁻¹¹ M–4.56 × 10⁻⁷ M | 6.99 × 10⁸ M−1 (BPA) 6.15 × 10⁸ M−1 (2,4—D) | PBS (0.01 M, pH = 7.4) Also tested in real water | 0.5% SDS (pH 1.9) | - | [82] |
| Atrazine and 2,4-D | Fluorophore-labelled antibodies | 600 µm-core diameter (Rx) | 20 nm (683 nm–703 nm) | Atrazine: 1.4 × 10⁻¹⁰ M 2,4-D: 1.81 × 10⁻¹⁰ M | Atrazine: 6.95 × 10⁻¹⁰ M–5.03 × 10⁻⁷ M 2,4-D: 4.52 × 10⁻¹⁰ M–4.64 × 10⁻⁷ M | Atrazine: -7.3 × 10⁵ AU/M 2,4-D: -9.95 × 10⁵ AU/M | PBS (0.01 M, pH = 7.4) Also tested in lab tap water and water from natural sources | 0.5% SDS (pH 1.9) | - | [83] |
| Microcystin-LR (MC-LR) | Cy5.5-labelled anti-MC-LR antibody | 600 µm-core quartz fiber (Rx) | 20 nm (683 nm–703 nm) | 4.02 × 10⁻¹¹ M | 9.04 × 10⁻¹¹ M–1.1 × 10⁻⁷ M | - | PBS (0.01 M, pH 7.4) and real water samples | 0.5% SDS (pH 1.9) | Negligible | [73] |
| 2,4-Dichlorophenoxyacetic acid (2,4-D) | Cy5.5-labelled anti-2,4-D antibody | 4.07 × 10⁻¹⁰ M | 8.14 × 10⁻¹⁰ M–4.51 × 10⁻⁷ M | - | ||||||
| Atrazine (ATZ) | Cy5.5-labelled anti-ATZ antibody | 9.27 × 10⁻¹¹ M | 1.85 × 10⁻¹⁰ M–5.12 × 10⁻⁷ M | - | ||||||
| Bisphenol A (BPA) | Cy5.5-labelled anti-BPA antibody | 1.31 × 10⁻¹⁰ M | 2.19 × 10⁻¹⁰ M–4.82 × 10⁻⁷ M | - | ||||||
| Cholylglycine (CG) | Cy5.5-labelled CG antibody | 220 µm-core diameter (Rx) | 20 nm (683 nm–703 nm) | 5.37 × 10⁻⁸ M | 1.07 × 10⁻⁷ M–1.07 × 10⁻⁵ M (linear from 1.52 × 10⁻⁷ M to 2.15 × 10⁻⁶ M) | 2.9 × 10⁸ AU/M | PBS (pH 7.4) and serum samples | 0.5% SDS (pH 1.9) | No | [84] |
| Target Analyte | Bioreceptor | OF Configuration | Stokes Shift (λabs–λem) | LOD | Dynamic Range | Sensitivity (S) (Slope) | Detection Media | Regeneration | Cross-Sensitivity | Ref. |
|---|---|---|---|---|---|---|---|---|---|---|
| Glucose | fluorescently labeled glucose-binding lectin concanavalin A (Con A) and dextran | 500 µm-core polymer OF (Rx) | Not specified | - | - | - | - | - | - | [85] |
| BADAN-labelled Green Binding Protein (GBP) | 1.96 mm-core OF (Rx) | 120 nm (400 nm–520 nm) | - | 4 × 10⁻⁶ M–2 × 10⁻⁵ M (linear) | 2.3 × 10³ AU/M | Ultrapure water | PBS buffer, ultrapure water | - | [58] | |
| BADAN-labelled GBP | 1.96 mm-core OF (Rx) | 120 nm (400 nm–520 nm) | 2 × 10⁻⁶ M in PBS Yucatan minipig skin | 4 × 10⁻⁶ M–2 × 10⁻⁵ M (linear) in PBS | 1.3 × 10⁶ AU/μM in PBS | PBS (0.1 M, pH 7.4) and Yucatan minipig skin | PBS buffer | - | ||
| Noradrenaline | [Ru(bipy)3]2+ | Fiber dimensions not specified (Rx) | 160 nm (450 nm–610 nm) | 4.6 × 10⁻⁷ M | 2.4 × 10⁻⁶–9.2 × 10⁻⁵ M (linear) | ~33.09 × 10³ rad/M | Solution at pH 7.0 and rabbit serum | - | - | [86] |
| Ca2+ | Yellow Fluorescent Protein (YFP) | 100/100 µm core/cladding diameter (Rx) | 14 nm (513 nm–527 nm) | - | 2.5 × 10⁻¹⁰ M–1 × 10⁻⁵ M | 1.47 × 10⁶ CL/M | 0.02 M Tris–HCl (pH 7.9) | - | pH | [59] |
| Cu2+ | Chimeric metal-binding green fluorescent protein (His6GFP) | Fiber dimensions not specified (Rx) | 113 nm (396 nm–509 nm) | - | 5 × 10⁻⁷ M–5 × 10⁻² M | -320 U/log[Cu2+ (M)] | 0.05 M Na2HPO4 and 300 mM NaCl buffer | EDTA 50 mM, HEPES buffer | No | [87] |
| 17β-estradiol | 17β-estradiol aptamer | 600 µm-core diameter (Rx) | 20 nm (683 nm–703 nm) | 2.1 × 10⁻⁹ M | 5 × 10⁻⁹–75 × 10−9 M | - | Tris–HCl (0.01 M, pH 8.0) and wastewater treatment effluent samples | 0.5% SDS (pH 1.9) | No | [69] |
| Nitric oxide | diaminobenzozcridine (VDABA) | Dimensions not specified (Rx) | Not specified, λem = 492 nm | - | 1.8 × 10⁻⁶–9 × 10⁻⁶ M (linear) | 3.8889 (M NO) | Gas | - | - | [88] |
| Ethanol | alcohol dehydrogenase enzyme | 1.6 mm-core diameter (Rx) | 130 nm (360 nm–490 nm) | - | 1–3100 ppb | - | Skin gas | - | 1-propanol | [89] |
| 1,2-dibromoethane and 3-chloro-2-(chloromethyl)-1-propene | purified enzyme haloalkane dehalogenase and a fluorescence pH indicator | 1 mm-core PMMA fiber (Rx) | 22 nm (495 nm–517 nm) | 1,2-dibromoethane: 0.133 × 10⁻³ M. 3-chloro-2-(chloromethyl)-1-propene: 1.4 × 10⁻⁵ M | 0–1.2 × 10⁻⁶ M and 0–8 × 10⁻⁷ M | 110.3990 (V/M) (1,2-dibromoethane). 61.0072 (V/M) (3-chloro-2-(chloromethyl)-1-propene) | HEPES buffer (0.001 M, pH 8.2) | - | - | [90] |
| Target Analyte | Bioreceptor | OF Configuration | λabs | LOD | Dynamic Range | Sensitivity (S) (Slope) | Detection Media | Regeneration | Cross-Sensitivity | Ref. |
|---|---|---|---|---|---|---|---|---|---|---|
| Goat anti-human Ig G (GaHIgG) | Human immunoglobulin G (HIgG) antibody | 200 µm-core (U-bent, Tx) | 495 nm (FITC) and 530 nm (AuNPs) | - | FITC-GaHIgG: 1.38 × 10⁻⁵ M–6.95 × 10⁻⁵ M. AuNPs–GaHIgG: 1.38 × 10⁻⁵ M–6.95 × 10⁻⁵ M | - | PBS | - | - | [108] |
| Human IgG antibody | 200, 400 and 600-μm (U-bent, Tx) | 280 nm | 6.7 × 10⁻¹⁰ M | 6.7 × 10⁻¹⁰ M–3.35 × 10⁻⁸ M | - | 5 mg/mL BSA solution | - | - | [96,97,98] | |
| HIgG immobilized onto AuNPs | 200 µm-core fiber (U-bent, Tx) | 535-548 nm | - | 3.47 × 10⁻⁶ M–6.95 × 10⁻⁵ M | - | PBS (pH 7.4) | - | - | [100] | |
| HIgG antibodies | 400 μm core PCS fiber (S-shape, Tx) | 500 nm | 1.7 × 10⁻⁹ M | 1.7 × 10⁻⁹ M–6.8 × 10⁻⁸ M | - | PBS (pH 7.4) | - | - | [109] | |
| Human Ig G (HIgG) | GaHIgG antibodies | 200 µm-core fiber (U-bent, Tx) | 530 nm | 2 × 10⁻¹² M | 6.67 × 10⁻¹² M–6.67 × 10⁻⁷ M | 0.019 A530nm/(log(M) − 11) | PBS (pH 7.4) | - | - | [110] |
| Bioreceptors for HIgG (Fab-GaHIgG) | 200 μm-core (U-bent, Tx) | 530 nm | 6.67 × 10⁻¹⁵ M IgG using immunogold labels. 6.67 × 10⁻⁹ M HIgG using immunogold labels and subsequently silver enhancement | 6.67 × 10⁻¹⁵ M–6.67 × 10⁻¹² M IgG | 0.04 Abs/(log(M) − 11) using immunogold labels. 0.8 Abs/(log(M) − 11) using immunogold labels and subsequently silver enhancement | PBS | - | - | [94] | |
| AuNPs functionalized with GaHIgG antibodies | 200 μm-core (U-bent, Tx) | 530 nm | 7 × 10⁻¹⁸ M | 7 × 10⁻¹⁸ M–7 × 10⁻¹² M | 0.1036 Abs @530 nm/log (M) | PBS buffer | - | - | [111] | |
| LEEH caped AuNPs | 250 μm-core PMMA fiber (U-shape, Tx) | 650 nm | 12.7 × 10⁻⁶ M | - | - | MilliQ water | - | - | [112] | |
| Cu2+ | Human immunoglobulin G (HIgG) | 200 μm-core fiber (U-bent, Tx) | 650 nm | 7.5 × 10⁻¹⁵ M in tap water | 10−14–10−6 M | Tap water: 0.006 (Abs @530 nm)/ln[Cu2+ (M)] | Tap water, natural water bodies and soil | 90–115% (not specified how) | Negligible response to 10 μM of other ions | [113] |
| Mannosylated Lipoarabinomannan (Mtb LAM) | AuNPs functionalized with anti-Mtb LAM immunoglobin M (IgM) and Anti-Mtb LAM IgG | 200 μm-fused silica fiber (U-bent, Tx) | 540 nm | 5.9 × 10⁻⁹ M (in PBS buffer) 5.9 × 10⁻⁸ M (in synthetic urine) | 2.95 × 10⁻⁸ M–5.9 × 10⁻⁵ M in PBS buffer 5.9 × 10⁻⁸ M–5.9 × 10⁻⁵ M in synthetic urine | 0.078 (Abs @542 nm/(log[LAM(M)] − 8.3) in PBS buffer 0.043 (Abs @542 nm/log (log[LAM(M)] − 8.3) in synthetic urine | PBS buffer and synthetic urine | - | - | [114] |
| Target Analyte | Bioreceptor | OF Configuration | λabs | LOD | Dynamic Range | Sensitivity (S) (Slope) | Detection Media | Regeneration | Cross-Sensitivity | Ref. |
|---|---|---|---|---|---|---|---|---|---|---|
| E. coli O55 | E. coli antibodies | 1 mm-core PMMA fiber (U-bent, Tx) | 600 nm and 845 nm | 1.5 × 10³ CFU/mL | 1 × 10³–1 × 10⁸ CFU/mL | - | Ultrapure water with NaCl | - | No | [115] |
| Bovine Serum Albumin (BSA) | BSA antibody | 8 μm core/125 μm cladding silica fiber (Tx) | 1558 nm | - | - | - | PBS | - | - | [116] |
| LEEH caped AuNPs | 250 μm-core PMMA fiber (U-shape, Tx) | 650 nm | 3 × 10¹⁹ M | - | - | MilliQ water | - | - | [112] | |
| Interleukin-1β | Anti-IL-1β | 250 μm-core PCS fiber (Tx) | 532 nm | 1.2 × 10⁻¹² M | 4.98 × 10⁻¹¹ M–9.95 × 10⁻⁹ M | 5.5 × 10¹⁰ AU/M | PBS (pH 7.4) | - | No | [101] |
| Alpha feto-protein | Alpha feto-protein antibody | 600 μm-core PCS fiber (U-bent, Tx) | 550 nm | 7.33 × 10¹² M in PBS and 2.85 × 10¹³ M in human serum | 4.31 × 10¹³ M–1.72 × 10¹⁵ M in PBS and human serum | 1.24 AU/RIU | PBS and human serum | - | Slight interference from HSA and human IgG | [117] |
| Alpha feto-protein antibody | 8 μm-core SMF fiber (Tx) | 532 nm | 1.72 × 10¹² M in PBS and 1.72 × 10¹³ M in BSA | 1.72 × 10¹² M–8.6 × 10¹⁵ M) | - | PBS and BSA | 0.1 M glycine–HCl buffer (pH 2.3) | - | [105] | |
| Procalcitonin | Procalcitonin (PCT) antibodies | OF dimensions not specified (Tx) | 520 nm | 3.96 × 10¹² M | 4.17 × 10¹³ M–4.17 × 10¹⁵ M | 0.002 (ΔI/I0)/log[PCT(M)] | PBS (pH 7.3) | - | - | [118] |
| Target Analyte | Bioreceptor | OF Configuration | λabs | LOD | Dynamic Range | Sensitivity (S) (Slope) | Detection Media | Regeneration | Cross-Sensitivity | Observations | Ref. |
|---|---|---|---|---|---|---|---|---|---|---|---|
| Blood glucose | Glucose oxidase (GOx) | 600 μm-core fiber (U-shape, Tx) | 540 nm | 1.38 × 10⁻⁵ M | 0–1.38 × 10⁻² M | S (= Awater − Asample at 540 nm for 5 × 10⁻³ M of glucose) depends on the beding radius: S (r = 0.4 mm) = 0.0008 S (r = 0.5 mm) = 0.0016 S (r = 0.65 mm) = 0.0025 S (r = 0.7 mm) = 0.003 S (r = 1 mm) = 0.005 S (r = 1.7 mm) = 0.004 | Millipore® water | Distilled water (reused up to 4 times in a month) | - | [104] | |
| Glucose | Glucose oxidase (GOx) | 450 μm-core PCS fiber (Tx) | 272 nm | 1 × 10⁻⁹ M | 1 × 10⁻⁸ M–1 × 10⁻⁴ M | - | PBS (0.1 M, pH 7.4) | - | No | [107] | |
| - | OF dimensions not specified (Tx) | 581 nm | - | 3.31 × 10⁻³ M–1.38 × 10⁻² M | 7.6 AU/M | Blood serum | - | - | Proof-of-concept | [119] | |
| Taurine | Taurine dioxygenase enzyme | 600 µm-core fiber (Tx) | 585 nm | 5.3 × 10⁻⁵ M | 0–1 × 10⁻³ M | 19 AU/M | PBS (0.1 M, pH 7.4) | - | No | [120] | |
| Urea | Enzyme-urease | 1000 μm-core PCS fiber (Tx) | 250 nm | 1 × 10⁻⁷ M | 1 × 10⁻⁷ M–1 M | - | PBS (0.1 M, pH 7.4) | - | No | [121] | |
| Enzyme-urease | 1000 μm-core PCS fiber (Tx) | 245 nm | - | - | - | PBS (0.1 M, pH 7.4) | - | - | Proof-of-concept. Only 1 μM, 10 μM and 100 μM tested | [122] | |
| Enzyme-urease | 400 μm-core PCS fiber (Tx) | 250 nm | 1 × 10⁻⁸ M | 1 × 10⁻⁸ M–1 M | - | PBS (0.1 M, pH 7.4) | - | No | [123] | ||
| Uric acid | Uricase enzyme | 9 μm-core fiber | 513 nm | 6.56 × 10⁻⁵ M | 1 × 10⁻⁵ M–1 × 10⁻³ M | −2.1 × 10³%/M | PBS (0.1 M, pH 7.4) | PBS (0.1 M, pH 7.4) | No | [124] |
| Target Analyte | Bioreceptor | OF Configuration | λabs | LOD | Dynamic Range | Sensitivity (S) (Slope) | Detection Media | Regeneration | Cross-Sensitivity | Observations | Ref. |
|---|---|---|---|---|---|---|---|---|---|---|---|
| E. coli B40 (bacteriophage T4) | B40 cells | 200 μm-core (U-bent, Tx) | 610 nm | - | 5.05 ∆A660nm/RIU (Sensitivity to E. coli B40 not studied) | PBS | - | No | [125] | ||
| DNA strand | ON sequence | 600 µm-core fiber (PMMA) (U-bent, Tx) | 535 nm | 2 × 10⁻¹⁰ M | - | - | PBS | - | - | [93] | |
| S. typhimurium | DNA strand | 600 μm-core PCS fiber (Ω-bent, Tx) | 530 nm | 128 CFU/mL | 5 × 10² to 1 × 10⁸ CFU/mL | 0.013 AU/log(CFU/mL) | PBS (0.1 M, pH 7.4) | 93–123% with PBS (0.1 M, pH 7.4) | No | [102] | |
| Vitamin A | Au@Ag core-shell nanoparticles embedded SiO2-TiO2-ZrO2 ternary matrix | 600 μm-core PCS fiber (Tx) | 400 nm and 500 nm | 1 × 10⁻⁵ M | 1 × 10⁻⁶ M–1 × 10⁻² M | - | Aqueous solution | - | No | [126] | |
| Concanavalin A | Glycoprotein ribonuclease B (RNase B) | 400 μm-core PCS fiber (Tx) | 595 nm | - | 5.78 × 10¹⁷ M–4.64 × 10¹⁸ M | 394.56%/RIU (Sensitivity to Con A not studied) | PBS (0.01 M, pH 7.4) | 8.0 M urea solution | - | Proof-of-concept | [127] |
Publisher’s Note: MDPI stays neutral with regard to jurisdictional claims in published maps and institutional affiliations. |
© 2021 by the authors. Licensee MDPI, Basel, Switzerland. This article is an open access article distributed under the terms and conditions of the Creative Commons Attribution (CC BY) license (https://creativecommons.org/licenses/by/4.0/).
Share and Cite
De Acha, N.; Socorro-Leránoz, A.B.; Elosúa, C.; Matías, I.R. Trends in the Design of Intensity-Based Optical Fiber Biosensors (2010–2020). Biosensors 2021, 11, 197. https://doi.org/10.3390/bios11060197
De Acha N, Socorro-Leránoz AB, Elosúa C, Matías IR. Trends in the Design of Intensity-Based Optical Fiber Biosensors (2010–2020). Biosensors. 2021; 11(6):197. https://doi.org/10.3390/bios11060197
Chicago/Turabian StyleDe Acha, Nerea, Abián B. Socorro-Leránoz, César Elosúa, and Ignacio R. Matías. 2021. "Trends in the Design of Intensity-Based Optical Fiber Biosensors (2010–2020)" Biosensors 11, no. 6: 197. https://doi.org/10.3390/bios11060197