Probing Individual Particles in Aquatic Suspensions by Simultaneously Measuring Polarized Light Scattering and Fluorescence


Abstract
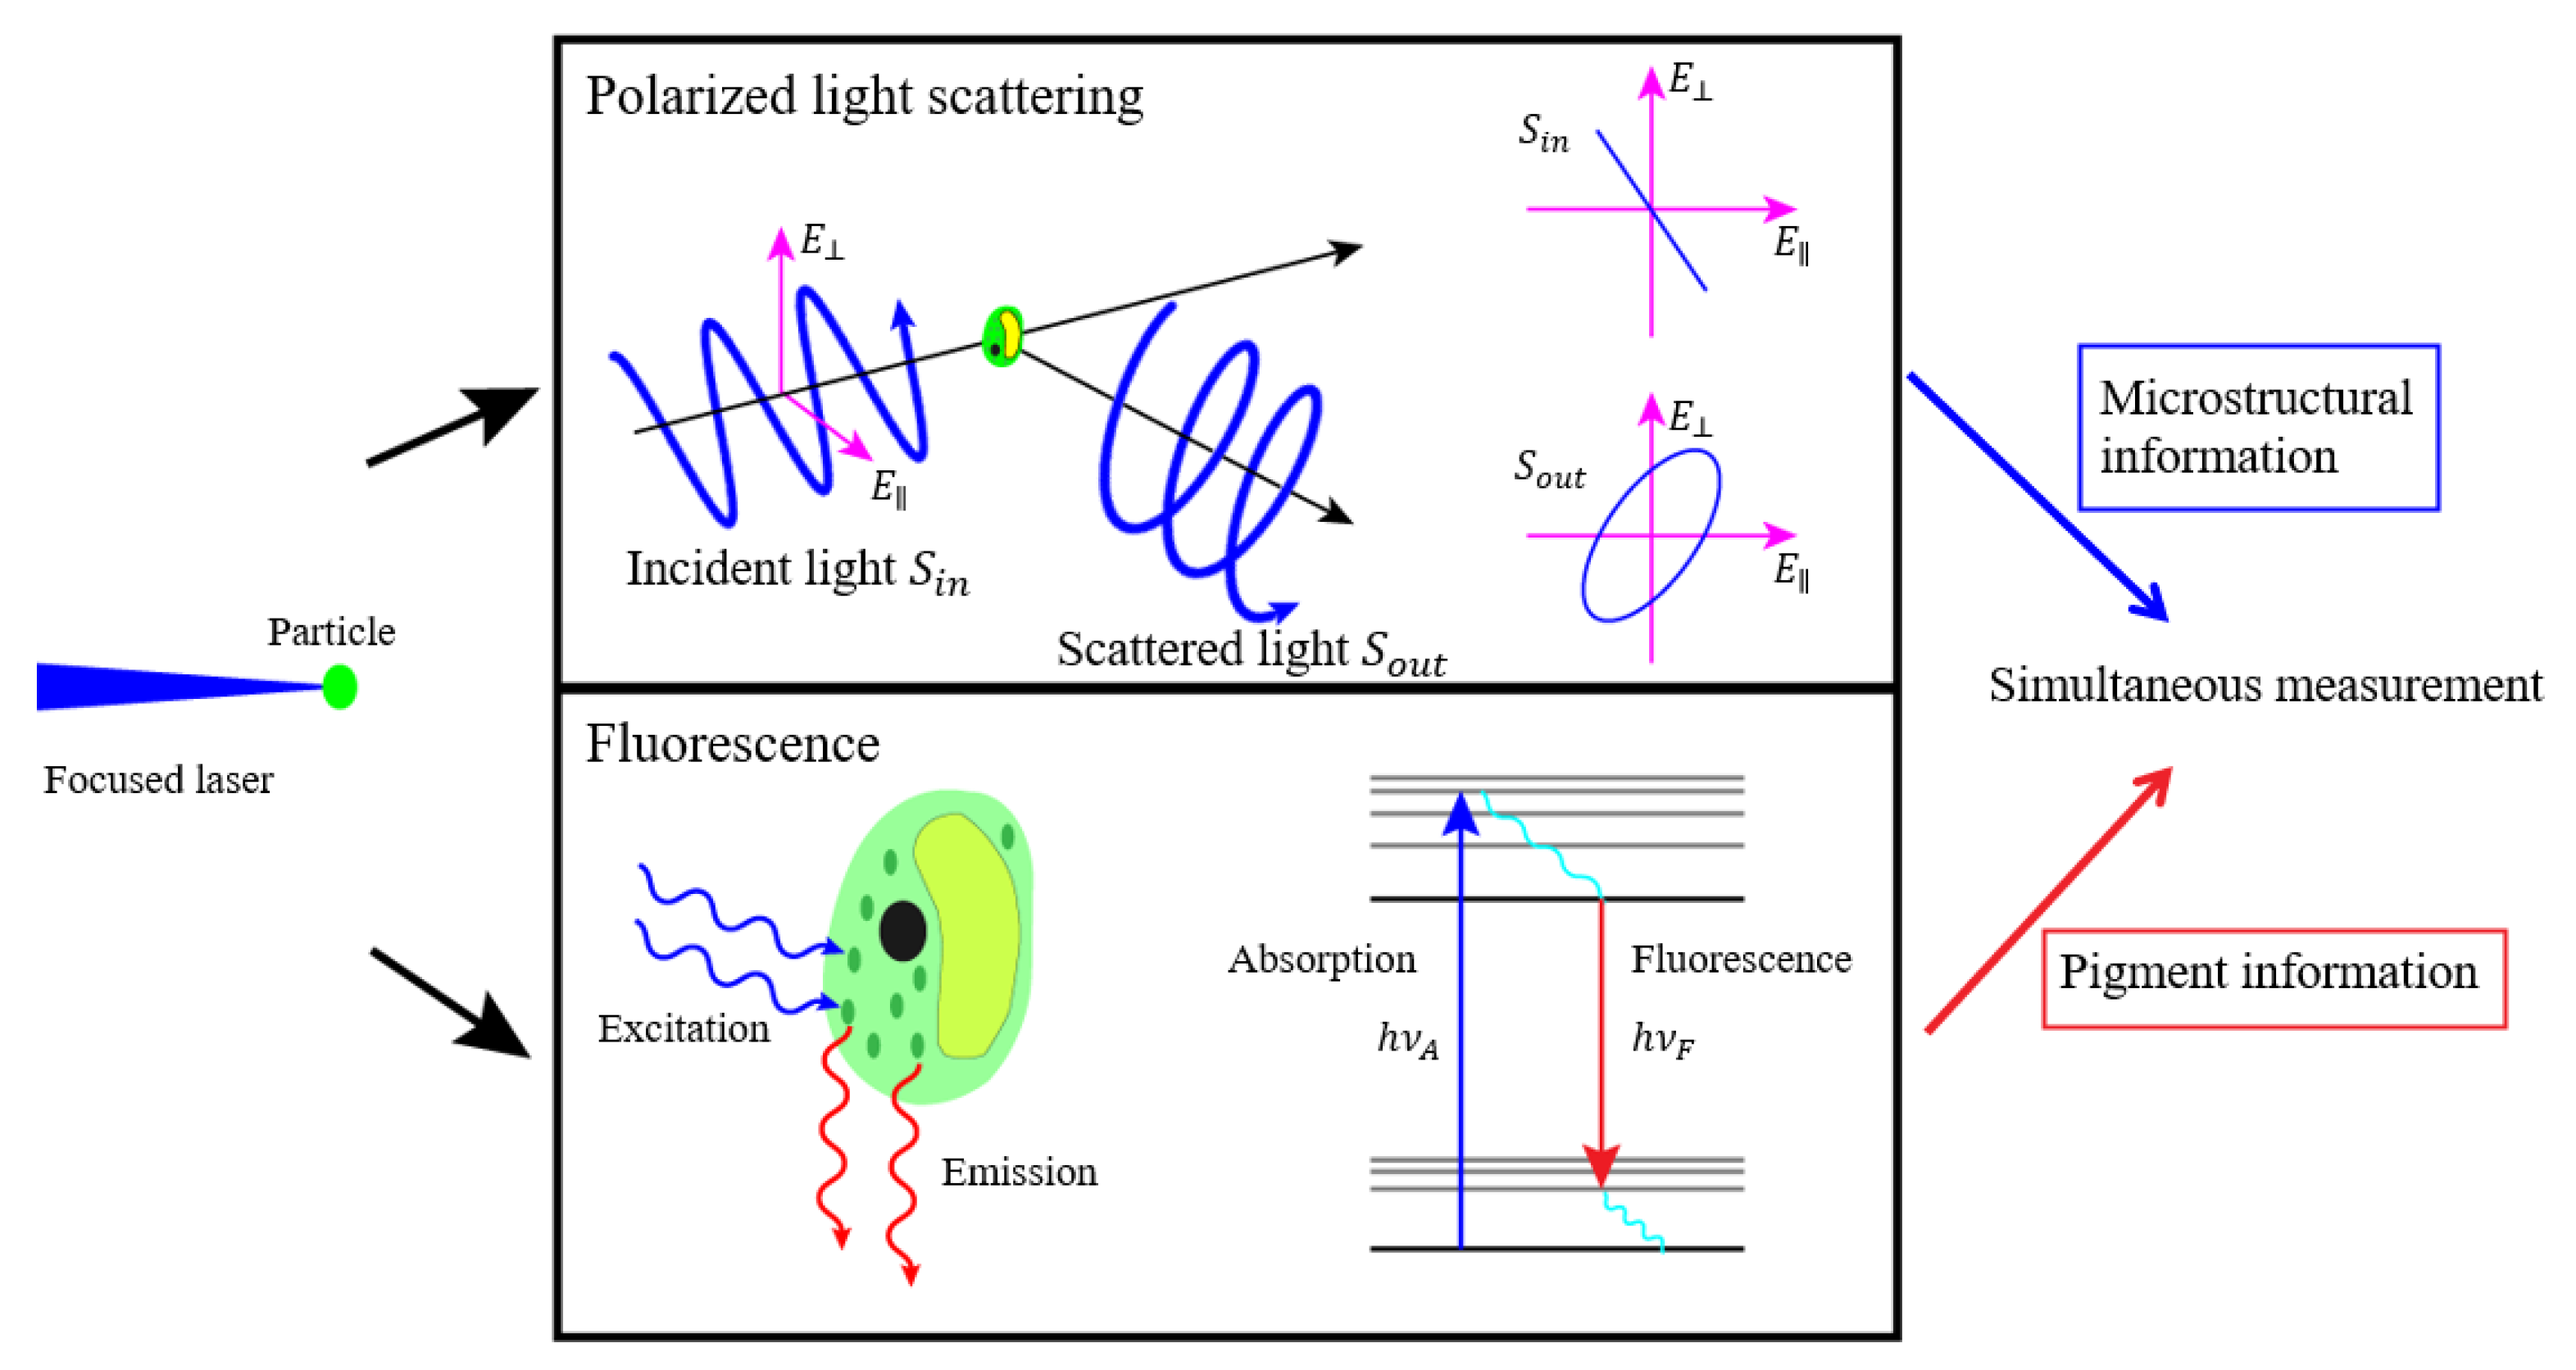
:1. Introduction
2. Methods
2.1. Samples
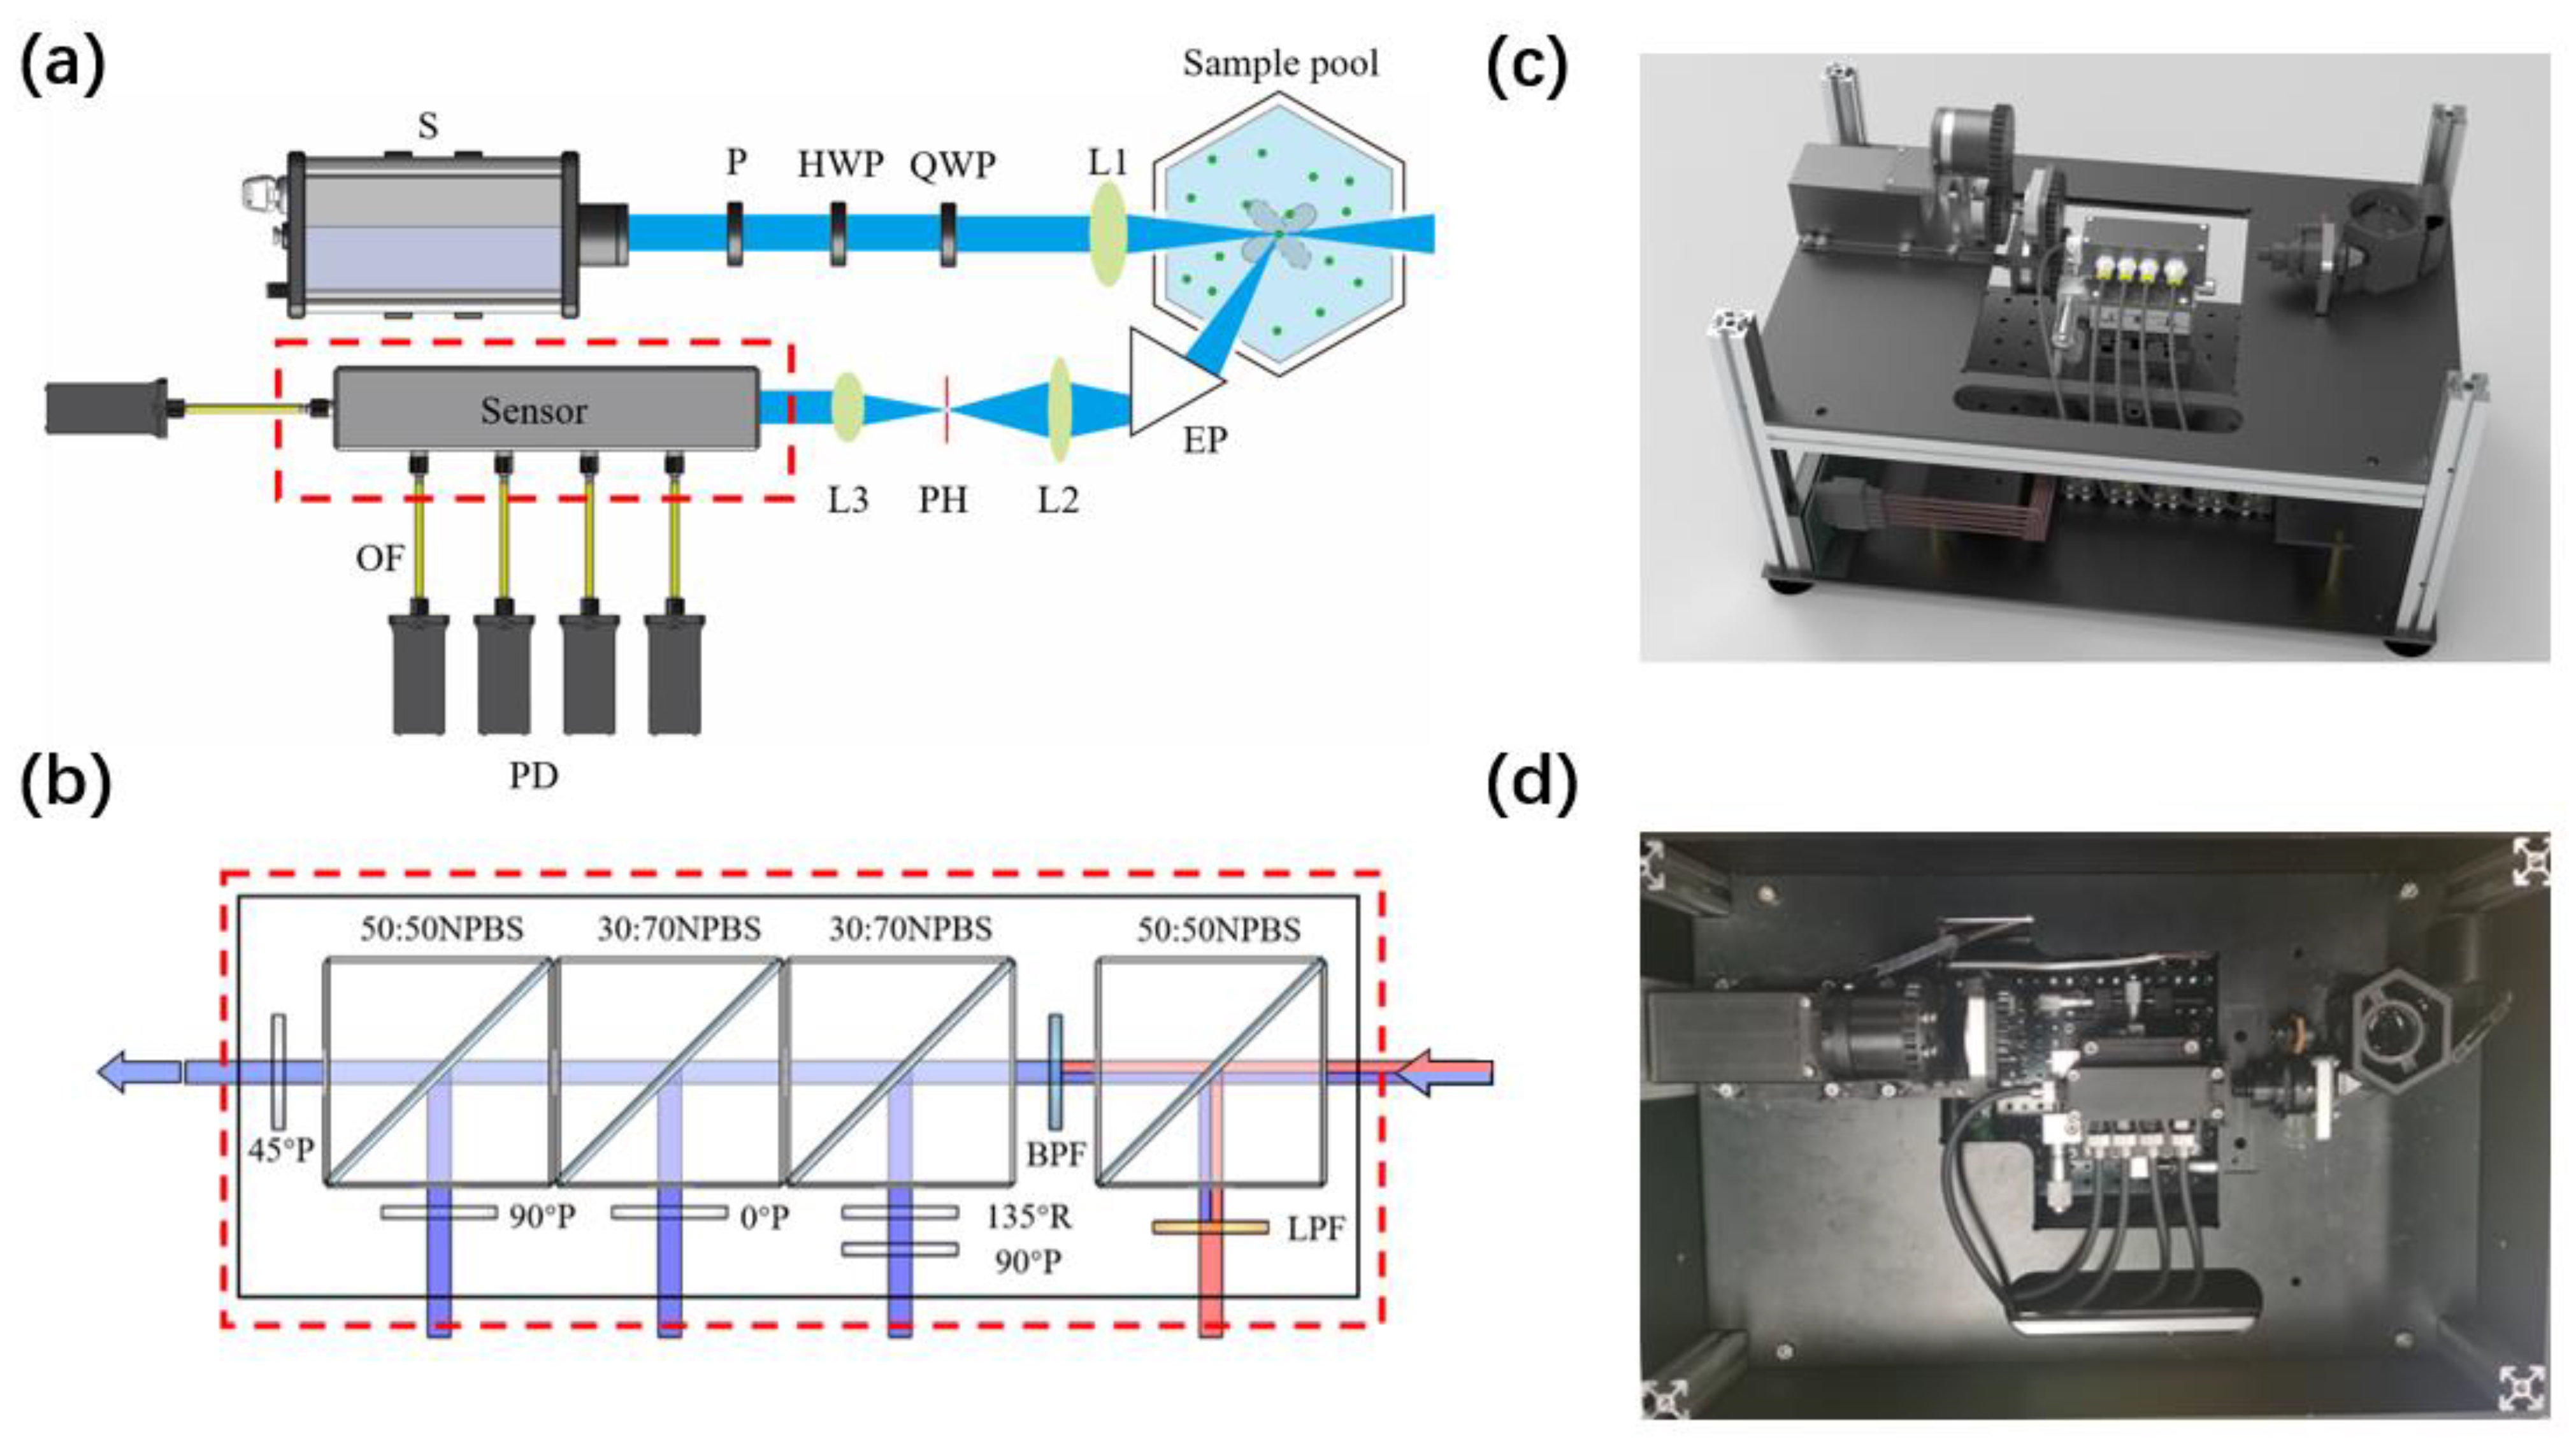
2.2. Experimental Setup
2.3. Data Analyzing Method
3. Results
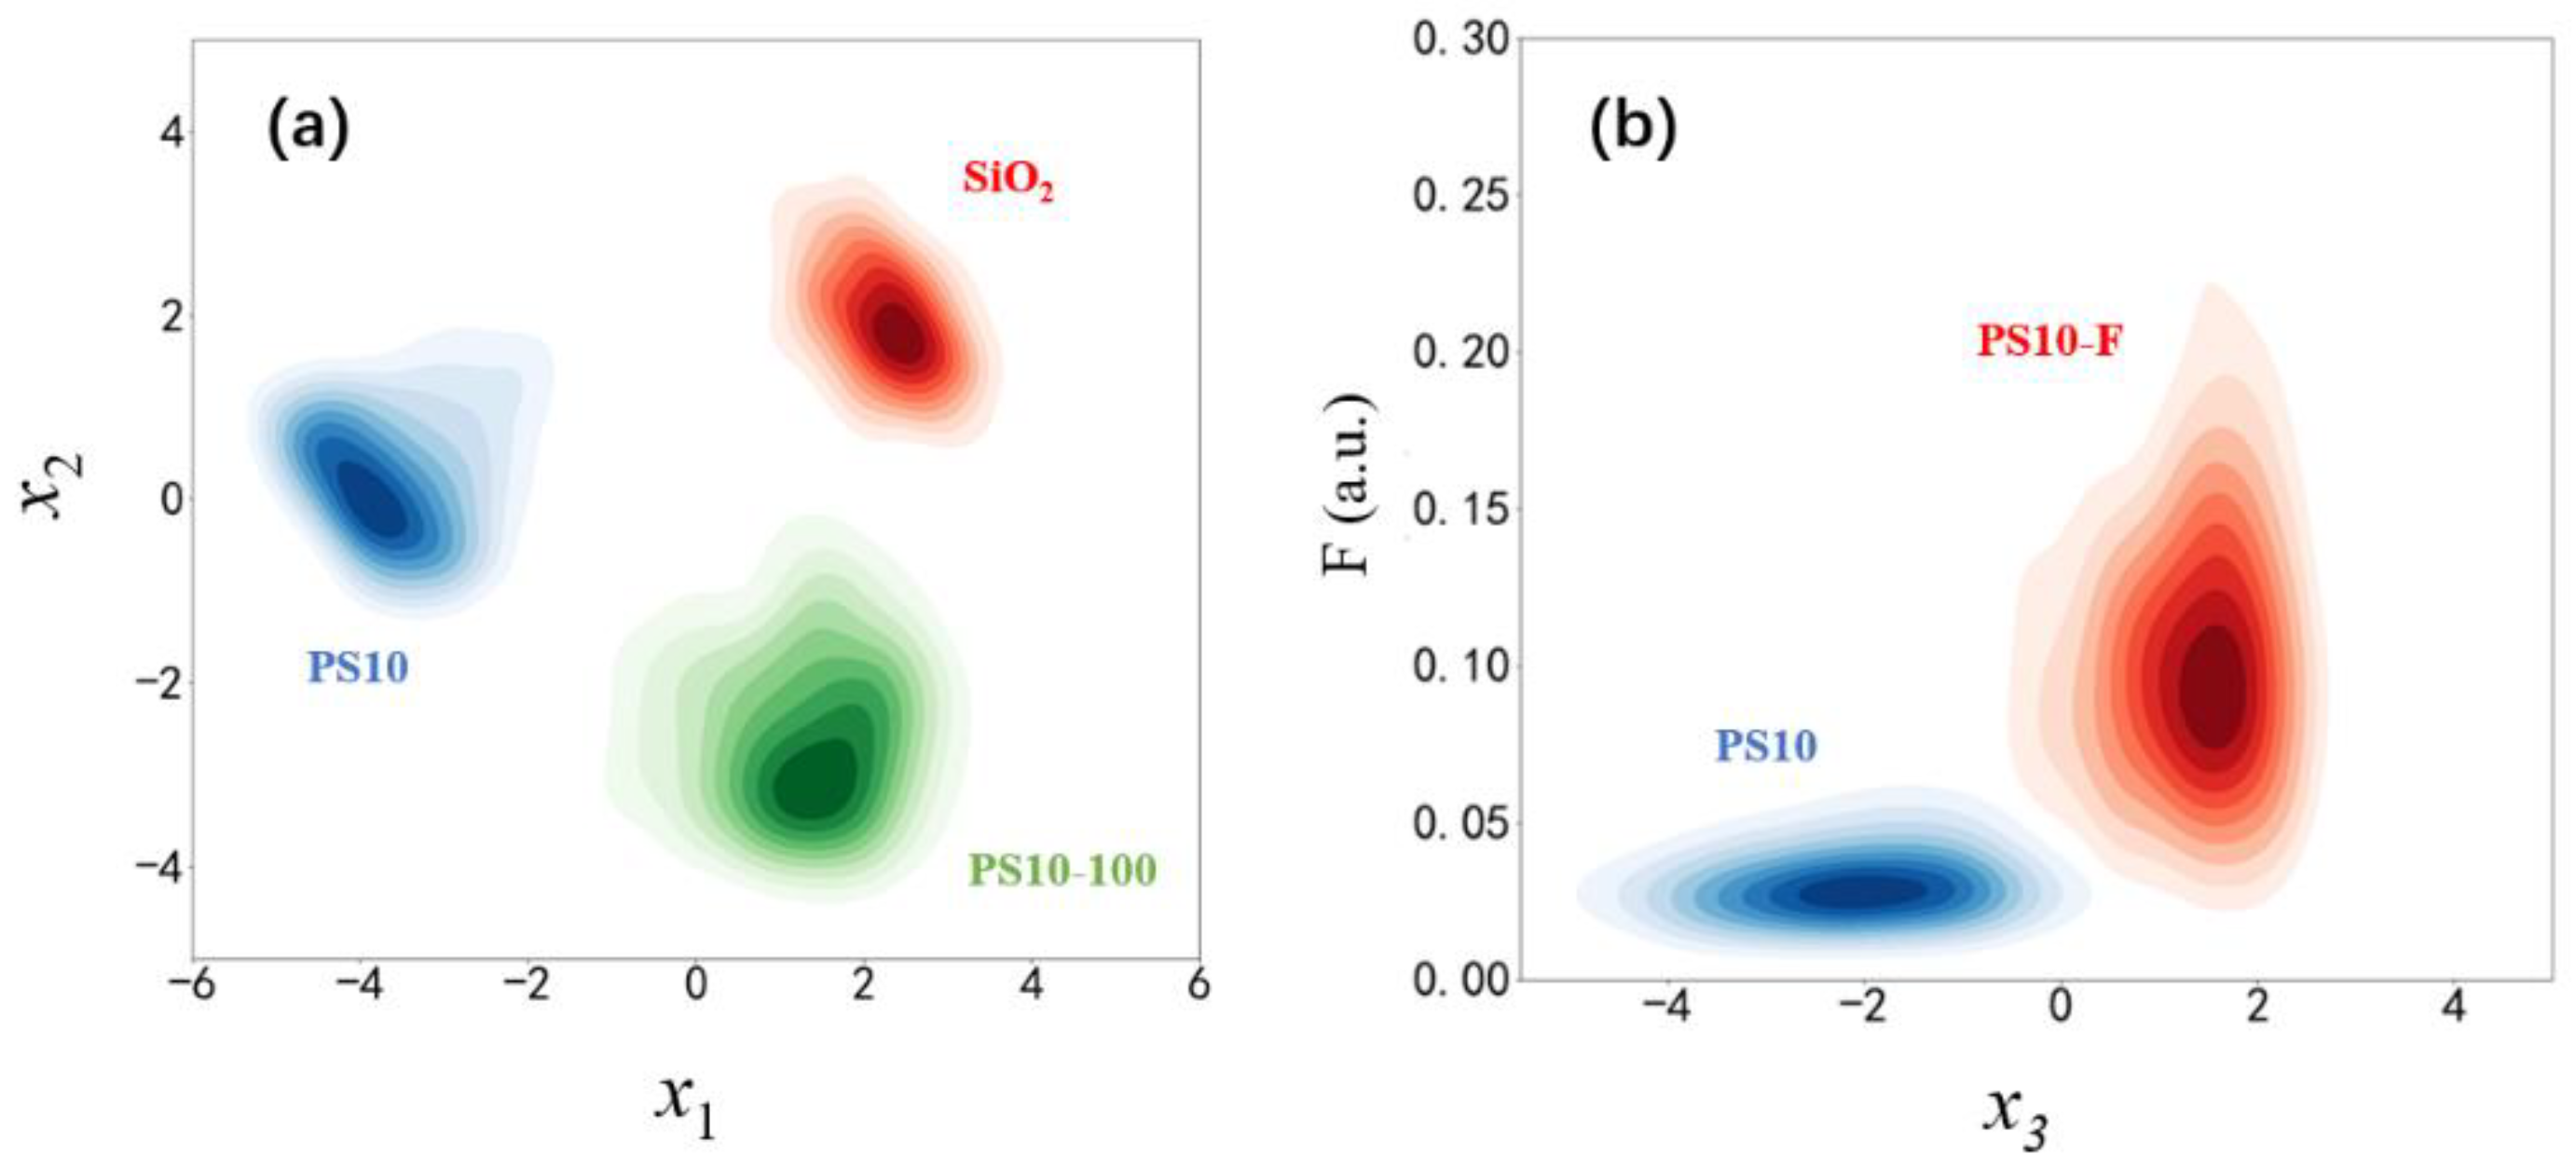
3.1. Non-Biological Particles
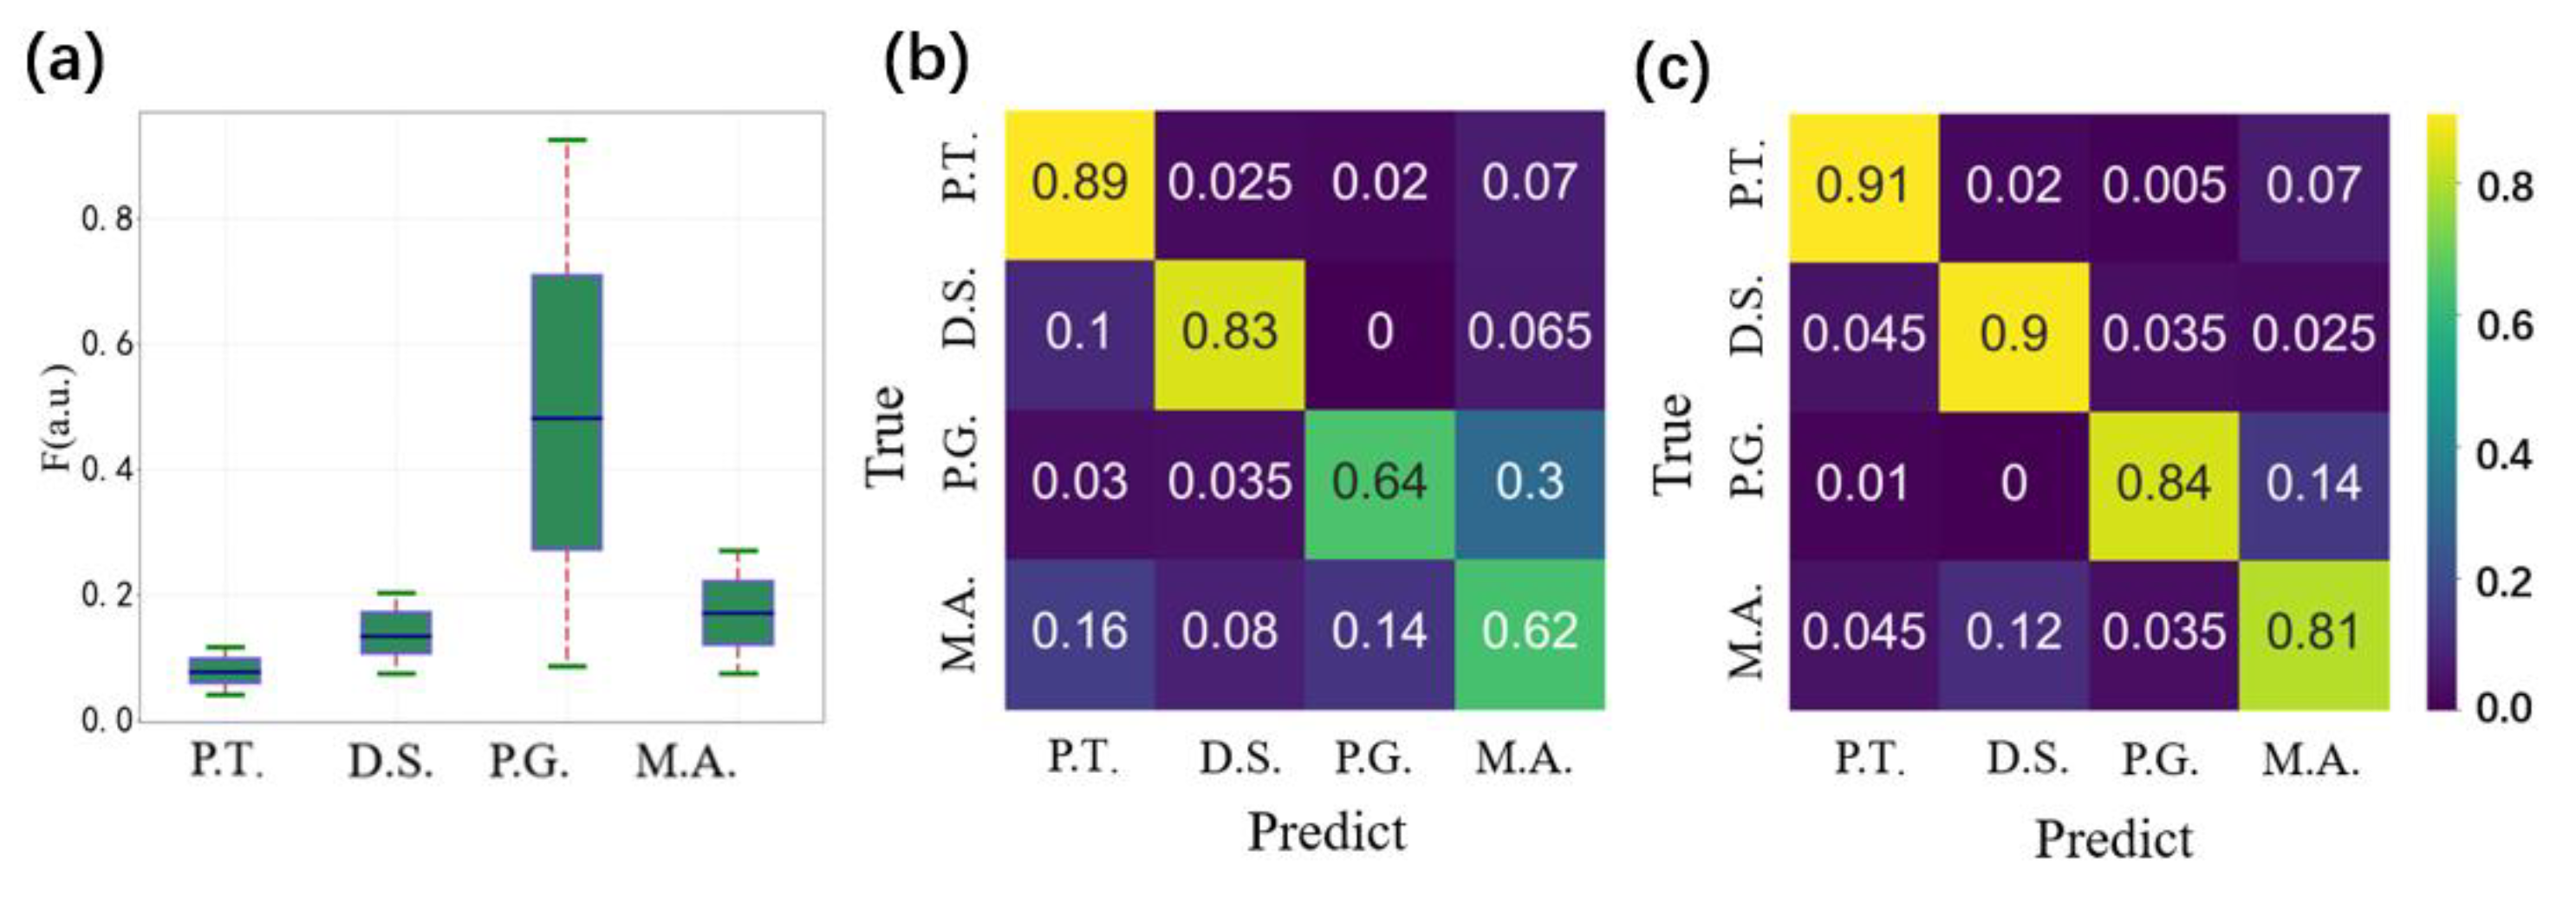
3.2. Different Categories of Microalgae
3.3. Submicron Particles Measurement
4. Discussions
5. Conclusions
Author Contributions
Funding
Institutional Review Board Statement
Informed Consent Statement
Data Availability Statement
Conflicts of Interest
References
- Neukermans, G.; Reynolds, R.A.; Stramski, D. Optical classification and characterization of marine particle assemblages within the western Arctic Ocean. Limnol. Oceanogr. 2016, 61, 1472–1494. [Google Scholar] [CrossRef]
- Embleton, K.V.; Gibson, C.E.; Heaney, S.I. Automated counting of phytoplankton by pattern recognition: A comparison with a manual counting method. J. Plankton Res. 2003, 25, 669–681. [Google Scholar] [CrossRef] [Green Version]
- Jaffe, J.S. Underwater Optical Imaging: The Past, the Present, and the Prospects. IEEE J. Ocean. Eng. 2015, 40, 683–700. [Google Scholar] [CrossRef]
- Koestner, D.; Stramski, D.; Reynolds, R.A. Assessing the effects of particle size and composition on light scattering through measurements of size-fractionated seawater samples. Limnol. Oceanogr. 2020, 65, 173–190. [Google Scholar] [CrossRef] [Green Version]
- Peng, F.; Effler, S.W.; Pierson, D.C.; Smith, D.G. Light-scattering features of turbidity-causing particles in interconnected reservoir basins and a connecting stream. Water Res. 2009, 43, 2280–2292. [Google Scholar] [CrossRef]
- Svensen, O.; Stamnes, J.J.; Kildemo, M.; Aas, L.M.S.; Erga, S.R.; Frette, O. Mueller matrix measurements of algae with different shape and size distributions. Appl. Opt. 2011, 50, 5149–5157. [Google Scholar] [CrossRef] [PubMed]
- Li, J.; Liao, R.; Tao, Y.; Zhuo, Z.; Liu, Z.; Deng, H.; Ma, H. Probing the Cyanobacterial Microcystis Gas Vesicles after Static Pressure Treatment: A Potential in Situ Rapid Method. Sensors 2020, 20, 4170. [Google Scholar] [CrossRef]
- Dong, Y.; Liu, S.; Shen, Y.; He, H.; Ma, H. Probing variations of fibrous structures during the development of breast ductal carcinoma tissues via quantitative Mueller matrix imaging. Biomed. Opt. Express 2020, 11, 4960–4975. [Google Scholar] [CrossRef] [PubMed]
- Liao, R.; Zeng, N.; Zeng, M.; Ma, H. Estimation and extraction of the aerosol complex refractive index based on Stokes vector measurements. Opt. Lett. 2019, 44, 4877–4880. [Google Scholar] [CrossRef]
- Wang, Y.; Liao, R.; Dai, J.; Liu, Z.; Xiong, Z.; Zhang, T.; Chen, H.; Hui, M. Differentiation of suspended particles by polarized light scattering at 120°. Opt. Express 2018, 26, 22419–22431. [Google Scholar] [CrossRef]
- Yang, J.; Holbach, A.; Stewardson, M.J.; Wilhelms, A.; Qin, Y.; Zheng, B.; Zou, H.; Qin, B.; Zhu, G.; Moldaenke, C.; et al. Simulating chlorophyll-a fluorescence changing rate and phycocyanin fluorescence by using a multi-sensor system in Lake Taihu, China. Chemosphere 2021, 264, 128482. [Google Scholar] [CrossRef]
- Zhao, N.; Zhang, X.; Yin, G.; Yang, R.; Hu, L.; Chen, S.; Liu, J.; Liu, W. On-line analysis of algae in water by discrete three-dimensional fluorescence spectroscopy. Opt. Express 2018, 26, A251–A259. [Google Scholar] [CrossRef] [PubMed]
- Wilkinson, M.G. Flow Cytometry in Microbiology: Technology and Applications; Caister Academic Press: Poole, Ireland, 2015. [Google Scholar]
- Adan, A.; Alizada, G.; Kiraz, Y.; Baran, Y.; Nalbant, A. Flow cytometry: Basic principles and applications. Crit. Rev. Biotechnol. 2016, 37, 163–176. [Google Scholar] [CrossRef] [PubMed]
- Steen, H.B. Flow cytometer for measurement of the light scattering of viral and other submicroscopic particles. Cytom. Part A 2004, 57, 94–99. [Google Scholar] [CrossRef] [PubMed]
- Fajardo, A.R.; Cerdan, L.E.; Medina, A.R.; Fernandez, F.G.A.; Moreno, P.A.G.; Grima, E.M. Lipid extraction from the microalga Phaeodactylum tricornutum. Eur. J. Lipid Sci. Technol. 2007, 109, 120–126. [Google Scholar] [CrossRef]
- Pisal, D.S.; Lele, S.S. Carotenoid production from microalga, Dunaliella salina. Indian. J. Biotechnol. 2005, 4, 476–483. [Google Scholar]
- Lamy, D.; Obernosterer, I.; Laghdass, M.; Artigas, F.; Breton, E.; Grattepanche, J.D.; Lecuyer, E.; Degros, N.; Lebaron, P.; Christaki, U. Temporal changes of major bacterial groups and bacterial heterotrophic activity during a Phaeocystis globosa bloom in the eastern English Channel. Aquat. Microb. Ecol. 2009, 58, 95–107. [Google Scholar] [CrossRef]
- Daly, R.I.; Ho, L.; Brookes, J.D. Effect of chlorination on Microcystis aeruginosa cell integrity and subsequent microcystin release and degradation. Environ. Sci. Technol. 2007, 41, 4447–4453. [Google Scholar] [CrossRef]
- Palenik, B.; Brahamsha, B.; Larimer, F.W.; Land, M.; Hauser, L.; Chain, P.; Lamerdin, J.; Regala, W.; Allen, E.E.; McCarren, J.; et al. The genome of a motile marine Synechococcus. Nature 2003, 424, 1037–1042. [Google Scholar] [CrossRef] [Green Version]
- Toklu-Alicli, B.; Polat, S.; Balkis-Ozdelice, N. Temporal variations in the abundance of picoplanktonic Synechococcus (Cyanobacteria) during a mucilage event in the Gulfs of Bandırma and Erdek. Estuar. Coast. Shelf Sci. 2020, 233, 106513. [Google Scholar] [CrossRef]
- Hasunuma, T.; Kikuyama, F.; Matsuda, M.; Aikawa, S.; Izumi, Y.; Kondo, A. Dynamic metabolic profiling of cyanobacterial glycogen biosynthesis under conditions of nitrate depletion. J. Exp. Bot. 2013, 64, 2943–2954. [Google Scholar] [CrossRef] [PubMed] [Green Version]
- Li, J.; Wang, H.; Liao, R.; Wang, Y.; Liu, Z.; Zhuo, Z.; Guo, Z.; Ma, H. Statistical Mueller matrix driven discrimination of suspended particles. Opt. Lett. 2021, 46, 3645–3648. [Google Scholar] [CrossRef] [PubMed]
- Morel, O.; Seulin, R.; Fofi, D. Handy method to calibrate division-of-amplitude polarimeters for the first three Stokes parameters. Opt. Express 2016, 24, 13634–13646. [Google Scholar] [CrossRef]
- Yan, C.; Chang, X.; Luo, M.; Zheng, Q.; Zhang, X.; Li, Z.; Nie, F. Self-weighted Robust LDA for Multiclass Classification with Edge Classes. ACM Trans. Intell. Syst. Technol. 2021, 12, 4. [Google Scholar] [CrossRef]
- Chang, C.C.; Lin, C.J. Libsvm: A Library for Support Vector Machines. ACM Trans. Intell. Syst. Technol. 2011, 2, 27. [Google Scholar] [CrossRef]
- Sosik, H.M.; Mitchell, B.G. Absorption, fluorescence, and quantum yield for growth in nitrogen-limited Dunaliella tertiolecta. Lomnol. Oceanogr. 1991, 36, 910–921. [Google Scholar] [CrossRef]
- Li, T.; Bi, Y.; Liu, J.; Wu, C. Effects of laser irradiation on a bloom forming cyanobacterium Microcystis aeruginosa. Environ. Sci. Pollut. Res. 2016, 23, 20297–20306. [Google Scholar] [CrossRef]


Publisher’s Note: MDPI stays neutral with regard to jurisdictional claims in published maps and institutional affiliations. |
© 2021 by the authors. Licensee MDPI, Basel, Switzerland. This article is an open access article distributed under the terms and conditions of the Creative Commons Attribution (CC BY) license (https://creativecommons.org/licenses/by/4.0/).
Share and Cite
Xiong, Z.; Wang, H.; Li, J.; Liao, R.; Mai, H.; Guan, C.; Guo, Z.; Yang, S.; Chen, Y.; Liu, B.; et al. Probing Individual Particles in Aquatic Suspensions by Simultaneously Measuring Polarized Light Scattering and Fluorescence. Biosensors 2021, 11, 416. https://doi.org/10.3390/bios11110416
Xiong Z, Wang H, Li J, Liao R, Mai H, Guan C, Guo Z, Yang S, Chen Y, Liu B, et al. Probing Individual Particles in Aquatic Suspensions by Simultaneously Measuring Polarized Light Scattering and Fluorescence. Biosensors. 2021; 11(11):416. https://doi.org/10.3390/bios11110416
Chicago/Turabian StyleXiong, Zhihang, Hongjian Wang, Jiajin Li, Ran Liao, Haoji Mai, Caizhong Guan, Zhiming Guo, Shangpan Yang, Yan Chen, Biwang Liu, and et al. 2021. "Probing Individual Particles in Aquatic Suspensions by Simultaneously Measuring Polarized Light Scattering and Fluorescence" Biosensors 11, no. 11: 416. https://doi.org/10.3390/bios11110416