A Rapid Immunochromatographic Method Based on a Secondary Antibody-Labelled Magnetic Nanoprobe for the Detection of Hepatitis B preS2 Surface Antigen


Abstract
:1. Introduction
2. Materials and Methods
2.1. Materials
2.2. Preparation of preS2Ag-BSA Conjugates
2.3. Preparation of GAM-MNPs
2.4. Preparation of GAM-MNPs-ICA Test Strips
2.5. Detection Procedure of GAM-MNPs-ICA
2.6. Detection Condition Optimization of GAM-MNPs-ICA
2.7. Detection Performance Evaluation
2.7.1. Sensitivity
2.7.2. Specificity
2.7.3. Accuracy Validation
2.7.4. Stability
2.7.5. Reproducibility
2.8. Clinical Sample Analysis
3. Results
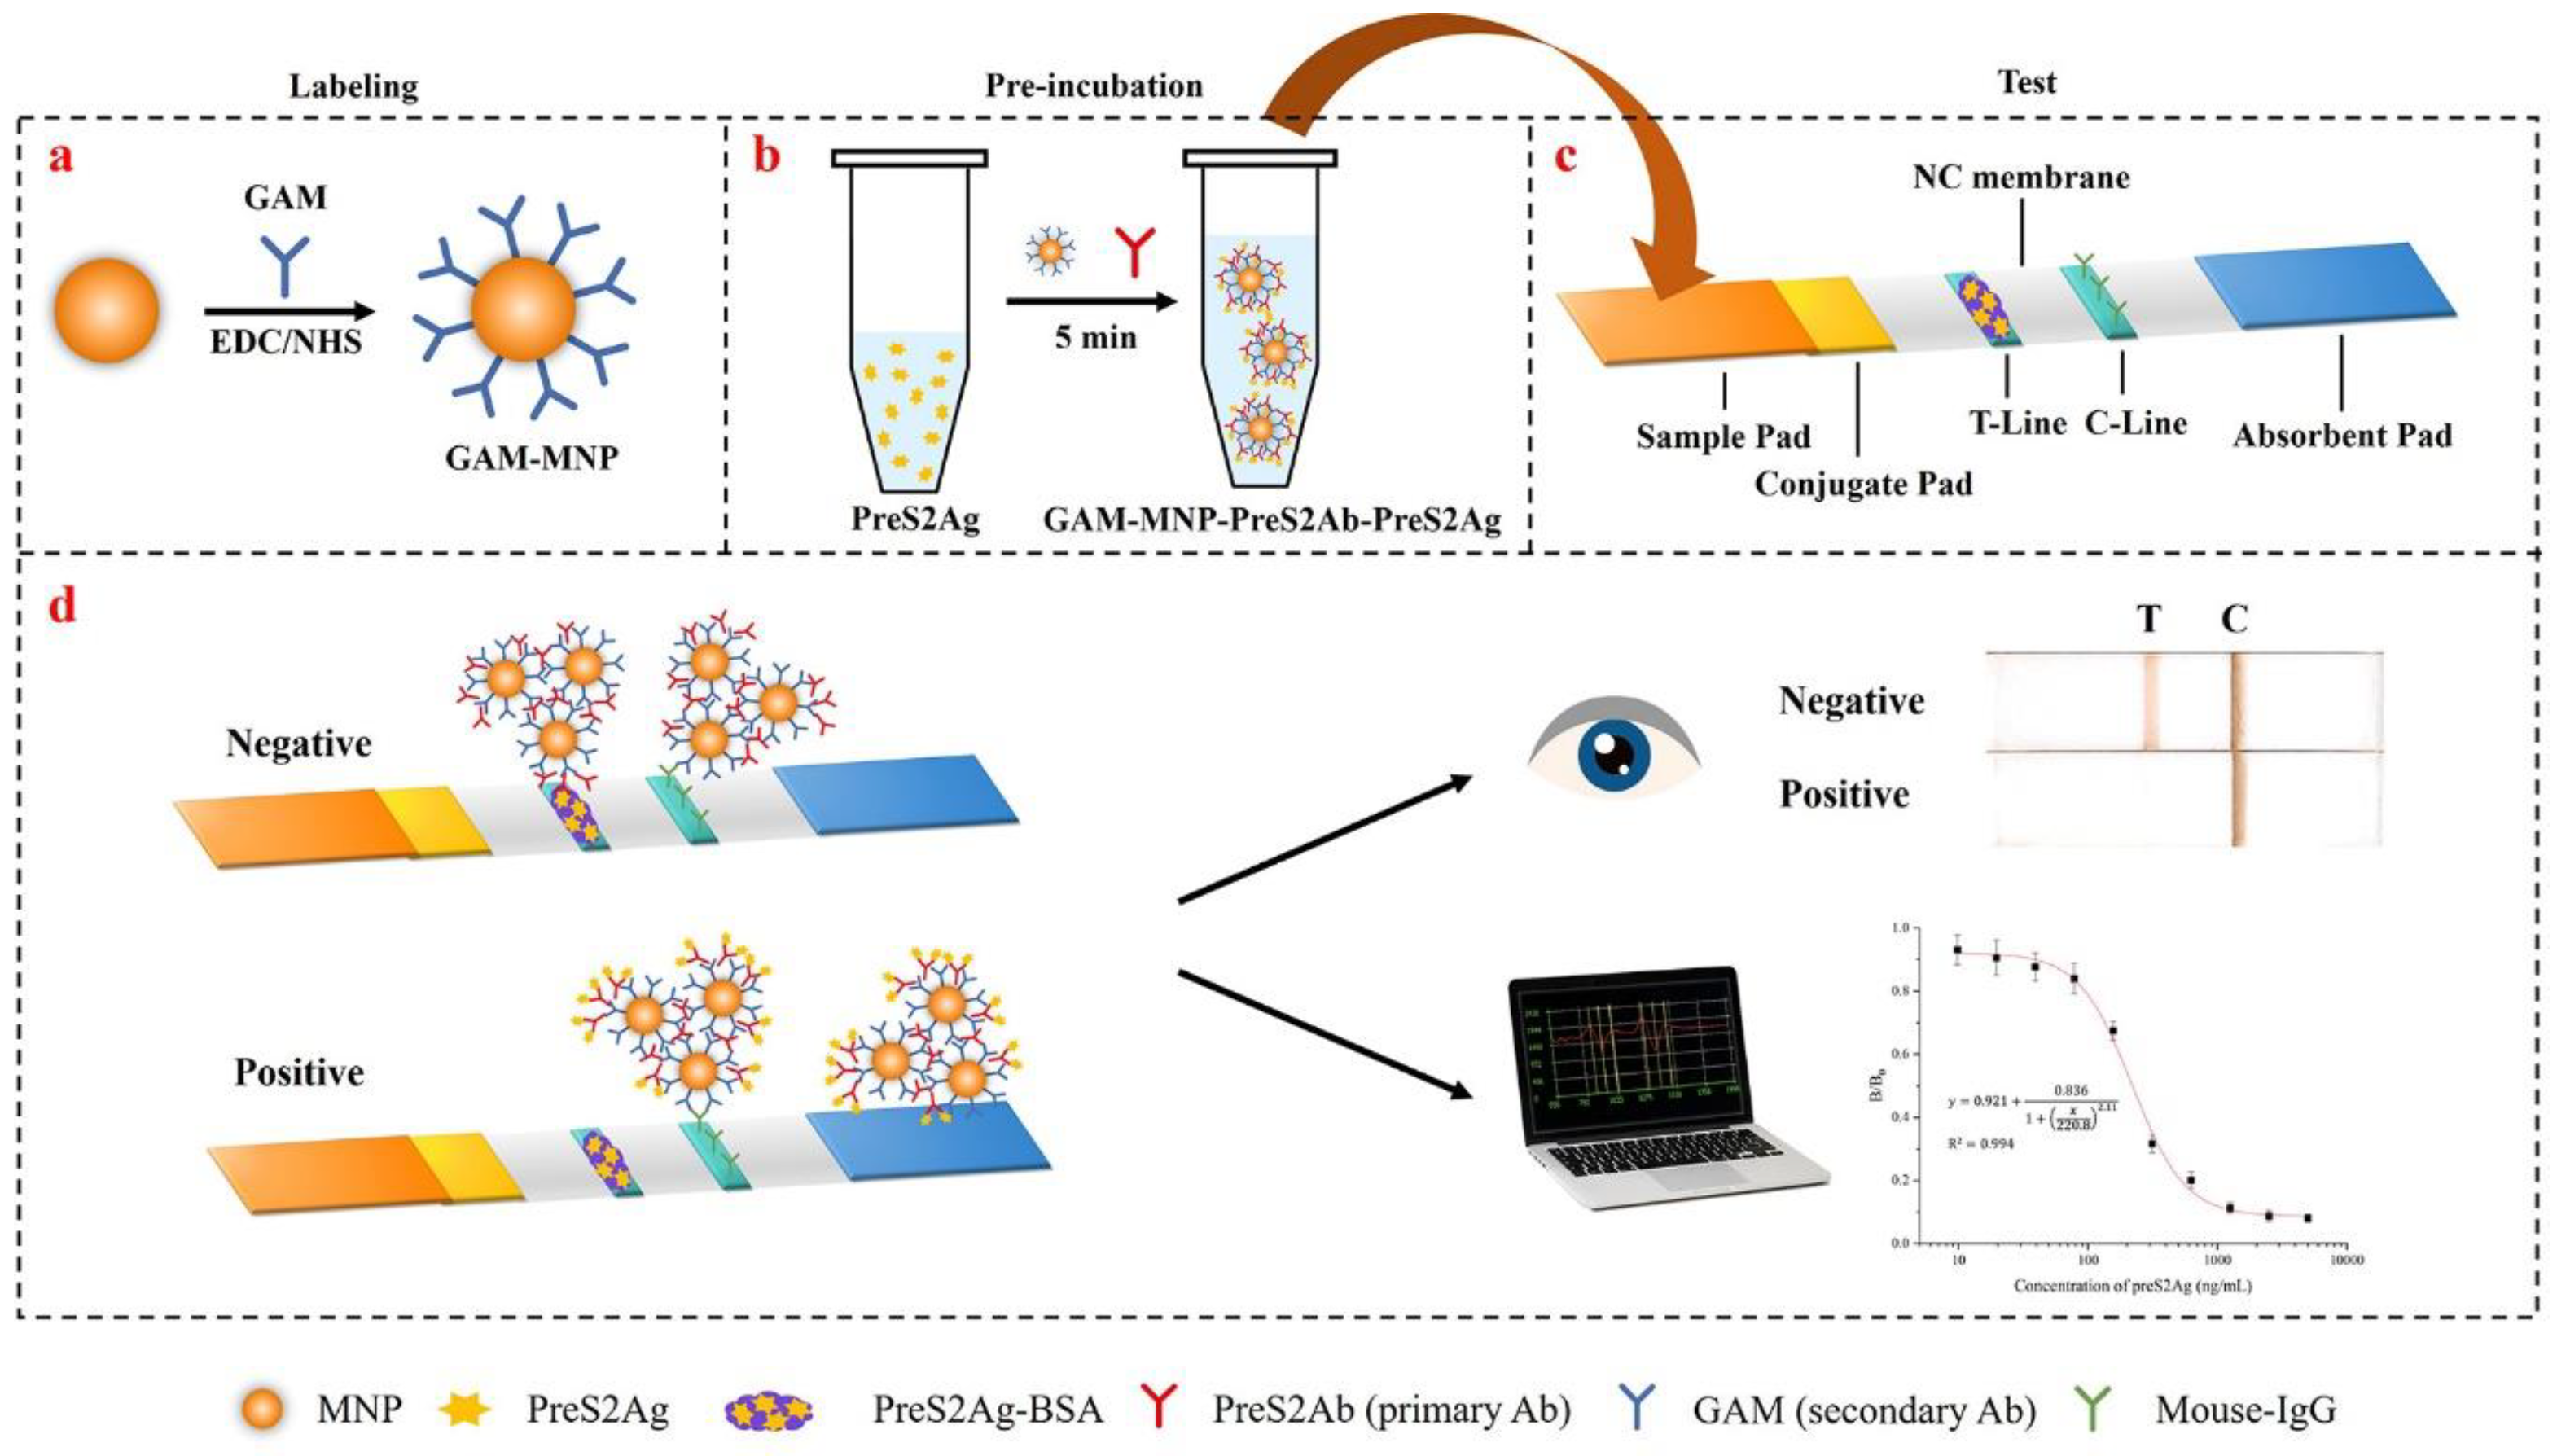
3.1. Detection Principle of GAM-MNPs-ICA
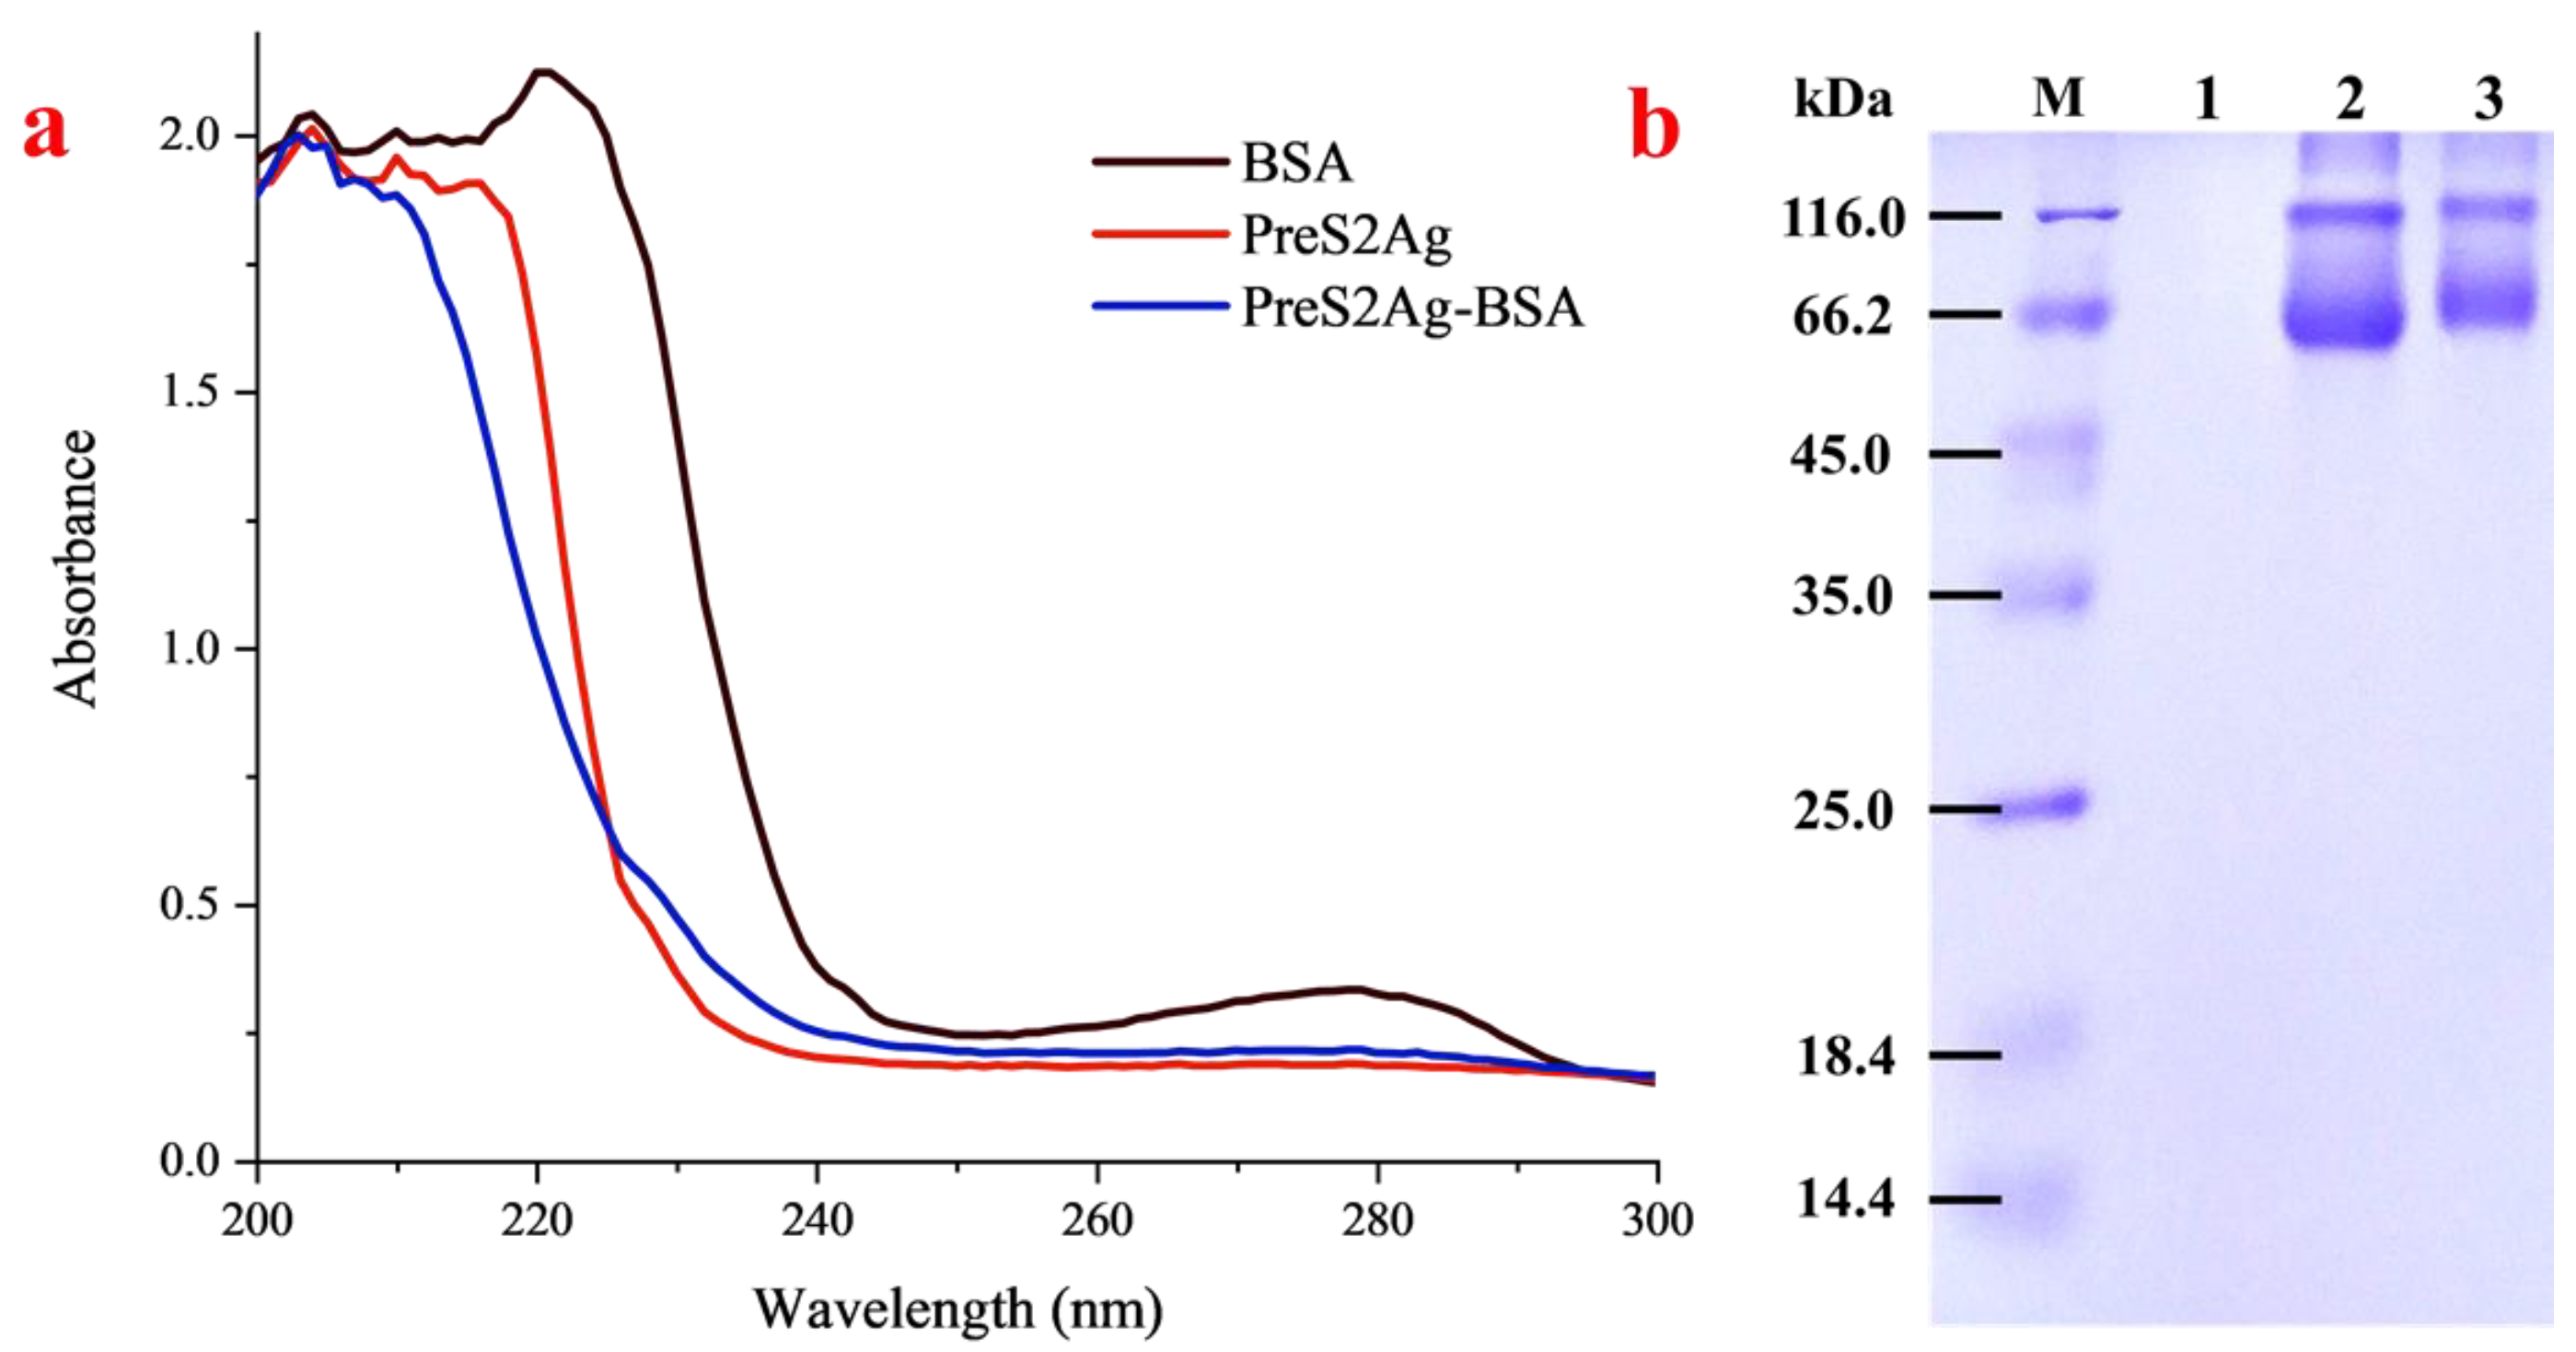
3.2. Characterization of Conjugated Antigen
3.3. Optimization of Detection Conditions
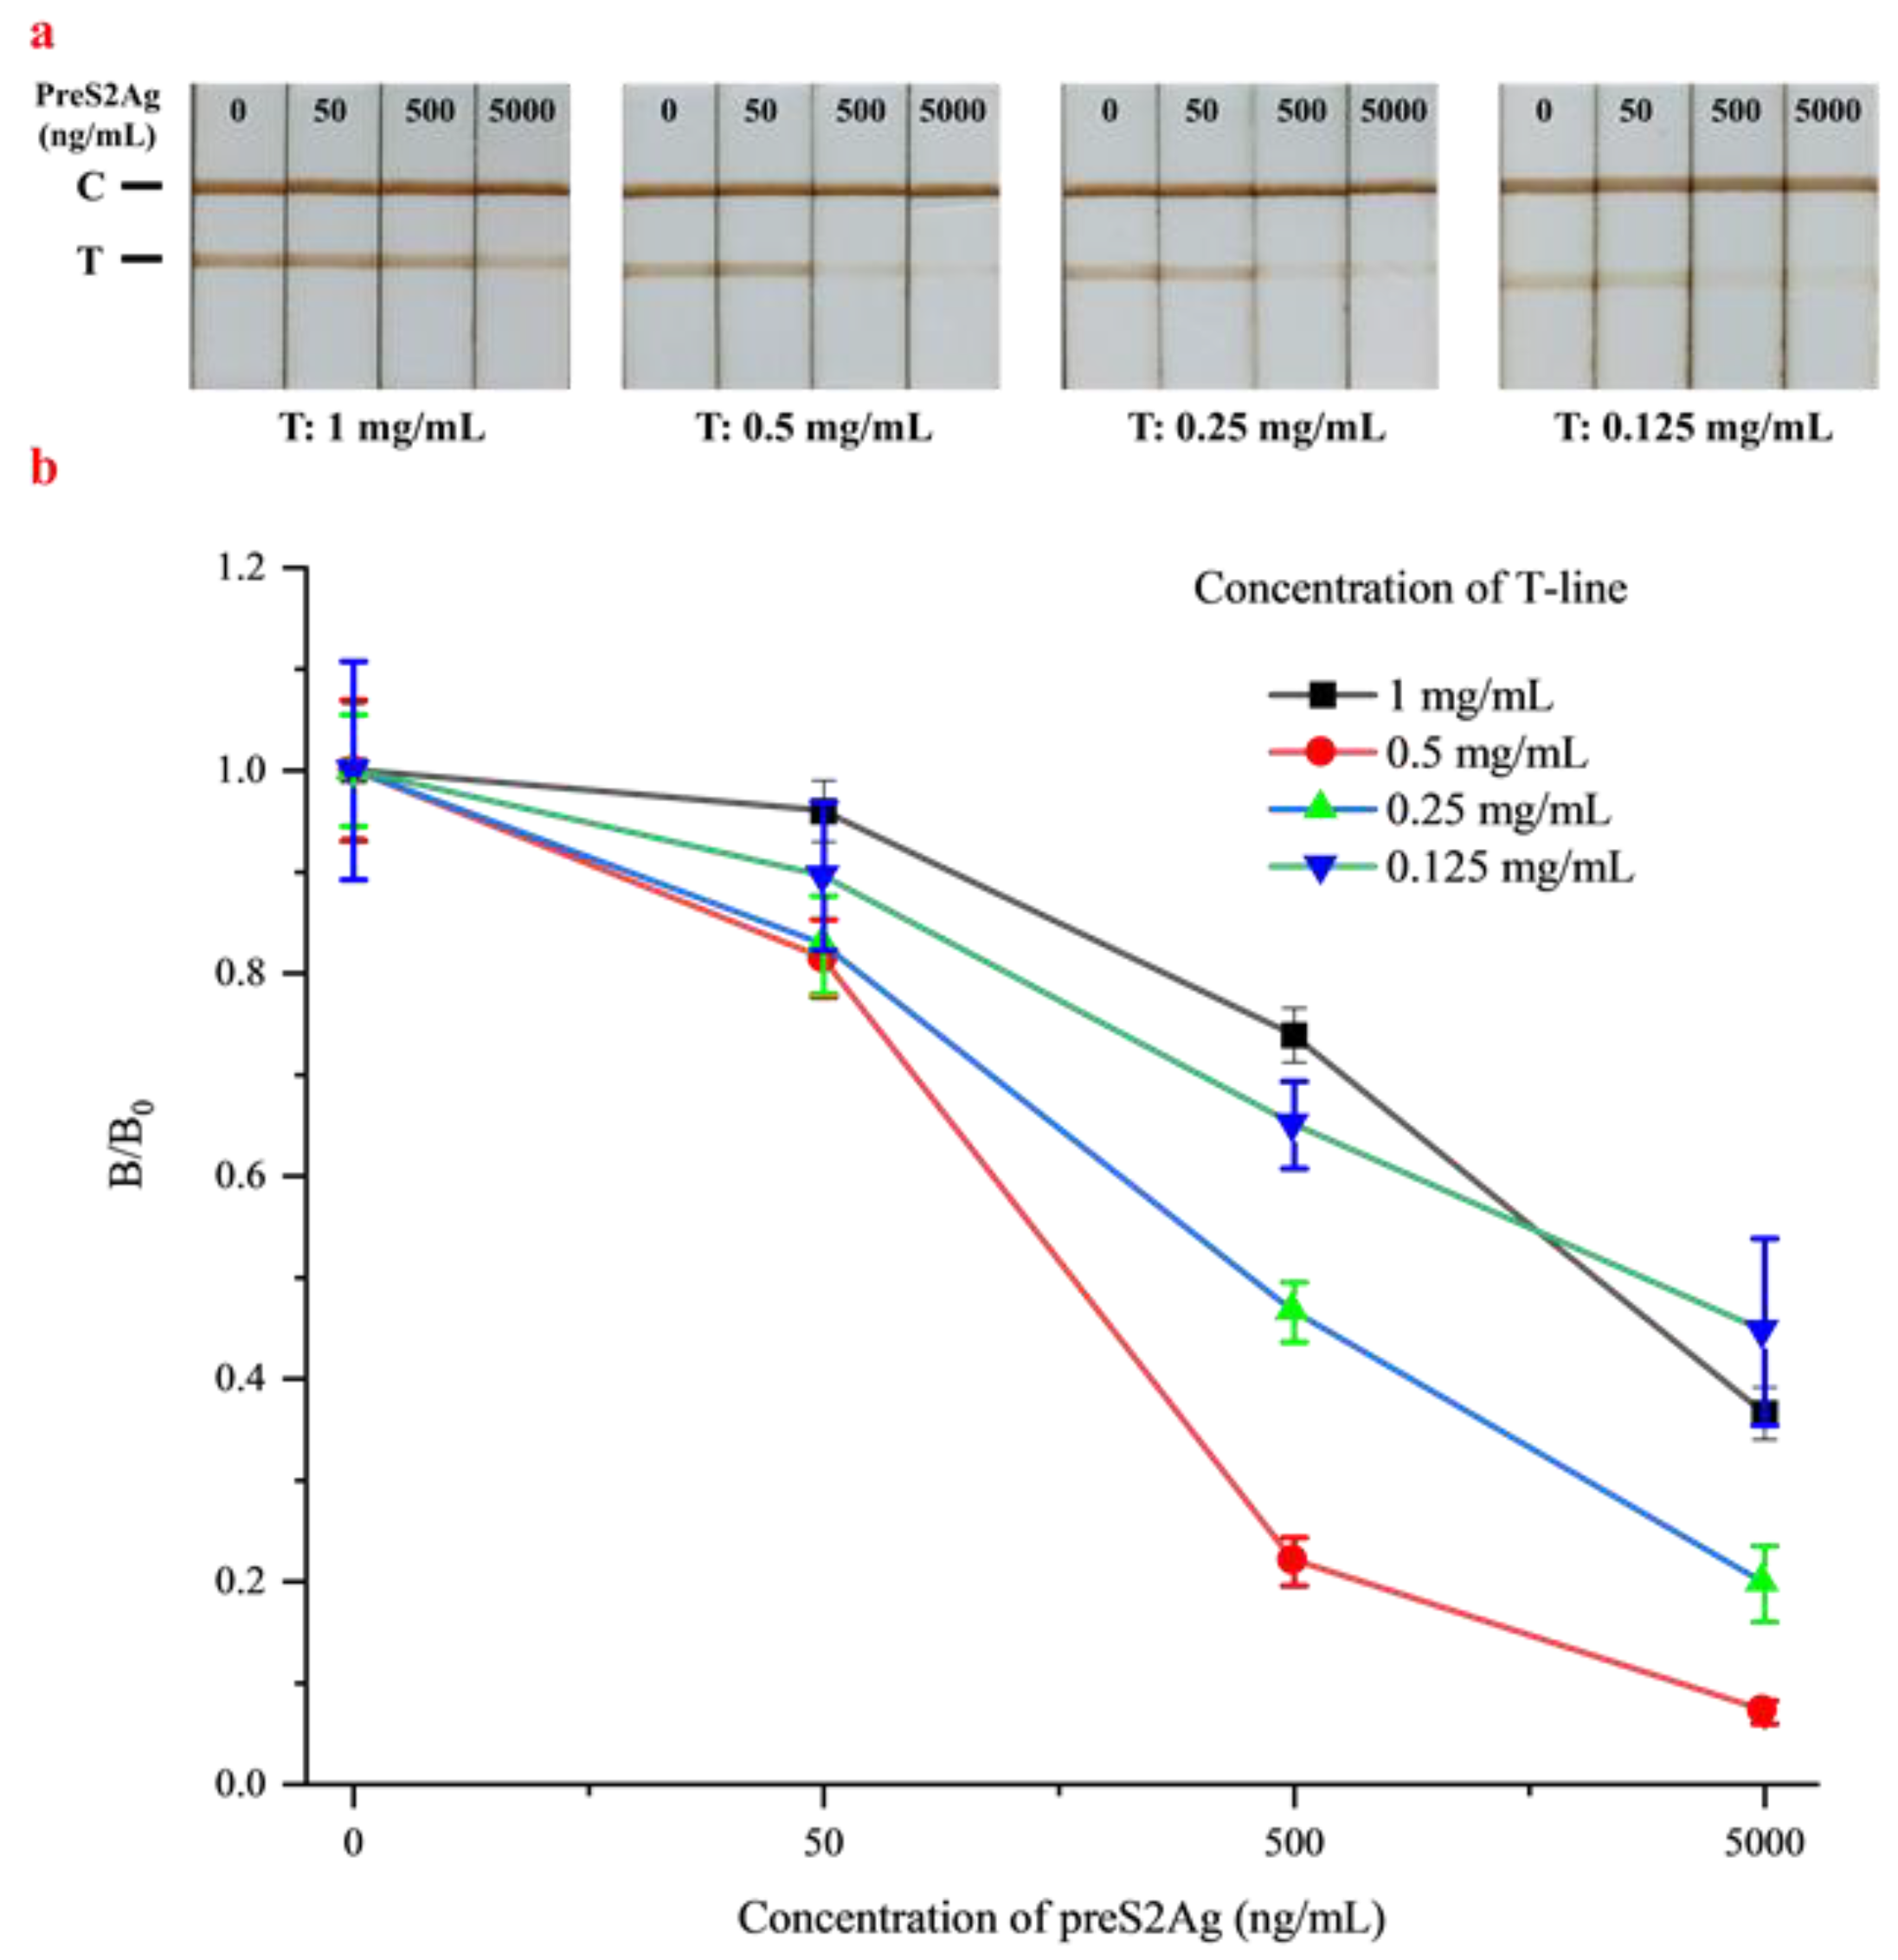
3.3.1. Optimization of the T-line Concentration
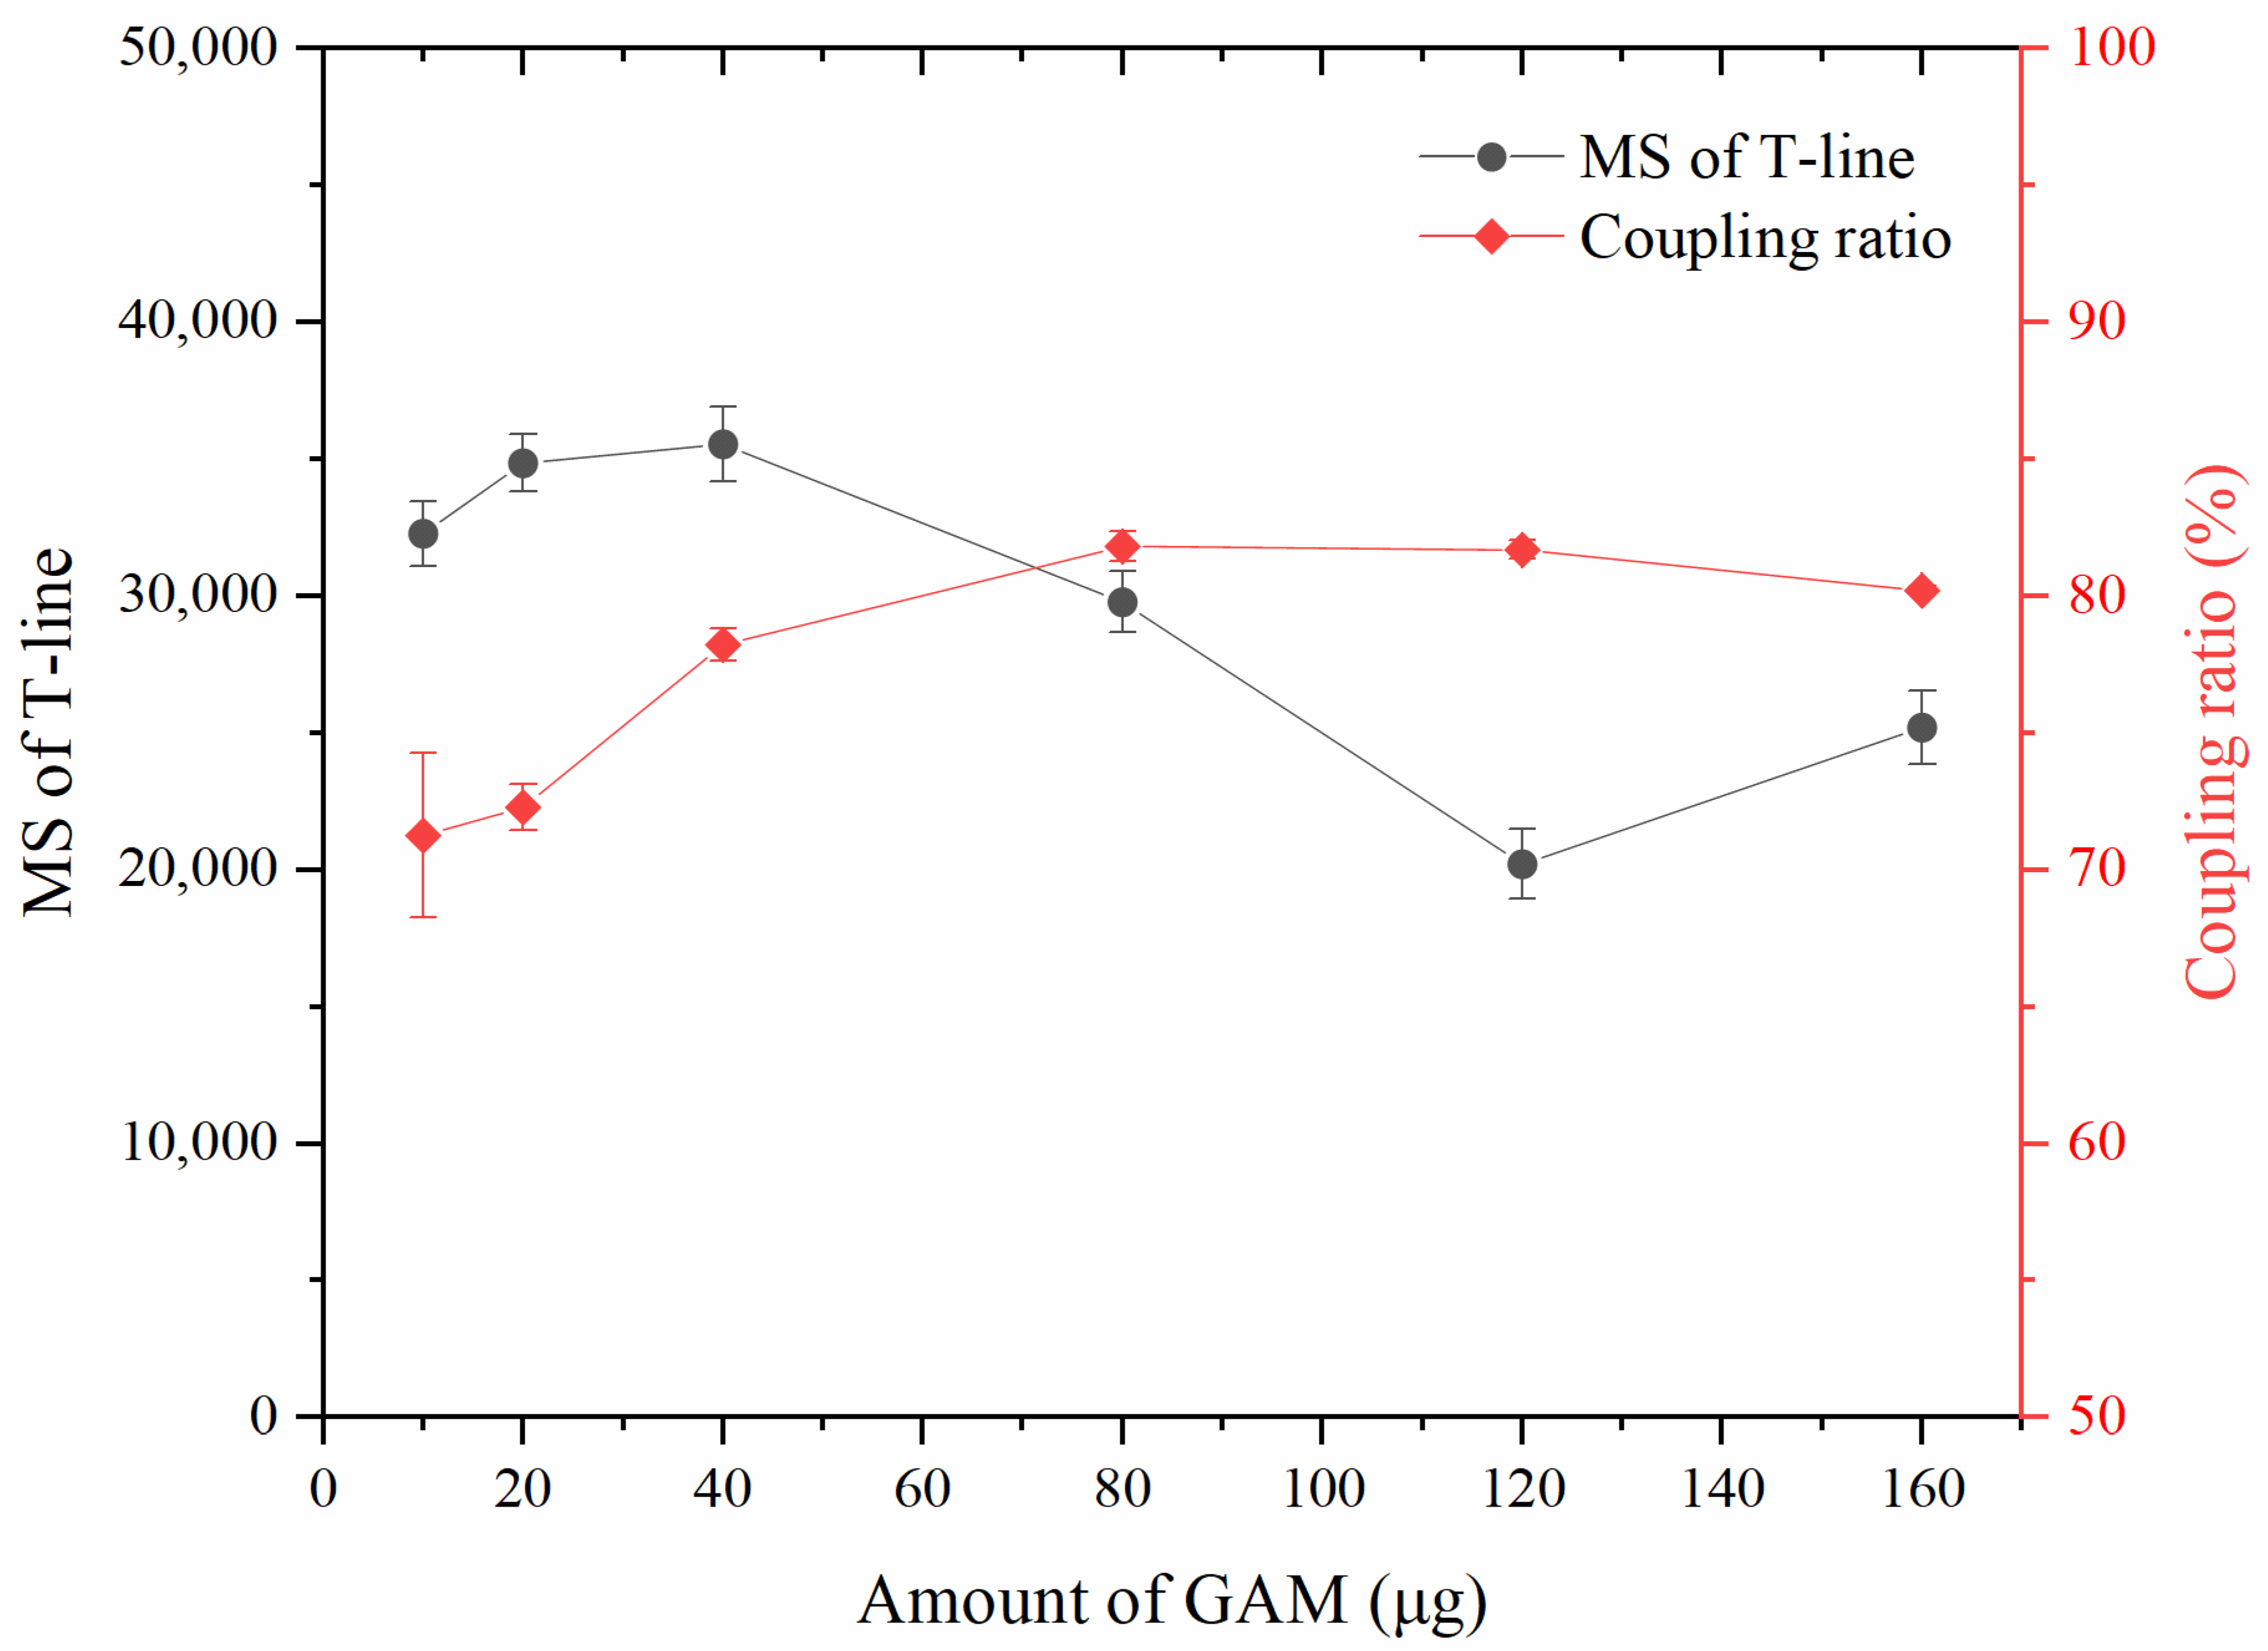
3.3.2. Optimization of the GAM Amount Coupled with MNPs
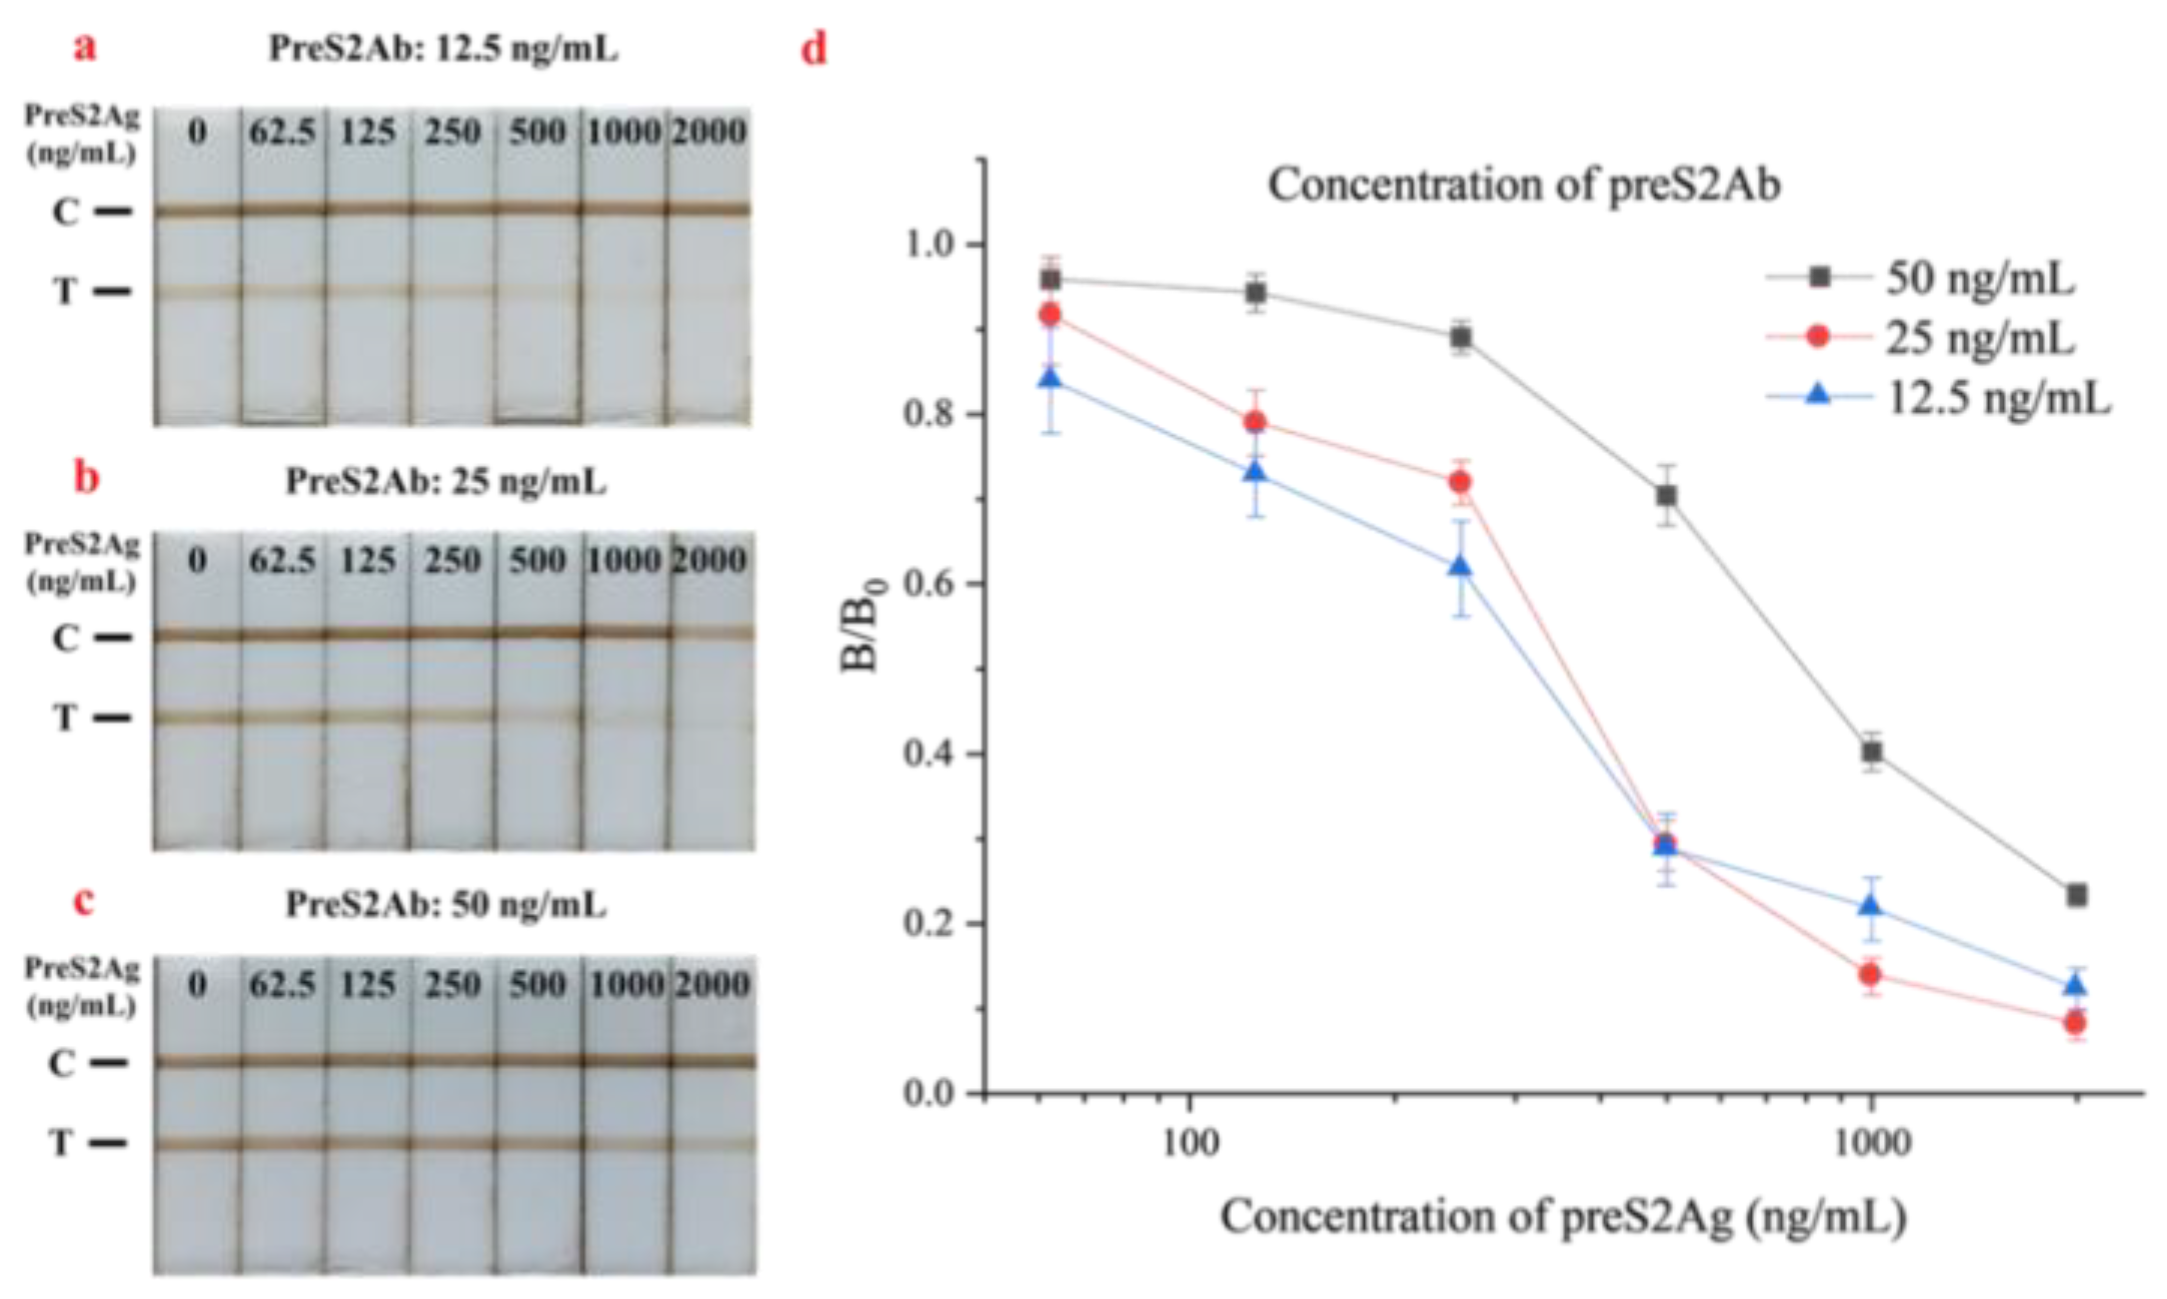
3.3.3. Optimization of the preS2Ab Concentration in the Pre-Incubation Solution
3.4. Performance Evaluation of GAM-MNPs-ICA
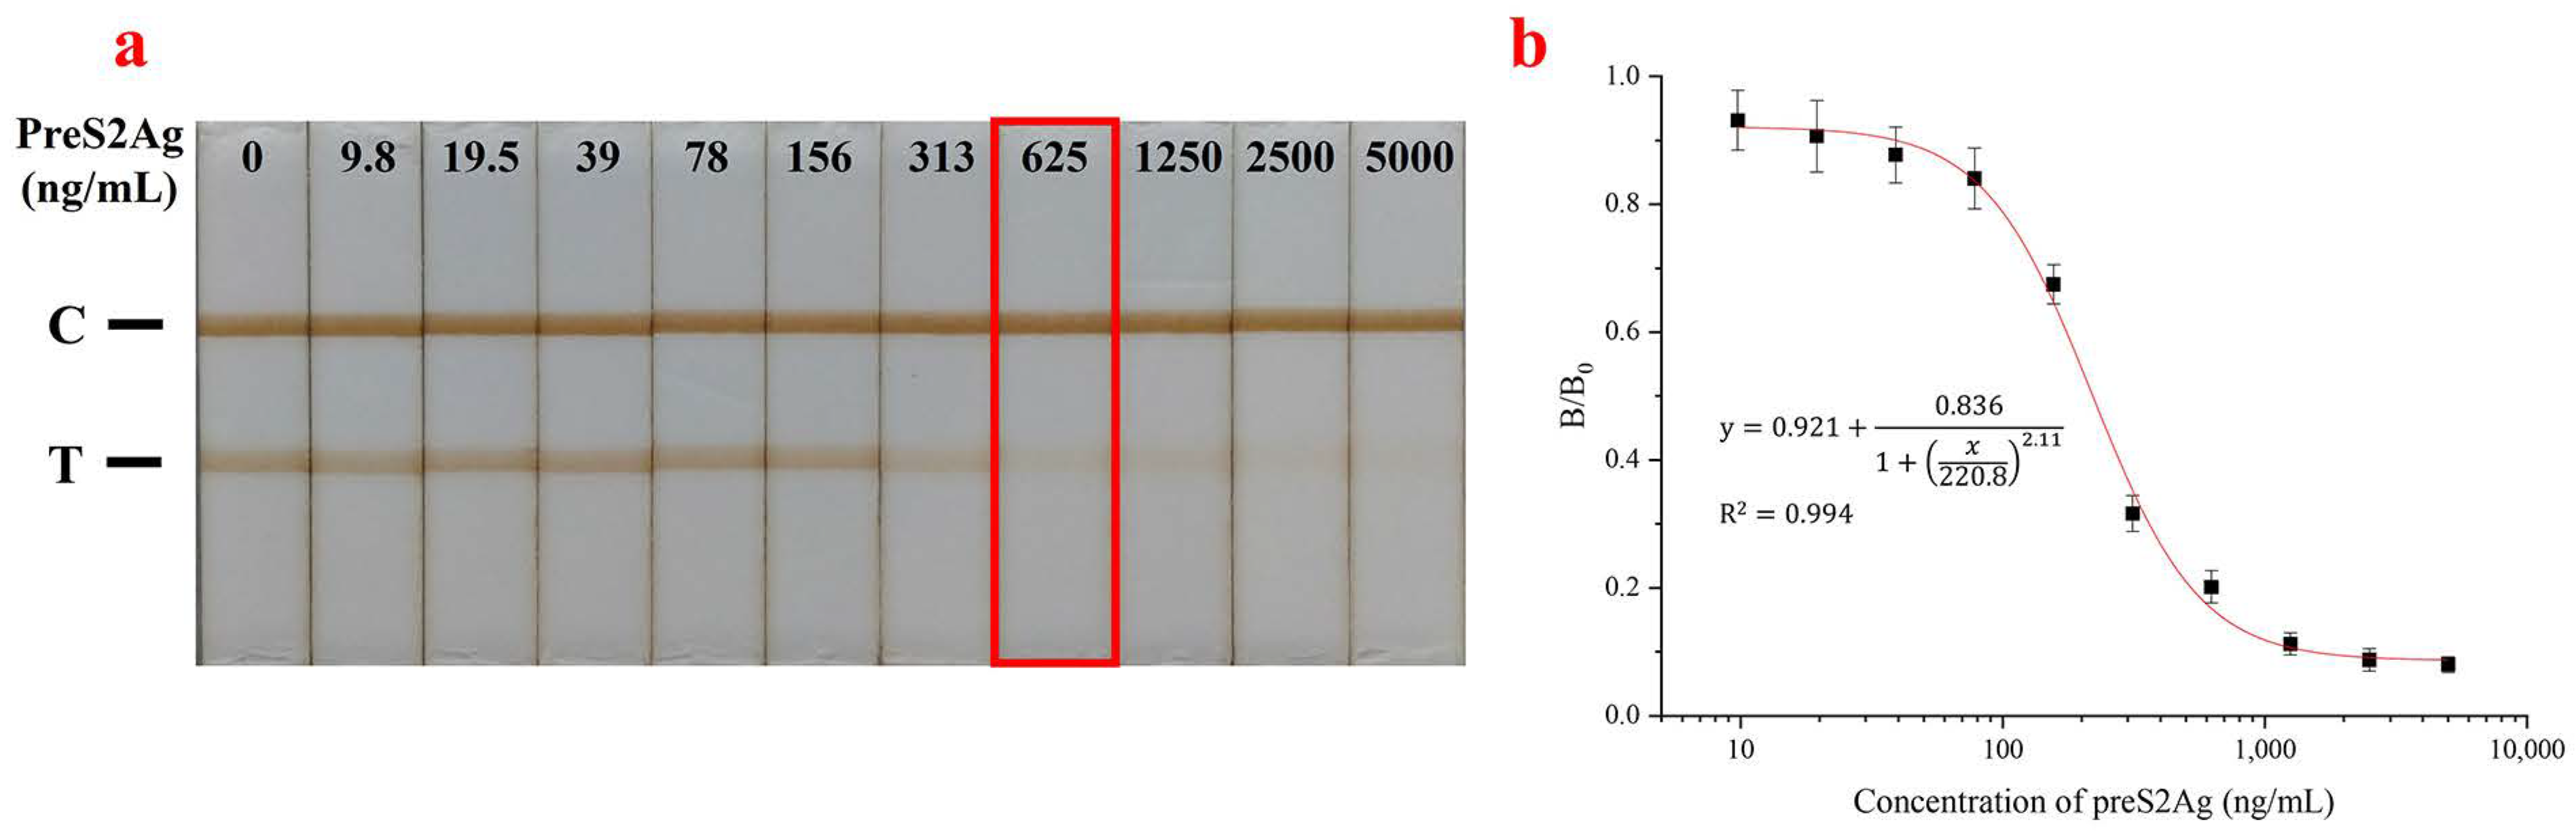
3.4.1. Sensitivity
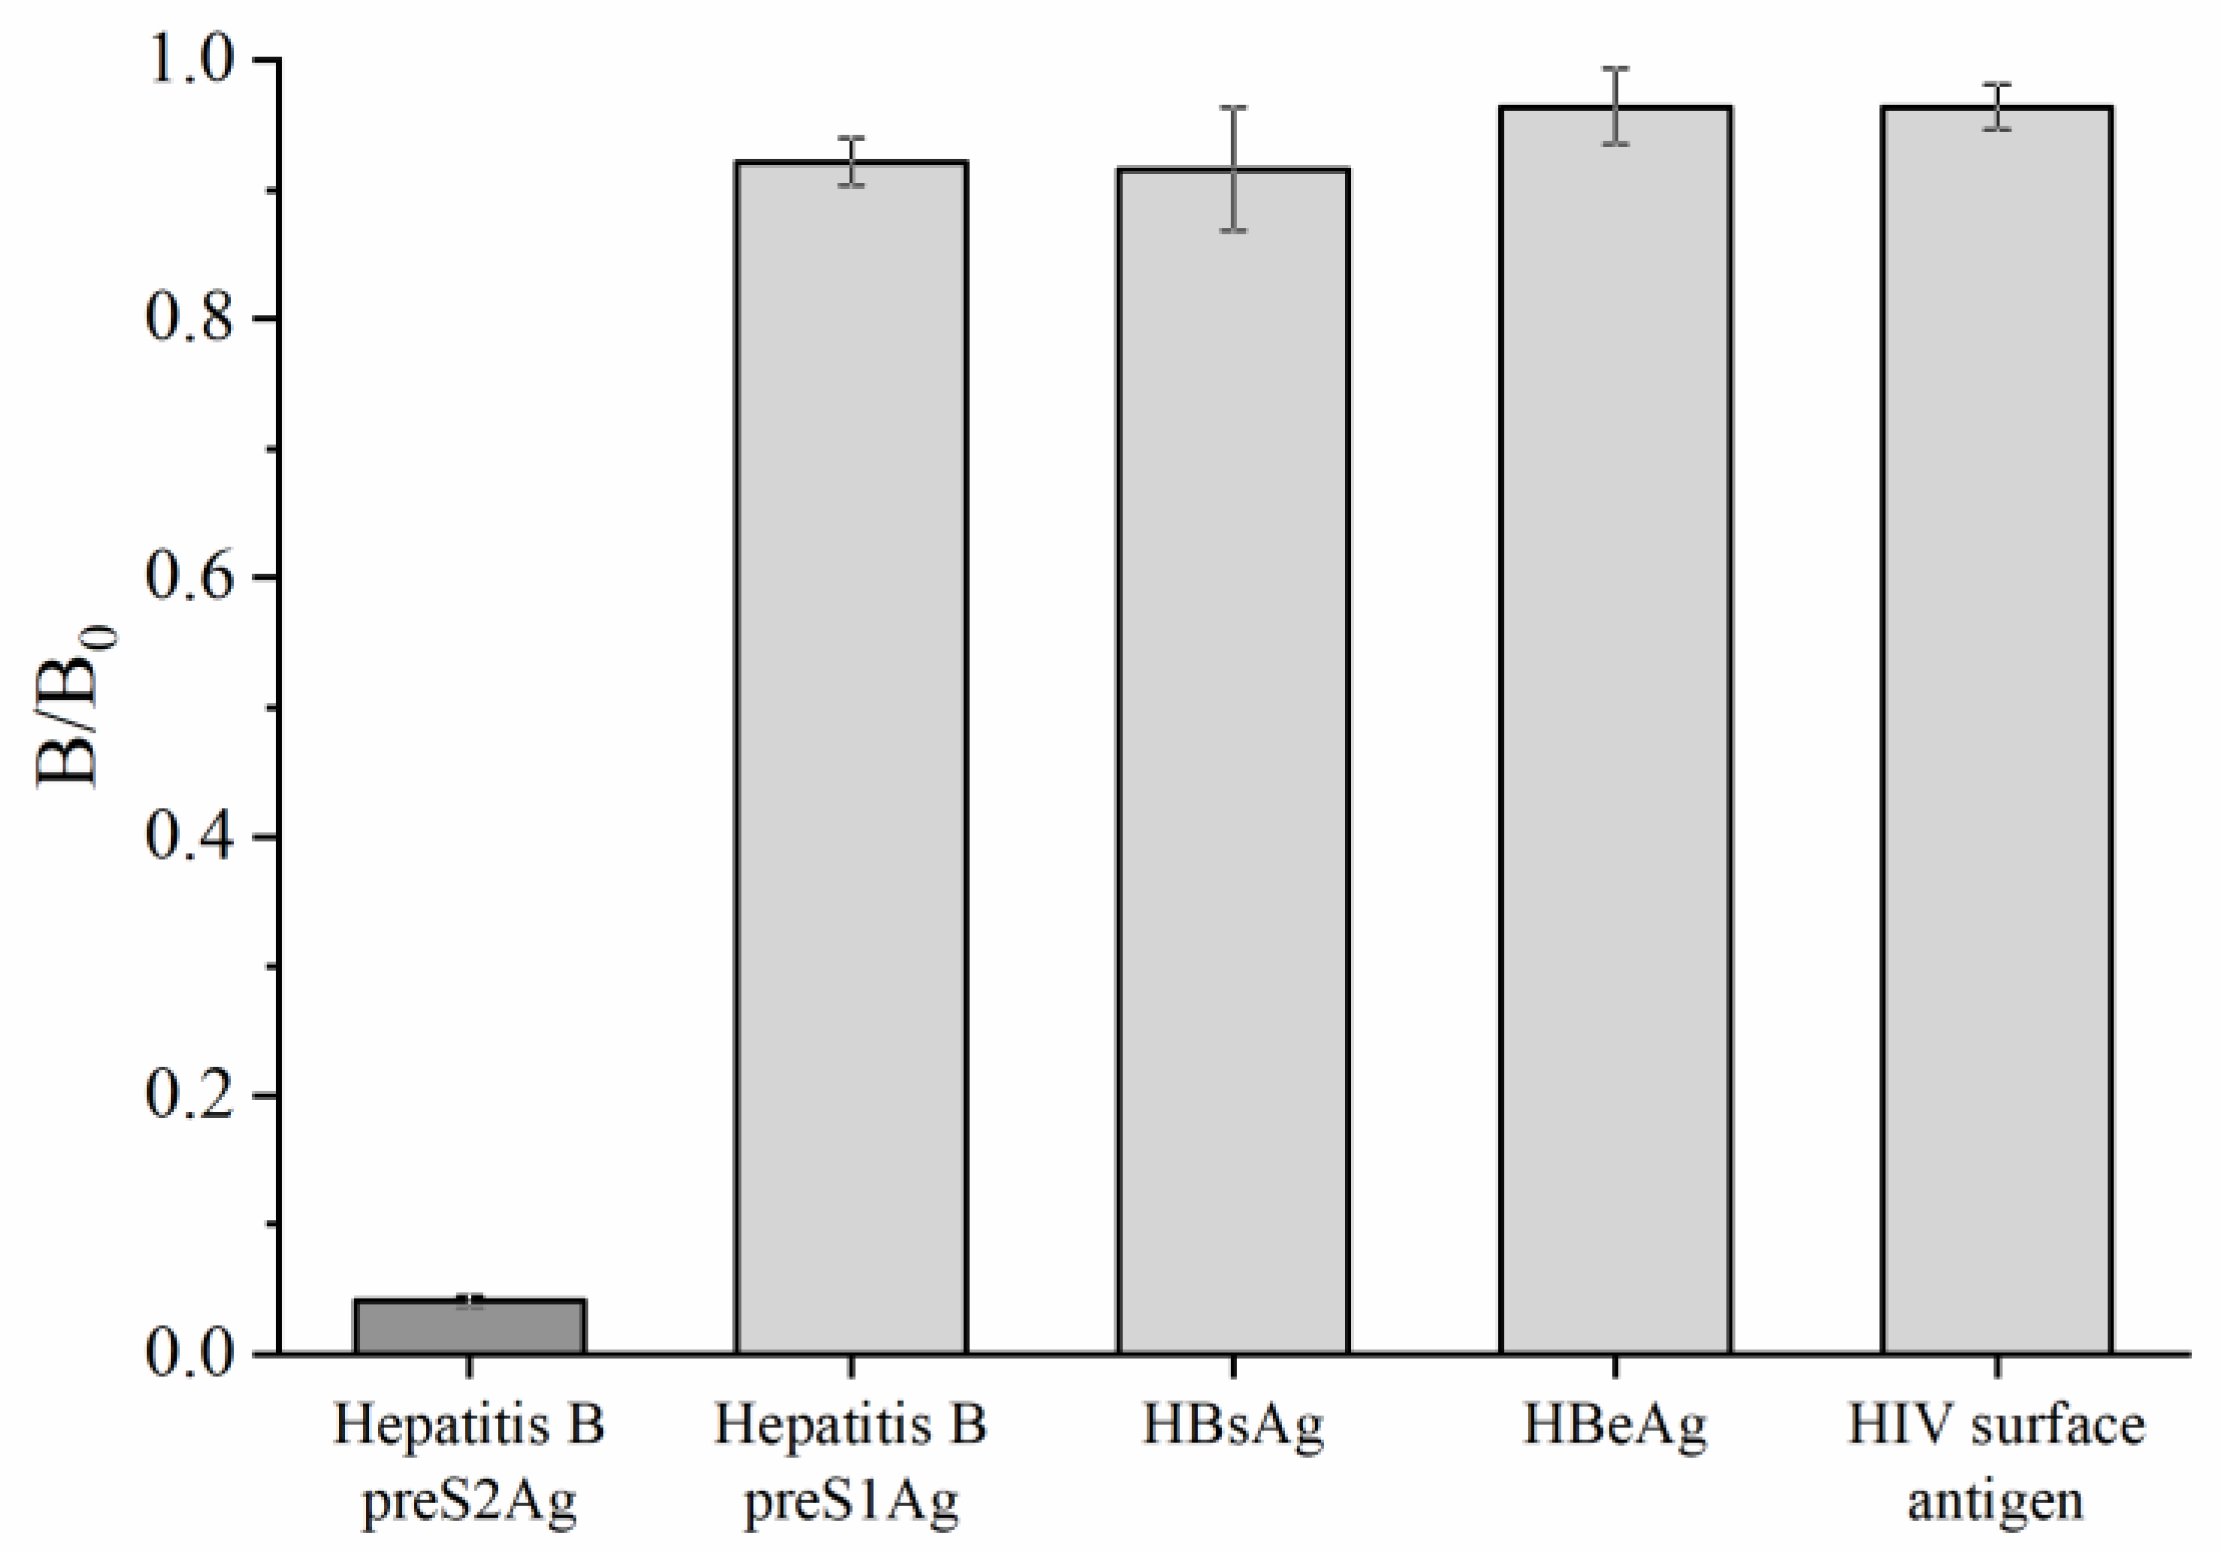
3.4.2. Specificity
3.4.3. Accuracy Validation
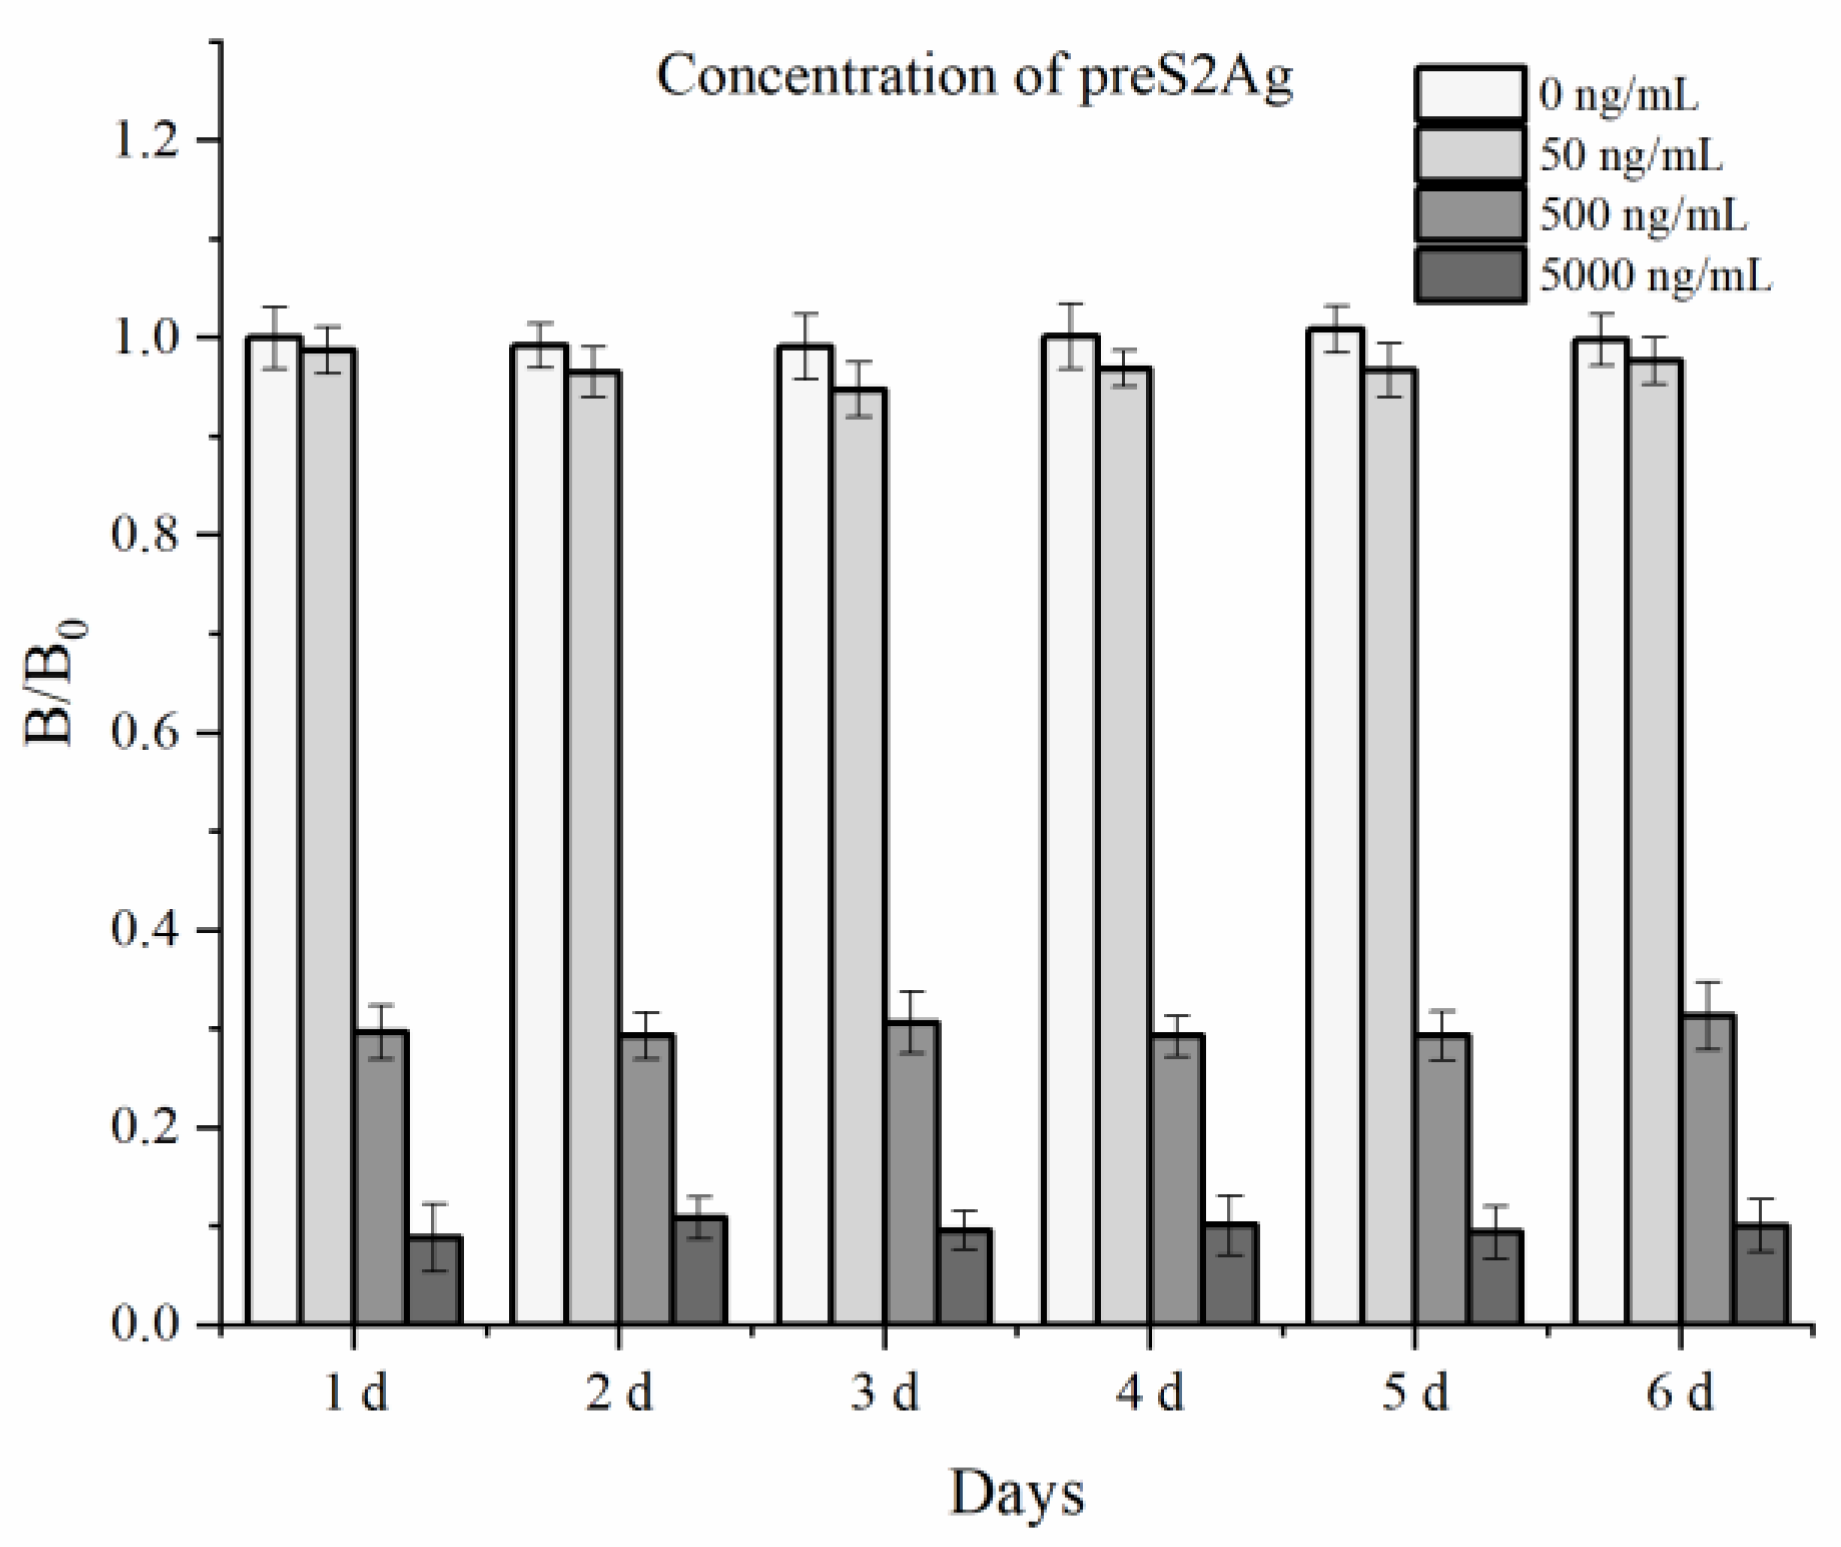
3.4.4. Stability
3.4.5. Reproducibility
3.5. Clinical Sample Analysis
4. Discussion
5. Conclusions
Author Contributions
Funding
Conflicts of Interest
References
- Hutin, Y.; Desai, S.; Bulterys, M. Preventing hepatitis B virus infection: Milestones and targets. Bull. World Health Organ. 2018, 96, 443. [Google Scholar] [CrossRef] [PubMed]
- Luckenbaugh, L.; Kitrinos, K.M.; Delaney, W.E.; Hu, J. Genome-free hepatitis B virion levels in patient sera as a potential marker to monitor response to antiviral therapy. J. Viral Hepat. 2015, 22, 561–570. [Google Scholar] [CrossRef] [PubMed] [Green Version]
- Siederdissen, C.H.Z.; Maasoumy, B.; Cornberg, M. New viral biomarkers for Hepatitis B: Are we able to change practice? J. Viral Hepat. 2018, 25, 1226–1235. [Google Scholar] [CrossRef] [PubMed]
- Su, I.J.; Wang, L.H.C.; Hsieh, W.C.; Wu, H.C.; Teng, C.F.; Tsai, H.W.; Huang, W. The emerging role of hepatitis B virus Pre-S2 deletion mutant proteins in HBV tumorigenesis. J. Biomed. Sci. 2014, 21. [Google Scholar] [CrossRef] [Green Version]
- Yen, T.T.C.; Yang, A.; Chiu, W.T.; Li, T.N.; Wang, L.H.; Wu, Y.H.; Wang, H.C.; Chen, L.; Wang, W.C.; Huang, W.; et al. Hepatitis B virus PreS2-mutant large surface antigen activates store-operated calcium entry and promotes chromosome instability. Oncotarget 2016, 7, 23346–23360. [Google Scholar] [CrossRef] [Green Version]
- Li, T.N.; Wu, Y.J.; Tsai, H.W.; Sun, C.P.; Wu, Y.H.; Wu, H.L.; Pei, Y.N.; Lu, K.Y.; Yen, T.T.C.; Chang, C.W.; et al. Intrahepatic hepatitis B virus large surface antigen induces hepatocyte hyperploidy via failure of cytokinesis. J. Pathol. 2018, 245, 502–513. [Google Scholar] [CrossRef]
- Musa, J.; Li, J.; Grünewald, T.G. Hepatitis B virus large surface protein is priming for hepatocellular carcinoma development via induction of cytokinesis failure. J. Pathol. 2019, 247, 6–8. [Google Scholar] [CrossRef] [Green Version]
- Ji, D. Study of transactivating effect of pre-S2 protein of hepatitis B virus and cloning of genes transactivated by pre-S2 protein with suppression subtractive hybridization. WJG 2005, 11, 5438. [Google Scholar] [CrossRef]
- Xie, Y.; Zhai, J.; Deng, Q.; Tiollais, P.; Wang, Y.; Zhao, M. Entry of hepatitis B virus: Mechanism and new therapeutic target. Pathol. Biol. 2010, 58, 301–307. [Google Scholar] [CrossRef]
- Pfefferkorn, M.; Böhm, S.; Schott, T.; Deichsel, D.; Bremer, C.M.; Schröder, K.; Gerlich, W.H.; Glebe, D.; Berg, T.; van Bömmel, F. Quantification of large and middle proteins of hepatitis B virus surface antigen (HBsAg) as a novel tool for the identification of inactive HBV carriers. Gut 2018, 67, 2045–2053. [Google Scholar] [CrossRef]
- Wu, C.C.; Chen, Y.S.; Cao, L.; Chen, X.W.; Lu, M.J. Hepatitis B virus infection: Defective surface antigen expression and pathogenesis. WJG 2018, 24, 3488–3499. [Google Scholar] [CrossRef]
- Rinker, F.; Bremer, C.M.; Schröder, K.; Wiegand, S.B.; Bremer, B.; Manns, M.P.; Kraft, A.R.; Wedemeyer, H.; Yang, L.; Pavlovic, V.; et al. Quantitation of large, middle and small hepatitis B surface proteins in HBeAg-positive patients treated with peginterferon alfa-2a. Liver Int. 2020, 40, 324–332. [Google Scholar] [CrossRef]
- Ryu, J.H.; Kwon, M.; Moon, J.D.; Hwang, M.W.; Lee, J.M.; Park, K.H.; Yun, S.J.; Bae, H.J.; Choi, A.; Lee, H.; et al. Development of a Rapid Automated Fluorescent Lateral Flow Immunoassay to Detect Hepatitis B Surface Antigen (HBsAg), Antibody to HBsAg, and Antibody to Hepatitis C. Ann. Lab. Med. 2018, 38, 578. [Google Scholar] [CrossRef] [Green Version]
- Lu, W.; Wang, K.; Xiao, K.; Qin, W.; Hou, Y.; Xu, H.; Yan, X.; Chen, Y.; Cui, D.; He, J. Dual Immunomagnetic Nanobeads-Based Lateral Flow Test Strip for Simultaneous Quantitative Detection of Carcinoembryonic Antigen and Neuron Specific Enolase. Sci. Rep. 2017, 7. [Google Scholar] [CrossRef]
- Hong, L.X.; Wang, K.; Yan, W.Q.; Xu, H.; Chen, Q.H.; Zhang, Y.H.; Cui, D.X.; Jin, Q.H.; He, J.H. High performance immunochromatographic assay for simultaneous quantitative detection of multiplex cardiac markers based on magnetic nanobeads. Theranostics 2018, 8, 6121–6131. [Google Scholar] [CrossRef]
- Yan, L.Z.; Dou, L.N.; Bu, T.; Huang, Q.; Wang, R.; Yang, Q.F.; Huang, L.J.; Wang, J.L.; Zhang, D.H. Highly sensitive furazolidone monitoring in milk by a signal amplified lateral flow assay based on magnetite nanoparticles labeled dual-probe. Food Chem. 2018, 261, 131–138. [Google Scholar] [CrossRef]
- Liu, D.; Huang, Y.; Wang, S.; Liu, K.; Chen, M.; Xiong, Y.; Yang, W.; Lai, W. A modified lateral flow immunoassay for the detection of trace aflatoxin M1 based on immunomagnetic nanobeads with different antibody concentrations. Food Control 2015, 51, 218–224. [Google Scholar] [CrossRef]
- Khodadadi, M.; Chang, L.; Trabuco, J.R.C.; Vu, B.V.; Kourentzi, K.; Willson, R.C.; Litvinov, D. PCB-Based Magnetometer as a Platform for Quantification of Lateral-Flow Assays. Sensors 2019, 19, 5433. [Google Scholar] [CrossRef] [PubMed] [Green Version]
- Xu, X.W.; Cui, Z.Q.; Lu, Y.; Jia, X.M.; Wang, Y.L. Establishment of HBV rapid magnetic immunochromatographic method based on magnetic nanoprobe for Pre-S1 antigen. J. Biol. 2016, 33, 98–103. [Google Scholar] [CrossRef]
- Li, Q.; Yang, Y.; Hu, F.; Cai, Y.; Liu, X.; He, X. Rapid detection of Escherichia coli O157:H7 by a fluorescent microsphere-based immunochromatographic assay and immunomagnetic separation. Anal. Biochem. 2019, 564–565, 32–39. [Google Scholar] [CrossRef]
- Razo, S.C.; Panferov, V.G.; Safenkova, I.V.; Varitsev, Y.A.; Zherdev, A.V.; Dzantiev, B.B. Double-enhanced lateral flow immunoassay for potato virus X based on a combination of magnetic and gold nanoparticles. Anal. Chim. Acta 2018, 1007, 50–60. [Google Scholar] [CrossRef] [PubMed]
- Yao, X.; Wang, Z.; Dou, L.; Zhao, B.; He, Y.; Wang, J.; Sun, J.; Li, T.; Zhang, D. An innovative immunochromatography assay for highly sensitive detection of 17β-estradiol based on an indirect probe strategy. Sens. Actuators B Chem. 2019, 289, 48–55. [Google Scholar] [CrossRef]
- Du, J.; Xu, X.W.; Cui, Z.Q.; Wang, Y.L.; Jia, X.M.; Lu, Y. Influences of magnetic immunochromatographic assay for detection of PreS1 region of hepatitis B virus surface antigen. J. Biol. 2017, 34, 11–15. [Google Scholar] [CrossRef]
- Yan, J.; Liu, Y.Y.; Wang, Y.L.; Xu, X.W.; Lu, Y.; Pan, Y.J.; Guo, F.F.; Shi, D.L. Effect of physiochemical property of Fe3O4 particle on magnetic lateral flow immunochromatographic assay. Sens. Actuators B 2014, 197, 129–136. [Google Scholar] [CrossRef]
- Wu, Y.; Zhou, Y.; Huang, H.; Chen, X.; Leng, Y.; Lai, W.; Huang, X.; Xiong, Y. Engineered gold nanoparticles as multicolor labels for simultaneous multi-mycotoxin detection on the immunochromatographic test strip nanosensor. Sens. Actuators B Chem. 2020, 316, 128107. [Google Scholar] [CrossRef]
- Blažková, M.; Rauch, P.; Fukal, L. Strip-based immunoassay for rapid detection of thiabendazole. Biosens. Bioelectron. 2010, 25, 2122–2128. [Google Scholar] [CrossRef]
- Liu, Y.Y.; Zhang, Z.H.; Wang, Y.L.; Zhao, Y.; Lu, Y.; Xu, X.W.; Yan, J.; Pan, Y.J. A highly sensitive and flexible magnetic nanoprobe labeled immunochromatographic assay platform for pathogen Vibrio parahaemolyticus. Int. J. Food Microbiol. 2015, 211, 109–116. [Google Scholar] [CrossRef] [PubMed]
- Urusov, A.E.; Zherdev, A.V.; Dzantiev, B.B. Use of gold nanoparticle-labeled secondary antibodies to improve the sensitivity of an immunochromatographic assay for aflatoxin B1. Microchim. Acta 2014, 181, 1939–1946. [Google Scholar] [CrossRef]
- Petrakova, A.V.; Urusov, A.E.; Gubaydullina, M.K.; Bartosh, A.V.; Zherdev, A.V.; Dzantiev, B.B. “External” antibodies as the simplest tool for sensitive immunochromatographic tests. Talanta 2017, 175, 77–81. [Google Scholar] [CrossRef]
- Shen, X.Y.; Wu, X.L.; Liu, L.Q.; Kuang, H. Development of a colloidal gold immunoassay for the detection of four eugenol compounds in water. Food Agric. Immunol. 2019, 30, 1318–1331. [Google Scholar] [CrossRef]
- Hu, L.M.; Luo, K.; Xia, J.; Xu, G.M.; Wu, C.H.; Han, J.J.; Zhang, G.G.; Liu, M.; Lai, W.H. Advantages of time-resolved fluorescent nanobeads compared with fluorescent submicrospheres, quantum dots, and colloidal gold as label in lateral flow assays for detection of ractopamine. Biosens. Bioelectron. 2017, 91, 95–103. [Google Scholar] [CrossRef] [PubMed]
- Dou, L.N.; Zhao, B.X.; Bu, T.; Zhang, W.T.; Huang, Q.; Yan, L.Z.; Huang, L.J.; Wang, Y.R.; Wang, J.L.; Zhang, D.H. Highly sensitive detection of a small molecule by a paired labels recognition system based lateral flow assay. Anal. Bioanal. Chem. 2018, 410, 3161–3170. [Google Scholar] [CrossRef]
- Cornberg, M.; Wong, V.W.-S.; Locarnini, S.; Brunetto, M.; Janssen, H.L.A.; Chan, H.L.-Y. The role of quantitative hepatitis B surface antigen revisited. J. Hepatol. 2017, 66, 398–411. [Google Scholar] [CrossRef] [PubMed] [Green Version]
- Gong, Y.F.; Chen, Z.L.; Xi, X.; Li, M.; Wang, W.F.; Wang, M.Z.; Ying, Y.F.; Zhang, M.Z. Colloidal gold immunochromatographic strip for rapid detection of melamine. Chin. J. Biotech. 2012, 117–128. [Google Scholar] [CrossRef]
- Barnett, J.M.; Wraith, P.; Kiely, J.; Persad, R.; Hurley, K.; Hawkins, P.; Luxton, R. An Inexpensive, Fast and Sensitive Quantitative Lateral Flow Magneto-Immunoassay for Total Prostate Specific Antigen. Biosensors 2014, 4, 204–220. [Google Scholar] [CrossRef] [Green Version]
- Inoue, T.; Tanaka, Y. Novel biomarkers for the management of chronic hepatitis B. Clin. Mol. Hepatol. 2020, 26, 261–279. [Google Scholar] [CrossRef]
- Liu, C.; Wu, W.; Shang, H.; Lin, S.; Xun, Z.; Huang, E.; Lin, J.; Yang, B.; Ou, Q. Prediction value of serum HBV large surface protein in different phases of HBV infection and virological response of chronic hepatitis B patients. Clin. Chim. Acta 2018, 481, 12–19. [Google Scholar] [CrossRef]
- Liu, J.; Yu, Q.; Zhao, G.; Dou, W. A Au@Pt bimetallic nanoparticle and blue silica nanoparticle nanocomposite as a probe of immunochromatographic assay for HBsAg detection. Anal. Methods 2019, 11, 6103–6110. [Google Scholar] [CrossRef]
- Liu, J.; Yu, Q.; Zhao, G.; Dou, W. A novel immunochromatographic assay using ultramarine blue particles as visible label for quantitative detection of hepatitis B virus surface antigen. Anal. Chim. Acta 2020, 1098, 140–147. [Google Scholar] [CrossRef]
- Yu, Q.; Dou, W.; Liu, J.; Zhao, G.; Yang, S.; Zhu, D.; Zhao, Y.; Li, L. A sensitive and quantitative immunochromatographic assay for HBsAg based on novel red silica nanoparticles. Anal. Methods 2019, 11, 268–275. [Google Scholar] [CrossRef]
- Oh, K.; Choi, Y.S.; Yoon, H.; Park, N.; Kim, J.; Kim, Y.K. Immunochromatographic Assay of Hepatitis B Surface Antigen Using Magnetic Nanoparticles as Signal Materials. IEEE Trans. Magn. 2014, 50, 1–4. [Google Scholar] [CrossRef]
- Shen, J.; Zhou, Y.; Fu, F.; Xu, H.; Lv, J.; Xiong, Y.; Wang, A. Immunochromatographic assay for quantitative and sensitive detection of hepatitis B virus surface antigen using highly luminescent quantum dot-beads. Talanta 2015, 142, 145–149. [Google Scholar] [CrossRef]
- Wang, Z.; Li, Y.; Liang, W.; Zheng, J.; Li, S.; Hu, C.; Chen, A. A Highly Sensitive Detection System based on Proximity-dependent Hybridization with Computer-aided Affinity Maturation of a scFv Antibody. Sci. Rep. 2018, 8. [Google Scholar] [CrossRef] [PubMed]
- Akkapinyo, C.; Khownarumit, P.; Waraho-Zhmayev, D.; Poo-arporn, R.P. Development of a multiplex immunochromatographic strip test and ultrasensitive electrochemical immunosensor for hepatitis B virus screening. Anal. Chim. Acta 2020, 1095, 162–171. [Google Scholar] [CrossRef]
- Lim, S.L.; Ooi, C.W.; Tan, W.S.; Chan, E.S.; Ho, K.L.; Tey, B.T. Biosensing of hepatitis B antigen with poly(acrylic acid) hydrogel immobilized with antigens and antibodies. Sens. Actuators B Chem. 2017, 252, 409–417. [Google Scholar] [CrossRef]


| Spiked PreS2Ag Concentrations (ng/mL) | GAM-MNPs-ICA | ELISA | Relative Error (%) |
|---|---|---|---|
| PreS2Ag Concentrations (ng/mL) | PreS2Ag Concentrations (ng/mL) | ||
| 5 | 5.91 ± 1.68 | 5.16 ± 1.34 | 14.4 |
| 50 | 43.04 ± 6.35 | 48.27 ± 4.61 | 10.8 |
| 500 | 456.93 ± 59.76 | 505.64 ± 82.39 | 9.6 |
| 5000 | 4517.44 ± 787.50 | 4551.18 ± 753.04 | 7.4 |
| PreS2Ag Concentrations (ng/mL) | Intra-Assay | Inter-Assay | ||
|---|---|---|---|---|
| B/B0 | CV | B/B0 | CV | |
| 0 | 1.000 ± 0.021 | 2.13% | 1.009 ± 0.025 | 2.46% |
| 50 | 0.928 ± 0.031 | 3.39% | 0.953 ± 0.045 | 4.74% |
| 500 | 0.247 ± 0.011 | 4.45% | 0.270 ± 0.030 | 11.29% |
| 5000 | 0.079 ± 0.007 | 9.07% | 0.092 ± 0.012 | 12.72% |
| Serological Marker | Method | Positive Results | Negative Results | ||||
|---|---|---|---|---|---|---|---|
| TP | FP | Same Results | TN | FN | Same Results | ||
| PreS2Ag | GAM-MNPs-ICA | 14 | 1 | 12 | 9 | 1 | 9 |
| ELISA Kit 1 | 13 | 0 | 10 | 2 | |||
| HBsAg | ELISA Kit 2 | 15 | 0 | 10 | 0 | ||
| Target | Method | Label Material | LOD | Detection Time | Quantitative Method | Sample | Reference |
|---|---|---|---|---|---|---|---|
| HBsAg | ICA | Au@Pt/blue SiNPs | 0.13 ng/mL | 15 min | Camera/Image J | Spiked FCS | [38] |
| ICA | Ultramarine blue particles | 0.37 ng/mL | 15 min | Camera/Image J | Spiked FCS | [39] | |
| ICA | Red SiNPs | 0.97 ng/mL | 10 min | Camera/Image J | Spiked FCS | [40] | |
| ICA | MNPs | 1 ng/mL | 20 min | Immuno-chromato Reader | Spiked PBS buffer with 1% BSA | [41] | |
| ICA | Quantum dots | 0.075 ng/mL | 15 min | Fluorescence strip reader | Human serum | [42] | |
| ECA | SPCE | 2.1 ng/mL | 25 min | EIS | Spiked acetate buffer | [44] | |
| HBcAg | Hydrogel-based QCM biosensor | Hydrogel based on PAAc | 0.6 mg/mL | 1 h | QCM | Spiked rabbit serum | [45] |
| PreS1Ag | ECA | AuNPs modified glassy carbon electrode | 0.1 pM | 80 min | Electrochemical analyser | Human serum | [43] |
| PreS2Ag | ICA | MNPs | 3.6 ng/mL | 25 min | Magnetic assay reader | Human serum | This work |
Publisher’s Note: MDPI stays neutral with regard to jurisdictional claims in published maps and institutional affiliations. |
© 2020 by the authors. Licensee MDPI, Basel, Switzerland. This article is an open access article distributed under the terms and conditions of the Creative Commons Attribution (CC BY) license (http://creativecommons.org/licenses/by/4.0/).
Share and Cite
Cai, Y.; Yan, J.; Zhu, L.; Wang, H.; Lu, Y. A Rapid Immunochromatographic Method Based on a Secondary Antibody-Labelled Magnetic Nanoprobe for the Detection of Hepatitis B preS2 Surface Antigen. Biosensors 2020, 10, 161. https://doi.org/10.3390/bios10110161
Cai Y, Yan J, Zhu L, Wang H, Lu Y. A Rapid Immunochromatographic Method Based on a Secondary Antibody-Labelled Magnetic Nanoprobe for the Detection of Hepatitis B preS2 Surface Antigen. Biosensors. 2020; 10(11):161. https://doi.org/10.3390/bios10110161
Chicago/Turabian StyleCai, Yangyang, Jun Yan, Li Zhu, Hengliang Wang, and Ying Lu. 2020. "A Rapid Immunochromatographic Method Based on a Secondary Antibody-Labelled Magnetic Nanoprobe for the Detection of Hepatitis B preS2 Surface Antigen" Biosensors 10, no. 11: 161. https://doi.org/10.3390/bios10110161