Article

First-Principles Calculation of MoO2 and MoO3 Electronic and Optical Properties Compared with Experimental Data

1
Department of Materials, Environmental Sciences and Urban Planning, Marche Polytechnic University, Via Brecce Bianche, 60131 Ancona, Italy
2
Tyndall National Institute, University College Cork, T12 R5CP Cork, Ireland
3
Department of Information Engineering, Marche Polytechnic University, Via Brecce Bianche, 60131 Ancona, Italy
*
Author to whom correspondence should be addressed.
Nanomaterials 2023, 13(8), 1319; https://doi.org/10.3390/nano13081319
Submission received: 30 March 2023 / Revised: 5 April 2023 / Accepted: 7 April 2023 / Published: 9 April 2023
(This article belongs to the Special Issue First-Principle Calculation Study of Nanomaterials)

Abstract

:
MoO3 and MoO2 systems have attracted particular attention for many widespread applications thanks to their electronic and optical peculiarities; from the crystallographic point of view, MoO3 adopts a thermodynamically stable orthorhombic phase (α-MoO3) belonging to the space group Pbmn, while MoO2 assumes a monoclinic arrangement characterized by space group P21/c. In the present paper, we investigated the electronic and optical properties of both MoO3 and MoO2 by using Density Functional Theory calculations, in particular, the Meta Generalized Gradient Approximation (MGGA) SCAN functional together with the PseudoDojo pseudopotential, which were used for the first time to obtain a deeper insight into the nature of different Mo–O bonds in these materials. The calculated density of states, the band gap, and the band structure were confirmed and validated by comparison with already available experimental results, while the optical properties were validated by recording optical spectra. Furthermore, the calculated band-gap energy value for the orthorhombic MoO3 showed the best match to the experimental value reported in the literature. All these findings suggest that the newly proposed theoretical techniques reproduce the experimental evidence of both MoO2 and MoO3 systems with high accuracy.

Graphical Abstract

1. Introduction

The molybdenum oxides family includes compounds characterized by different Mo:O stoichiometries and polymorphs. Among them, the most common are MoO3 and MoO2, which differ in their chemical structure as well as in their electronic and optical properties [1,2]. Molybdenum oxides are widely used as redox-active catalysts in organic chemistry; for example, they act as catalysts in the oxidation reaction of methane or propane [3,4]. Moreover, the ability of the metal center to be involved in the redox process, together with the numerous oxidation states, and the four, five, or six coordination modes of molybdenum have attracted particular attention even for many other widespread applications such as sensors [5] and solar cells [6].
As for WO3 [7], MoO3 is also well known to have pronounced chromism—it is able to undergo color change under proper stimulations. Molybdenum oxide coloration can be determined by applying a potential (electrochromism) [8], by optical irradiation (photochromism) [9], and by changing the temperature (thermochromism) [10].
The doping of MoO3 with different elements and the creation of an oxygen vacancy inside the crystal lattice have enhanced the applicability of this material to electronic and optical devices. As a matter of fact, doping with special substituents allows for the controlling and tuning of the carrier concentration and band structure peculiarities [11,12]. Furthermore, optical devices with a reconfigurable response have recently attracted much attention, such as VO2 [13,14,15], which shows that a large modification in physical properties upon external input, even the reversible molybdenum oxides MoO3-to-MoO2 transformation associated with a dielectric-to-metallic character could be significant. Defect formation, vacancy presence, and dopant substitution seem to be also responsible for the ferromagnetic behavior in MoO3 [16,17,18,19] and the change in the crystal structure that may affect the electronic, optical, and mechanical properties of the material [20,21,22].
From the crystallographic point of view, MoO3 adopts a thermodynamically stable orthorhombic phase (α-MoO3) belonging to the space group Pbmn [2]. More, MoO3 can adopt a less stable phase, which is the monoclinic phase called β-MoO3 that spontaneously evolves into the orthorhombic structure at a temperature above 370 °C [23].
The orthorhombic polymorph is of special interest as it possesses a unique two-dimensional layered structure that is a fundamental requirement to be exfoliated in mono- or multiple-layered assemblies. As a matter of fact, after the discovery of graphene, other two-dimensional materials, such as metal chalcogenides and transition metal oxides, have attracted research interest and are considered appealing for a wide range of applications and the next generation of devices [24]. α-MoO3 is made by a series of bilayers oriented perpendicular to the [010] y-axis and kept together by non-covalent, mainly van der Waals interactions [24,25].
Regarding MoO2, it adopts a monoclinic crystallographic arrangement characterized by space group P21/c. In MoO2, the Mo–O bond can be described as two different coordination environments, each one with three different Mo–O bond lengths [2]. Molybdenum dioxide is a metallic compound with interesting electronic properties.
MoO2 finds its major application in the organic chemistry field as a catalyst for isomerization and oxidation, and in the petrochemical industry for hydrodesulfurization, hydrogenation, and dehydrogenation reactions; it is a promising material for lithium-ion batteries [26] due to its high energy storage capacity and excellent electrochemical stability, and it is used as a substrate in surface-enhanced Raman spectroscopy (SERS) [27].
MoO2-based sensors are used for detecting hydrogen, oxygen, and carbon monoxide in different industries, and it is also used as a hole transport layer in organic and perovskite solar cells, which helps to improve their performance and stability; overall, MoO2 has significant potential for applications in various fields, and its use is expected to grow in the future [28].
In the present paper, we investigated the peculiar electronic and optical properties of both MoO3 and MoO2 by making use of Density Functional Theory (DFT) calculations and by comparing the obtained results with the experimental ones. For these reasons, among all the possible polymorphs of the molybdenum oxides, MoO3 and MoO2 were studied by considering the orthorhombic (α) and the monoclinic crystallographic structure, respectively, in order to reproduce the most thermodynamically stable phases. In detail, we used the newly proposed Meta Generalized Gradient Approximation (MGGA) exchange-correlation functional called Strongly Constrained and Appropriately Normed (SCAN) [29] together with the PseudoDojo pseudopotential [30]. The choice to use SCAN is that this approach adds the orbital kinetic energy density of each spin to the Generalized Gradient Approximation. In this way, SCAN can accurately predict different kinds of bonding, also including the effects of intermediate-range van der Waals interactions. SCAN is also fitted to additional appropriate norms, non-bonded systems such as atoms in which it can be accurate for the exchange and correlation energies separately, and not just for their sum as in bonded systems [31]. Since the interactions between Mo and O atoms can be ionic, single, and double covalent types, and this depends on the coordination, the number of oxygens, and the distances with centered Mo, the accuracy in the bond description is crucial for describing MoOx systems. The semilocal density functional fulfills all known constraints that the exact density functional must satisfy. Studies have demonstrated that this functional is superior to most gradient-corrected functionals [32], and for these reasons, MGGA-SCAN was used to describe the MoO3 and MoO2 for the first time in this paper. To verify the reliability of the chosen method, the electronic properties of MoO2 and MoO3 were also calculated using the Generalized Gradient Approximation (GGA) PBEsol and hybrid HSE06 functionals. Both these methods are known to be very accurate for solid state oxide systems. In fact, both these materials have been already studied by the theoretical model with different methodologies. Authors such as Chen et al. [33], Rozzi et al. [34], and Eyert and coworkers [35,36] used the ab initio DFT based on local density approximation (LDA); Coquet and Willock [37] used the generalized gradient approximation (GGA) with the Hubbard correction term to understand the effect of oxygen vacancies while remarking on the importance of such a methodology for complex electronic systems. Scanlon et al. [2] used the generalized gradient approximation (GGA) with PBE in the plane wave basis set to study both MoO3 and MoO2. More recently, Gulomov et al. [38] used and compared two DFT approaches, namely, PBE and HSE06 functionals, calculating in both cases the band gap energy of MoO3 that was found to be, in the best case from HSE06 calculation, 3.027 eV.
The results obtained were confirmed and validated by comparison with literature data and our recorded experimental findings. In particular, the calculated density of the electronic state (DOS) was in good agreement with that in the literature, and the frontier orbitals detection, in terms of Highest Occupied Molecular Orbital (HOMO) and Lowest Unoccupied Molecular Orbitals (LUMO), confirmed the dielectric-to-conductor transition moving from MoO3 to MoO2. Moreover, the calculated optical spectra were compared with experimental findings, showing very good agreement; finally, the band-gap energy calculated for the dielectric α-MoO3 best matched the one reported experimentally rather than the other theoretical DFT-based studies. The use of our proposed computational method on Mo-based materials could clarify the interesting change in the properties of the systems, better describing the nature of each Mo–O bond in MoO2 and MoO3.

2. Materials and Methods

2.1. Theoretical Modeling and DFT Calculation

The Quantum Atomistic Toolkit (ATK) atomic-scale modeling platform was used to model all polymorphs and to perform all calculations [39]. The monoclinic MoO2 (P21/c) and the orthorhombic MoO3 (Pbmn) polymorphs were modelled starting from the Materials Project database [40] and optimized. The electron basis was expanded in linear combination using the atomic orbital (LCAO) method for Mo and O entities resembling the SIESTA formalism [41]. In comparison with other basis sets, the whole electron LCAO calculations describe accurately electronic distributions both in the valence and the core region with a limited number of basis functions. All simulations were carried out using the MGGA density functional called SCAN for the electron exchange-correlation energy [42]. It is described as follows (1):
E x c   [ n ] = n ( r ) x c ( n ( r ) ,   | n ( r ) | ,     t   ( r ) )   d r  
where n is the electron density, n ( r ) is its gradient, while t (r) is the positive orbital kinetic energy density. This latter term is the additional one to the canonical GGA approach, and it is determined by (2):
t ( r ) = 1 2 i O c c ( φ i ( r ) ) 2
where φi (r) are the Kohn–Sham orbitals.
For each atom, the ionic cores were represented by norm-conserving (NC) PDj pseudopotentials [30]. To model the systems, the periodic boundary conditions (PBCs) were used along all axes; in this way, it was possible to avoid problems with boundary effects caused by the finite size and to reduce the calculation time while maintaining high accuracy. The energy cut-off was fixed at 1200 eV, and the Brillouin-zone integration was performed over a 15 × 15 × 15 k-points grid.
The optical properties of the MoOx structures were determined by two components of the dielectric function ε(ω) = εr(ω) + iεi(ω).
The imaginary part εi (ω) of the dielectric constant was determined from Equation (3) [43]:
ε i ( ω ) = 4 π 2 Ω ω 2 i HOMO , j LUMO k W k | ρ i j | 2 δ ( ε k j ε k i ω )
where HOMO, LUMO, ω, Ω, Wk, ρij were the valence band, conduction band, photon frequency, volume of the lattice, weight of the k-point, and elements of the dipole transition matrix, respectively.
The real part of the dielectric constant was obtained with Equation (4):
ε r ( ω ) = 1 + 1 π P 0 d ω ¯ ω ¯ ε 2 ( ω ¯ ) ω ¯ 2 ω 2
Finally, the refractive index (n) and extinction coefficient (k) of MoOx systems were calculated as follows using Equations (5) and (6):
ε r ( ω ) = n 2 k 2
ε i ( ω ) = 2 n k
Finally, with the aim of comparing the simulated results between them and then to validate the computational approach, the electronic properties of MoO2 and MoO3 were calculated again using Generalized Gradient Approximation (GGA) PBEsol and hybrid HSE06 functionals, maintaining the same approach in relation to the basis sets and pseudopotentials adopted.

2.2. Experimental Section

Amorphous MoO3 and MoO2 thin films were deposited at room temperature by e-beam evaporation using MoO3 and MoO2 pellets (Pi-KEM 99.99% purity) in a Leybold SYRUS pro 710 on n-type silicon (100). The n-type Si (100) wafers were cleaned before the deposition using a standard RCA cleaning procedure. The nominal thickness of these MoO3 and MoO2 films targeted was 150 nm. After the deposition, MoO3 and MoO2 were annealed in N2 at 400 °C for 30 min in order to fully crystallize them.
Spectroscopic ellipsometry [44,45,46] was performed on the 150 nm-thick MoO2 film and on the 150 nm-thick MoO3 deposited on n-type silicon (100). The measurements were performed at a 70-degree incidence using a Woollam M2000 ellipsometer in the UV-VIS-NIR spectral range. The collected ellipsometry data were analyzed considering a four-layer optical model, i.e., air/MoO3/interfacial oxide/silicon, and for this purpose Woollam’s CompletEASE software was used.

3. Results and Discussion

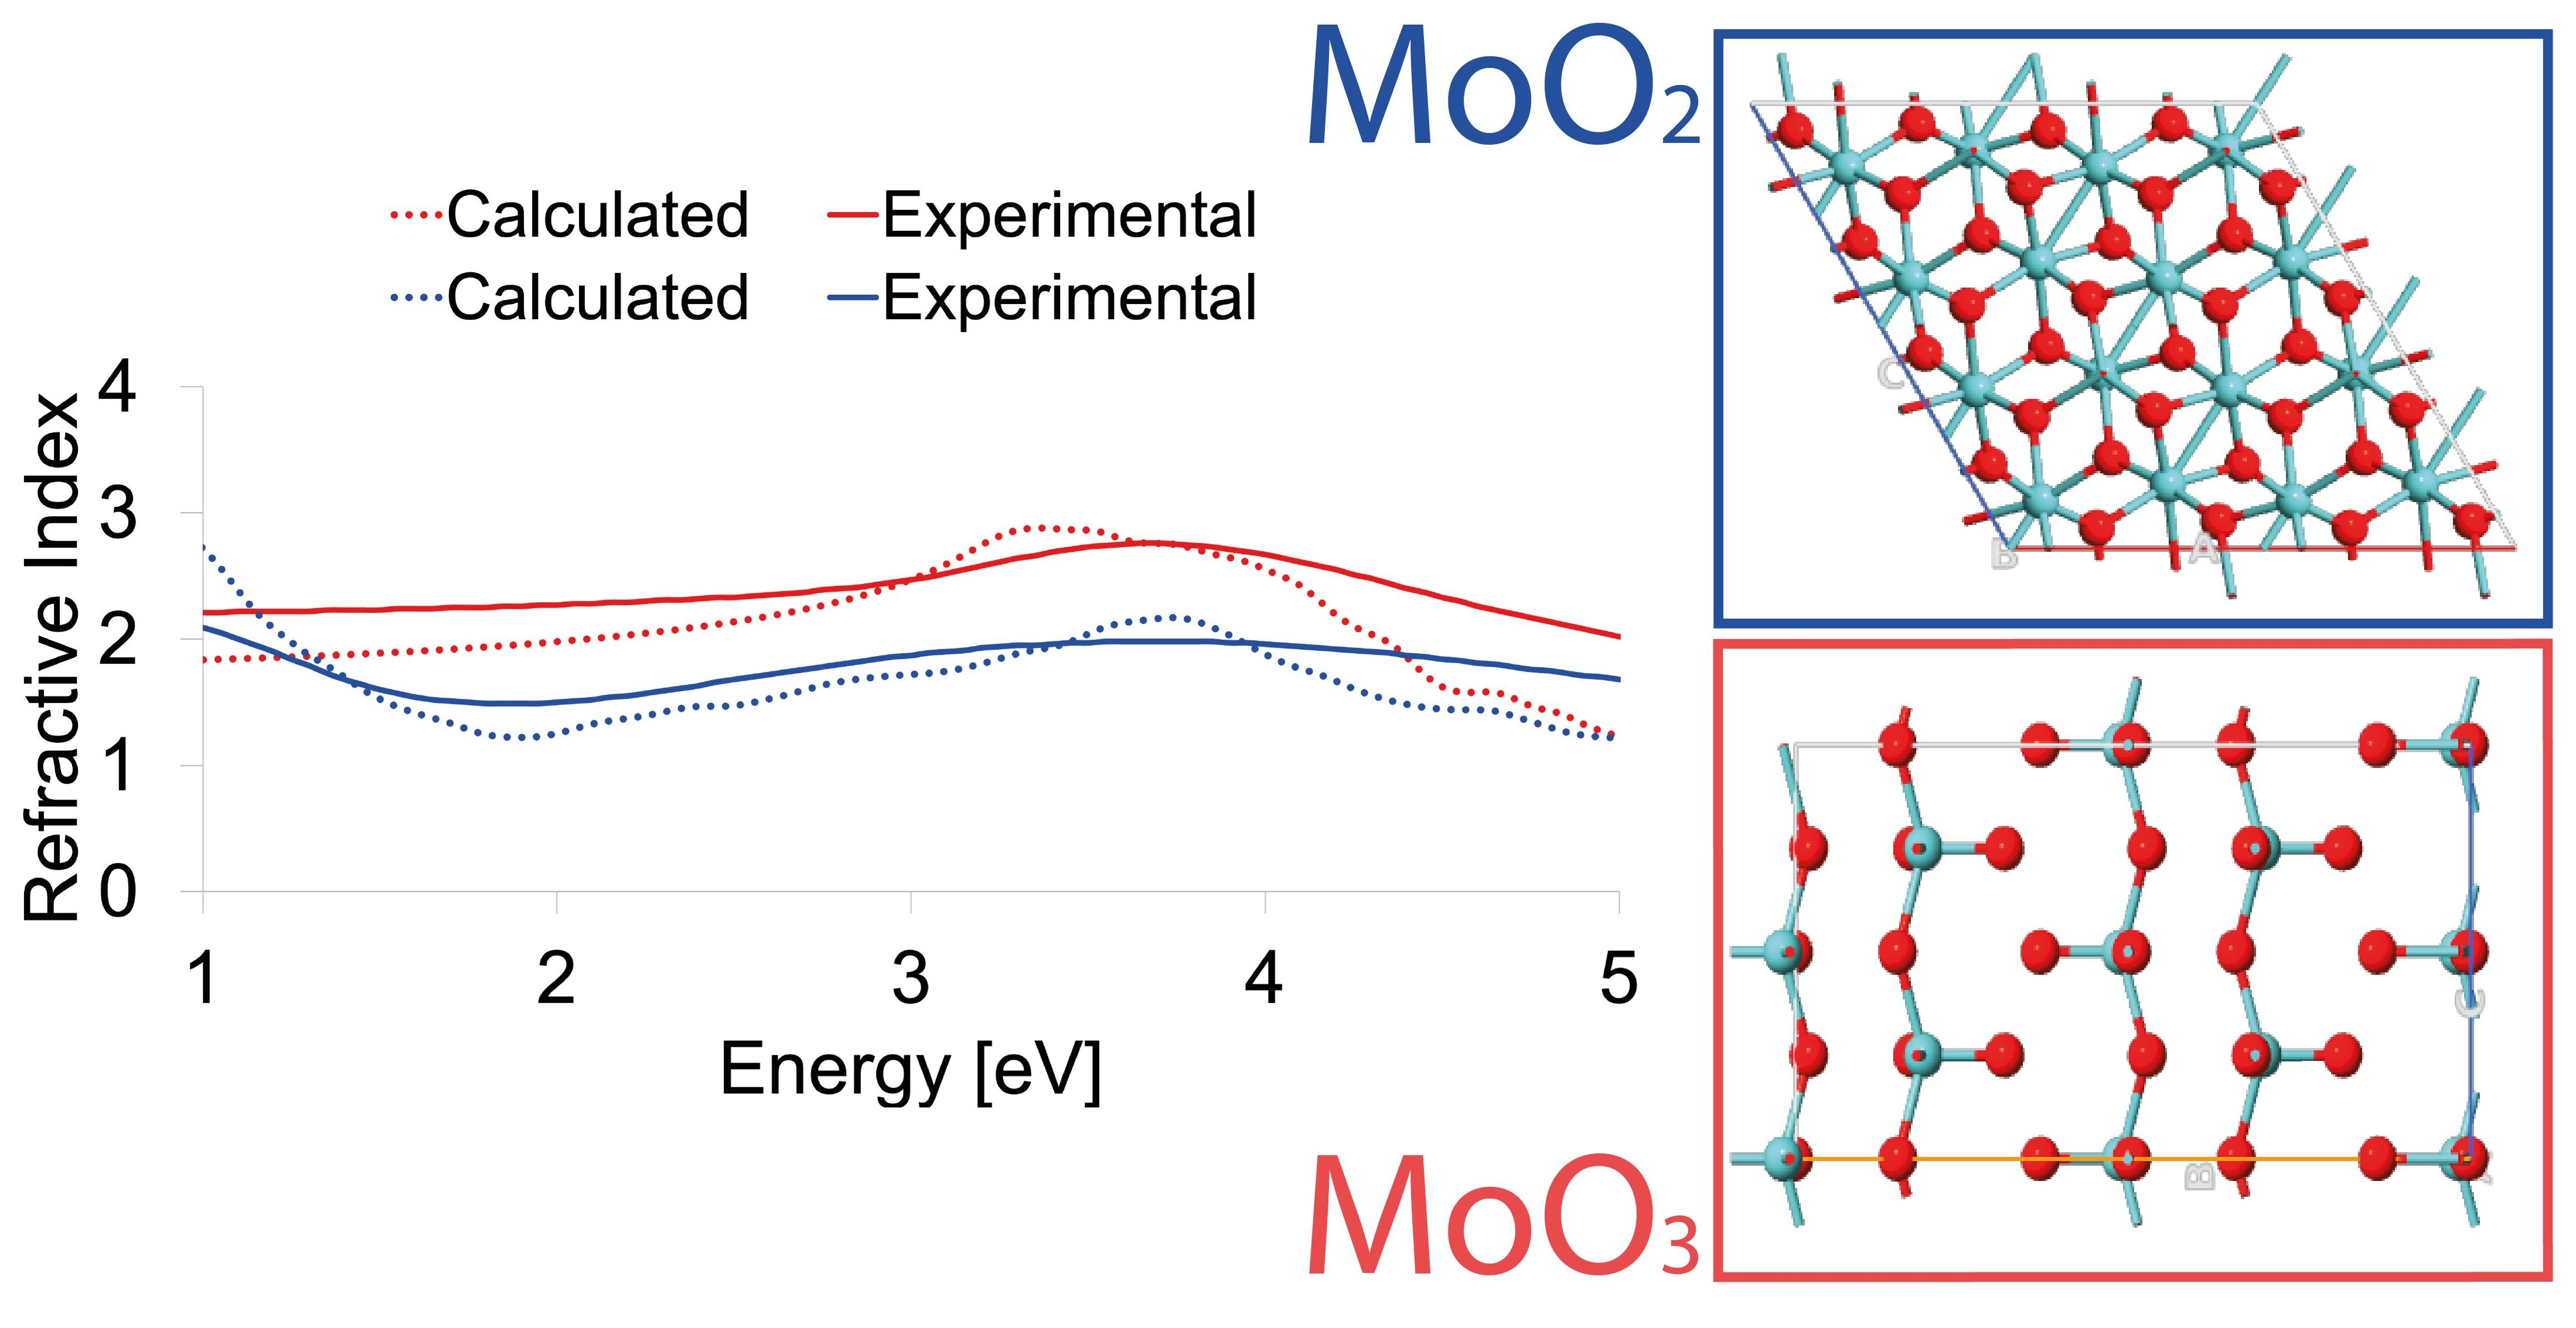
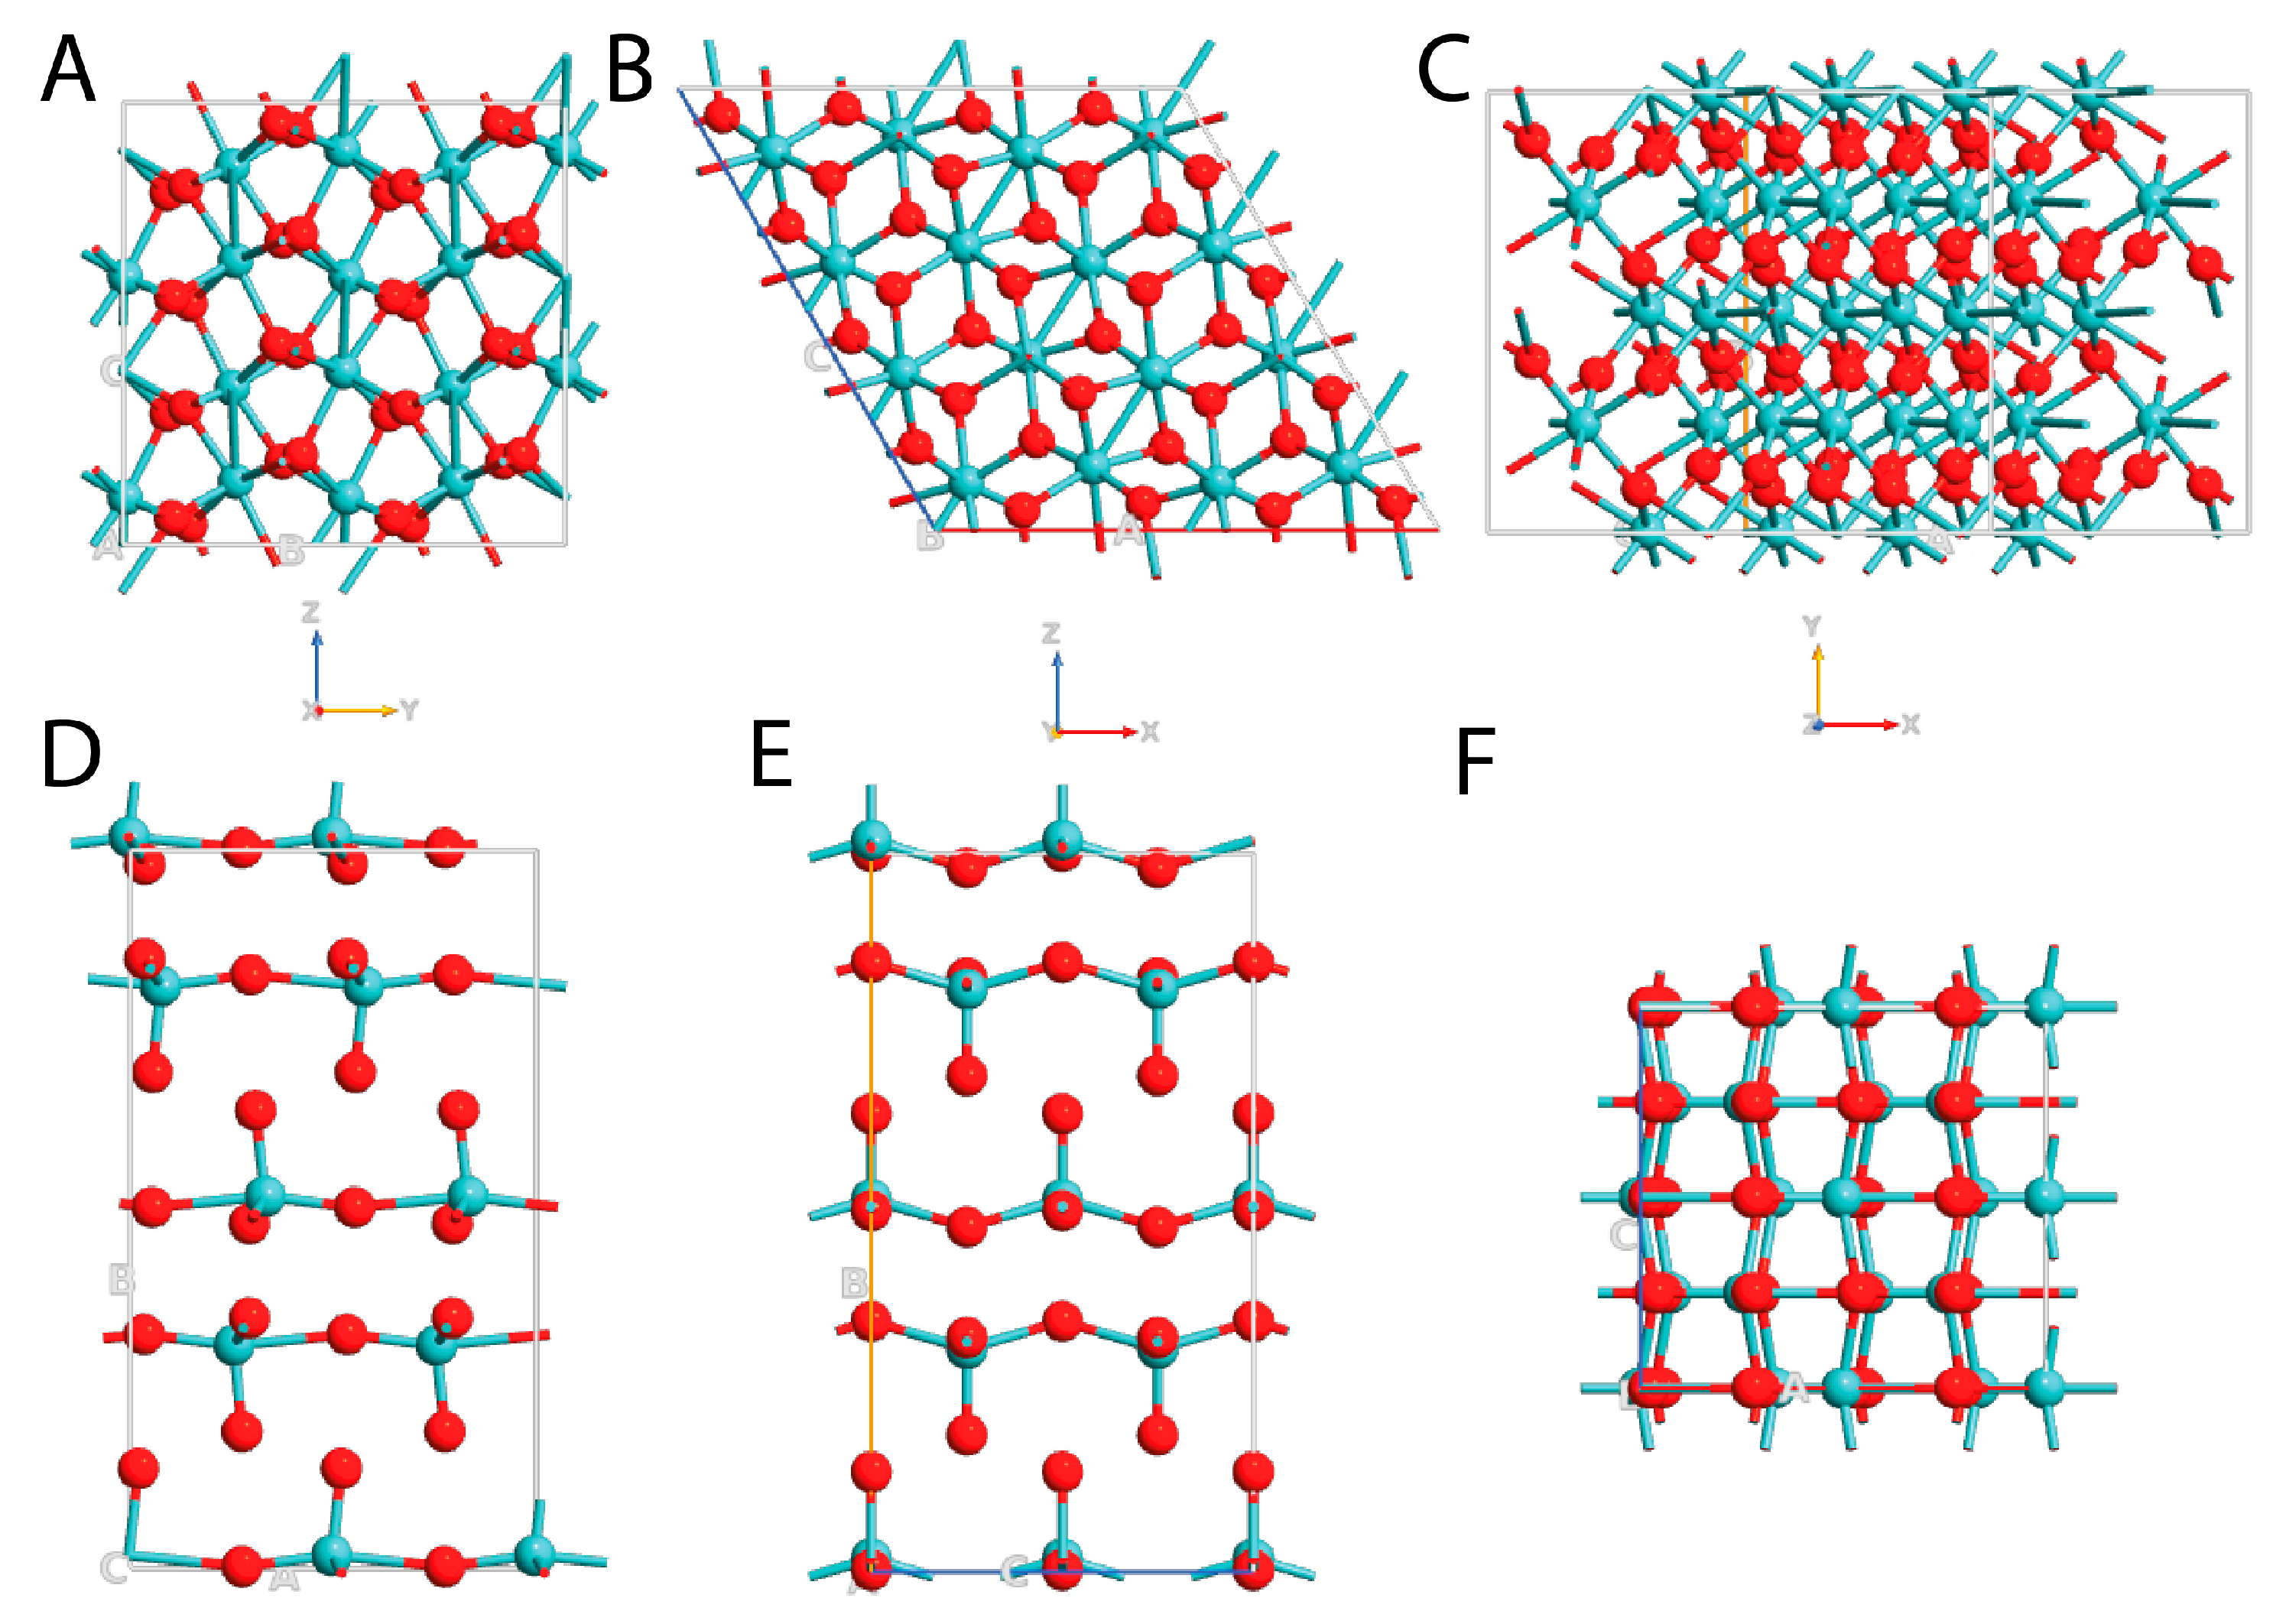
3.1. Geometrical and Lattice Parameters

In Figure 1 are reported the structures of both MoO3 and MoO2 from xy, yz, and xz planes, while in Table 1 are listed the values obtained after the geometry optimization for both the examined molybdenum oxides in terms of crystallographic lattice constant (the coordinate files of the optimized geometries are reported in the Supplementary Material). After the optimization of the geometry, the lattice constants of α-MoO3 were (a) 3.909 Å, (b) 13.855 Å, and (c) 3.681 Å, and α = β = γ = 90°. MoO2 adopted a monoclinic crystallographic arrangement characterized by space group P21/c, with the lattice constant of (a) 5.625 Å, (b) 4.872 Å, and (c) 5.645 Å, and α = γ = 90°, and β = 120.5°. These values were in good agreement with the previous literature [2,47,48,49], confirming the ability of our methodology to reproduce both MoOx systems.
In more detail, α-MoO3 was made by distorted octahedra MoO6 with three different crystallographic oxygens: (i) single-coordinated O(I) bonded only to one Mo atom (Mo–O length of 1.67 Å), (ii) two-coordinate O(II) located symmetrically to two Mo atoms (Mo–O lengths of 1.74 Å and 2.25 Å), and (iii) three-coordinate O(III) oxygens in which two were symmetrically positioned between two Mo atoms (Mo–O lengths of 1.94 Å) and the third one interacted with Mo on the other layer (length of 2.33 Å) (Figure 2A). In MoO2, the Mo–O bond could be described as two different coordination environments with Mo–O bond lengths of about 2.00 Å and 1.97 Å (Figure 2B).

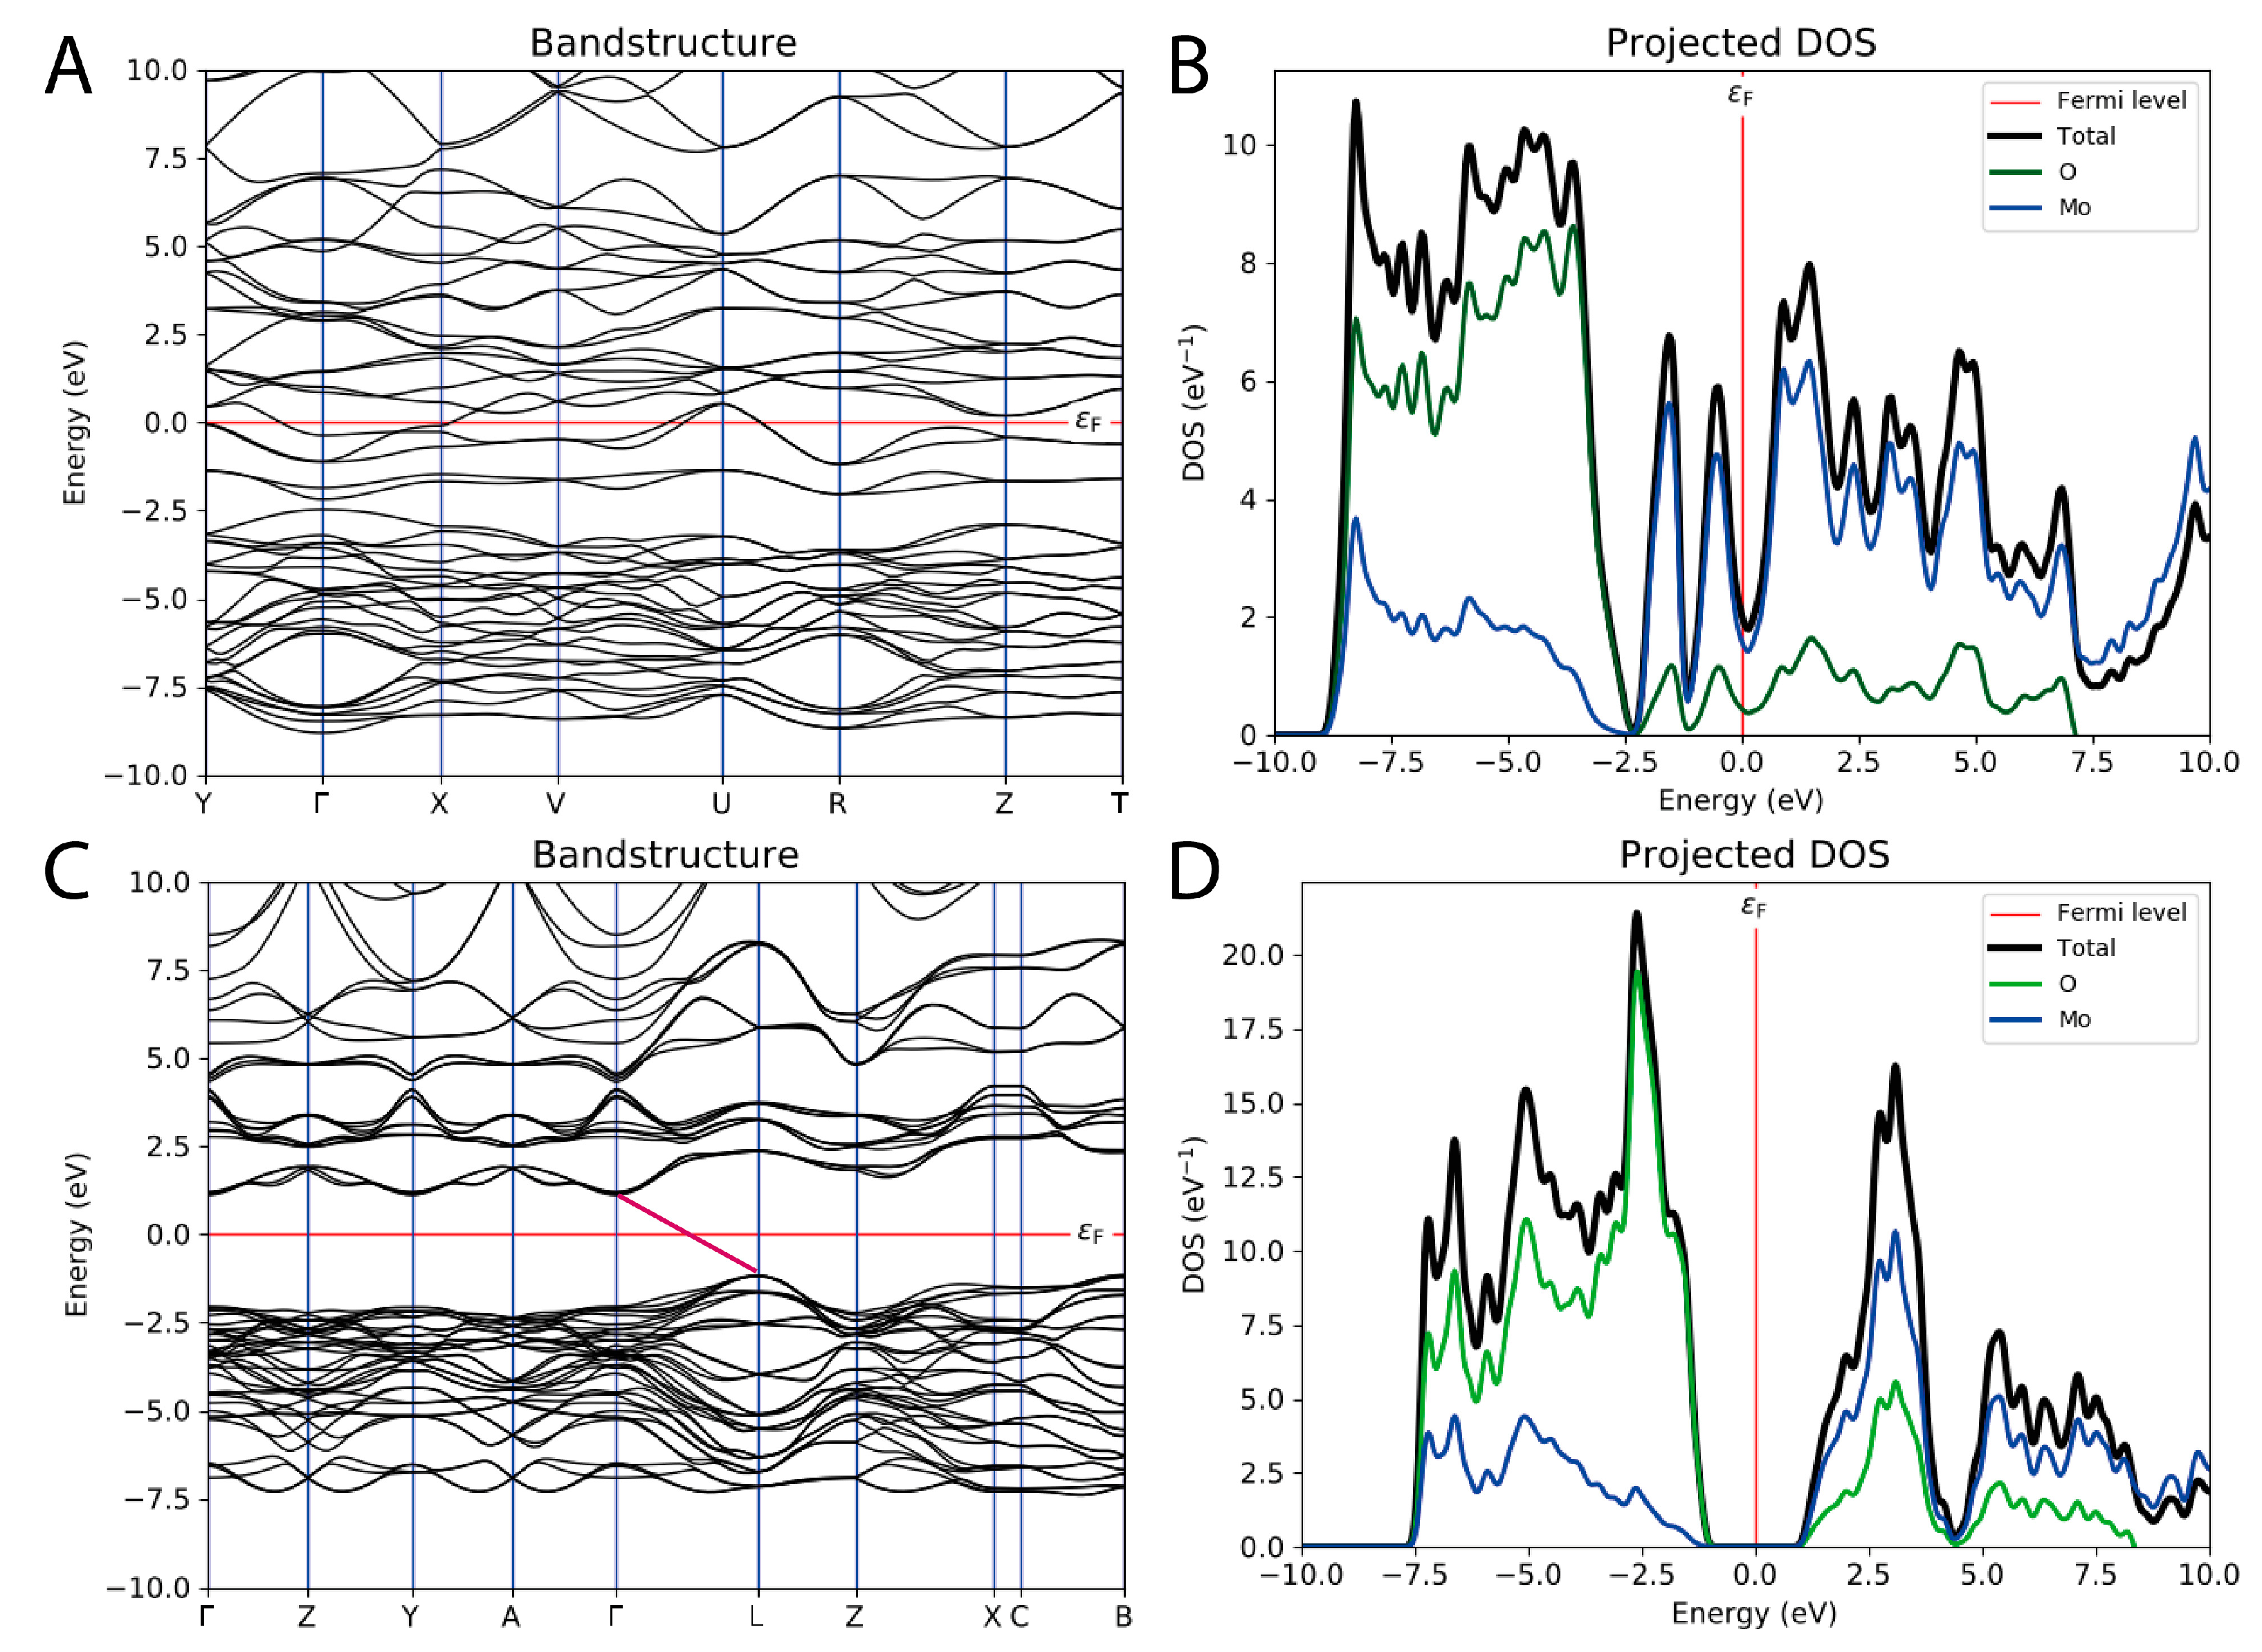
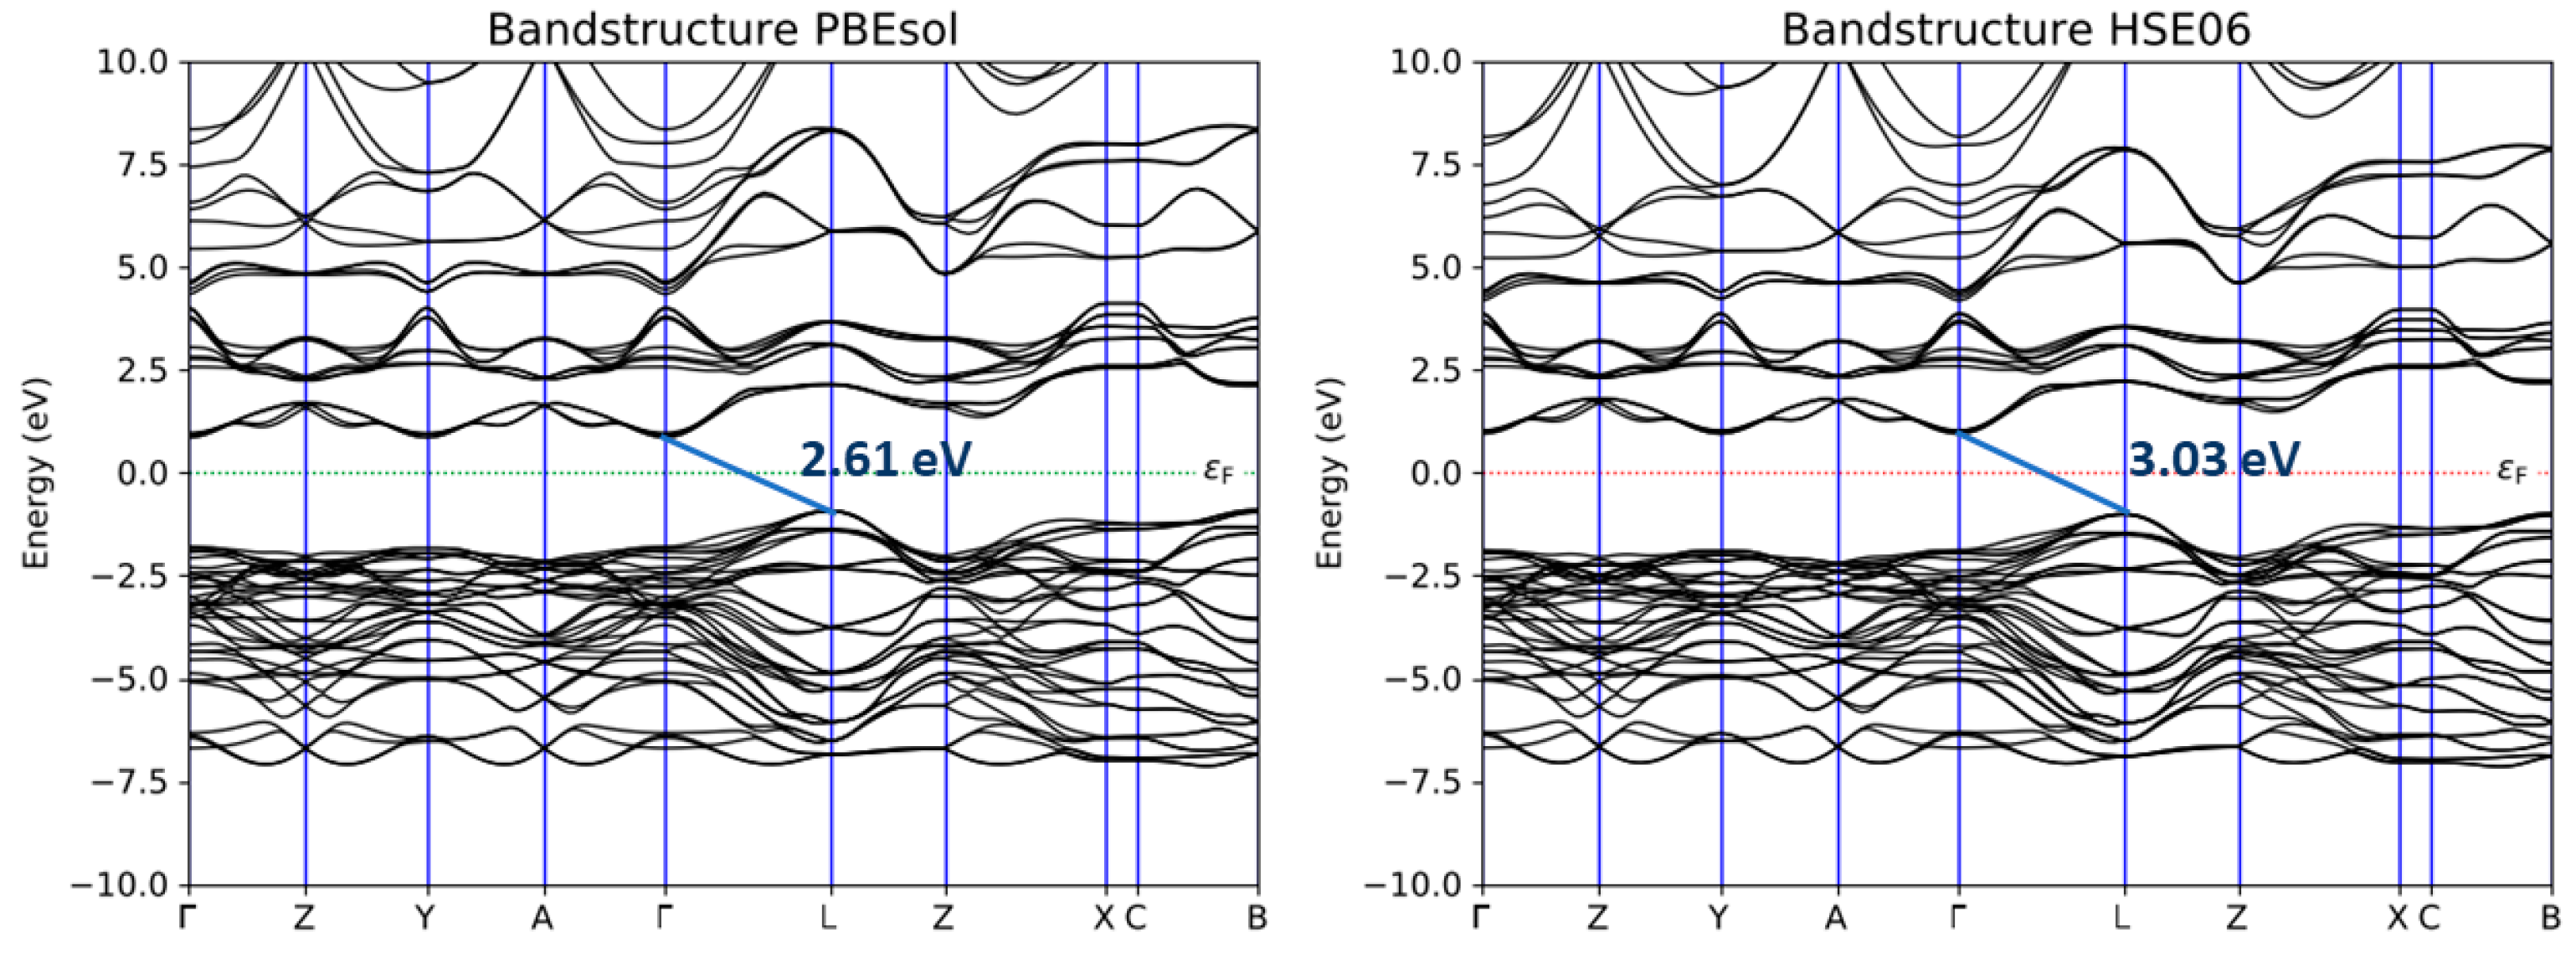
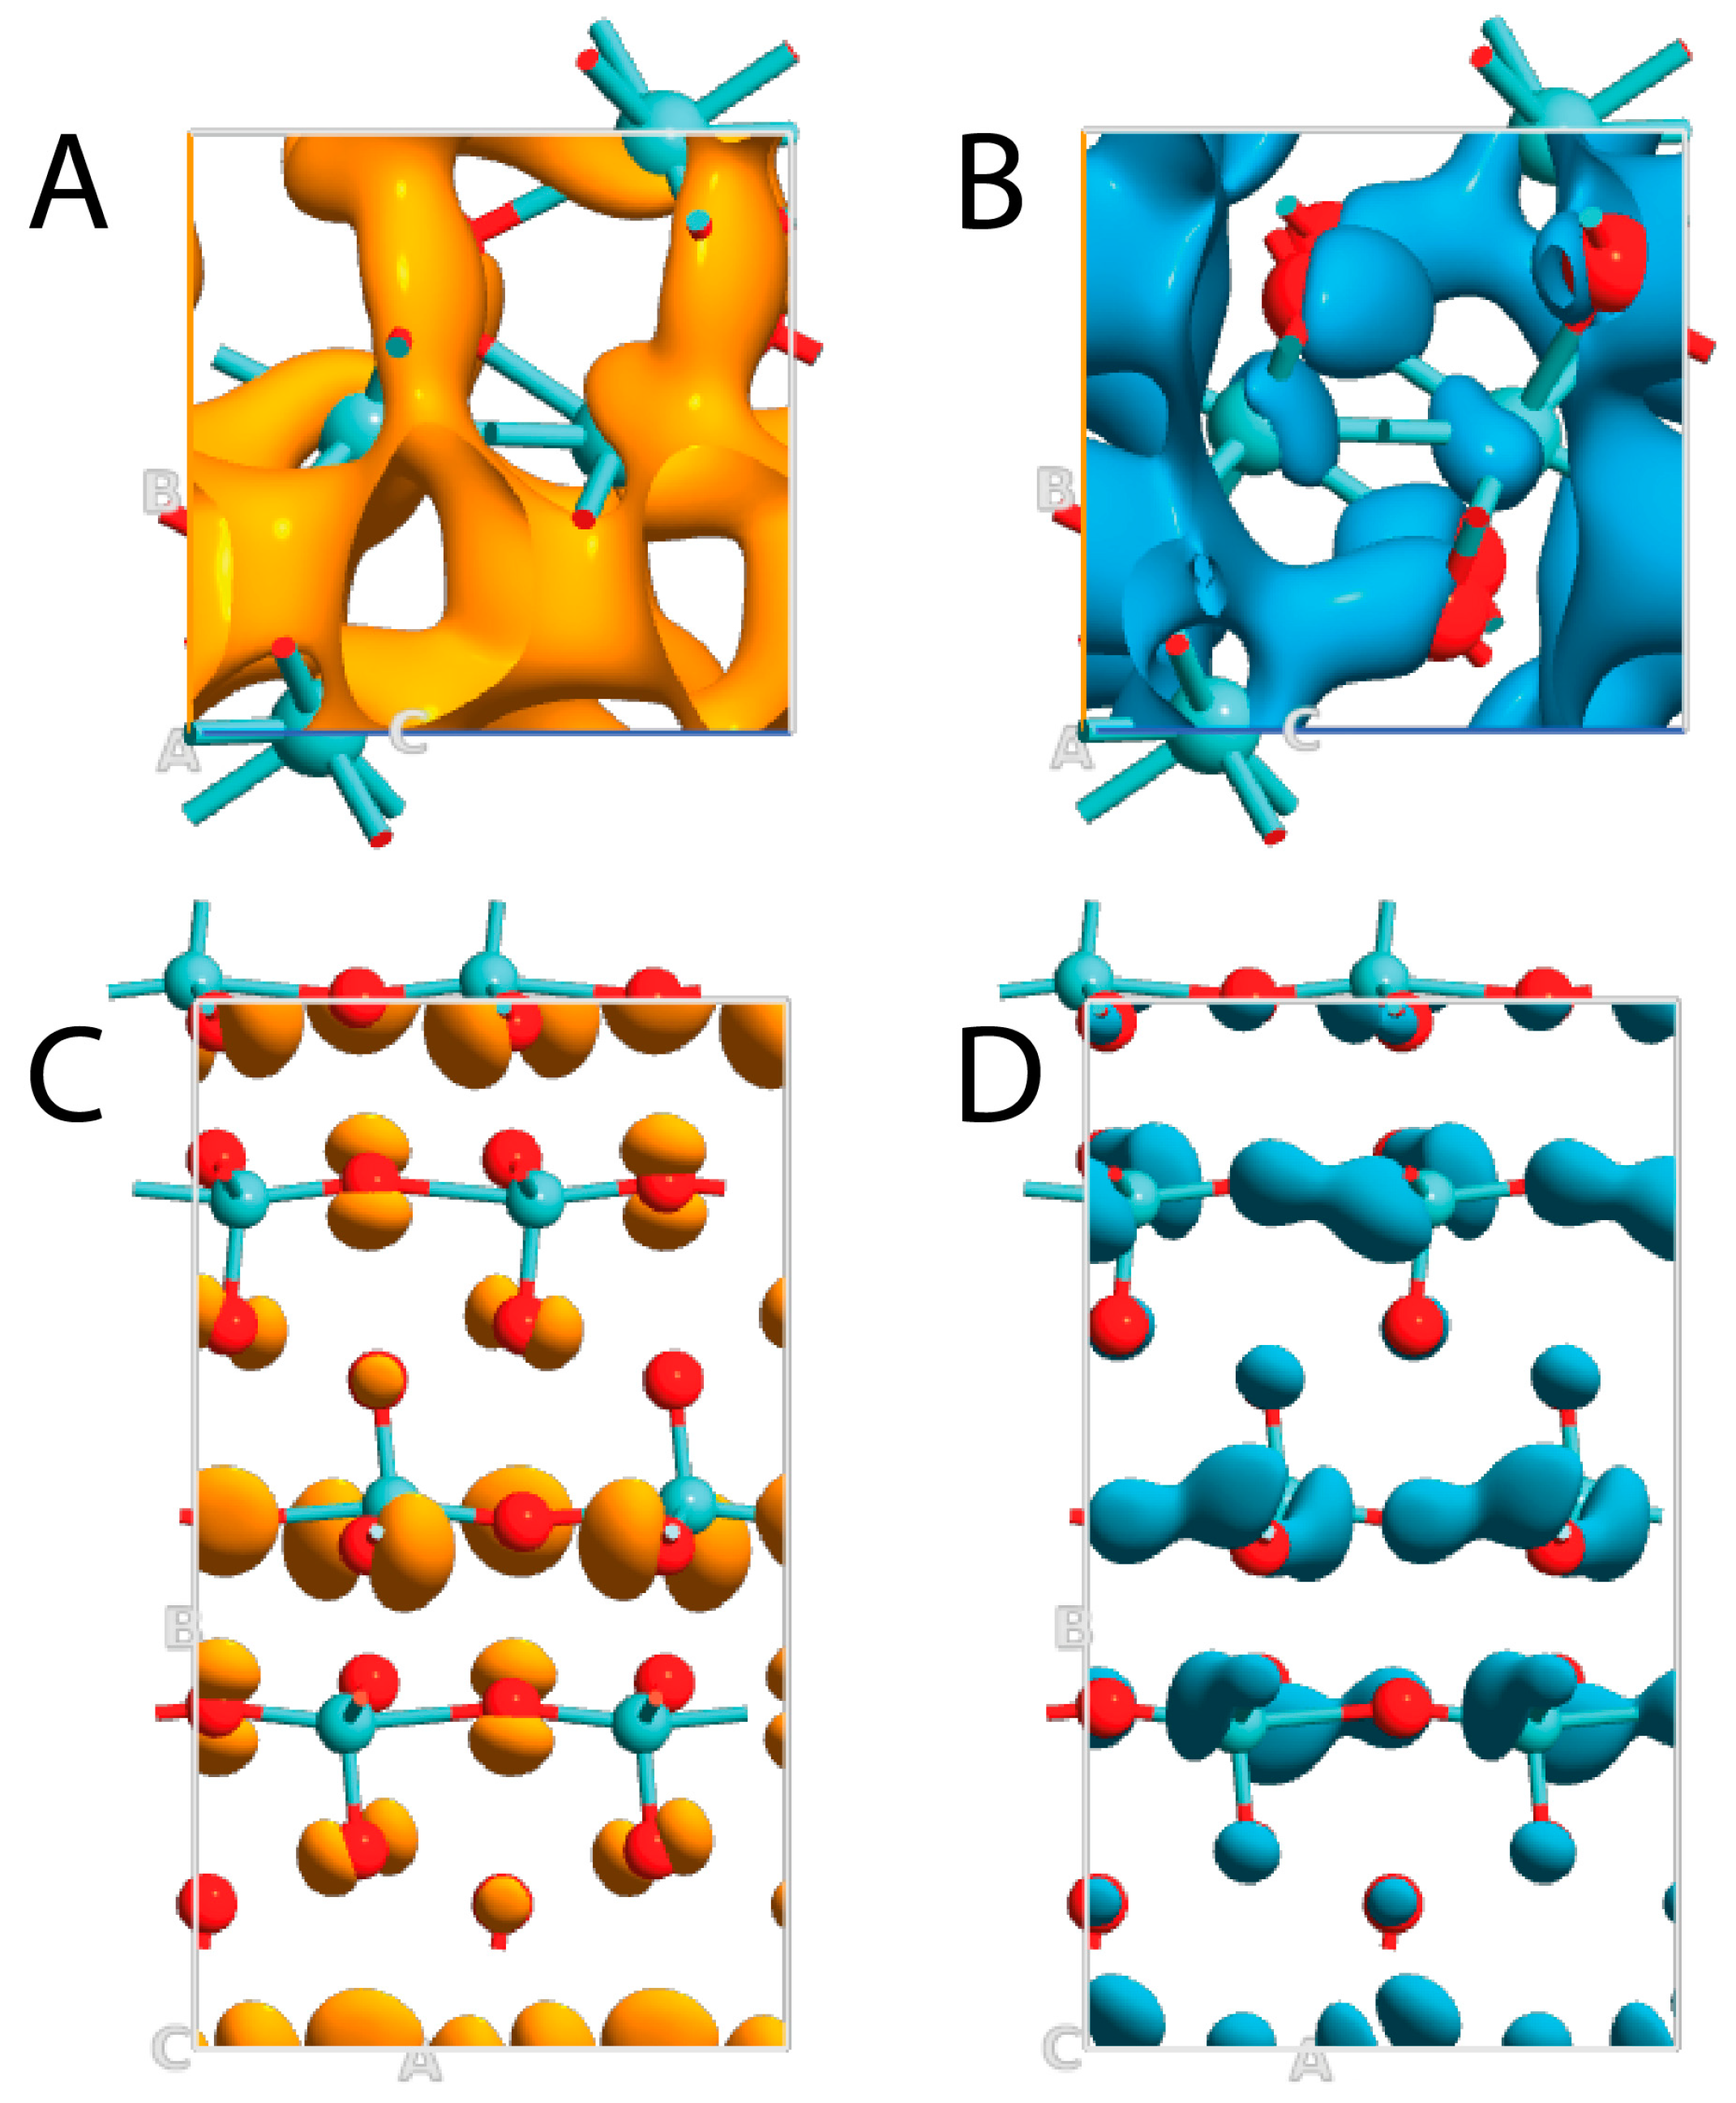
3.2. Band Structure, Band Gap, and Density of the Electronic State

In Figure 3 are reported the band structure and the PDOS of both MoO2 and α-MoO3. The different oxidation states of molybdenum, which are +4 in MoO2 and +6 in MoO3, and the crystallographic displacement of the atoms, monoclinic for MoO2 and orthorhombic for MoO3, led to completely different electronic behaviors. As attested by the band structure (Figure 3A), MoO2 had zero band gap energy and the valence and the conduction bands were overlapping at the Fermi level. The DOS showed how the main contribution to the valence band originated from the oxygen, even if near the Fermi level the situation reversed and molybdenum started to play a fundamental role. The portion between −8 eV and −2.5 eV was mainly composed of the O 2p orbitals, and only a minor contribution arose from the d states of Mo that by contrast became predominant between –2.5 eV and the Fermi level. Above the Fermi level, the Mo 4d states determined the main trend with only a small involvement of the O states. Mo resulted in the leading responsibility of the conduction band, while above the Fermi level the 4d states of Mo determined the main trend with only a small contribution of the O states (Figure 3B). These results perfectly match what was observed by other authors previously [35,36].
MoO3 is an indirect bandgap material; thus, the energy band gap resulted in 3.16 eV (with a direct band gap of 2.27 eV) (Figure 3C), and, to the best of our knowledge, this value is the one that best matches the experimental one of 3.2 eV [12], also considering other theoretical studies [2], where a band gap of 3.027 eV was found with the HSE06 method [38]. Similarly to the MoO2, even for MoO3 the PDOS calculation showed that the valence band derived from the oxygen 2p states with a small contribution of the d state of Mo. Above the Fermi level, in the conduction portion, the Mo 6d states determined the principal trend with a minor involvement of the O states (Figure 3D). These results are in line with previous literature reports [2].
With the aim of testing the effective reliability of the SCAN functional, the MoO3 band structure was calculated again using the GGA PBEsol and the hybrid HSE06 functionals (Figure 4). The results were compared with the those obtained with the MGGA approach. The indirect bandgap detected with PBEsol was 2.61 eV, which means that the Generalized Gradient Approximation tended to underestimate the energy gap between valence and conduction bands. Using HSE06, the incorporation of a portion of the exact exchange from Hartree–Fock theory allowed us to obtain an indirect bandgap value of 3.03 eV, which is also in line with other previously conducted studies [38]. In any case, the SCAN functional was found to be the most accurate for the prediction of electrical properties of Mo–O-based systems, and for this reason, all the next calculations reported were performed using this MGGA approach.
The HOMO–LUMO visualization of both MoOx materials was also reported to better indicate the metallic and dielectric behaviors of MoO2 and MoO3, respectively. Starting with the first one, LUMO was evidently present in correspondence of the Mo atoms, even if it was possible to easily identify it also on the O atoms in a symmetrical manner by following the space group of the unit cell (Figure 5A). This confirmed that the largest contribution in the bands beyond the Fermi level came from the 4d electrons of Mo, and only a small contribution was associated with the 2p electrons of O. In a parallel way, HOMO followed a symmetric trend showing a higher localization on O atoms and moving again with a lower contribution on Mo entities. This behavior is in perfect agreement with the DOS plot, since the highest contribution in the bands below the Fermi level arose from the 2p electrons of O, and only a very small participation was attributed to the 4d electrons of Mo (Figure 5B). In any case, HOMO and LUMO clouds complemented each other in the MoO2 structure, confirming the metallic behavior and the bonding homology between Mo and O entities.
Focusing on MoO3, peculiar characteristics were detected. In this case, LUMO was again predominantly localized on Mo entities, but only axial O atoms showed a small contribution (Figure 5C). This means that the Mo–O connections exhibited both ionic (the charge transfer from 2p orbital of oxygen to molybdenum) and covalent (charge accumulation in the region of Mo–O) components, and the MoO3 bonds were not equal. Furthermore, HOMO was particularly localized on the O atoms in an asymmetric way (Figure 5D). This means that the valence band came from the 2p electrons of O and only in a small part from 4d electrons of Mo, while the opposite was observed for the conduction bands.

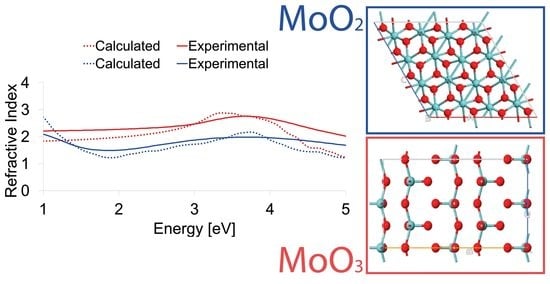
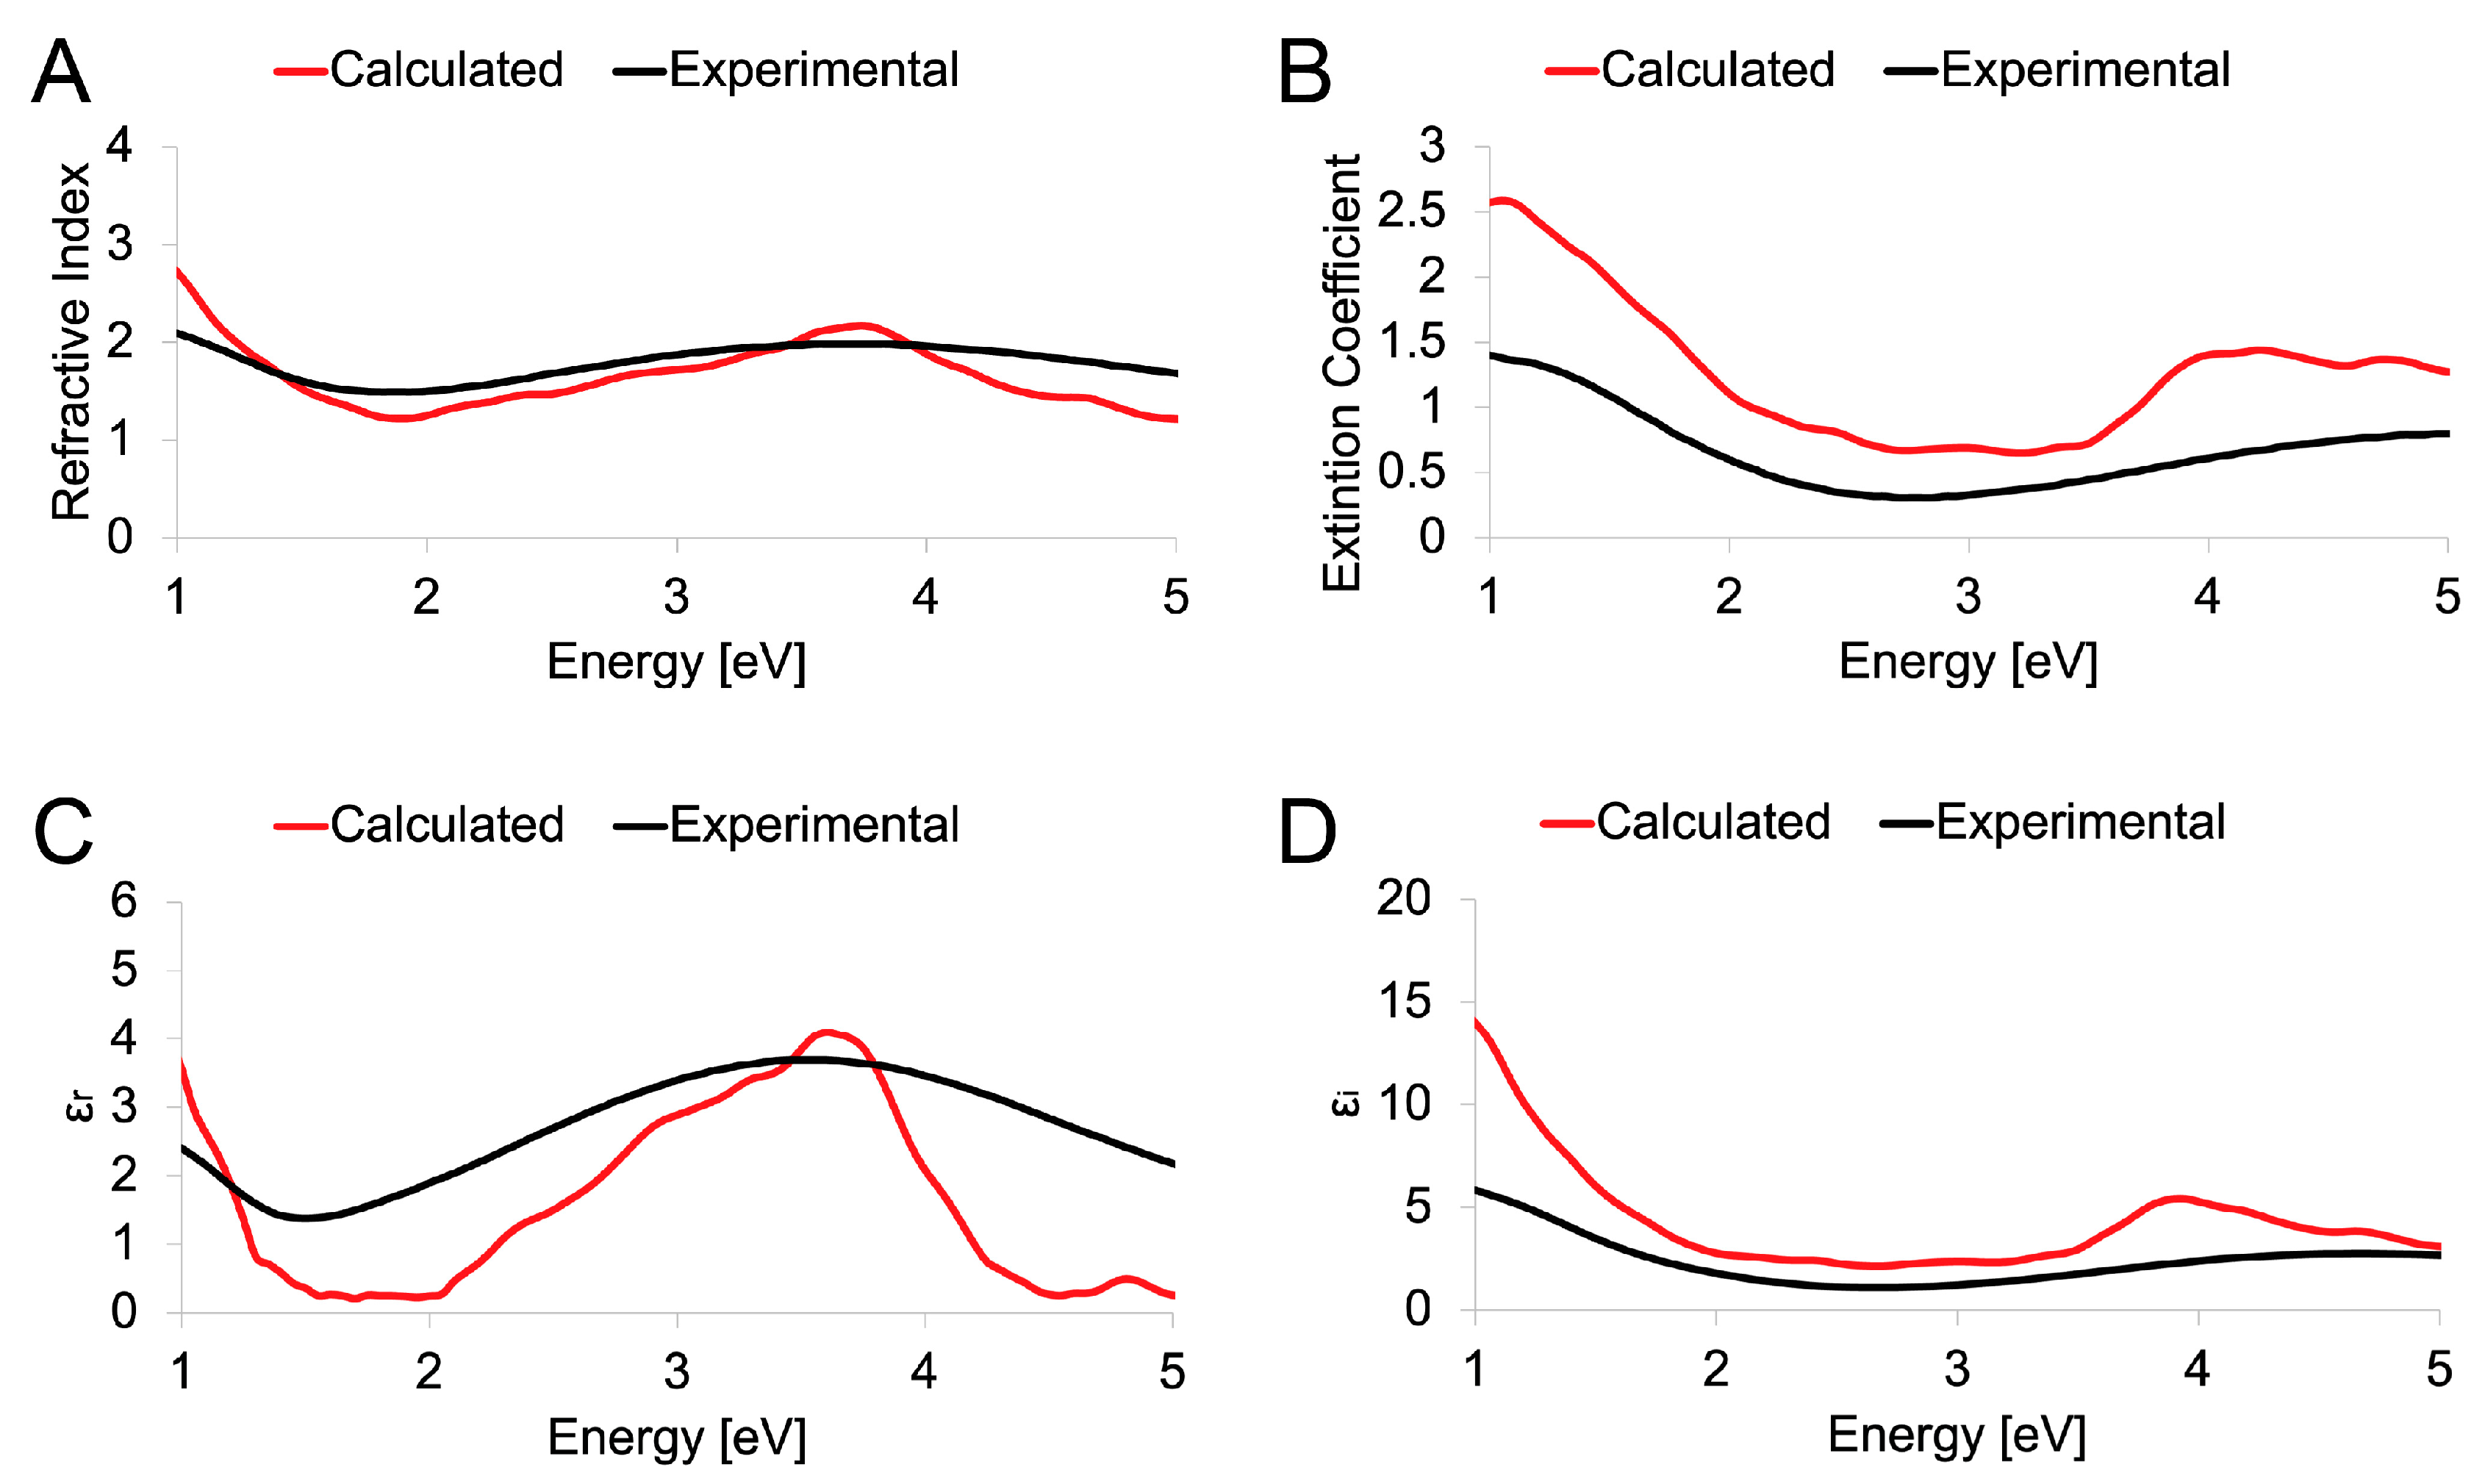
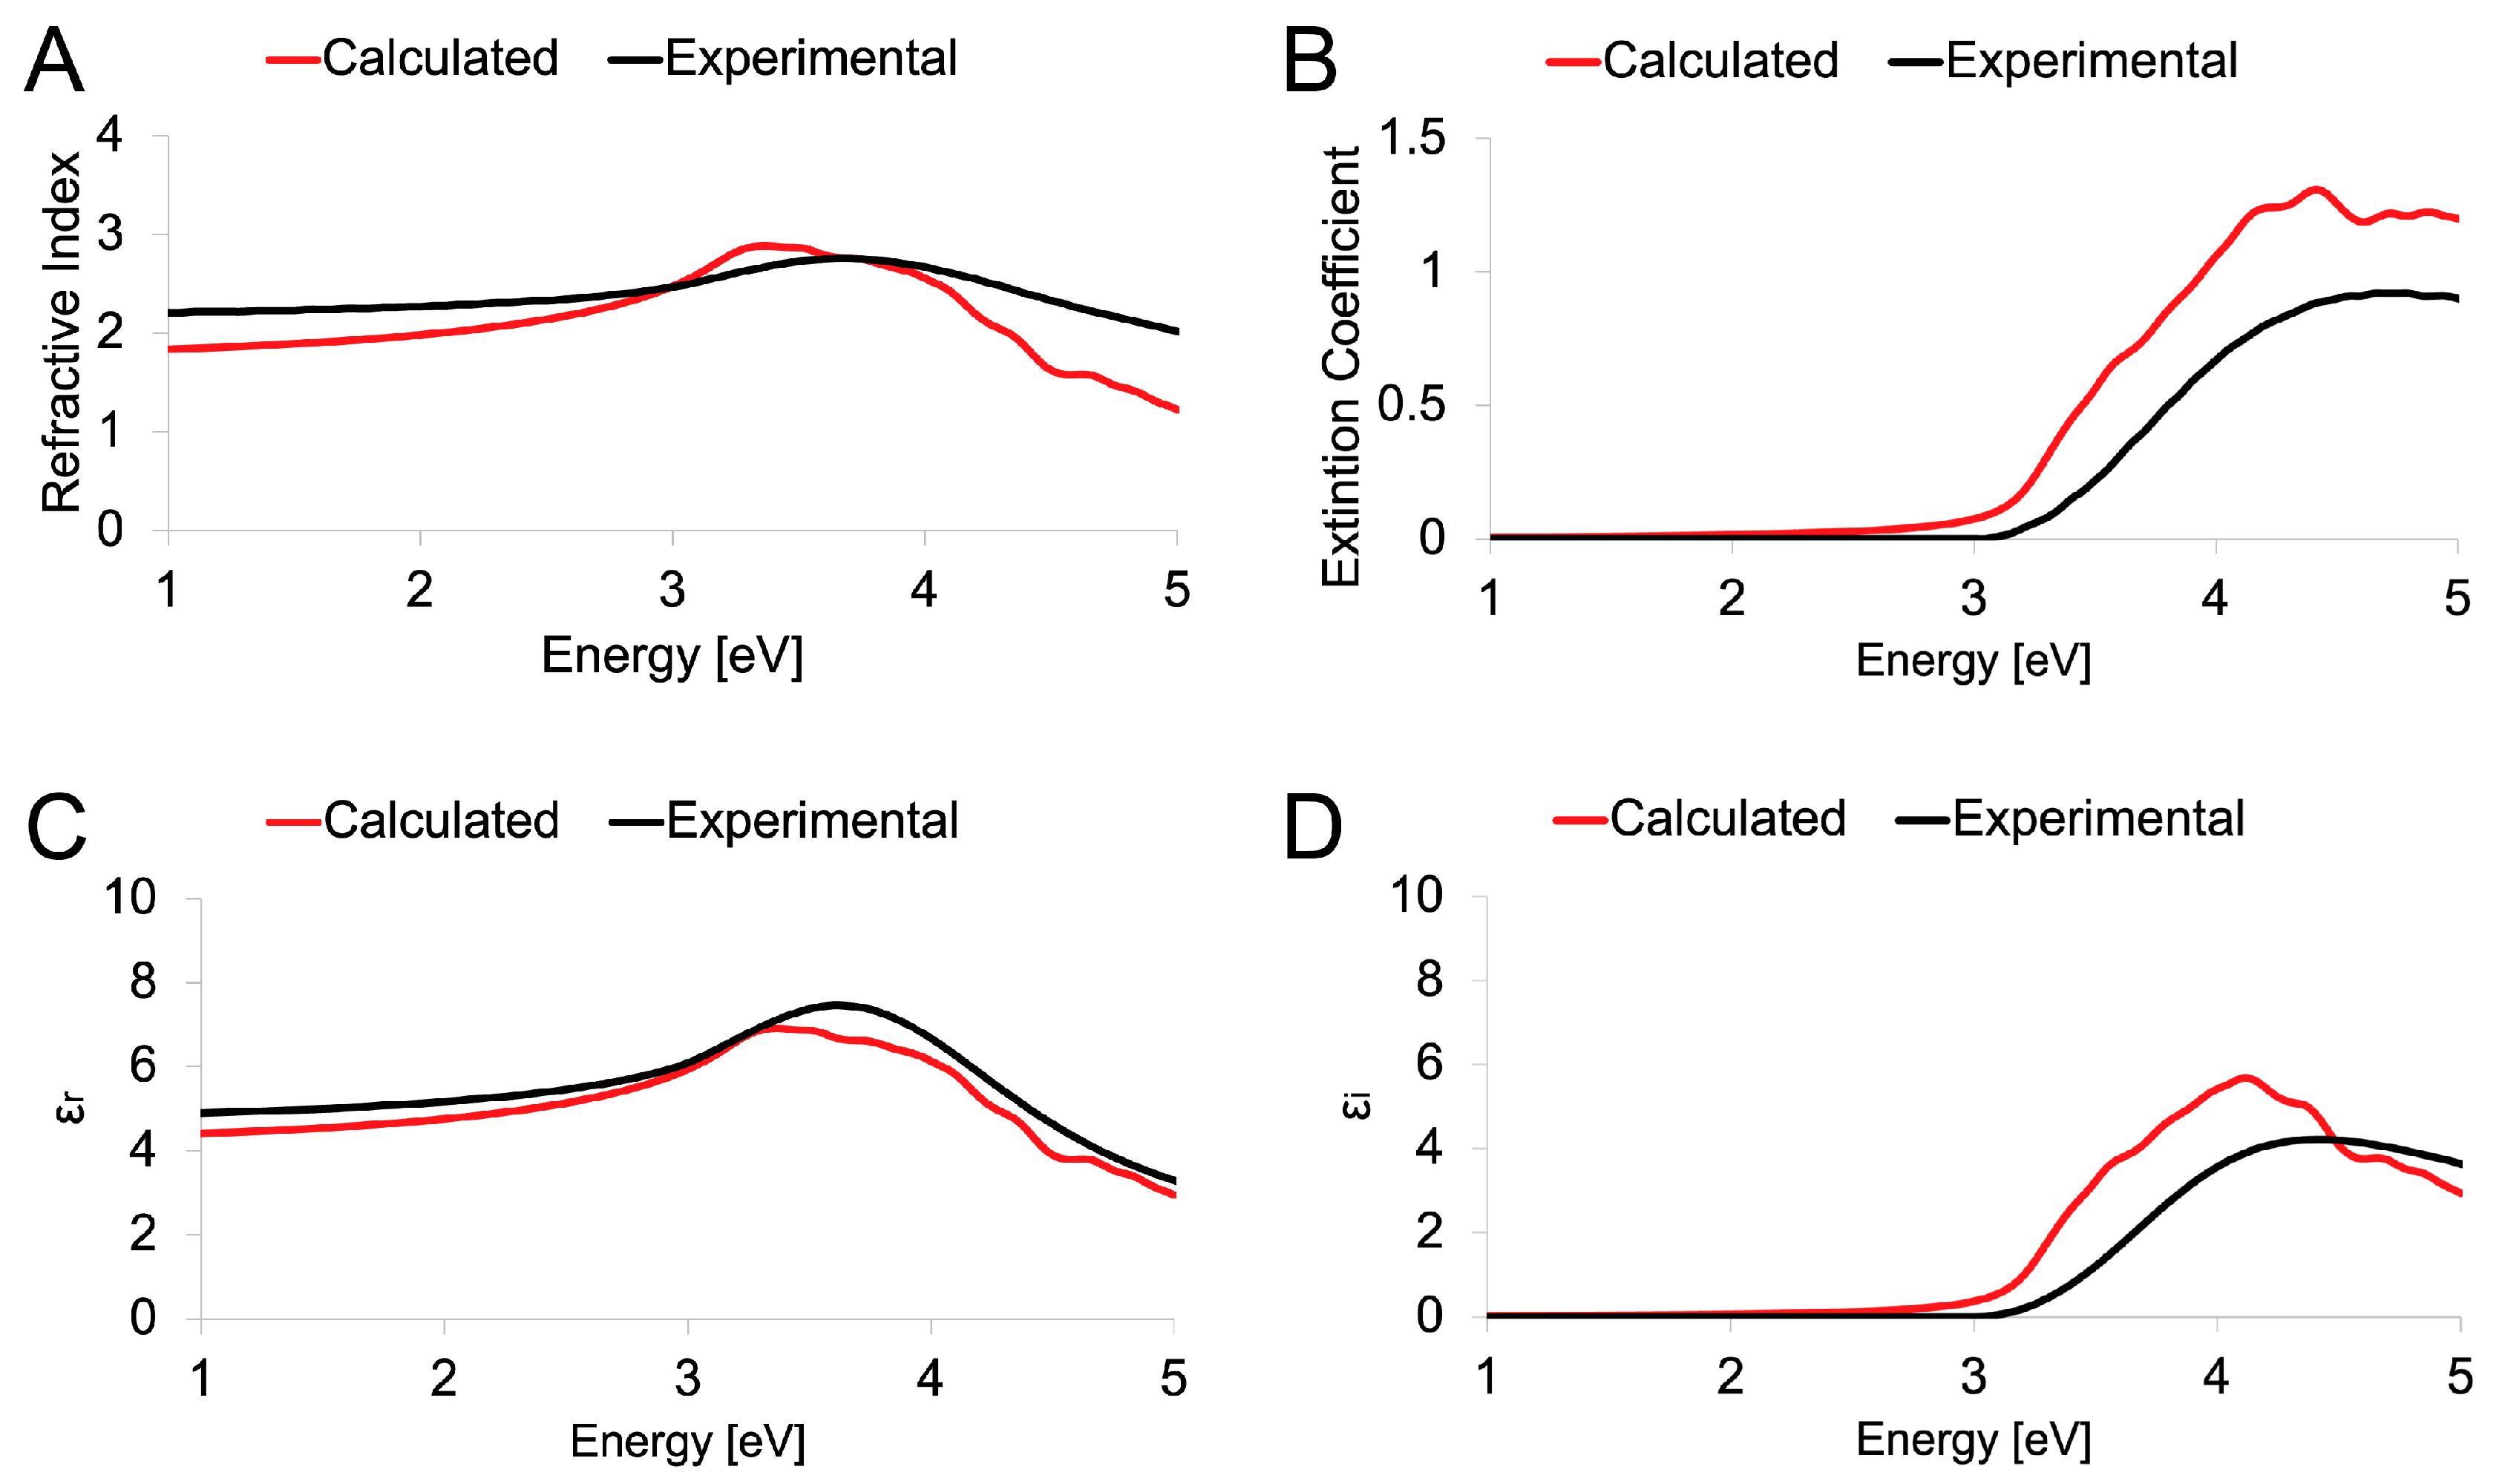
3.3. Experimental and Theoretical Optical Spectra

In order to confirm the ability of the DFT methodology proposed herein to describe the peculiarities of both MoO2 and MoO3, the experimentally recorded optical spectra were compared to the simulated ones. The evaluation regarded (i) the refractive index, which is useful to understand the ability of the matter to bend or refract the light that passes through the material itself; (ii) the extinction coefficient, which represents the capability of the matter to absorb the light; (iii) the real part (εr) of the dielectric function, which describes the ability of the matter to interact with an electric field without absorbing energy; and (iv) the imaginary part (εi) of the dielectric function, which describes the ability of the matter to permanently absorb energy from a time-varying electric field; the spectra were reported in the function of the energy of the applied (and simulated) electric field expressed in eV.
The MoO2 optical spectra, simulated and recorded experimentally, are reported in Figure 6. From the comparison between the theoretical curve (in red) and the experimental (black) it is possible to notice good agreement in all four reported cases, with a small overestimation in the calculated spectra in terms of the extinction coefficient and the imaginary part of the dielectric constant. The reason for the small discrepancies between calculated and experimental evidence may be due to some small differences in the three-dimensional systems. In fact, MoO2 and MoO3 were considered in simulations as single crystals, while polycrystalline structures can be obtained during fabrication. These differences in microstructures of the materials were reflected in the optical properties observed and plotted together. Overall, good agreement was observed in the position of most critical points in the optical constants spectra. Moreover, when a disorder occurred, a change in the magnitude of the optical properties was expected.
Similarly, Figure 7 reported the optical spectra of MoO3. In this case, agreement between the experimental obtained and the estimated by the theoretical method was more evident, demonstrating the capability of the MGGA-SCAN proposed methodology to predict and verify the experimental findings.
The slight increase in discrepancy between experimental and simulated data for MoO2 can be attributed to the metallic character of the material, since this behavior is more difficult to reproduce with first-principle methods during optical properties calculations. Nevertheless, the SCAN functional seems to satisfactorily approach the experimental evidence.

4. Conclusions

In the present study, the properties of the well-known MoO3 and MoO2 systems were investigated. These compounds have attracted the attention of the scientific community thanks to their electronic and optical properties. MoO3 assumes an orthorhombic phase, named α-MoO3 that belongs to the space group Pbmn; MoO2 adopts a monoclinic crystallographic disposition described by space group P21/c. The electronic and optical properties of both MoO3 and MoO2 were investigated using the MGGA-SCAN functional and the PseudoDojo pseudopotential, and then our calculated results were compared with previously reported experimental data and our recorded optical spectra. The results obtained confirmed that the chosen theoretical modeling methodology is highly accurate and able to reproduce the experimental findings of both MoO3 and MoO2. Moreover, it is important to underline that the band structure and the respective band gap calculated for MoO3 is the one that best matches the experimental one. Even by repeating the calculation with other known and widely used functionals, it was not possible to obtain the optimal bandgap, thus indicating the high sensitivity of the chosen method. The HOMO–LUMO descriptions of both MoO2 and MoO3 better clarified the peculiarities of these materials, shedding light on the role of different Mo–O bonds on the basis of metallic–dielectric behavior. Additionally, the recorded optical spectra in terms of refractive index, extinction coefficient, and the real and imaginary parts of the dielectric constant were in very good agreement with the corresponding calculated values by means of our ab initio methodology. The adopted first-principles study verified the experimental data available, identified the effects of one more O atom in the Mo-based structure, and provided a reasonable prediction of the physical–chemical properties of both systems, allowing us to clarify in detail the properties of these materials at the nanoscale.

Supplementary Materials

The supporting information about the input geometries of both the Mo systems can be downloaded at: https://www.mdpi.com/article/10.3390/nano13081319/s1.

Author Contributions

Conceptualization, E.L., E.P., E.M., M.G.M. and P.S.; methodology, E.L. and E.P.; software, E.L. and E.M.; validation, E.L. and E.P.; formal analysis, E.L., E.M. and P.S.; investigation, E.L., M.G.M. and L.P.; resources, E.L. and D.M; data curation, E.L. and P.S.; writing—original draft preparation, E.L. and E.P.; writing—review and editing, E.L., E.P., M.G.M., E.M., P.S., L.P. and D.M.; visualization, E.L. and E.P.; All authors have read and agreed to the published version of the manuscript.

Funding

This work is funded by the European Project “Nanomaterials enabling smart energy harvesting for next-generation Internet-of-Things” (NANO-EH) (grant agreement No. 951761) (FETPROACT-EIC-05-2019).

Data Availability Statement

Not applicable.

Acknowledgments

This work is part of the research of H2020 (FETPROACT-EIC-05-2019) “Nanomaterials enabling smart energy harvesting for next-generation Internet-of-Things” (NANO-EH) (grant agreement No. 951761).

Conflicts of Interest

The authors declare no conflict of interest.

References

  1. De Castro, I.A.; Datta, R.S.; Ou, J.Z.; Castellanos-Gomez, A.; Sriram, S.; Daeneke, T.; Kalantar-zadeh, K. Molybdenum Oxides—From Fundamentals to Functionality. Adv. Mater. 2017, 29, 1701619. [Google Scholar] [CrossRef]
  2. Scanlon, D.O.; Watson, G.W.; Payne, D.J.; Atkinson, G.R.; Egdell, R.G.; Law, D.S.L. Theoretical and Experimental Study of the Electronic Structures of MoO3 and MoO2. J. Phys. Chem. C 2010, 114, 4636–4645. [Google Scholar] [CrossRef]
  3. Boyadjian, C.; Lefferts, L. Promoting Li/MgO Catalyst with Molybdenum Oxide for Oxidative Conversion of n-Hexane. Catalysts 2020, 10, 354. [Google Scholar] [CrossRef] [Green Version]
  4. Taylor, S.H.; Hargreaves, J.S.J.; Hutchings, G.J.; Joyner, R.W.; Lembacher, C.W. The Partial Oxidation of Methane to Methanol: An Approach to Catalyst Design. Catal. Today 1998, 42, 217–224. [Google Scholar] [CrossRef]
  5. Balendhran, S.; Walia, S.; Alsaif, M.; Nguyen, E.P.; Ou, J.Z.; Zhuiykov, S.; Sriram, S.; Bhaskaran, M.; Kalantar-Zadeh, K. Field Effect Biosensing Platform Based on 2D α-MoO3. ACS Nano 2013, 7, 9753–9760. [Google Scholar] [CrossRef] [PubMed]
  6. Battaglia, C.; Yin, X.; Zheng, M.; Sharp, I.D.; Chen, T.; McDonnell, S.; Azcatl, A.; Carraro, C.; Ma, B.; Maboudian, R.; et al. Hole Selective MoOx Contact for Silicon Solar Cells. Nano Lett. 2014, 14, 967–971. [Google Scholar] [CrossRef] [PubMed]
  7. Zheng, J.Y.; Haider, Z.; Van, T.K.; Pawar, A.U.; Kang, M.J.; Kim, C.W.; Kang, Y.S. Tuning of the Crystal Engineering and Photoelectrochemical Properties of Crystalline Tungsten Oxide for Optoelectronic Device Applications. CrystEngComm 2015, 17, 6070–6093. [Google Scholar] [CrossRef]
  8. Santhosh, S.; Mathankumar, M.; Selva Chandrasekaran, S.; Nanda Kumar, A.K.; Murugan, P.; Subramanian, B. Effect of Ablation Rate on the Microstructure and Electrochromic Properties of Pulsed-Laser-Deposited Molybdenum Oxide Thin Films. Langmuir 2017, 33, 19–33. [Google Scholar] [CrossRef]
  9. Ranjba, M.; Delalat, F.; Salamati, H. Molybdenum Oxide Nanosheets Prepared by an Anodizing-Exfoliation Process and Observation of Photochromic Properties. Appl. Surf. Sci. 2017, 396, 1752–1759. [Google Scholar] [CrossRef]
  10. Tomás, S.A.; Arvizu, M.A.; Zelaya-Angel, O.; Rodríguez, P. Effect of ZnSe Doping on the Photochromic and Thermochromic Properties of MoO3 Thin Films. Thin Solid Films 2009, 518, 1332–1336. [Google Scholar] [CrossRef]
  11. Bandaru, S.; Saranya, G.; English, N.J.; Yam, C.; Chen, M. Tweaking the Electronic and Optical Properties of A-MoO3 by Sulphur and Selenium Doping—A Density Functional Theory Study. Sci. Rep. 2018, 8, 10144. [Google Scholar] [CrossRef] [PubMed] [Green Version]
  12. Balendhran, S.; Deng, J.; Ou, J.Z.; Walia, S.; Scott, J.; Tang, J.; Wang, K.L.; Field, M.R.; Russo, S.; Zhuiykov, S.; et al. Enhanced Charge Carrier Mobility in Two-Dimensional High Dielectric Molybdenum Oxide. Adv. Mater. 2013, 25, 109–114. [Google Scholar] [CrossRef]
  13. Mohebbi, E.; Pavoni, E.; Mencarelli, D.; Stipa, P.; Pierantoni, L.; Laudadio, E. Insights into First-Principles Characterization of the Monoclinic VO2(B) Polymorph via DFT + U Calculation: Electronic, Magnetic and Optical Properties. Nanoscale Adv. 2022, 4, 3634–3646. [Google Scholar] [CrossRef]
  14. Mohebbi, E.; Pavoni, E.; Mencarelli, D.; Stipa, P.; Pierantoni, L.; Laudadio, E. PBEsol/HSE Functional: A Promising Candidate for Vanadium Dioxide (B) Characterization. RSC Adv. 2022, 12, 31255–31263. [Google Scholar] [CrossRef]
  15. Cueff, S.; John, J.; Zhang, Z.; Parra, J.; Sun, J.; Orobtchouk, R.; Ramanathan, S.; Sanchis, P. VO2 Nanophotonics. APL Photonics 2020, 5, 110901. [Google Scholar] [CrossRef]
  16. Alves, L.M.S.; Benaion, S.S.; Romanelli, C.M.; dos Santos, C.A.M.; da Luz, M.S.; de Lima, B.S.; Oliveira, F.S.; Machado, A.J.S.; Guedes, E.B.; Abbate, M.; et al. Electrical Resistivity in Non-Stoichiometric MoO2. Braz. J. Phys. 2015, 45, 234–237. [Google Scholar] [CrossRef]
  17. Boukhachem, A.; Bouzidi, C.; Boughalmi, R.; Ouerteni, R.; Kahlaoui, M.; Ouni, B.; Elhouichet, H.; Amlouk, M. Physical Investigations on MoO3 Sprayed Thin Film for Selective Sensitivity Applications. Ceram. Int. 2014, 40, 13427–13435. [Google Scholar] [CrossRef]
  18. Pavoni, E.; Mohebbi, E.; Stipa, P.; Mencarelli, D.; Pierantoni, L.; Laudadio, E. The Role of Zr on Monoclinic and Orthorhombic Hfx Zry O2 Systems: A First-Principles Study. Materials 2022, 15, 4175. [Google Scholar] [CrossRef]
  19. Pavoni, E.; Mohebbi, E.; Mencarelli, D.; Stipa, P.; Laudadio, E.; Pierantoni, L. The Effect of Y Doping on Monoclinic, Orthorhombic, and Cubic Polymorphs of HfO2: A First Principles Study. Nanomaterials 2022, 12, 4324. [Google Scholar] [CrossRef]
  20. Camacho-López, M.A.; Escobar-Alarcón, L.; Picquart, M.; Arroyo, R.; Córdoba, G.; Haro-Poniatowski, E. Micro-Raman Study of the m-MoO2 to α-MoO3 Transformation Induced by Cw-Laser Irradiation. Opt. Mater. 2011, 33, 480–484. [Google Scholar] [CrossRef]
  21. Taddei, P.; Ruggiero, A.; Pavoni, E.; Affatato, S. Transfer of Metallic Debris after in Vitro Ceramic-on-Metal Simulation: Wear and Degradation in Biolox® Delta Composite Femoral Heads. Compos. B Eng. 2017, 115, 477–487. [Google Scholar] [CrossRef]
  22. Feng, Y.; Liu, H.; Liu, Y.; Li, J. Tunable Oxygen Deficient in MoO3-x/MoO2 Heterostructure for Enhanced Lithium Storage Properties. Int. J. Energy Res. 2022, 46, 5789–5799. [Google Scholar] [CrossRef]
  23. Divigalpitiya, W.M.R.; Frindt, R.F.; Morrison, S.R. Oriented Films of Molybdenum Trioxide. Thin Solid Films 1990, 188, 173–179. [Google Scholar] [CrossRef]
  24. Balendhran, S.; Walia, S.; Nili, H.; Ou, J.Z.; Zhuiykov, S.; Kaner, R.B.; Sriram, S.; Bhaskaran, M.; Kalantar-Zadeh, K. Two-Dimensional Molybdenum Trioxide and Dichalcogenides. Adv. Funct. Mater. 2013, 23, 3952–3970. [Google Scholar] [CrossRef]
  25. Pavoni, E.; Bandini, E.; Benaglia, M.; Molloy, J.K.; Bergamini, G.; Ceroni, P.; Armaroli, N. A Tailored RAFT Copolymer for the Dispersion of Single Walled Carbon Nanotubes in Aqueous Media. Polym. Chem. 2014, 5, 6148–6150. [Google Scholar] [CrossRef]
  26. Zhao, Y.; Zhang, Y.; Yang, Z.; Yan, Y.; Sun, K. Synthesis of MoS2 and MoO2 for Their Applications in H2 Generation and Lithium Ion Batteries: A Review. Sci. Technol. Adv. Mater. 2013, 14, 43501–43513. [Google Scholar] [CrossRef] [PubMed] [Green Version]
  27. Zhang, Q.; Li, X.; Ma, Q.; Zhang, Q.; Bai, H.; Yi, W.; Liu, J.; Han, J.; Xi, G. A Metallic Molybdenum Dioxide with High Stability for Surface Enhanced Raman Spectroscopy. Nat. Commun. 2017, 8, 14903. [Google Scholar] [CrossRef] [PubMed] [Green Version]
  28. Hu, X.; Zhang, W.; Liu, X.; Mei, Y.; Huang, Y. Nanostructured Mo-Based Electrode Materials for Electrochemical Energy Storage. Chem. Soc. Rev. 2015, 44, 2376–2404. [Google Scholar] [CrossRef] [PubMed]
  29. Sun, J.; Ruzsinszky, A.; Perdew, J.P. Strongly Constrained and Appropriately Normed Semilocal Density Functional. Phys. Rev. Lett. 2015, 115, 36402. [Google Scholar] [CrossRef] [Green Version]
  30. van Setten, M.J.; Giantomassi, M.; Bousquet, E.; Verstraete, M.J.; Hamann, D.R.; Gonze, X.; Rignanese, G.M. The PSEUDODOJO: Training and Grading a 85 Element Optimized Norm-Conserving Pseudopotential Table. Comput. Phys. Commun. 2018, 226, 39–54. [Google Scholar] [CrossRef] [Green Version]
  31. Sun, J. (Invited) SCAN Meta-GGA: An Accurate, Efficient, and Physically Sound Density Functional for Materials Discovery and Design. ECS Meet. Abstr. 2019, MA2019-02, 2022. [Google Scholar] [CrossRef]
  32. Sun, J.; Remsing, R.C.; Zhang, Y.; Sun, Z.; Ruzsinszky, A.; Peng, H.; Yang, Z.; Paul, A.; Waghmare, U.; Wu, X.; et al. Accurate First-Principles Structures and Energies of Diversely Bonded Systems from an Efficient Density Functional. Nat. Chem. 2016, 8, 831–836. [Google Scholar] [CrossRef] [PubMed]
  33. Chen, M.; Waghmare, U.V.; Friend, C.M.; Kaxiras, E. A Density Functional Study of Clean and Hydrogen-Covered α-MoO3 (010): Electronic Structure and Surface Relaxation. J. Chem. Phys. 1998, 109, 6854. [Google Scholar] [CrossRef]
  34. Rozzi, A.; Manghi, F.; Parmigiani, F. Ab Initio Fermi Surface and Conduction-Band Calculations in Oxygen-Reduced MoO3. Phys. Rev. B 2003, 68, 075110. [Google Scholar] [CrossRef]
  35. Eyert, V.; Horny, R.; Höck, K.H.; Horn, S. Embedded Peierls instability and the Electronic Structure of MoO2. J. Phys. Condens. Matter 2000, 12, 4923. [Google Scholar] [CrossRef]
  36. Moosburger-Will, J.; Kündel, J.; Klemm, M.; Horn, S.; Hofmann, P.; Schwingenschlögl, U.; Eyert, V. Fermi Surface of MoO2 Studied by Angle-Resolved Photoemission Spectroscopy, de Haas-van Alphen Measurements, and Electronic Structure Calculations. Phys. Rev. B Condens. Matter Mater. Phys. 2009, 79, 115113. [Google Scholar] [CrossRef] [Green Version]
  37. Coquet, R.; Willock, D.J. The (010) Surface of α-MoO3, a DFT + U Study. Phys. Chem. Chem. Phys. 2005, 7, 3819–3828. [Google Scholar] [CrossRef]
  38. Gulomov, J.; Accouche, O.; Al Barakeh, Z.; Aliev, R.; Gulomova, I.; Neji, B. Atom-to-Device Simulation of MoO3/Si Heterojunction Solar Cell. Nanomaterials 2022, 12, 4240. [Google Scholar] [CrossRef]
  39. Smidstrup, S.; Markussen, T.; Vancraeyveld, P.; Wellendorff, J.; Schneider, J.; Gunst, T.; Verstichel, B.; Stradi, D.; Khomyakov, P.A.; Vej-Hansen, U.G.; et al. QuantumATK: An Integrated Platform of Electronic and Atomic-Scale Modelling Tools. J. Phys. Condens. Matter 2020, 32, 015901. [Google Scholar] [CrossRef]
  40. Jain, A.; Ong, S.P.; Hautier, G.; Chen, W.; Richards, W.D.; Dacek, S.; Cholia, S.; Gunter, D.; Skinner, D.; Ceder, G.; et al. Commentary: The Materials Project: A Materials Genome Approach to Accelerating Materials Innovation. APL Mater. 2013, 1, 011002. [Google Scholar] [CrossRef] [Green Version]
  41. Soler, J.M.; Artacho, E.; Gale, J.D.; García, A.; Junquera, J.; Ordejón, P.; Sánchez-Portal, D. The SIESTA Method for Ab Initio Order-N Materials Simulation. J. Phys. Condens. Matter 2002, 14, 2745. [Google Scholar] [CrossRef] [Green Version]
  42. Perdew, J.P.; Burke, K.; Ernzerhof, M. Generalized Gradient Approximation Made Simple. Phys. Rev. Lett. 1996, 77, 3865. [Google Scholar] [PubMed] [Green Version]
  43. Mortazavi, B.; Shahrokhi, M.; Makaremi, M.; Rabczuk, T. Anisotropic Mechanical and Optical Response and Negative Poisson’s Ratio in Mo2C Nanomembranes Revealed by First-Principles Simulations. Nanotechnology 2017, 28, 115705. [Google Scholar] [CrossRef] [PubMed] [Green Version]
  44. Hiroyuki, F. Spectroscopic Ellipsometry: Principles and Applications; John Wiley & Sons Inc: Hoboken, NJ, USA, 2007. [Google Scholar]
  45. Jellison, G.E.; Modine, F.A. Parameterization of the Optical Functions of Amorphous Materials in the Interband Region. Appl. Phys. Lett. 1996, 69, 371–373. [Google Scholar] [CrossRef]
  46. Azzam, R.M.A.; Bashara, N.M. Ellipsometry and Polarized Light, Paperback ed.; North-Holland: Amsterdam, The Netherlands, 1987; ISBN 0444870164. [Google Scholar]
  47. Brandt, B.; Skapski, A. A Refinement of the Crystal Structure of Molybdenum Dioxide. Acta Chem. Scand. 1967, 21, 661–672. [Google Scholar] [CrossRef]
  48. Sitepu, H.; O’Connor, B.H.; Li, D. Comparative Evaluation of the March and Generalized Spherical Harmonic Preferred Orientation Models Using X-Ray Diffraction Data for Molybdite and Calcite Powders. J. Appl. Crystallogr. 2005, 38, 158–167. [Google Scholar] [CrossRef]
  49. Kihlborg, L. Crystal structure of Mo18O52+ existence of homologous series of structures based on MoO3. Ark. Kemi 1964, 21, 443–448. [Google Scholar]
Figure 1. Schematic representation of all the examined systems: monoclinic MoO2 from yz plane (A), xz plane (B), and xy plane (C); orthorhombic MoO3 from yz plane (D), xz plane (E), and xy plane (F). Mo atoms are depicted in light blue and O in red.
Nanomaterials 13 01319 g001
Figure 2. Bond lengths of MoO3 (A) and MoO2 (B). Mo atoms are depicted in light blue, while O are reported in red.
Nanomaterials 13 01319 g002
Figure 3. Band structure (A) and projected density of electronic states (B) of monoclinic MoO2. Band structure (C) and projected density of electronic states (D) of orthorhombic MoO3. The Fermi level is depicted as a red line, and the bandgap of MoO3 is evidenced as a pink line.
Nanomaterials 13 01319 g003
Figure 4. Band structure of MoO3 calculated with PBEsol and HSE06 functionals.
Nanomaterials 13 01319 g004
Figure 5. HOMO–LUMO representation of MoO2 (A,B) and MoO3 (C,D). HOMO and LUMO are reported in orange and blue, respectively.
Nanomaterials 13 01319 g005
Figure 6. Calculated (red) and experimental (black) optical spectra of monoclinic MoO2. Refractive index (A), extinction coefficient (B), real part εr (C), and imaginary part εi (D) of the dielectric constant reported as a function of the energy.
Nanomaterials 13 01319 g006
Figure 7. Calculated (red) and Experimental (black) optical spectra of orthorhombic MoO3. Refractive index (A), extinction coefficient (B), real part εr (C), and imaginary part εi (D) of the dielectric constant reported as a function of the energy.
Nanomaterials 13 01319 g007
Table 1. Comparison between our theoretical results and experimental lattice vectors [47,48] for monoclinic P21/c MoO2 and orthorhombic Pca21 MoO3.
This WorkExperimental This Work
Orthorhombic
MoO3
a3.909 Å3.962 Åα90°
b13.855 Å13.855 Åβ90°
c3.681 Å3.699 Åγ90°
Monoclinic
MoO2
a5.625 Å5.611 Åα90°
b4.872 Å4.856 Åβ120.5°
c5.645 Å5.628 Åγ90°
Disclaimer/Publisher’s Note: The statements, opinions and data contained in all publications are solely those of the individual author(s) and contributor(s) and not of MDPI and/or the editor(s). MDPI and/or the editor(s) disclaim responsibility for any injury to people or property resulting from any ideas, methods, instructions or products referred to in the content.

