
Successful Growth of TiO2 Nanocrystals with {001} Facets for Solar Cells
 ,
,  ,
,
Abstract
:1. Introduction
2. Materials and Methods
2.1. Materials
2.2. Methods
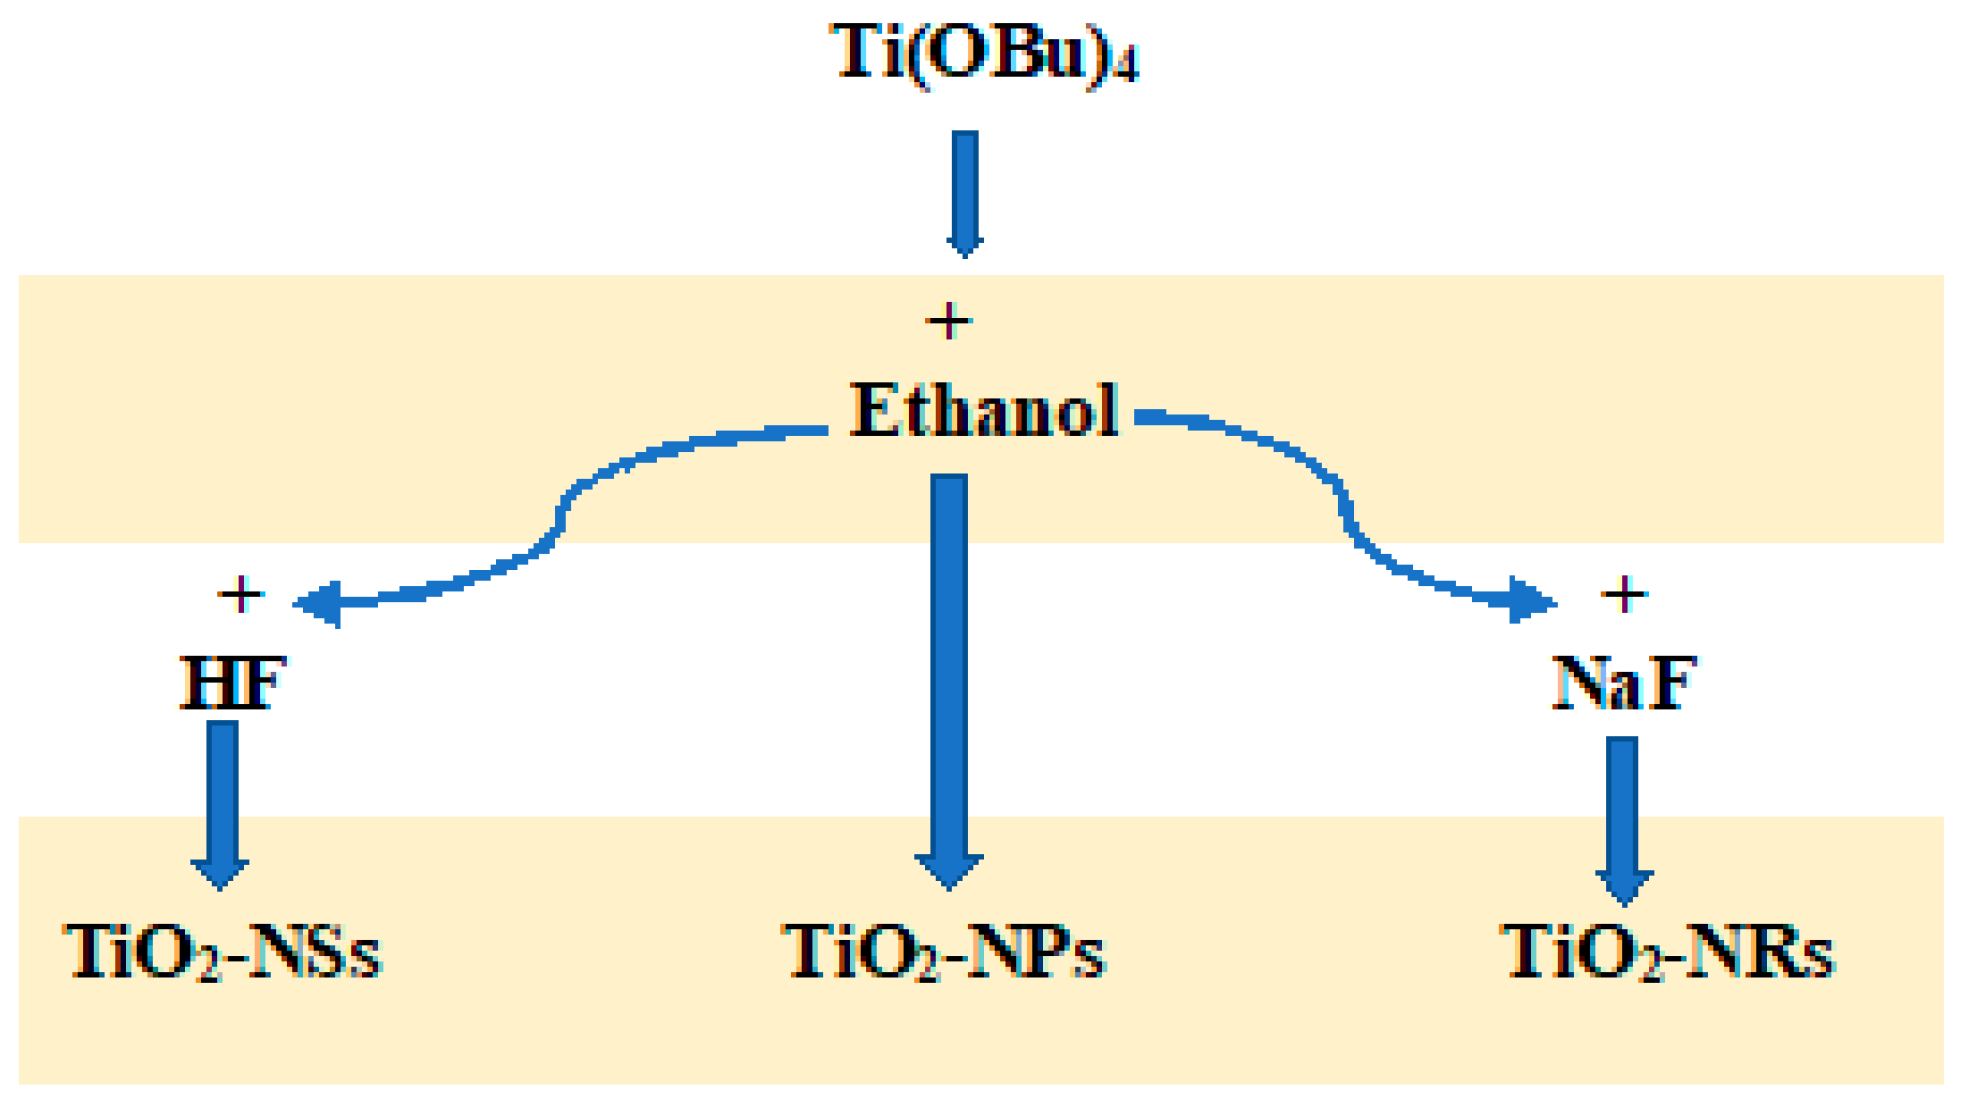
2.2.1. Preparation of Various TiO2 Nanocrystals by Hydrothermal Method
2.2.2. Preparation of TiO2 Anatase Nanosheet
2.2.3. Preparation of TiO2 Brookite Nanorod
3. Sample Characterization
4. Results and Discussion
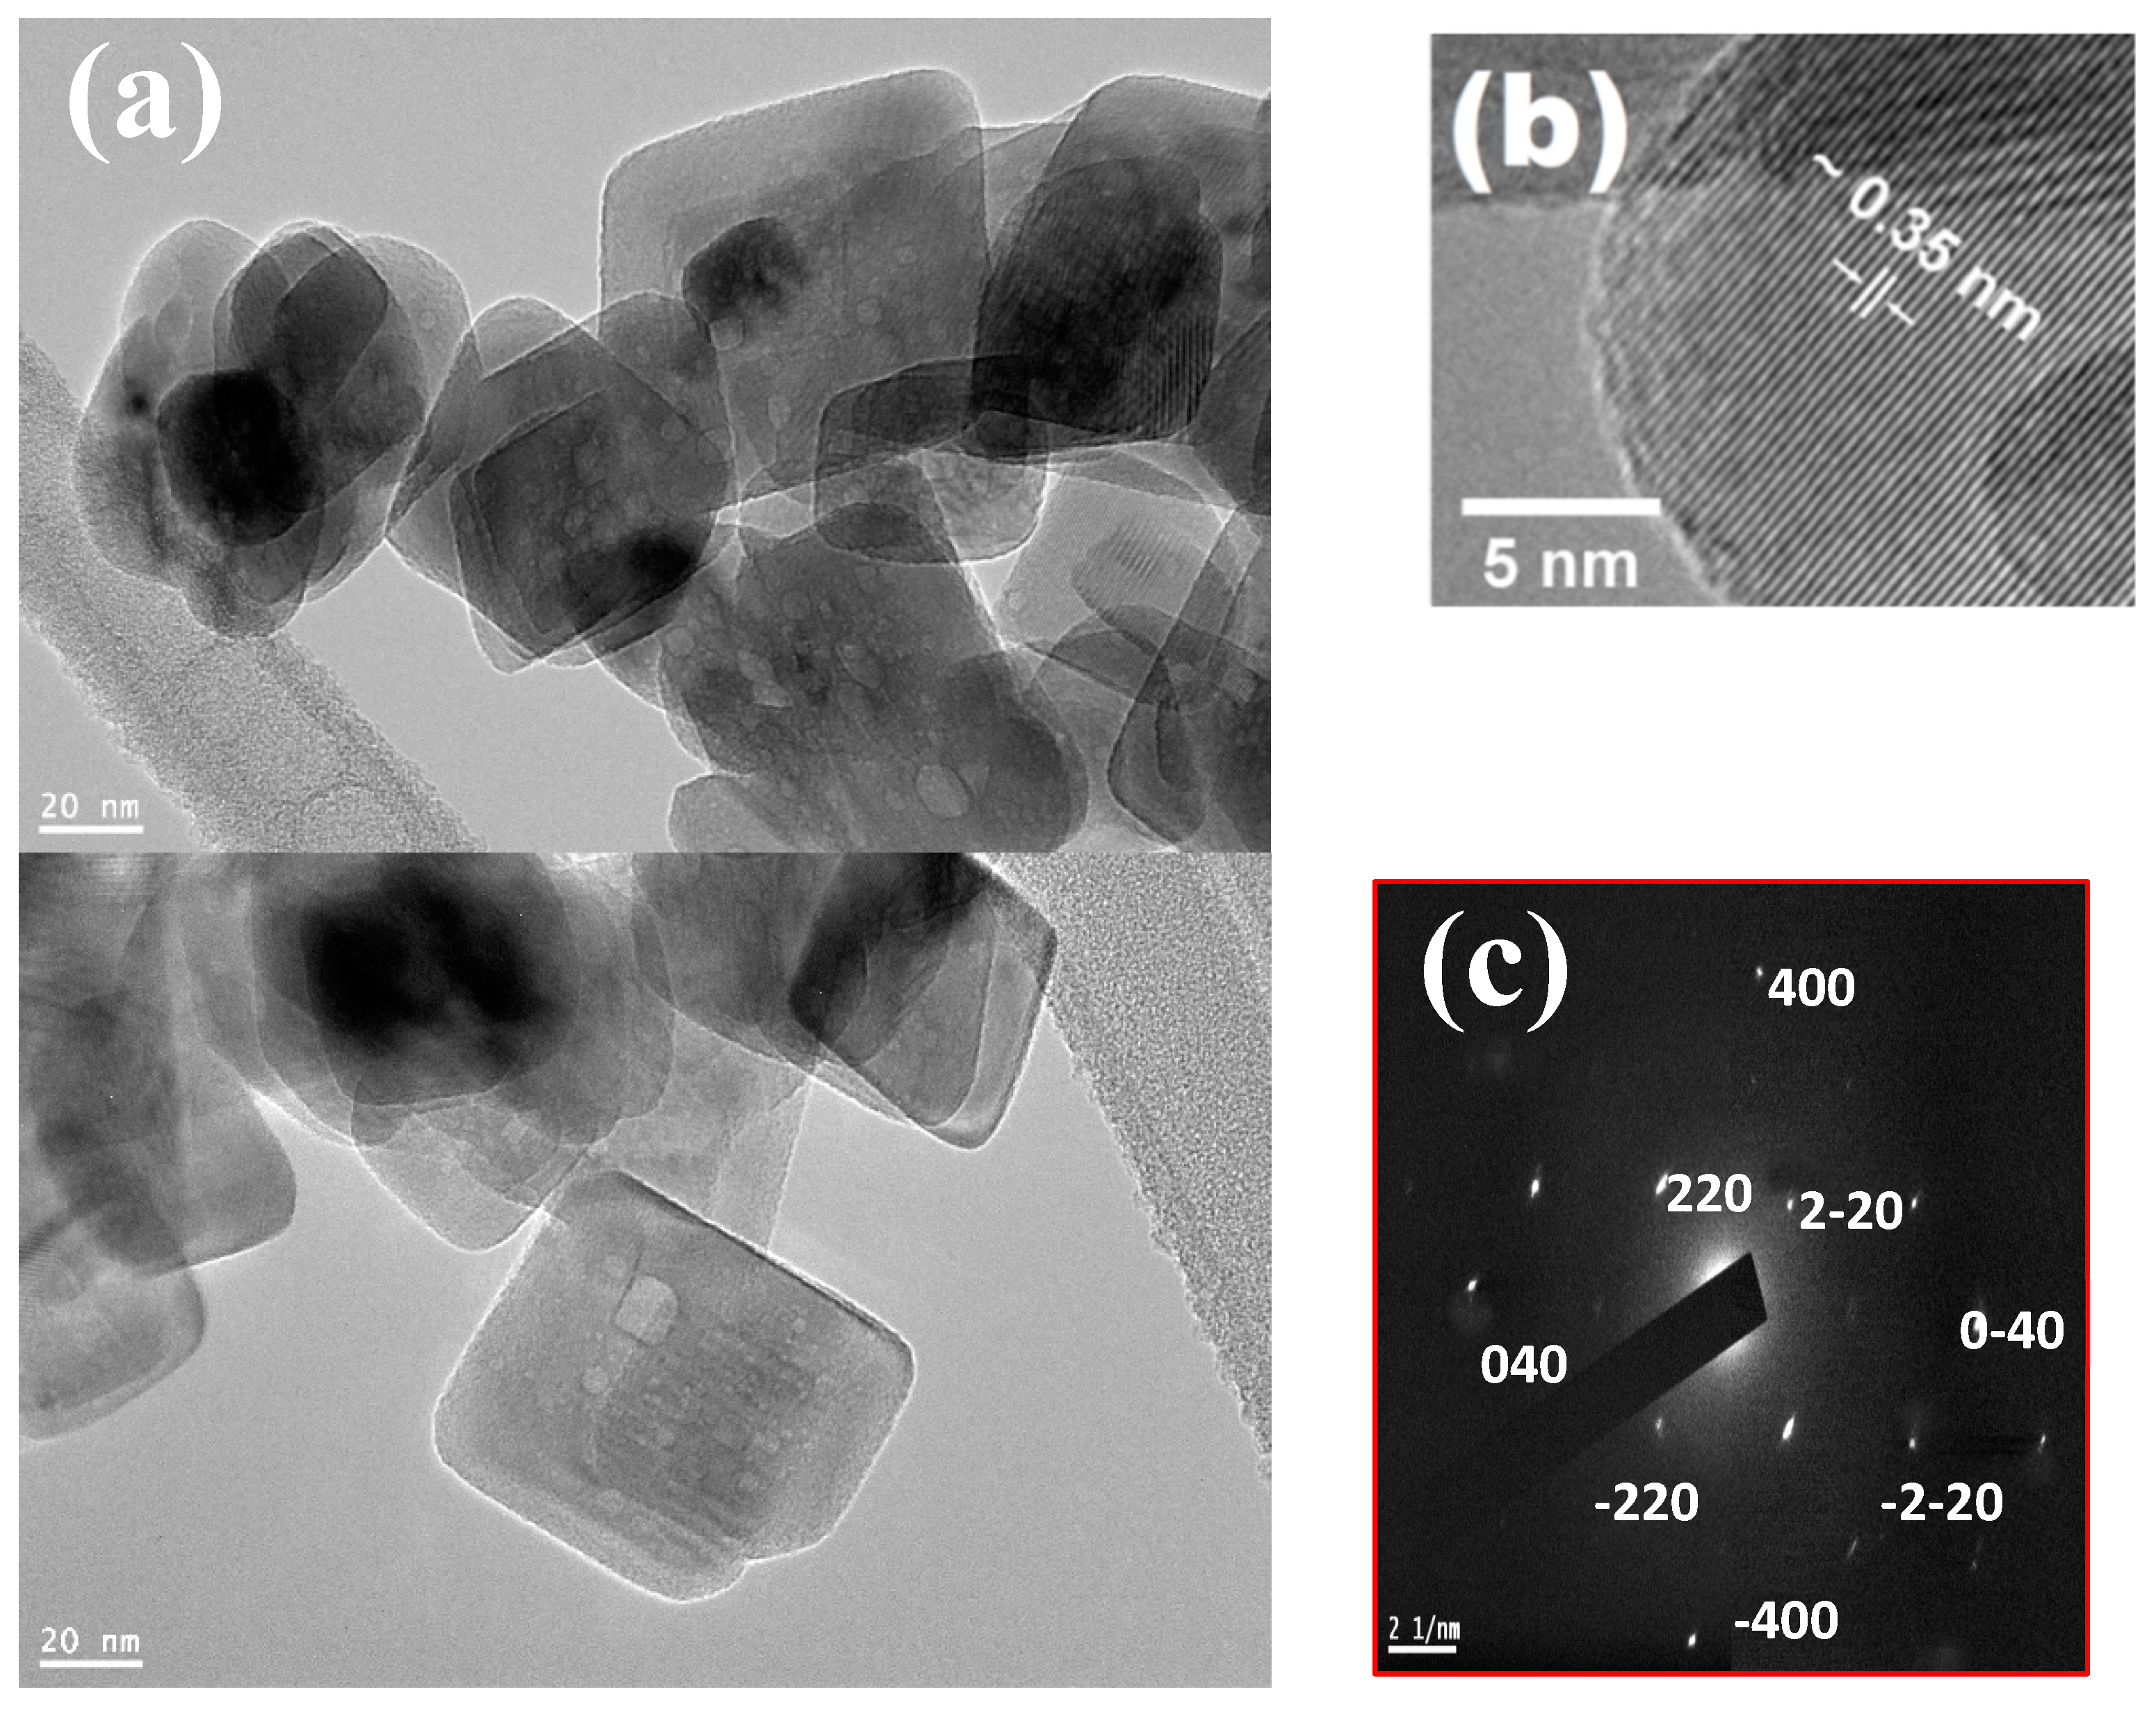
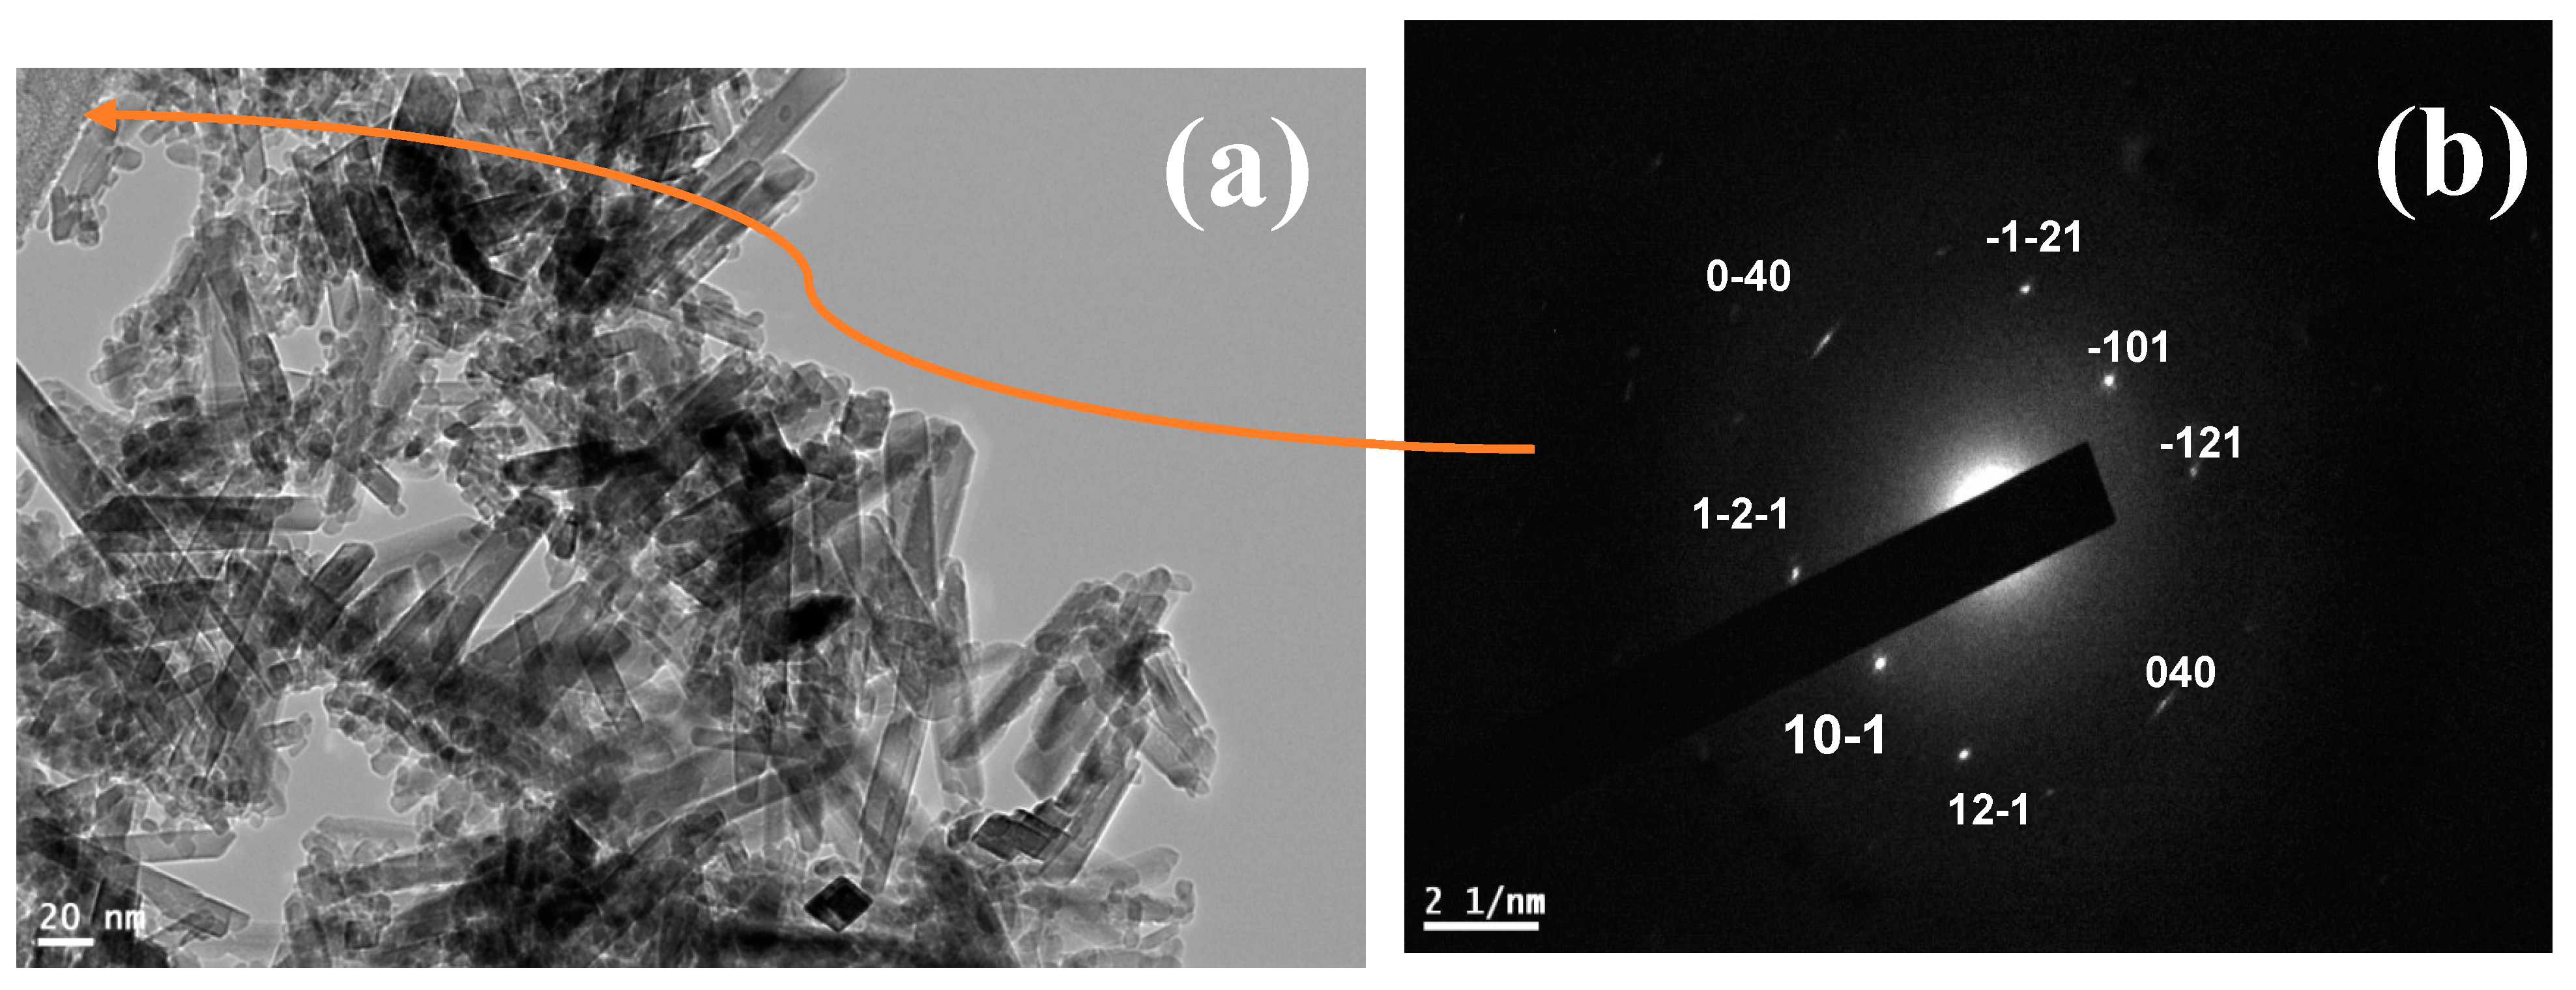
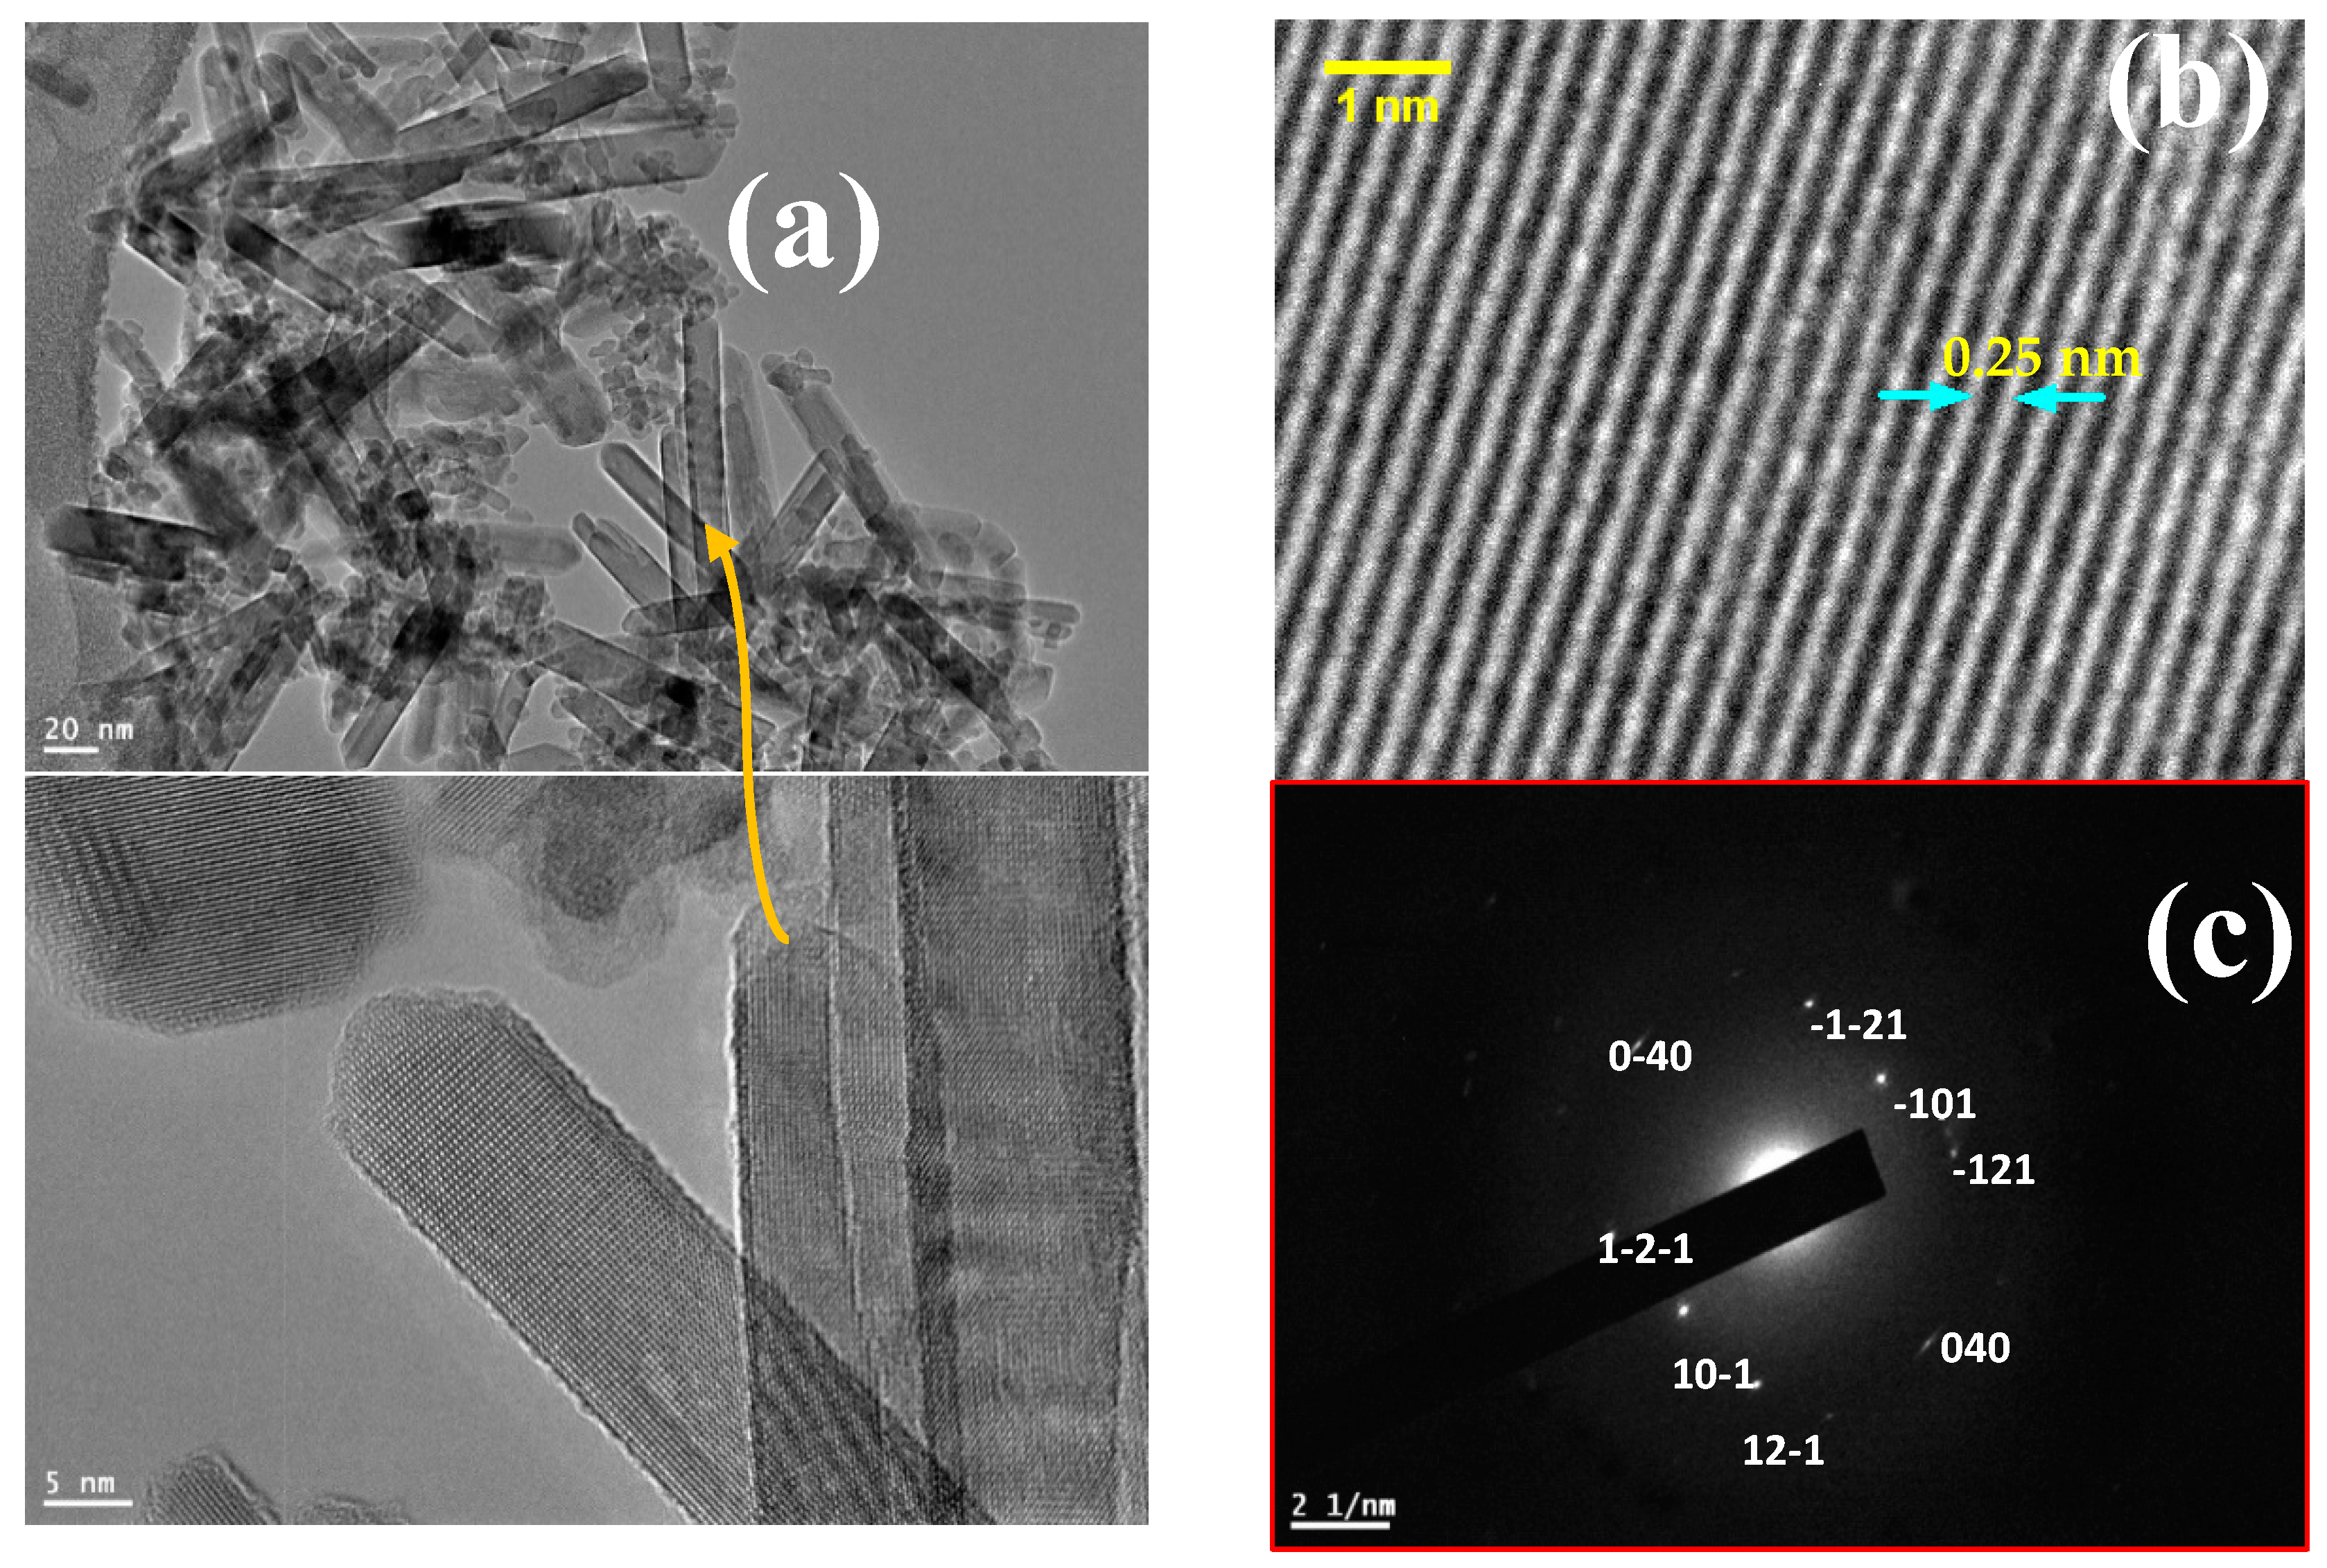
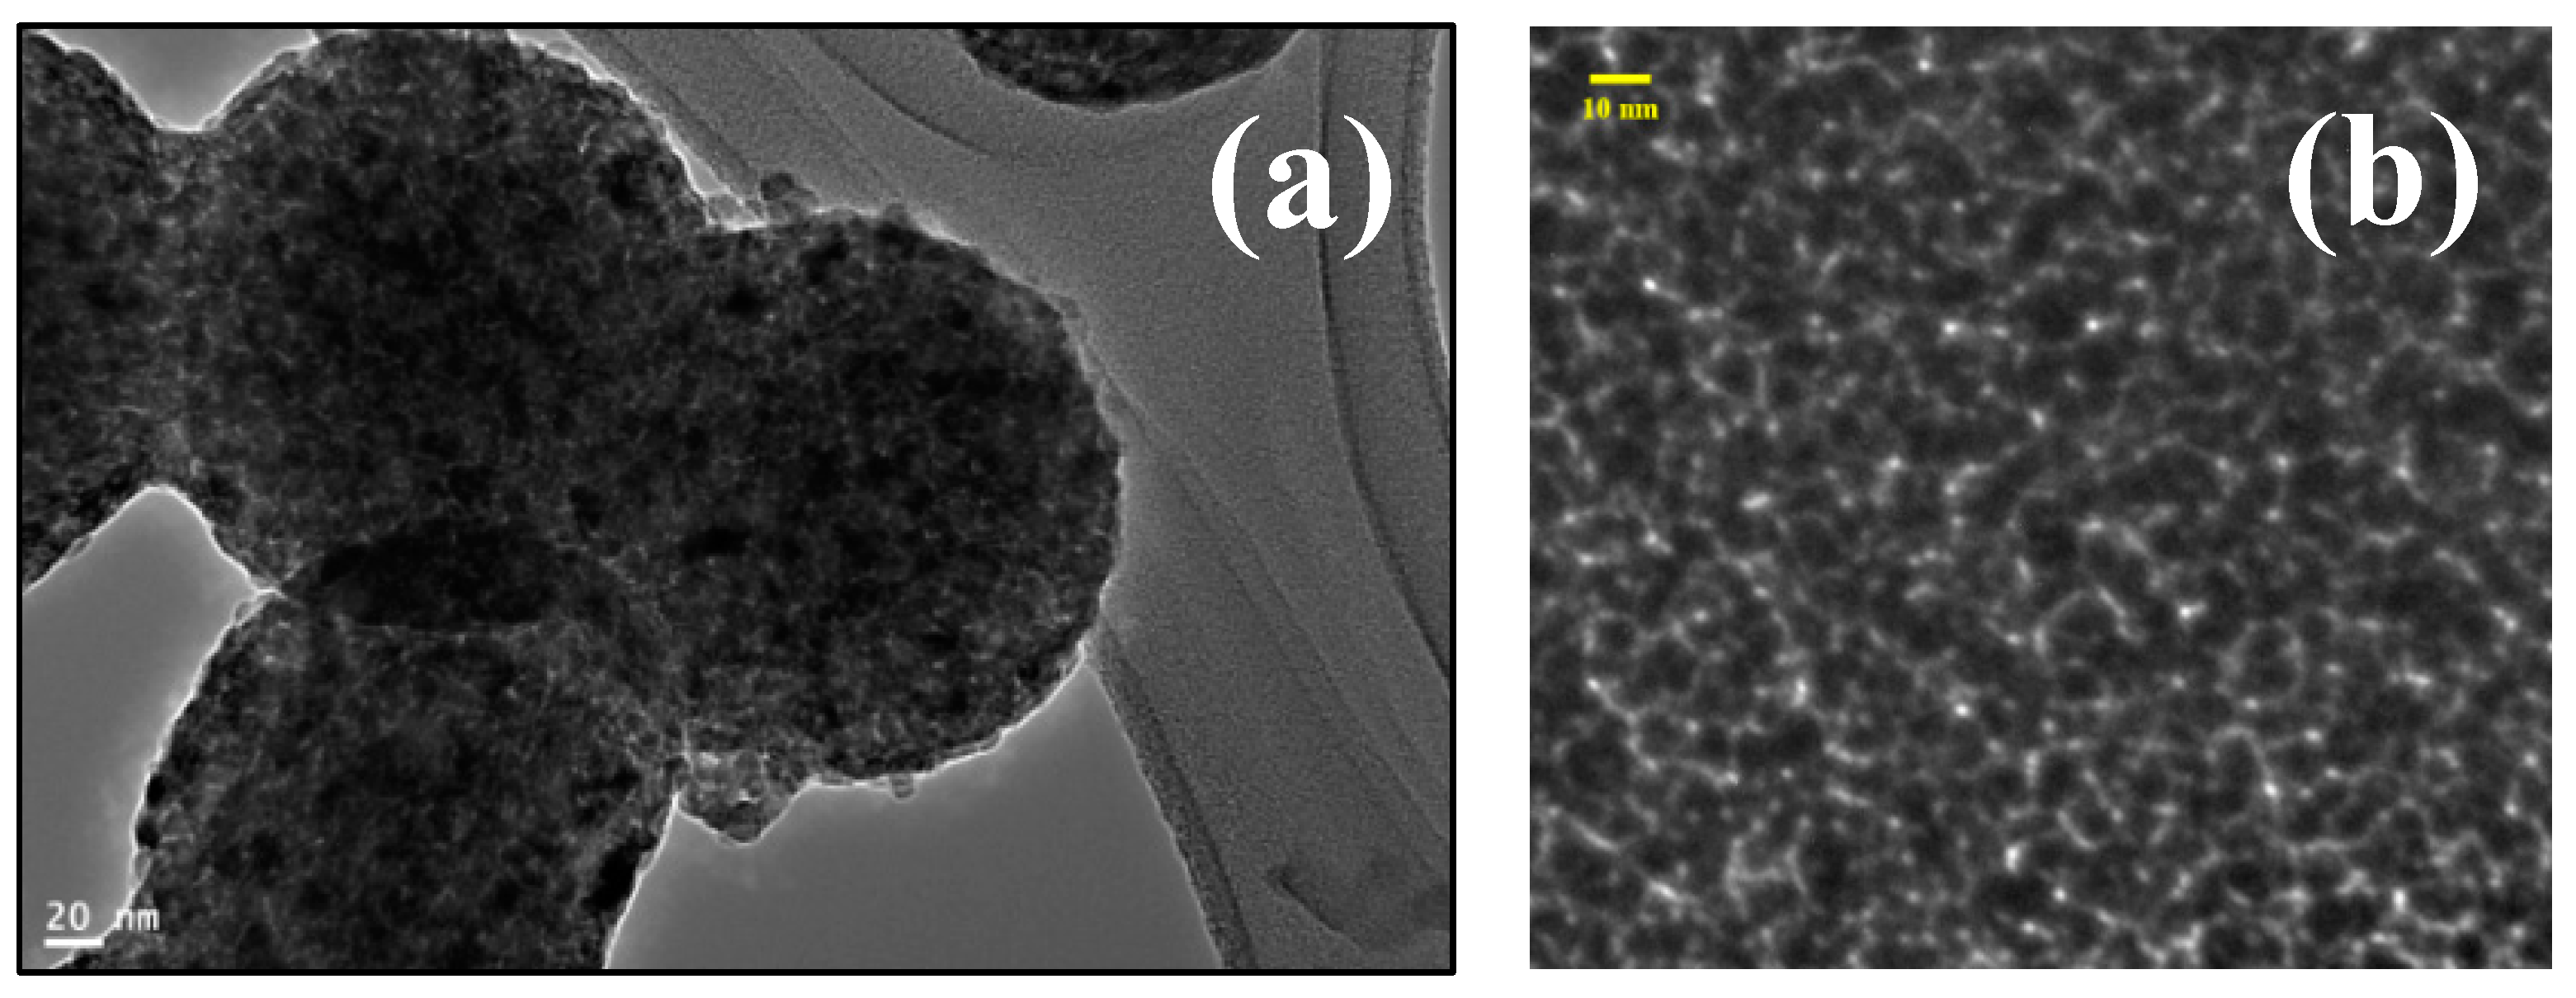
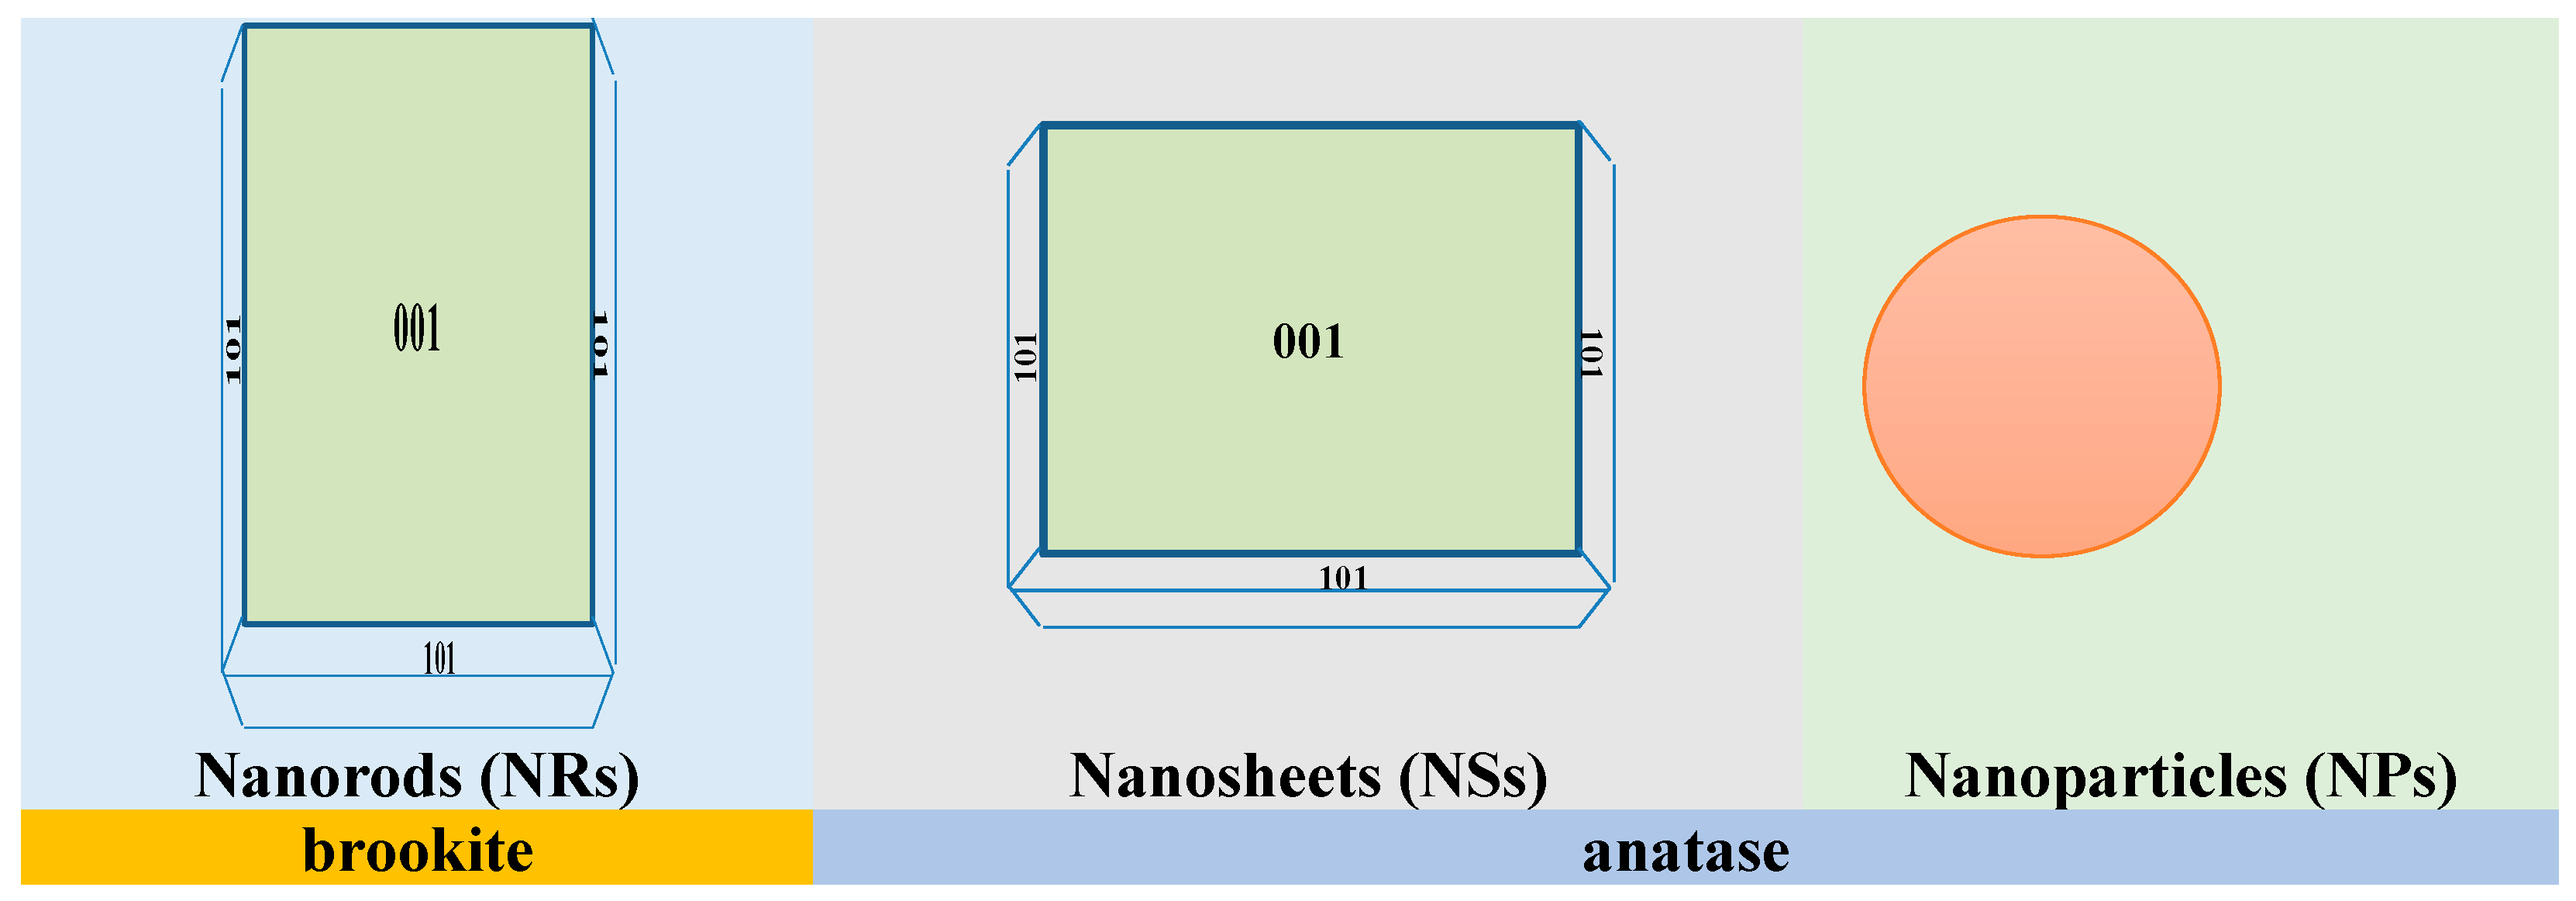
5. Morphological Properties
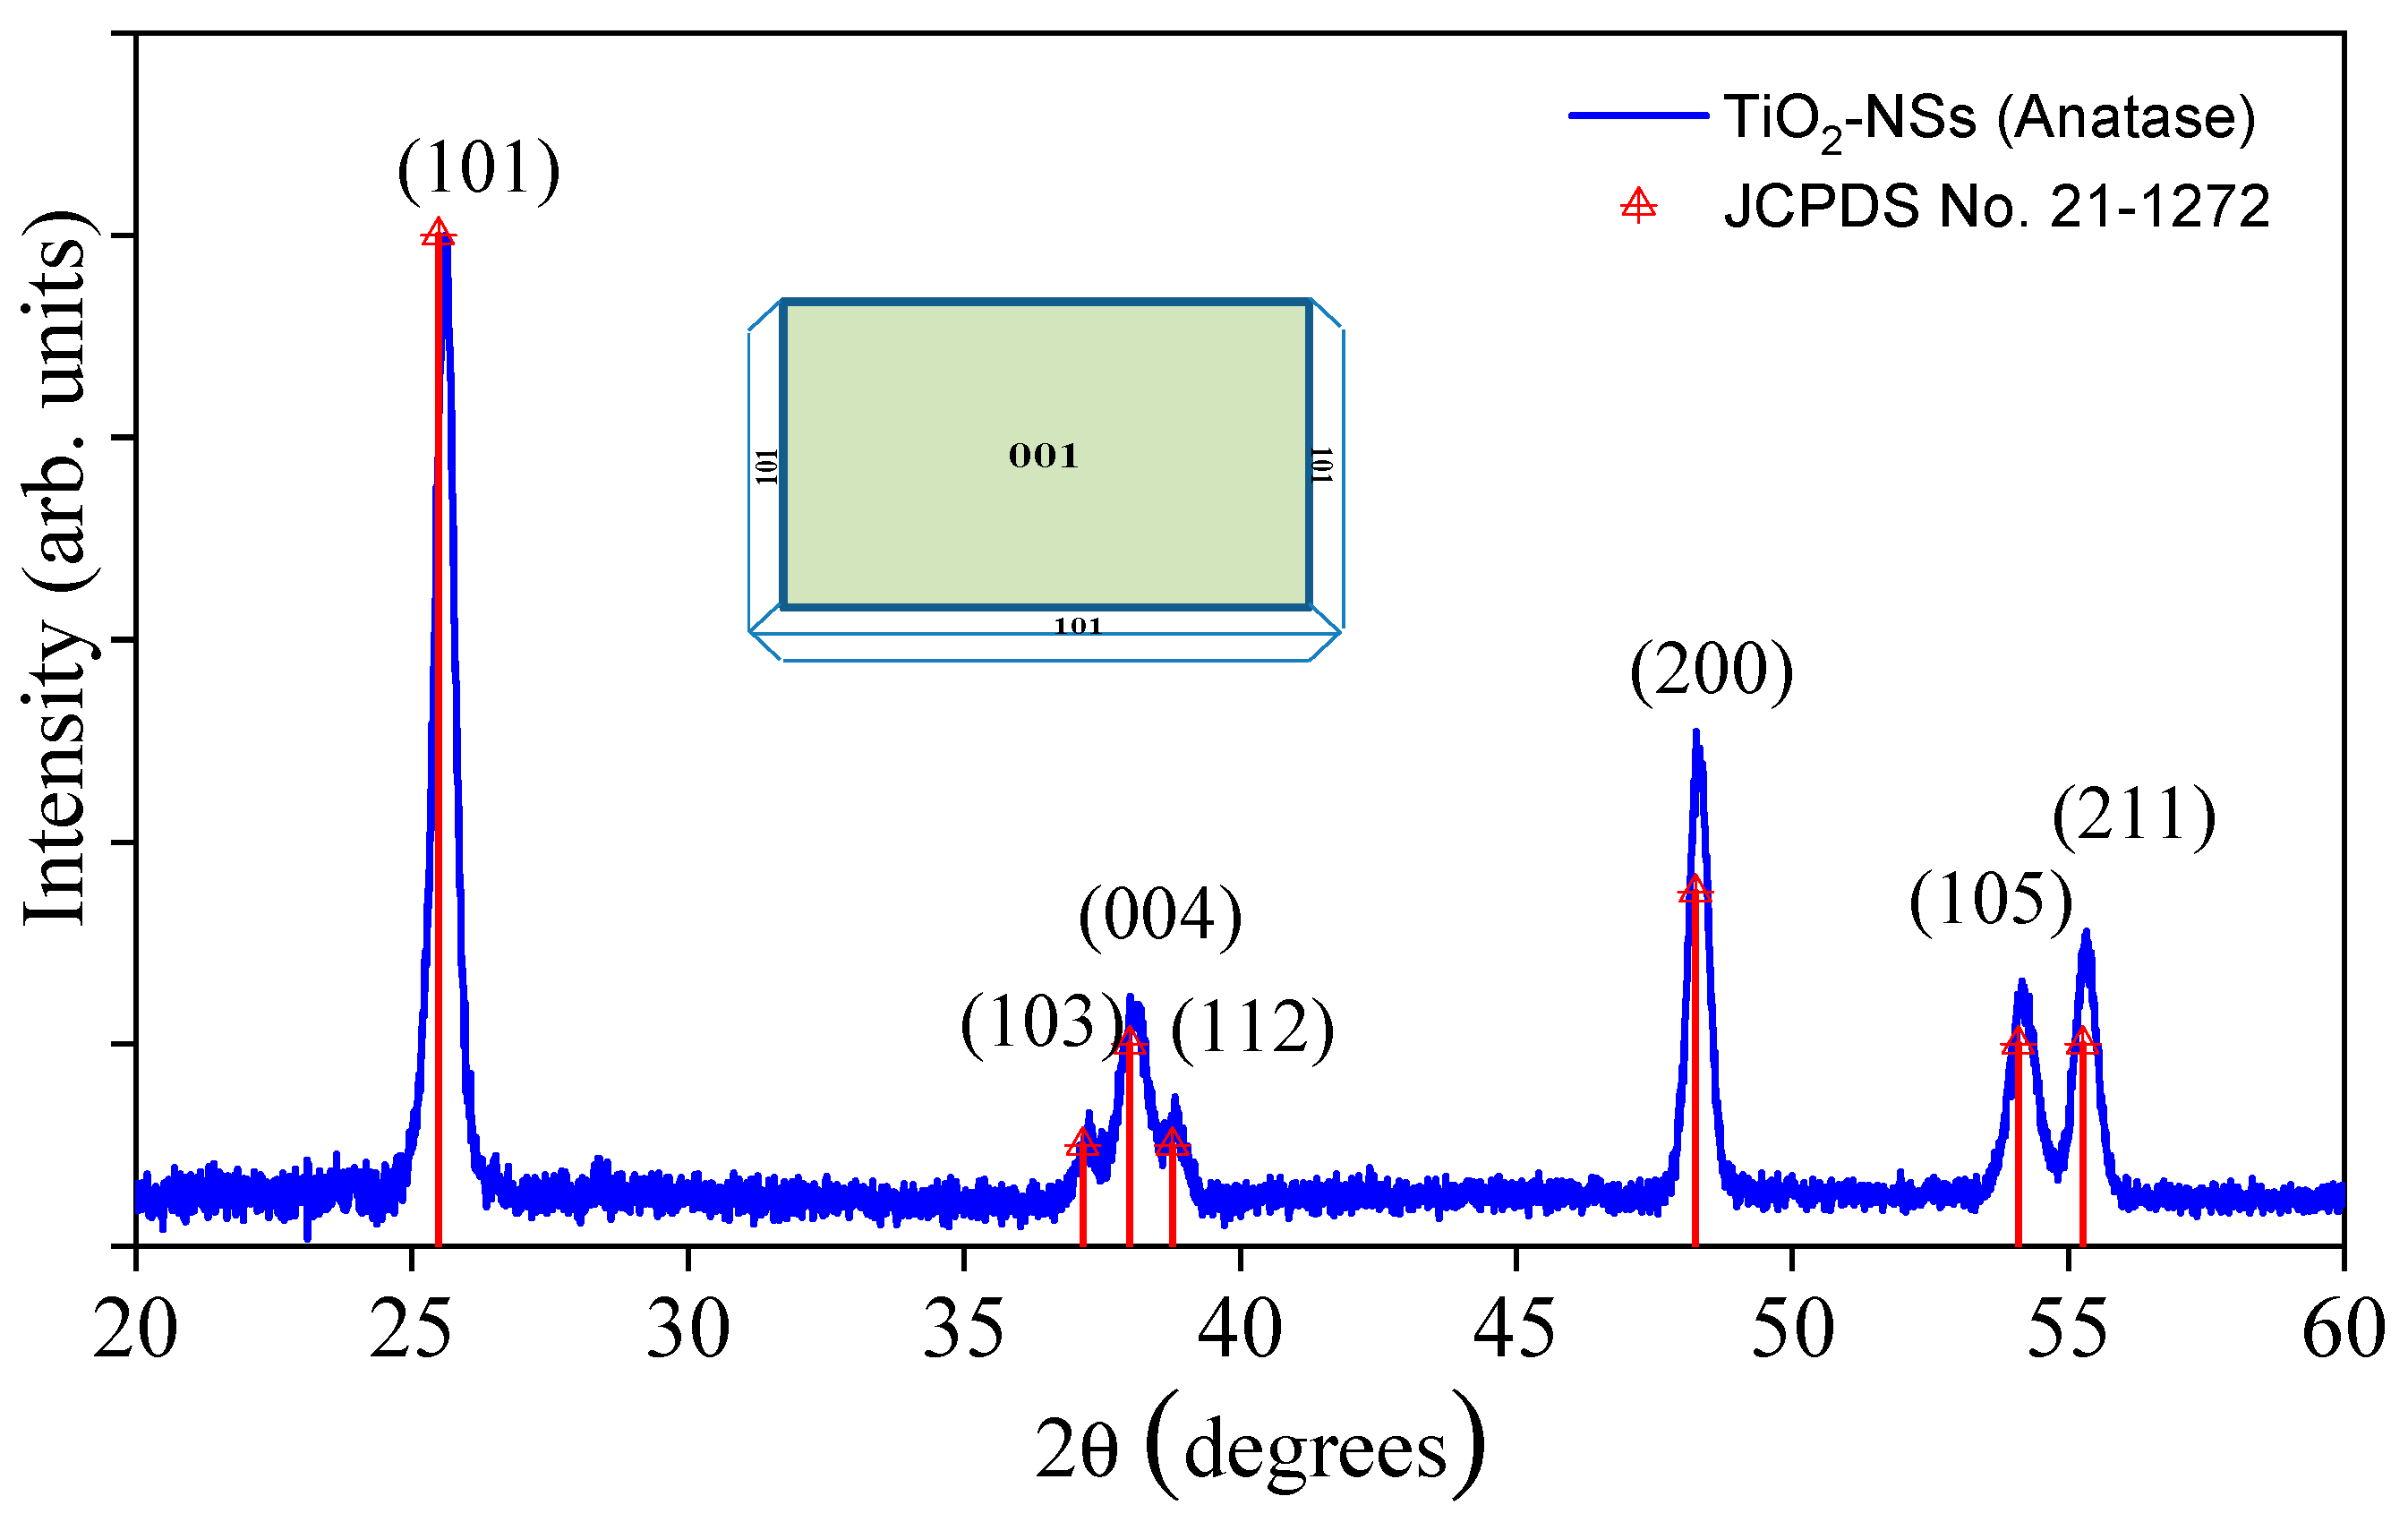
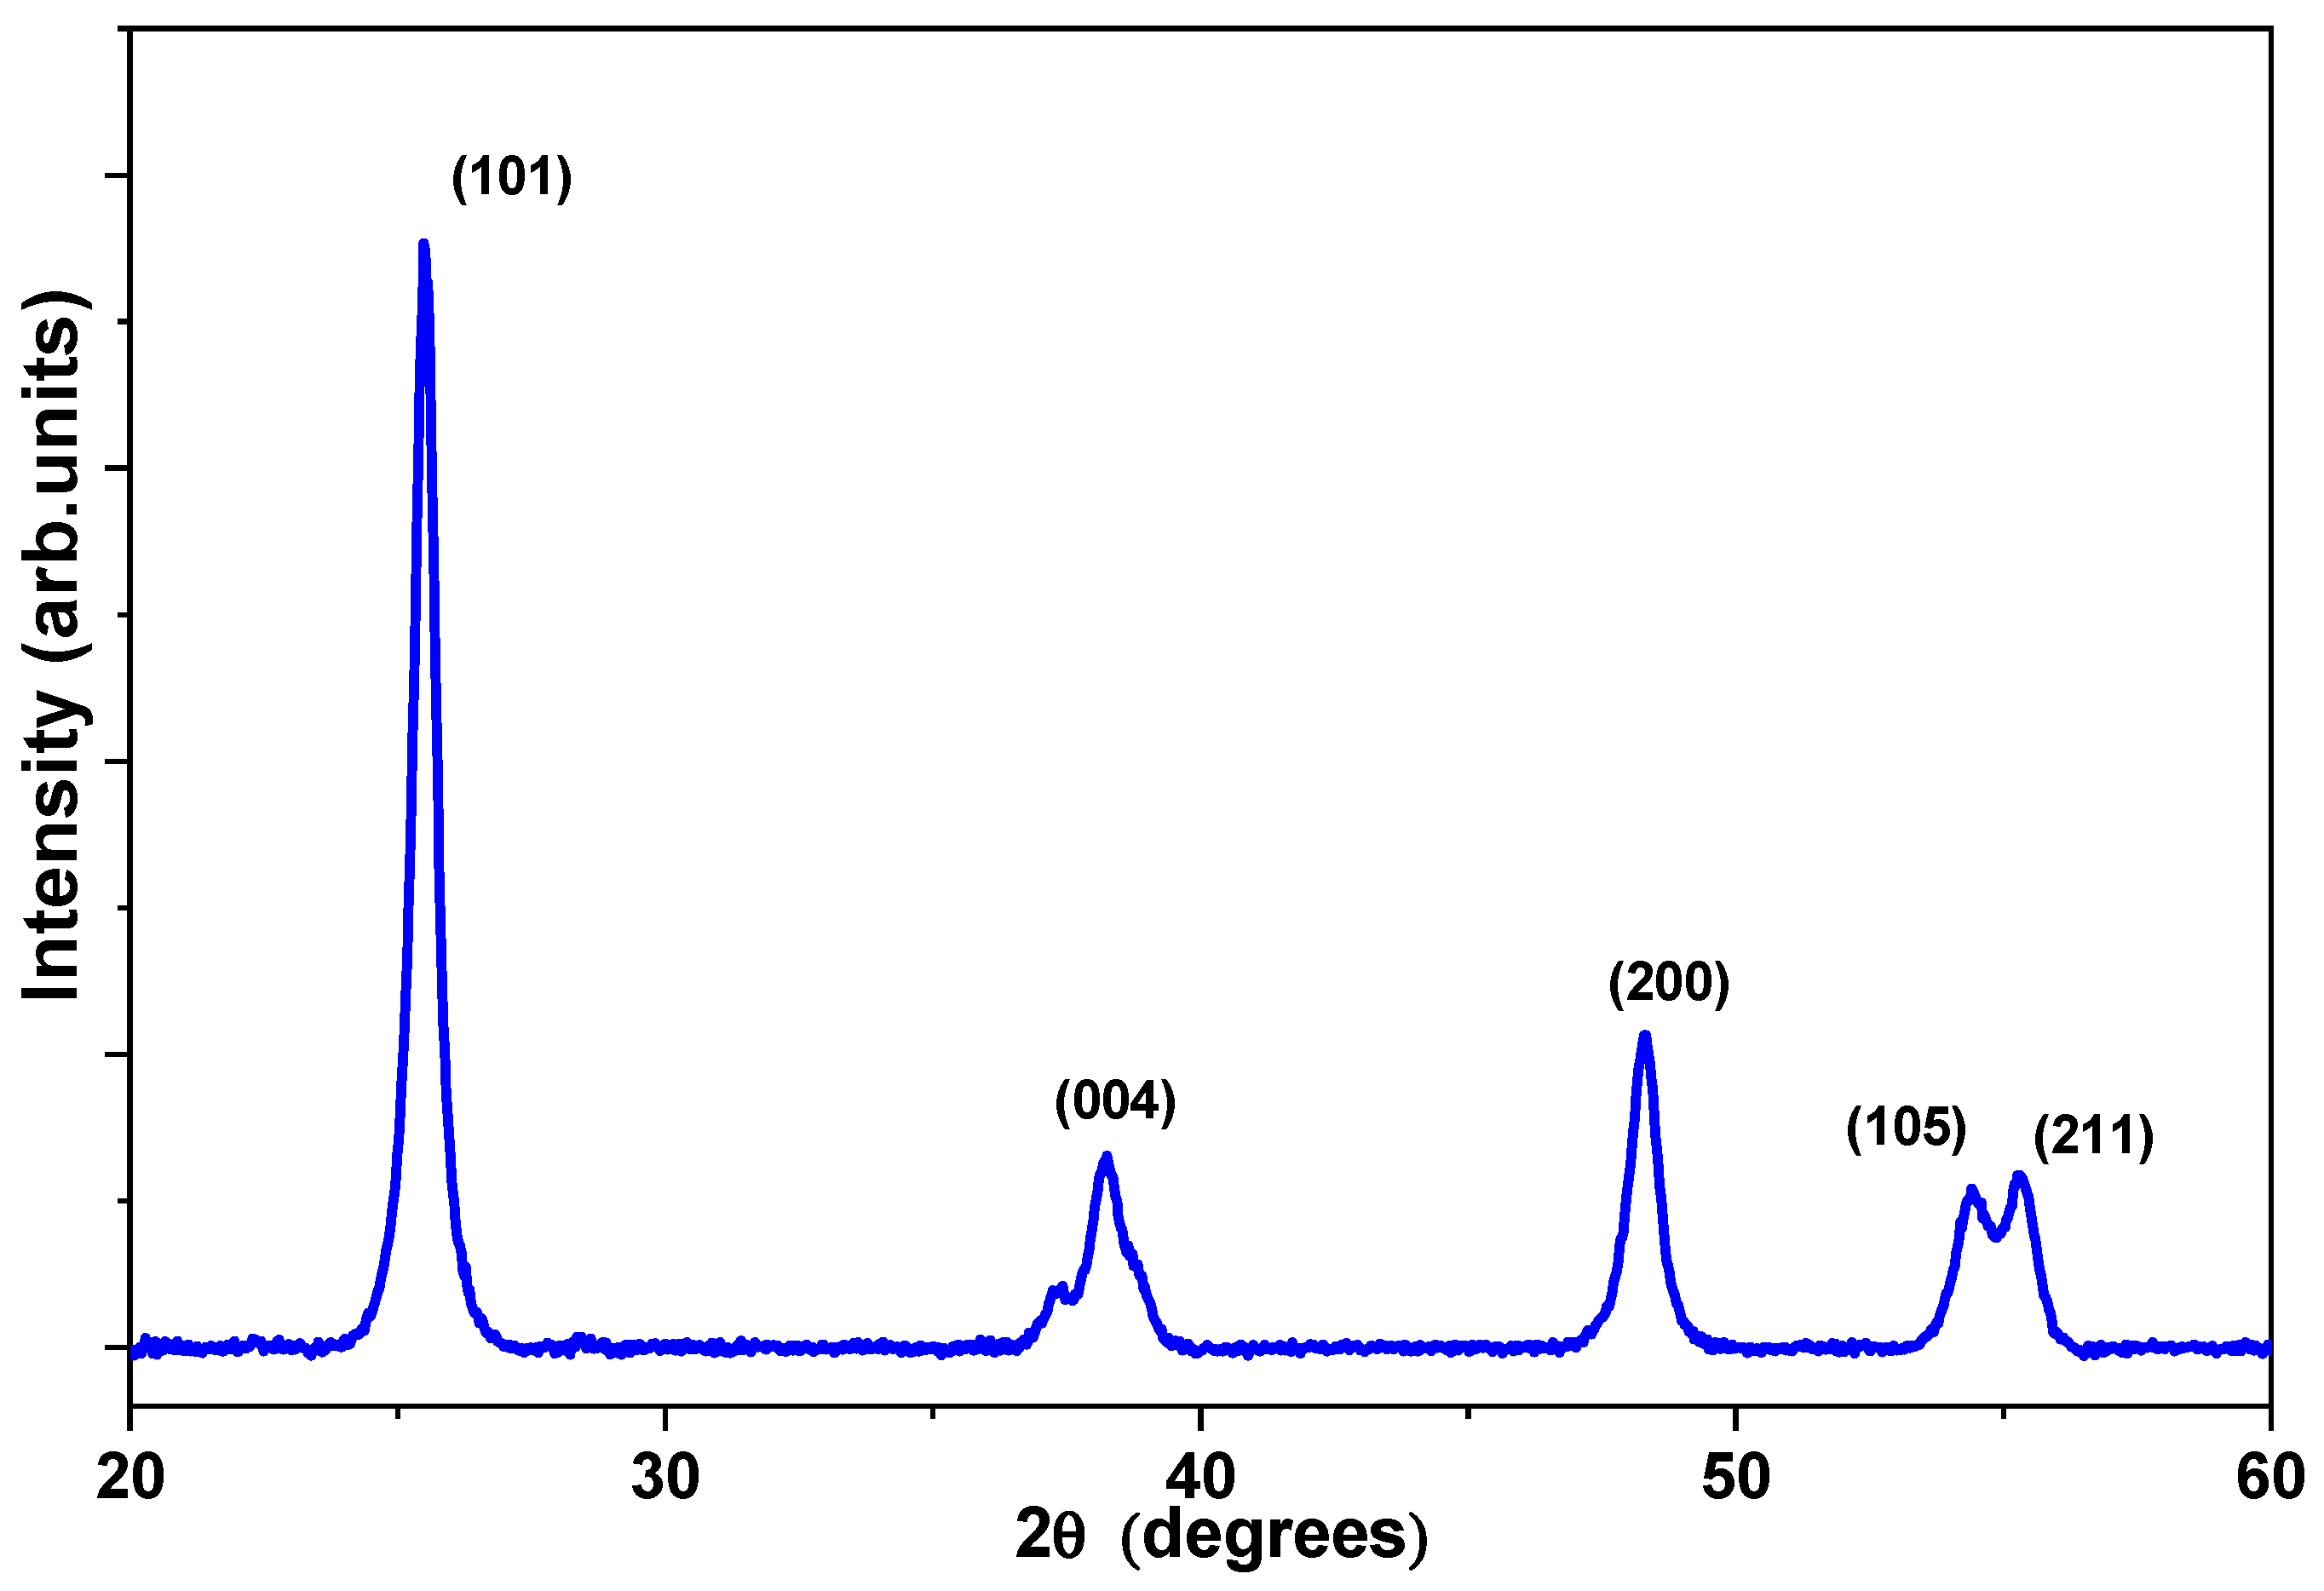
6. Structural Properties
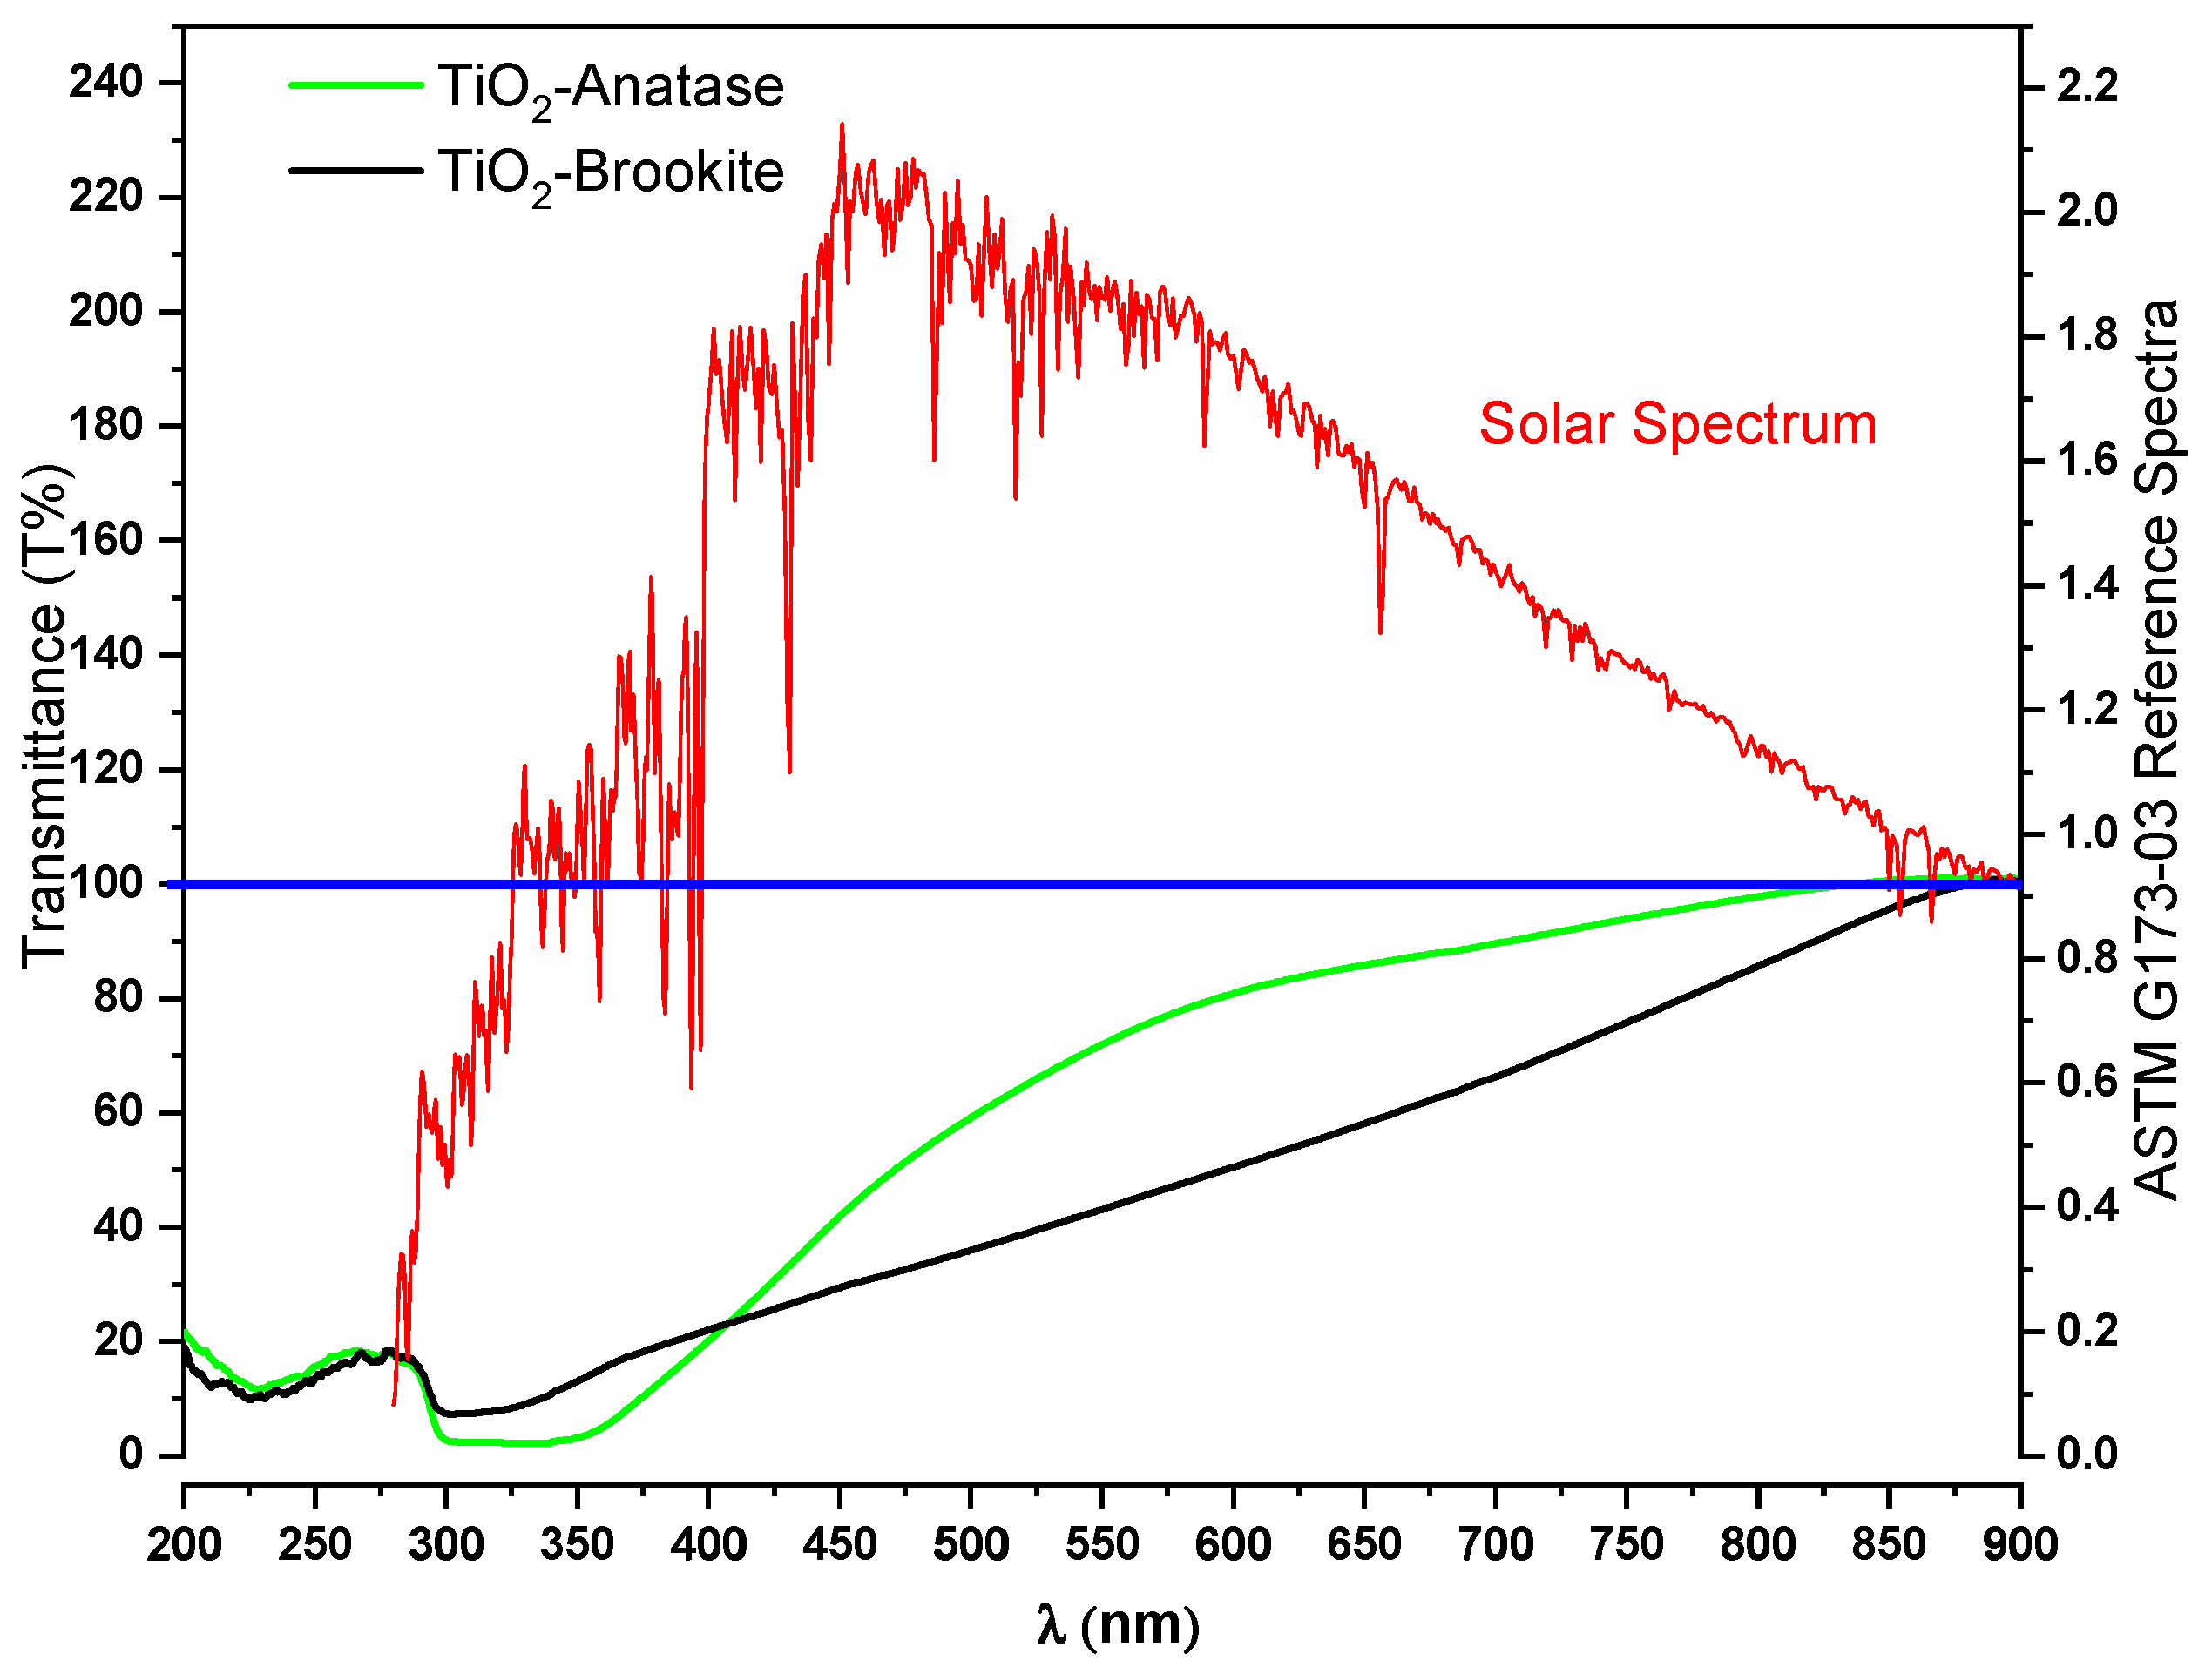
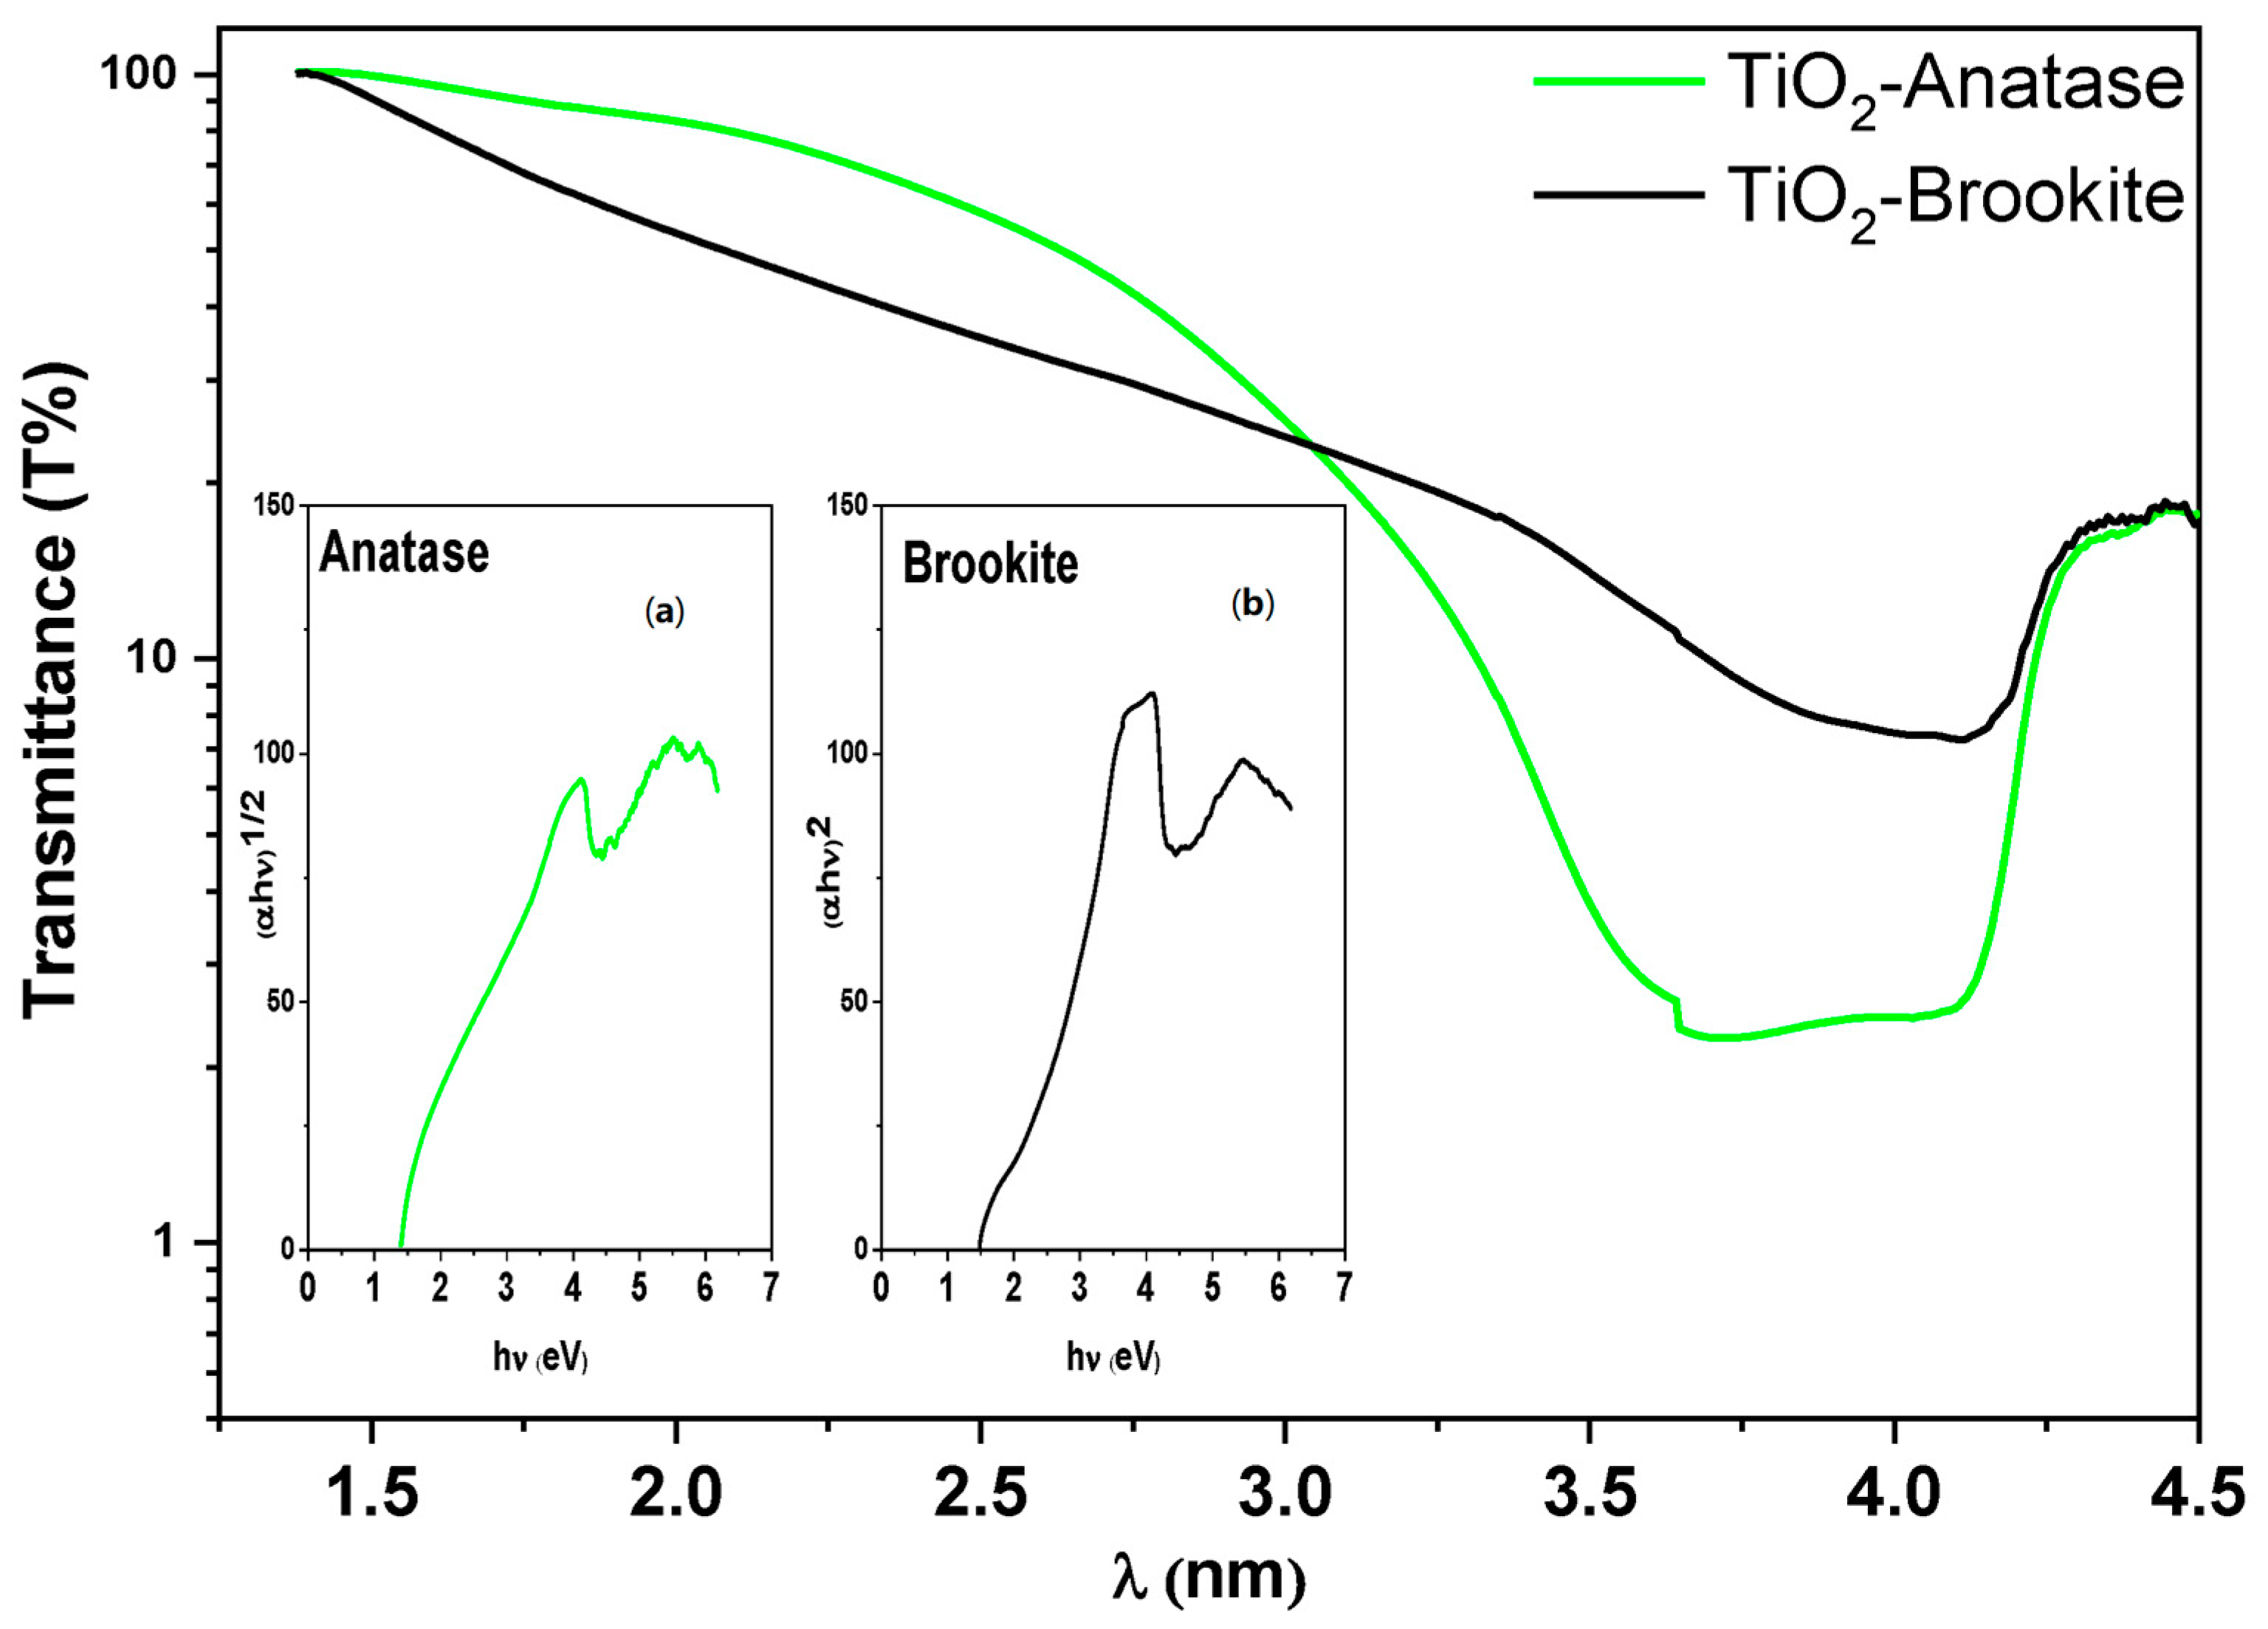
7. Optical Properties
8. Conclusions
Author Contributions
Funding
Data Availability Statement
Acknowledgments
Conflicts of Interest
References
- Kalyanasundaram, K. Dye-Sensitized Solar Cells, 1st ed.; EPFL Press: Lausanne, Switzerland, 2010; ISBN 9782940222360. [Google Scholar]
- Hoang, S.; Berglund, S.P.; Fullon, R.R.; Minter, R.L.; Mullins, C.B. Chemical bath deposition of vertically aligned TiO2 nanoplatelet arrays for solar energy conversion applications. J. Mater. Chem. A 2013, 1, 4307–4315. [Google Scholar] [CrossRef]
- Hagfeldt, A.; Boschloo, G.; Sun, L.; Kloo, L.; Pettersson, H. Dye-sensitized solar cells. Chem. Rev. 2010, 110, 6595–6663. [Google Scholar] [CrossRef] [PubMed]
- Vafaei, S.; Holmes, I.; Errion, B.; Thukka, Z.; Narita, R.; Sugiura, T.; Manseki, K. Manufacturing a TiO2-Based Semiconductor Film with Nanofluid Pool Boiling and Sintering Processes toward Solar-Cell Applications. Nanomaterials 2022, 12, 1165. [Google Scholar] [CrossRef]
- Koech, R.K.; Ichwani, R.; Oyewole, D.O.; Kigozi, M.; Amune, D.; Sanni, D.M.; Adeniji, S.A.; Oyewole, O.K.; Bello, A.; Ntsoenzok, E.; et al. Tin oxide modified titanium dioxide as electron transport layer in formamidinium-rich perovskite solar cells. Energies 2021, 14, 7870. [Google Scholar] [CrossRef]
- Xiao, Y.; Han, G.; Chang, Y.; Zhang, Y.; Li, Y.; Li, M. Investigation of perovskite-sensitized nanoporous titanium dioxide photoanodes with different thicknesses in perovskite solar cells. J. Power Sources 2015, 286, 118–123. [Google Scholar] [CrossRef]
- Meng, L.; Li, L. Recent research progress on operational stability of metal oxide/sulfide photoanodes in photoelectrochemical cells. Nano Res. Energy 2022, 1, e9120020. [Google Scholar] [CrossRef]
- Xin, X.; Xu, T.; Wang, L.; Wang, C. Ti3+-self doped brookite TiO2 single-crystalline nanosheets with high solar absorption and excellent photocatalytic CO2 reduction. Sci. Rep. 2016, 6, 2368. [Google Scholar] [CrossRef] [PubMed] [Green Version]
- Yadeta, T.F.; Huang, K.W.; Imae, T.; Tung, Y.L. Enhancement of Perovskite Solar Cells by TiO2-Carbon Dot Electron Transport Film Layers. Nanomaterials 2023, 13, 186. [Google Scholar] [CrossRef]
- Yu, Y.; Li, J.; Geng, D.; Wang, J.; Zhang, L.; Andrew, T.L.; Arnold, M.S.; Wang, X. Development of lead iodide perovskite solar cells using three-dimensional titanium dioxide nanowire architectures. ACS Nano 2015, 9, 564–572. [Google Scholar] [CrossRef]
- Tortorella, S.; Marotta, G.; Cruciani, G.; De Angelis, F. Quantitative structure-property relationship modeling of ruthenium sensitizers for solar cells applications: Novel tools for designing promising candidates. RSC Adv. 2015, 5, 23865–23873. [Google Scholar] [CrossRef]
- Gong, J.; Liang, J.; Sumathy, K. Review on dye-sensitized solar cells (DSSCs): Fundamental concepts and novel materials. Renew. Sustain. Energy Rev. 2012, 16, 5848–5860. [Google Scholar] [CrossRef]
- Elrashidi, A.; Elleithy, K. High-Efficiency Crystalline Silicon-Based Solar Cells Using Textured TiO2 Layer and Plasmonic Nanoparticles. Nanomaterials 2022, 12, 1589. [Google Scholar] [CrossRef]
- Buonsanti, R.; Grillo, V.; Carlino, E.; Giannini, C.; Kipp, T.; Cingolani, R.; Cozzoli, P.D. Nonhydrolytic synthesis of high-quality anisotropically shaped brookite TiO2 nanocrystals. J. Am. Chem. Soc. 2008, 130, 11223–11233. [Google Scholar] [CrossRef] [PubMed]
- Hezam, M.; Qaid, S.M.H.; Bedja, I.M.; Alharbi, F.; Nazeeruddin, M.K.; Aldwayyan, A. Synthesis of pure brookite nanorods in a nonaqueous growth environment. Crystals 2019, 9, 562. [Google Scholar] [CrossRef] [Green Version]
- Chen, X.; Mao, S.S. Titanium dioxide nanomaterials: Synthesis, properties, modifications and applications. Chem. Rev. 2007, 107, 2891–2959. [Google Scholar] [CrossRef]
- Zhang, H.; Banfield, J.F. Thermodynamic analysis of phase stability of nanocrystalline titania. J. Mater. Chem. 1998, 8, 2073–2076. [Google Scholar] [CrossRef]
- Zhang, H.; Banfield, J.F. Understanding polymorphic phase transformation behavior during growth of nanocrystalline aggregates: Insights from TiO2. J. Phys. Chem. B 2000, 104, 3481–3487. [Google Scholar] [CrossRef]
- Paola, A.D.; Bellardita, M.; Palmisano, L. Brookite, the Least Known TiO2 Photocatalyst. Catalysts 2013, 3, 36–73. [Google Scholar] [CrossRef] [Green Version]
- Zhang, J.; Zhou, P.; Liu, J.; Yu, J. New understanding of the difference of photocatalytic activity among anatase, rutile and brookite TiO2. Phys. Chem. Chem. Phys. 2014, 16, 20382–20386. [Google Scholar] [CrossRef]
- Iskandar, F.; Nandiyanto, A.B.D.; Yun, K.M.; Hogan, C.J.; Okuyama, K.; Biswas, P. Enhanced photocatalytic performance of brookite TiO2 macroporous particles prepared by spray drying with colloidal templating. Adv. Mater. 2007, 19, 1408–1412. [Google Scholar] [CrossRef]
- Yang, M.-H.; Chen, P.-C.; Tsai, M.-C.; Chen, T.-T.; Chang, I.-C.; Chiu, H.-T.; Lee, C.-Y. Anatase and brookite TiO2 with various morphologies and their proposed building block. CrystEngComm 2014, 16, 441–447. [Google Scholar] [CrossRef]
- Kobayashi, M.; Petrykin, V.; Tomita, K.; Kakihana, M. Hydrothermal synthesis of brookite-type titanium dioxide with snowflake-like nanostructures using a water-soluble citratoperoxotitanate complex. J. Cryst. Growth 2011, 337, 30–37. [Google Scholar] [CrossRef]
- Hu, W.; Li, L.; Li, G.; Tang, C.; Sun, L. High-quality brookite TiO2 flowers: Synthesis, characterization, and dielectric performance. Cryst. Growth Des. 2009, 9, 3676–3682. [Google Scholar] [CrossRef]
- Kandiel, T.A.; Feldhoff, A.; Robben, L.; Dillert, R.; Bahnemann, D.W. Tailored titanium dioxide nanomaterials: Anatase nanoparticles and brookite nanorods as highly active photocatalysts. Chem. Mater. 2010, 22, 2050–2060. [Google Scholar] [CrossRef]
- Yoshizawa, M.; Kobayashi, M.; Petrykin, V.; Kato, H.; Kakihana, M. Insights into a selective synthesis of anatase, rutile, and brookite-type titanium dioxides by a hydrothermal treatment of titanium complexes. J. Mater. Res. 2014, 29, 90–97. [Google Scholar] [CrossRef]
- Xu, H.; Zhang, L. Controllable one-pot synthesis and enhanced photocatalytic activity of mixed-phase TiO2 nanocrystals with tunable brookite/rutile ratios. J. Phys. Chem. C 2009, 113, 1785–1790. [Google Scholar] [CrossRef]
- Kobayashi, M.; Tomita, K.; Petrykin, V.; Yoshimura, M.; Kakihana, M. Direct synthesis of brookite-type titanium oxide by hydrothermal method using water-soluble titanium complexes. J. Mater. Sci. 2008, 43, 2158–2162. [Google Scholar] [CrossRef]
- Pottier, A.; Chanéac, C.; Tronc, E.; Mazerolles, L.; Jolivet, J.-P. Synthesis of brookite TiO2 nanoparticles by thermolysis of TiCl4 in strongly acidic aqueous media. J. Mater. Chem. 2001, 11, 1116–1121. [Google Scholar] [CrossRef]
- Lin, H.; Li, L.; Zhao, M.; Huang, X.; Chen, X.; Li, G.; Yu, R. Synthesis of high-quality brookite TiO2single-crystalline nanosheets with specific facets exposed: Tuning catalysts from inert to highly reactive. J. Am. Chem. Soc. 2012, 134, 8328–8331. [Google Scholar] [CrossRef]
- Lee, B.I.; Wang, X.; Bhave, R.; Hu, M. Synthesis of brookite TiO2 nanoparticles by ambient condition sol process. Mater. Lett. 2006, 60, 1179–1183. [Google Scholar] [CrossRef]
- Kuznetsova, I.N.; Blaskov, V.; Stambolova, I.; Znaidi, L.; Kanaev, A. TiO2 pure phase brookite with preferred orientation, synthesized as a spin-coated film. Mater. Lett. 2005, 59, 3820–3823. [Google Scholar] [CrossRef]
- Vioux, A. Nonhydrolytic Sol-Gel Routes to Oxides. Chem. Mater. 1997, 9, 2292–2299. [Google Scholar] [CrossRef]
- Debecker, D.P.; Mutin, P.H. Non-hydrolytic sol–gel routes to heterogeneous catalysts. Chem. Soc. Rev. 2012, 41, 3624–3650. [Google Scholar] [CrossRef] [PubMed]
- Yang, H.G.; Sun, C.H.; Qiao, S.Z.; Zou, J.; Liu, G.; Smith, S.C.; Cheng, H.M.; Lu, G.Q. Anatase TiO2 single crystals with a large percentage of reactive facets. Nature 2008, 453, 638–641. [Google Scholar] [CrossRef] [Green Version]
- Han, X.; Kuang, Q.; Jin, M.; Xie, Z.; Zheng, L. Synthesis of Titania Nanosheets with a High Percentage of Exposed (001) Facets Facets and Related Photocatalytic Properties. Am. Chem. Soc. 2009, 131, 3152–3153. [Google Scholar] [CrossRef]
- Mo, S.D.; Ching, W.Y. Electronic and optical properties of three phases of titanium dioxide: Rutile, anatase, and brookite. Phys. Rev. B 1995, 51, 13023–13032. [Google Scholar] [CrossRef]
- Kharisov, B.I.; Kharissova, O.V.; Mendez, U.O. Microwave Hydrothermal and Solvothermal Processing of Materials and Compounds. Dev. Appl. Microw. Heat. 2012, 5, 107–140. [Google Scholar]
- Ghaithan, H.M.; Qaid, S.M.H.; Hezam, M.; Labis, J.P.; Alduraibi, M.; Bedja, I.M.; Aldwayyan, A.S. Laser induced photocurrent and photovoltage transient measurements of dye-sensitized solar cells based on TiO2 nanosheets and TiO2 nanoparticles. Electrochim. Acta 2016, 212, 992–997. [Google Scholar] [CrossRef]
- Yu, J.; Fan, J.; Lv, K. Anatase TiO2 nanosheets with exposed (001) facets: Improved photoelectric conversion efficiency in dye-sensitized solar cells. Nanoscale 2010, 2, 2144–2149. [Google Scholar] [CrossRef]
- Fang, J.; Li, Z.; Bai, X.; Zhang, Y.; Liu, J.; Wang, D.; Yao, Y. Co2+ Doping and Molecular Adsorption Behavior of Anatase TiO2 (001) Crystal Plane. Catal. Res. 2022, 2, 1–23. [Google Scholar] [CrossRef]
- Qaid, S.M.H.; Ghaithan, H.M.; Al-Asbahi, B.A.; Aldwayyan, A.S. Achieving Optical Gain of the CsPbBr3 Perovskite Quantum Dots and Influence of the Variable Stripe Length Method. ACS Omega 2021, 6, 5297–5309. [Google Scholar] [CrossRef] [PubMed]
- Nath, D.; Singh, F.; Das, R. X-ray diffraction analysis by Williamson-Hall, Halder-Wagner and size-strain plot methods of CdSe nanoparticles- a comparative study. Mater. Chem. Phys. 2020, 239, 122021. [Google Scholar] [CrossRef]
- Qaid, S.M.H.; Ghaithan, H.M.; Al-Asbahi, B.A.; Aldwayyan, A.S. Tuning of amplified spontaneous emission wavelength for green and blue light emission through the tunable composition of cspb(br1-xclx)3 inorganic perovskite quantum dots. J. Phys. Chem. C 2021, 125, 9441–9452. [Google Scholar] [CrossRef]
- Qaid, S.M.; Ghaithan, H.M.; Aldwayyan, A.S. Simple approach for crystallizing growth of MAPbI3 perovskite nanorod without thermal annealing. Mater. Chem. Phys. 2023, 298, 127423. [Google Scholar] [CrossRef]
- Qaid, S.M.H.; Ghaithan, H.M.; Al-Asbahi, B.A.; Alqasem, A.; Aldwayyan, A.S. Fabrication of thin films from powdered cesium lead bromide (CsPbBr3) perovskite quantum dots for coherent green light emission. ACS Omega 2020, 5, 30111–30122. [Google Scholar] [CrossRef]
- Qaid, S.M.H.; Hussain, M.; Hezam, M.; Khan, M.A.M.; Albrithen, H.; Ghaithan, H.M.; Aldwayyan, A.S. Structural and optical investigation of brookite TiO2 thin fi lms grown by atomic layer deposition on Si (111) substrates. Mater. Chem. Phys. 2019, 225, 55–59. [Google Scholar] [CrossRef]
- Souri, D.; Tahan, Z.E. A new method for the determination of optical band gap and the nature of optical transitions in semiconductors. Appl. Phys. B Lasers Opt. 2015, 119, 273–279. [Google Scholar] [CrossRef]
- Yakuphanoglu, F.; Sekerci, M.; Ozturk, O.F. The determination of the optical constants of cu(ii) compound having 1-chloro-2,3-o-cyclohexylidinepropane thin film. Opt. Commun. 2004, 239, 275–280. [Google Scholar] [CrossRef]
- Costa, J.C.S.; Taveira, R.J.S.; Lima, C.F.R.A.C.; Mendes, A.; Santos, L.M.N.B.F. Optical band gaps of organic semiconductor materials. Opt. Mater. 2016, 58, 51–60. [Google Scholar] [CrossRef]
- Dolgonos, A.; Mason, T.O.; Poeppelmeier, K.R. Direct optical band gap measurement in polycrystalline semiconductors: A critical look at the Tauc method. J. Solid State Chem. 2016, 240, 43–48. [Google Scholar] [CrossRef] [Green Version]
- Qaid, S.M.H.; Alharbi, F.H.; Bedja, I.; Nazeeruddin, M.K.; Aldwayyan, A.S. Reducing amplified spontaneous emission threshold in CsPbBr3 quantum dot films by controlling TiO2 compact layer. Nanomaterials 2020, 10, 1605. [Google Scholar] [CrossRef] [PubMed]
- Qaid, S.M.H.; Al-Asbahi, B.A.; Ghaithan, H.M.; AlSalhi, M.S.; Al dwayyan, A.S. Optical and structural properties of CsPbBr3 perovskite quantum dots/PFO polymer composite thin films. J. Colloid Interface Sci. 2020, 563, 426–434. [Google Scholar] [CrossRef] [PubMed]
- Qaid, S.M.H.; Ghaithan, H.M.; Al-Asbahi, B.A.; Aldwayyan, A.S. Investigation of the Surface Passivation Effect on the Optical Properties of CsPbBr3 Perovskite Quantum Dots. Surfaces Interfaces 2021, 23, 100948. [Google Scholar] [CrossRef]
- Navidpour, A.H.; Abbasi, S.; Li, D.; Mojiri, A.; Zhou, J.L. Investigation of Advanced Oxidation Process in the Presence of TiO2 Semiconductor as Photocatalyst: Property, Principle, Kinetic Analysis, and Photocatalytic Activity. Catalysts 2023, 13, 232. [Google Scholar] [CrossRef]


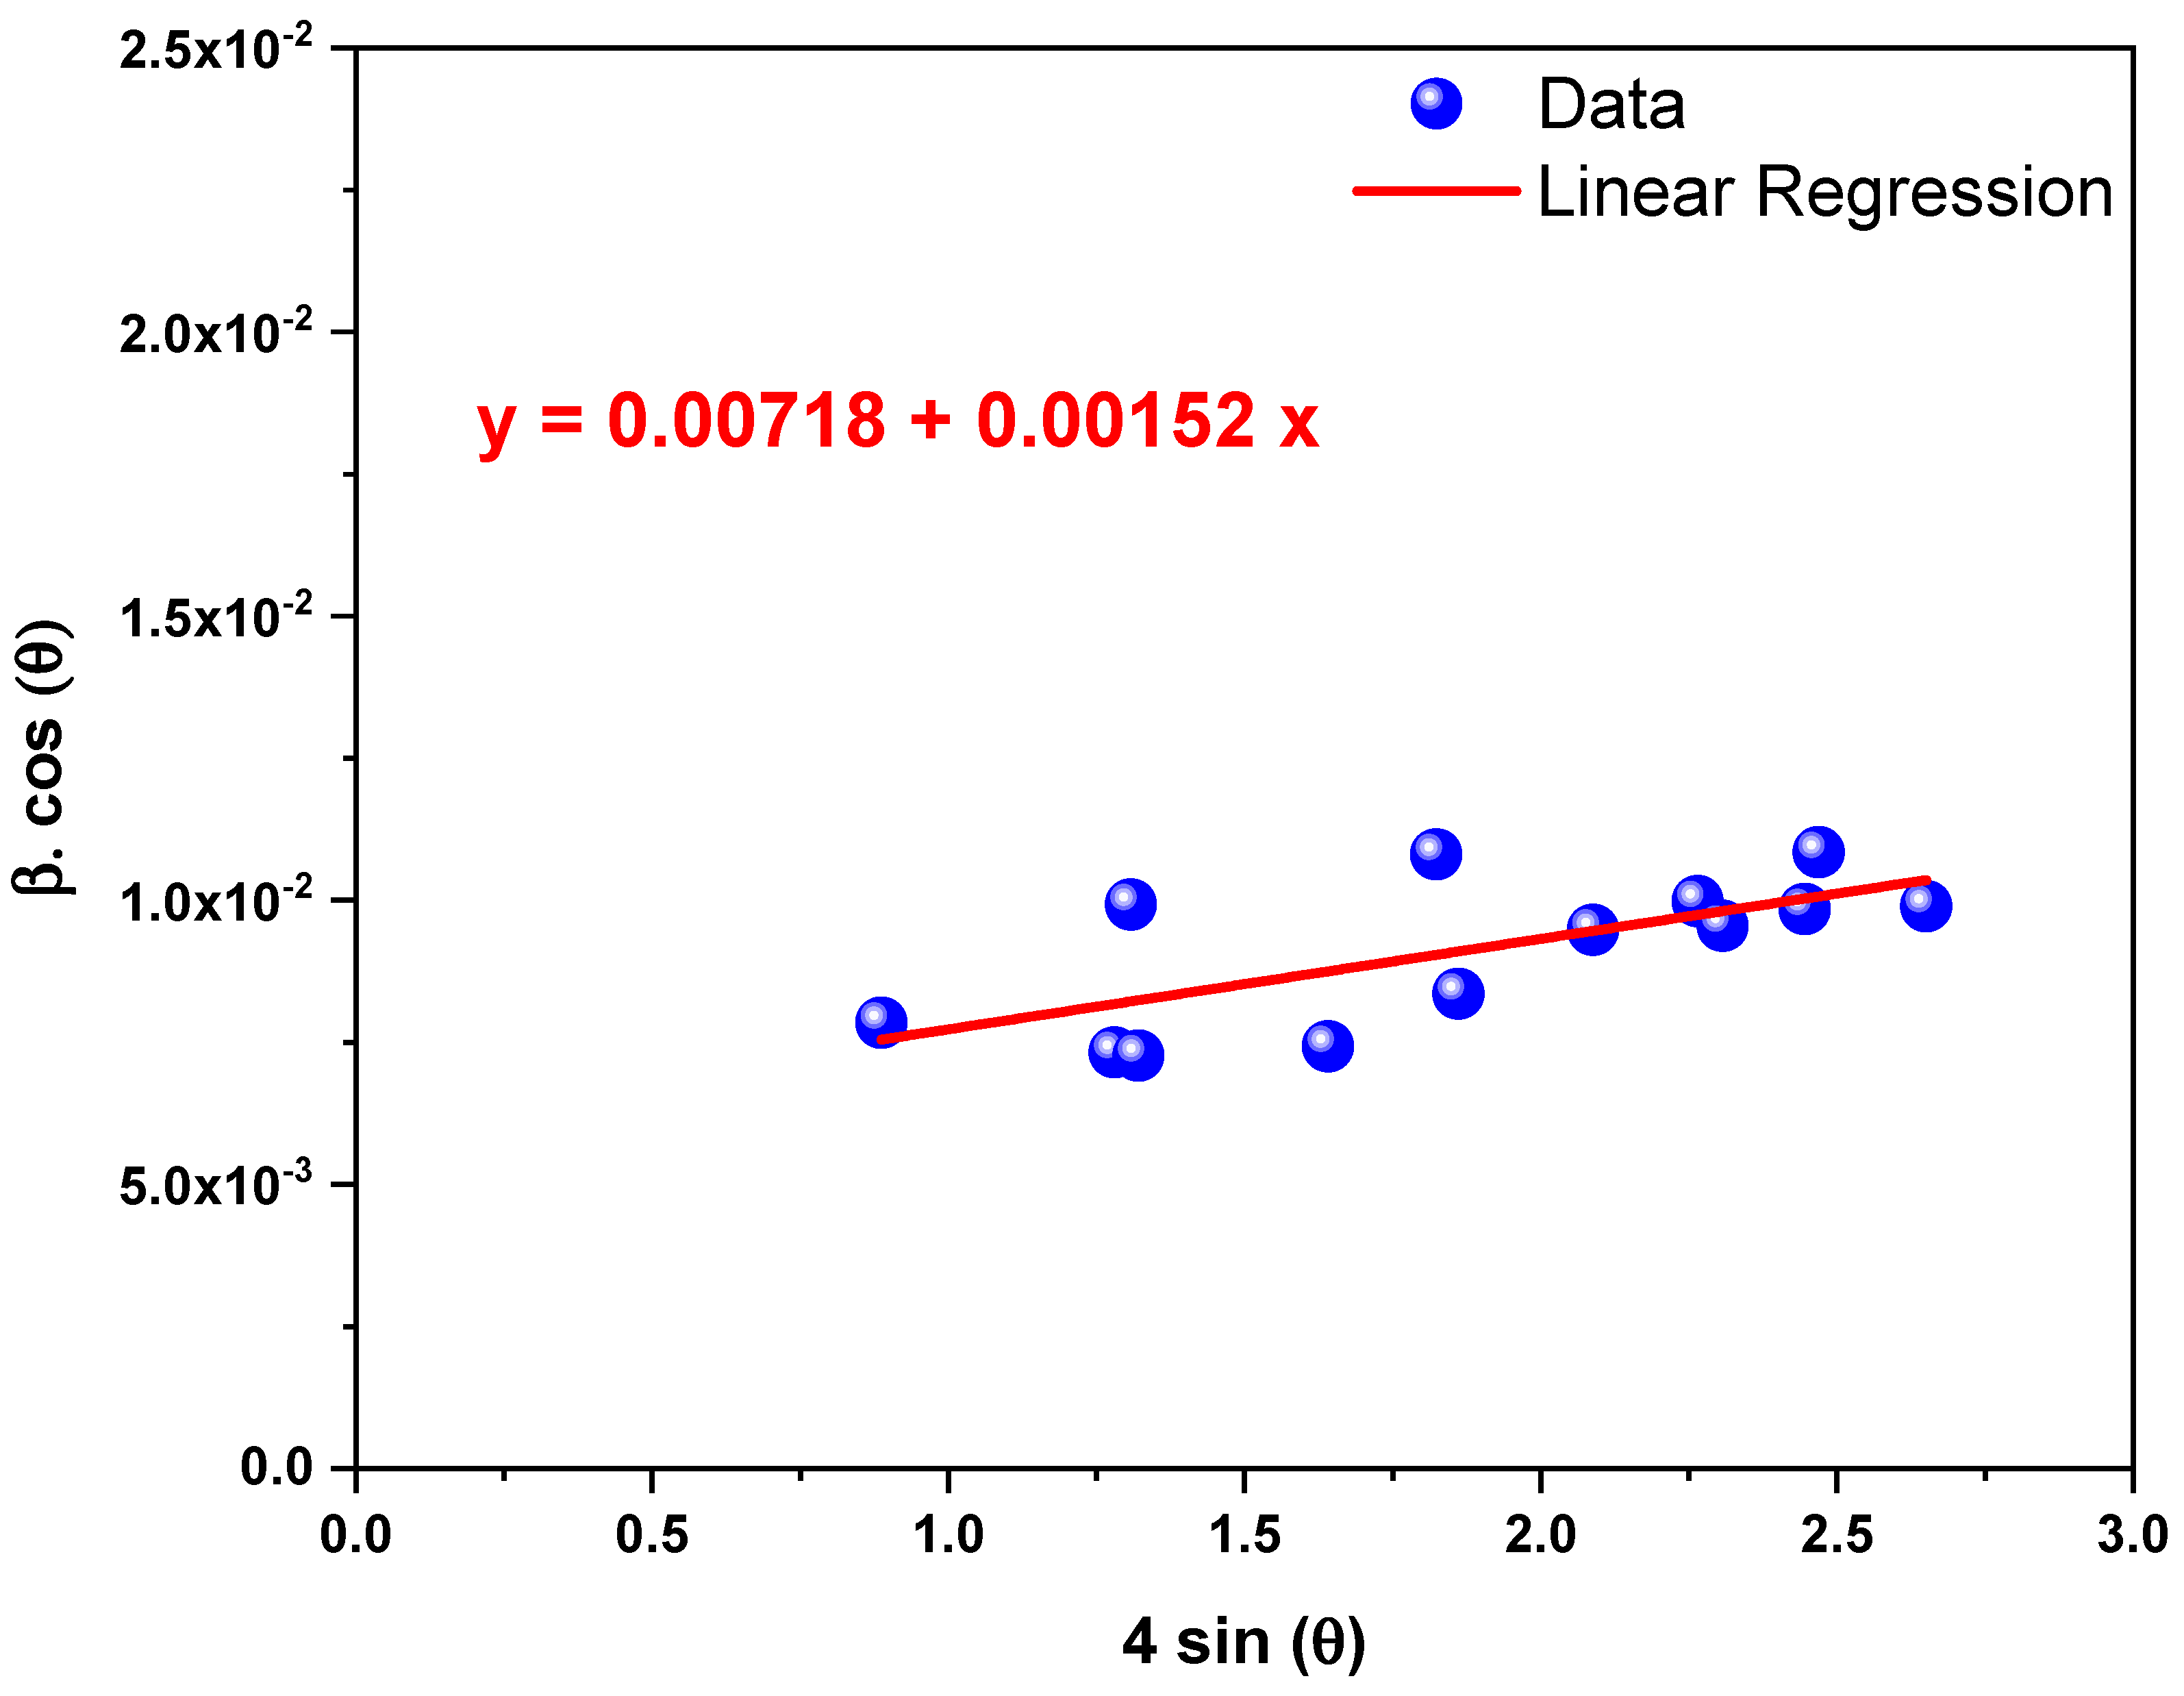
| Crystalline size, D (nm) | 19.30 |
| Micro strain × 10−3 | 1.52 |
| Dislocation density (δ) × 10−3 (nm)−2 | 2.68 |
| TiO2-NCs | Crystallite Size, D (nm) |
| TiO2-NSs | 14.7 |
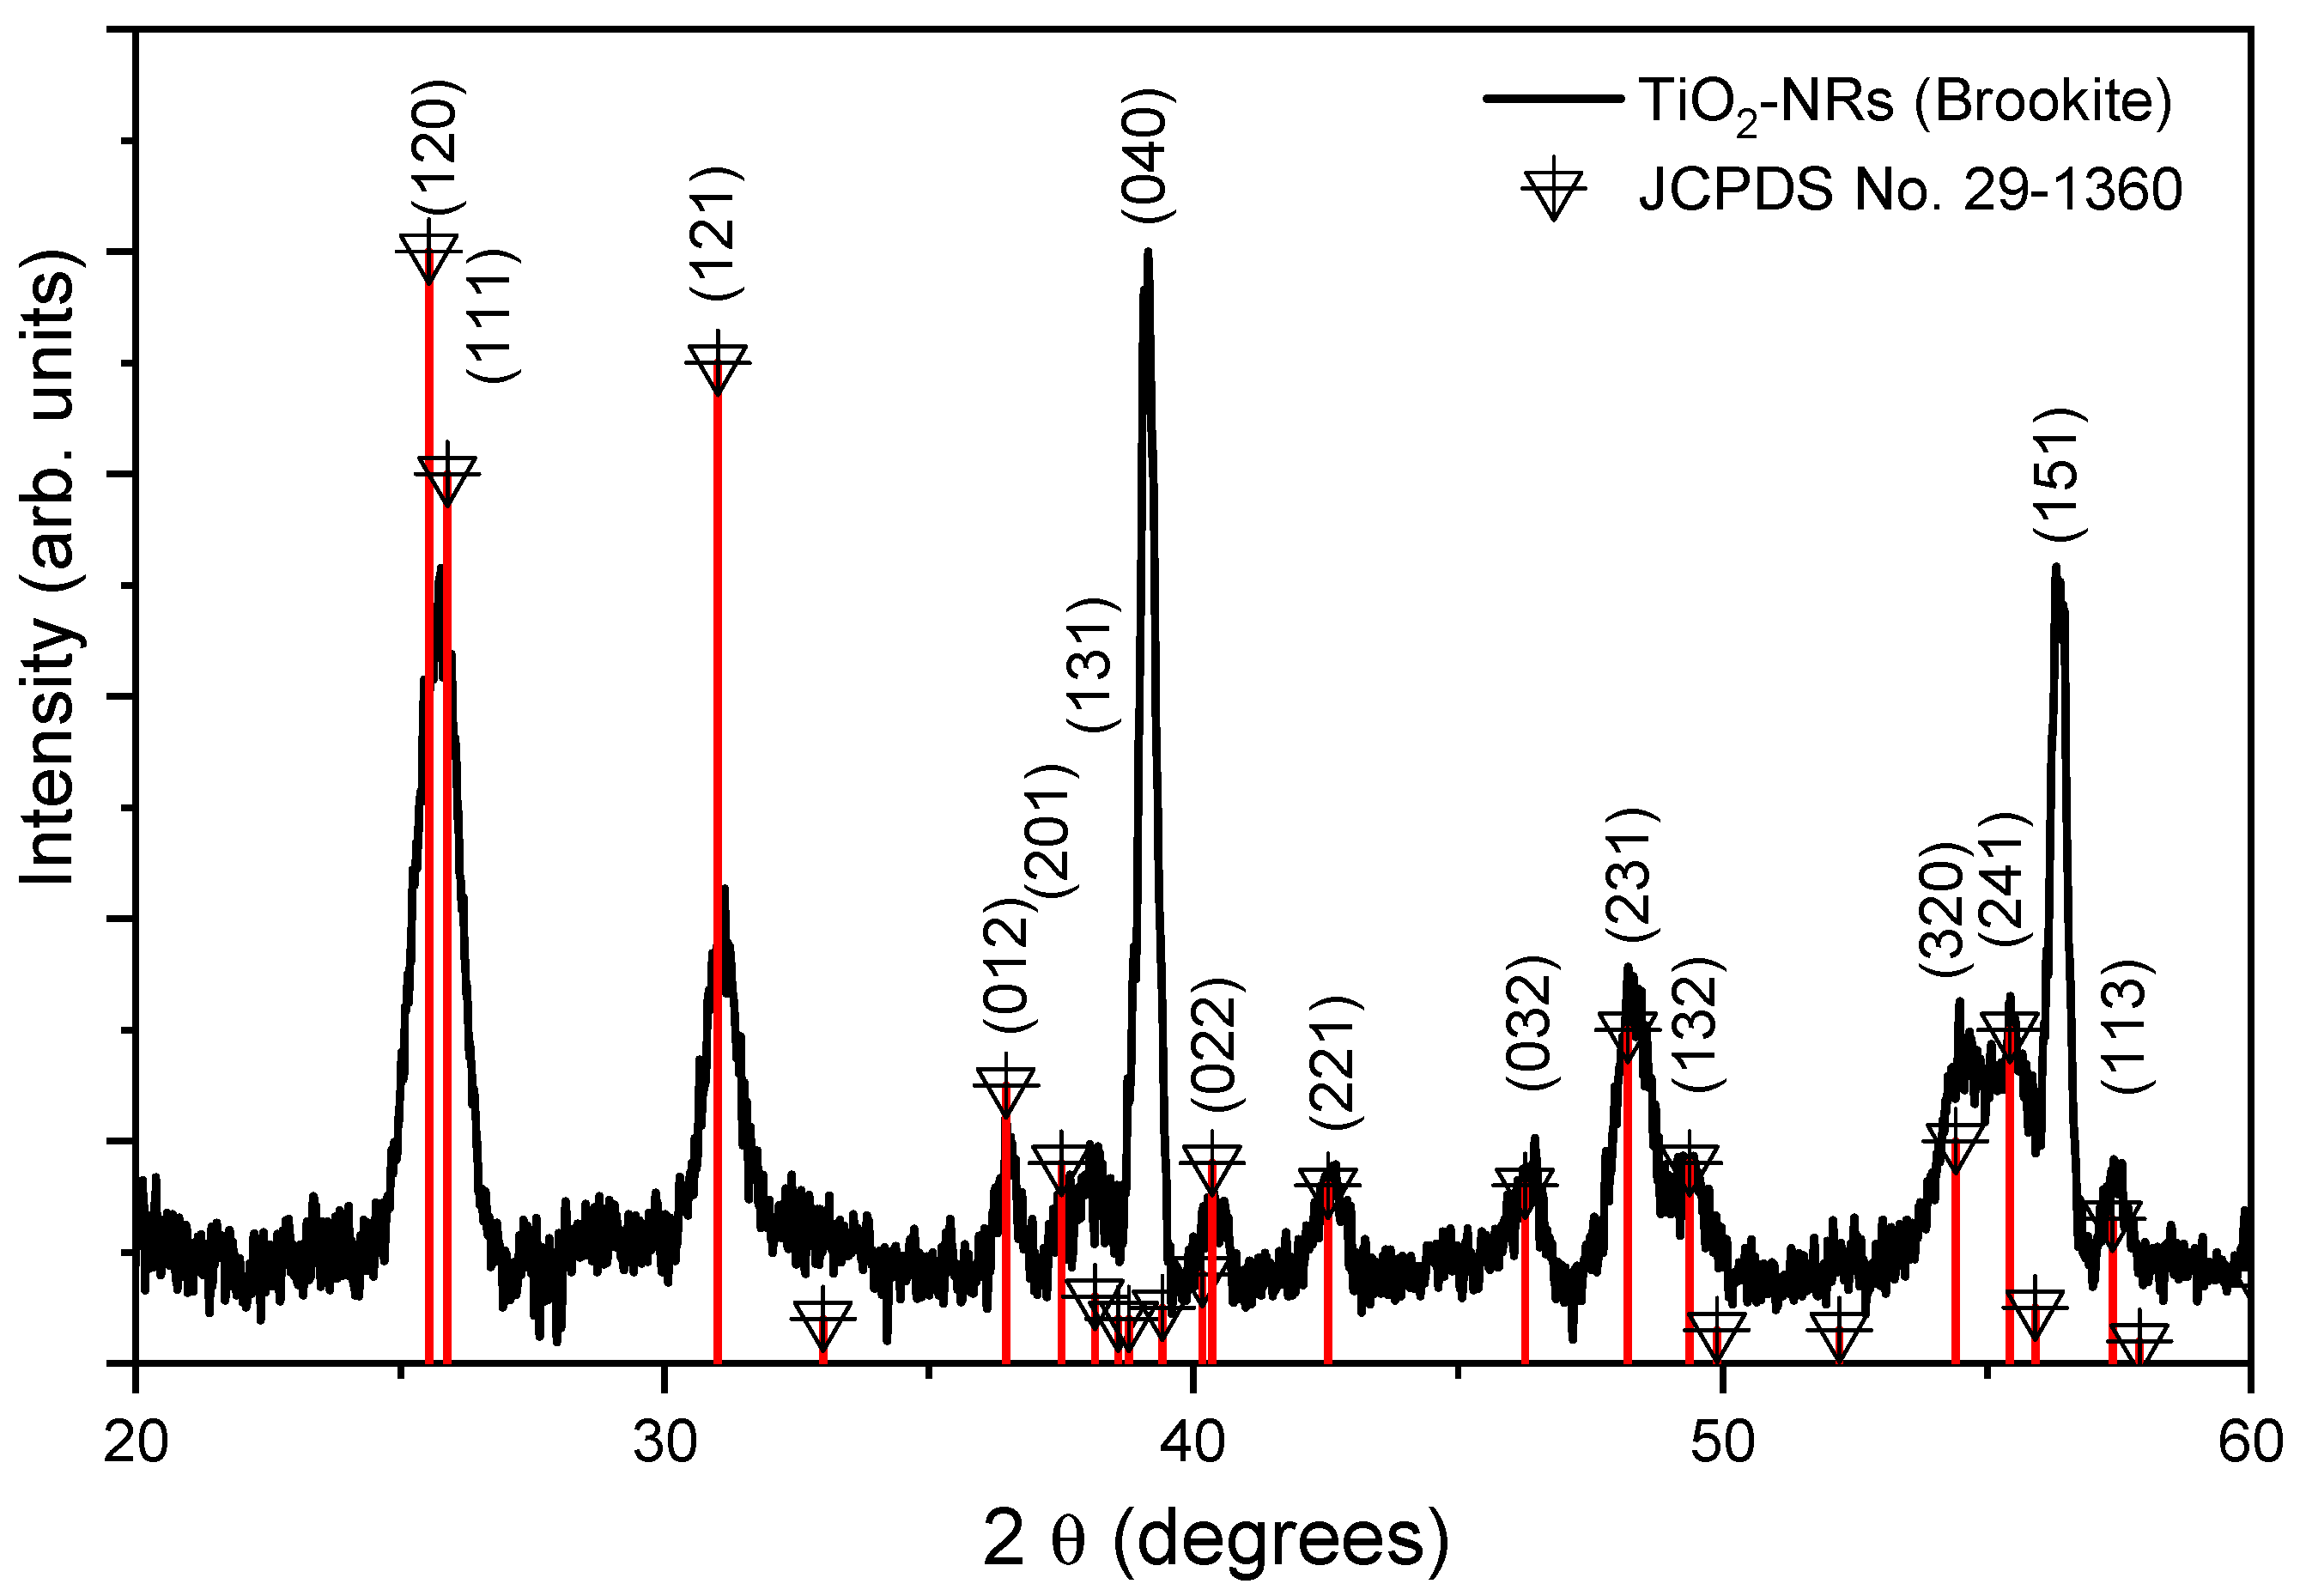
| TiO2-NRs | 12 |
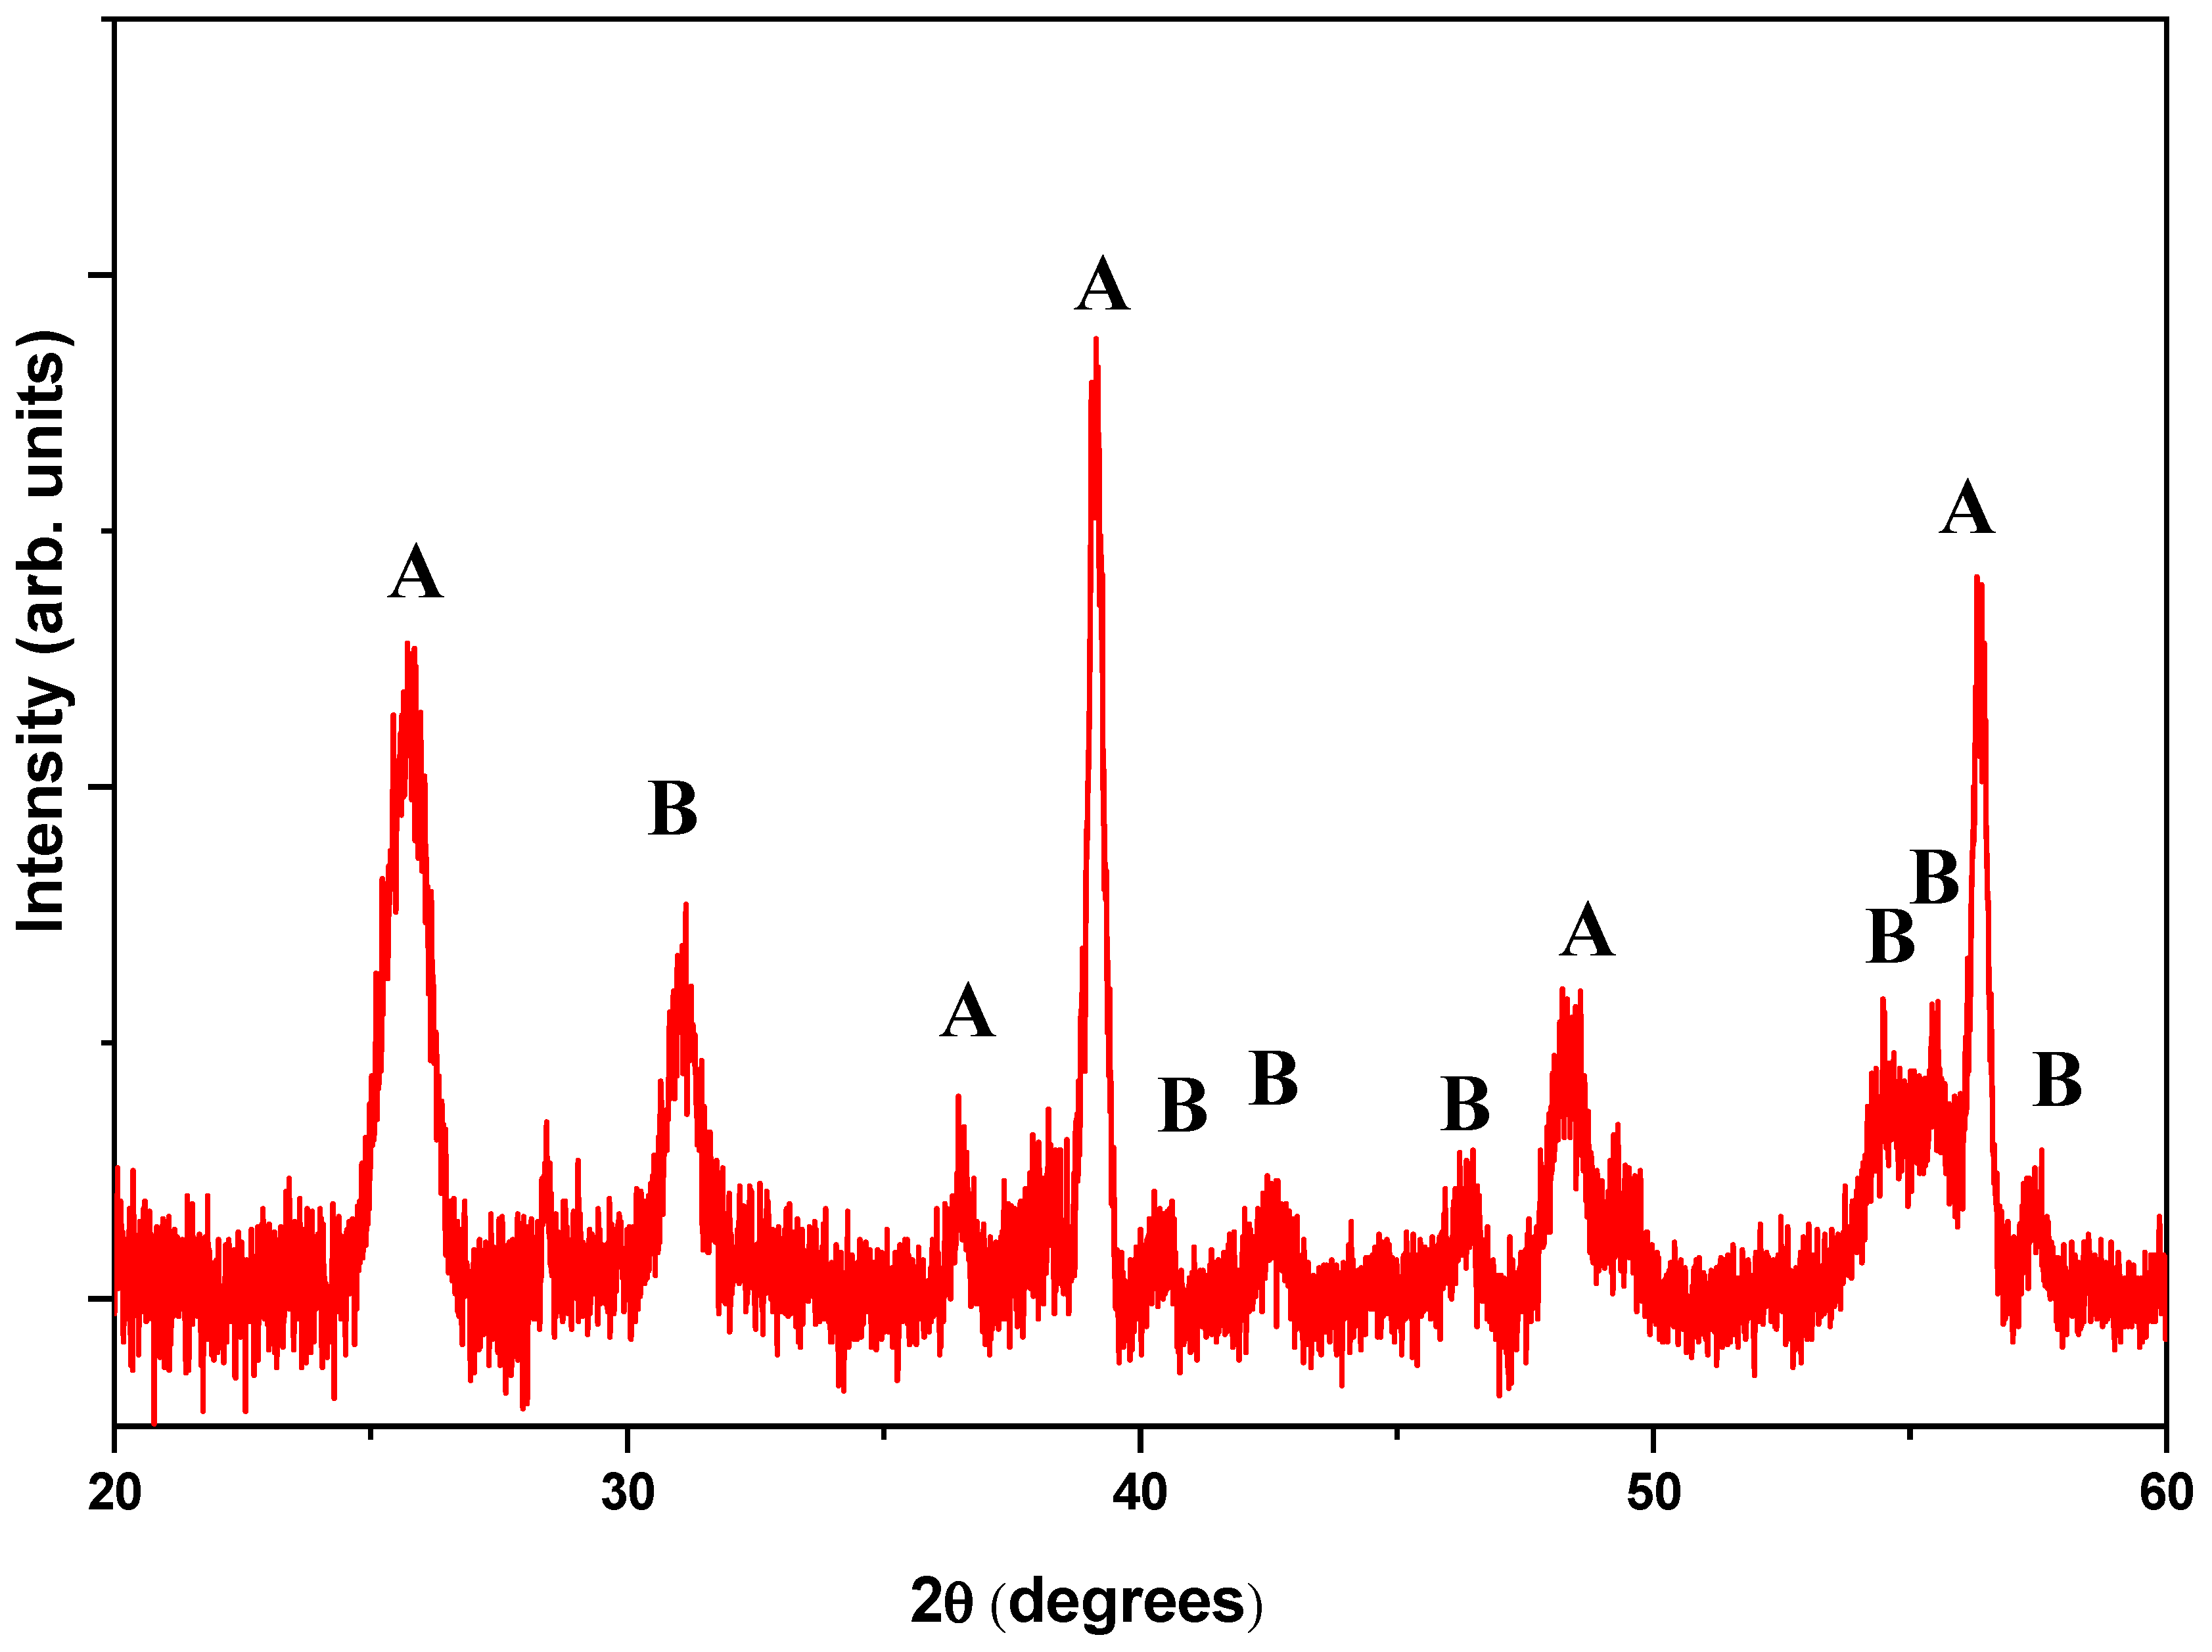
| TiO2-NPs | 5 |
Disclaimer/Publisher’s Note: The statements, opinions and data contained in all publications are solely those of the individual author(s) and contributor(s) and not of MDPI and/or the editor(s). MDPI and/or the editor(s) disclaim responsibility for any injury to people or property resulting from any ideas, methods, instructions or products referred to in the content. |
© 2023 by the authors. Licensee MDPI, Basel, Switzerland. This article is an open access article distributed under the terms and conditions of the Creative Commons Attribution (CC BY) license (https://creativecommons.org/licenses/by/4.0/).
Share and Cite
Qaid, S.M.H.; Ghaithan, H.M.; Bawazir, H.S.; Bin Ajaj, A.F.; AlHarbi, K.K.; Aldwayyan, A.S. Successful Growth of TiO2 Nanocrystals with {001} Facets for Solar Cells. Nanomaterials 2023, 13, 928. https://doi.org/10.3390/nano13050928
Qaid SMH, Ghaithan HM, Bawazir HS, Bin Ajaj AF, AlHarbi KK, Aldwayyan AS. Successful Growth of TiO2 Nanocrystals with {001} Facets for Solar Cells. Nanomaterials. 2023; 13(5):928. https://doi.org/10.3390/nano13050928
Chicago/Turabian StyleQaid, Saif M. H., Hamid M. Ghaithan, Huda S. Bawazir, Abrar F. Bin Ajaj, Khulod K. AlHarbi, and Abdullah S. Aldwayyan. 2023. "Successful Growth of TiO2 Nanocrystals with {001} Facets for Solar Cells" Nanomaterials 13, no. 5: 928. https://doi.org/10.3390/nano13050928