Article

Ecotoxicological Properties of Titanium Dioxide Nanomorphologies in Daphnia magna

by
Freddy Mendoza-Villa
1,
Noemi-Raquel Checca-Huaman
2 and
Juan A. Ramos-Guivar
1,*
1
Grupo de Investigación de Nanotecnología Aplicada para Biorremediación Ambiental, Energía, Biomedicina y Agricultura (NANOTECH), Facultad de Ciencias Físicas, Universidad Nacional Mayor de San Marcos, Av. Venezuela Cdra 34 S/N, Ciudad Universitaria, Lima 15081, Peru
2
Centro Brasileiro de Pesquisas Físicas (CBPF), R. Xavier Sigaud, 150, Urca, Rio de Janeiro 22290-180, Brazil
*
Author to whom correspondence should be addressed.
Nanomaterials 2023, 13(5), 927; https://doi.org/10.3390/nano13050927
Submission received: 7 February 2023 / Revised: 27 February 2023 / Accepted: 1 March 2023 / Published: 3 March 2023
(This article belongs to the Special Issue Ecotoxicology and Risk Assessment of Engineered Nanomaterials)

Abstract

:
In this work, the structural, vibrational, morphological, and colloidal properties of commercial 15.1 nm TiO2 nanoparticles (NPs) and nanowires (NWs, 5.6 thickness, 74.6 nm length) were studied with the purpose of determining their ecotoxicological properties. This was achieved by evaluating acute ecotoxicity experiments carried out in the environmental bioindicator Daphnia magna, where their 24-h lethal concentration (LC50) and morphological changes were evaluated using a TiO2 suspension (pH = 7) with point of zero charge at 6.5 for TiO2 NPs (hydrodynamic diameter of 130 nm) and 5.3 for TiO2 NWs (hydrodynamic diameter of 118 nm). Their LC50 values were 157 and 166 mg L−1 for TiO2 NWs and TiO2 NPs, respectively. The reproduction rate of D. magna after fifteen days of exposure to TiO2 nanomorphologies was delayed (0 pups for TiO2 NWs and 45 neonates for TiO2 NPs) in comparison with the negative control (104 pups). From the morphological experiments, we may conclude that the harmful effects of TiO2 NWs are more severe than those of 100% anatase TiO2 NPs, likely associated with brookite (36.5 wt. %) and protonic trititanate (63.5 wt. %) presented in TiO2 NWs according to Rietveld quantitative phase analysis. Specifically, significant change in the heart morphological parameter was observed. In addition, the structural and morphological properties of TiO2 nanomorphologies were investigated using X-ray diffraction and electron microscopy techniques to confirm the physicochemical properties after the ecotoxicological experiments. The results reveal that no alteration in the chemical structure, size (16.5 nm for TiO2 NPs and 6.6 thickness and 79.2 nm length for NWs), and composition occurred. Hence, both TiO2 samples can be stored and reused for future environmental purposes, e.g., water nanoremediation.

1. Introduction

Promising metal/metal-oxide nanomaterials have been synthesized by different chemical, physical, and biological synthesis techniques [1,2], such as pulse laser ablation, high-energy ball milling, sputtering, chemical reduction, microemulsion, sol gel, and green synthesis, to create different shapes of nanoparticles (NPs) [1,2]. Therefore, different enhanced physicochemical properties are expected and will differ in the required applications/purposes [2]. One of these applications is to solve existing environmental problems such as the accelerated consumption of fossil fuels through the removal of emerging pollutants that will end up in aquatic ecosystems, etc. [1,3,4]. One important nanomaterial is titanium dioxide (TiO2), the world production of which is estimated to reach 2.5 million tons in 2025 [5]. These are found in applications such as sun creams and self-cleaning products due to their photocatalytic, antimicrobial, and UV protection properties [6,7]. Hence, due to the high production of these nanomaterials at industrial levels, it is expected that they will be spread to aqueous bodies and represent a toxic material to water specimens as well. The ultimate process for these nanomaterials in aquatic ecosystems is a current concern and previous toxic effect evaluations have been reported [8,9,10].
Moreover, though TiO2 types have shown high removal efficiency in the uptake of heavy metals from water bodies [11], studies on their removal efficiency are limited to preliminary studies performed in nanoremediation. A second and mandatory study is to evaluate their ecotoxicological risks. This represents an open gap in the field of nanoremediation, since NPs will have different toxic effects depending on their size, morphologies, and textural properties (porosity +specific surface area). Daphnia magna (D. magna) is a crustacean of the cladoceran family found in lakes, ponds, etc. [12] and is an important environmental bioindicator, due to its easy handling, rapid growth, and asexual reproduction (parthenogenesis) under favorable conditions, characteristics that allowing its observation because of its biological sensitivity and response to the toxic effects of nanomaterials under standardized laboratory conditions, it is thus highly advantageous as a test specimen for ecotoxicological evaluation, e.g., LC50 determination [8].
In the last years, innovative, and novel research about ecotoxicological properties (lab conditions) of metal oxides and magnetic oxides has been developed [13,14,15]. For example, Liu et al. [13] studied the chronic toxicity of the crystalline forms of TiO2 (rutile + anatase) NPs on the physiological parameters of D. magna. They found a direct relation between the energy gaps of the TiO2 forms (0.25 to 1 mg L−1) and the toxicity in the aquatic organisms. Nevertheless, these concentrations are smaller than others used for water treatments [16] and the 48h-EC50 values were the same for the five samples, having a value of 100 mg L−1. In another study, Novak et al. [14] implemented and improved the commercial EN ISO 6341:2014 in order to analyze the effect of TiO2 NPs in Daphnia magna for 48 h postexposure experiments. No remarkable toxic effects were observed during the tested 48 h, but the daphnids immobility increased when testing longer exposure times, up to 72 h. This problem was solved by transferring the daphnids to clean water after 48 h tests. Nevertheless, no characterization of the TiO2 NPs was carried out to evaluate their reuse and storage. Furthermore, various pilot experiments using TiO2 NPs have been developed to treat polluted water using solar assistant [17] and photolitically produced hydrogen has also become a topic of research [18]. However, the handling, reuse, storage and, more importantly, the ecotoxicological properties of TiO2 NPs have not been studied, pilot experiments are therefore required for larger amounts of material.
Hence, determining whether concentrations of TiO2 (diverse nanomorphologies) are harmful to aquatic organisms is a priority in order to analyze its ecotoxicological behavior before its commercialization as a potential nanoremediator candidate. These novel results may also be used to help future markets interested in nanoremediation to establish political guidelines. More importantly, research on the ecotoxicological effects of TiO2 (different morphologies) on environmental biomarkers such as D. magna is scarce in many countries that face pollution problems [9]. Therefore, nanotoxicology experiments should be evaluated before adsorption experiments to determine lethal concentrations (LC50). More importantly, the colloidal parameters and reusability properties of TiO2 NPs have not been widely studied in the literature when studying the ecotoxicological properties, and the dispersion preparation method, the hydrodynamic diameter, zeta potential, and recovery properties can affect the LC50 determination [8,9,10,11]. Most reports only showed ecotoxicological evaluation and this can represent a disadvantage since the reusability or conserved properties of TiO2 NPs were not proved.
Thus, the present work seeks to elucidate the toxic effects of TiO2 on D. magna under laboratory conditions that simulate their corresponding habitat, and then compare the results with the literature and discuss whether they are useful for the simultaneous nanoremediation of water bodies. For this, the environmental bioindicator D. magna was used to perform the ecotoxicity experiments for various TiO2 NPs and TiO2 nanowires (NWs) concentrations. Before studying the ecotoxicological properties of both materials, their structural, vibrational, morphological, and colloidal properties were investigated. Then, a 24 h-LC50 estimation was undertaken for both commercial nanosystems using non-linear approaches. Morphological analysis was undertaken to analyze the significant damage caused to D. magna individuals after exposure to the material. Novel post-ecotoxicological experiments regarding the structural and morphological characterization of the recovered nanosystems were undertaken by X-ray diffraction (XRD), selected area electron diffraction (SAED), and electron energy loss spectroscopy (EELS) to ensure their reusability and regeneration properties.

2. Materials and Methods

2.1. Chemicals

To perform the ecotoxicological experiments in the presence of the environmental bioindicator D. magna, both 20 nm anatase TiO2 NPs and TiO2 NWs (10 µm in length and 10 nm in thickness) were purchased from SIGMA-ALDRICH without any other chemical modifications. Both samples were synthesized by the hydrothermal method.

2.2. Characterization of the TiO2 Samples

X-ray diffraction data were obtained using an Empyrean diffractometer operating with CuKα, 45 kV and 40 mA. X-ray diffractograms were collected in step scanning mode, 2θ = 10–100°, step of 0.026°, and 20 s/step. By means of the Match v3 software [19], the phase identification and indexation of both samples was carried out, resulting in a monophasic sample (anatase with a crystallographic chart #500-0024) for the NPs and a biphasic sample (brookite with a crystallographic chart #900-9088 and protonic trititanate with a crystallographic chart crystallography #433-6946) for the NWs. The Rietveld refinement was applied from the crystallographic information file (cif) of both samples using the FullProf Suite software (Gif sur Yvette Cedex, France, version January 2021). To refine the X-ray diffraction profile, the Thompson–Cox–Hastings (TCH) pseudo-Voigt axial divergence asymmetry function was used. The instrumental resolution function (IRF) of the diffractometer was obtained from an aluminum-oxide (Al2O3) standard with refined Caglioti parameters, U = 0.0093, V = −0.0051, and W = 0.0013 [20,21].
The μ-Raman spectrum was measured in a Renishaw inVia Raman microscope. A wavelength of λ = 785 nm (initial laser power of 82.8 mW) was used as the excitation source. An optical objective of 50× magnification was chosen for the measurements. The Raman mode profiles (spectrum taken at laser power fraction of 10% over the sample) were fit using Lorentzian functions.
The colloidal properties by means of effective hydrodynamic diameter and Zeta potential of the TiO2 suspensions (both morphologies) were determined using a Brookhaven Nanobrook 90 Plus PALS. The zeta potential of the suspensions as a function of pH was obtained for TiO2 samples to find the point of zero charge. In addition, the hydrodynamic diameter at different pH values (2, 5, 7, 9, 12) were measured for initial 50 mg L 1 TiO2 NPs and NWs. All the experiments were done in duplicate. The base line index criterium was used to analyze the correct measurement.
To determine the average particle size, particle size distribution, and morphological features, the 200 kV JEOL 2100F (Tokyo, Japan) imaging electron microscopy equipment was employed in transmission (TEM), scanning (STEM), and high-resolution modes. For particle size distribution (PSD) estimation, a total number of particles and wires of 800 to 1000 was counted from 30–35 images using the Image J software. A log-normal distribution was considered to fit the obtained histograms according to [22]. Finally, the polydispersity values were estimated from the standard deviation of the log-normal distribution. The microscope has two accessories for energy-dispersive X-ray spectroscopy (EDS) and electron energy loss spectroscopy (EELS) (EELS-GIF Tridiem GATAN). Both techniques were used to evaluate the atomic composition at the nanoscale using the mode STEM. EELS experiments were carried out in the STEM imaging mode using a spot size of 0.7 nm. The spectrometer aperture was 5 mm and the energy resolution (measured by the FWHM of the zero-loss peaks) was approximately 1.8 eV. For the morphological analysis, commercial samples without any modification were labeled as before samples and recovered samples after ecotoxicological experiments were labeled as after. This nomenclature was also used ahead in this work.

2.3. D. magna Culture

The set of D. magna individuals used for the ecotoxicity experiments were cultivated in the laboratory under optimized conditions which resemble their habitat. D. magna were maintained in an 8:16 h light:dark photoperiod and a temperature of (20 ± 1) °C and pH = 7.5 ± 0.5. The required hatchlings were obtained by separating 120 adult daphnia individuals with the potential to give hatchlings in a short time. The daphnia individuals were fed daily with microalgae of the genus Scenedesmus, in relation to the volume of the beaker, with a scale of 1 mL per 100 mL [12].
These D. magna individuals were separated in to four beakers with 200 mL of standardized water for the cultivation of D. magna, after one to five days the corresponding neonates were born, which are clones due to the favorable conditions in which they were found. Neonates are D. magna individuals with a life span of less than 24 h. If daphnia are well fed, they can have up to 65 hatchlings in a single litter, with an average size of 12 hatchlings per litter [23].
When the 120 D. magna individuals were separated in the four reproduction beakers no more hatchlings were generated. Then, they were returned to the original culture beaker and other D. magna with the potential to give hatchlings in a short time were separated again with the purpose of continuing the ecotoxicity experiment.
It should also be highlighted that the set of D. magna must have a specific culture temperature, since being a bioindicator, it is very sensitive to sudden physicochemical changes that occur in its habitat. For example, a sudden change in temperature inside the beaker during feeding, oxygen concentration, etc. [23], under the specific laboratory conditions.

2.4. D. magna Exposure Protocol

The TiO2 concentrations for the ecotoxicity experiment were done separately. In a volume of 200 mL of standardized water, five concentrations of TiO2 NPs were prepared: 37.5 mg L 1 , 75 mg L 1 , 150 mg L 1 , 300 mg L 1 , and 600 mg L 1 . While for the TiO2 NWs five chosen concentrations were also prepared: 50 mg L 1 , 100 mg L 1 , 200 mg L 1 , 400 mg L 1 , and 800 mg L 1 . The individuals for each concentration were 10 neonates of D. magna. Experiments were done in duplicate and the mean values were reported.

2.5. Morphological Analysis of D. magna

The morphological evaluation was undertaken after 16 days, one day for the exposure with the TiO2 samples. After the 24-h exposure, surviving D. magna were moved to another beaker with conditions prior to TiO2 exposure. The remaining 15 days were for the control of the surviving D. magna. On the last day of the experiment, the length (micrometers) of the tail, body, antenna, eye, and heart morphological parameters of the surviving D. magna were measured using an optical microscope and ToupView software on a computer.
Within two weeks, D. magna reaches sexual maturity (generally between the sixth and ninth day [23]) to be able to reproduce either sexually or asexually depending on habitat conditions. In the ecotoxicity experiment it was evidenced that the negative control D. magna began to have newborns from the ninth day.
Finally, the statistical analysis of the morphological parameters was analyzed by means of the paired Student’s t-test using the p value criterium of 0.05 for the corresponding significance. A box plot was used to visualize the comparison of morphological parameters between exposed daphnia and negative control D. magna. These calculations were made using SPSS 27 statistical software. The comparison was made with respect to the negative control, a set of D. magna that were not exposed to the TiO2 sample.

3. Results and Discussions

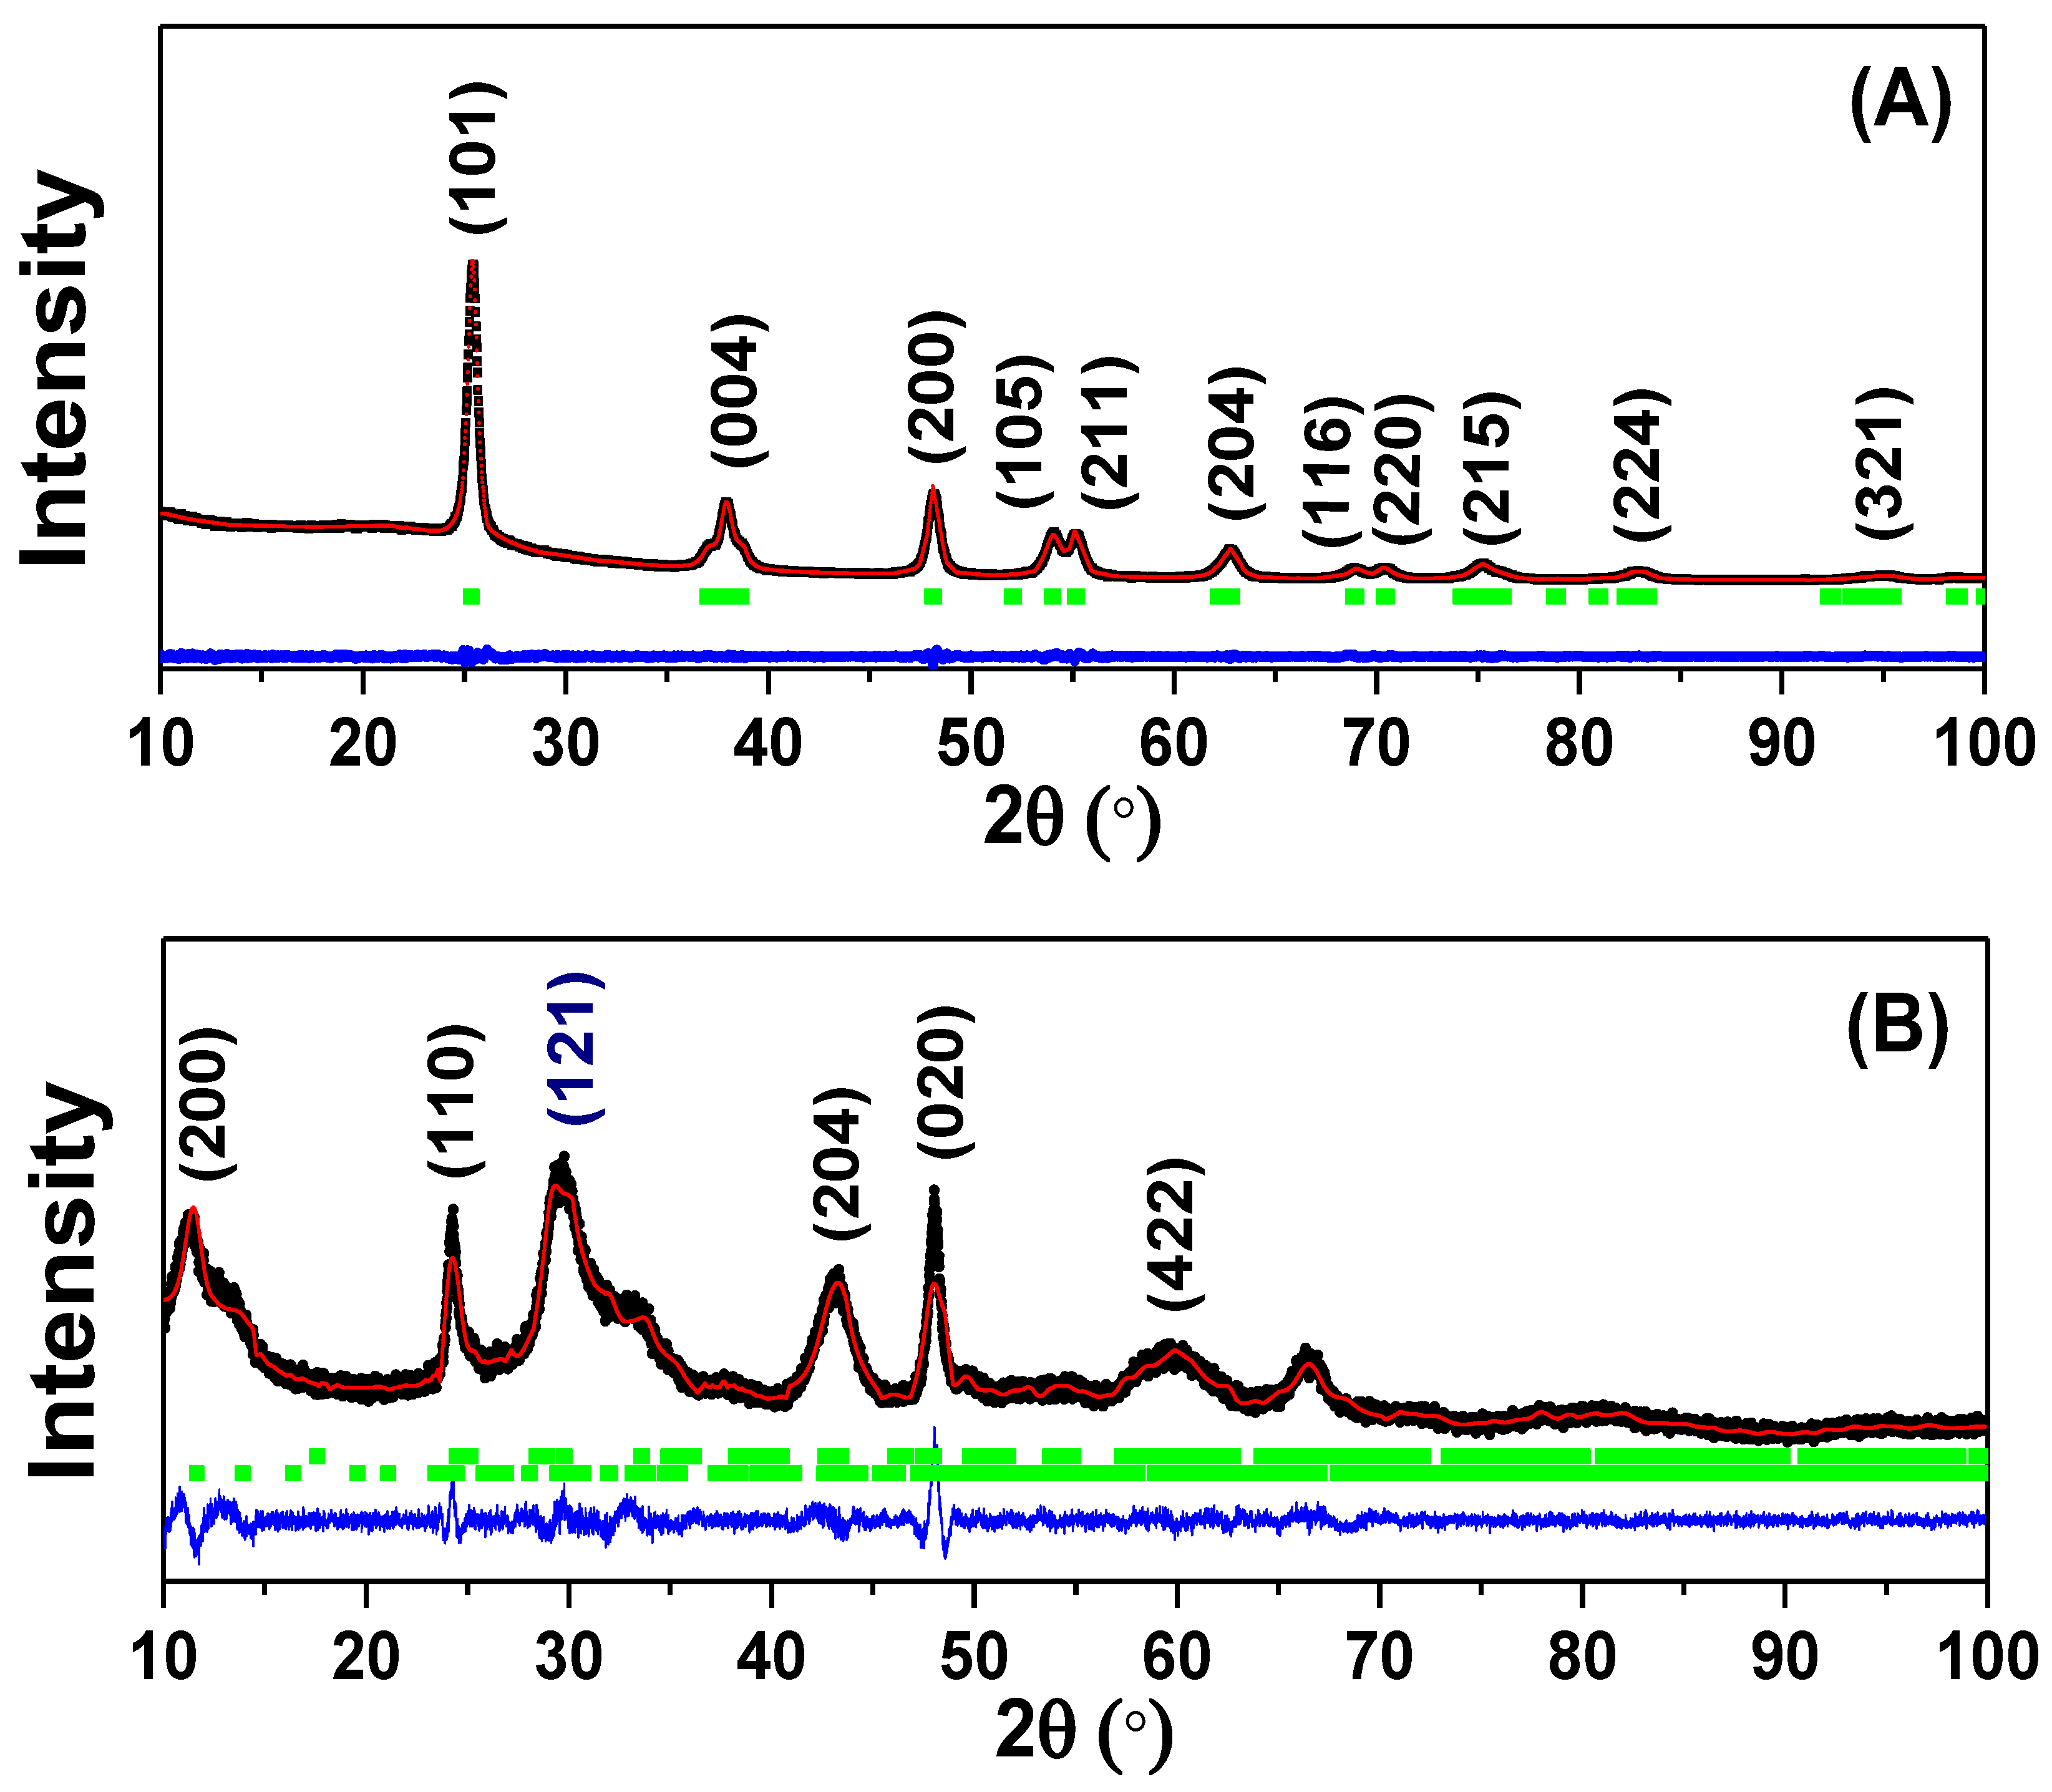
3.1. Rietveld Refinement Analysis

Refined X-ray diffractograms are presented in Figure 1 for TiO2 NPs (A) and TiO2 NWs (B). The refined X-ray diffractogram of commercial TiO2 NPs, Figure 1A, consists of the reported polymorph phase of TiO2, anatase, synthesized by sol-gel method assisted with heat treatment [24]. The corresponding Bragg’s angle positions for crystalline identified phases are given in Table S1.
In the X-ray diffractogram of Figure 1B, two crystalline contributions were observed for TiO2 NWs, the crystalline phase percentage of the main crystalline phase (Protonic Trititanate, 63.5%) is higher than the secondary identified crystalline phase (Brookite, 36.5%). On the other hand, as was explained in [25], the second crystalline phase is a product of the ion exchange that occurs in sodium trititanate, wherein the sodium is eliminated at a temperature of 120 °C, leaving the protonic trititanate available. Their respective Miller’s indices and Bragg’s angles were found at: (200) at 11.6°, (110) at 24°, and (020) at 48° [25]. These Bragg’s angles, according to [25], appear when the calcination temperature is lower than 350 °C. However, when the temperature is higher than 550 °C, the Bragg’s angle at 11.6° completely disappears. The disappearance of Bragg’s peak (200) is attributed to dehydration caused by the increase in temperature [26]. In this case, a Bragg’s peak with Miller index (211) appears at 43.9°. Despite the fact that the synthesis method in [26] was also hydrothermal, the two employed precursors of titanium dioxide (rutile and anatase) together with a solution of sodium hydroxide (NaOH) [26] were different and we can discard the idea of high temperature synthesis due to the lack of this (211) Miller index. Hence, the temperature for hydrothermal synthesis of the TiO2 NWs was less than 350 °C. Moreover, the detail indexation of brookite phase is give in Table S2.

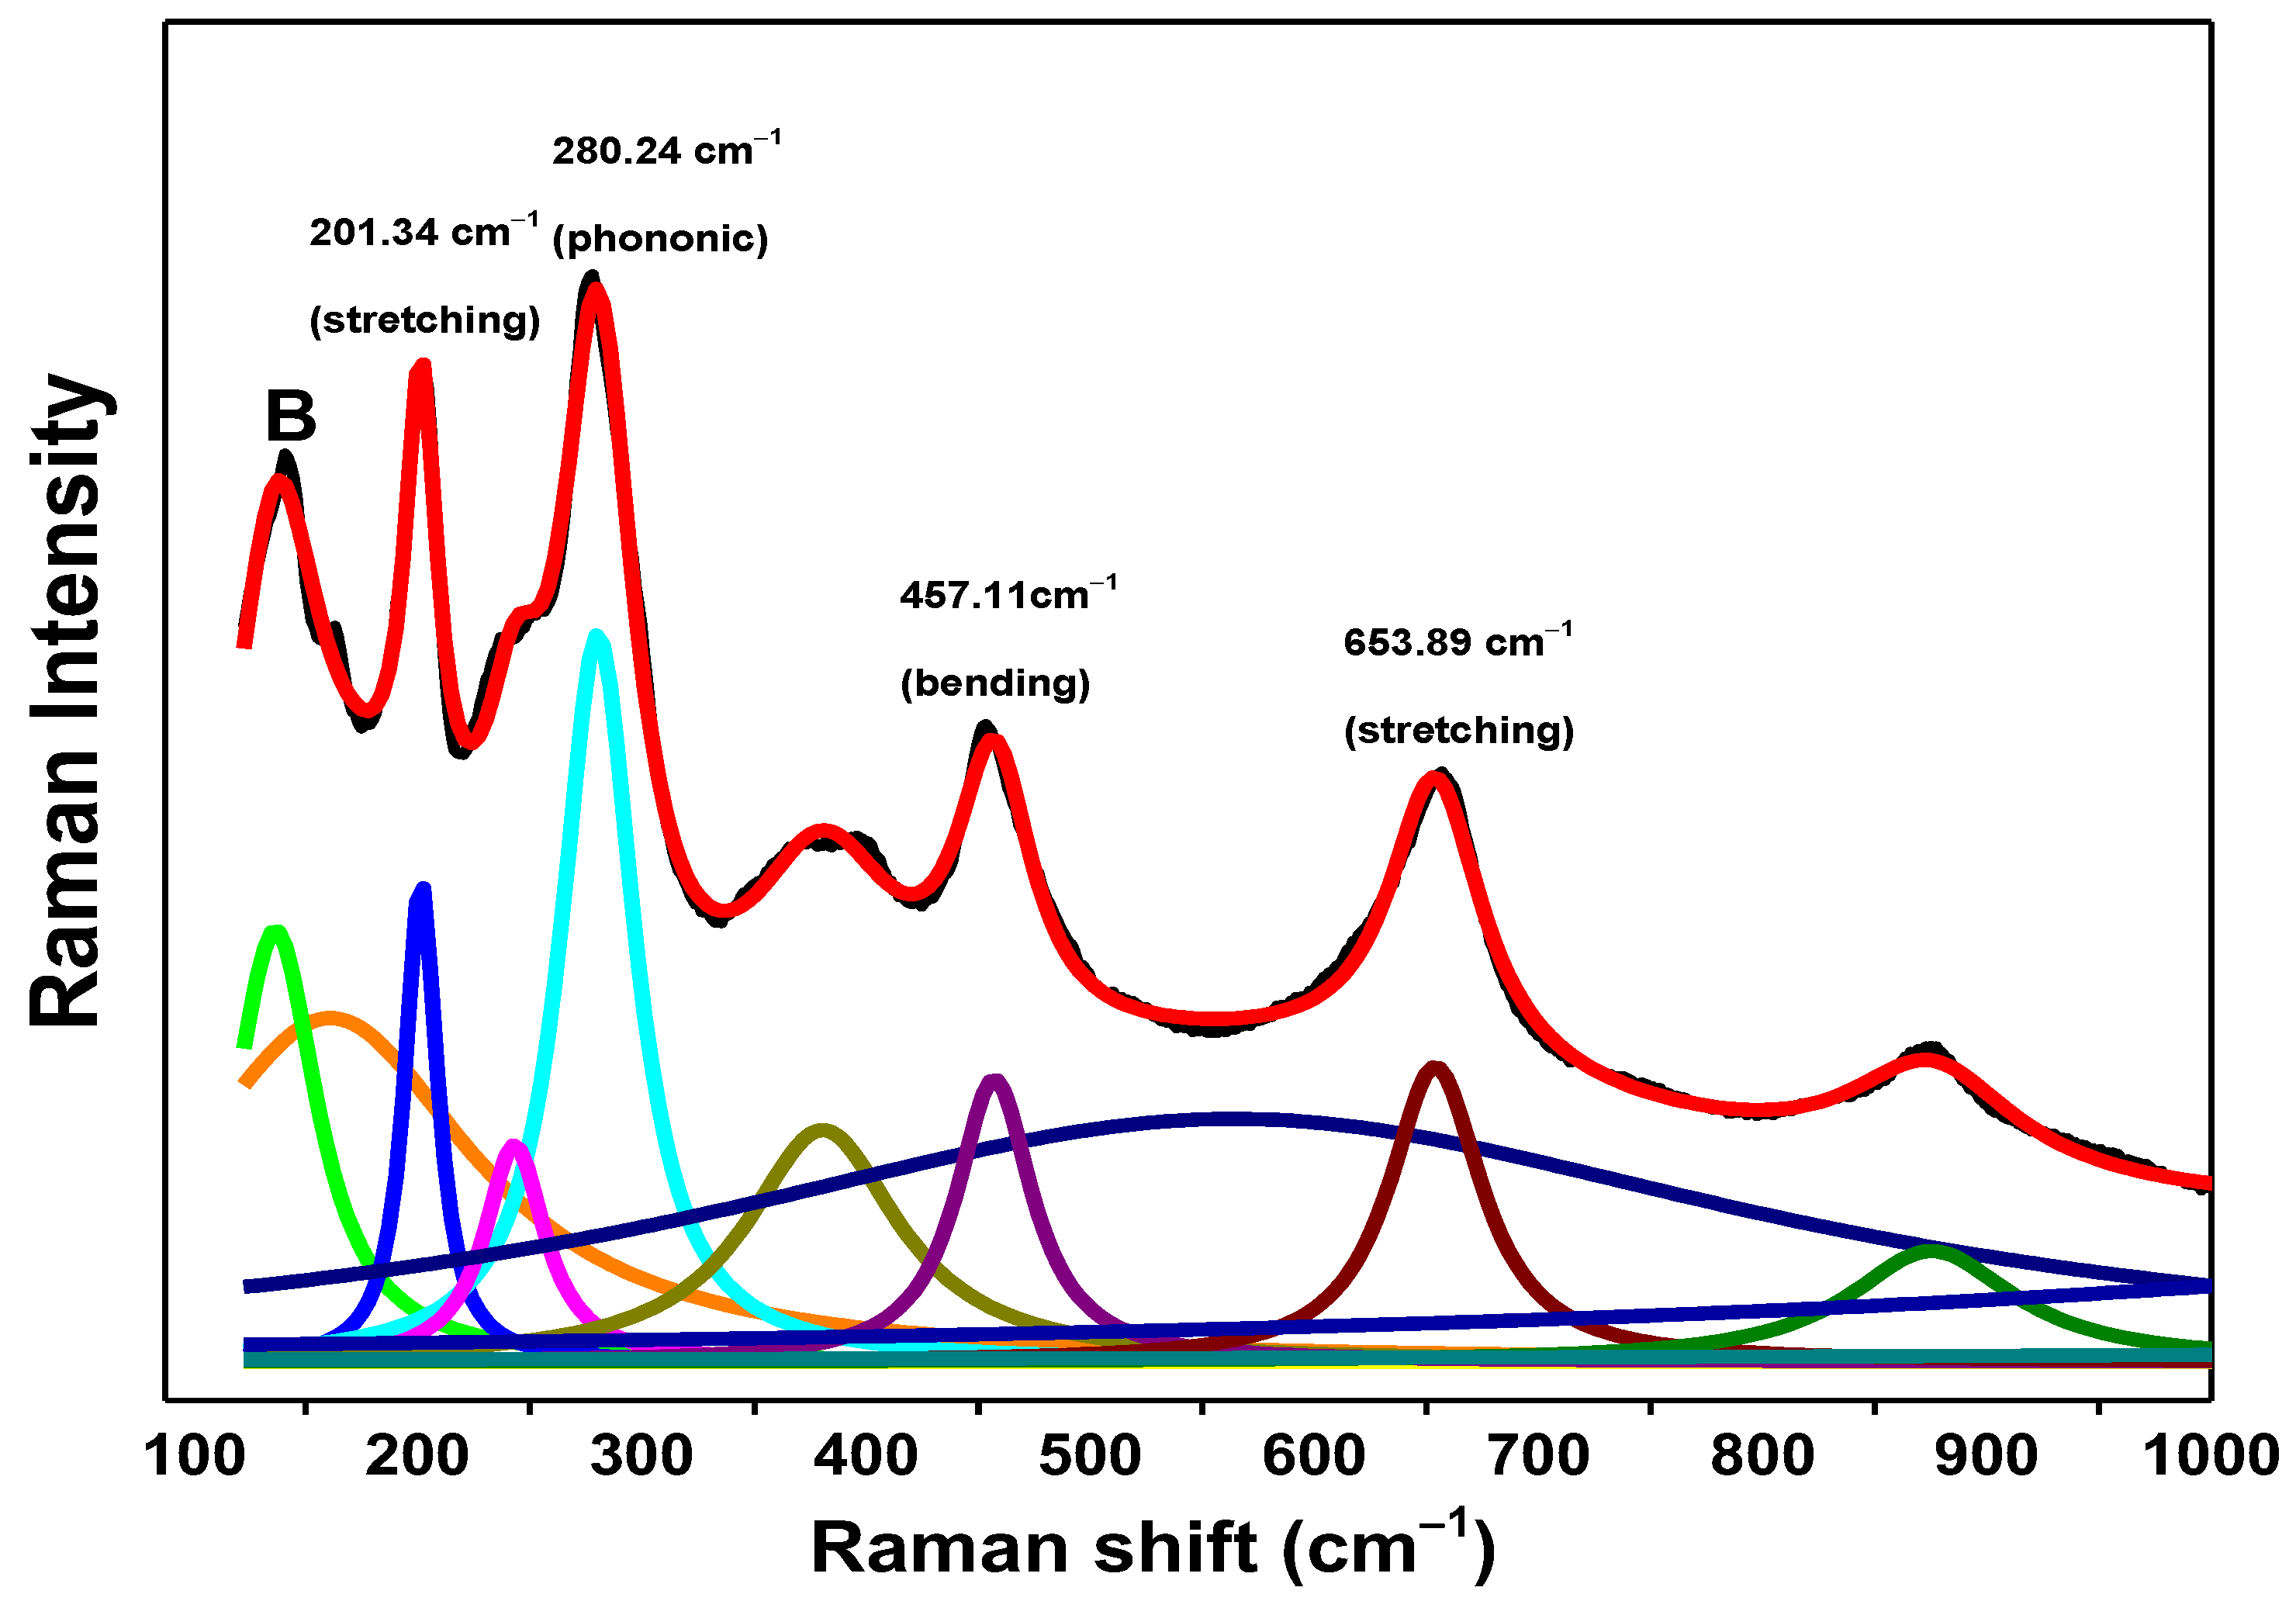
3.2. µ-Raman Analysis

µ-Raman spectrum for commercial TiO2 NPs has been previously characterized in [20]. To identify the vibrational Raman bands for the TiO2 NWs sample in Figure 2, a nonlinear regression was performed by means of a finite sum of Lorentzian functions. The reason the Lorentzian was taken as the profile function is because it better approximates the physical process in which inelastic light scattering intervenes [27].
Reviewing the corresponding literature, some Raman peaks or vibrational bands of the Raman curve of the TiO2 NWs sample were identified and are summarized in Table 1 [28,29,30].
The pure brookite phase presents between four and five characteristic vibrational Raman bands [31,32]. The strong optical signal for brookite is positioned at ~150 cm 1 and no other peaks were found. This is because brookite is a secondary phase and major chemical compositions are detected for the H2Ti3O7, which agrees with Rietveld quantitative analysis. It is worth mentioning that that the phonon mode located at 280 cm 1 is a characteristic vibrational band of trititanate nanotube geometries [33].

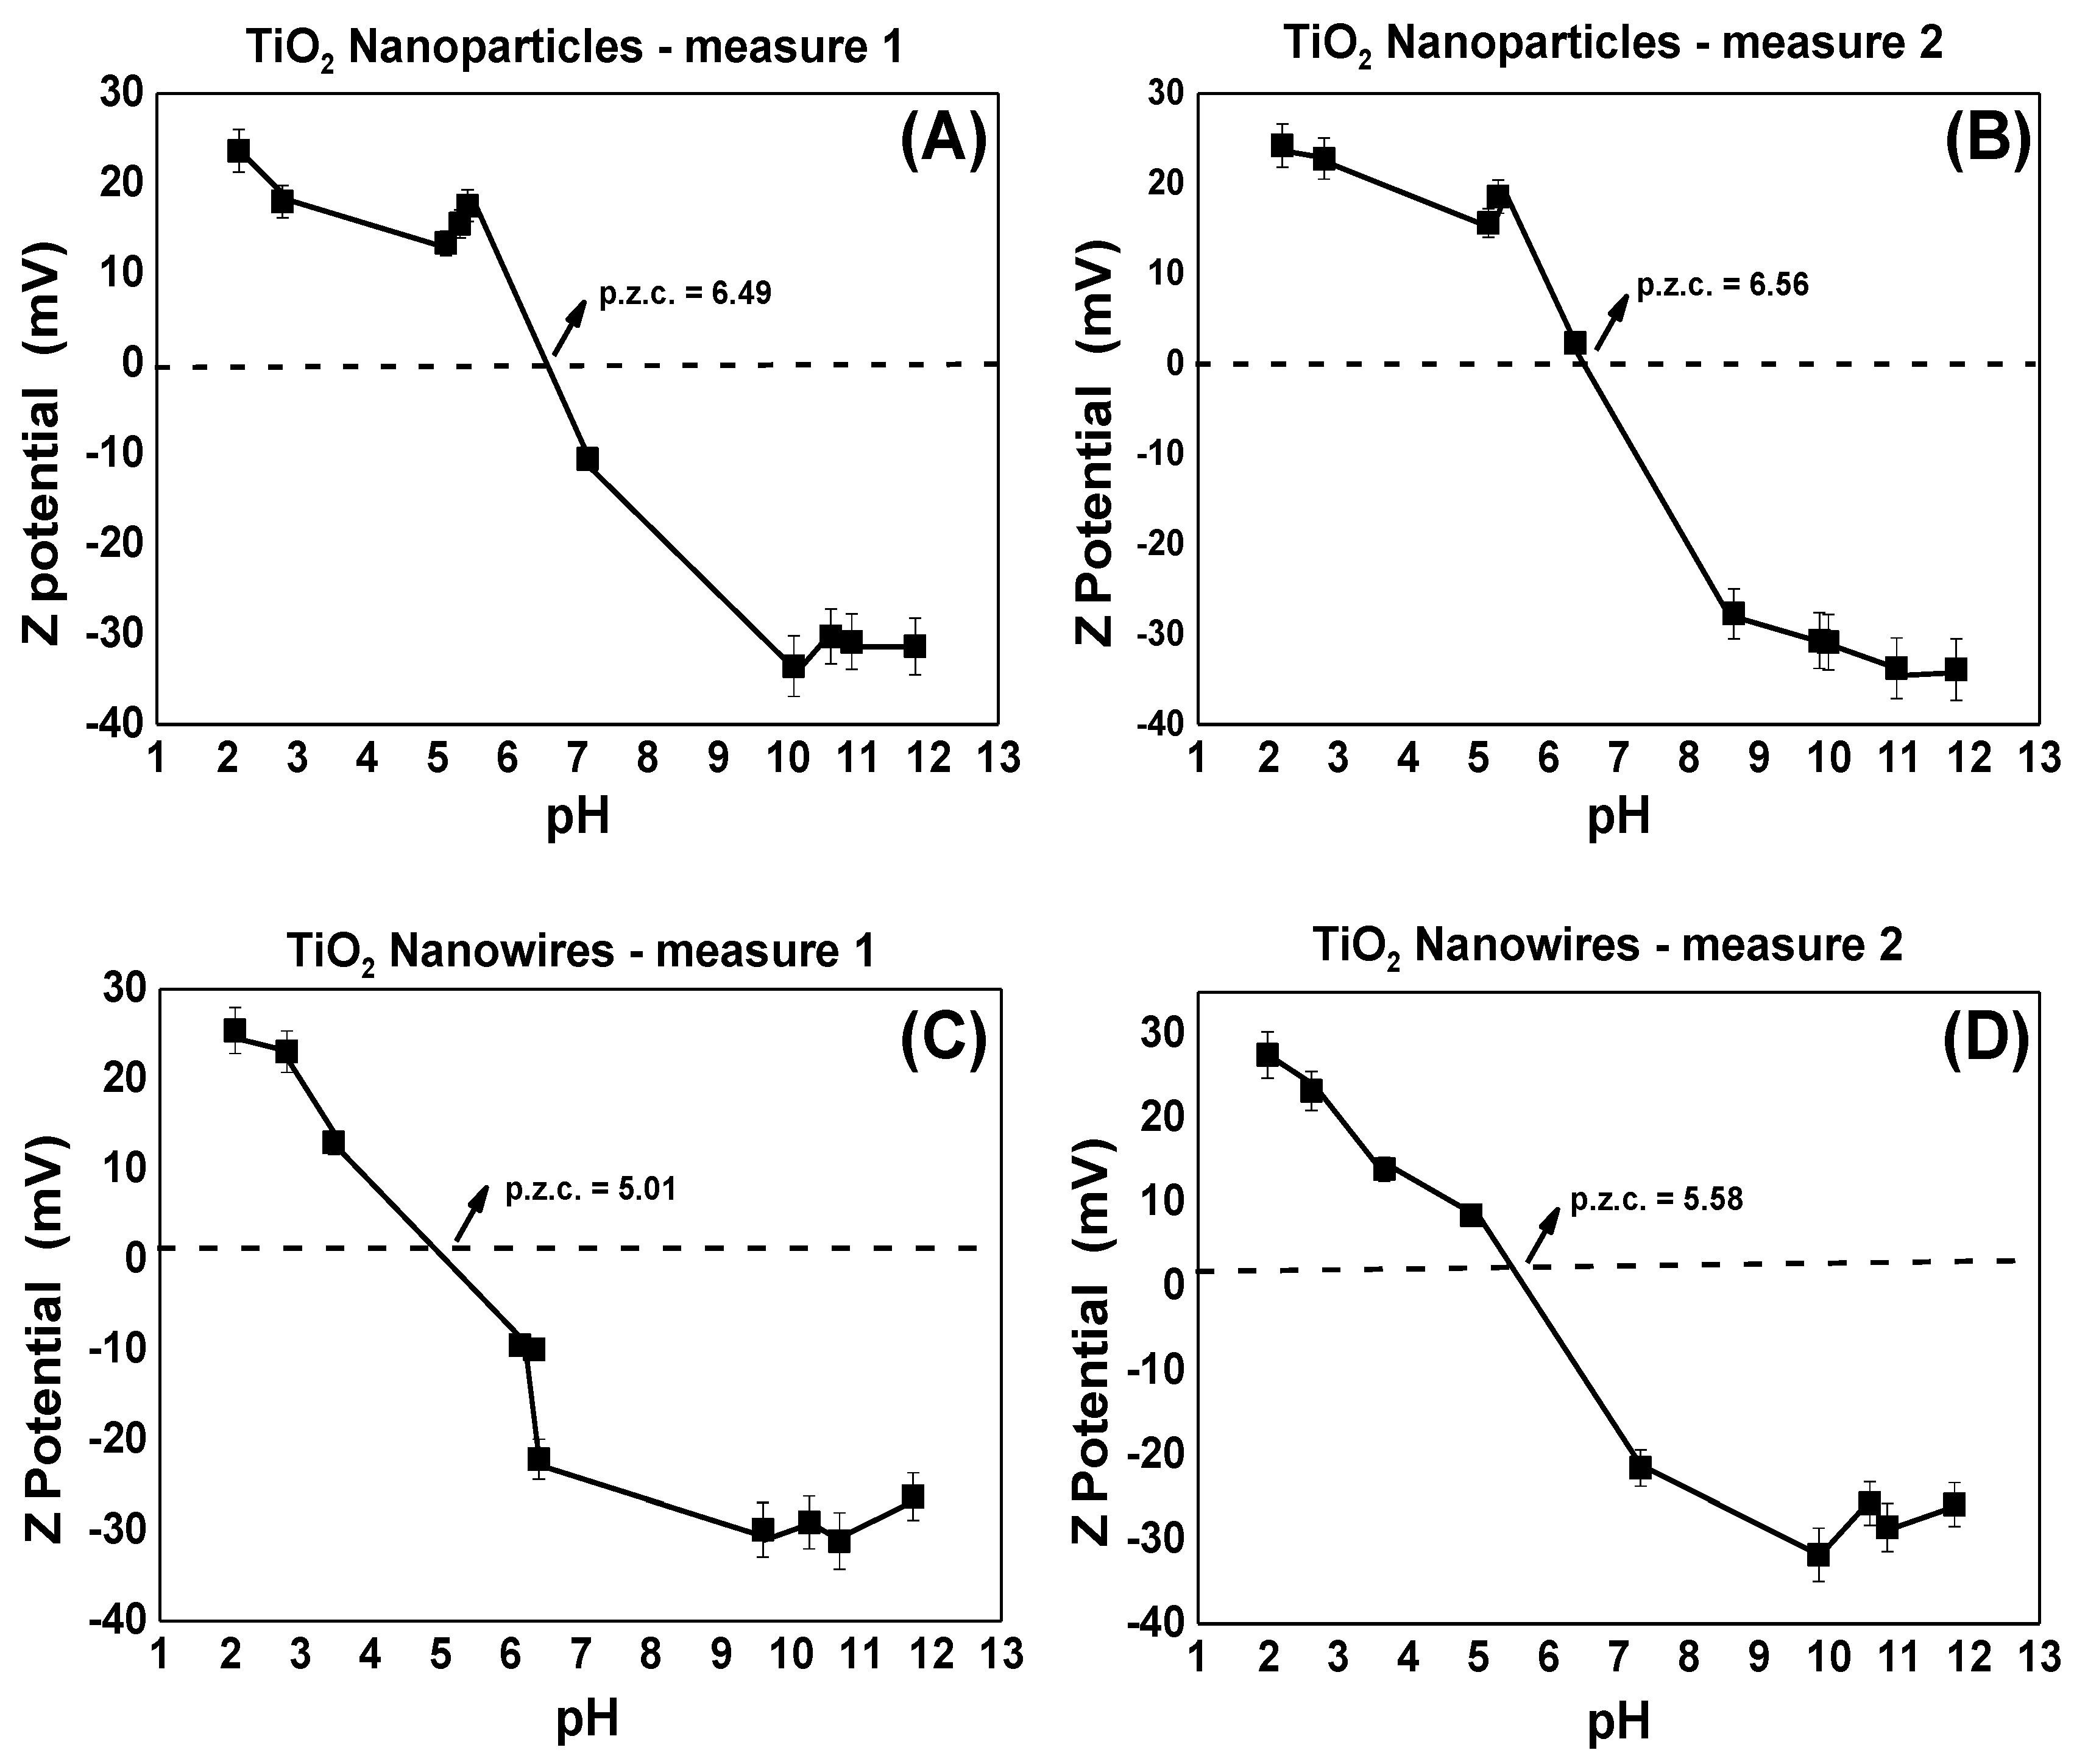
3.3. DLS Technique and Point of Zero Charge (p.z.c.) Determination
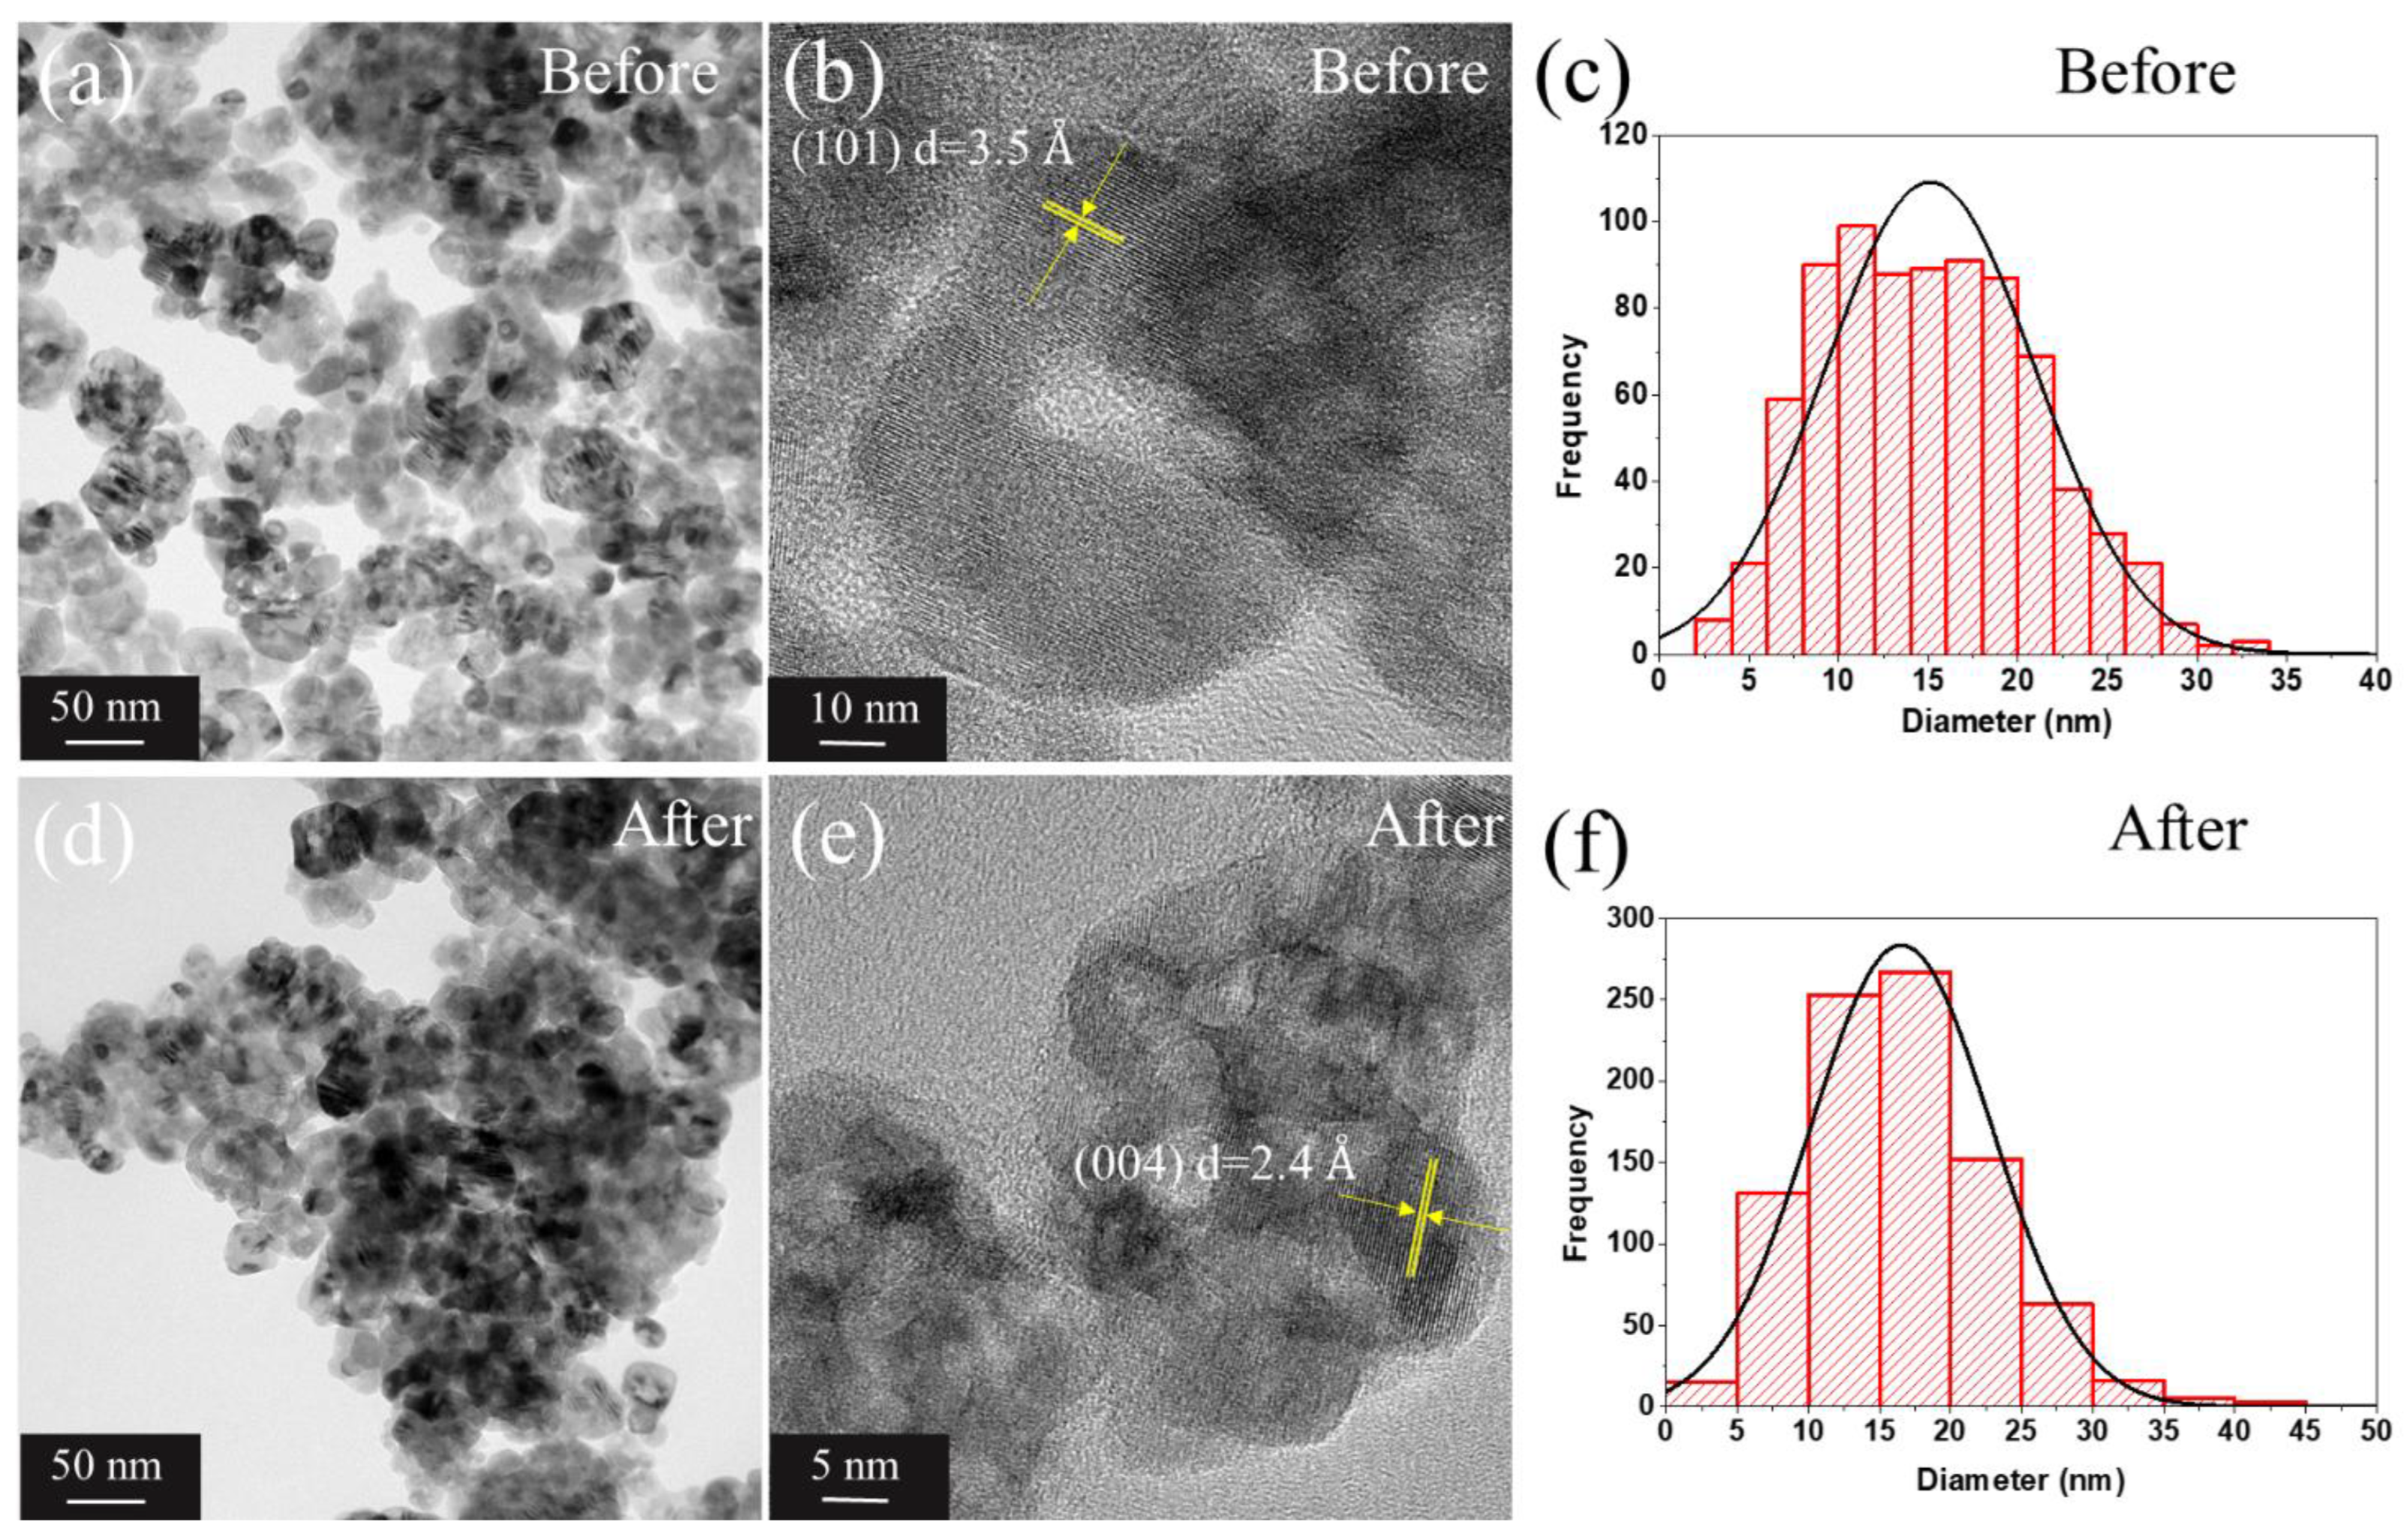
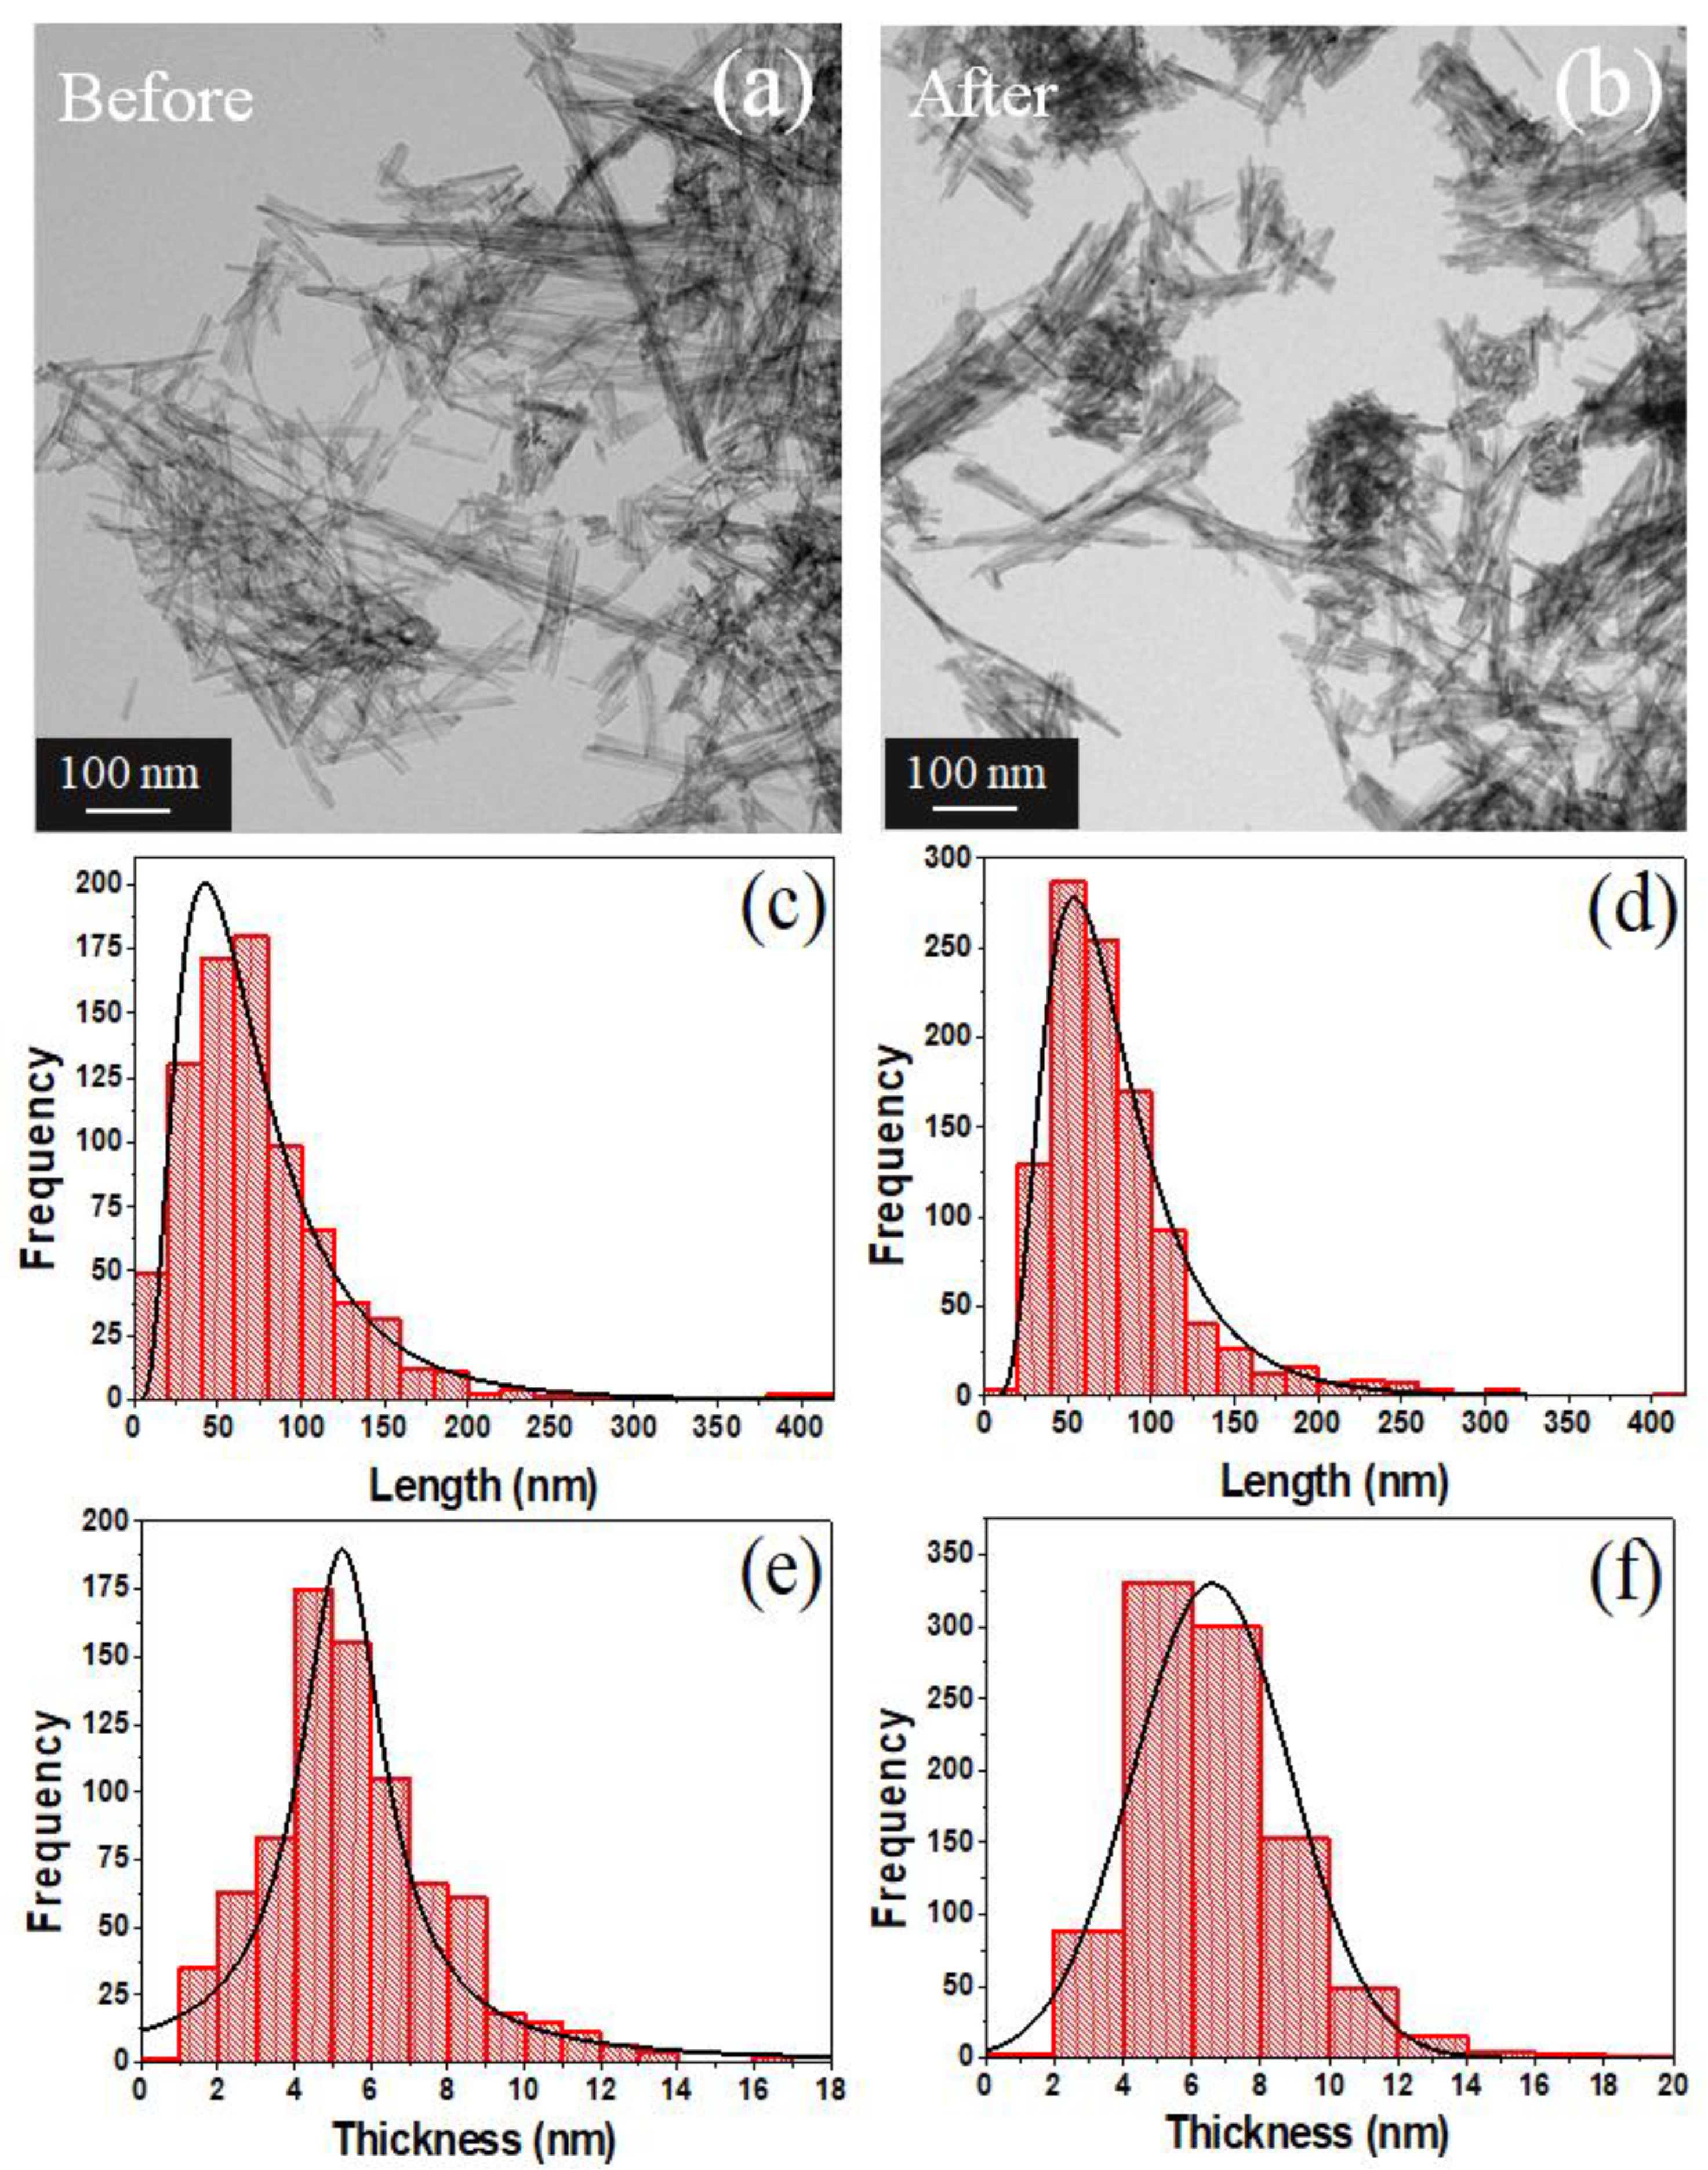
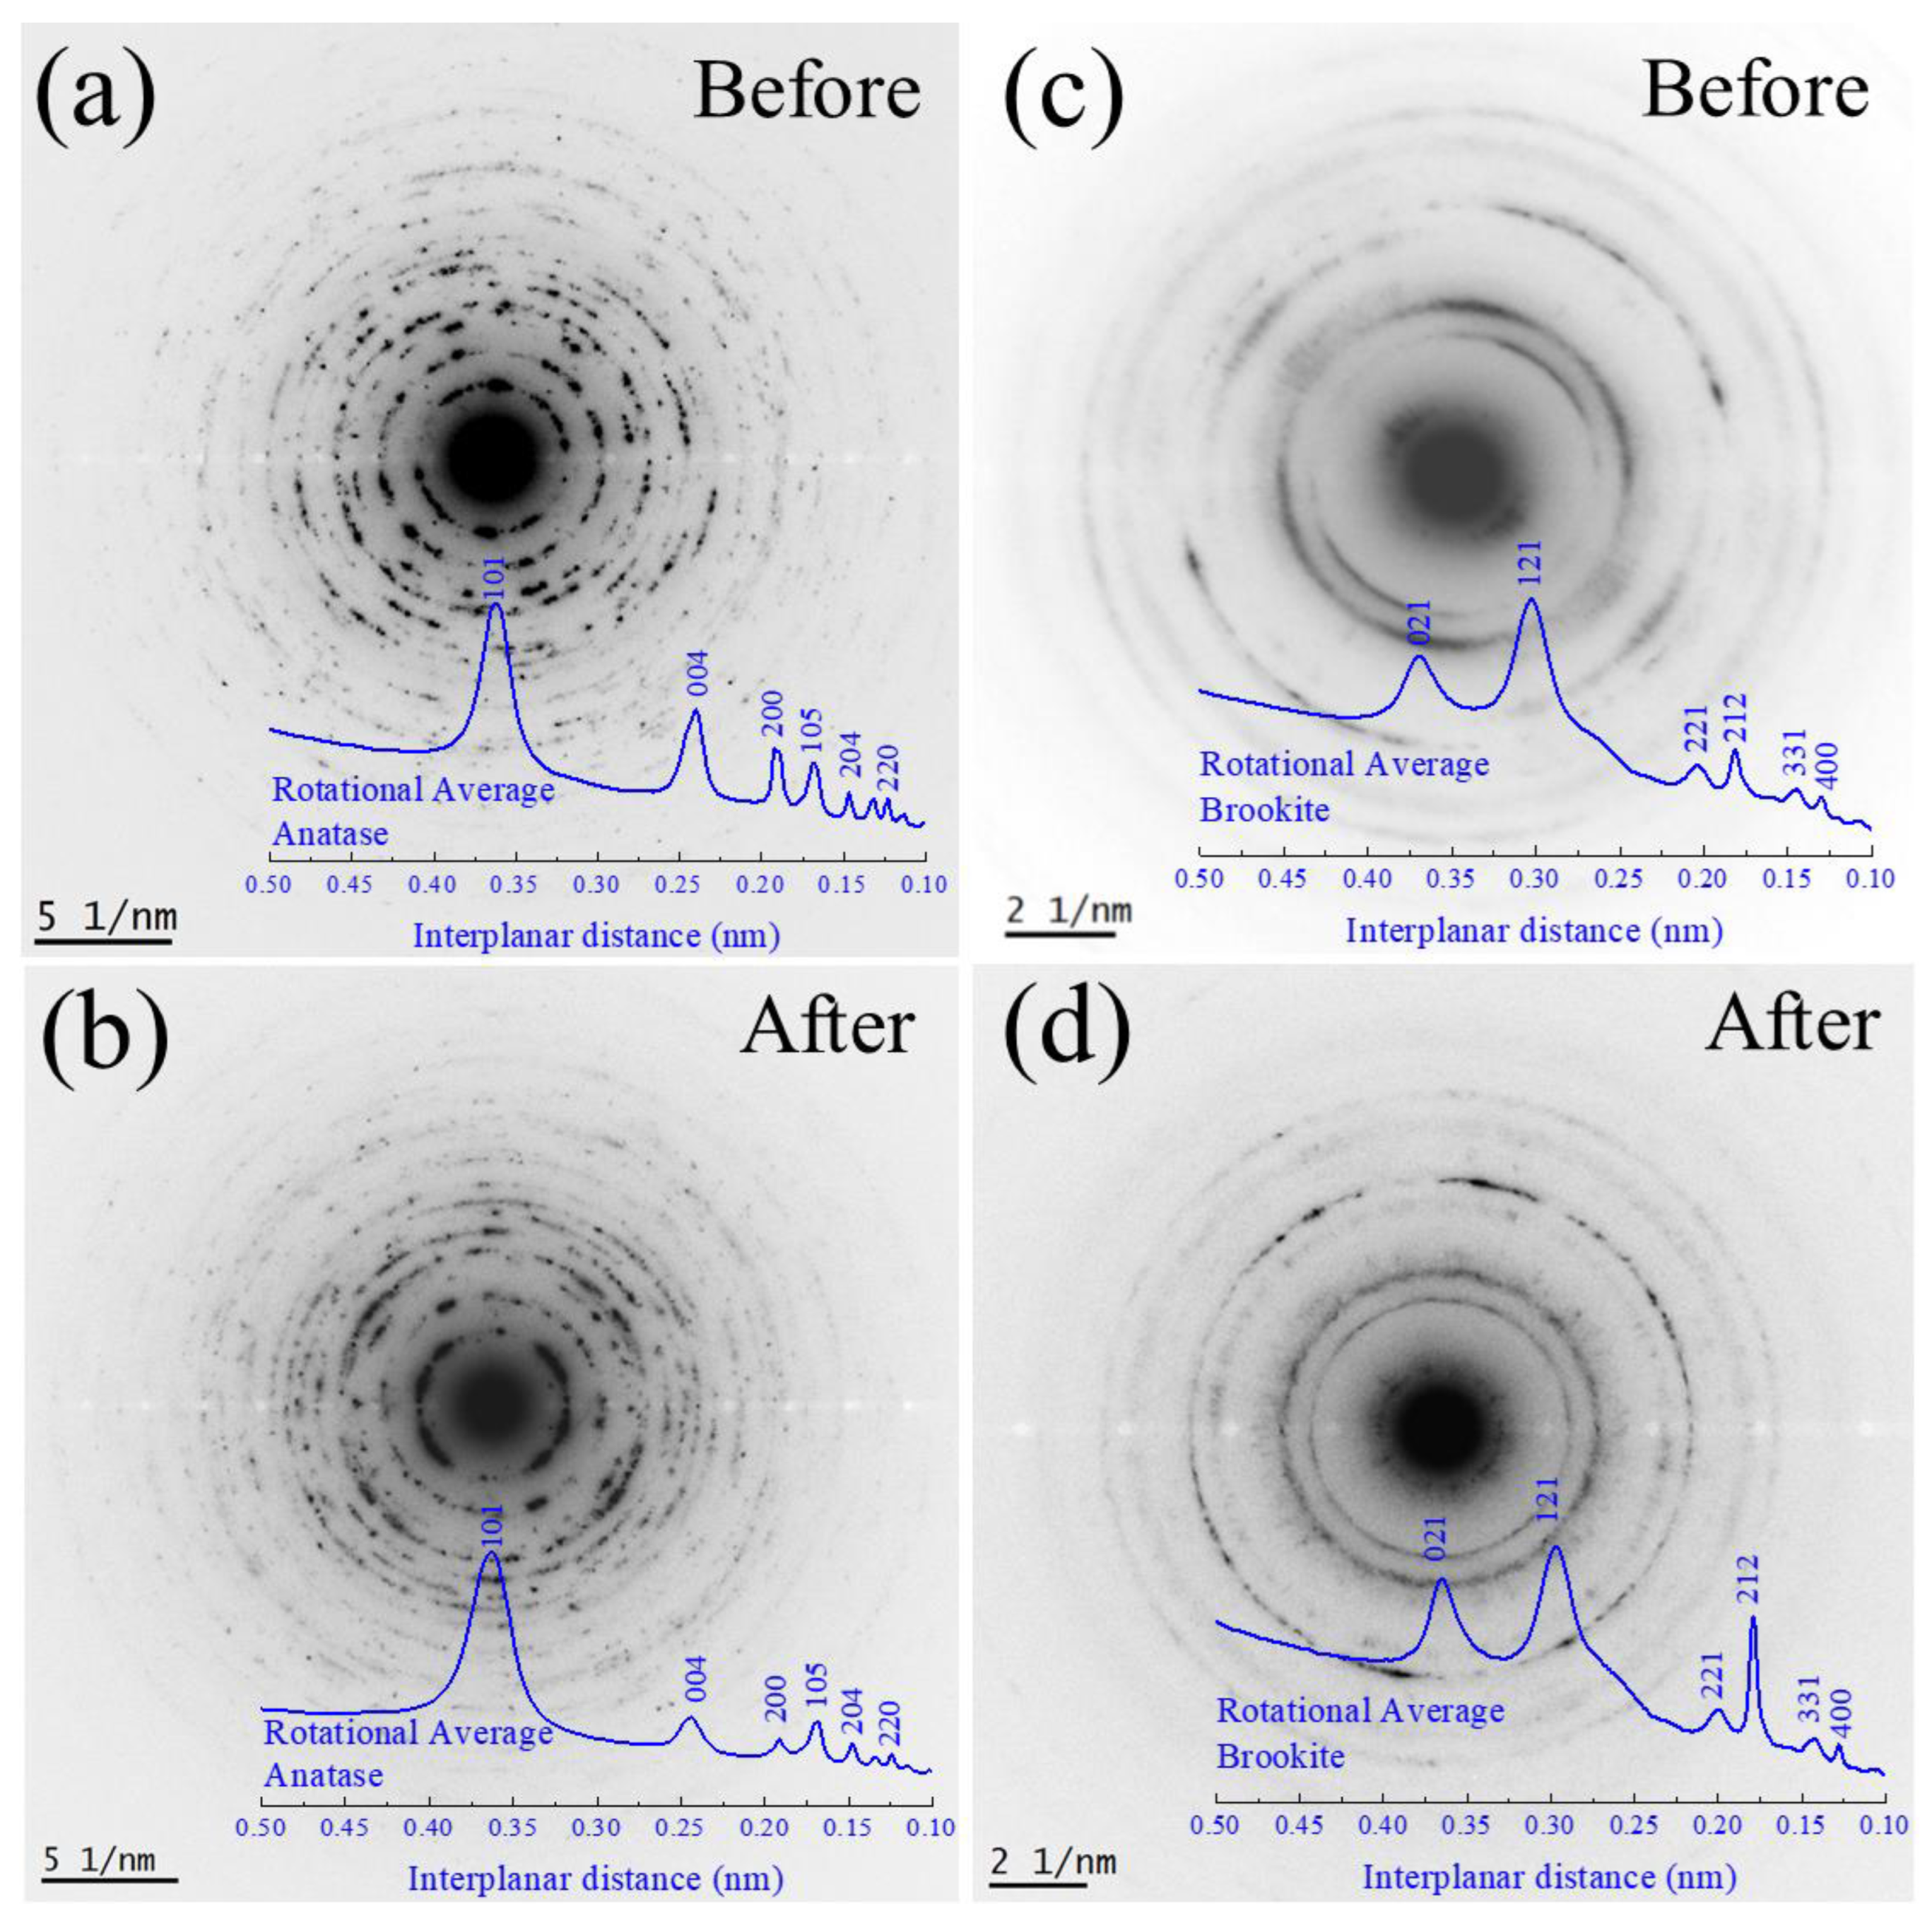
The effective hydrodynamic diameter (EHD) of the TiO2 NPs sample was determined using the DLS technique, in which the pH value of the TiO2 sample was varied to obtain different values of this EHD. In Figure S1, one can see the EHD for five corresponding pH values. Since TiO2 NWs do not have a spherical geometry, the Stokes–Einstein equation cannot, in principle, be applied, since it is valid for spherical particles only [34]. However, since they are in a fluid, they tend to agglomerate with other nanowires until they form a quasi-spherically symmetrical particle that agree with the DLS principle. The EHD measured at a pH equal to 7 of the TiO2 NWs was 118 nm with a base line index of 10.
The p.z.c. is the pH value corresponding to a null zeta potential value [35], or also understood as an electrical surface potential equal to zero (shear plane model). At lower pH values (below p.z.c.) it is positively charged, while at higher pH (above p.z.c.) it is negatively charged [35]. As reported by Calle et al. the p.z.c. of TiO2 (anatase 70% and rutile 30%) was found to be 6.5, whilst doped TiO2 samples have a low p.z.c. [36]. This value of 6.5 is equal to that found with our titration experiment, see Figure 3A,B, also 6.5, for anatase TiO2 NPs. However, for compounds that have impurities, the p.z.c. is less than 6.5. This may be the reason that the mean p.z.c. for the TiO2 NWs sample is 5.3, see Figure 3C,D, since it is a biphasic sample (brookite and protonic trititanate).

3.4. TEM Analysis

Figure 4a,b,d,e and Figure 5a,b show the TEM images, while Figure 4c,f and Figure 5c–f their respective particle size distribution (PSD) histograms for TiO2 NPs and TiO2 NWs, the obtained statistical parameters after fitting with a normal and log-normal distribution are listed in Table 2. This was achieved with the aim of comparing with the manufacturer’s measurements (Sigma-Aldrich) that reported 20 nm for mean particle size, in case of TiO2 NPs, and 10 nm (thickness)/10 µm(length) for TiO2 NWs. For the case of TiO2 NPs, the difference between before (15.1 nm) and after (16.5 nm) did not show a noticeable difference with respect to the agglomeration of TiO2 NPs, this was also notice in the interplanar distance of 3.5 Å for (101) and 2.4 Å for (004) planes, in agreement with Rietveld refinement, cif files in Section 2.2, and supporting information in Tables S1 and S3. However, some morphological changes to the measurements reported by the manufacturer were found in the thickness and length parameters (before exposure) for TiO2 NWs. The estimated thickness was less than 10 nm and the mean length value was 74.6 nm. These values remain close after performing the ecotoxicological experiments. The small value for the reported length can be related to the small temperature used for the synthesis (<350 °C), as discussed in Section 3.1. It is worth mentioning the importance of performing a rigorous characterization to correctly determine the LC50 and morphological D. magna changes, as we will discuss in the following sections.

3.5. Acute Toxicity of TiO2 in D. magna

Over the course of 24 h, D. magna neonates were exposed to five different concentrations of TiO2 NPs and NWs. 0% of mortality was found for 75 mg L−1 (TiO2 NPs) and 800 mg L−1 (TiO2 NWs). The surviving daphnias were assessed for an additional 15 days in a beaker with conditions before exposure in a volume of 200 mL of daphnia water to determine what toxic effects they may have encountered (morphological and reproduction rate experiments).

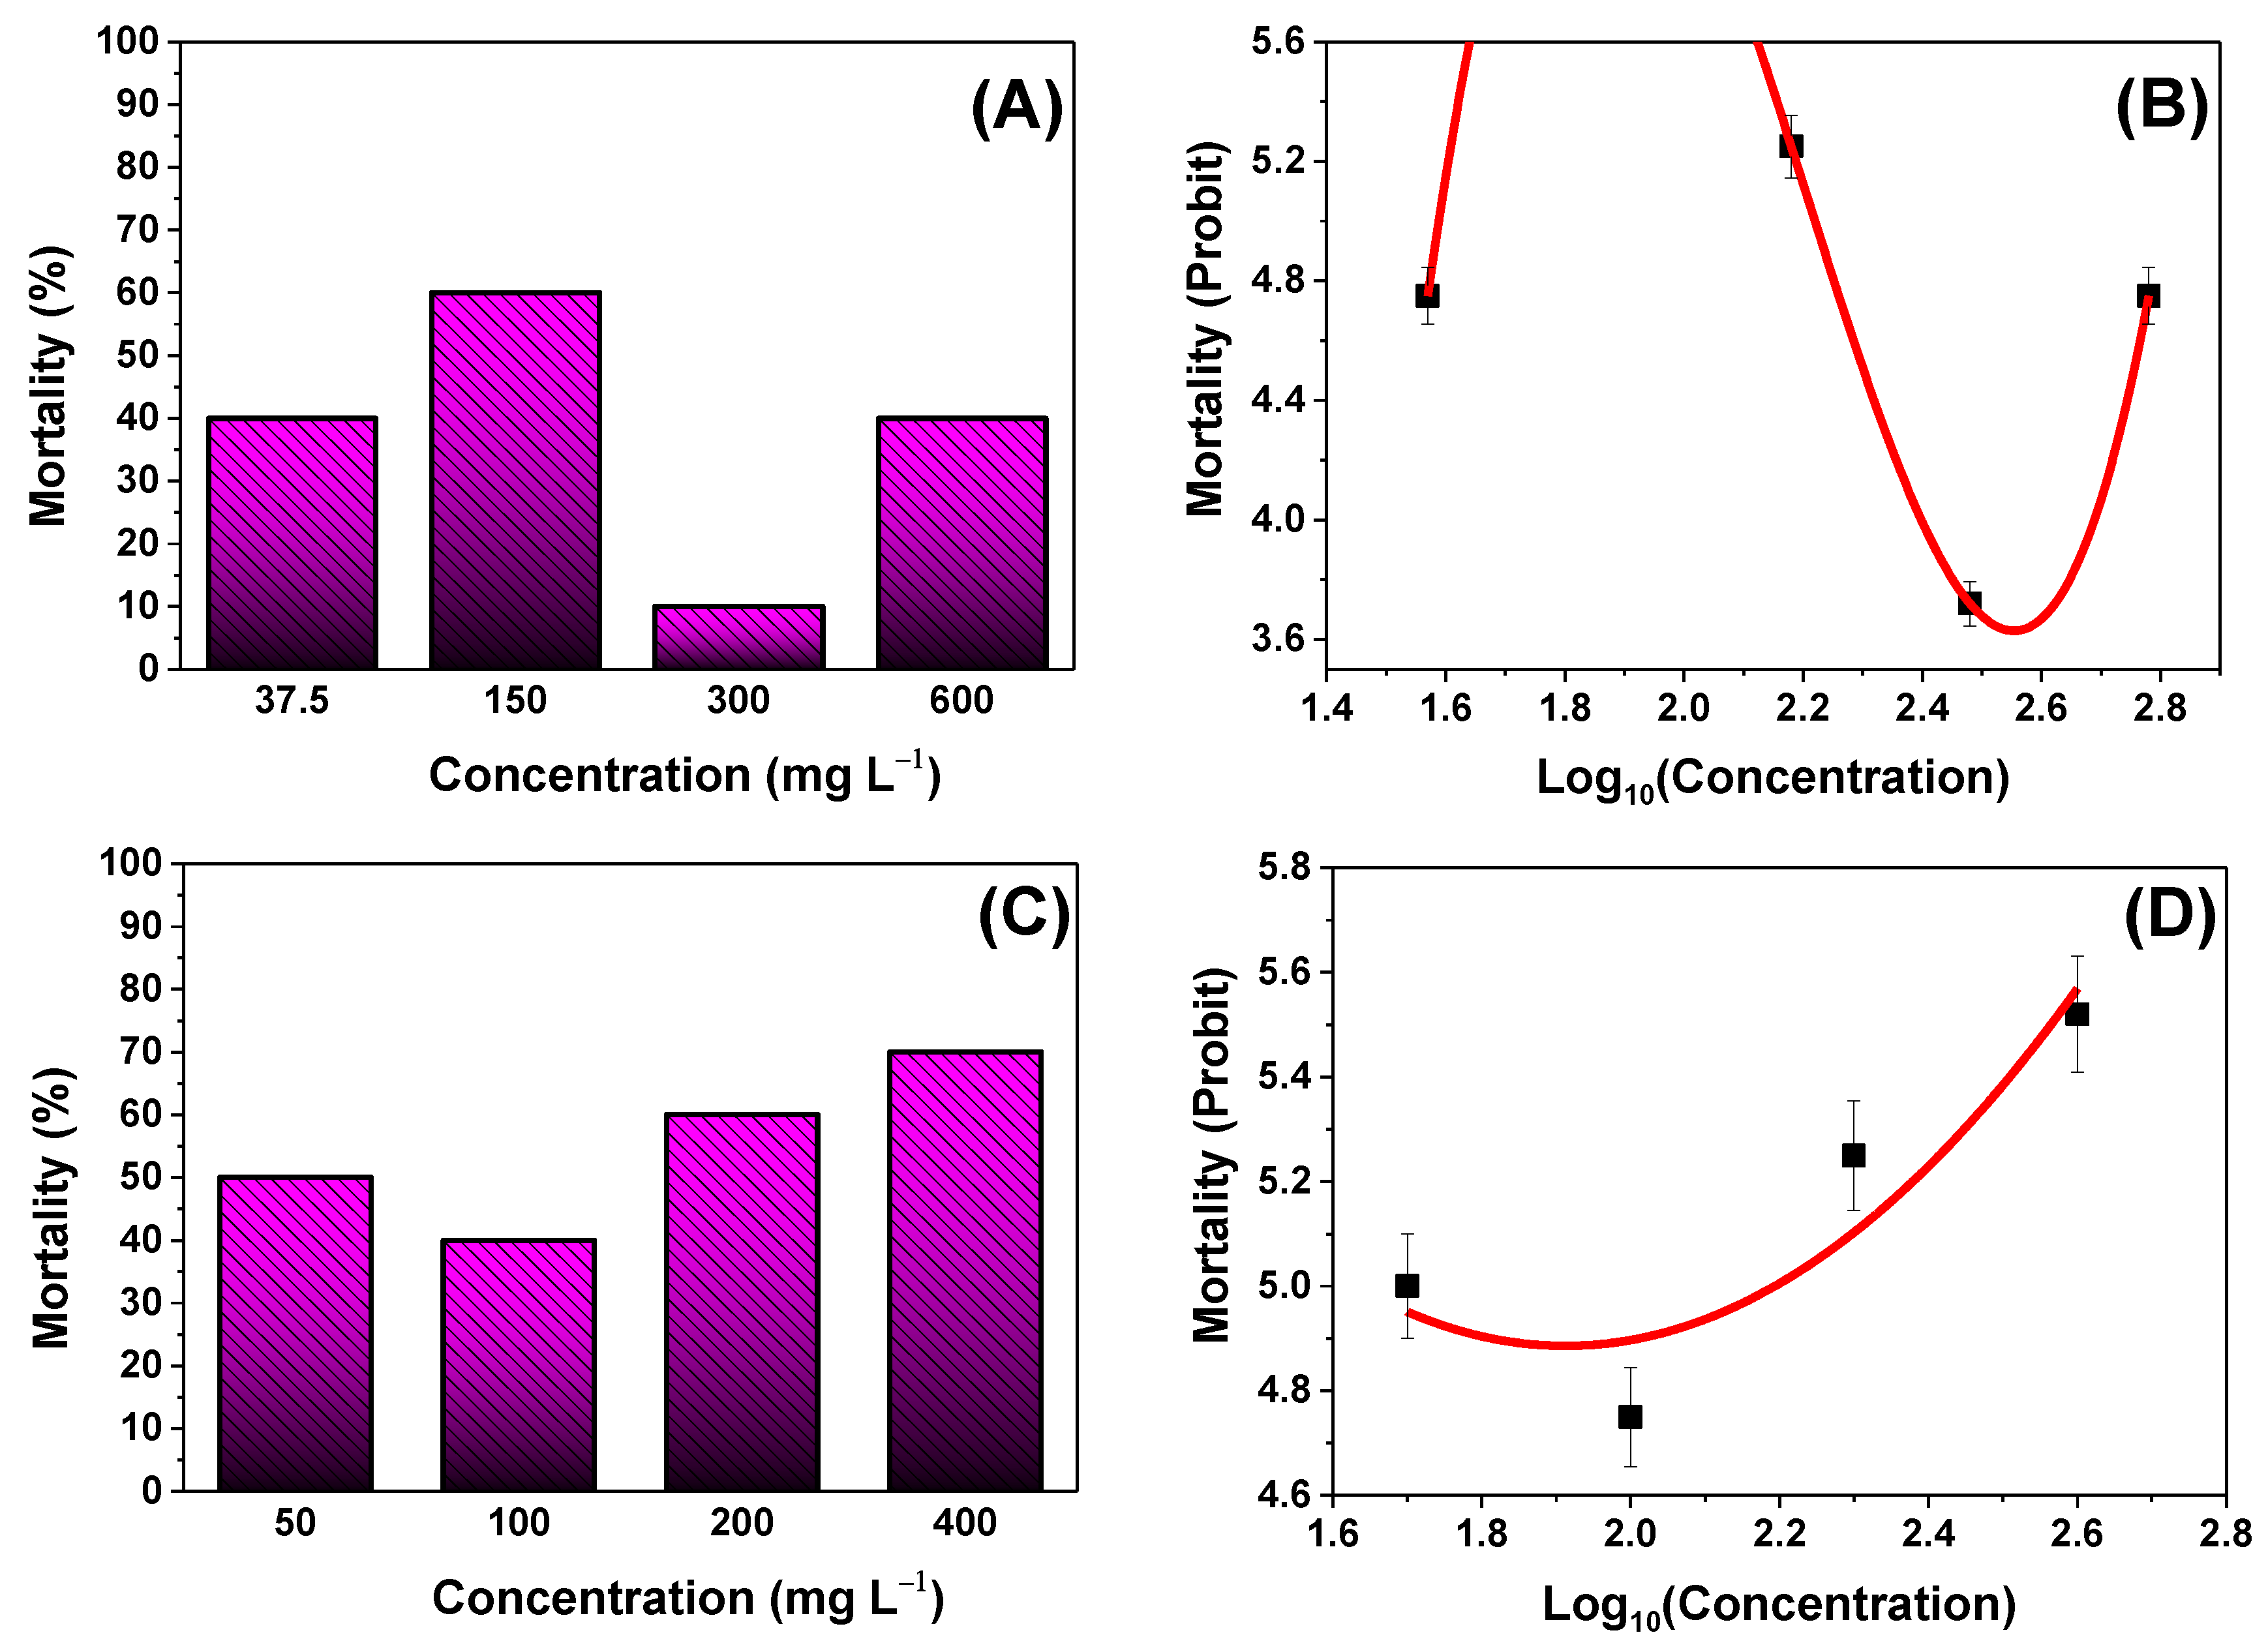
3.5.1. Lethal Concentration 24-h LC50

As previously mentioned, 10 neonates of D. magna for concentration were used for 24-h LC50 determination. Modified Probit analysis was used to calculate the 24-h LC50 for TiO2 samples. Figure 6A,C show mortality (%) as a function of concentration (mg L−1) for both TiO2 samples.
In Figure 6B, a cubic regression was performed on the experimental data. The non-linear regression has a goodness of fit of 1.0 and has the following equation:
Y = 17.13   X 3 113.22   X 2 + 243.15   X 164.2
In this case, substituting the value of 5.0, which is the probit value of 50% mortality, into Equation (1) gave us two points of intersection, two values (positive and negative) for the LC50. These points lie at the probit numerical values of 1.58 and 2.22. Therefore, the positive value that lies in the LC50 range of various previous investigations [8,9,10,37,38] for TiO2 NPs was chosen. Hence, the concentration at which the LC50 occurs was 166 mg L 1 .
In Figure 6D, a quadratic regression was performed on the experimental data. The non-linear regression has an R2 = of 0.859 and has the following equation:
Y = 1.430   X 2 5.445   X + 10.062
The LC50 for the TiO2 NWs sample was calculated, replacing probit value of 5.0 in Equation (2), we obtained the LC50 of 157 mg L 1 .
LC50 of TiO2 nanosystems have been shown to be dependent of structure, morphology, sample preparation method, size, specific surface area, and exposure time [8,9,10,37,38].
According to Murali et al. [9], our reported LC50 values are within the range of the other compared assays of TiO2 NPs in D. magna, this range was reported to be between 118 mg L 1 and 218.79 mg L 1 . Table 3 lists the LC50 values for some TiO2 nanosystems found in the literature. Similarly, Johari and Ashagari have reported that the LC50 was greater than 200 mg L−1 [10]. However, only poor references considered the importance of the EHD when comparing the LC50. The values reported by Murali et al. [9] and Gökçe et al. [37] referenced only the mean particle size, but direct exposition occurred with suspended NPs, indicating that mean hydrodynamic size needs to be determined. In our case, we used short exposure times of 24 h because of the fast response of TiO2 nanosystems to the adsorption of heavy metals, as, for example, in [16,39]. Hence, the 24-h LC50 gave us insights into the concentration limits for quick water treatment and short exposure time for the D. magna individuals under the tested concentrations.
More importantly, the LC50 determination was observed to depend on the solution preparation method. When the method of stock solution preparation is the same, that is, by sonication [10], it was possible to determine LC50 values. However, the studied particle sizes are much larger. A notable difference is found in [8], in which the LC50 could not be found by sonication, having applied concentrations of up to 500 mg L−1 and using a nanoparticle size greater than 100 nm. However, when the solution was prepared by filtration [8], the LC50 was found to be 5.5 mg L−1 at a very low concentration, using the average NPs size of 30 nm. Hence, solubility of TiO2 NPs is an important parameter for the accurate determination of LC50 values. In our case, the zeta potential values of TiO2 nanosystems are both ~−20 mV at pH = 7, indicating high colloidal stability.

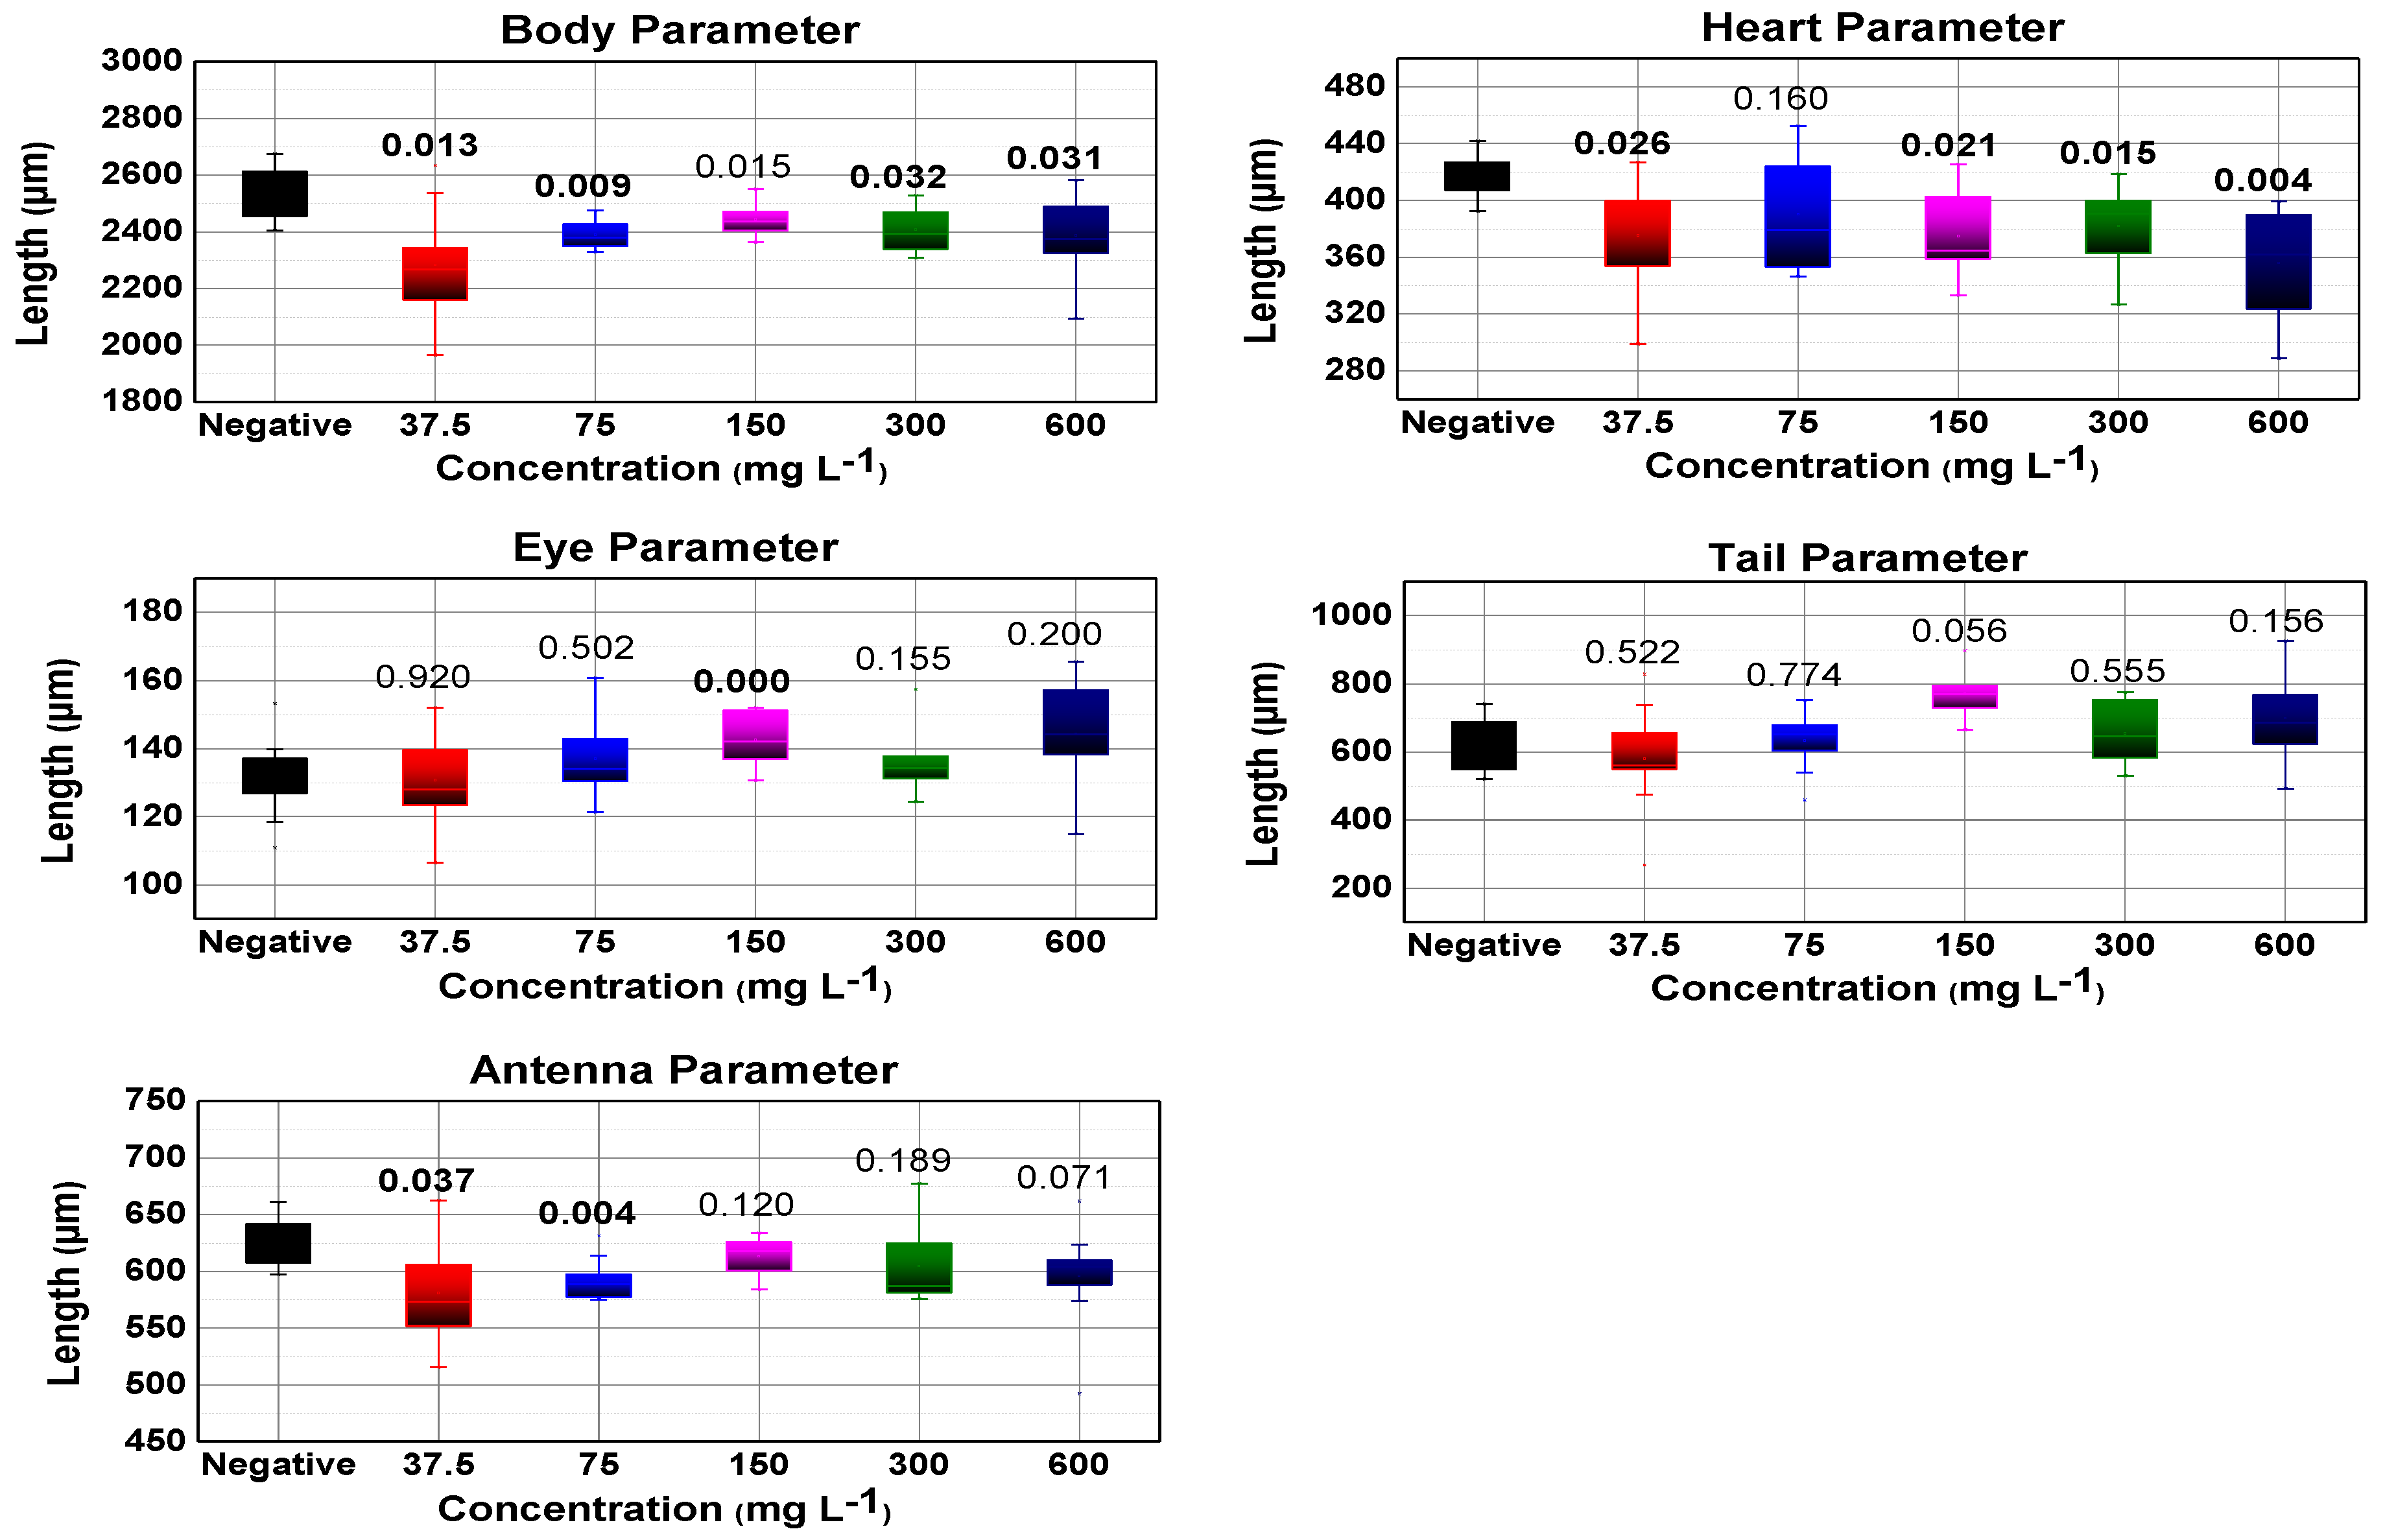
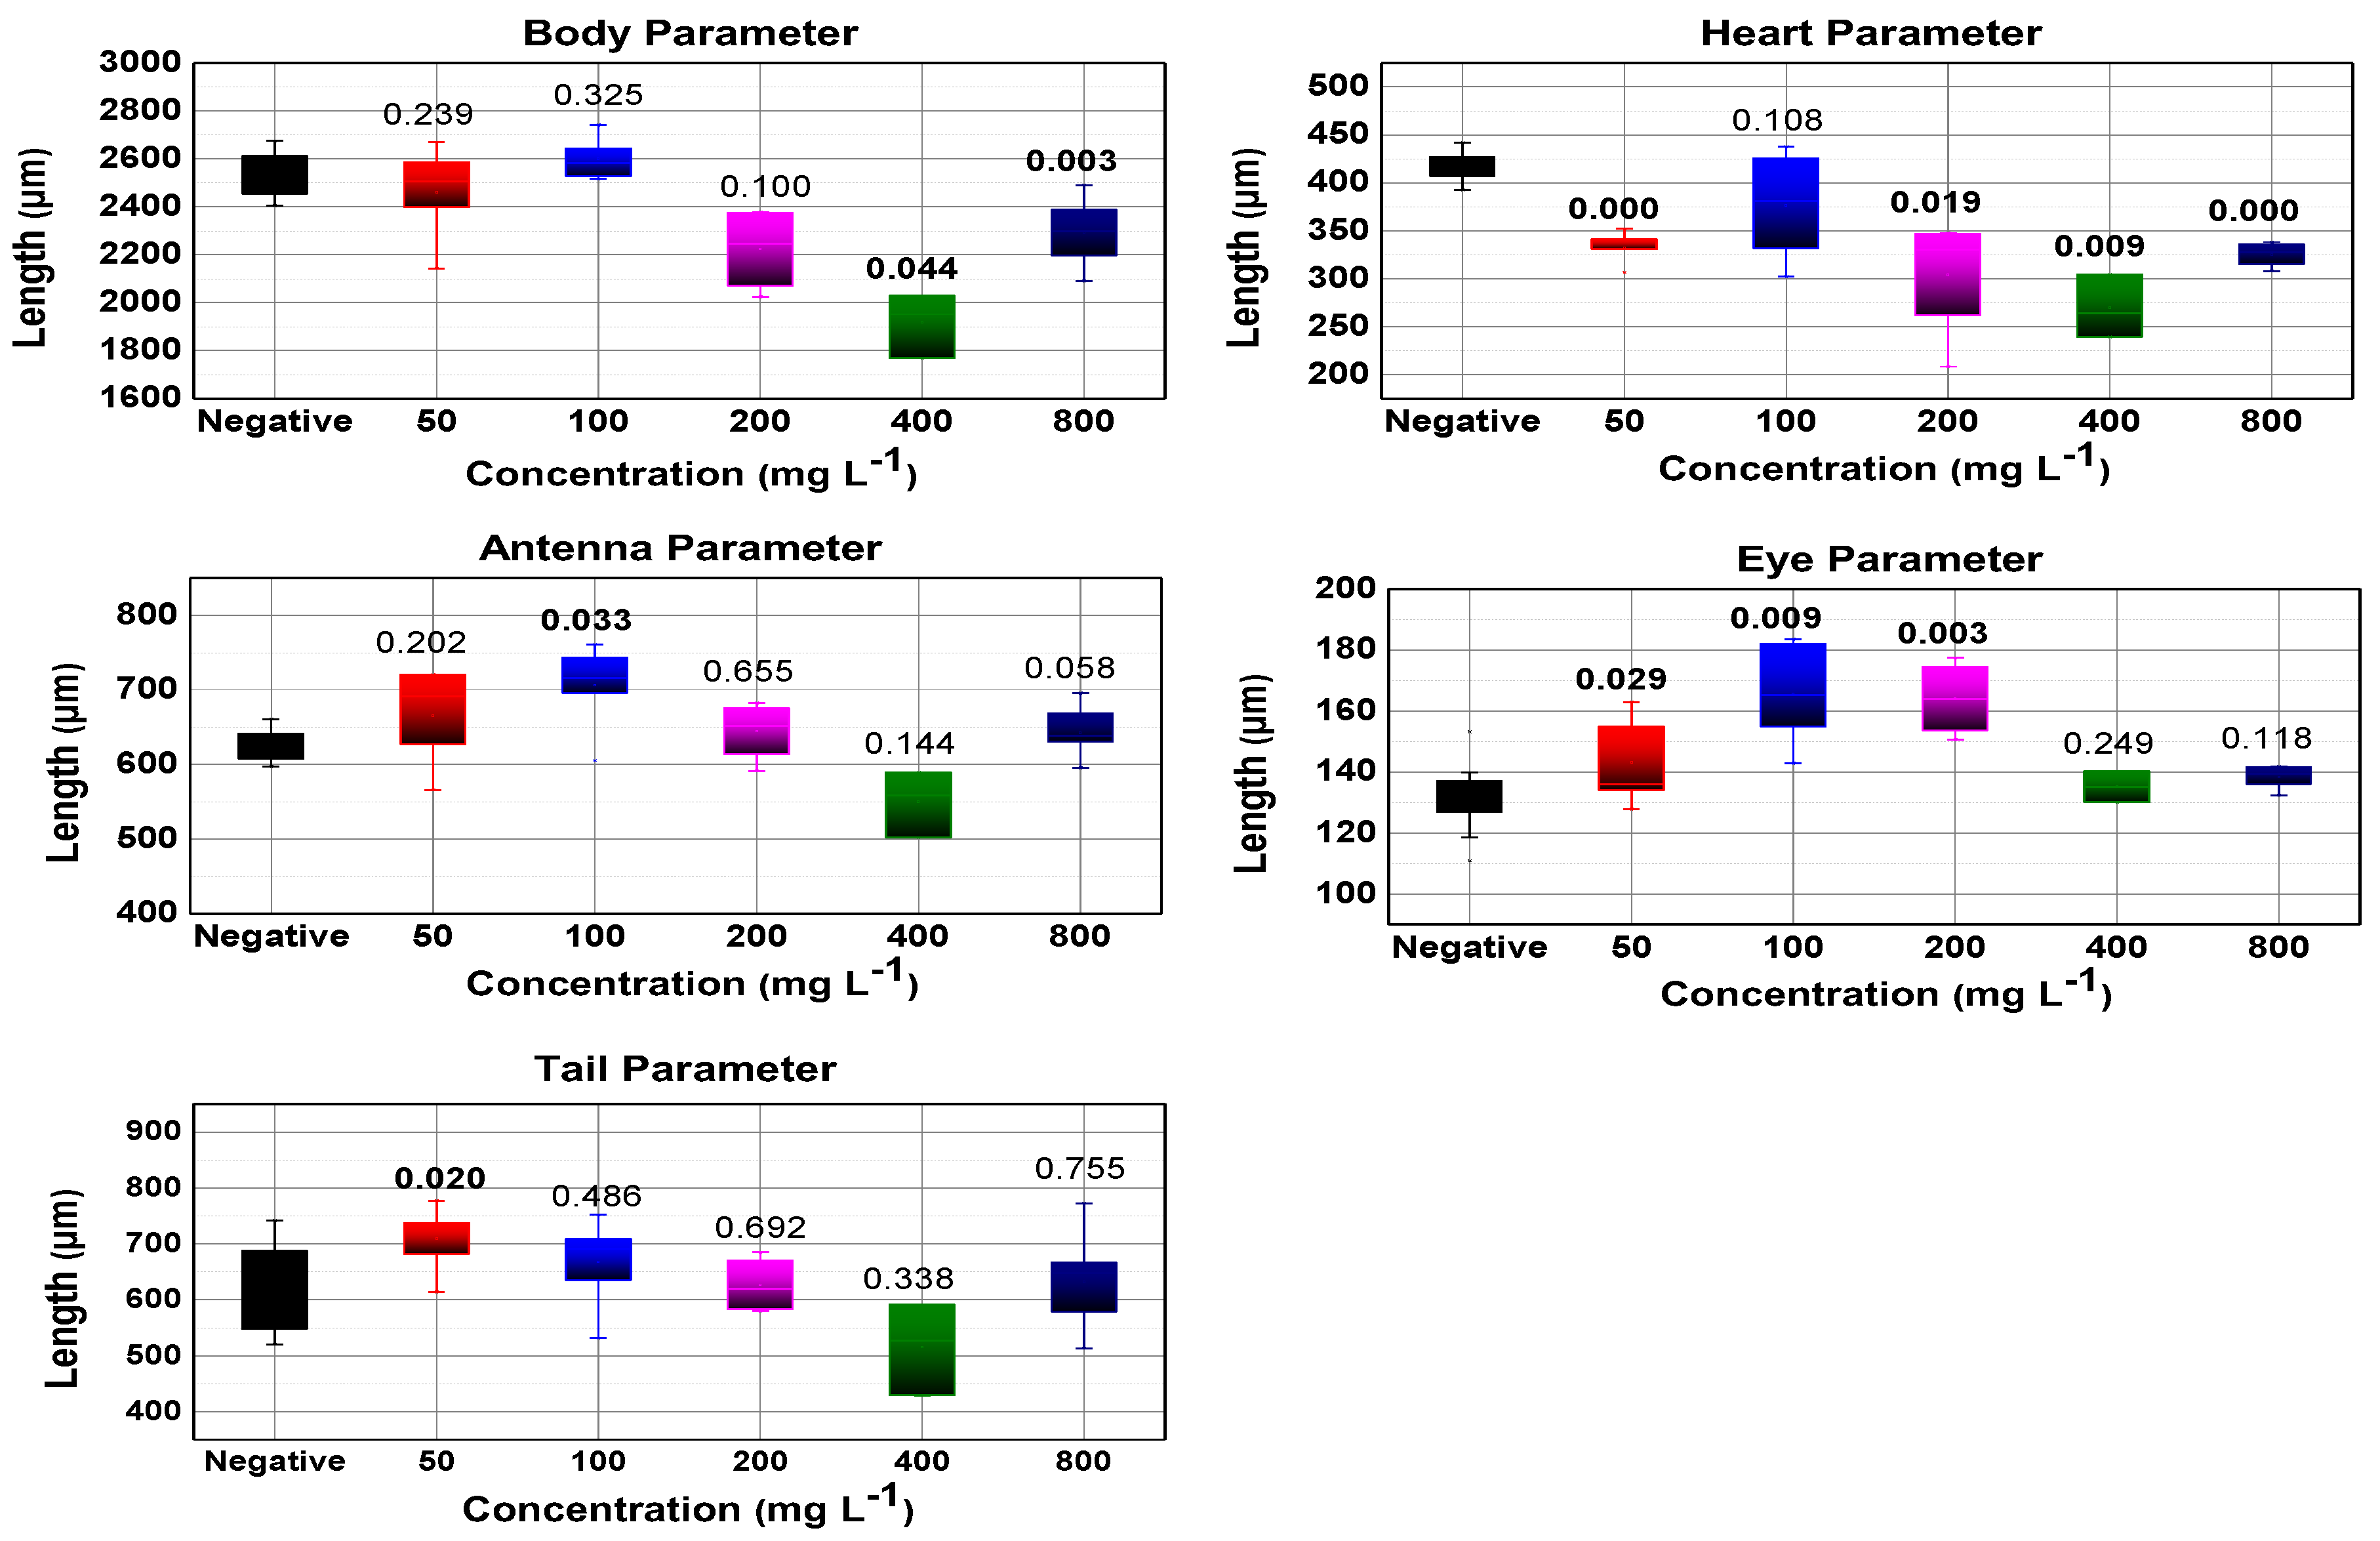
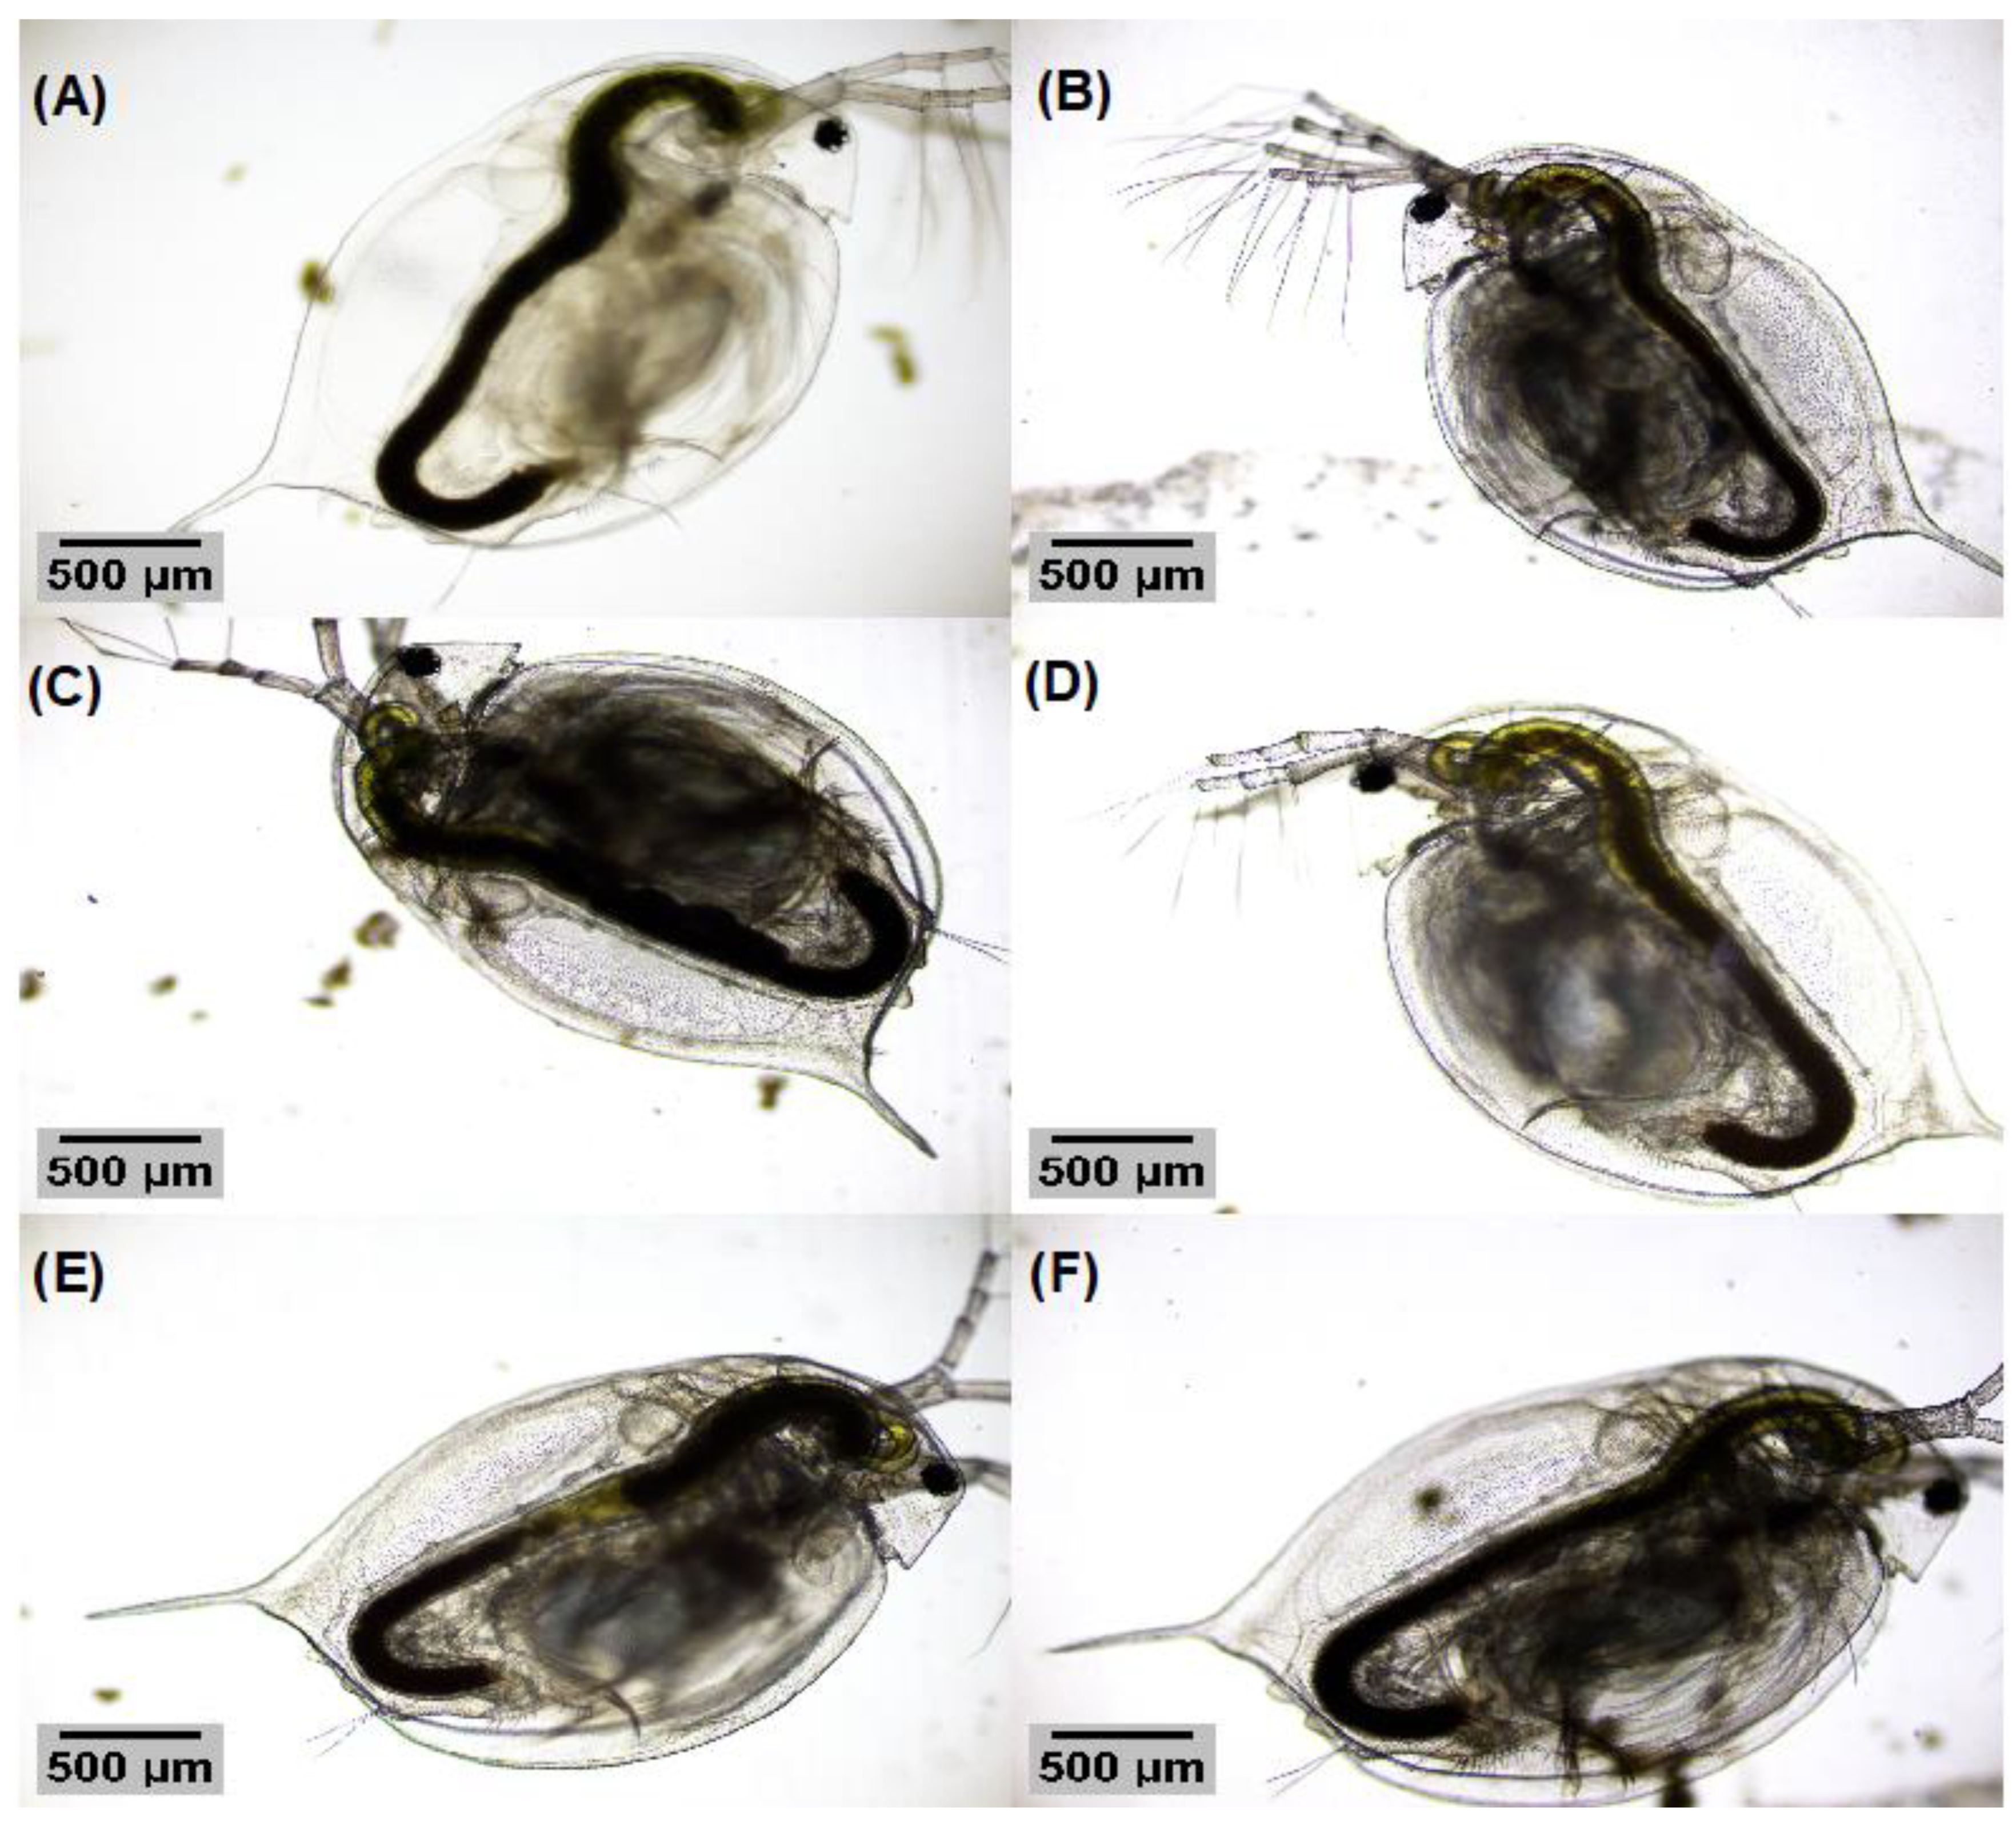
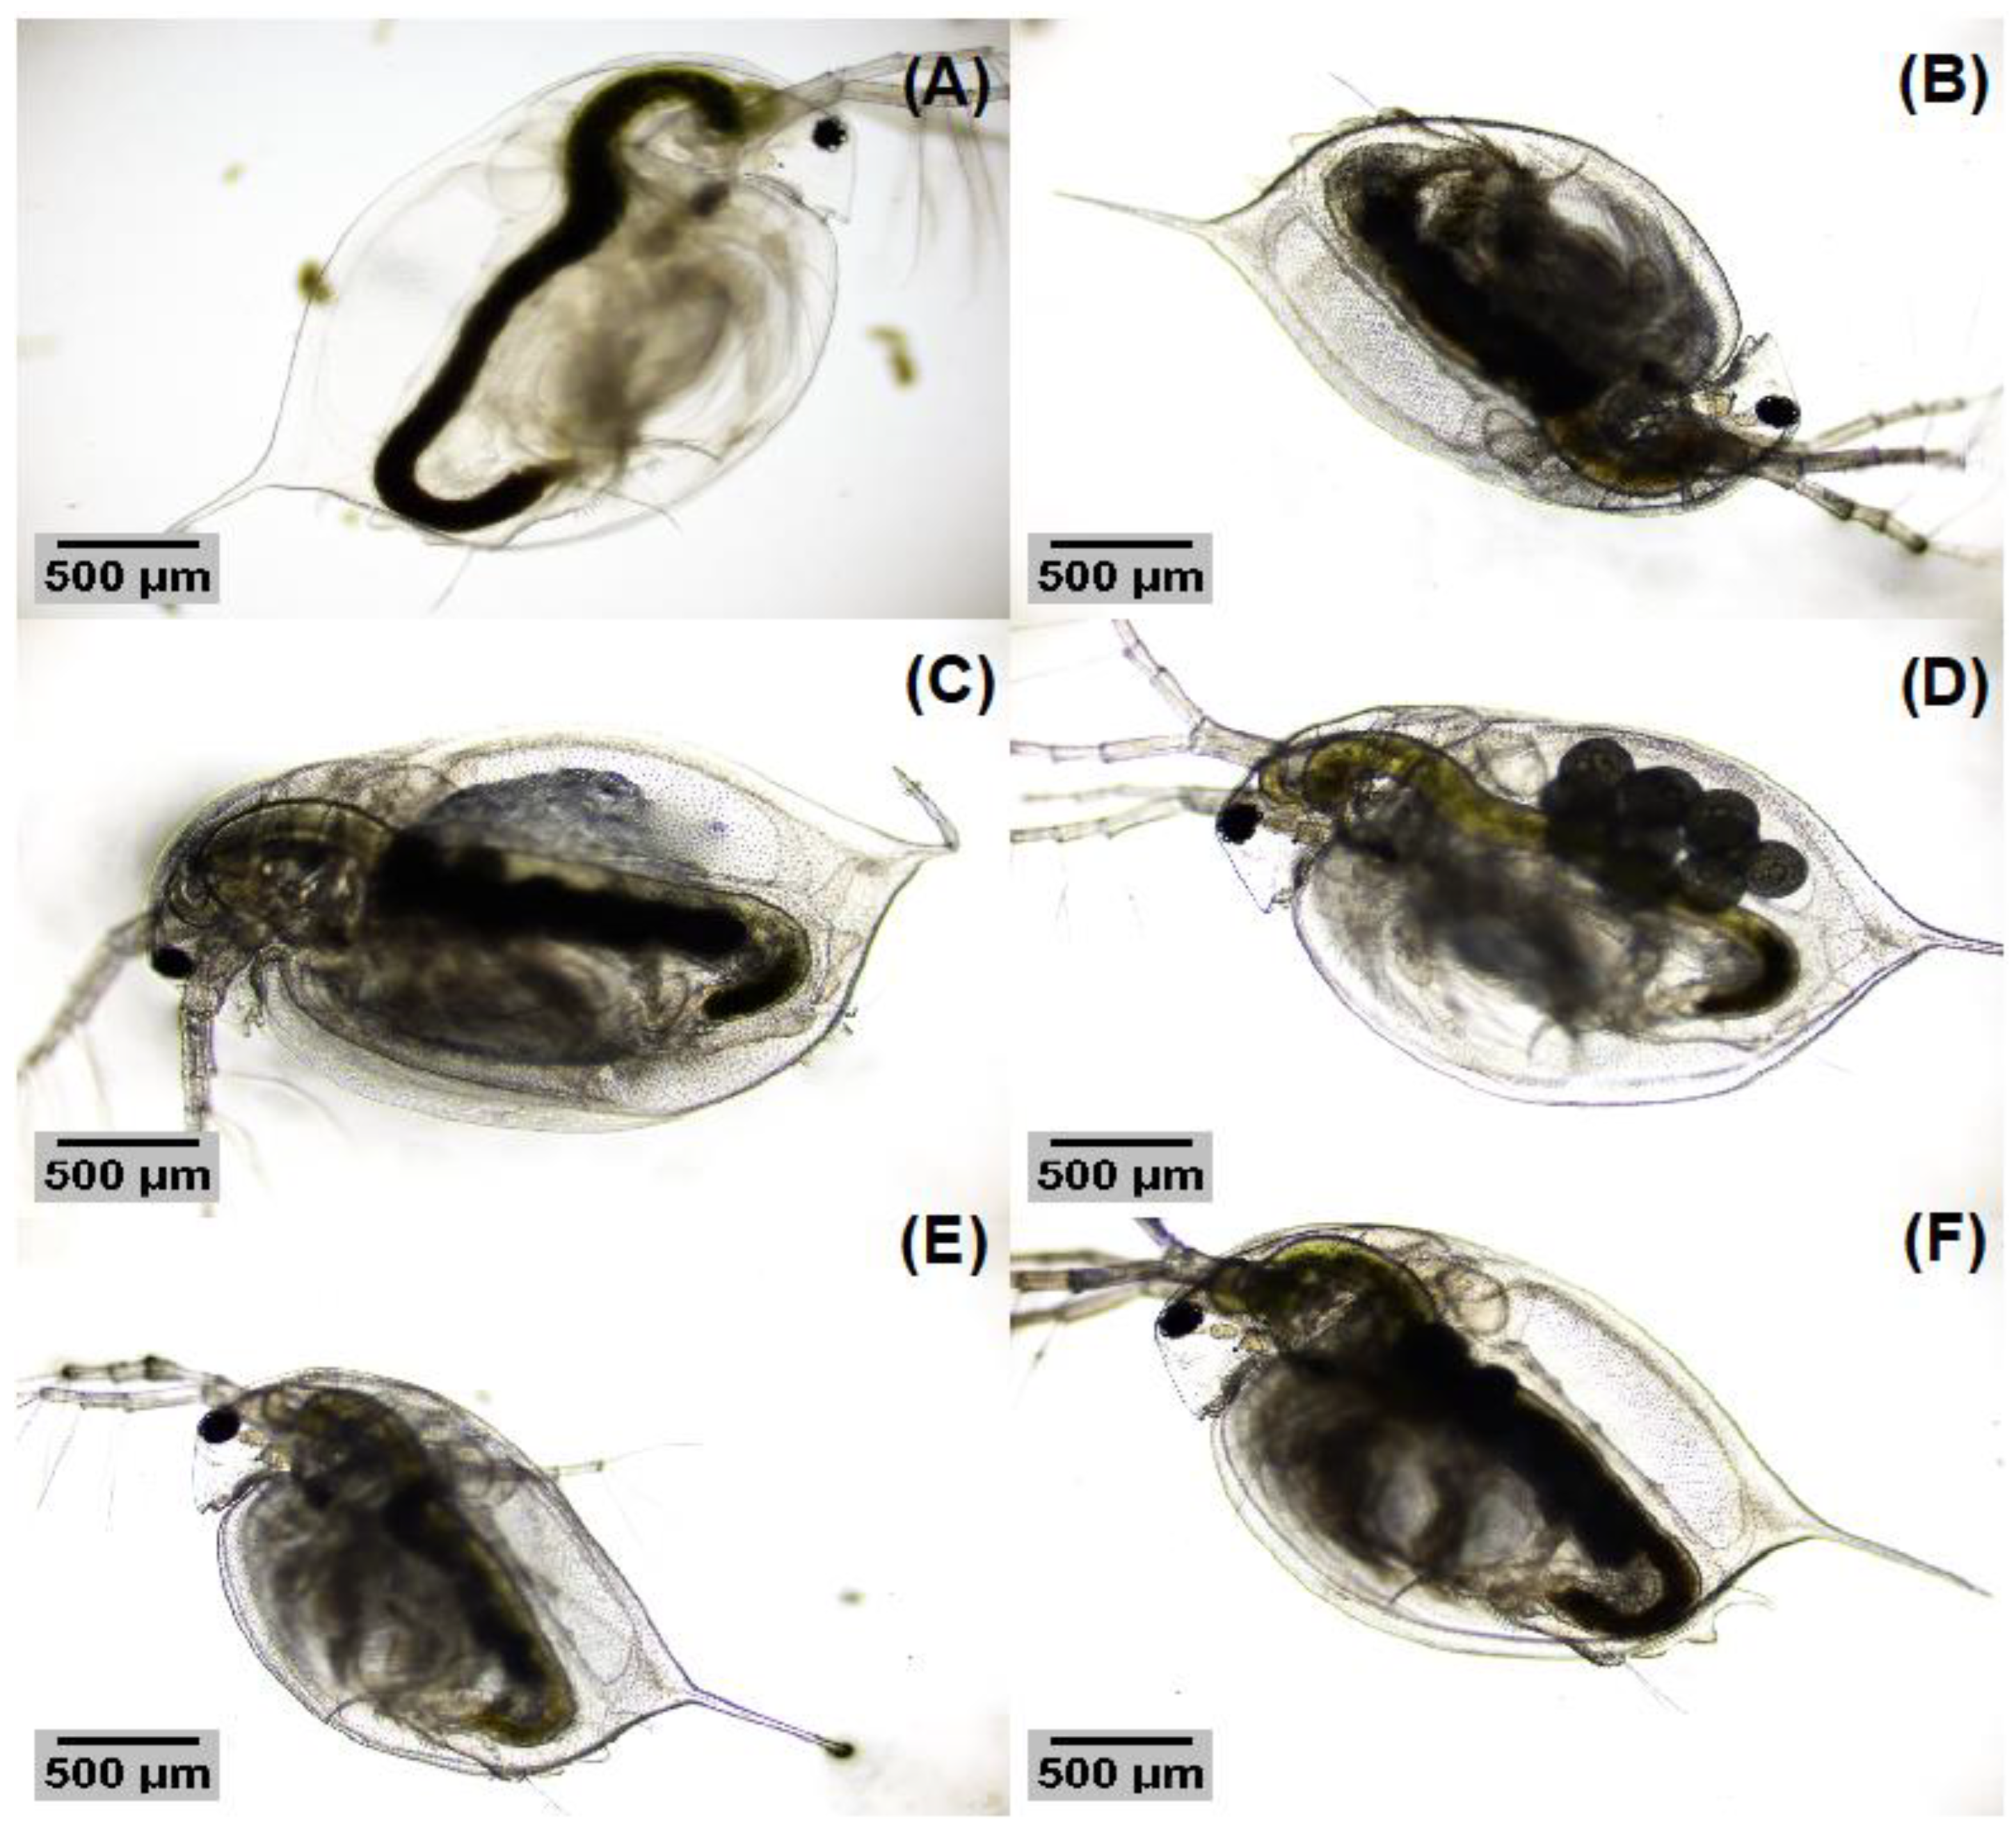
3.5.2. Morphological Analysis

Figure S2 shows the typical growth in the morphological parameters that one would expect when they are not exposed to the TiO2 sample, that is, the growth that D. magna should have naturally. Figure S3 shows the optical microscopy image of a negative control D. magna specimen on the first and the last day.
In the boxplot presented in Figure 7 and Figure 8, the morphological parameters are illustrated, a significant change in the heart morphological parameter was evidenced for both TiO2 samples, this may indicate a stress level of D. magna, while the tail morphological parameter does not show substantial significance for both TiO2 samples.
Regarding the body morphological parameter, it is shown that there is not much significance for the TiO2 NWs in two of the five concentrations, so there is no effect on their growth as concluded by Lee et al. [40], while for the TiO2 NPs there is a significance considerable in four of the five concentrations in opposition to Lee et al. [40]. In the morphological parameter antenna, no noticeable significance is observed in the five tested concentrations of both TiO2 nanosystems. Therefore, the erratic behavior in the swimming of D. magna is not confirmed to be due to this malformation. This is also corroborated by the observations of Lovern et al. [8].
Figure 9A–F and Figure 10A–F show the comparison of D. magna when they are exposed to both TiO2 samples at the tested concentrations. As can be seen, no apparent malformations were directly noticed when analyzing the optical images and no residuals of the TiO2 nanosystems were noticed on the body surface.

3.5.3. Reproduction Rate

The reproduction rate of D. magna occurred in the negative control in the ninth day with 61 pups born. On day 12, however, 40 pups were born, and finally on the fifteenth day, three pups were born giving 104 individuals born (control) in parallel to the exposure experiments. Regarding the individuals of D. magna exposed to the TiO2 samples, no reproduction was observed in the period of the ecotoxicity experiment with TiO2 NWs. In case of TiO2 NPs, only two concentrations reported neonates, they were 300 mg L−1 (25 neonates) and 600 mg L−1 (20 neonates). It was also found from the morphological experiments that there was a delay in the reproduction of these individuals. Significant inhibition of growth and reproduction has been observed in chronic toxicity studies with TiO2 [41], while for the D. magna exposed to TiO2 there was a delay in their reproduction, this was observed due to the translucent properties of the crustaceans, which were monitored with the help of an optical microscope, and through observation of the eggs on the specie incubation chamber on the last day.

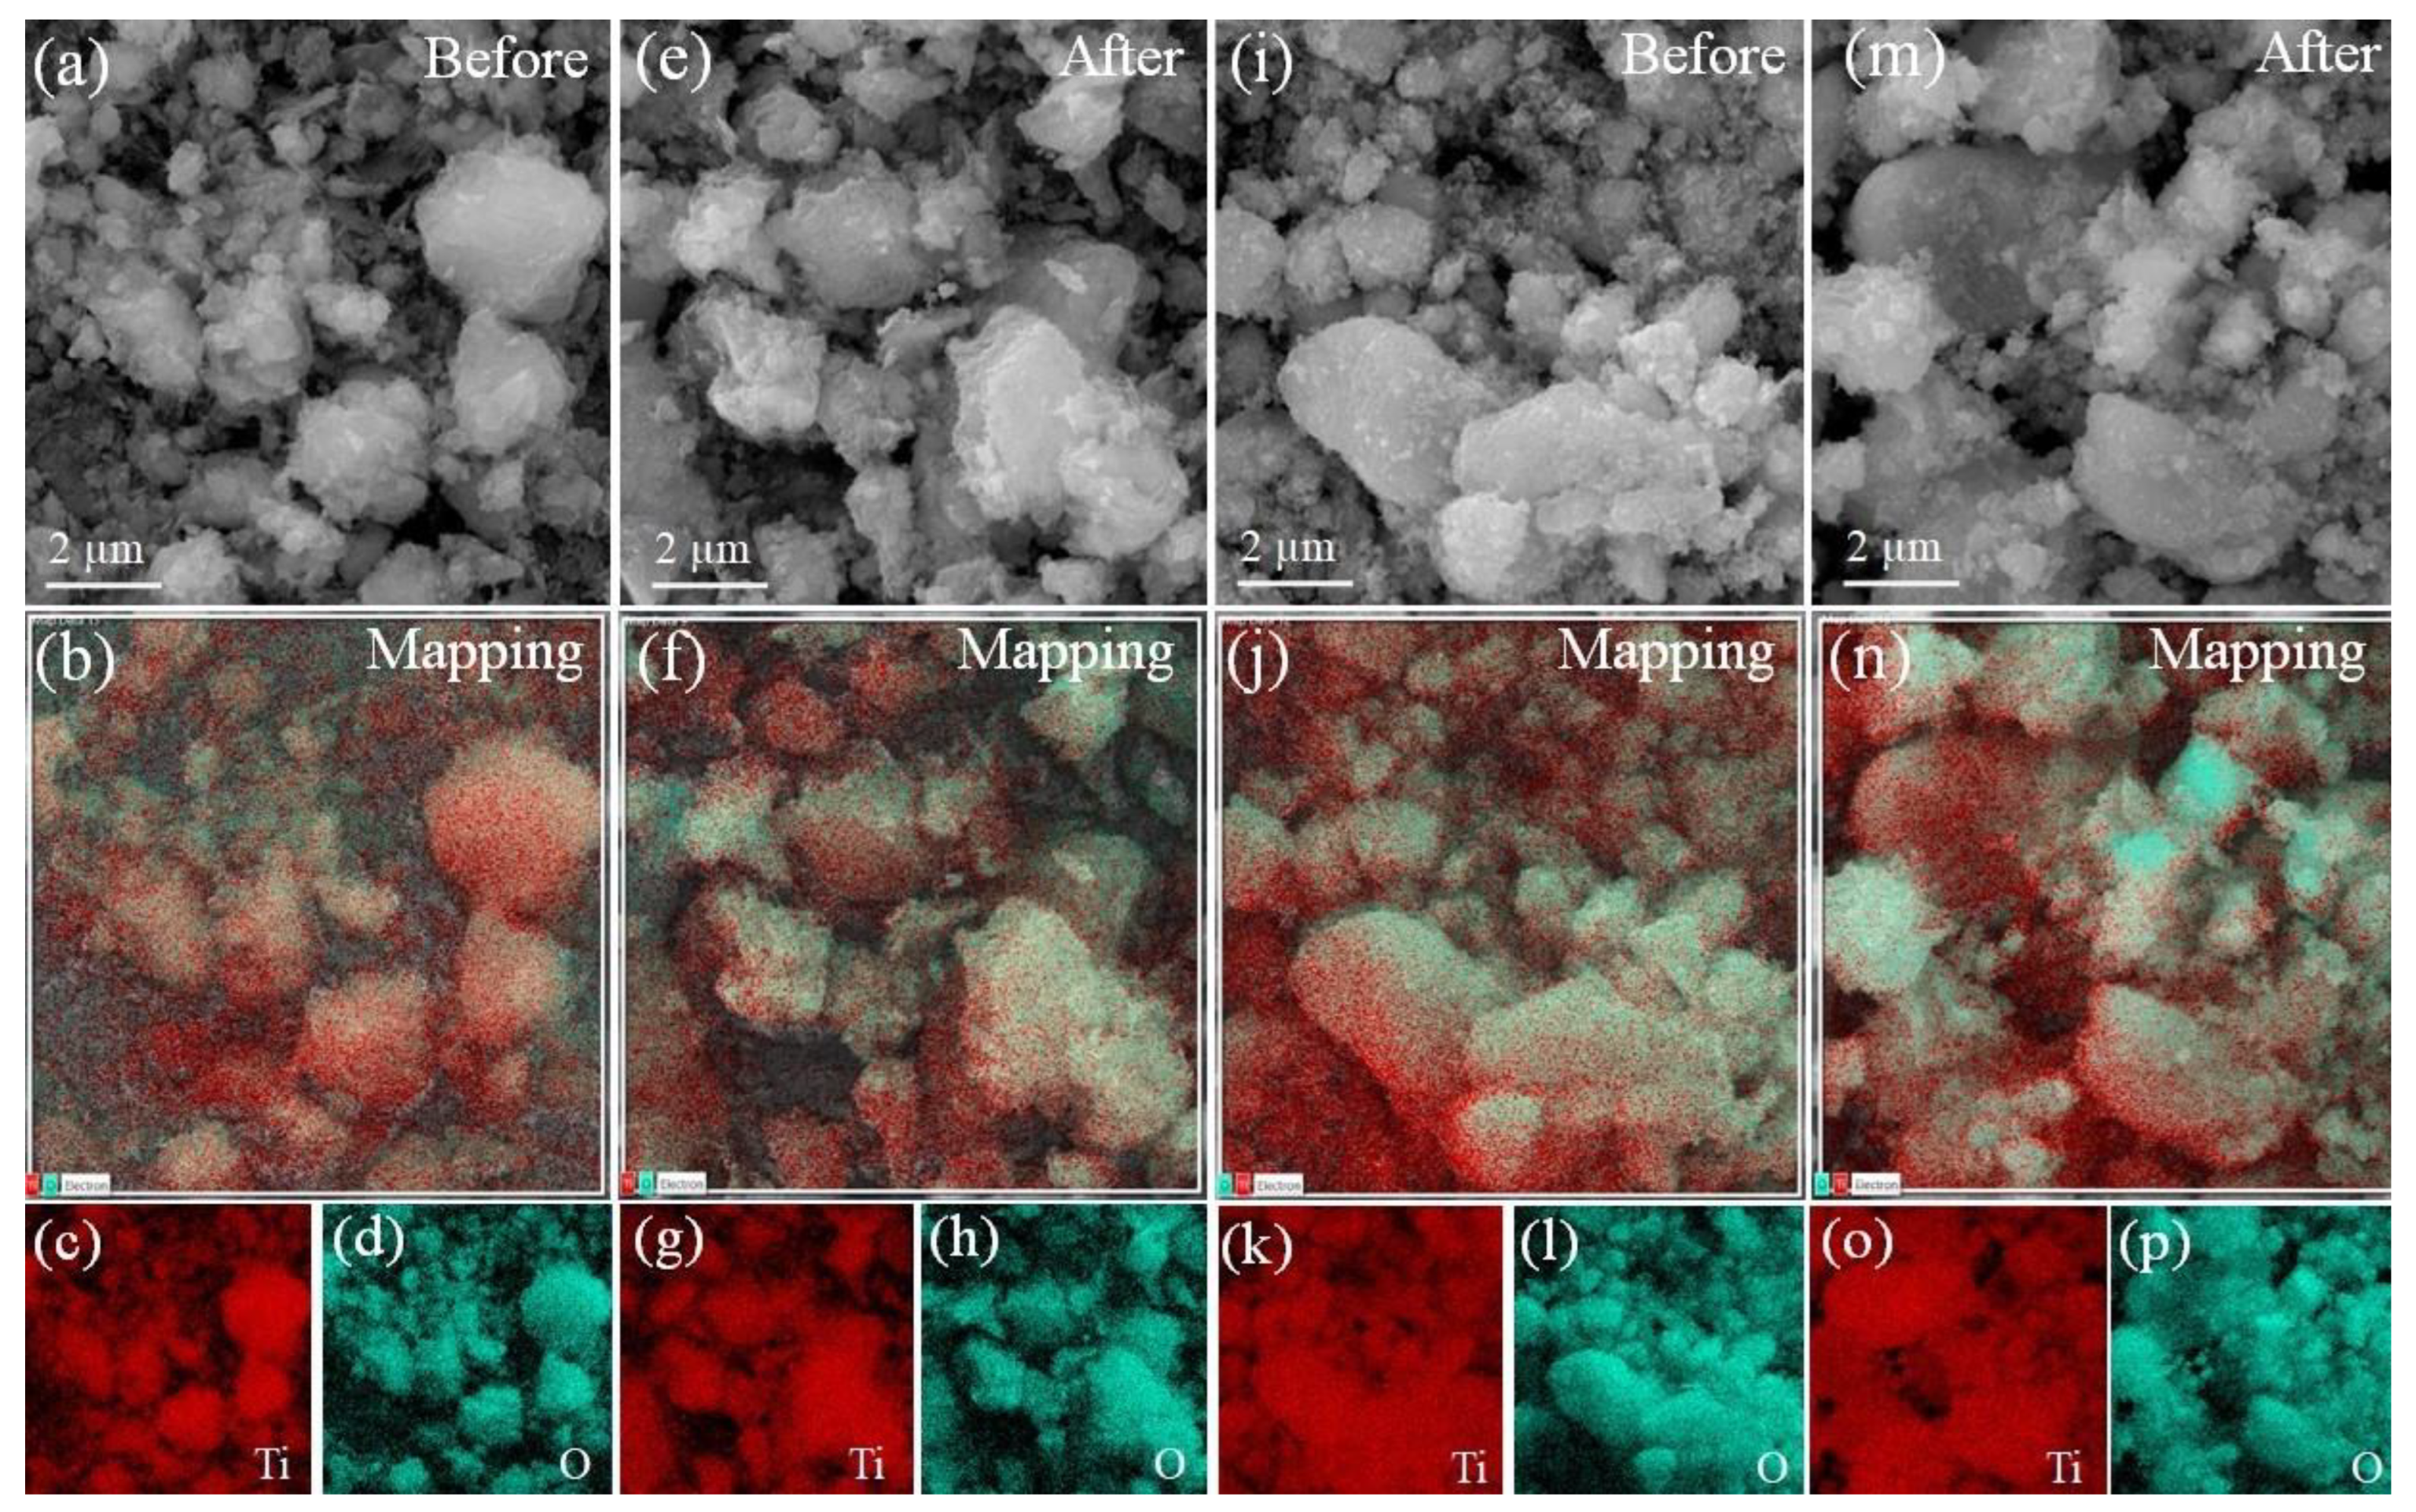
3.6. After Exposure Properties of TiO2 Nanomorphologies

Refined X-ray diffractograms for TiO2 samples after performing ecotoxicological experiments are given in Figure S4. In Figure S4A the characteristic Bragg’s peaks of TiO2 anatase are shown after the ecotoxicity experiment. These were identified using Match v3 software, confirming the crystalline phase of anatase (# 900-8214). However, some new Bragg’s peaks, not related to anatase, were observed [42]. A possible explanation for these Bragg’s peaks is the presence of sodium chloride or another minor impurity, though this cannot be elucidated with accuracy due to the predominance of TiO2 anatase (>90 wt. %). In Figure S4B, the refined X-ray diffractogram for TiO2 NWs (after the ecotoxicity experiment) permitted the identification of H2Ti3O7 (# 433-6946). This crystalline phase is like that shown in [43,44], wherein H2Ti3O7 is the product of the deionization process of Na2Ti3O7. The corresponding Bragg’s angle positions for identified crystalline phases are given in Tables S3 and S4.
On the other hand, the brookite phase did not appear in the phase identification using the Match v3 software, since no characteristic peak of this TiO2 polymorph appears in the X-ray diffractogram [42]. This may be due to the aqueous solution exposure (culture solution) with D. magna that causes a segregation or dilution for this secondary phase [45]. However, this phase was corroborated by analyzing the selected area electron diffraction (SAED) pattern.
Figure 11a–d shows the SAED pattern for the recovered samples with their respective indexed rotational average patterns. By analyzing before and after the structural properties, it was possible to confirm the presence of the brookite phase (as a minority phase). Hence, the fingerprints indexes confirmed the presence of anatase TiO2 and brookite phases before and after ecotoxicological experiments.
Figure 12a–p shows the EDS mapping images that was performed to corroborate the total weight composition for the samples and to confirm the presence of Ti and O elements homogenously distributed in the samples. Figure 12 depicts the EDS mapping images that were used to validate the overall weight composition of the samples and the existence of Ti and O elements that were evenly distributed in the samples.
Table 4 shows the quantitative weight composition of the four samples. After ecotoxicological investigations, there was a change in the weight composition of TiO2 NPs for Ti and O. This was mostly due to the experiment conditions and D. magna exposure (minority phases detected by X-ray diffraction). In contrast, no significant changes in TiO2 NWs composition were observed following the biological studies.
The O-K edge and Ti L2,3 edge EELS spectra for the anatase TiO2 NPs (before and after) are given in Figure 13a. Two peaks at 455 and 461 eV are related to L3 and L2 transitions. While the O-K edge exhibited four marked peaks given by capital letters (A–D) in Figure 13b. For both TiO2 NPs, four strong peaks in the O-K edge were seen at (A) 531 eV, (B) 540 eV, (C) 545 eV, and (D) 568 eV. All of these peaks were anatase TiO2 NPs [46,47]. There were no further peaks associated with other TiO2 phases before or following TiO2 NPs. Rutile is frequently distinguished by three extra peaks positioned after the A and B peaks that were not seen in the EELS spectra [46]. For TiO2 NWs in Figure 13c,d, energy peaks located at 532 eV, (B) 540 eV, (C) 543 eV, and (D) 566 eV assigned to TiO2 polymorphs were found, indicating that, despite the different morphologies, both systems retained their chemical structure (before and after ecotoxicological experiments).

3.7. Perspectives

One important subject for future research is the evaluation of how TiO2 NPs modifies the bioaccumulation of heavy metals in D. magna. Poor references are available in the literature focusing on this issue. For example, Wang et al. [48] innovatively showed that bioaccumulation of heavy metal increases to 85% in the presence of TiO2 NPs, and that this increase was correlated with the heavy metal’s physical properties. Hartmann et al. [49] studied how TiO2 NPs affected the toxicity of cadmium to aquatic organisms. While the NPs could potentially carry cadmium, their addition did not change the toxicity to the studied organisms. However, more research is needed in this direction to understand the role of nanoparticle-bound versus soluble cadmium in uptake and toxicity. Finally, experiments at molecular levels will also be needed to improve understanding and obtain a total ecotoxicological evaluation.

4. Conclusions

Two different commercial TiO2 nanomorphologies were characterized to understand their ecotoxicological properties in D. magna. Refined X-ray diffractograms showed that the TiO2 NPs sample has a monophasic anatase phase. Meanwhile, the TiO2 NWs biphasic sample allowed us to identify and elucidate brookite (tetragonal) and protonic trititanate (monoclinic) phases. From the quantitative analysis, 63.5 wt. % corresponded to protonic trititanate and 36.5 wt. % for brookite. Raman spectroscopy proved the presence of both phases through their optical vibrational modes. DLS allowed the calculation of the effective hydrodynamic sizes at various pH and the zeta potential values of ca. −20 mV for both TiO2 nanomorphologies, which are important parameters to establish the LC50 and are not often studied when determining this value. The zeta potential was observed to increase in an alkaline medium for TiO2 samples. This means that a negative potential can favor the adsorption of divalent cations in polluted water. However, this can represent a flaw because changing the pH can affect the D. magna habitat; thus, future evaluations in the LC50 will be needed. Therefore, the LC50 values must be first determined. TEM images and statistical analysis revealed no morphological changes for TiO2 species (before and after ecotoxicological experiments). The ecotoxicological impact of TiO2 on the environmental bioindicator was slightly higher for TiO2 NWs than TiO2 NPs, despite their close LC50 values of 157 and 166 mg L−1, the mortality in TiO2 NWs was high and equivalent to 50% for the three of five concentrations but mortality in TiO2 NPs was only above 50% in one of the five tested concentrations. These nanomaterials also caused a delay in D. magna reproduction, because, in favorable conditions (negative control), the neonates began to be born on day nine, having 104 D. magna individuals counted for control (after 16 days). However, those daphnids exposed to TiO2 NWs had no neonates at the end of the experiments under the tested concentrations. On the contrary, neonates were only born in the last day of the experiments for 300 mg L−1 (25 neonates) and 600 mg L−1 (20 neonates) TiO2 NPs. This may represent an important disadvantage that must be carefully evaluated in future works and damage comparison with studies at molecular levels will be further necessary. In terms of morphological metrics, it was found that the heart size for D. magna varies significantly when exposed to TiO2 samples at four of the five tested concentrations. It was also observed that there was no change in D. magna swimming because there was no overall significant change in the antenna parameter after TiO2 nanomorphologies exposure, which is the morphological feature that permits D. magna’s distinctive jump. As a result of this research, we can infer that the toxic effects of TiO2 NWs are more severe than those of TiO2 NPs. Finally, we went beyond the ecotoxicological experiments by analyzing the recovering samples by X-ray diffraction, SAED, EDS mapping, and EELS, revealing that the structure and morphological properties of TiO2 nanomorphologies are kept after the biological experiments. This represents a potential improvement, since they can be recycled and stored for future applications, such as water remediation, below the determined LC50 values.

Supplementary Materials

The following supporting information can be downloaded at: https://www.mdpi.com/article/10.3390/nano13050927/s1. Figure S1: Graph of EHD vs. pH for TiO2 NPs (anatase), each point is the result of the measurement with the highest baseline index; Figure S2: Box plot for all morphological parameters (tail, body, heart, antenna and eye) for the negative control for both the first day and the last day; Figure S3: (A) D. magna neonate and (B) 16-day-old D. magna; Figure S4: Rietveld refinement of the diffractogram obtained for after the ecotoxicity experiment, (A) TiO2 NPs and (B) TiO2 NWs; Table S1: crystalline phase, Miller indices, and the Bragg angle for the TiO2 NPs; Table S2: crystalline phase, Miller indices, and the Bragg angle for the TiO2 NWs sample; Table S3: crystalline phase, Miller indices, and Bragg angle for the TiO2 NPs after ecotoxicity experiment; and Table S4: crystalline phase, Miller indices, and Bragg angle for the TiO2 NWs after ecotoxicity experiment.

Author Contributions

Conceptualization, F.M.-V. and J.A.R.-G.; methodology, F.M.-V. and J.A.R.-G.; software, F.M.-V., N.-R.C.-H. and J.A.R.-G.; validation, F.M.-V., N.-R.C.-H. and J.A.R.-G.; formal analysis, F.M.-V., N.-R.C.-H. and J.A.R.-G.; investigation, F.M.-V., N.-R.C.-H. and J.A.R.-G.; resources, F.M.-V., N.-R.C.-H. and J.A.R.-G.; data curation, F.M.-V., N.-R.C.-H. and J.A.R.-G.; writing—original draft preparation, F.M.-V. and J.A.R.-G.; writing—review and editing, F.M.-V., N.-R.C.-H. and J.A.R.-G.; visualization, F.M.-V., N.-R.C.-H. and J.A.R.-G.; supervision, J.A.R.-G.; project administration, J.A.R.-G.; funding acquisition, J.A.R.-G. All authors have read and agreed to the published version of the manuscript.

Funding

This research was supported by Vicerrectorado de Investigación y Posgrado (VRIP) de la Universidad Nacional Mayor de San Marcos (UNMSM)—RR N° 01686-R-20 and project number B20131691. The APC was funded by VRIP-UNMSM.

Data Availability Statement

The original data related to this research can be asked for any time to the corresponding author’s email: juan.ramos5@unmsm.edu.pe.

Acknowledgments

We thank the Universidad Nacional Mayor de San Marcos (UNMSM)—RR N° 01686-R-20 and project number B20131691 for financially support this work. The authors thank the BIOTOXIC research group from UNMSM, for let us perform the ecotoxicological experiments.

Conflicts of Interest

The authors declare no conflict of interest.

References

  1. Kumar, J.A.; Krithiga, T.; Manigandan, S.; Sathish, S.; Renita, A.A.; Prakash, P.; Prasad, B.S.N.; Kumar, T.R.P.; Rajasimman, M.; Hosseini-Bandegharaei, A.; et al. A focus to green synthesis of metal/metal-based oxide nanoparticles: Various mechanisms and applications towards ecological approach. J. Clean. Prod. 2021, 324, 129198. [Google Scholar] [CrossRef]
  2. Chouke, P.B.; Shrirame, T.; Potbhare, A.K.; Mondal, A.; Chaudhary, A.R.; Mondal, S.; Thakare, S.R.; Nepovimova, E.; Valis, M.; Kuca, K.; et al. Bioinspired metal/metal oxide nanoparticles: A road map to potential applications. Mater. Today Adv. 2022, 16, 100314. [Google Scholar] [CrossRef]
  3. Abdallah, A.M.; Abdel-Rahman, A.A.; Elwardany, A.E. Analysis of the impact of different nanoparticle metal oxides as fuel additives in compression ignition engine performance. Energy Rep. 2020, 6, 99–105. [Google Scholar] [CrossRef]
  4. Ağbulut, Ü.; Karagöz, M.; Sarıdemir, S.; Öztürk, A. Impact of various metal-oxide based nanoparticles and biodiesel blends on the combustion, performance, emission, vibration and noise characteristics of a CI engine. Fuel 2020, 270, 117521. [Google Scholar] [CrossRef]
  5. Faraji, J.; Sepehri, A.; Salcedo-Reyes, J.C. Titanium Dioxide Nanoparticles and Sodium Nitroprusside Alleviate the Adverse Effects of Cadmium Stress on Germination and Seedling Growth of Wheat (Triticum aestivum L.). Univ. Sci. 2018, 23, 61–87. [Google Scholar] [CrossRef]
  6. Nevárez-Martínez, M.C.; Espinoza-Montero, P.J.; Quiroz-Chávez, F.J.; Ohtani, B. Fotocatálisis: Inicio, actualidad y perspectivas a través del TiO2. Av. Quim. 2018, 12, 45–59. [Google Scholar]
  7. Instituto Nacional de Seguridad e Higiene en el Trabajo (INSHT). Seguridad y Salud en el Trabajo con Nanomateriales. Available online: https://www.insst.es/documents/94886/789635/sst+nanomateriales.pdf/bd21b71f-d5ec-4ee8-8129-a4fa58480968?t=1605802873517 (accessed on 28 February 2023).
  8. Lovern, S.B.; Klaper, R. Daphnia magna mortality when exposed to titanium dioxide and fullerene (C60) nanoparticles. Environ. Toxicol. 2006, 25, 1132–1137. [Google Scholar] [CrossRef]
  9. Murali, M.; Suganthi, P.; Athif, P.; Sadiq Bukhari, A.; Syed Mohamed. H.E.; Basu, H.; Singhal, R.K. Synthesis and characterization of TiO2 nanoparticle and study of its impact on aquatic organism. J. Adv. Appl. Sci. Res. 2016, 1, 10–23. [Google Scholar] [CrossRef]
  10. Johari, S.A.; Asghari, S. Acute toxicity of titanium dioxide nanoparticles in Daphnia magna and Pontogammarus maeoticus. J. Environ. Health Sci. Eng. 2015, 3, 111–119. [Google Scholar] [CrossRef]
  11. Irshad, M.A.; Nawaz, R.; ur Rehman, M.Z.; Adrees, M.; Rizwan, M.; Ali, S.; Ahmad, S.; Tasleem, S. Synthesis, characterization and advanced sustainable applications of titanium dioxide nanoparticles: A review. Ecotoxicol. Environ. Saf. 2021, 212, 111978. [Google Scholar] [CrossRef] [PubMed]
  12. Cid Martínez, G. Análisis de la Dinámica del Crecimiento Poblacional de la Daphnia magna: Un Modelo Para su Uso den Bioensayos. Bachelor’s Thesis, Benemérita Universidad Autónoma de Puebla, Puebla, Mexico, 2018. [Google Scholar]
  13. Liu, S.; Zeng, P.; Li, X.; Thuyet, D.Q.; Fan, W. Effect of chronic toxicity of the crystalline forms of TiO2 nanoparticles on the physiological parameters of Daphnia magna with a focus on index correlation analysis. Ecotoxicol. Environ. Saf. 2019, 181, 292–300. [Google Scholar] [CrossRef] [PubMed]
  14. Novak, S.; Kokalj, A.J.; Hočevar, M.; Godec, M.; Drobne, D. The significance of nanomaterial post-exposure responses in Daphnia magna standard acute immobilisation assay: Example with testing TiO2 nanoparticles. Ecotoxicol. Environ. Saf. 2018, 152, 61–66. [Google Scholar] [CrossRef]
  15. Zarria-Romero, J.Y.; Ocampo-Anticona, J.A.; Pinotti, C.N.; Passamani, E.C.; Checca-Huaman, N.R.; Castro-Merino, I.L.; Pino, J.; Shiga, B.; Ramos-Guivar, J.A. Ecotoxicological properties of functionalized magnetic graphene oxide and multiwall carbon nanotubes in Daphnia magna. Ceram. Int. 2023, in press. [Google Scholar] [CrossRef]
  16. Song, H.; Kuang, X.; Wei, X.; Luo, S.; Zeng, Q.; Peng, L. The effect of TiO2 nanoparticles size on Cd (II) removal by the paddy crusts from waterbody. J. Environ. Chem. Eng. 2022, 10, 107883. [Google Scholar] [CrossRef]
  17. Andronic, L.; Isac, L.; Miralles-Cuevas, S.; Visa, M.; Oller, I.; Duta, A.; Malato, S. Pilot-plant evaluation of TiO2 and TiO2-based hybrid photocatalysts for solar treatment of polluted water. J. Hazard. Mater. 2016, 320, 469–478. [Google Scholar] [CrossRef]
  18. Salgado, S.Y.A.; Zamora, R.M.R.; Zanella, R.; Peral, J.; Malato, S.; Maldonado, M.I. Photocatalytic hydrogen production in a solar pilot plant using a Au/TiO2 photo catalyst. Int. J. Hydrog. Energy 2017, 41, 11933–11940. [Google Scholar] [CrossRef]
  19. Putz, H.; Brandenburg GbR, K. Match!—Phase Identification from Powder Diffraction—Version 3; Crystal Impact: Bonn, Germany. Available online: https://www.crystalimpact.com/match (accessed on 28 February 2023).
  20. Canchanya-Huaman, Y.; Mayta-Armas, A.F.; Pomalaya-Velasco, J.; Bendezú-Roca, Y.; Guerra, J.A.; Ramos-Guivar, J.A. Strain and Grain Size Determination of CeO2 and TiO2 Nanoparticles: Comparing Integral Breadth Methods versus Rietveld, μ-Raman, and TEM. Nanomaterials 2011, 11, 2311. [Google Scholar] [CrossRef]
  21. Flores-Cano, D.A.; Chino-Quispe, A.R.; Rueda-Vellasmin, R.; Ocampo-Anticona, J.A.; González, J.C.; Ramos-Guivar, J.A. Fifty years of Rietveld refinement: Methodology and guidelines in superconductors and functional magnetic nanoadsorbents. Rev. Investig. Fis. 2021, 24, 39–48. [Google Scholar] [CrossRef]
  22. Rueda-Vellasmin, R.; Checca-Huaman, N.R.; Passamani, E.C.; Litterst, F.J.; Ramos-Guivar, J.A. Mössbauer studies of core-single-shell and core-double-shell polymer functionalized magnetic nanoparticles. Hyperfine Interact. 2022, 243, 27. [Google Scholar] [CrossRef]
  23. Sánchez Martínez, M. Alteraciones Fisiológicas como Consecuencia de la Exposición a Plaguicidas en Sucesivas Generaciones de Daphnia magna. Ph.D. Thesis, Universitat de Valencia, Valencia, Spain, 2005. [Google Scholar]
  24. Martínez Rojas, V.C.; Matejova, L.; López Milla, A.; Cruz, G.J.; Solís Veliz, J.L.; Gómez León, M.M. Obtención de partículas de TiO2 por sol-gel, asistido con ultrasonido para aplicaciones fotocatalíticas. Rev. Soc. Quím. Perú. 2015, 81, 201–211. [Google Scholar] [CrossRef]
  25. Morales, J.C. Nuevos Catalizadores de ni (mo) w Soportados en Titania Nanoestructurada para Hidrodesulfuración Profunda. Master’s Thesis, Universidad Nacional Autónoma de México, Mexico City, Mexico, 2013. [Google Scholar]
  26. Shi, J.W.; Fan, Z.; Gao, C.; Gao, G.; Wang, B.; Wang, Y.; He, C.; Niu, C. Mn-Co mixed oxide nanosheets vertically anchored on H2Ti3O7 nanowires: Full exposure of active components results in significantly enhanced catalytic performance. ChemCatChem 2018, 10, 2833–2844. [Google Scholar] [CrossRef]
  27. Penalba Albuixech, A. A New Mathematical Profile for Experimental Raman Spectra of Historical Mineral Pigments. Bachelor’s Thesis, Universitat Politècnica de Catalunya, Barcelona, Spain, 2020. [Google Scholar]
  28. Mohd Hasmizam, R.; Ahmad-Fauzi, M.; Mohamed, A.R.; Sreekantan, S. Physical Properties Study of TiO2 Nanoparticle Synthesis via Hydrothermal Method Using TiO2 Microparticles as Precursor. Adv. Mat. Res. 2013, 772, 365–370. [Google Scholar] [CrossRef]
  29. Guo, C.; Xu, L.; He, J.; Hu, L.; Wang, B.; Da, L. Enhanced Photocatalytic Activity by Cu2O Nanoparticles Integrated H2Ti3O7 Nanotubes for Removal of Mercaptan. Nano 2017, 12, 1750075. [Google Scholar] [CrossRef]
  30. Zhang, W.; Zhu, J.; He, J.; Xu, L.; Hu, L. Construction of NiO/H2Ti3O7 nanotube composite and its photocatalytic conversion feature for ethyl mercaptan. Appl. Phys. A 2020, 126, 630. [Google Scholar] [CrossRef]
  31. Iliev, M.N.; Hadjiev, V.G.; Litvinchuk, A.P. Raman and infrared spectra of brookite (TiO2): Experiment and theory. Vib. Spectrosc. 2013, 64, 148–152. [Google Scholar] [CrossRef]
  32. García-Contreras, L.A.; Flores-Flores, J.O.; Arenas-Alatorre, J.Á.; Chávez-Carvayar, J.Á. Synthesis, characterization and study of the structural change of nanobelts of TiO2 (H2Ti3O7) to nanobelts with anatase, brookite and rutile phases. J. Alloy Compd. 2022, 923, 166236. [Google Scholar] [CrossRef]
  33. Huang, C.; Liu, X.; Kong, L.; Lan, W.; Su, Q.; Wang, Y. The structural and magnetic properties of Co-doped titanate nanotubes synthesized under hydrothermal conditions. Appl. Phys. A 2007, 87, 781–786. [Google Scholar] [CrossRef]
  34. Lim, J.; Yeap, S.P.; Che, H.X.; Low, S.C. Characterization of magnetic nanoparticle by dynamic light scattering. Nanoscale Res. Lett. 2013, 8, 1–14. [Google Scholar] [CrossRef]
  35. Liao, D.L.; Wu, G.S.; Liao, B.Q. Zeta potential of shape-controlled TiO2 nanoparticles with surfactants. Colloids Surf. A Physicochem. Eng. Asp. 2009, 348, 270–275. [Google Scholar] [CrossRef]
  36. Calle, J.R.; Henao Valencia, A.E.H.; Ardila Arias, A.N. Degradación fotocatalítica de los colorantes rojo reactivo 120 y azul reactivo 4 hidrolizados usando TiO2 dopado con hierro o nitrógeno. Rev. Politécnica 2015, 11, 9–19. [Google Scholar] [CrossRef]
  37. Gökçe, D.; Köytepe, S.; Özcan, İ. Effects of nanoparticles on Daphnia magna population dynamics. Chem. Ecol. 2018, 34, 301–323. [Google Scholar] [CrossRef]
  38. Velzeboer, I.; Hendriks, A.J.; Ragas, A.M.; Van de Meent, D. Nanomaterials in the environment aquatic ecotoxicity tests of some nanomaterials. Environ. Toxicol. Chem. 2008, 27, 1942–1947. [Google Scholar] [CrossRef] [PubMed]
  39. Mahdavi, S.; Jalali, M.; Afkhami, A. Heavy metals removal from aqueous solutions using TiO2, MgO, and Al2O3 nanoparticles. Chem. Eng. Commun. 2013, 200, 448–470. [Google Scholar] [CrossRef]
  40. Lee, S.W.; Kim, S.M.; Choi, J. Genotoxicity and ecotoxicity assays using the freshwater crustacean Daphnia magna and the larva of the aquatic midge Chironomus riparius to screen the ecological risks of nanoparticle exposure. Environ. Toxicol. Pharmacol. 2009, 28, 86–91. [Google Scholar] [CrossRef] [PubMed]
  41. Zhu, X.; Chang, Y.; Chen, Y. Toxicity and bioaccumulation of TiO2 nanoparticle aggregates in Daphnia magna. Chemosphere 2010, 78, 209–215. [Google Scholar] [CrossRef]
  42. Monai, M.; Montini, T.; Fornasiero, P. Brookite: Nothing New Under the Sun? Catalysts 2017, 7, 304. [Google Scholar] [CrossRef]
  43. Niu, X.; Du, Y.; Liu, J.; Li, J.; Sun, J.; Guo, Y. Facile Synthesis of TiO2/MoS2 Composites with Co-Exposed High-Energy Facets for Enhanced Photocatalytic Performance. Micromachines 2022, 13, 1812. [Google Scholar] [CrossRef]
  44. Eguía-Barrio, A.; Castillo-Martínez, E.; Zarrabeitia, M.; Muñoz-Márquez, M.A.; Casas-Cabanas, M.; Rojo, T. Structure of H2Ti3O7 and its evolution during sodium insertion as anode for Na ion batteries. Phys. Chem. Chem. Phys. 2015, 17, 6988–6994. [Google Scholar] [CrossRef]
  45. Dambournet, D.; Belharouak, I.; Amine, K. Tailored Preparation Methods of TiO2 Anatase, Rutile, Brookite: Mechanism of Formation and Electrochemical Properties. Chem. Mater. 2010, 22, 1173–1179. [Google Scholar] [CrossRef]
  46. Brydson, R.; Sauer, H.; Engel, W.; Thomass, J.M.; Zeitler, E.; Kosugi, N.; Kuroda, H. Electron energy loss and X-ray absorption spectroscopy of rutile and anatase: A test of structural sensitivity. J. Phys. Condens. Matter. 1989, 1, 797. [Google Scholar] [CrossRef]
  47. Ramos-Guivar, J.A.; Zarria-Romero, J.Y.; Canchanya-Huaman, Y.; Guerra, J.A.; Checca-Huaman, N.R.; Castro-Merino, I.L.; Passamani, E.C. Raman, TEM, EELS, and Magnetic Studies of a Magnetically Reduced Graphene Oxide Nanohybrid following Exposure to Daphnia magna Biomarkers. Nanomaterials 2022, 12, 1805. [Google Scholar] [CrossRef] [PubMed]
  48. Wang, Y.; Gao, X.; Cheng, Y.; Peijnenburg, W.J.; Dong, Z.; Fan, W. Nano-TiO2 modifies heavy metal bioaccumulation in Daphnia magna: A model study. Chemosphere 2023, 312, 137263. [Google Scholar] [CrossRef] [PubMed]
  49. Hartmann, N.B.; Legros, S.; Von der Kammer, F.; Hofmann, T.; Baun, A. The potential of TiO2 nanoparticles as carriers for cadmium uptake in Lumbriculus variegatus and Daphnia magna. Aquat. Toxicol. 2012, 118, 1–8. [Google Scholar] [CrossRef] [PubMed]
Figure 1. Rietveld refinement of X-ray diffractograms obtained for (A) TiO2 NPs and (B) TiO2 NWs. The black line corresponds to experimental data, red line to calculated diffractogram, and the blue line is the residual data between the experimental and calculated data. Green vertical lines indicate the Bragg’s positions and Miller indices which are given by vertical number in parentheses. Blue numbers between parentheses are assigned to brookite phase.
Nanomaterials 13 00927 g001
Figure 2. Fit to experimental µ-Raman spectrum for TiO2 NWs sample. The laser power over the sample was of 8.3 mW. Lorentzian subcomponents were highlighted with different colors and main Raman modes are indicated on the top of each identified active optical mode. B indicates the brookite phase.
Nanomaterials 13 00927 g002
Figure 3. Zeta potential measurements as a function of pH for TiO2 samples. (A) First measurement for TiO2 NPs, (B) second measurement for TiO2 NPs, (C) first measurement for TiO2 NWs, (D) second measurement for TiO2 NWs.
Nanomaterials 13 00927 g003
Figure 4. (a) TEM image of the TiO2 NPs before the ecotoxicity experiment, (b) 10 nm zoomed TEM image, (c) normal distribution of the measurements of the TiO2 NPs from before the ecotoxicity experiment, (d) TEM image of the TiO2 NPs after the ecotoxicity experiment, (e) 5 nm zoomed TEM image, and (f) normal distribution of the TiO2 NPs measurements after the ecotoxicity experiment.
Nanomaterials 13 00927 g004
Figure 5. (a) TEM image of the TiO2 NWs before the ecotoxicity experiment, (b) TEM image of the TiO2 NWs after the ecotoxicity experiment. (c) Log-normal distribution of the TiO2 NWs length measurements before the experiment of ecotoxicity and (d) log-normal distribution of the measurements of the length of the TiO2 NWs after the ecotoxicity experiment. (e) Lorentz distribution of the measurements of the diameter of the TiO2 NWs before the ecotoxicity experiment and (f) normal distribution of the measurements of the diameter of the TiO2 NWs after the ecotoxicity experiment.
Nanomaterials 13 00927 g005
Figure 6. (A) Mortality (%) for the TiO2 NP sample vs. concentration and (B) probit of mortality vs. log10 concentration (right) fitted with a non-linear cubic function. Goodness of fit ( R 2 = 1.0). (C) Mortality (%) for the TiO2 NWs sample against concentration and (D) mortality probit vs. log10 concentration (right) fitted with a nonlinear parabolic function. R 2 = 0.859.
Nanomaterials 13 00927 g006
Figure 7. Boxplot for all morphological parameters (tail, body, heart, antenna, and eye) measured after TiO2 NPs exposure. Numbers above boxes are their p-values, with those written in bold numbers indicating significance (p-value < 0.05).
Nanomaterials 13 00927 g007
Figure 8. Box plot for all morphological parameters (tail, body, heart, antenna, and eye) measured after TiO2 NWs exposure. Numbers above boxes are their p-values, with those written in bold numbers indicating significance (p-value < 0.05).
Nanomaterials 13 00927 g008
Figure 9. (A) D. magna individual from the negative control, (B) D. magna individual exposed to 37.5 mg L 1 of TiO2 NPs, (C) D. magna individual exposed to 75 mg L 1 of TiO2 NPs, (D) D. magna individual exposed to 150 mg L 1 of TiO2 NPs, (E) D. magna individual exposed to 300 mg L 1 of TiO2 NPs, and (F) D. magna individual exposed to 600 mg L 1 of TiO2 NPs.
Nanomaterials 13 00927 g009
Figure 10. (A) D. magna individual from the negative control, (B) D. magna individual exposed to 50 mg L 1 TiO2 NWs, (C) D. magna individual exposed to 100 mg L 1 TiO2 NWs, (D) D. magna exposed to 200 mg L 1 TiO2 NWs, (E) D. magna individual exposed to 400 mg L 1 TiO2 NWs, and (F) D. magna exposed to 800 mg L 1 TiO2 NWs.
Nanomaterials 13 00927 g010
Figure 11. SAED pattern for before (a) and after (b) TiO2 NPs. SAED pattern for before (c) and after (d) TiO2 NWs. The inset (bottom-right) in blue indicates the indexed rotational average pattern for the identified crystalline phases before and after ecotoxicological experiments.
Nanomaterials 13 00927 g011
Figure 12. (a) SEM image, (b) EDS mapping, (c,d) elemental (Ti,O) EDS images for before TiO2 NPs, (e) SEM image, (f) EDS mapping, (g,h) elemental (Ti,O) EDS images for after TiO2 NPs, (i) SEM image, (j) EDS mapping, (k,l) elemental (Ti,O) EDS images for before TiO2 NWs, (m) SEM image, (n) EDS mapping, and (o,p) elemental (Ti,O) EDS images for after TiO2 NWs.
Nanomaterials 13 00927 g012
Figure 13. (a) Ti-L2,3 edge and (b) O-K edge in the EELS spectra for before and after TiO2 NPs. (c) Ti-L2,3 edge and (d) O-K edge in the EELS spectra for before and after TiO2 NWs. The upper letters (A, B, C, and D) indicate the characteristic energy loss positions (eV).
Nanomaterials 13 00927 g013
Table 1. Vibrational Raman bands of the TiO2 NWs sample.
Crystalline PhaseRaman Shift (cm−1)Vibrational Assignment
H2Ti3O7201.34Vibration mode (stretching)
H2Ti3O7280.24Phonic mode
H2Ti3O7457.11Vibration mode (Bending)
H2Ti3O7653.89Vibration mode (stretching)
Table 2. TEM parameters obtained for the TiO2 samples after fitting the data with normal and log-normal distribution. <D> is the mean particle size.
Samples<D> (nm)Standard DeviationPolydispersity
Before TiO2 NPs15.15.90.39
After TiO2 NPs16.56.40.39
Before TiO2 NWs5.6 (thickness)2.30.42
74.6 (length)48.30.65
After TiO2 NWs6.6 (thickness)2.30.35
79.2 (thickness)46.40.59
Table 3. LC50 values for TiO2 nanosystems exposed to D. magna. (n.d. = Not determined).
NanosystemMean Particle Size in Aqueous MediaNPs SourceExposition Time (h)LC50 (mg L−1)Reference
TiO2 NPsn.d.Synthesized in the lab48>100[8]
TiO2 NPs15–500 nmCommercial48>200[10]
TiO2 NPsn.d.Synthesized in the lab961.8[37]
TiO2 NPs0.5–70 µmCommercial48>100[38]
TiO2 NPs130 nmCommercial24166This work
TiO2 NWs118 nmCommercial24157This work
Table 4. Quantitative weight composition obtained from EDS mapping.
SampleTi (%wt)O (%wt)
Before TiO2 NPs59.1 (1.5)40.9 (1.5)
After TiO2 NPs72.3 (0.2)27.7 (0.2)
Before TiO2 NWs55.7 (1.5)44.3 (1.5)
After TiO2 NWs50.3 (0.4)49.7 (0.4)
Disclaimer/Publisher’s Note: The statements, opinions and data contained in all publications are solely those of the individual author(s) and contributor(s) and not of MDPI and/or the editor(s). MDPI and/or the editor(s) disclaim responsibility for any injury to people or property resulting from any ideas, methods, instructions or products referred to in the content.

