Article

Polyethylenimine-Coated Ultrasmall Holmium Oxide Nanoparticles: Synthesis, Characterization, Cytotoxicities, and Water Proton Spin Relaxivities

1
Department of Chemistry, College of Natural Sciences, Kyungpook National University, Taegu 41566, Korea
2
Division of RI-Convergence Research, Korea Institute of Radiological and Medical Sciences (KIRAMS), Seoul 01817, Korea
3
Department of Medical & Biological Engineering, Kyungpook National University, Taegu 41944, Korea
4
Department of Molecular Medicine, School of Medicine, Kyungpook National University, Taegu 41944, Korea
5
Department of Biology Education, Teachers’ College, Kyungpook National University, Taegu 41566, Korea
*
Authors to whom correspondence should be addressed.
Nanomaterials 2022, 12(9), 1588; https://doi.org/10.3390/nano12091588
Submission received: 27 March 2022 / Revised: 29 April 2022 / Accepted: 3 May 2022 / Published: 7 May 2022
(This article belongs to the Special Issue Advanced Nanomaterials for Bioimaging)

Abstract

:
Water proton spin relaxivities, colloidal stability, and biocompatibility of nanoparticle magnetic resonance imaging (MRI) contrast agents depend on surface-coating ligands. In this study, hydrophilic and biocompatible polyethylenimines (PEIs) of different sizes (Mn = 1200 and 60,000 amu) were used as surface-coating ligands for ultrasmall holmium oxide (Ho2O3) nanoparticles. The synthesized PEI1200- and PEI60000-coated ultrasmall Ho2O3 nanoparticles, with an average particle diameter of 2.05 and 1.90 nm, respectively, demonstrated low cellular cytotoxicities, good colloidal stability, and appreciable transverse water proton spin relaxivities (r2) of 13.1 and 9.9 s−1mM−1, respectively, in a 3.0 T MR field with negligible longitudinal water proton spin relaxivities (r1) (i.e., 0.1 s−1mM−1) for both samples. Consequently, for both samples, the dose-dependent contrast changes in the longitudinal (R1) and transverse (R2) relaxation rate map images were negligible and appreciable, respectively, indicating their potential as efficient transverse T2 MRI contrast agents in vitro.

Graphical Abstract

1. Introduction

Nanoparticles are ideal materials for use as negative magnetic resonance imaging (MRI) contrast agents because they have sufficient magnetic moments at room temperature to generate considerable local magnetic field fluctuations to induce transverse (T2) water proton spin relaxations [1,2,3,4]. Consequently, they can provide negative (or darker) contrasts in MR images. However, molecular agents containing one metal ion at the chelating coordination center have paramagnetic moments that are extremely small. Their small paramagnetic moments do not induce sufficient T2 water proton spin relaxations to provide negative contrasts in MR images at typical injection concentrations [4,5].
Certain lanthanide oxide nanoparticles are suitable MRI contrast agents because their paramagnetic moments at room temperature are sufficiently high to induce water proton spin relaxations [6,7,8,9,10,11,12], especially at high MR fields [10,11,13,14]. Their magnetic moments are attributed to 4f-electron spin-orbital or spin motions [15]. The 4f-electrons have compact 4f-orbitals and are shielded by 5s- and 5p-orbitals; hence, these magnetic moments are almost unaffected by surface effects such as coating ligand and particle size [16]. Therefore, magnetic moments (unit: emu/g) of lanthanide oxide nanoparticles are nearly independent of the coating ligand and particle size. Importantly, because they are almost independent from particle size, lanthanide oxide nanoparticles can function as MRI contrast agents even at ultrasmall particle diameters (<3 nm) at which nanoparticles are excretable via the renal system as in the case of molecular agents [17,18].
In this study, ultrasmall holmium oxide (Ho2O3) nanoparticles were examined because of their unique magnetic properties obtained from Ho3+ (5I8) [15]. Ho3+ is a lanthanide ion with high magnetic moment [15]. Thus, ultrasmall Ho2O3 nanoparticles have an appreciable magnetic moment at room temperature [9,10,11]. Interestingly, because of the contribution of the fast 4f-electron orbital motion to the magnetic moment of Ho3+ and the mismatch between the fast 4f-electron motion of Ho3+ and slow water proton spin motion, nanoparticles can exclusively cause only T2 water proton spin relaxations with negligible longitudinal (T1) water proton spin relaxations [19]. Hence, the nanoparticles can only cause negative contrasts in MR images, thus acting as efficient T2 MRI contrast agents [2].
In MRI contrast agents, surface-coating ligands play an important role because they affect the water proton spin relaxivities, colloidal stability, and biocompatibility of contrast agents [7,20,21,22,23]. Compared with small molecules, polymers have many hydrophilic groups for binding to nanoparticles; thus, they can show improved colloidal stability, better biocompatibility, and thicker coating for the nanoparticles [20,23]. In this study, polyethylenimine (PEI) was used as a surface-coating ligand because it has many hydrophilic primary amines useful for binding to nanoparticles [24,25,26,27,28,29,30] and demonstrates good biocompatibility [31,32]. PEI has many secondary and tertiary amine groups that enhance the hydrophilicity of the nanoparticles. Therefore, PEI has been extensively used as a surface-coating ligand for various nanoparticles in biomedical applications such as drug delivery [33,34], imaging [35,36,37], cancer cell separation [38], cancer therapy [39,40], and gene delivery [41,42,43,44,45,46].
Herein, PEI-coated ultrasmall Ho2O3 nanoparticles were synthesized using a one-pot polyol method. In previous studies [9,10,11], D-glucuronic acid- and polyacrylic acid-coated ultrasmall Ho2O3 nanoparticles had been investigated as efficient T2 MRI contrast agents. However, physicochemical properties such as zeta potentials, hydrodynamic diameters, colloidal stability, and cellular cytotoxicities and MRI properties such as water proton spin relaxivities depend on surface-coating ligands. Therefore, PEI polymers were used as surface-coating ligands in this study to explore the physicochemical properties and water proton spin relaxivities of PEI-coated ultrasmall Ho2O3 nanoparticles. This study will enhance the importance of surface-coating ligands in T2 MRI contrast agents. PEI polymers of different sizes, namely, PEI1200 and PEI60000 (Mn = 1200 and 60,000 amu, respectively) were used as surface coating ligands. We characterized PEI-coated ultrasmall Ho2O3 nanoparticles using multiple experimental techniques. Biocompatibility was verified by cellular cytotoxicity measurements. To explore the potential of synthesized nanoparticles as efficient transverse T2 MRI contrast agents in vitro, longitudinal (r1) and transverse (r2) water proton spin relaxivities and longitudinal (R1) and transverse (R2) relaxation rate map images were obtained in a 3.0 T MR field.

2. Materials and Methods

2.1. Chemicals

Chemicals, such as Ho(NO3)3∙5H2O (99.9%), NaOH (>99.9%), triethylene glycol (TEG; 99%), PEI [50 wt.% in water, Mn = 1200 amu (Mw = 1300 amu; PEI1200) and 60,000 amu (Mw = 750,000 amu; PEI60000)], dimethyl sulfoxide (DMSO) (99.9%), and Rosewell Park Memorial Institute (RPMI)1640 culture medium were obtained from Sigma-Aldrich (Burlington, MA, USA) and used as-received. Ethanol (99.5%) was purchased from Duksan (Ansan, South Korea) and used as-received for the initial washing of nanoparticles. Triple-distilled water was used for the final washing of nanoparticles and for preparing nanoparticle suspension samples (~30 mM Ho).

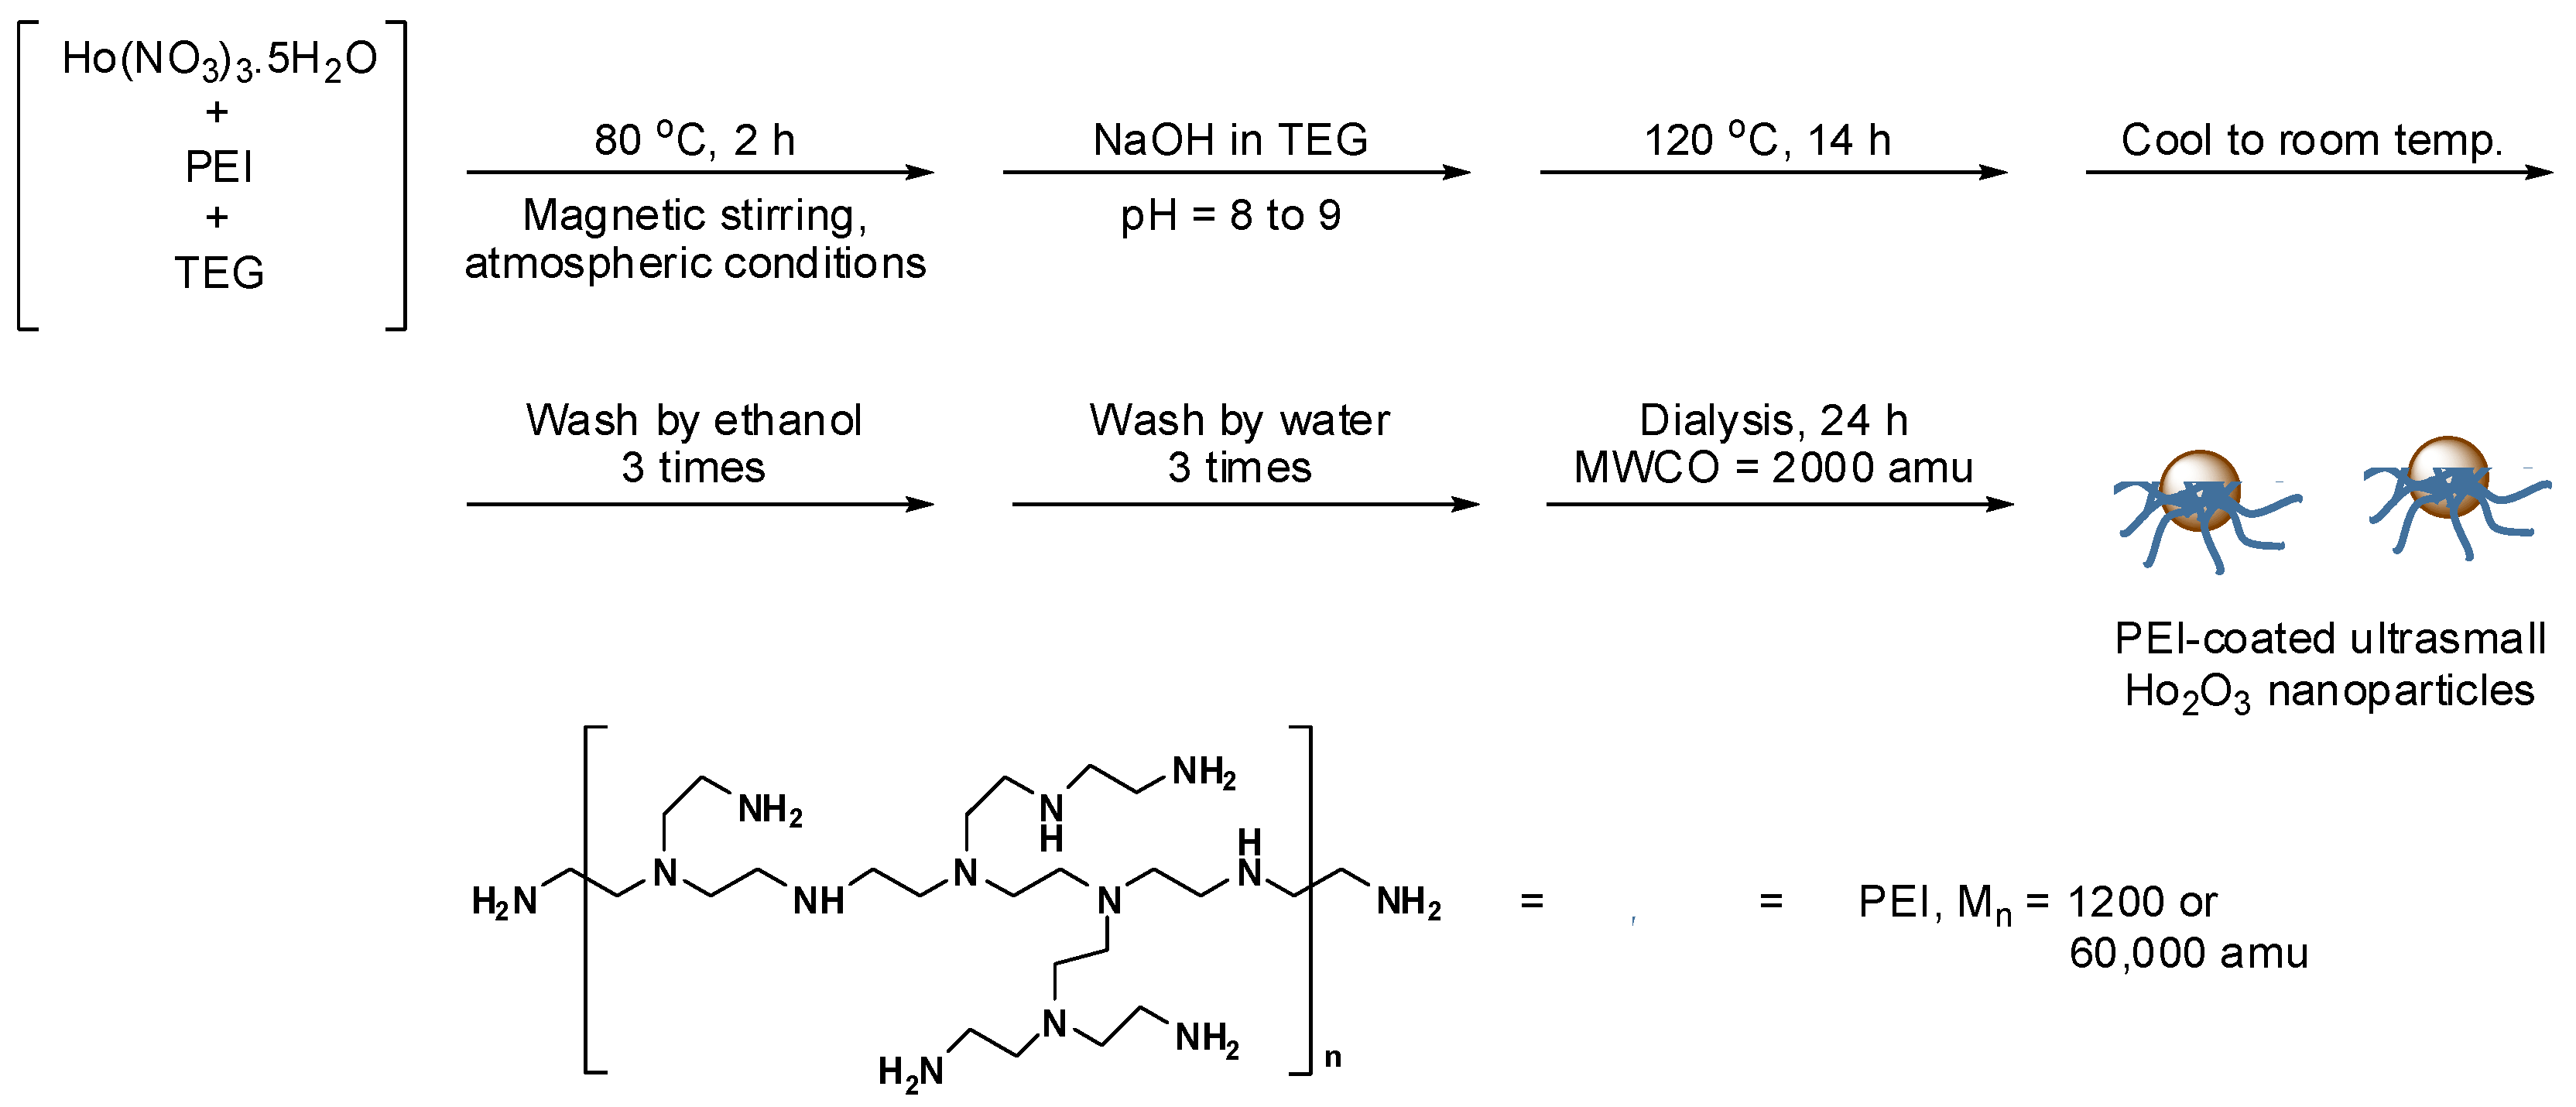
2.2. One-Pot Polyol Synthesis of PEI-Coated Ultrasmall Ho2O3 Nanoparticles

Figure 1 shows the one-pot polyol synthesis of PEI-coated ultrasmall Ho2O3 nanoparticles. In brief, 2.0 mmol of Ho(NO3)3∙5H2O and PEI (1.0 mmol of PEI1200 or 0.02 mmol of PEI60000) was dissolved in 20 mL of TEG in a three-necked round bottom flask placed inside a stirring heating mantle (MS-DMS, Misung Scientific Co. Ltd., Seoul, South Korea) at 80 °C for 2 h under normal atmospheric conditions. Separately, 7.0 mmol of NaOH was added to 15 mL of TEG at 80 °C with magnetic stirring until NaOH was completely dissolved in TEG, and the prepared NaOH solution was slowly dropped into the aforementioned precursor solution with magnetic stirring until the pH of the solution reached ~9. After the solution pH became nearly constant, the reaction temperature increased to 120 °C and was maintained at that temperature for 14 h with magnetic stirring. Then, the solution was air-cooled to room temperature. To remove the unreacted precursors, Na+, OH, PEI, and TEG from the product nanoparticles, 400 mL of ethanol was added to the product solution, which was then magnetically stirred for 10 min. The solution was then placed in a refrigerator (~4 °C) until the nanoparticles settled at the bottom of the beaker. The top transparent solution was decanted. This washing process with ethanol was repeated thrice. To remove ethanol from the product’s nanoparticles, 400 mL of triple-distilled water was added to the product solution, which was then concentrated to ~20 mL using a rotary evaporator. For additional purification of nanoparticles, the product solution was dialyzed against 1 L of triple-distilled water using a dialysis tube (molecular weight cutoff (MWCO) = ~2000 amu) for 24 h with magnetic stirring.

2.3. General Characterizations

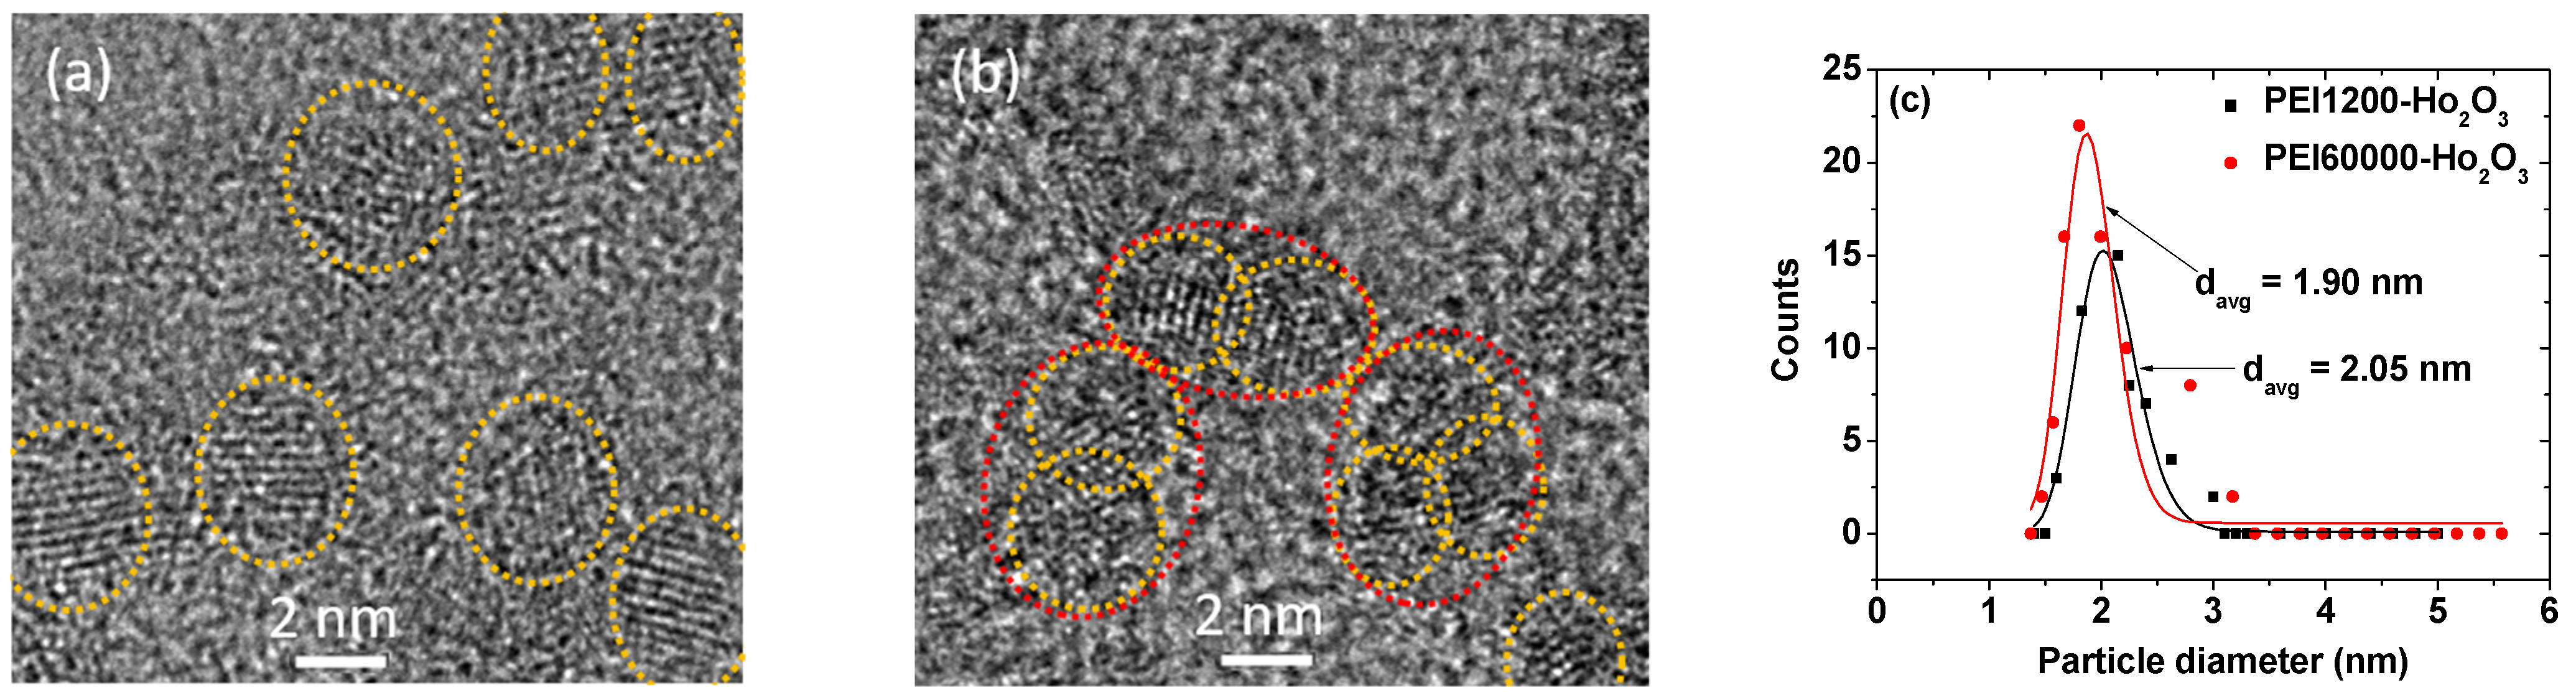
2.3.1. Particle Diameters

The particle diameter of the PEI-coated ultrasmall Ho2O3 nanoparticles was determined by high-resolution transmission electron microscopy (HRTEM) using the Titan G2 ChemiSTEM CS Probe (200 kV; FEI, Hillsboro, OR, USA). For measurements, a drop of the diluted nanoparticle sample in ethanol was dropped on a carbon film supported by a 200-mesh copper grid using a micropipette (2–20 μL, Eppendorf, Hamburg, Germany) and allowed to dry in air at room temperature. The copper grid with nanoparticles was then placed in the vacuum chamber of the microscope for characterization.

2.3.2. Metal Concentrations in the Aqueous Nanoparticle Suspension Samples

The Ho concentration of the nanoparticle suspension sample in the aqueous media was determined by inductively coupled plasma-atomic emission spectroscopy (ICP-AES) using the IRIS/AP spectrometer (Thermo Jarrell Ash Co., Waltham, MA, USA).

2.3.3. Hydrodynamic Diameters

A dynamic light scattering (DLS) particle size analyzer (Zetasizer Nano ZS, Malvern, Malvern, UK) was used to measure the hydrodynamic diameters and zeta potentials of the nanoparticle suspension samples in aqueous media (~0.5 mM Ho).

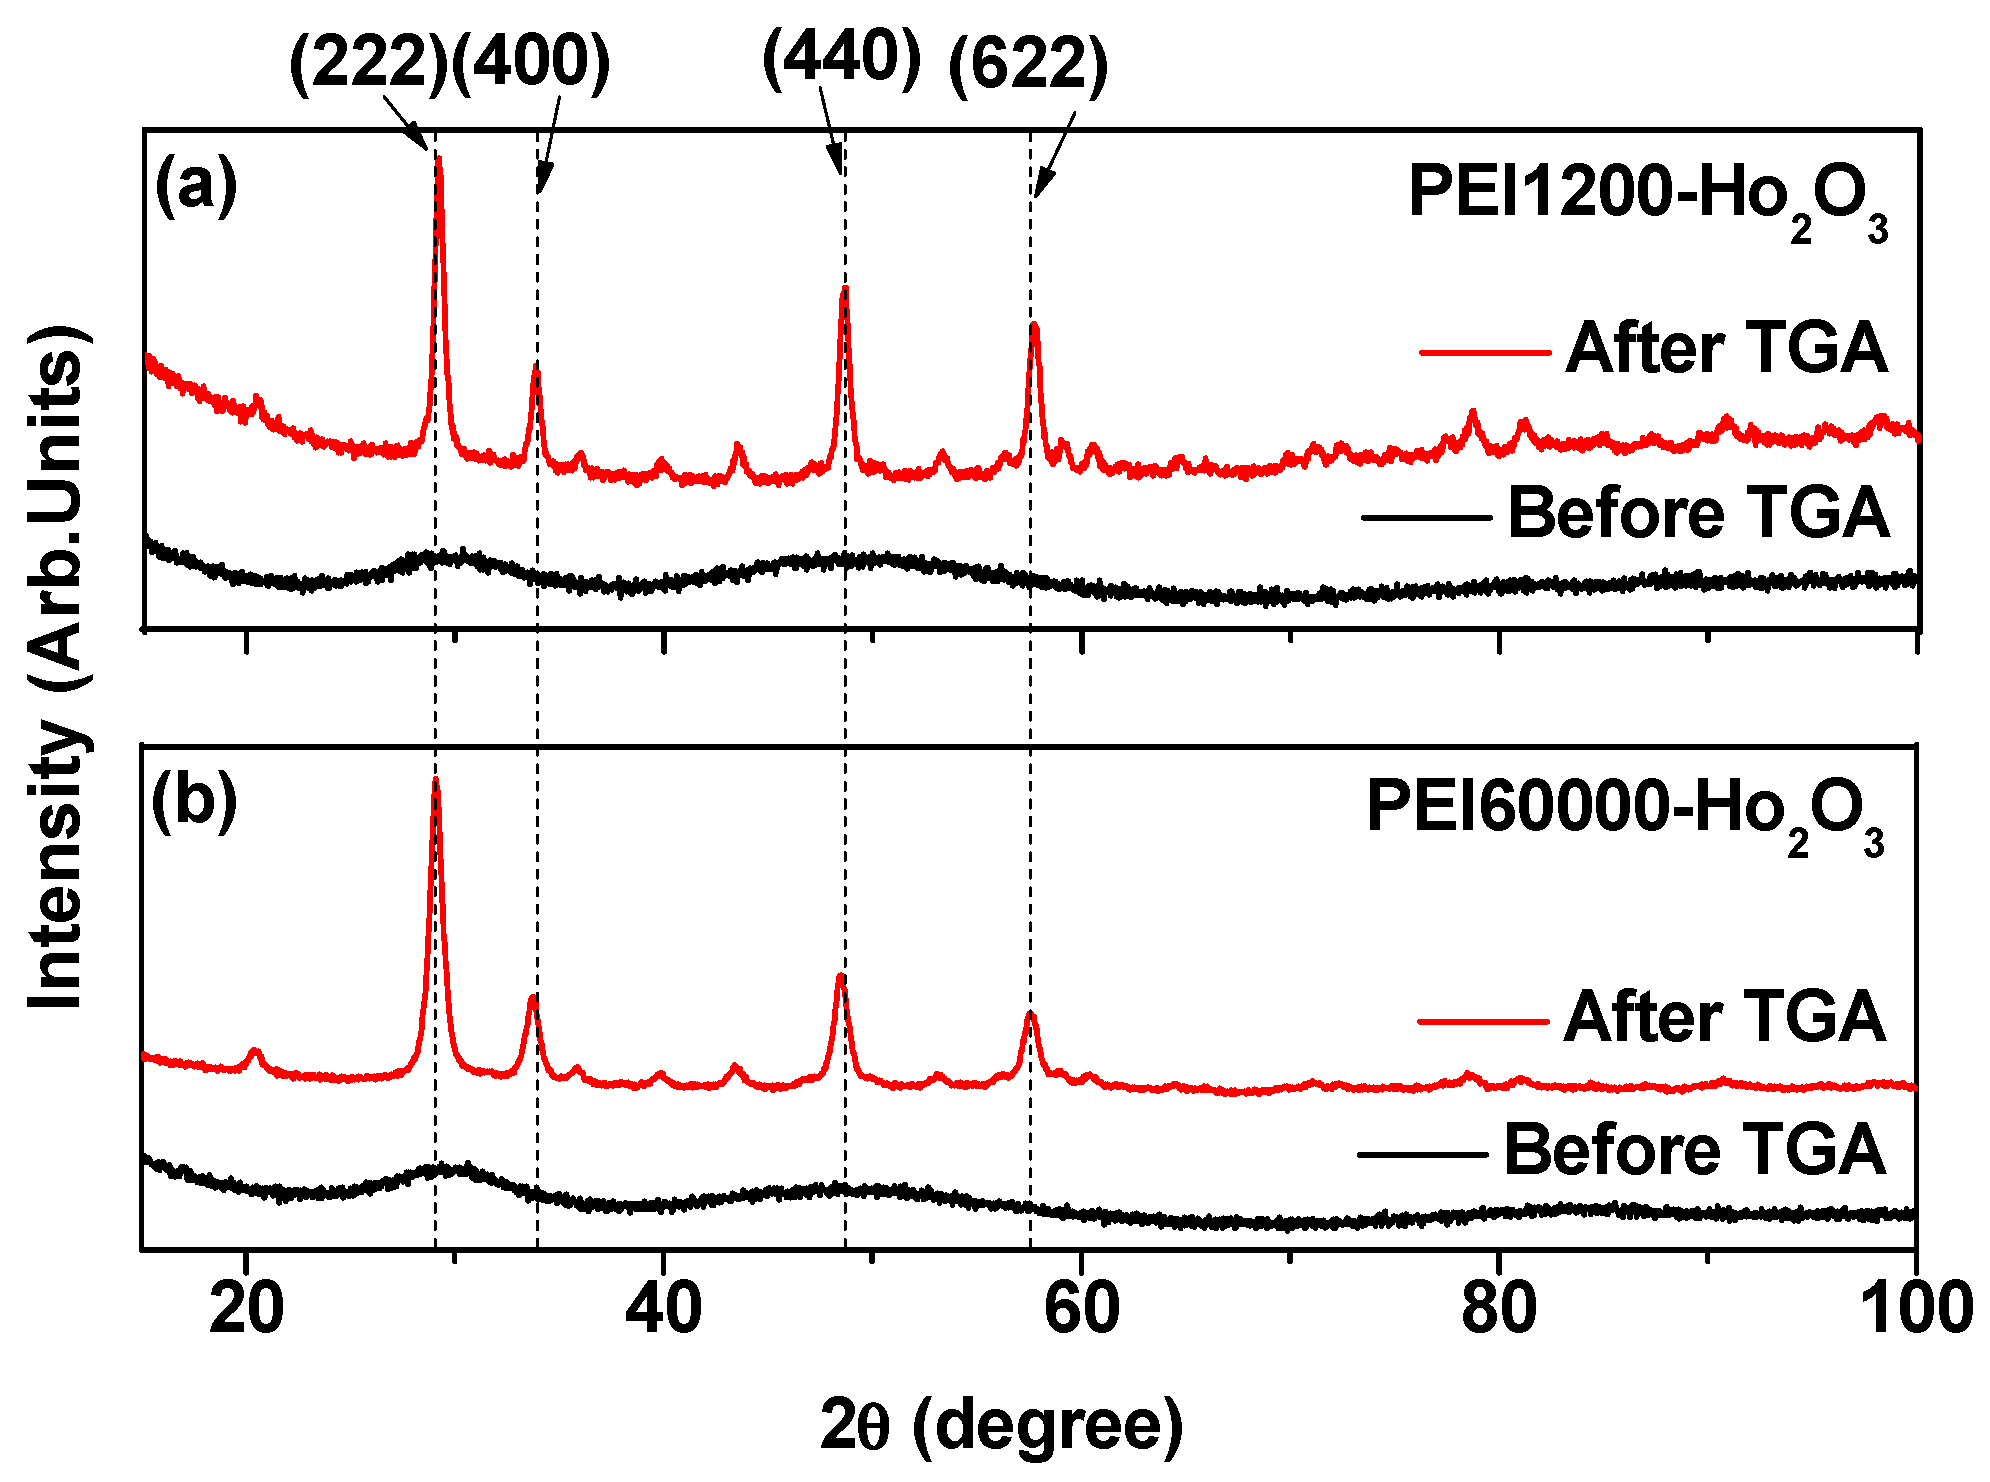
2.3.4. Nanoparticle Crystal Structures

A multi-purpose X-ray diffractometer (X’PERT PRO MRD, Philips, Amsterdam, The Netherlands) with unfiltered CuKa radiation (λ = 0.154184 nm) was used to characterize the crystal structures of the nanoparticle powder samples. The scanning step and scan range in 2θ were 0.033° and 15–100°, respectively.

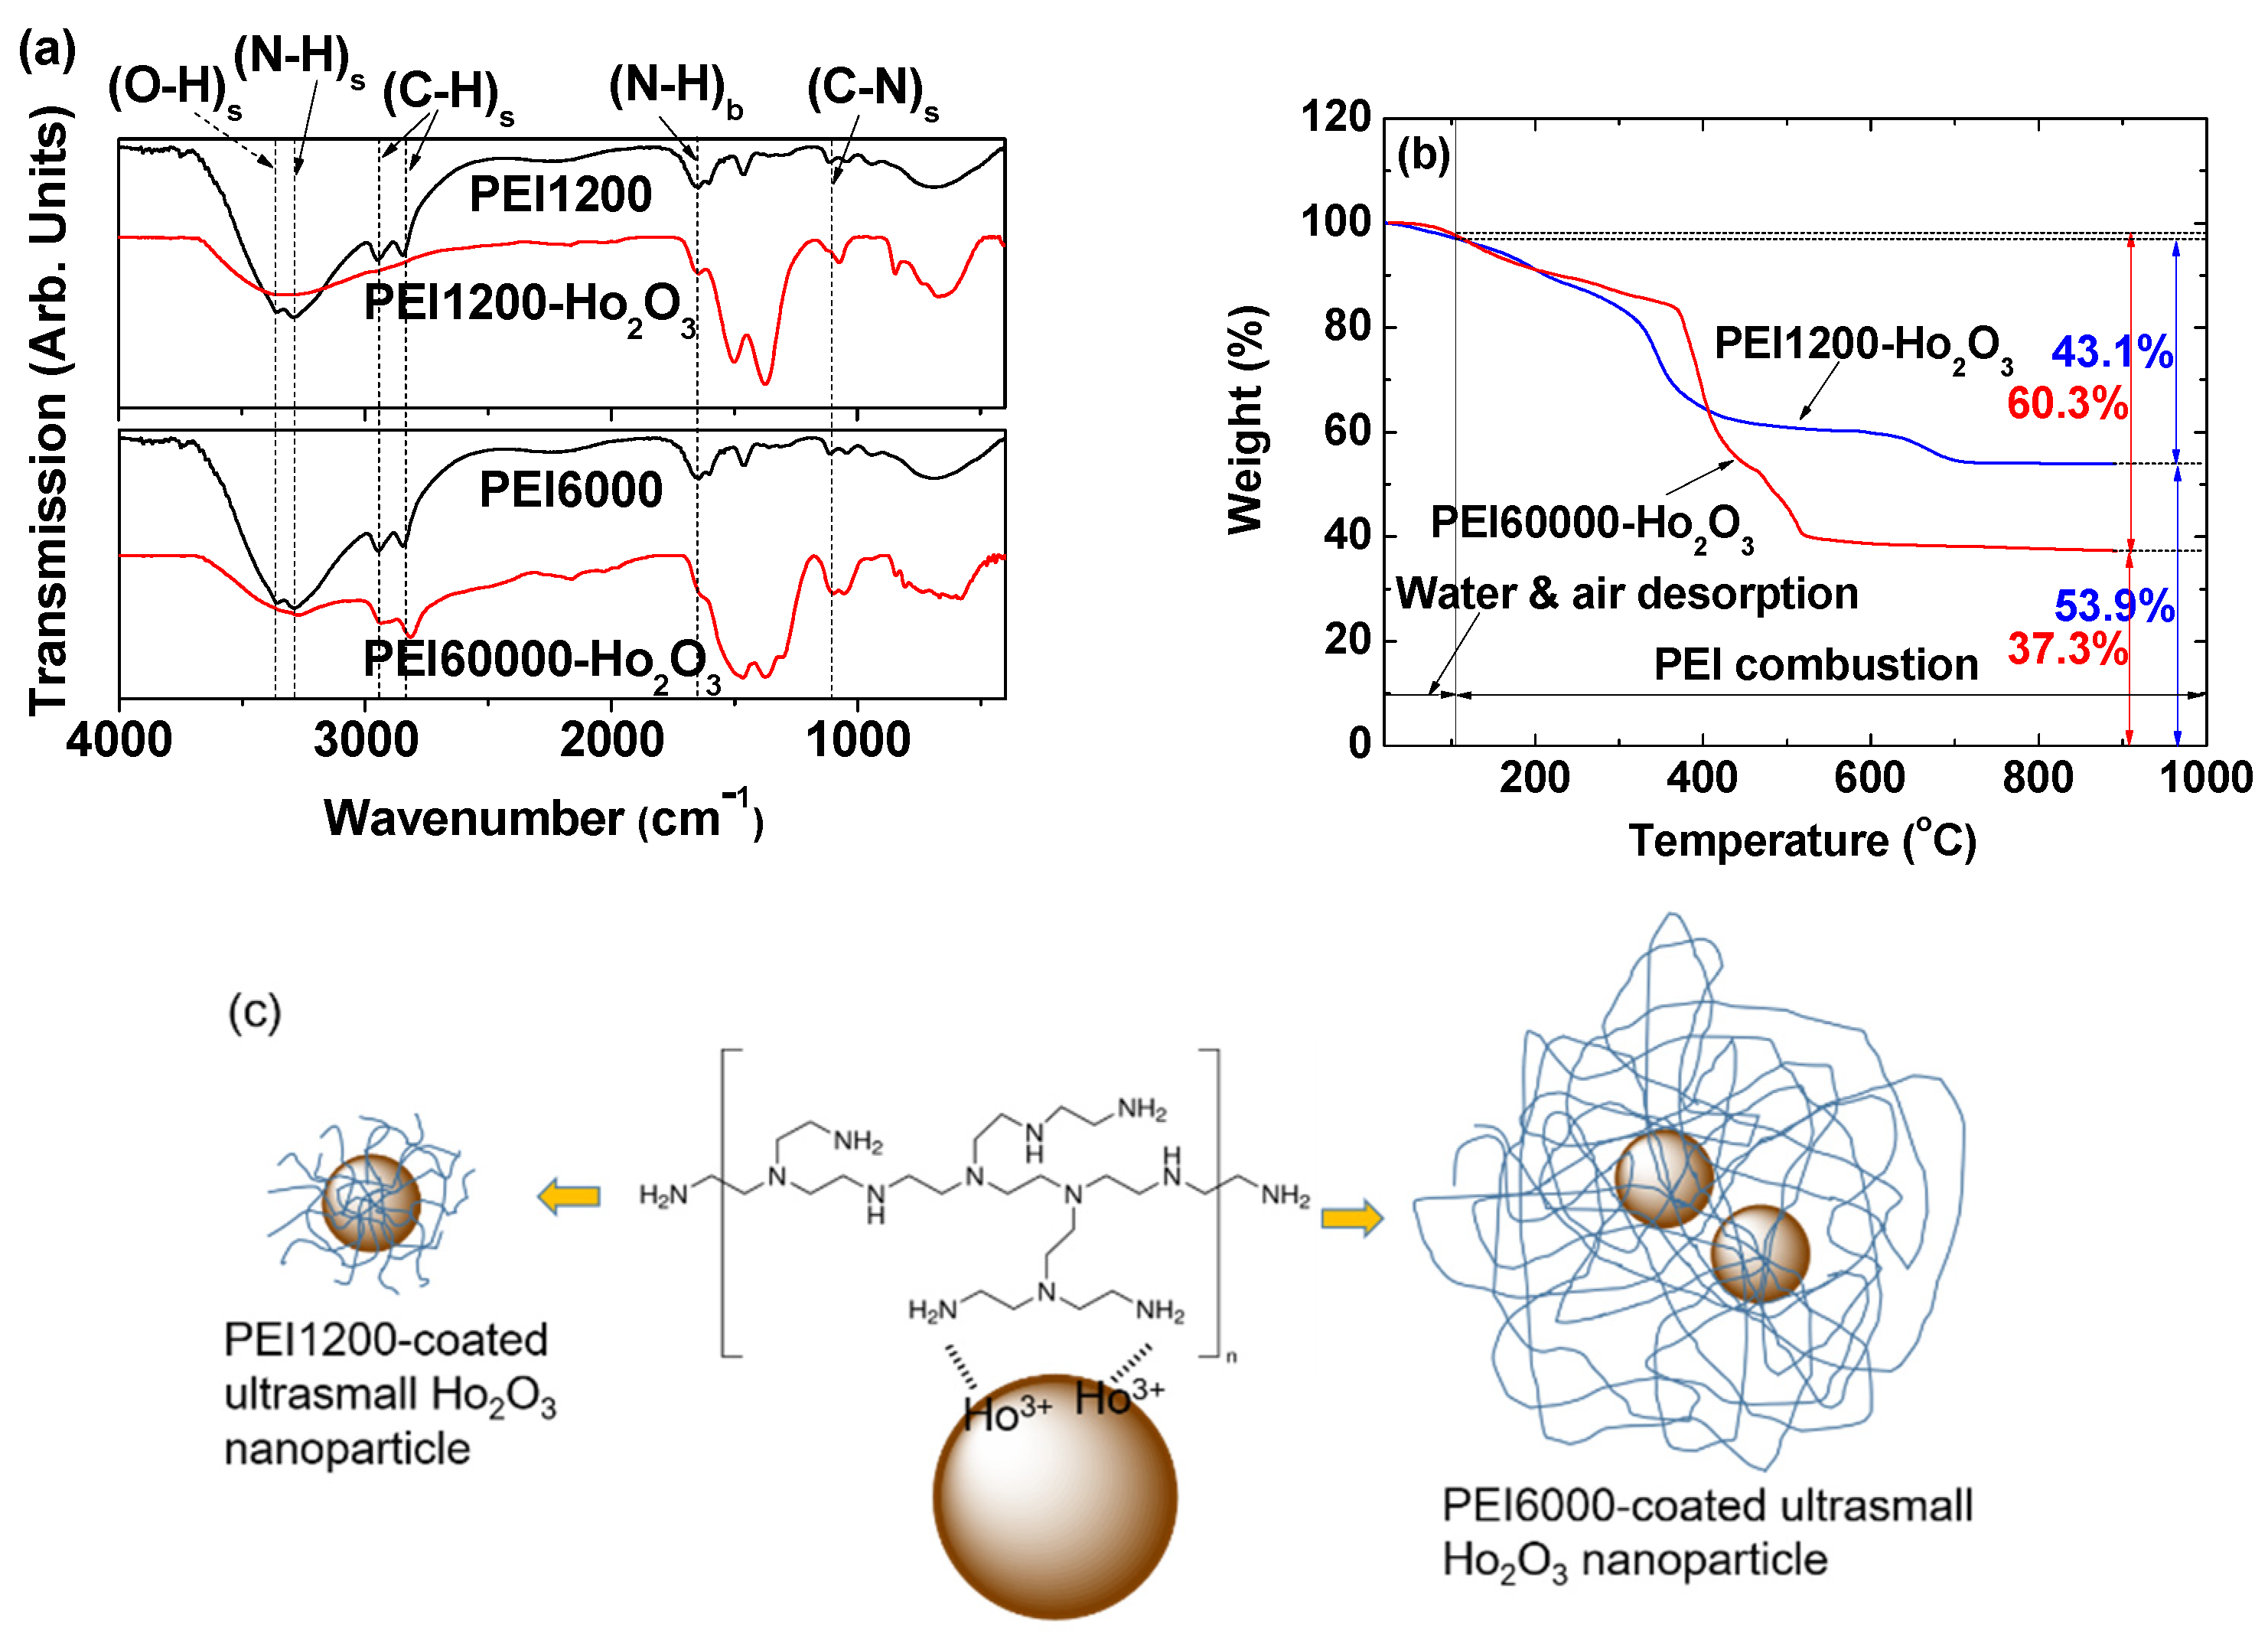
2.3.5. Surface-Coating Analyses

The attachment of PEI polymers to the Ho2O3 nanoparticles was probed by obtaining the Fourier transform infrared (FT-IR) absorption spectra (Galaxy 7020A, Mattson Instrument Inc., Madison, WI, USA) and using the powder samples pelletized with KBr. The scan range was 400–4000 cm−1. A thermogravimetric analysis (TGA) instrument (SDT-Q600, TA Instrument, New Castle, DE, USA) was used to estimate the surface-coating wt.% of ligands in the sample by recording the TGA curves between room temperature and 900 °C under air flow. The average amount of surface-coated ligands was estimated from mass loss after considering water and air desorption between room temperature and ~105 °C. Then, the amount of Ho2O3 nanoparticles in the sample was estimated from the remaining mass. After TGA, each sample was collected and subjected to X-ray diffraction (XRD) analysis.

2.3.6. Magnetic Property Measurements

A vibrating sample magnetometer (7407-S, Lake Shore Cryotronics Inc., Westerville, OH, USA) was used to characterize the magnetic properties of nanoparticle samples by recording magnetization (M) versus applied field (H) (or M−H) curves (−2.0 T ≤ H ≤ 2.0 T) at 300 K. The measurements were performed using powder samples of 20–30 mg; the net M value of each sample (i.e., only the Ho2O3 nanoparticles without the PEI coating) was estimated using the net mass of Ho2O3 nanoparticles obtained from the TGA curve.

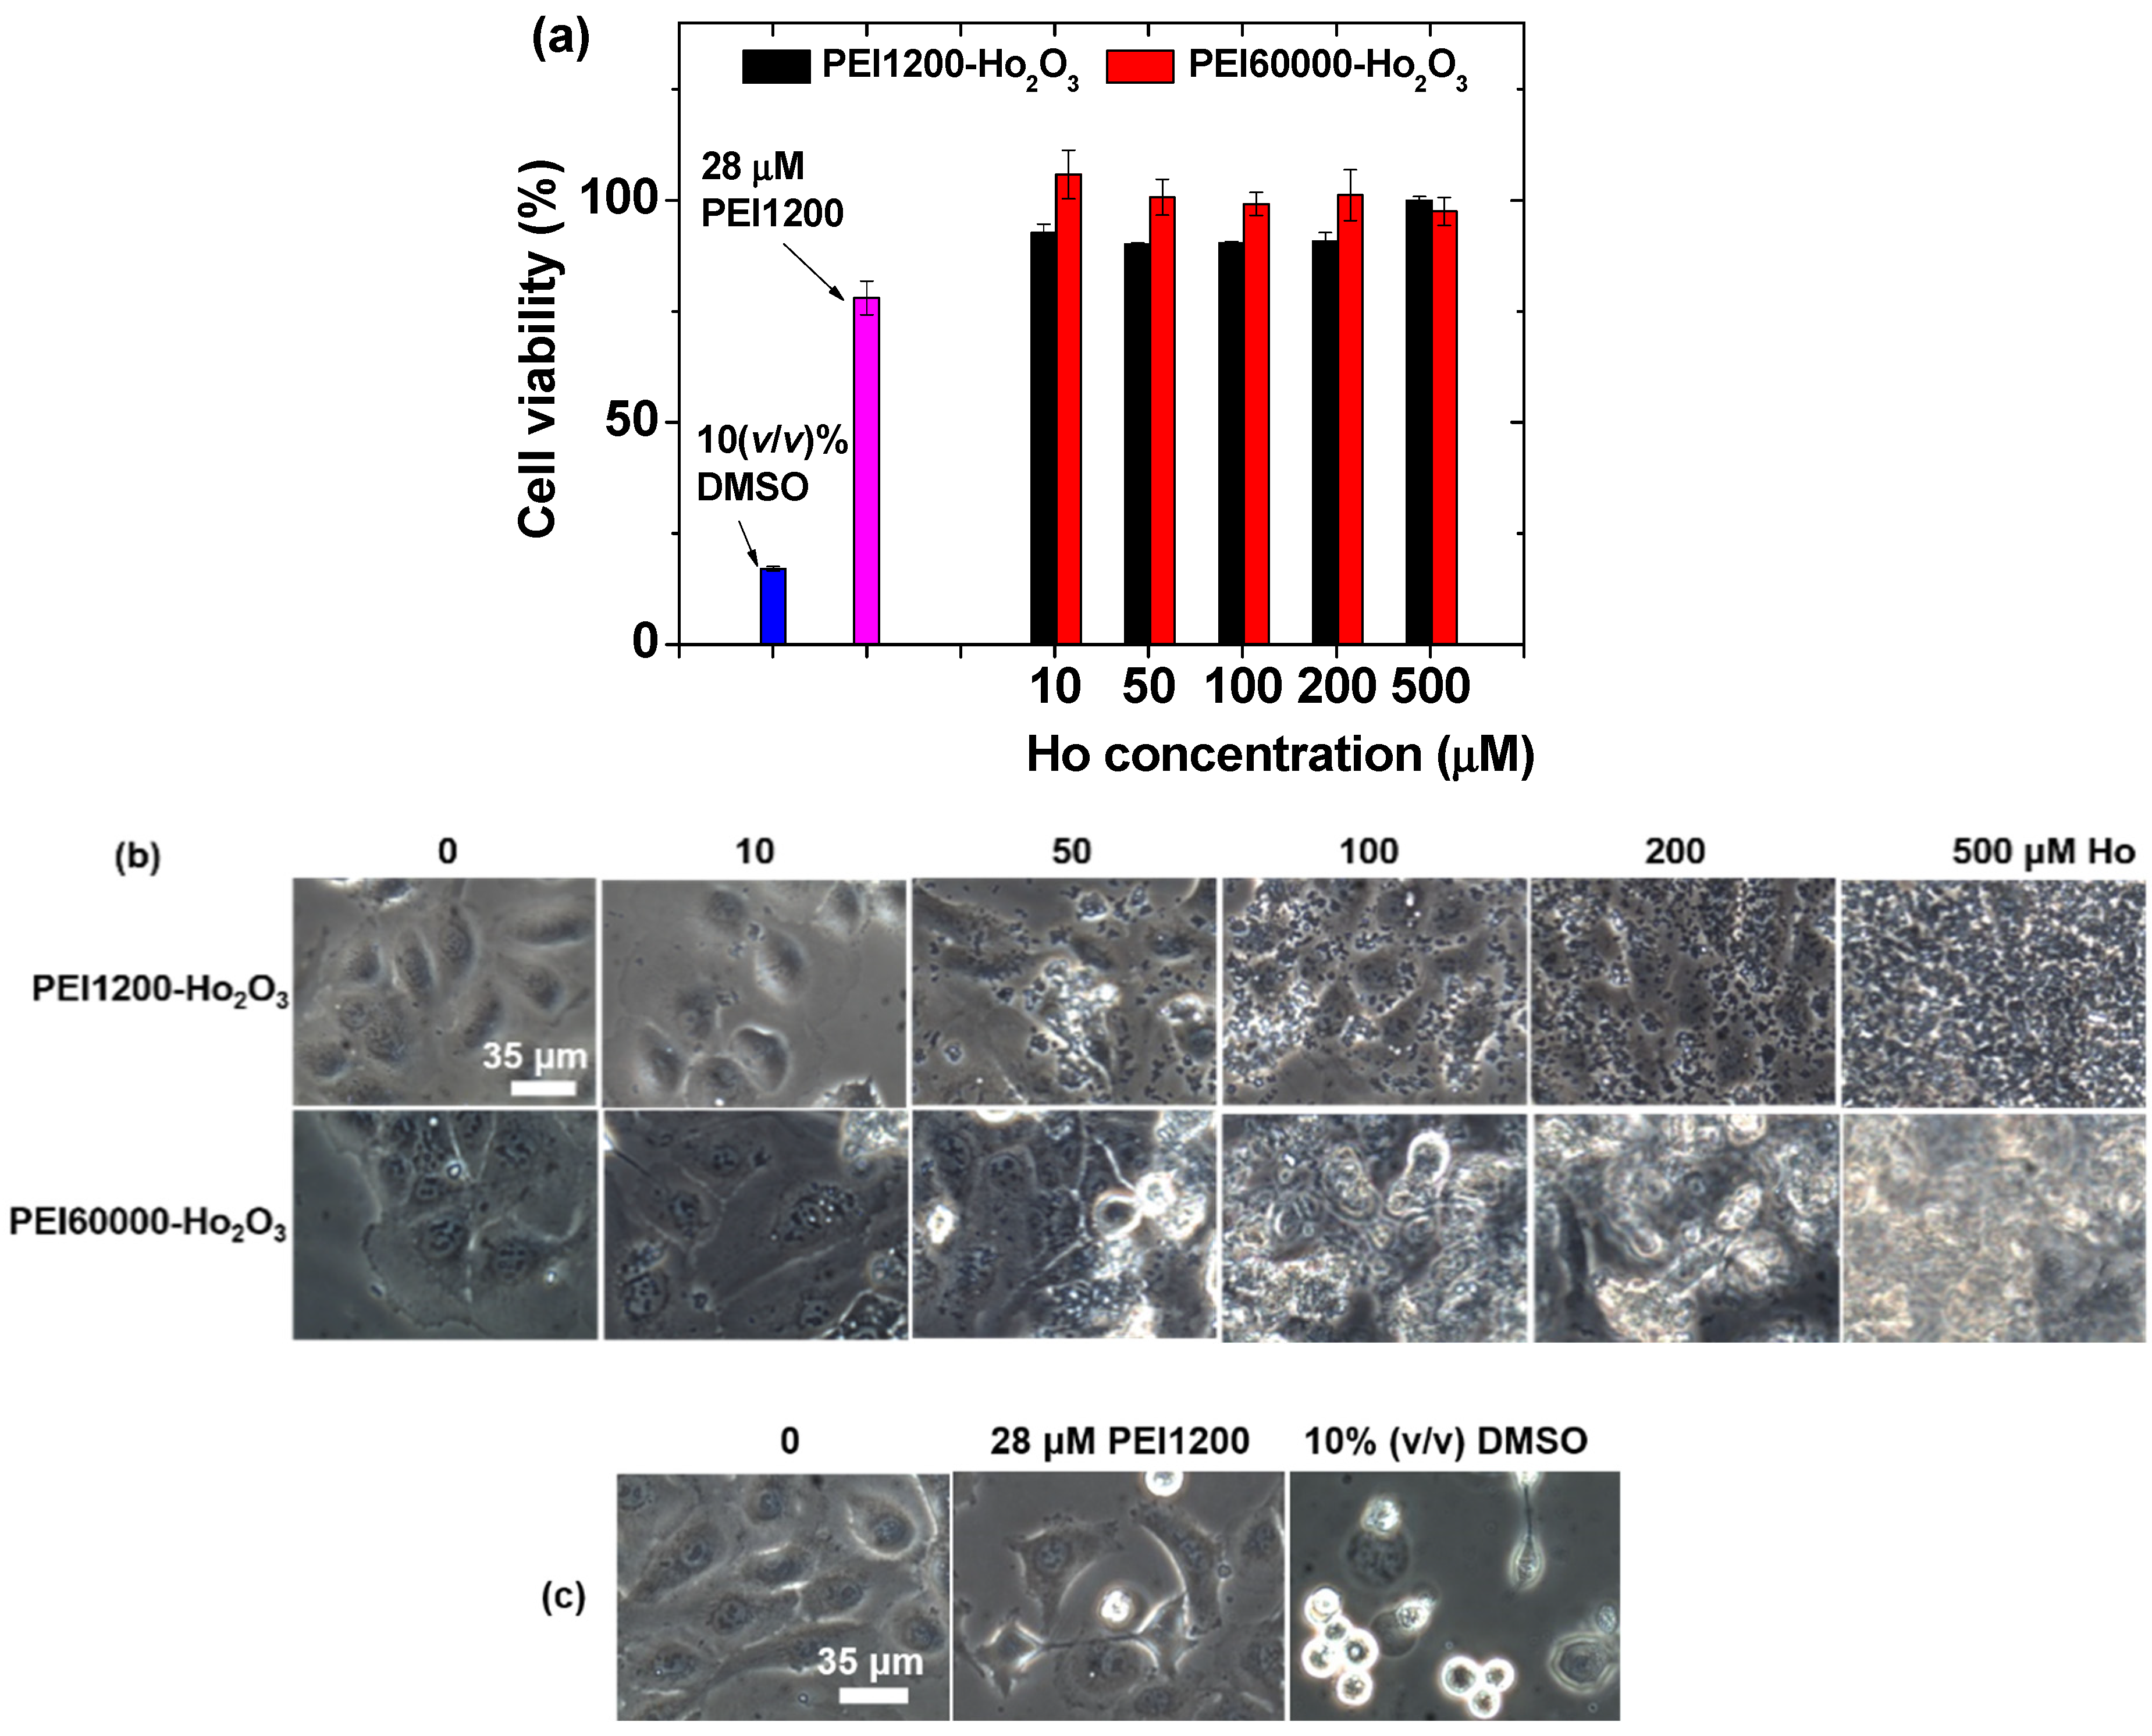
2.4. In Vitro Cellular Cytotoxicity Measurements

The in vitro cellular cytotoxicities of PEI-coated nanoparticles were measured using the CellTiter-Glo Luminescent Cell Viability Assay (Promega, Madison, WI, USA). The intracellular adenosine triphosphate was quantified using a Victor 3 luminometer (Perkin Elmer, Waltham, MA, USA). The human prostate cancer (DU145) cell line (Korean Cell Line Bank, Seoul, Korea) was used. The RPMI1640 was used as a cell culture medium. The cells were seeded on a separate 24-well cell culture plate and incubated for 24 h. Five test sample solutions (10, 50, 100, 200, and 500 μM Ho) were prepared by diluting the concentrated original nanoparticle suspension samples with a sterile phosphate-buffered saline solution and 2 mL aliquots were used to treat the cells, which were subsequently incubated for 48 h. Cell viabilities were measured thrice to obtain the average cell viabilities, which were then normalized in terms of the viability of untreated control cells (0.0 mM Ho).

2.5. Water Proton Spin Relaxivity Measurements

T1 and T2 water proton spin relaxation times and R1 and R2 map images were measured using a 3.0 T MRI scanner (GE 3.0 T Signa Advantage, GE Medical Systems, Chicago, IL, USA). Aqueous dilute solutions (1, 0.5, 0.25, 0.125, and 0.0625 mM Ho) were prepared by diluting the concentrated aqueous nanoparticle suspension samples (~30 mM Ho) with triple-distilled water. These dilute solutions were used to obtain both T1 and T2 relaxation times and R1 and R2 map images. Then, r1 and r2 water proton spin relaxivities were estimated from the slopes of the plots of the inverse relaxation times 1/T1 and 1/T2 versus Ho concentration, respectively. T1 relaxation time measurements were performed using an inversion recovery method. In this method, the inversion time (TI) was varied at 3.0 T, and the MR images were acquired at 34 TI values in the range of 50−1750 ms. Then, T1 relaxation times were obtained from the nonlinear least-square fits to the measured signal intensities at multiple TI values. The parameters used in T1 relaxation time measurements were as follows: slice thickness = 8 mm, repetition time (TR) = 2000 ms, echo time (TE) = 28 ms, echo train length (ETL) = 17, flip angle = 120°, matrix size = 320 × 256, and field of view (FOV) = 250 × 200 mm. For T2 relaxation time measurements, the Carr–Purcell–Meiboom–Gill pulse sequence was used for multiple spin-echo measurements. Then, 32 images were acquired at 32 TE values in the range of 15–480 ms. T2 relaxation times were obtained from the nonlinear least-square fits to the mean pixel values for the multiple spin-echo measurements at multiple TE values. The parameters used in T2 relaxation time measurements were as follows: slice thickness = 8 mm, TR = 2000 ms, ETL = 1, flip angle = 180°, matrix size = 320 × 256, and FOV = 250 × 200 mm.

3. Results

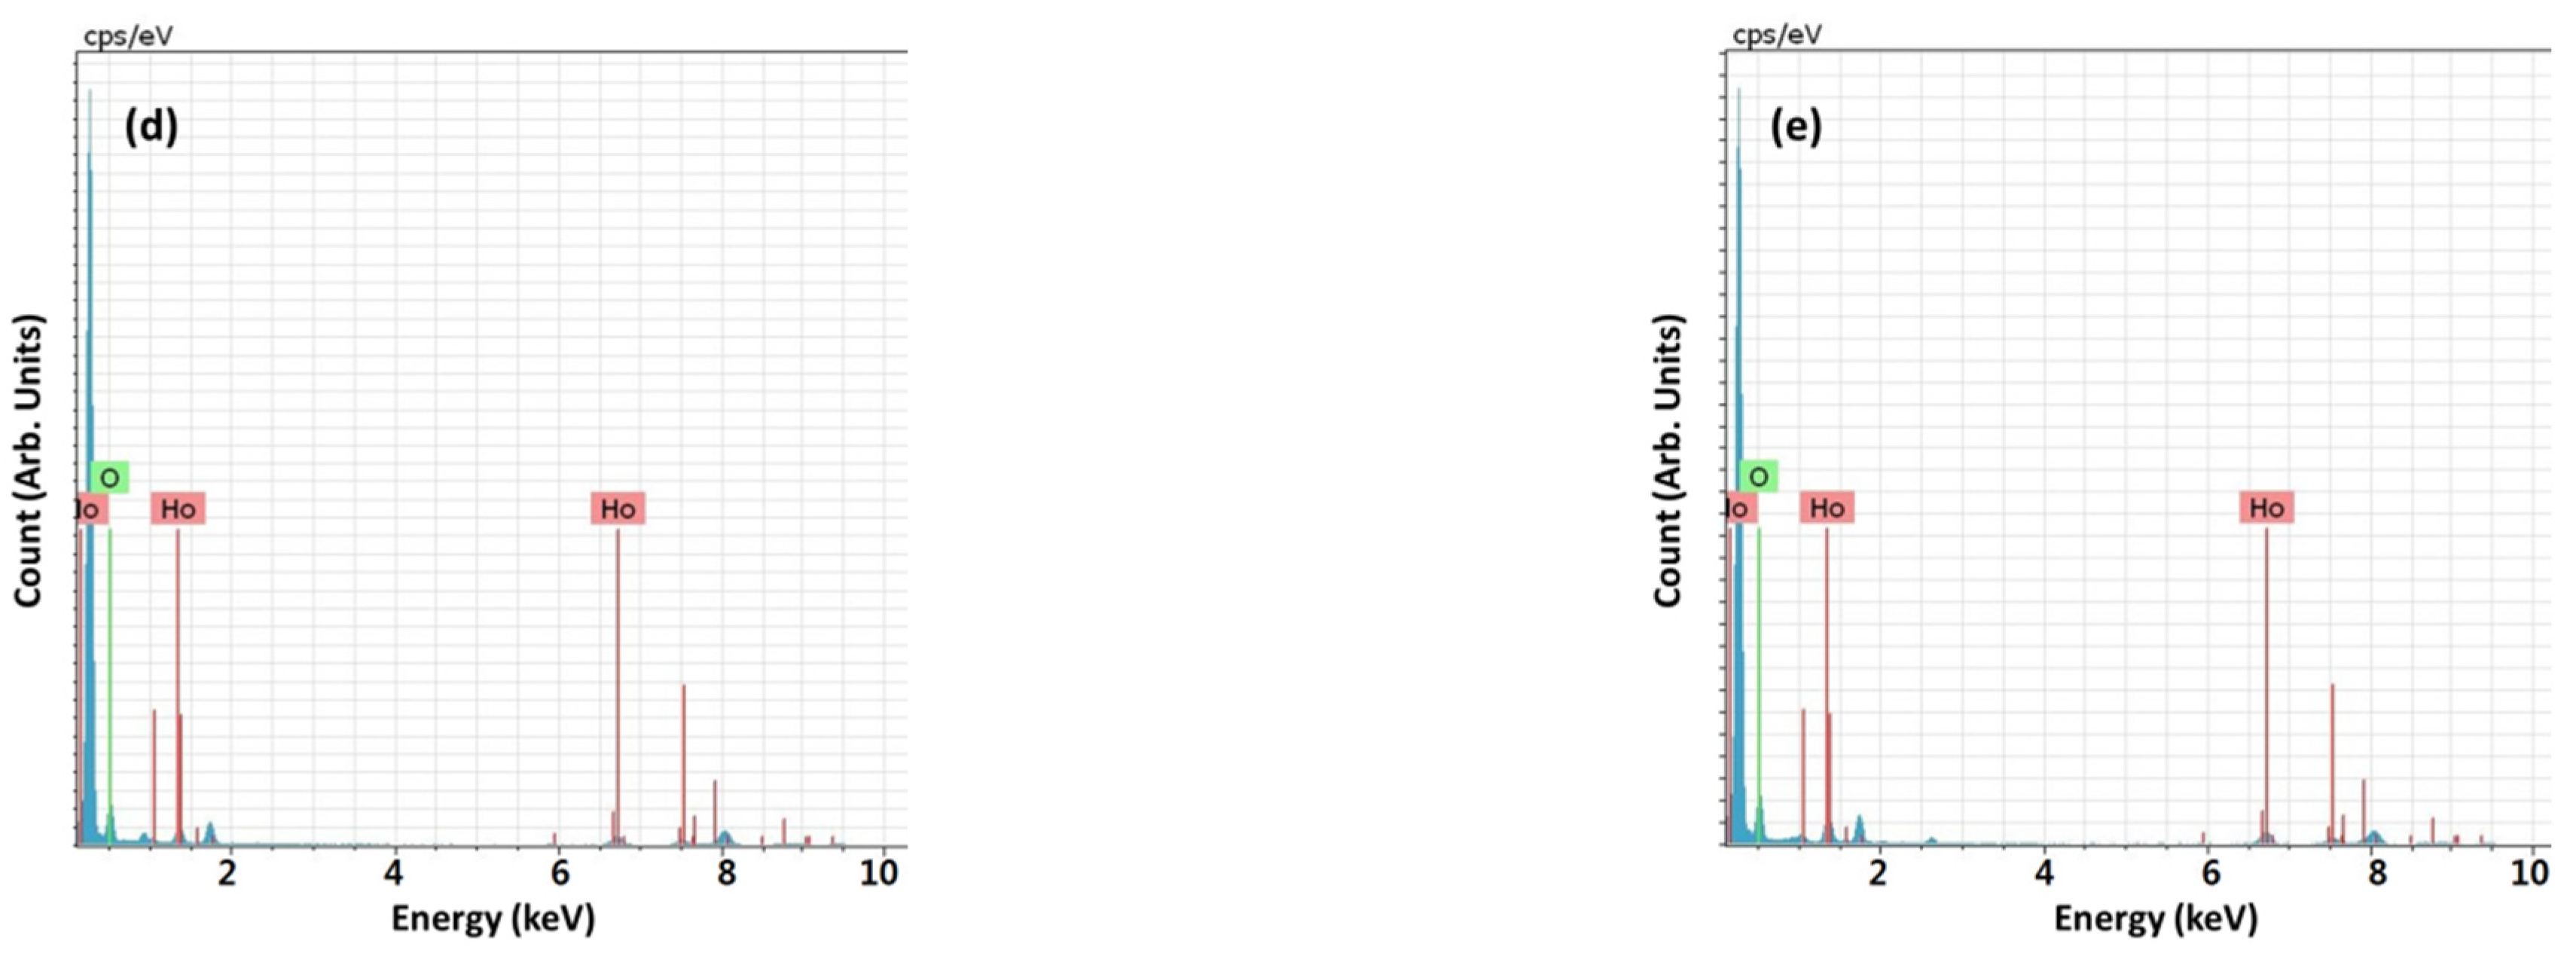
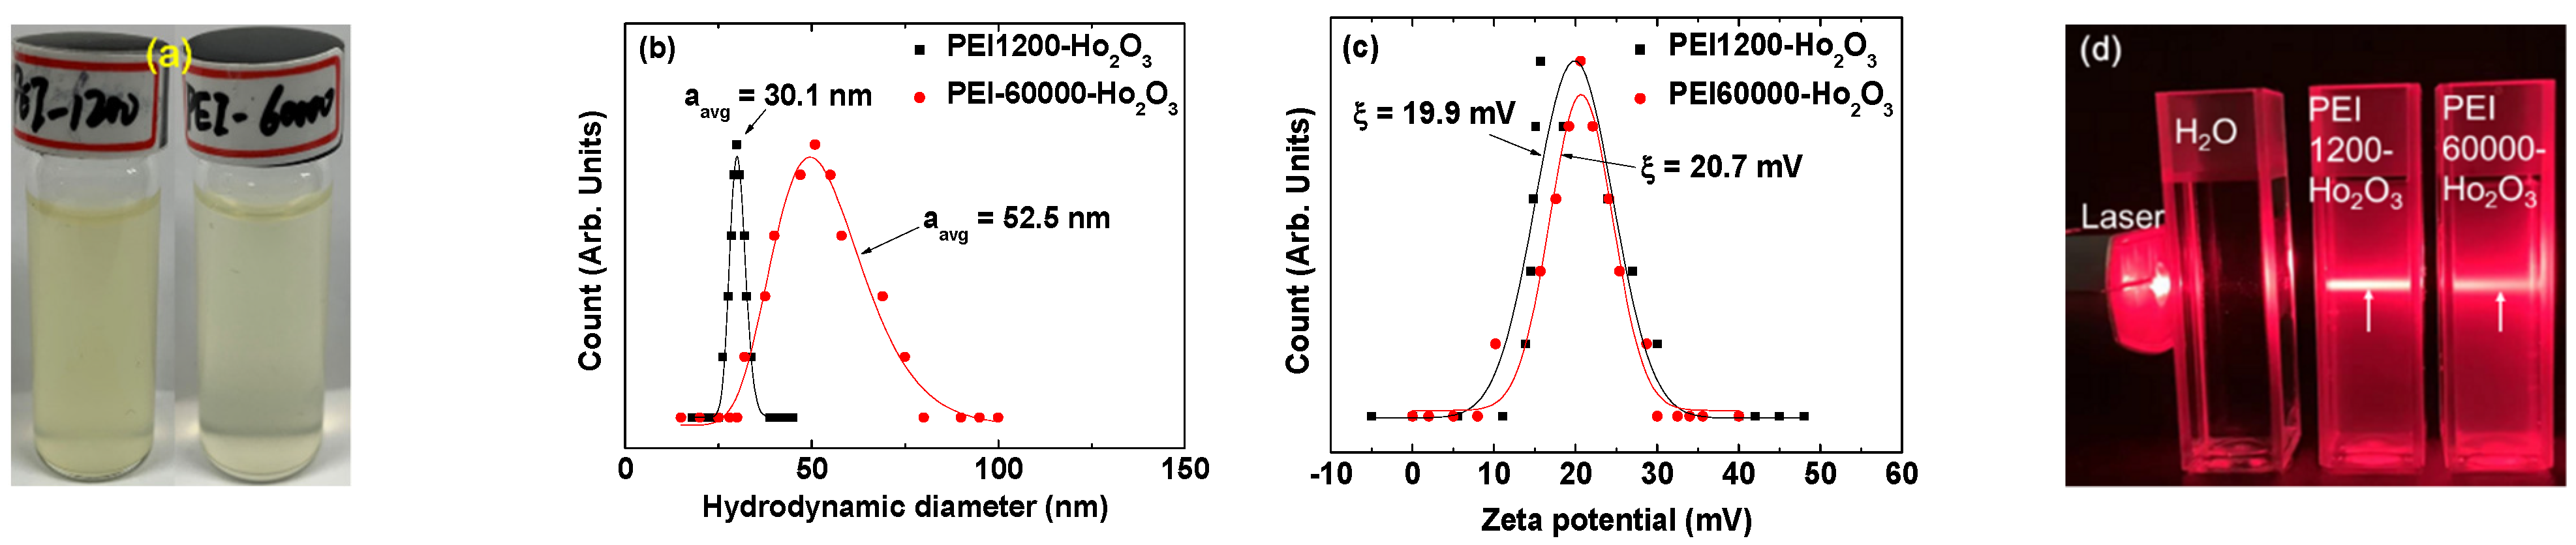
3.1. Physicochemical Properties of the PEI-Coated Ultrasmall Ho2O3 Nanoparticles

PEI1200- and PEI60000-coated ultrasmall Ho2O3 nanoparticles were synthesized using a polyol method [47] and characterized using various experimental techniques. As shown in the HRTEM images (Figure 2a,b), the particle diameters of the synthesized nanoparticles (labeled with dotted circles) were ultrasmall and ranged from 1.0 to 3.5 nm. For PEI60000-coated nanoparticles, approximately two nanoparticles appeared to be grafted with one PEI60000 because of the large size of PEI60000 (labeled with large dotted circles in Figure 2b), as discussed further in Section 3.2. The average particle diameter (davg) of the PEI1200- and PEI60000-coated Ho2O3 nanoparticles was estimated to be 2.05 and 1.90 nm, respectively, from the log-normal function fits to the observed particle diameter distributions (Figure 2c and Table 1). Furthermore, the results of energy-dispersive X-ray spectroscopy (EDS) substantiated the presence of C, O, and Ho in PEI1200- and PEI60000-coated Ho2O3 nanoparticles (Figure 2d,e).
Figure 3a shows the aqueous nanoparticle suspension samples of PEI1200- and PEI60000-coated ultrasmall Ho2O3 nanoparticles with a concentration of ~30 mM Ho. They exhibited well-dispersed colloidal suspensions of PEI-coated nanoparticles in aqueous media. The average hydrodynamic diameters (aavg) of the PEI1200- and PEI60000-coated ultrasmall Ho2O3 nanoparticles were estimated to be 30.1 and 52.5 nm, respectively, from the log-normal function fits to the observed DLS patterns (Figure 3b and Table 1). The aavg values were larger than the davg values because of the hydrophilic PEI coating and the accompanying hydration by water molecules around the nanoparticles. The larger aavg of the PEI60000-coated nanoparticles can be attributed to their considerably lower grafting density due to the larger size of PEI60000 than that of PEI1200 (~50 times larger in Mn). As shown in the HRTEM image (Figure 2b), each PEI60000 appeared to coat approximately two nanoparticles, which is quantitatively discussed in the surface-coating analysis in Section 3. This supports the observed larger aavg of the PEI60000-coated nanoparticles in DLS patterns. Furthermore, the broader DLS pattern of the PEI60000-coated nanoparticles is attributed to the higher polydispersity [48] (i.e., molecular weight broadness = Mw/Mn = 12.5) of PEI60000 compared with that (Mw/Mn = 1.1) of PEI1200. The positive zeta potentials (ζ) of 19.9 and 20.7 mV of the PEI1200- and PEI60000-coated ultrasmall Ho2O3 nanoparticles (Figure 3c and Table 1), respectively, are due to the amine groups of PEI [49]. The high ζ values indicated the good colloidal stability of PEI-coated nanoparticles in aqueous media. The Tyndall effect (or light scattering by the nanoparticle colloids) was observed only for PEI1200- and PEI60000-coated nanoparticles (samples on the middle and right-side in Figure 3d, respectively) but not for triple-distilled water (sample on the left), establishing the colloidal dispersion of PEI-coated nanoparticles in aqueous media.
The crystal structures of the as-prepared nanoparticles before and after TGA were determined via XRD analysis (Figure 4). Both samples demonstrated broad and amorphous XRD patterns before TGA, possibly because of their ultrasmall size [47]. However, the XRD patterns after TGA exhibited sharp peaks of body-centered cubic (bcc) Ho2O3. This was attributed to both particle size and crystal growth during TGA up to 900 °C. The lattice constant of TGA-treated powder samples was estimated to be 10.607 Å, which agreed with the reported value of 10.606 Å (Card No. 01-074-1829) [50].

3.2. Surface-Coating Results

The PEI surface coating of the nanoparticles was examined using FT-IR absorption spectroscopy. As shown in Figure 5a, the characteristic IR absorption bands of PEI [35,49], such as the N-H stretching at 3292–3248 cm−1, C–H stretching at 2910–2950 cm−1, N-H bending at 1620–1660 cm−1, and C-N stretching at 1100–1200 cm−1, were observed in the FT-IR absorption spectra of PEI-coated nanoparticles, indicating the presence of PEI on nanoparticle surfaces. The N-H stretching and bending peaks overlap with the water stretching and bending peaks, respectively. Table 2 provides the details of the observed FT-IR absorption frequencies.
The amount of coating (P, wt.%) of PEI on the nanoparticle surfaces was determined based on the mass loss seen in the TGA curve (Figure 5b) after considering the initial mass loss because of water and air desorption between room temperature and ~105 °C. The estimated p values were 43.1 and 60.3% for the PEI1200- and PEI60000-coated nanoparticles, respectively (Table 1). The wt.% of Ho2O3 nanoparticles in the sample was estimated from the residual mass seen in the TGA curve. The grafting density (σ) [51], corresponding to the average number of PEI polymers coating a unit surface area of a nanoparticle, was estimated to be 1.15 and 0.0432 nm−2 for PEI1200- and PEI60000-coated nanoparticles, respectively, using the bulk density of Ho2O3 (8.41 g/cm3) [52], davg of the nanoparticles estimated by HRTEM, and the p value estimated from the TGA curve. The average number (NNP) of PEI polymers coating a nanoparticle was estimated by multiplying σ by the nanoparticle surface area (=πd2avg). From Table 1, it can be seen that σ and NNP values decrease as the ligand’s size increases from PEI1200 to PEI60000 because the larger PEI60000 occupies a larger surface area owing to its higher steric effects than PEI1200. The surface-coating results are presented in Table 1.
PEI is grafted on the nanoparticle surface via a hard acid (Ho3+ on the nanoparticle surface)–hard base (NH2 of PEI) type of bonding [53]. Because each PEI has many NH2 groups, multiple bondings to each nanoparticle are possible (middle in Figure 5c). The estimated NNP of ~15 and ~0.49 for PEI1200- and PEI60000-coated nanoparticles, respectively, indicate that each nanoparticle was grafted with approximately fifteen PEI1200 polymers (left in Figure 5c), whereas ~2 nanoparticles were grafted with a single PEI60000 polymer (right in Figure 5c). These results were substantiated by HRTEM images, demonstrating that individual nanoparticles were mostly observed for PEI1200-coated ultrasmall Ho2O3 nanoparticles (Figure 2a), whereas multiple paired nanoparticles were observed for PEI60000-coated ultrasmall Ho2O3 nanoparticles (Figure 2b).

3.3. In Vitro Cellular Cytotoxicity Results

The biocompatibility of PEI1200- and PEI60000-coated ultrasmall Ho2O3 nanoparticles was examined by measuring in the vitro cell viability of DU145 cells 48 h after incubation with the nanoparticle samples (Figure 6a). The results demonstrated very low cellular toxicities of up to 500 μM Ho for both the samples. Moreover, optical microscopy images of DU145 cells indicated that the PEI-coated nanoparticles were scattered across the cells, and many of them gathered around the cells (Figure 6b) owing to the electrostatic interaction between the positively charged amine groups of the PEI-coated nanoparticles (see the positive zeta potentials of PEI-coated nanoparticles in Table 1) and negatively charged cell membranes [54]. The nanoparticle coverage over the cells increased with an increase in nanoparticle concentration. However, the cell morphologies did not change with increasing nanoparticle concentration, possibly because of the very low cytotoxicity of PEI-coated nanoparticles. Moreover, 10% (v/v) DMSO diluted in the RPMI1640 cell culture medium exhibited cellular toxicity, thus serving as a positive control (Figure 6a). To determine any effect of free PEI polymers on cellular cytotoxicity, we measured the cell viability of PEI1200 at 28 μM PEI concentration, which corresponds to the PEI1200 concentration at 500 μM Ho concentration in the sample. As shown in Figure 6a, 28 μM PEI1200 was slightly toxic with a cell viability of 78% possibly due to membrane damage or DNA damage after the internalization of the polymers into the cells as investigated by others [55,56]. This indicates that free PEI polymers should be thoroughly washed out from the samples after surface coating. The observed very low cellular toxicities of the PEI1200- and PEI60000-coated nanoparticles are possibly due to their reduced interaction with the cells because of bindings of multiple −NH2 groups in each PEI1200 to a nanoparticle, resulting in reduced membrane damage and reduced internalization into the cells compared with free PEI polymers. The PEI1200 concentration was estimated as follows: PEI1200-coated Ho2O3 nanoparticles (davg = 2.05 nm; Table 1) contain ~269 Ho3+ ions [11], and the PEI concentration was roughly estimated as (500/269) × NNP in which NNP = 15 (Table 1). Optical microscopy images of DU145 cells after incubation with 10% (v/v) DMSO and 28 μM PEI1200 clearly exhibited a considerably reduced cell density for 10% v/v) DMSO as a positive control and a slight cell density reduction for 28 μM PEI1200 (Figure 6c).

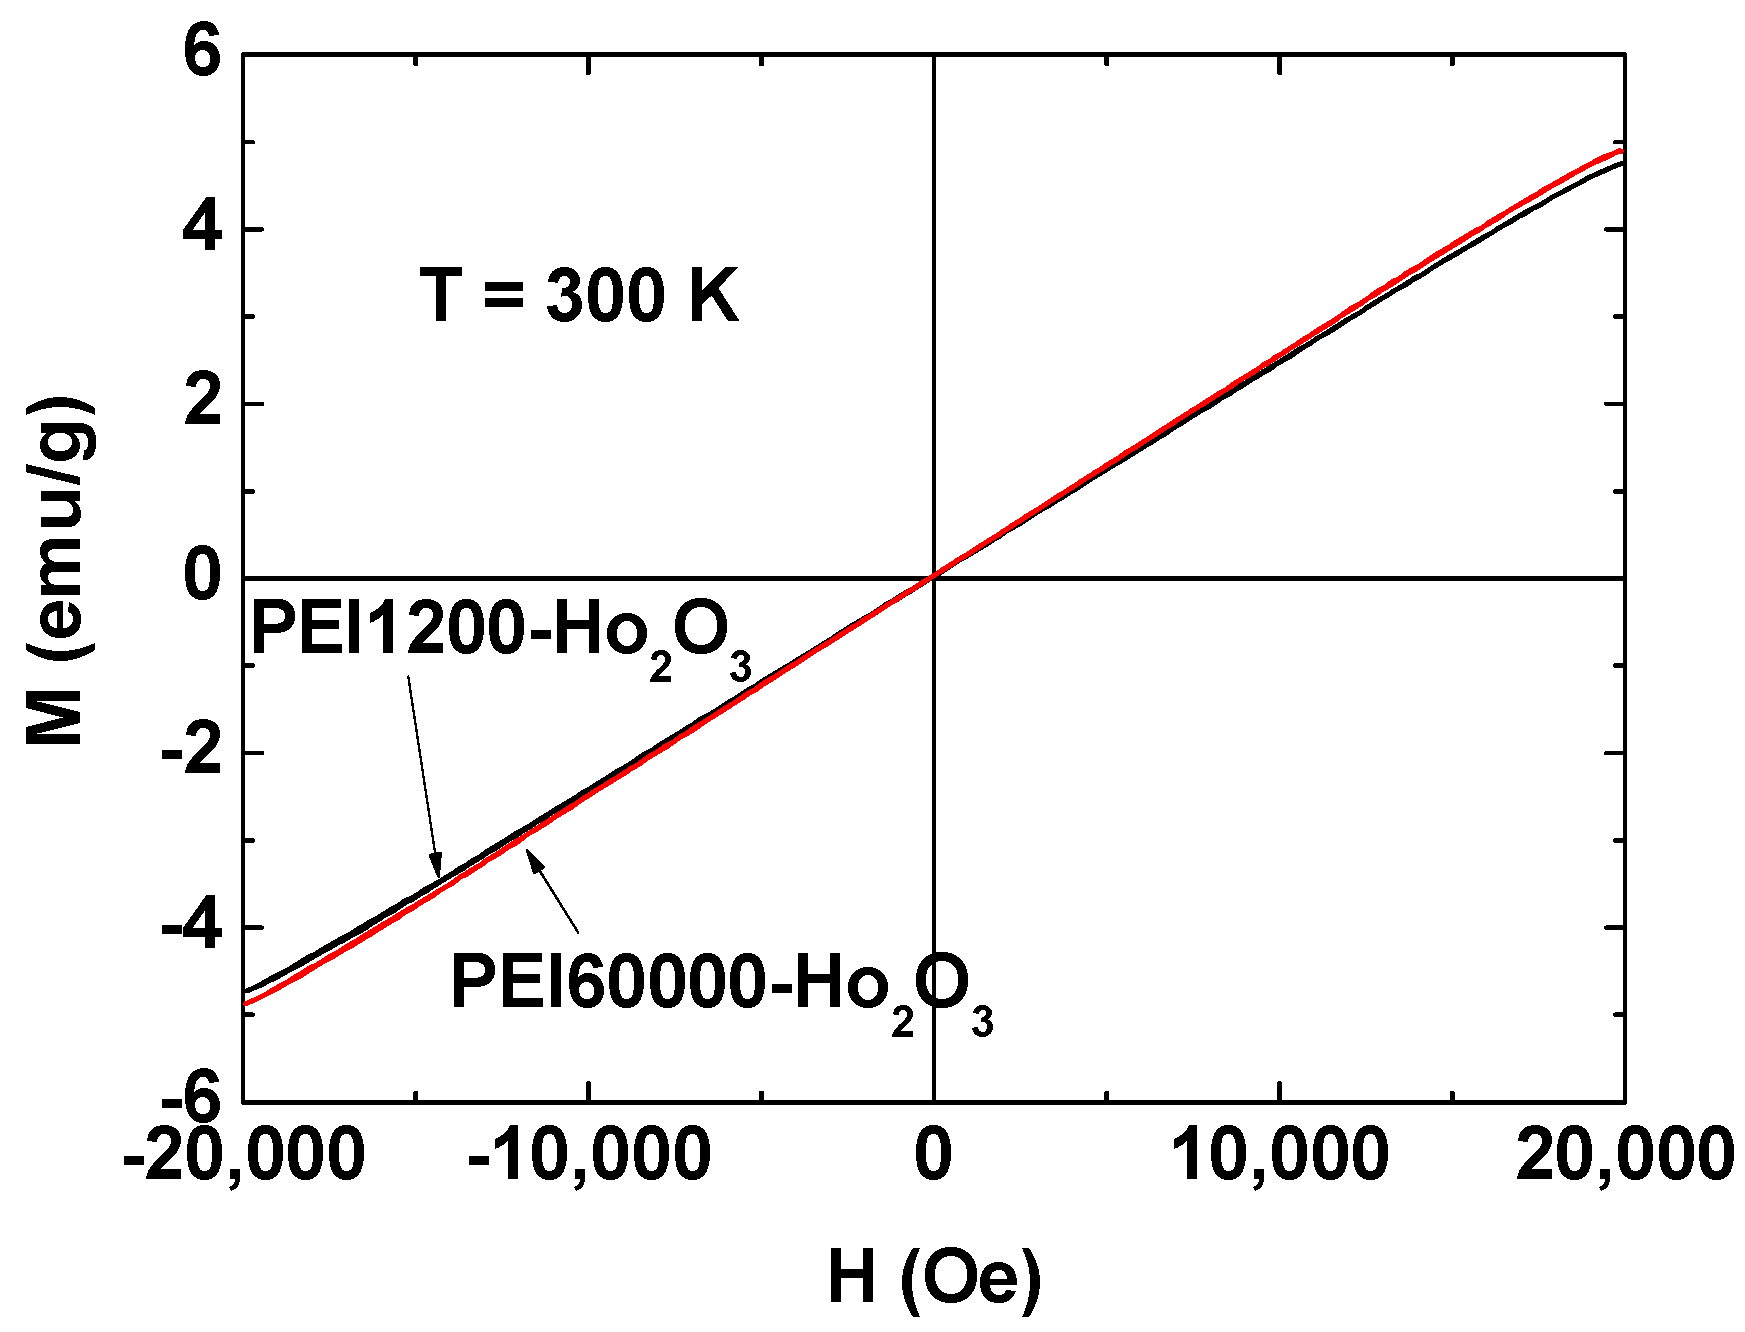
3.4. Magnetic Properties

The magnetic properties of PEI-coated ultrasmall Ho2O3 nanoparticles were determined by measuring M–H curves (−2.0 T ≤ H ≤ 2.0 T) at 300 K using a vibrating sample magnetometer (Figure 7). Both the nanoparticle samples were paramagnetic and exhibited no hysteresis, zero coercivity, and zero remanence in the M–H curves, which is similar to bulk Ho2O3 [57,58]. The measured M values were mass-corrected using the net masses of the Ho2O3 nanoparticles without PEI, which were obtained from the net masses of the Ho2O3 nanoparticles in the TGA curves. From the mass-corrected M–H curves (Figure 7), the unsaturated net M values of the Ho2O3 nanoparticles without PEI at H = 2.0 T were estimated as 4.75 and 4.90 emu/g for PEI1200- and PEI60000-coated ultrasmall Ho2O3 nanoparticles, respectively (Table 3). Therefore, the average net M value of ultrasmall Ho2O3 nanoparticles without PEI was 4.83 emu/g.

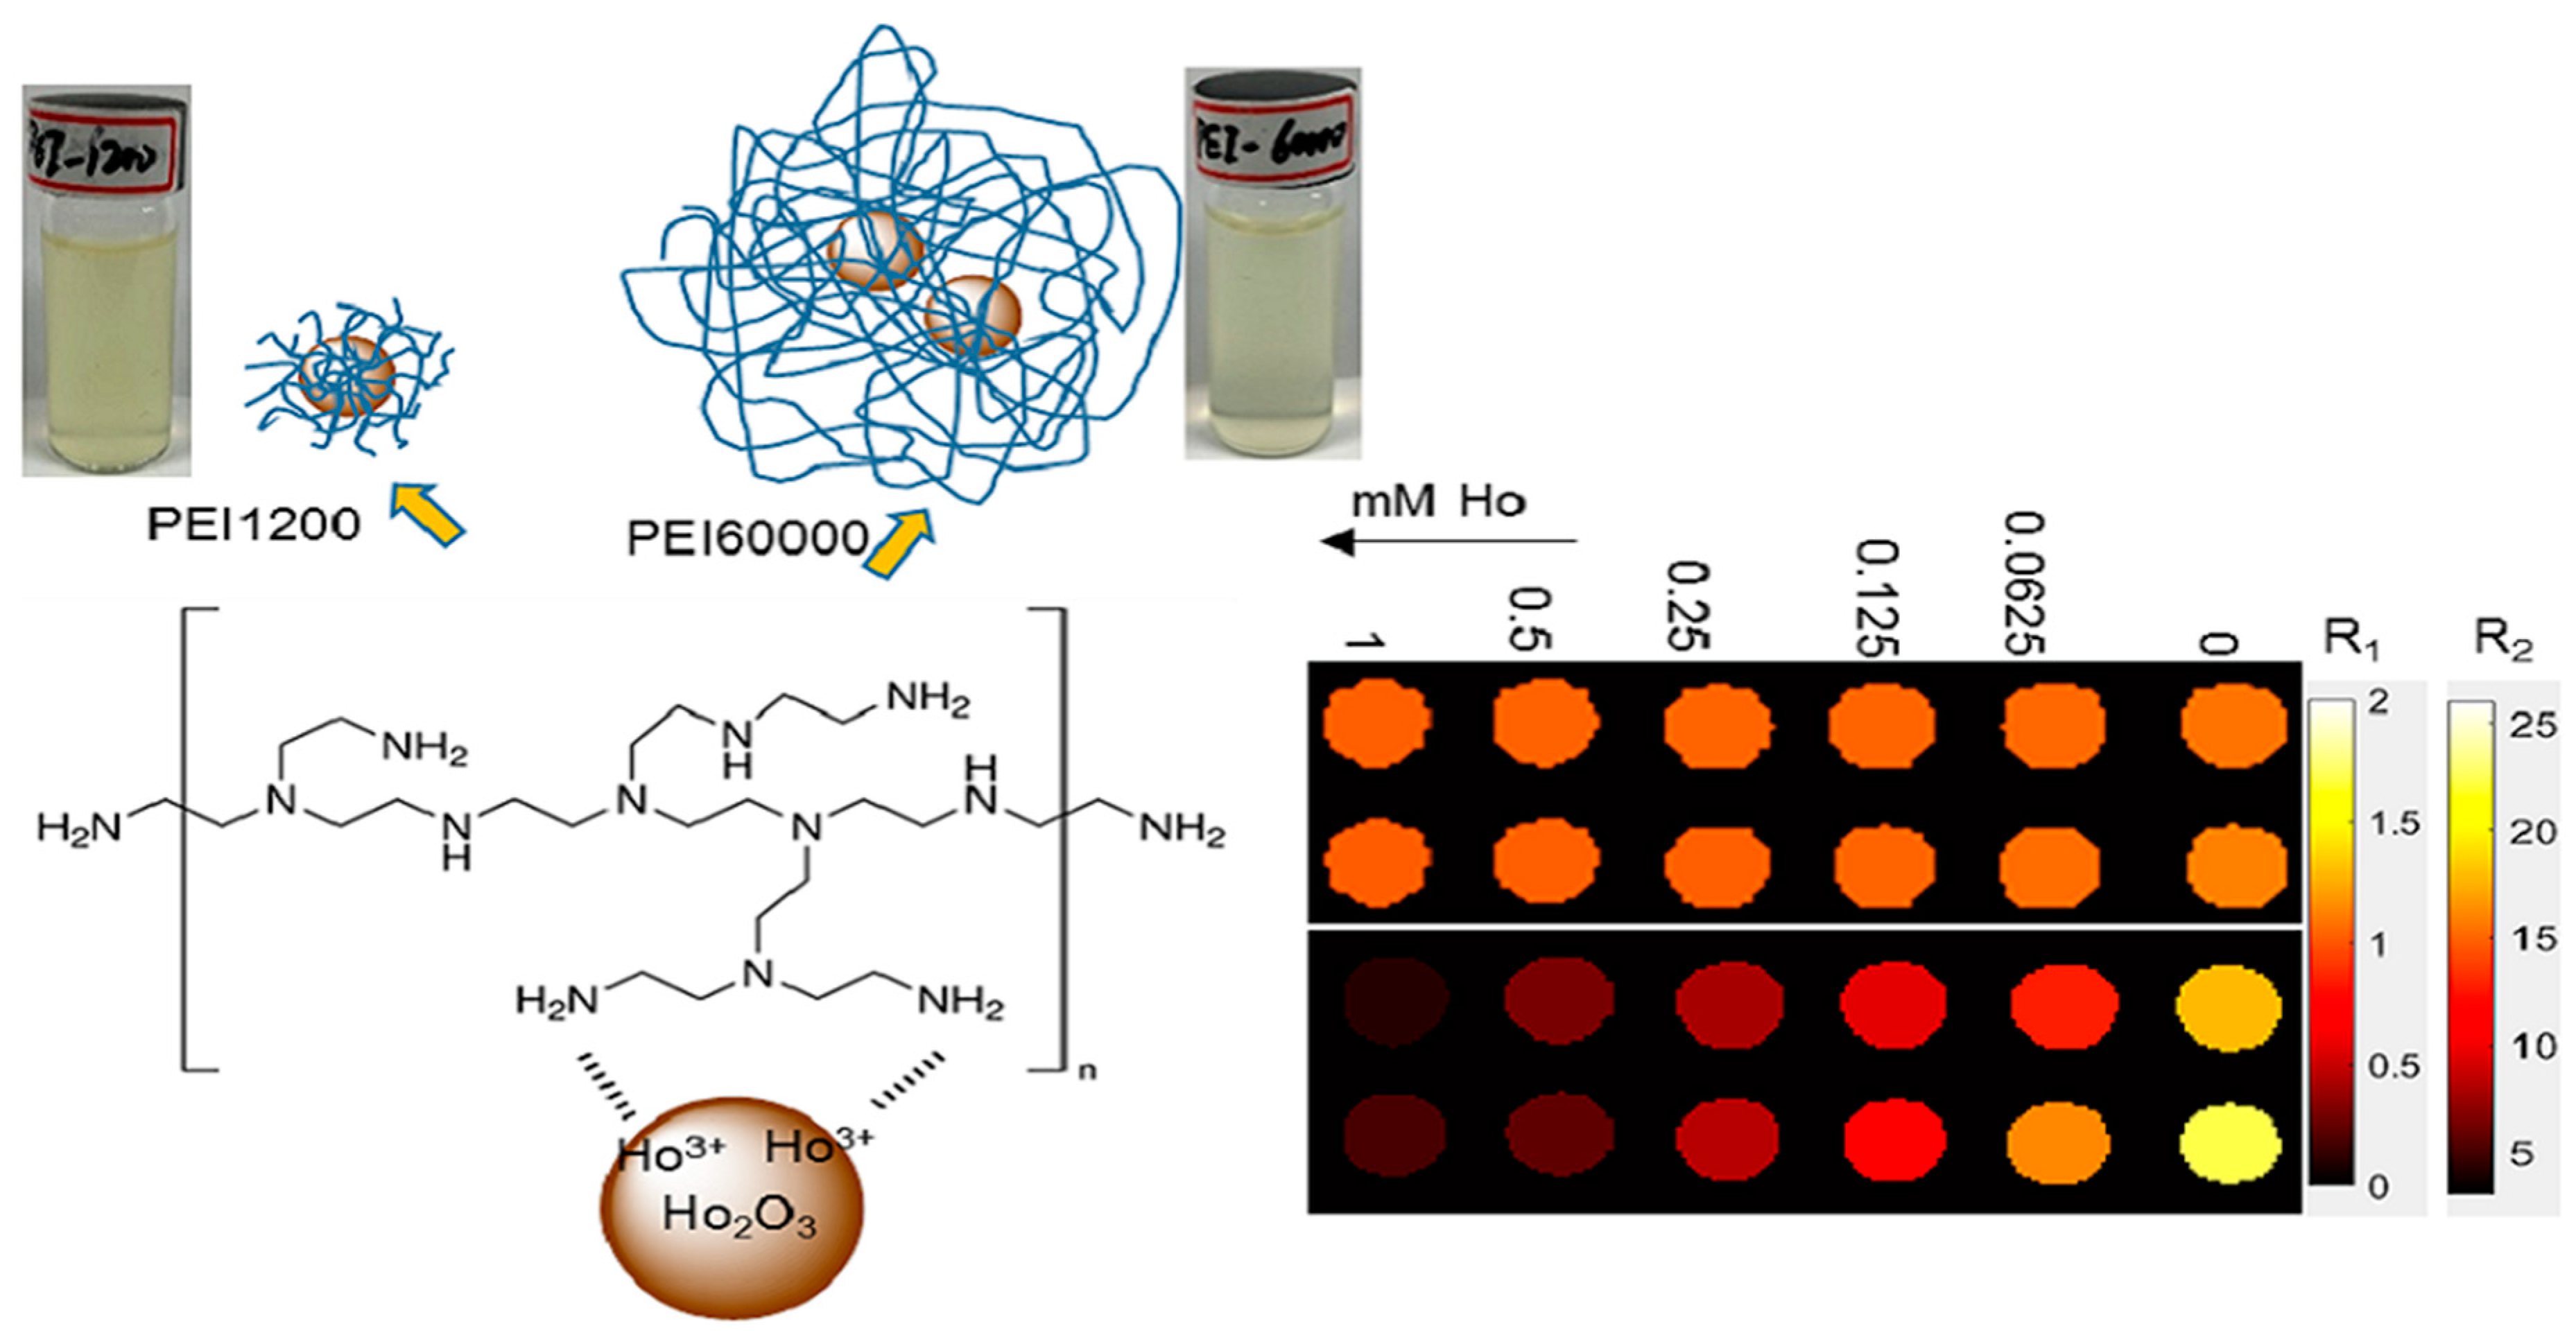
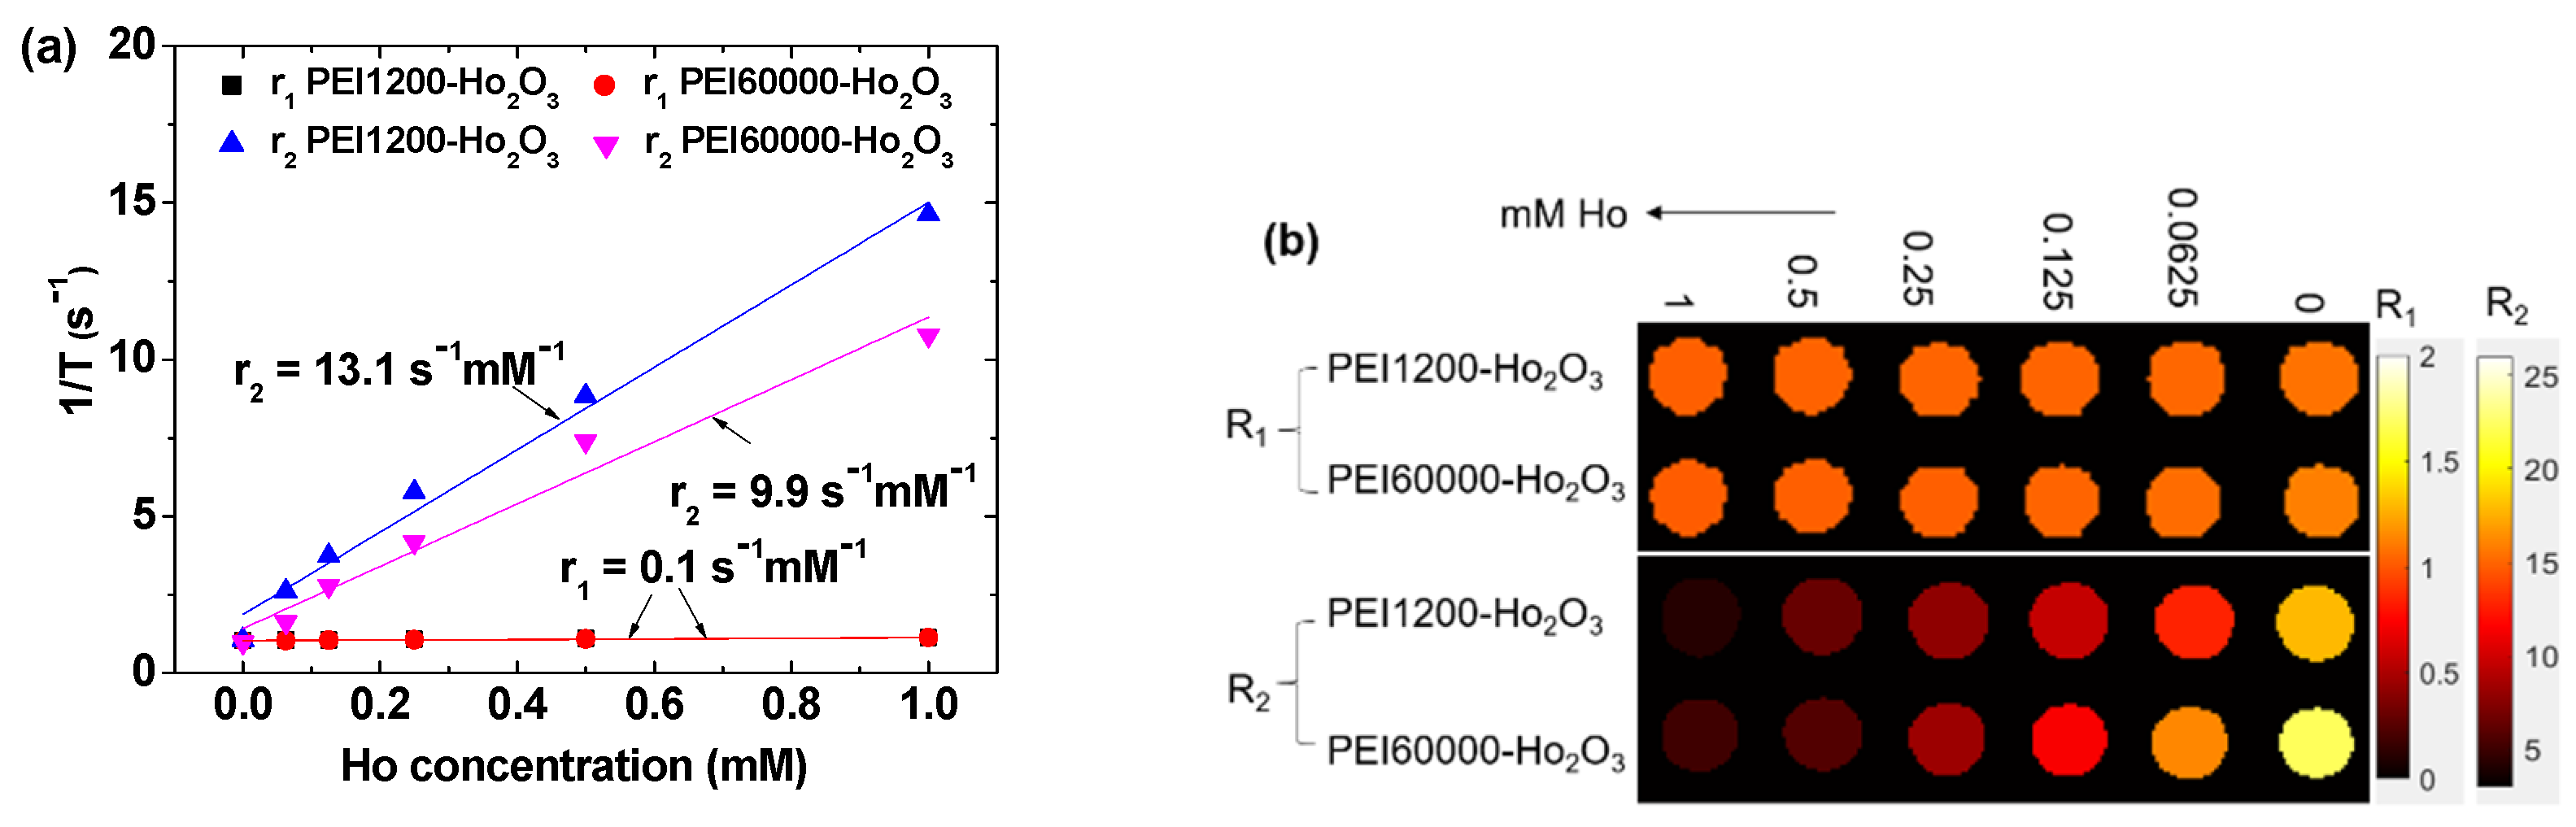
3.5. r1 and r2 Values and R1 and R2 Map Images

r1 and r2 water proton spin relaxivities and R1 and R2 map images were measured in an MR field of H = 3.0 T. r1 and r2 values were estimated from the slopes of the plots of inverse relaxation times 1/T1 and 1/T2 as a function of Ho concentration, respectively (Figure 8a). Both samples demonstrated negligible r1 (i.e., 0.1 s−1mM−1) and appreciable r2 values (13.1 and 9.9 s−1mM−1 for PEI1200- and PEI60000-coated ultrasmall Ho2O3 nanoparticles, respectively; Table 3). Consequently, the dose-dependent contrast enhancements observed in the R1 and R2 map images were negligible and appreciable, respectively, for both samples (Figure 8b). These results demonstrate in vitro that both samples can exclusively induce only T2 water proton spin relaxations and, thus, efficiently provide negative contrasts in MR images [2].

4. Discussion

In this study, PEI1200- and PEI60000-coated ultrasmall Ho2O3 nanoparticles (davg = 2.05 and 1.90 nm, respectively) were synthesized using a one-pot polyol method. In this method, the synthesis of ultrasmall Ho2O3 nanoparticles and surface coating with PEI were achieved via a one-step process in one pot. This method is simple and very useful for preparing hydrophilic and biocompatible ligand-coated ultrasmall lanthanide oxide nanoparticles with biomedical applications. PEI1200 and PEI60000 (Mn = 1200 and 60,000 amu, respectively) were used in this study to investigate the ligand-size effects on physicochemical properties and r2 values. The physicochemical properties of the synthesized PEI1200- and PEI60000-coated nanoparticles were characterized using various experimental techniques. Positive zeta potentials (~20 mV) were observed due to PEI coating for both the nanoparticle samples. The grafting density analyses [51] suggested that each nanoparticle was grafted with approximately fifteen PEI1200 polymers, whereas ~2 nanoparticles were grafted with a single PEI60000 polymer due to a considerably large molecular size of PEI60000; this finding was supported by HRTEM images (Figure 2a,b). Consequently, a larger hydrodynamic diameter (i.e., 52.5 nm) of PEI6000-coated nanoparticles than that (i.e., 30.1 nm) of the PEI1200-coated nanoparticles was observed. Moreover, a broader hydrodynamic diameter distribution in the DLS pattern of PEI6000-coated nanoparticles was observed than that of PEI1200-coated nanoparticles because of a higher polydispersity (i.e., 12.5) of PEI60000 than that (i.e., 1.1) of PEI1200. Both nanoparticle samples demonstrated good colloidal stability in aqueous media and promoted good DU145 cell viability. Interestingly, the development of T2 MRI contrast agents composed of ultrasmall nanoparticles that are excretable via the renal system, similarly to the case of molecular agents, is of considerable interest because the conventional iron oxide nanoparticles do not afford this possibility due to their appreciable particle sizes. For renal excretion, the nanoparticle diameter should be less than 3 nm [17,18].
Both nanoparticle samples show negligible r1 and appreciable r2 values (Table 3), which can be explained as follows. Negligible r1 values (i.e., 0.1 s−1mM−1) or negligible T1 water proton spin relaxation inductions can be explained by the inefficient interactions between the fast 4f-electron orbital motions of Ho3+ and slow water proton spin motions [19] as per the inner sphere model [4]. However, appreciable r2 values or appreciable T2 water proton spin relaxation inductions, which are caused by the fluctuation of local magnetic fields generated by the nanoparticle magnetic moments as per the outer sphere model [3,4], can be explained by the observed appreciable nanoparticle magnetic moment at room temperature (i.e., 4.83 emu/g at 2.0 T; Table 3).
The r2 value depends on multiple factors such as the solvent, sample solution pH, applied MR field, particle diameter, temperature, and surface-coating ligand [3,4,7,8]. All the factors except ligand size and particle diameter were similar for these two nanoparticle samples. The PEI60000-coated nanoparticles have a thicker coating than PEI1200-coated nanoparticles because each nanoparticle is grafted with an average PEI-mass of 18,000 and 29,400 amu in the case of PEI1200- and PEI60000-coated nanoparticles, respectively, as seen from their NNP of ~15 and ~0.49 (Table 1), respectively. Note that r2 is proportional to MNP2/L3, where MNP is the magnetic moment per nanoparticle (unit: emu/nanoparticle) and L is the distance between the nanoparticles and water proton spins [3,4]. Here, MNP = ~μ(Ho3+) (davg/0.234)3, where μ(Ho3+) is the atomic magnetic moment of Ho3+ [11], and L is proportional to ligand-coating thickness. Therefore, using davg values (Table 1), the MNP of the PEI1200-coated nanoparticles is ~1.26 times that of the PEI60000-coated nanoparticles and the L value of the former nanoparticles is shorter than that of the latter nanoparticles. This roughly explains why the observed r2 value of the PEI1200-coated nanoparticles is higher than that of the PEI60000-coated nanoparticles.
Note that T1 water proton spin relaxation always accompanies T2 water proton spin relaxation, whereas the reverse is not true [59]. Therefore, for the observed negligible r1 and appreciable r2 values or very high r2/r1 ratios, the PEI1200- and PEI60000-coated ultrasmall Ho2O3 nanoparticles can generate negative contrasts in MR images even with only appreciable (i.e., not high) r2 values because their T1 water proton spin relaxation contribution to MR images is negligible [2]. Thus, they are efficient T2 MRI contrast agents. This hypothesis was confirmed in vitro from the negligible and appreciable dose-dependent contrast enhancements in R1 and R2 map images, respectively (Figure 8b).

5. Conclusions

PEI1200- and PEI60000-coated ultrasmall Ho2O3 nanoparticles (davg = 2.05 and 1.90 nm, respectively) were synthesized using a one-pot polyol method and characterized using multiple experimental techniques. Their r1 and r2 values and R1 and R2 map images were measured to explore their potential as efficient T2 MRI contrast agents in vitro.
(1)
Both nanoparticle samples demonstrated low cellular cytotoxicity and good colloidal stability owing to the PEI coating on the nanoparticle surfaces.
(2)
Appreciable r2 values of 13.1 s−1mM−1 for the PEI1200-coated ultrasmall Ho2O3 nanoparticles and 9.9 s−1mM−1 for the PEI60000-coated ultrasmall Ho2O3 nanoparticles were observed. Negligible r1 values of 0.1 s−1mM−1 were observed for both nanoparticle samples. Consequently, R1 map images with negligible dose-dependent contrast changes and R2 map images with appreciable dose-dependent contrast changes were obtained for both nanoparticle samples. These in vitro experimental results demonstrate that PEI1200- and PEI60000-coated ultrasmall Ho2O3 nanoparticles can act as efficient T2 MRI contrast agents. In vivo MRI studies will further demonstrate the potential of ultrasmall Ho2O3 nanoparticles as efficient T2 MRI contrast agents.

Author Contributions

Methodology, S.L.; conceptualization, S.L. and S.L.H.; formal analysis, S.L., H.Y., T.T., M.Y.A., A.K.A.A.S., D.Z. and Y.L.; investigation, S.L., H.Y., S.L.H., S.K. (Soyeon Kim), J.A.P., S.K. (Seungho Kim) and K.S.C.; data curation, S.L., H.Y., S.K. (Soyeon Kim), J.A.P., S.K. (Seungho Kim), S.-W.N. and K.S.C.; writing—original draft preparation, S.L.; writing—review and editing, G.H.L.; supervision, Y.C. and G.H.L.; funding acquisition, S.-W.N., Y.C. and G.H.L. All authors have read and agreed to the published version of the manuscript.

Funding

This work was supported by the Basic Science Research Program of the National Research Foundation (NRF) funded by the Ministry of Education, Science, and Technology (No. 2016R1D1A3B01007622) and the Korean government (Ministry of Science, and Information and Communications Technology: MSIT) (No. 2021R1A4A1029433).

Institutional Review Board Statement

Not applicable.

Informed Consent Statement

Not applicable.

Data Availability Statement

The data presented in this study are available upon request from the corresponding authors.

Acknowledgments

We thank the Korea Basic Science Institute for allowing us to use their XRD machine.

Conflicts of Interest

The authors declare no conflict of interest.

References

  1. Laurent, S.; Bridot, J.-L.; Elst, L.V.; Muller, R.N. Magnetic iron oxide nanoparticles for biomedical applications. Future Med. Chem. 2010, 2, 427–449. [Google Scholar] [CrossRef] [PubMed] [Green Version]
  2. Estelrich, J.; Sánchez-Martín, M.J.; Busquets, M.A. Nanoparticles in magnetic resonance imaging: From simple to dual contrast agents. Int. J. Nanomed. 2015, 10, 1727–1741. [Google Scholar]
  3. Roch, A.; Gillis, P.; Muller, R.N. Theory of proton relaxation induced by superparamagnetic particles. J. Chem. Phys. 1999, 110, 5403–5411. [Google Scholar] [CrossRef]
  4. Lauffer, R.B. Paramagnetic metal complexes as water proton relaxation agents for NMR imaging: Theory and design. Chem. Rev. 1987, 87, 901–927. [Google Scholar] [CrossRef]
  5. Wahsner, J.; Gale, E.M.; Rodríguez-Rodríguez, A.; Caravan, P. Chemistry of MRI contrast agents: Current challenges and new frontiers. Chem. Rev. 2018, 119, 957–1057. [Google Scholar] [CrossRef] [PubMed]
  6. Xu, W.; Kattel, K.; Park, J.Y.; Chang, Y.; Kim, T.J.; Lee, G.H. Paramagnetic nanoparticle T1 and T2 MRI contrast agents. Phys. Chem. Chem. Phys. 2012, 14, 12687–12700. [Google Scholar] [CrossRef]
  7. Miao, X.; Xu, W.; Cha, H.; Chang, Y.; Oh, I.T.; Chae, K.S.; Tegafaw, T.; Ho, S.L.; Kim, S.J.; Lee, G.H. Ultrasmall Gd2O3 nanoparticle surface-coated by polyacrylic acid (PAA) and their PAA-size dependent relaxometric properties. Appl. Surf. Sci. 2019, 477, 111–115. [Google Scholar] [CrossRef]
  8. Norek, M.; Pereira, G.A.D.L.; Geraldes, C.F.G.C.; Denkova, A.; Zhou, W.; Peters, J.A. NMR Transversal relaxivity of suspensions of lanthanide oxide nanoparticles. J. Phys. Chem. C 2007, 111, 10240–10246. [Google Scholar] [CrossRef] [Green Version]
  9. Kattel, K.; Park, J.Y.; Xu, W.; Kim, H.G.; Lee, E.J.; Bony, B.A.; Heo, W.C.; Lee, J.J.; Jin, S.; Baeck, J.S.; et al. A facile synthesis, in vitro and in vivo MR studies of D-glucuronic acid-coated ultrasmall Ln2O3 (Ln = Eu, Gd, Dy, Ho, and Er) nanoparticles as a new potential MRI contrast agent. ACS Appl. Mater. Interfaces 2011, 3, 3325–3334. [Google Scholar] [CrossRef]
  10. Marasini, S.; Yue, H.; Ho, S.L.; Jung, K.-H.; Park, J.A.; Cha, H.; Ghazanfari, A.; Ahmad, M.Y.; Liu, S.; Jang, Y.J.; et al. D-glucuronic acid-coated ultrasmall paramagnetic Ln2O3 (Ln = Tb, Dy, and Ho) nanoparticles: Magnetic properties, water proton relaxivities, and fluorescence properties. Eur. J. Inorg. Chem. 2019, 34, 3832–3839. [Google Scholar] [CrossRef]
  11. Marasini, S.; Yue, H.; Ho, S.L.; Park, J.; Kim, S.; Jung, K.H.; Cha, H.; Liu, S.; Tegafaw, T.; Ahmad, M.Y.; et al. Synthesis, Characterizations, and 9.4 tesla T2 MR images of polyacrylic acid-coated terbium (III) and holmium (III) oxide nanoparticles. Nanomaterials 2021, 11, 1355. [Google Scholar] [CrossRef]
  12. Atabaev, T.S.; Shin, Y.C.; Song, S.-J.; Han, D.-W.; Hong, N.H. Toxicity and T2-weighted magnetic resonance imaging potentials of holmium oxide nanoparticles. Nanomaterials 2017, 7, 216. [Google Scholar] [CrossRef] [PubMed] [Green Version]
  13. Gómez-Gónzalez, E.; Núñez, N.O.; Caro, C.; García-Martín, M.L.; Fernández-Afonso, Y.; de la Fuente, J.M.; Balcerzyk, M.; Ocaña, M. Dysprosium and holmium vanadate nanoprobes as high-performance contrast agents for high-field magnetic resonance and computed tomography imaging. Inorg. Chem. 2021, 60, 152–160. [Google Scholar] [CrossRef]
  14. Gómez-Gónzalez, E.; Caro, C.; Martínez-Gutiérrez, D.; García-Martín, M.L.; Ocaña, M.; Becerro, A.I. Holmium phosphate nanoparticles as negative contrast agents for high-field magnetic resonance imaging: Synthesis, magnetic relaxivity study and in vivo evaluation. J. Colloid Interface Sci. 2021, 587, 131–140. [Google Scholar] [CrossRef]
  15. Greenwood, N.N.; Earnshaw, A. Chemistry of the Elements; Butterworth-Heinemann: New York, NY, USA, 1997; p. 1243. [Google Scholar]
  16. Cotton, F.A.; Wilkinson, G. Advanced Inorganic Chemistry, 4th ed.; A Wiley-Interscience Publication: New York, NY, USA, 1980; p. 984. [Google Scholar]
  17. Longmire, M.; Choyke, P.L.; Kobayashi, H. Clearance properties of nano-sized particles and molecules as imaging agents: Considerations and caveats. Nanomedicine 2008, 3, 703–717. [Google Scholar] [CrossRef] [PubMed] [Green Version]
  18. Choi, H.S.; Liu, W.; Misra, P.; Tanaka, E.; Zimmer, J.P.; Ipe, B.I.; Bawendi, M.G.; Frangioni, J.V. Renal clearance of nanoparticles. Nat. Biotechnol. 2007, 25, 1165–1170. [Google Scholar] [CrossRef] [Green Version]
  19. Caravan, P.; Ellison, J.J.; McMurry, T.J.; Lauffer, R.B. Gadolinium(III) chelates as MRI contrast agents: Structure, dynamics, and applications. Chem. Rev. 1999, 99, 2293–2352. [Google Scholar] [CrossRef] [PubMed]
  20. Palui, G.; Aldeek, F.; Wang, W.; Mattoussi, H. Strategies for interfacing inorganic nanocrystals with biological systems based on polymer-coating. Chem. Soc. Rev. 2015, 44, 193–227. [Google Scholar] [CrossRef] [PubMed] [Green Version]
  21. Ahmad, M.Y.; Ahmad, M.W.; Yue, H.; Ho, S.L.; Park, J.A.; Jung, K.-H.; Cha, H.; Marasini, S.; Ghazanfari, A.; Liu, S.; et al. In vivo positive magnetic resonance imaging applications of poly(methyl vinyl ether-alt-maleic acid)-coated ultra-small paramagnetic gadolinium oxide nanoparticles. Molecules 2020, 25, 1159. [Google Scholar] [CrossRef] [Green Version]
  22. Jang, Y.J.; Liu, S.; Yue, H.; Park, J.A.; Cha, H.; Ho, S.L.; Marasini, S.; Ghazanfari, A.; Ahmad, M.Y.; Miao, X.; et al. Hydrophilic biocompatible poly(acrylic acid-co-maleic acid) polymer as a surface-coating ligand of ultrasmall Gd2O3 nanoparticles to obtain a high r1 value and T1 MR images. Diagnostics 2021, 11, 2. [Google Scholar] [CrossRef]
  23. Singh, R.; Singh, S. Surface Modification of Nanomaterials for Biomedical Applications: Strategies and Recent Advances. In Nanobiotechnology, 1st ed.; Dhawan, A., Singh, S., Kumar, A., Shanker, R., Eds.; CRC Press: Boca Raton, FL, USA, 2018; pp. 171–217. [Google Scholar]
  24. Jäger, M.; Schubert, S.; Ochrimenko, S.; Fischer, D.; Schubert, U.S. Branched and linear poly (ethylene imine)-based conjugates: Synthetic modification, characterization, and application. Chem. Soc. Rev. 2012, 41, 4755–4767. [Google Scholar] [CrossRef]
  25. Cai, H.; An, X.; Cui, J.; Li, J.; Wen, S.; Li, K.; Shen, M.; Zheng, L.; Zhang, G.; Shi, X. Facile hydrothermal synthesis and surface functionalization of polyethyleneimine-coated iron oxide nanoparticles for biomedical applications. ACS Appl. Mater. Interfaces 2013, 5, 1722–1731. [Google Scholar] [CrossRef] [PubMed]
  26. Tomitaka, A.; Ueda, K.; Yamada, T.; Takemura, Y. Heat dissipation and magnetic properties of surface-coated Fe3O4 nanoparticles for biomedical applications. J. Magn. Magn. Mater. 2012, 324, 3437–3442. [Google Scholar] [CrossRef]
  27. Guller, A.E.; Nadort, A.; Generalova, A.N.; Khaydukov, E.V.; Nechaev, A.V.; Kornienko, I.A.; Petersen, E.V.; Liang, L.; Shekhter, A.B.; Qian, Y.; et al. Rational surface design of upconversion nanoparticles with polyethylenimine coating for biomedical applications: Better safe than brighter? ACS Biomater. Sci. Eng. 2018, 4, 3143–3153. [Google Scholar] [CrossRef] [PubMed]
  28. Cho, T.J.; Gorham, J.M.; Pettibone, J.M.; Liu, J.; Tan, J.; Hackley, V.A. Parallel multi-parameter study of PEI-functionalized gold nanoparticle synthesis for bio-medical applications: Part 1—A critical assessment of methodology, properties, and stability. J. Nanopart. Res. 2019, 21, 188. [Google Scholar] [CrossRef] [PubMed]
  29. Cho, T.J.; Gorham, J.M.; Pettibone, J.M.; Liu, J.; Tan, J.; Hackley, V.A. Parallel multiparameter study of PEI-functionalized gold nanoparticle synthesis for biomedical applications: Part 2—Elucidating the role of surface chemistry and polymer structure in performance. Langmuir 2020, 36, 14058–14069. [Google Scholar] [CrossRef] [PubMed]
  30. Karimzadeh, I.; Aghazadeh, M.; Ganjali, M.R.; Doroudi, T.; Kolivand, P.H. Preparation and characterization of iron oxide (Fe3O4) nanoparticles coated with polyvinylpyrrolidone/polyethylenimine through a facile one-pot deposition route. J. Magn. Magn. Mater. 2017, 433, 148–154. [Google Scholar] [CrossRef]
  31. Brunot, C.; Ponsonnet, L.; Lagneau, C.; Farge, P.; Picart, C.; Grosgogeat, B. Cytotoxicity of polyethyleneimine (PEI), precursor base layer of polyelectrolyte multilayer films. Biomaterials 2007, 28, 632–640. [Google Scholar] [CrossRef]
  32. Morimoto, K.; Nishikawa, M.; Kawakami, S.; Nakano, T.; Hattori, Y.; Fumoto, S.; Yamashita, F.; Hashida, M. Molecular weight-dependent gene transfection activity of unmodified and galactosylated polyethyleneimine on hepatoma cells and mouse liver. Mol. Ther. 2003, 7, 254–261. [Google Scholar] [CrossRef]
  33. Chertok, B.; David, A.E.; Yang, V.C. Polyethyleneimine-modified iron oxide nanoparticles for brain tumor drug delivery using magnetic targeting and intra-carotid administration. Biomaterials 2010, 31, 6317–6324. [Google Scholar] [CrossRef] [Green Version]
  34. Abbasi, S.; Paul, A.; Shao, W.; Prakash, S. Cationic albumin nanoparticles for enhanced drug delivery to treat breast cancer: Preparation and in vitro assessment. J. Drug Deliv. 2012, 2012, 686108. [Google Scholar] [CrossRef] [PubMed] [Green Version]
  35. Xu, W.; Park, J.Y.; Kattel, K.; Ahmad, M.W.; Bony, B.A.; Heo, W.C.; Jin, S.; Park, J.W.; Chang, Y.; Kim, T.J.; et al. Fluorescein-polyethyleneimine coated gadolinium oxide nanoparticles as T1 magnetic resonance imaging (MRI)–cell labeling (CL) dual agents. RSC Adv. 2012, 2, 10907–10915. [Google Scholar] [CrossRef]
  36. Olifirenko, V.; Abduraimova, A.; Kang, M.S.; Raja, I.S.; Duisenbayeva, B.; Molkenova, A.; Khamkhash, L.; Hwang, Y.-H.; Han, D.-W.; Atabaev, T.S. Potential applicability of polyethyleneimine PEI-coated Eu2O3 and Dy2O3 nanoparticles for contrast enhancement in computed tomography. Nano Express 2021, 2, 010022. [Google Scholar] [CrossRef]
  37. Wang, L.; Kang, X.; Pan, D. Gram-scale synthesis of hydrophilic PEI-coated AgInS2 quantum dots and its application in hydrogen peroxide/glucose detection and cell imaging. Inorg. Chem. 2017, 56, 6122–6130. [Google Scholar] [CrossRef]
  38. Lu, W.; Ling, M.; Jia, M.; Huang, P.; Li, C.; Yan, B. Facile synthesis and characterization of polyethylenimine-coated Fe3O4 superparamagnetic nanoparticles for cancer cell separation. Mol. Med. Rep. 2014, 9, 1080–1084. [Google Scholar] [CrossRef] [Green Version]
  39. Mulens-Arias, V.; Rojas, J.M.; Sanz-Ortega, L.; Portilla, Y.; Pérez-Yagüe, S.; Barber, D.F. Polyethylenimine-coated superparamagnetic iron oxide nanoparticles impair in vitro and in vivo angiogenesis. Nanomed. Nanotechnol. Biol. Med. 2019, 21, 102063. [Google Scholar] [CrossRef]
  40. Yu, K.; Zhao, J.; Yu, C.; Sun, F.; Liu, Y.; Zhang, Y.; Lee, R.J.; Teng, L.; Li, Y. Role of four different kinds of polyethylenimines (PEIs) in preparation of polymeric lipid nanoparticles and their anticancer activity study. J. Cancer 2016, 7, 872–882. [Google Scholar] [CrossRef]
  41. Neu, M.; Fischer, D.; Kissel, T. Recent advances in rational gene transfer vector design based on poly (ethylene imine) and its derivatives. J. Gene Med. 2005, 7, 992–1009. [Google Scholar] [CrossRef]
  42. Steitz, B.; Hofmann, H.; Kamau, S.W.; Hassa, P.O.; Hottiger, M.O.; von Rechenberg, B.; Hofmann-Amtenbrink, M.; Petri-Fink, A. Characterization of PEI-coated superparamagnetic iron oxide nanoparticles for transfection: Size distribution, colloidal properties and DNA interaction. J. Magn. Magn. Mater. 2007, 311, 300–305. [Google Scholar] [CrossRef]
  43. Cebrián, V.; Martín-Saavedra, F.; Yagüe, C.; Arruebo, M.; Santamaría, J.; Vilaboa, N. Size-dependent transfection efficiency of PEI-coated gold nanoparticles. Acta Biomater. 2011, 7, 3645–3655. [Google Scholar] [CrossRef]
  44. Park, I.Y.; Kim, I.Y.; Yoo, M.K.; Choi, Y.J.; Cho, M.H.; Cho, C.S. Mannosylated polyethylenimine coupled mesoporous silica nanoparticles for receptormediated gene delivery. Int. J. Pharm. 2008, 359, 280–287. [Google Scholar] [CrossRef] [PubMed]
  45. Hu, C.; Peng, Q.; Chen, F.; Zhong, Z.; Zhuo, R. Low molecular weight polyethylenimine conjugated gold nanoparticles as efficient gene vectors. Bioconjug. Chem. 2010, 21, 836–844. [Google Scholar] [CrossRef] [PubMed]
  46. Zhang, L.; Wang, T.; Li, L.; Wang, C.; Su, Z.; Li, J. Multifunctional fluorescent-magnetic polyethyleneimine functionalized Fe3O4–mesoporous silica yolk–shell nanocapsules for siRNA delivery. Chem. Commun. 2012, 48, 8706–8708. [Google Scholar] [CrossRef] [PubMed]
  47. Söderlind, F.; Pedersen, H.; Petoral, R.M., Jr.; Käll, P.-O.; Uvdal, K. Synthesis and characterization of Gd2O3 nanocrystals func-tionalized by organic acids. J. Colloid Interface Sci. 2005, 288, 140–148. [Google Scholar] [CrossRef]
  48. Rane, S.S.; Choi, P. Polydispersity index:  How accurately does it measure the breadth of the molecular weight distribution? Chem. Mater. 2005, 17, 926. [Google Scholar] [CrossRef]
  49. Wang, F.; Liu, P.; Nie, T.; Wei, H.; Cui, Z. Characterization of a polyamine microsphere and its adsorption for protein. Int. J. Mol. Sci. 2013, 14, 17–29. [Google Scholar] [CrossRef] [Green Version]
  50. Card No. 01-074-1829 for Ho2O3. In X’pert High Score; Version 2.0a (2.0.1); PANalytical B.V.: Almelo, The Netherlands, 2004.
  51. Benoit, D.N.; Zhu, H.; Lilierose, M.H.; Verm, R.A.; Ali, N.; Morrison, A.N.; Fortner, J.D.; Avendano, C.; Colvin, V.L. Measuring the grafting density of nanoparticles in solution by analytical ultracentrifugation and total organic carbon analysis. Anal. Chem. 2012, 84, 9238–9245. [Google Scholar] [CrossRef] [Green Version]
  52. Lide, D.R. (Ed.) CRC Handbook of Chemistry and Physics; CRC Press: Boca Raton, FL, USA, 2005; pp. 4–60. [Google Scholar]
  53. Pearson, R.G. Hard and soft acids and bases. J. Am. Chem. Soc. 1963, 85, 3533–3539. [Google Scholar] [CrossRef]
  54. Nishino, M.; Matsuzaki, I.; Musangile, F.Y.; Takahashi, Y.; Iwahashi, Y.; Warigaya, K.; Kinoshita, Y.; Kojima, F.; Murata, S. Measurement and visualization of cell membrane surface charge in fixed cultured cells related with cell morphology. PLoS ONE 2020, 15, e0236373. [Google Scholar] [CrossRef]
  55. Kafil, V.; Omidi, Y. Cytotoxic impacts of linear and branched polyethylenimine nanostructures in A431 cells. BioImpacts 2011, 1, 23–30. [Google Scholar]
  56. Moghimi, S.M.; Symonds, P.; Murray, J.C.; Hunter, A.C.; Debska, G.; Szewczyk, A. A two-stage poly(ethylenimine)-mediated cytotoxicity: Implications for gene transfer/therapy. Mol. Ther. 2005, 11, 990–995. [Google Scholar] [CrossRef] [PubMed]
  57. Koehler, W.C.; Wollan, E.O.; Wilkinson, M.K. Paramagnetic and nuclear scattering cross sections of holmium sesquioxide. Phys. Rev. 1958, 110, 37–40. [Google Scholar] [CrossRef]
  58. Wolf, W.P.; Meissner, H.; Catanese, C.A. Magnetic properties of rare earth hydroxides. J. Appl. Phys. 1968, 39, 1134–1136. [Google Scholar] [CrossRef]
  59. Bloch, F. Nuclear induction. Phys. Rev. 1946, 70, 460–474. [Google Scholar] [CrossRef]
Figure 1. One-pot polyol synthesis of ultrasmall Ho2O3 nanoparticles coated with PEI1200 and PEI60000 (Mn = 1200 and 60,000 amu, respectively).
Nanomaterials 12 01588 g001
Figure 2. HRTEM images of (a) PEI1200- and (b) PEI60000-coated ultrasmall Ho2O3 nanoparticles. Dotted circles indicate individual nanoparticles. Large dotted circles in (b) indicate nanoparticles grafted together with one PEI60000. (c) Particle diameter distributions and log-normal function fits of PEI1200- and PEI60000-coated ultrasmall Ho2O3 nanoparticles. EDS spectra of (d) PEI1200- and (e) PEI60000-coated ultrasmall Ho2O3 nanoparticles.
Nanomaterials 12 01588 g002aNanomaterials 12 01588 g002b
Figure 3. (a) Images of PEI1200- and PEI60000-coated ultrasmall Ho2O3 nanoparticles in aqueous media (vials on the left and right-side, respectively) with a concentration of ~30 mM Ho. (b) DLS patterns of PEI1200- and PEI60000-coated ultrasmall Ho2O3 nanoparticles in aqueous media with log-normal function fits to the observed DLS patterns to estimate davg. (c) The zeta potential curves of PEI1200- and PEI60000-coated ultrasmall Ho2O3 nanoparticles in aqueous media. (d) Tyndall effect (or light scattering by the nanoparticle colloids) of PEI1200- and PEI60000-coated ultrasmall Ho2O3 nanoparticles in aqueous media (samples on the middle and right-side, respectively), establishing the colloidal dispersion of PEI-coated nanoparticles in aqueous media; no such light scattering is observed in triple-distilled water (sample on the left). Arrows show laser light scattering by nanoparticle colloids.
Nanomaterials 12 01588 g003
Figure 4. XRD patterns before (i.e., as-prepared) and after TGA of (a) PEI1200- and (b) PEI60000-coated ultrasmall Ho2O3 nanoparticles. The (222), (400), (440), and (622) assignments on the XRD peaks after TGA are the (hkl) Miller indices of cubic Ho2O3. All peaks after TGA are assigned with the (hkl) Miller indices of cubic Ho2O3.
Nanomaterials 12 01588 g004
Figure 5. (a) FT-IR absorption spectra of PEI1200 and PEI60000 and PEI1200- and PEI60000-coated ultrasmall Ho2O3 nanoparticles. Subscripts “s” and “b” indicate stretching and bending vibrations, respectively. (b) TGA curves of PEI1200- and PEI60000-coated ultrasmall Ho2O3 nanoparticles. (c) PEI-coating structure: each nanoparticle is grafted with approximately fifteen PEI1200 polymers (left), multiple hard acid–hard base type of bondings (middle), and approximately two nanoparticles grafted with one PEI60000 polymer (left).
Nanomaterials 12 01588 g005
Figure 6. (a) In vitro cell viabilities after normalization with untreated control cells (0.0 mM Ho). 10% (v/v) DMSO was used as a positive control. (b) Optical microscopy images of the DU145 cells 48 h after incubation with PEI1200- and PEI60000-coated ultrasmall Ho2O3 nanoparticles. (c) Optical microscopy images of the DU145 cells 48 h after incubation with 10% (v/v) DMSO and 28 μM PEI1200.
Nanomaterials 12 01588 g006
Figure 7. Mass-corrected M–H curves of the PEI1200- and PEI60000-coated ultrasmall Ho2O3 nanoparticles at 300 K obtained using the net masses of Ho2O3 nanoparticles without PEI, which were estimated from the TGA curves.
Nanomaterials 12 01588 g007
Figure 8. (a) Plots of inverse relaxation times 1/T1 and 1/T2 as a function of Ho concentration for PEI1200- and PEI60000-coated ultrasmall Ho2O3 nanoparticles in aqueous media at 3.0 T and 22 °C; the slopes yield r1 and r2 values, respectively. (b) R1 and R2 map images.
Nanomaterials 12 01588 g008
Table 1. Summary of the observed physicochemical properties of PEI1200- and PEI60000-coated ultrasmall Ho2O3 nanoparticles.
Liganddavg (nm)aavg (nm)Sample Solution pHζ (mV)Surface-Coating Result
P a (wt.%)σ b (L/nm2)NNP c
PEI12002.0530.17.0−7.519.943.11.1515
PEI600001.9052.57.0–7.520.760.30.04320.49
a Average surface-coating amount in wt.% per nanoparticle. b Average grafting density (i.e., average number of PEI polymers coating a nanoparticle unit surface area). c Average number of PEI polymers coating a nanoparticle.
Table 2. Observed FT-IR absorption frequencies (in cm−1) a.
(O-H) s(N-H) s(C-H) s(N-H) b(C-N) s
PEI12003360329129,452,83316541115
PEI600003362329129,452,83316561106
PEI1200-Ho2O3--297016491112
PEI60000-Ho2O3-326929,462,82216501110
a Subscripts “s” and “b” indicate stretching and bending vibrations, respectively.
Table 3. Magnetic properties and water proton spin relaxivities.
NanoparticleMagnetic Properties at 300 KWater Proton Spin Relaxivities (s−1mM−1) at 22 °C and 3.0 T
MagnetismNet M (emu/g) at 2 Tr1r2
PEI1200-Ho2O3Paramagnetism4.750.1 13.1
PEI60000-Ho2O3Paramagnetism4.900.1 9.9
Publisher’s Note: MDPI stays neutral with regard to jurisdictional claims in published maps and institutional affiliations.

