

Degradation of Methylparaben Using Optimal WO3 Nanostructures: Influence of the Annealing Conditions and Complexing Agent

Abstract
:
1. Introduction
2. Materials and Methods
2.1. Materials
2.2. WO3 Nanostructures Fabrication
2.3. Nanostructures Characterization
2.4. PEC Degradation
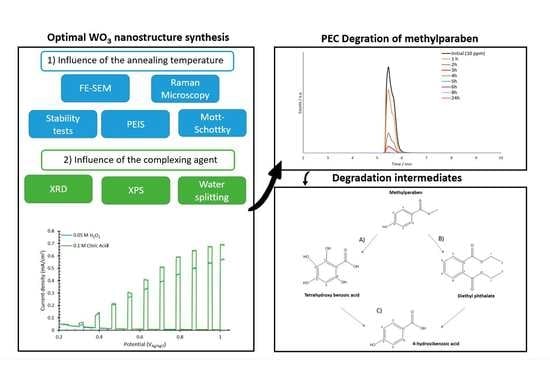
3. Results
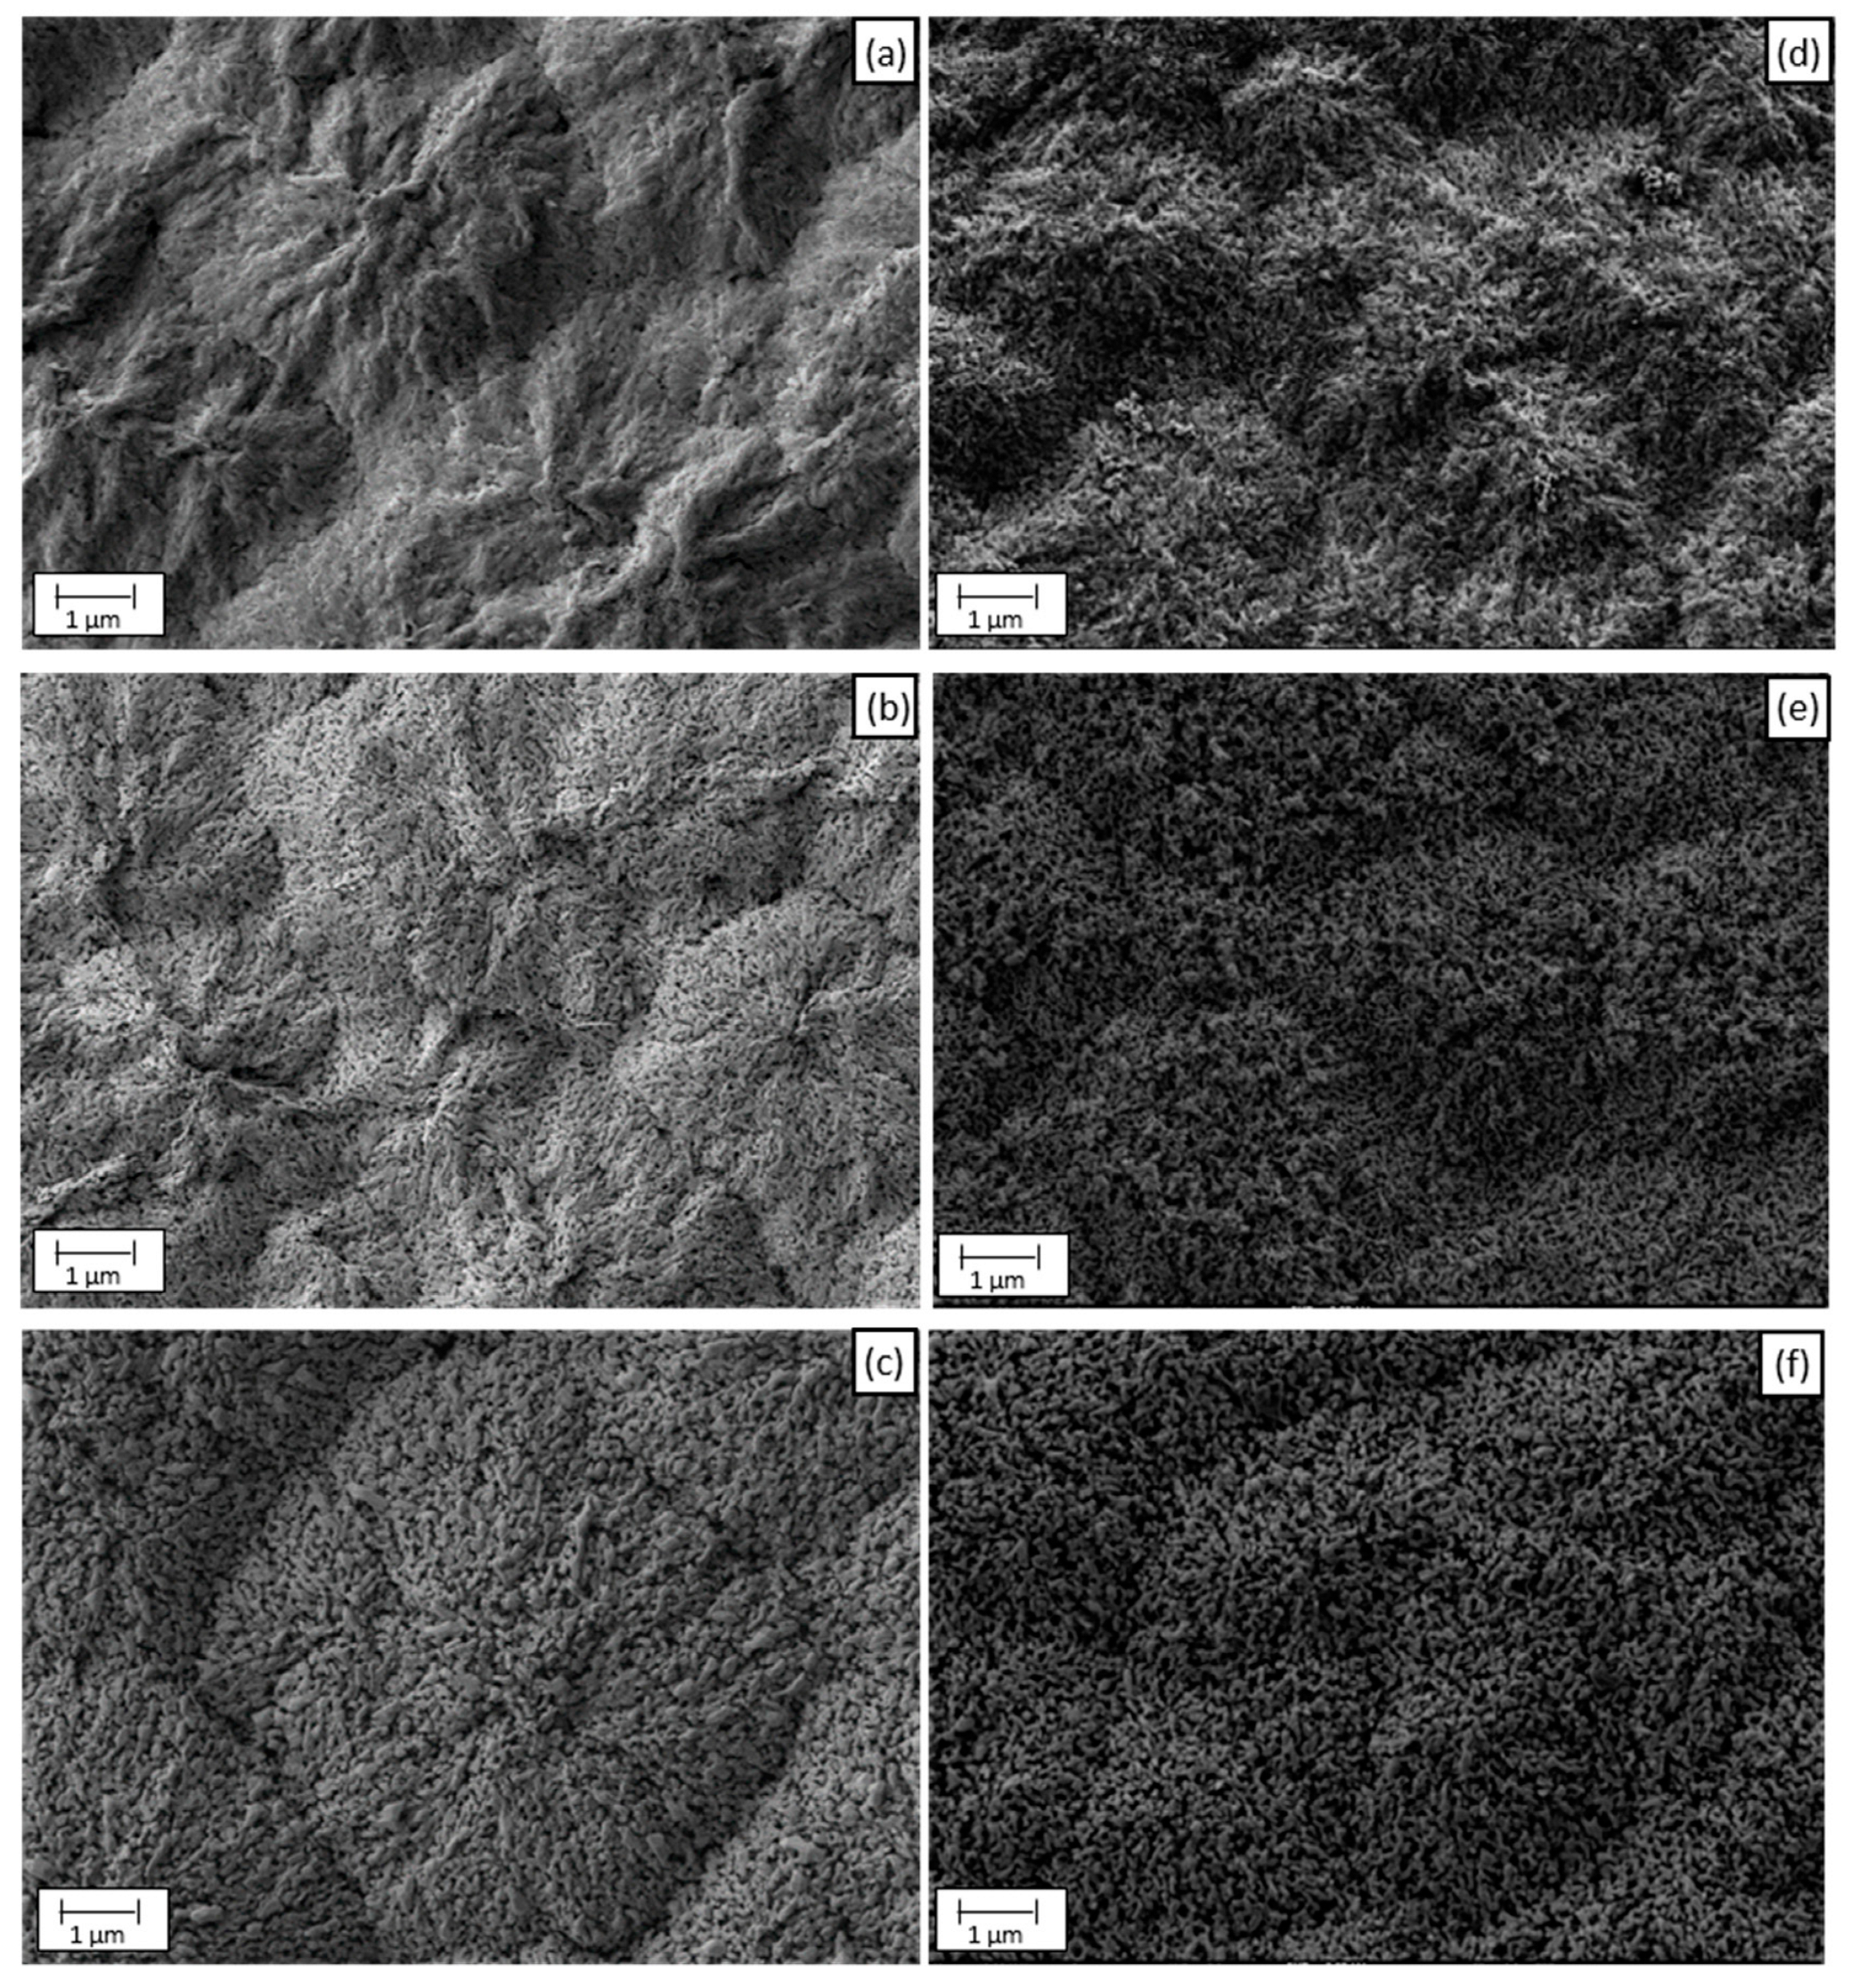
3.1. FE-SEM
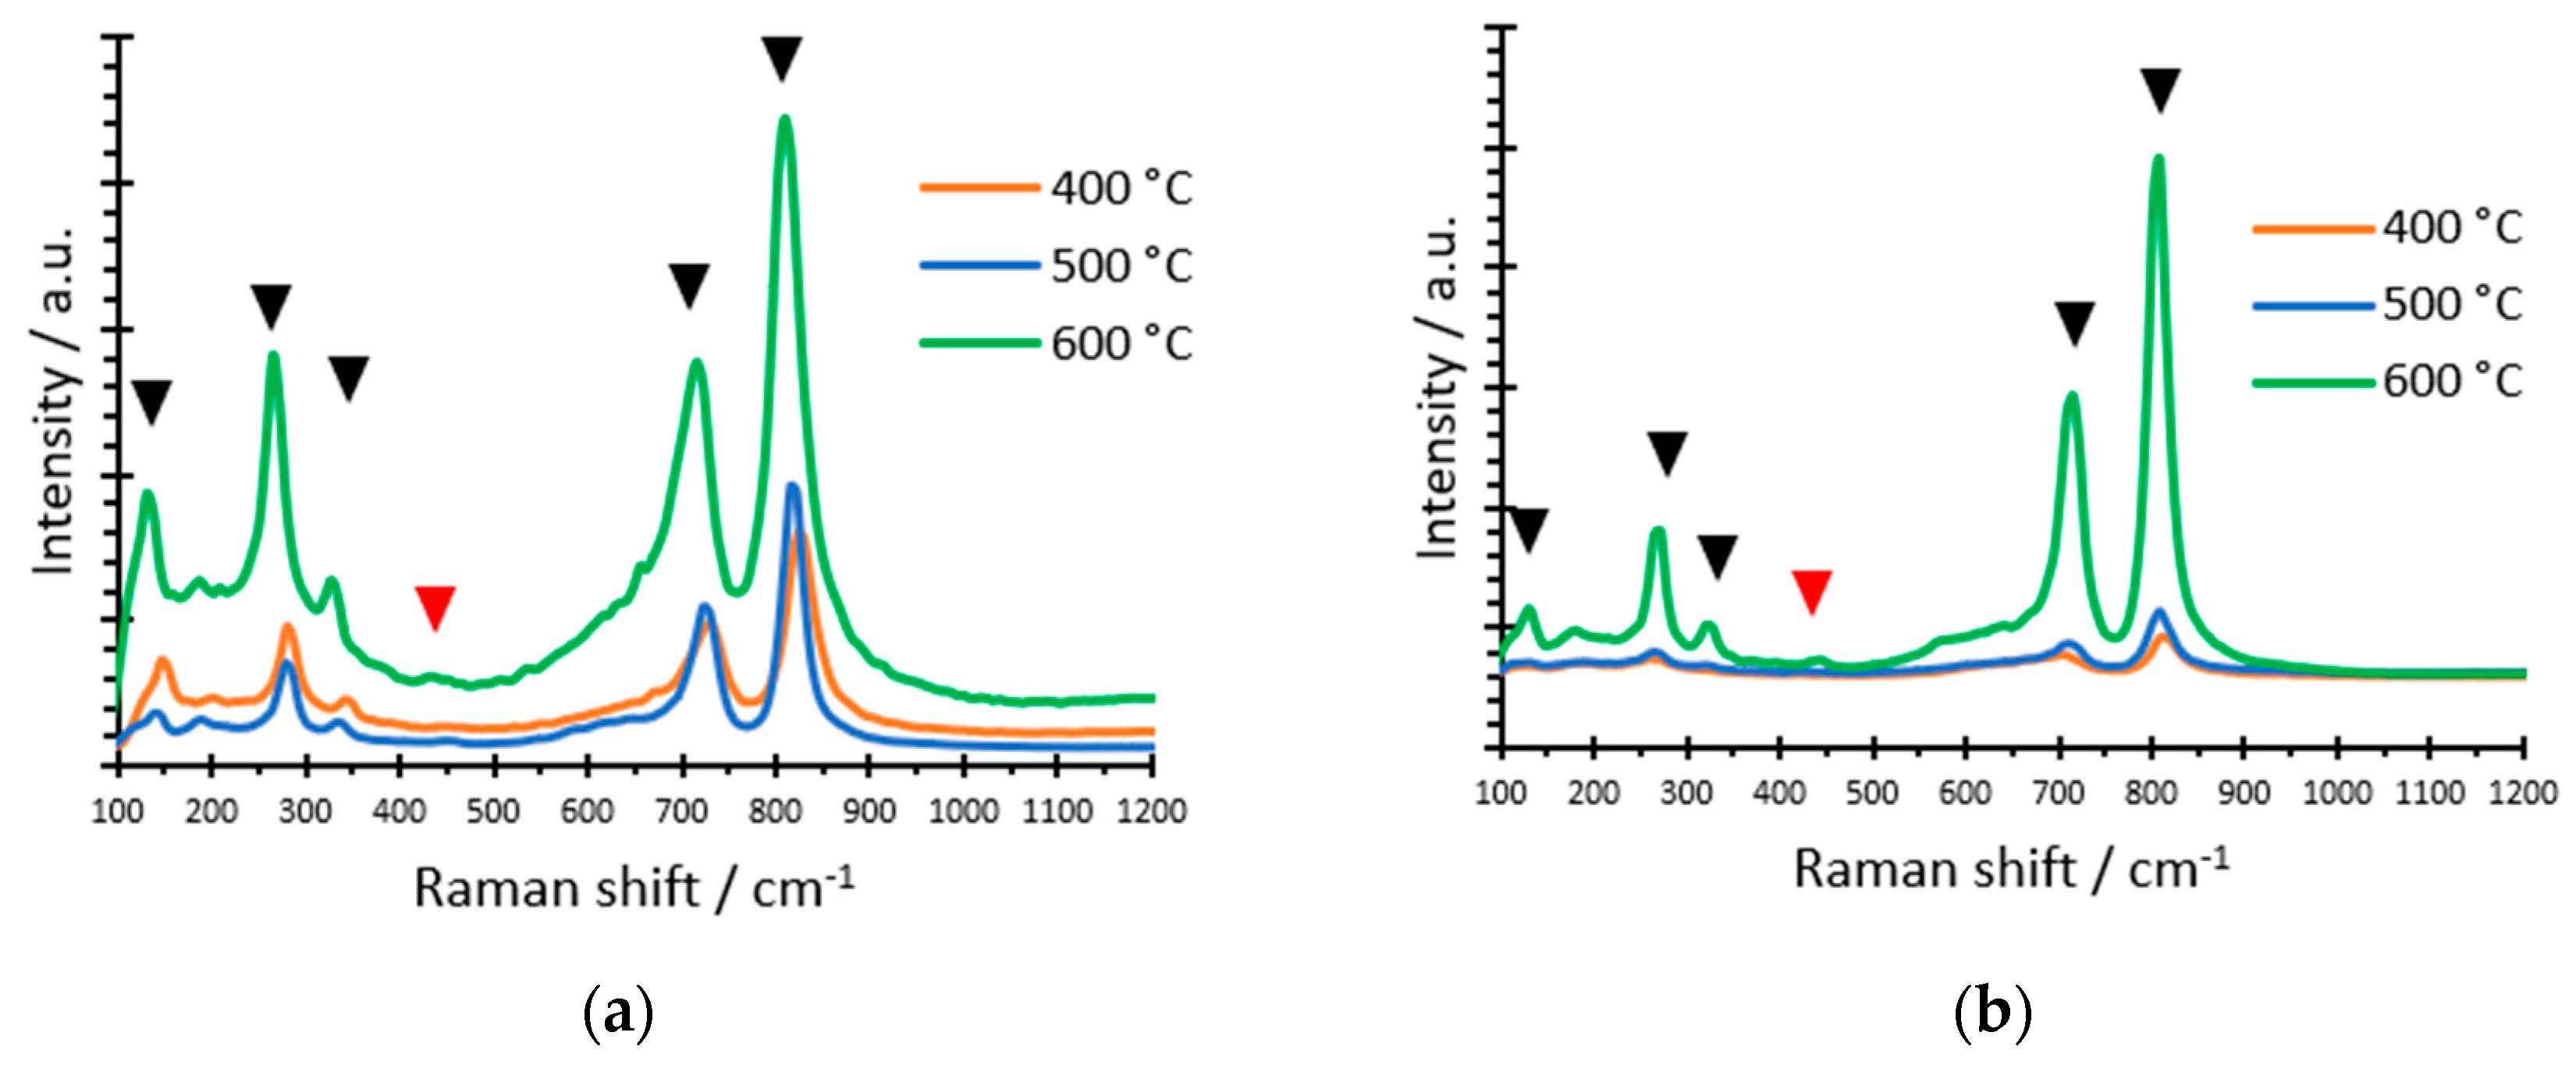
3.2. Raman
3.3. Stability Test
3.4. PEIS
3.5. XRD
3.6. AFM
3.7. XPS
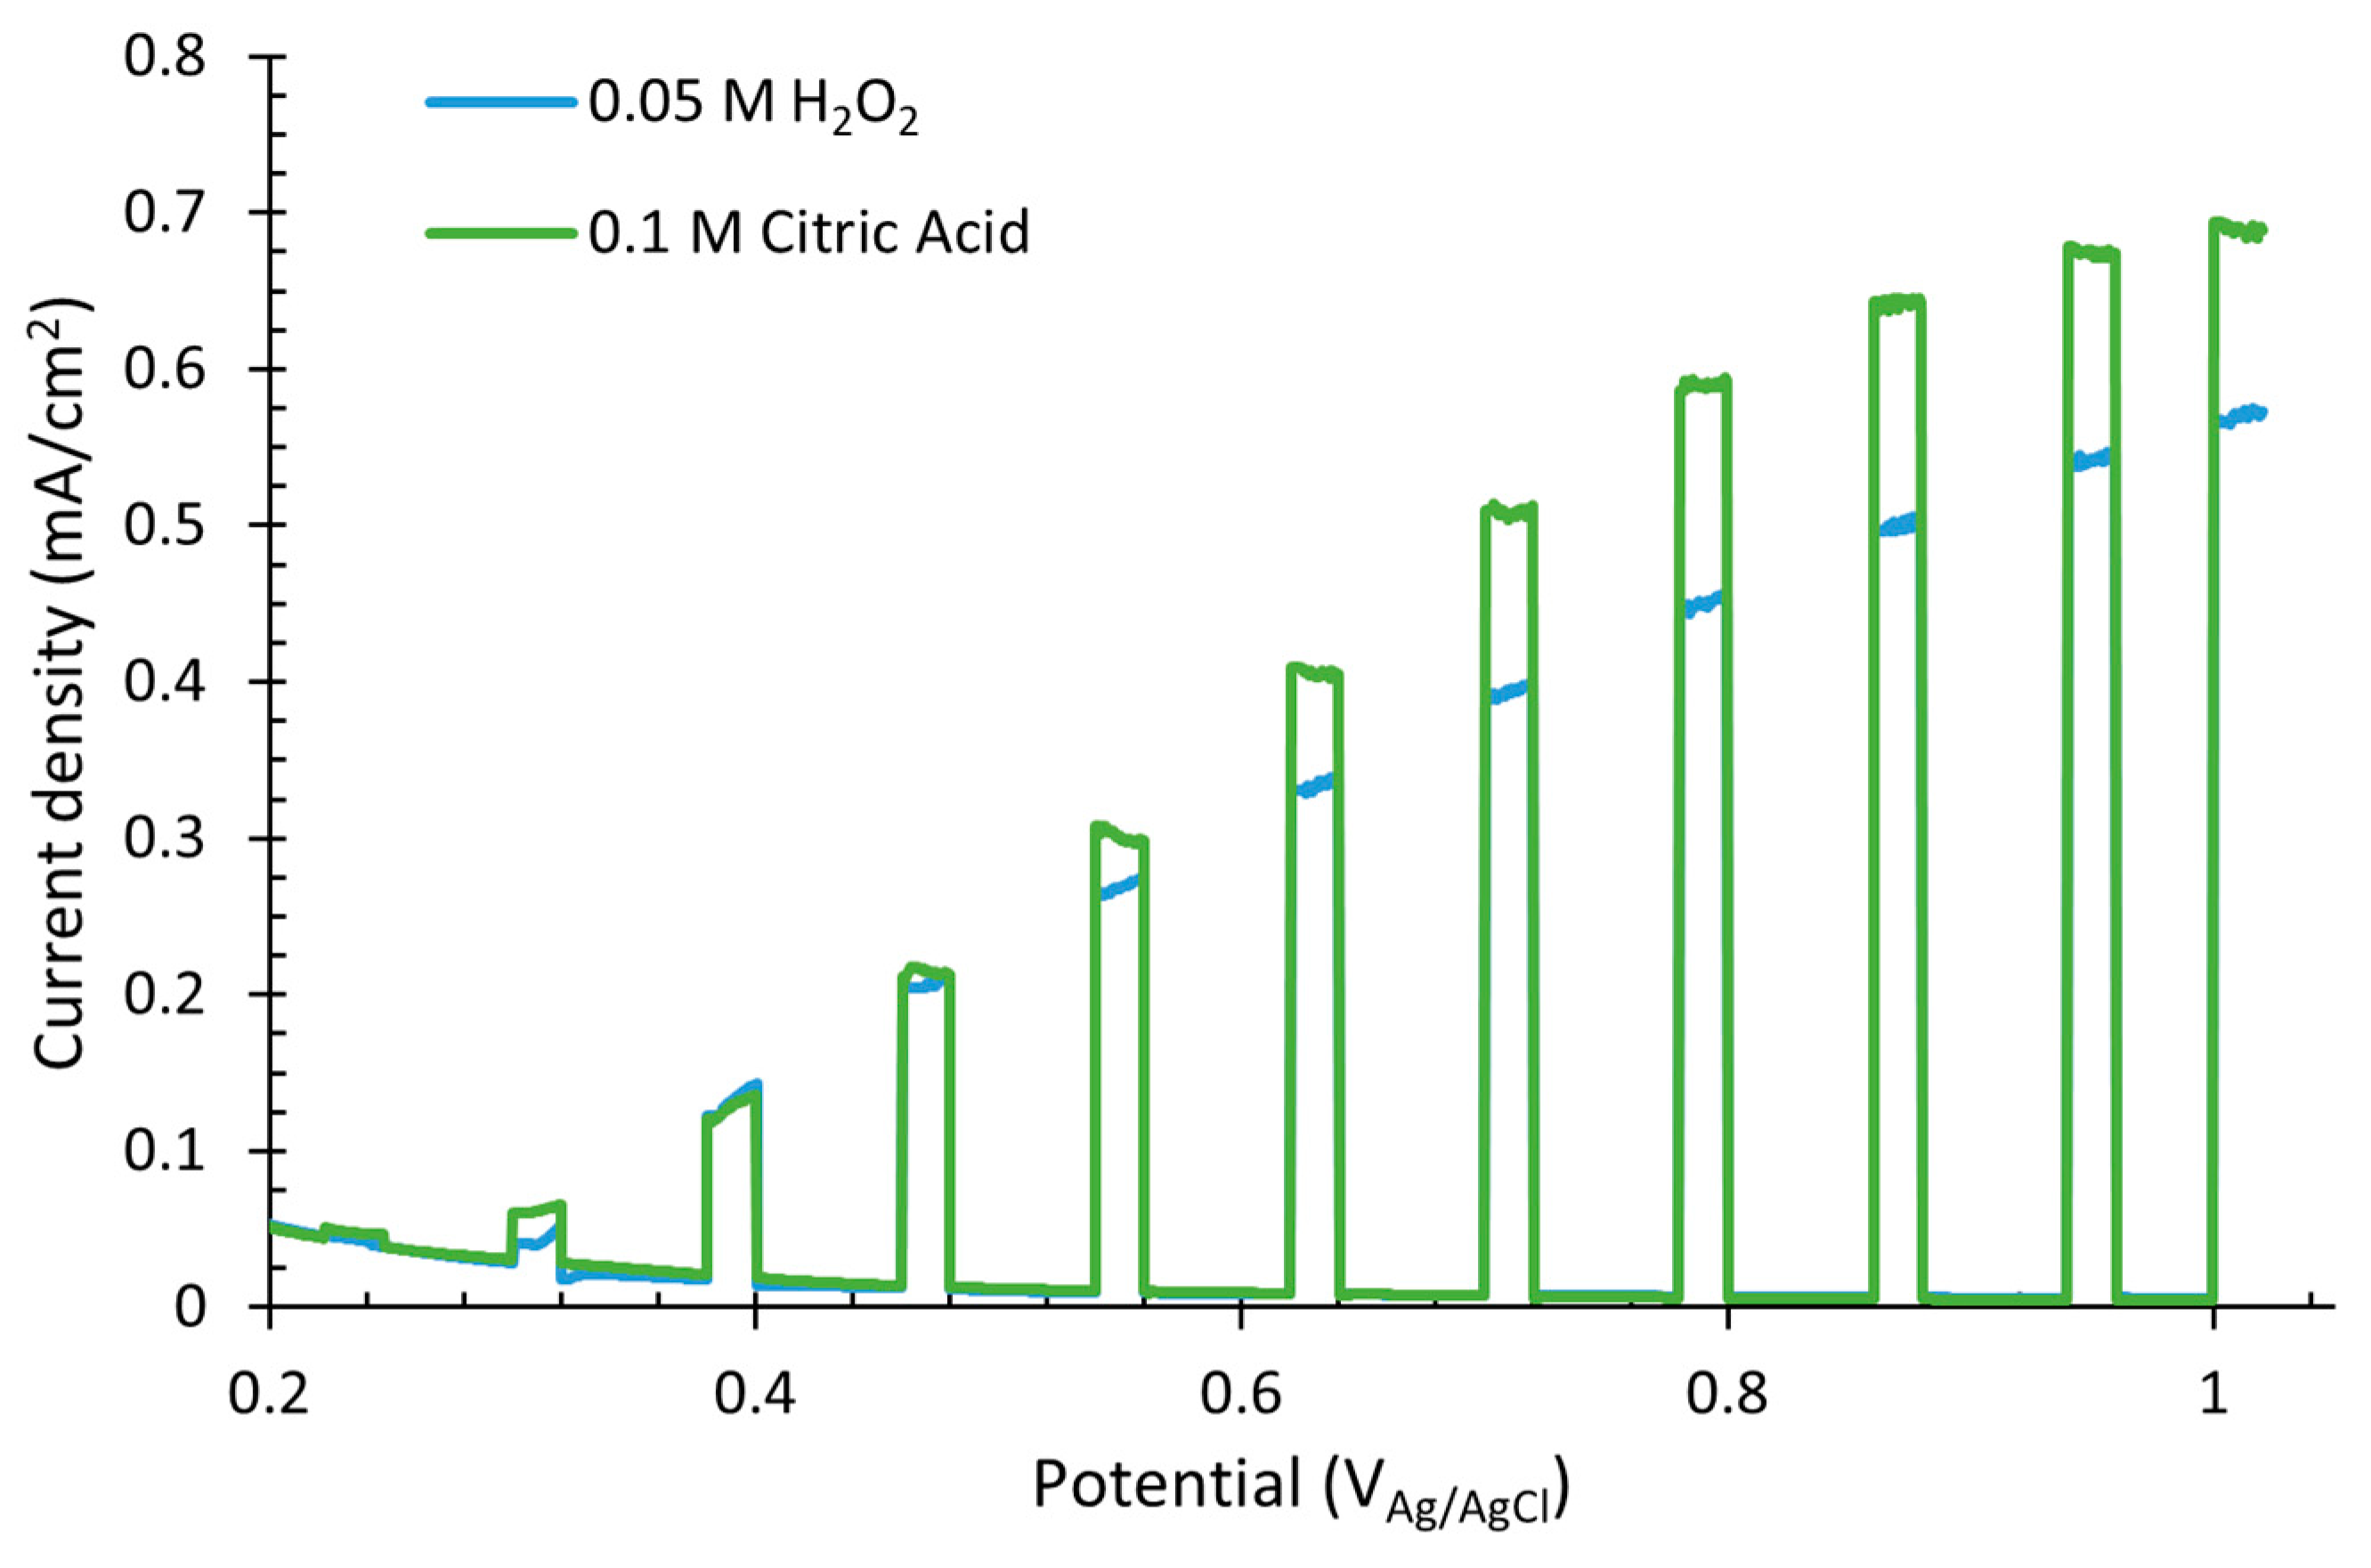
3.8. Water Splitting Tests
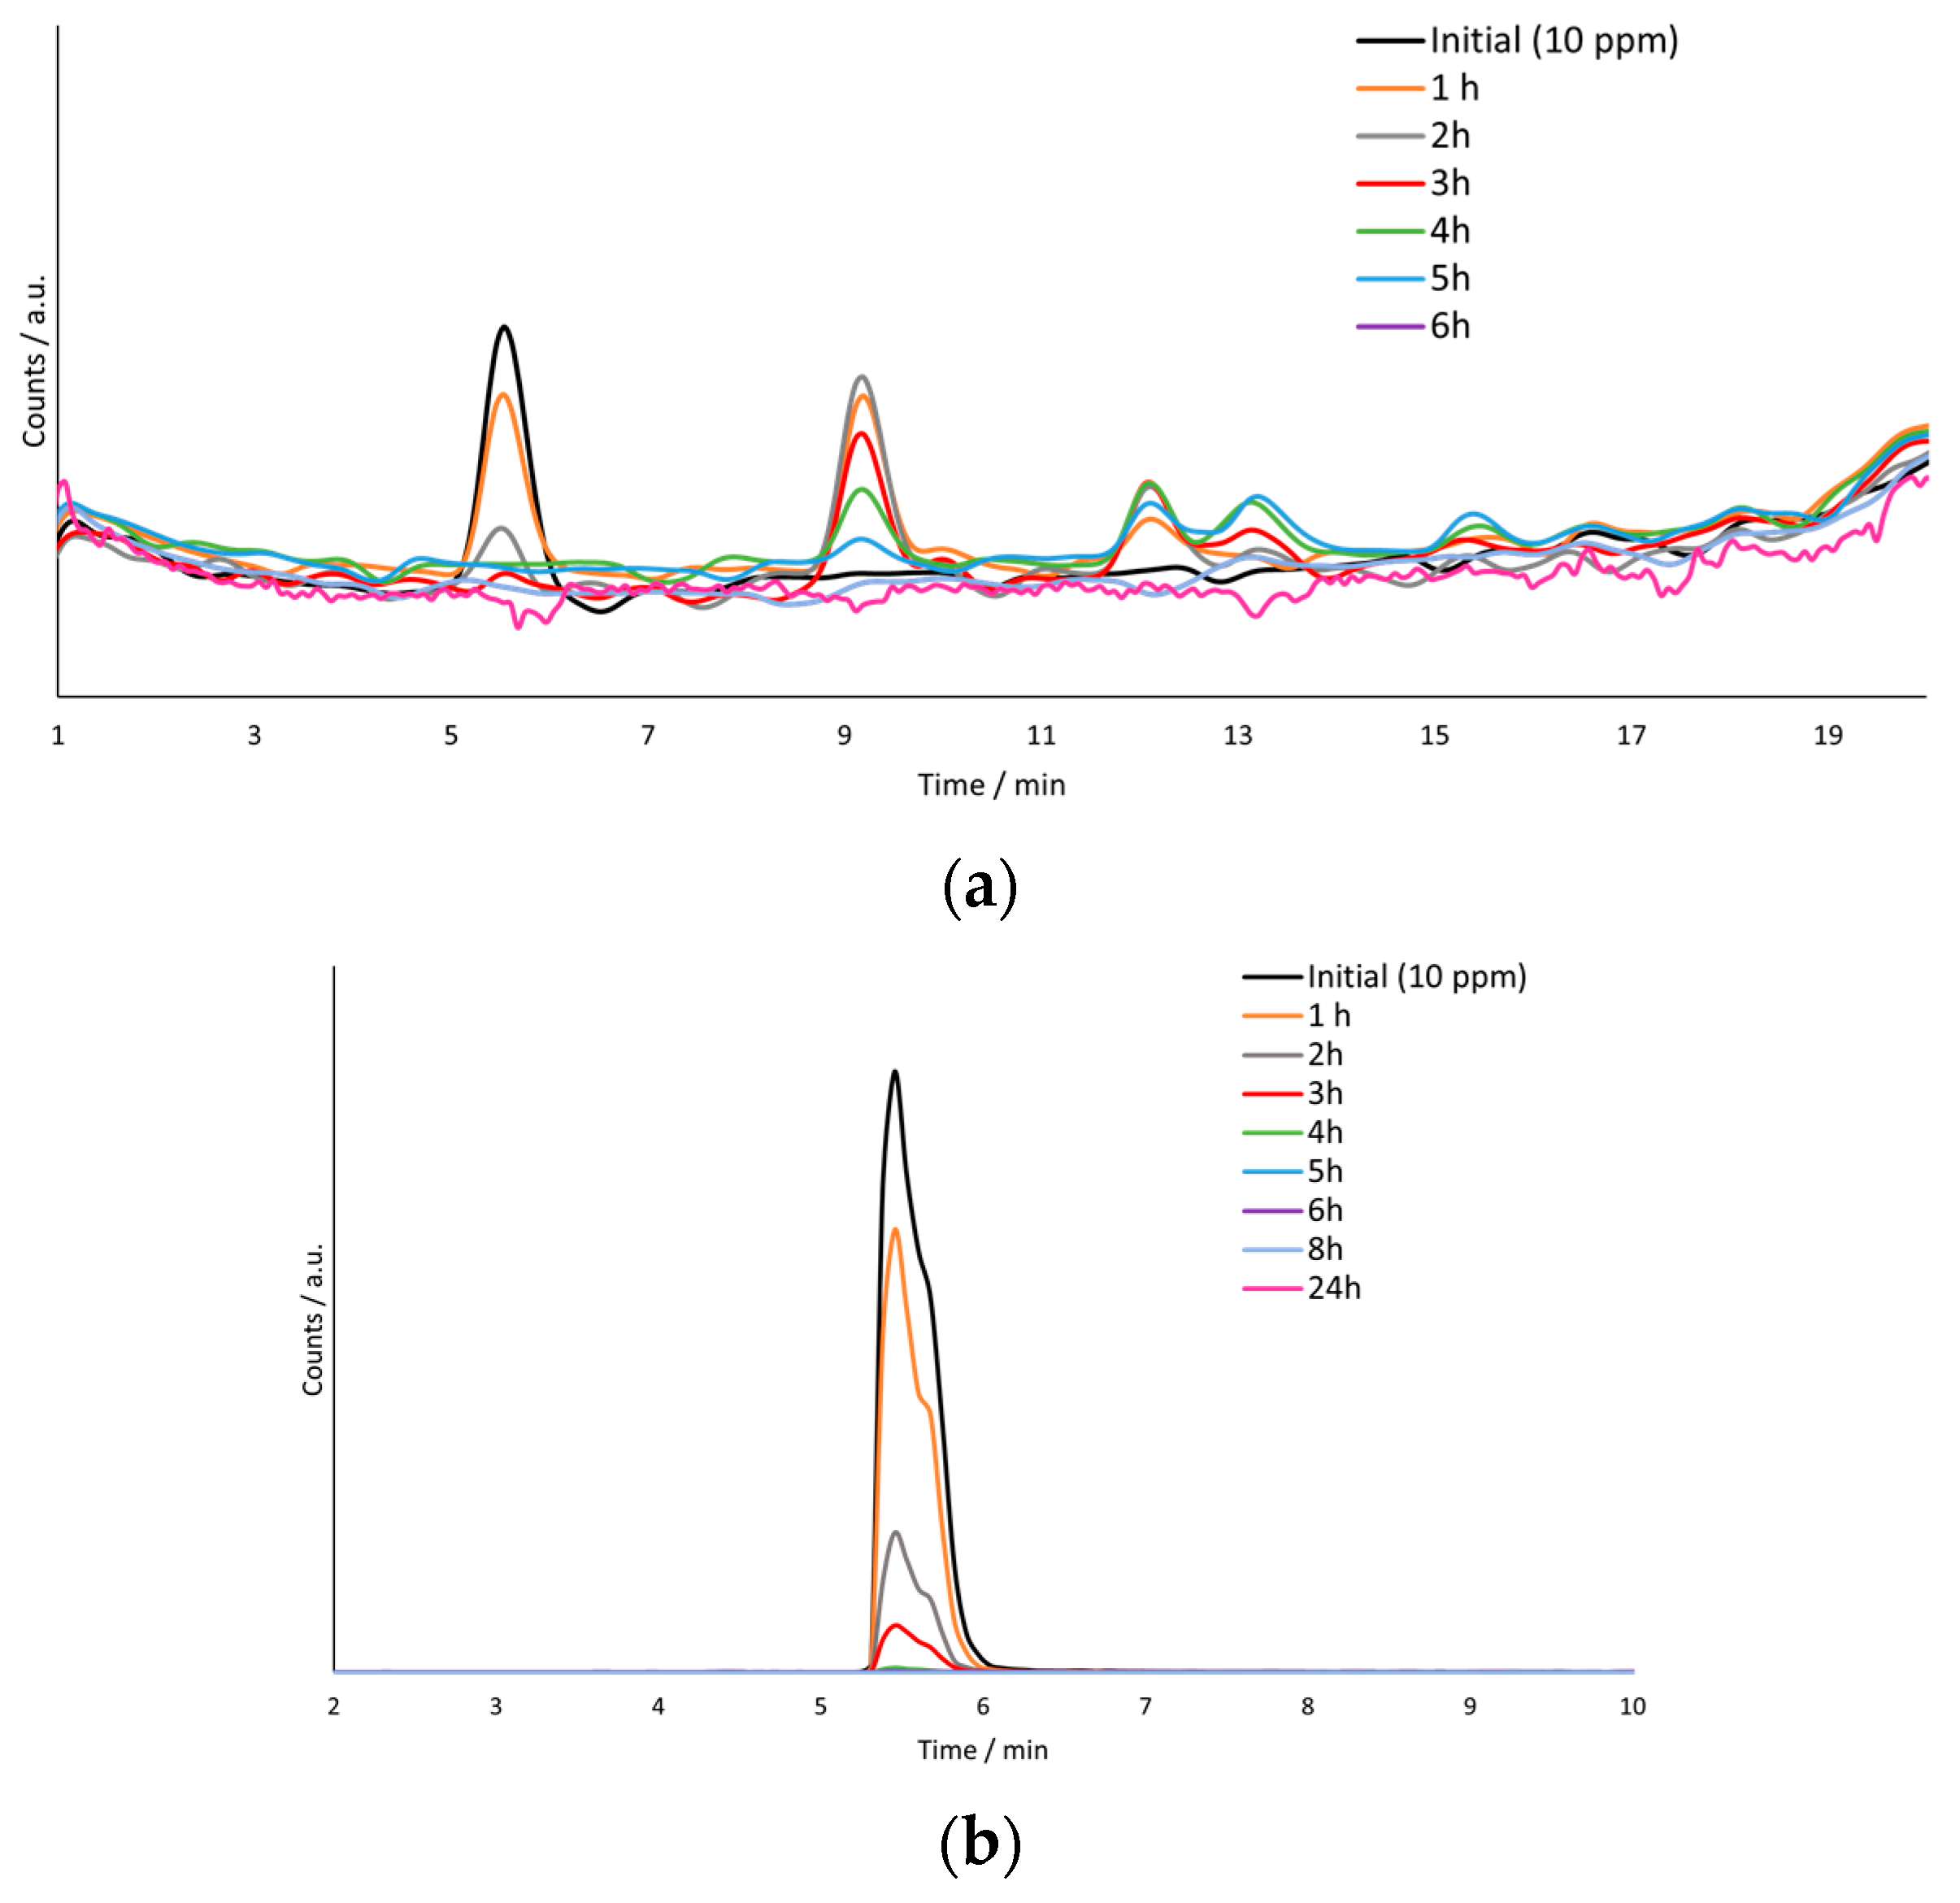
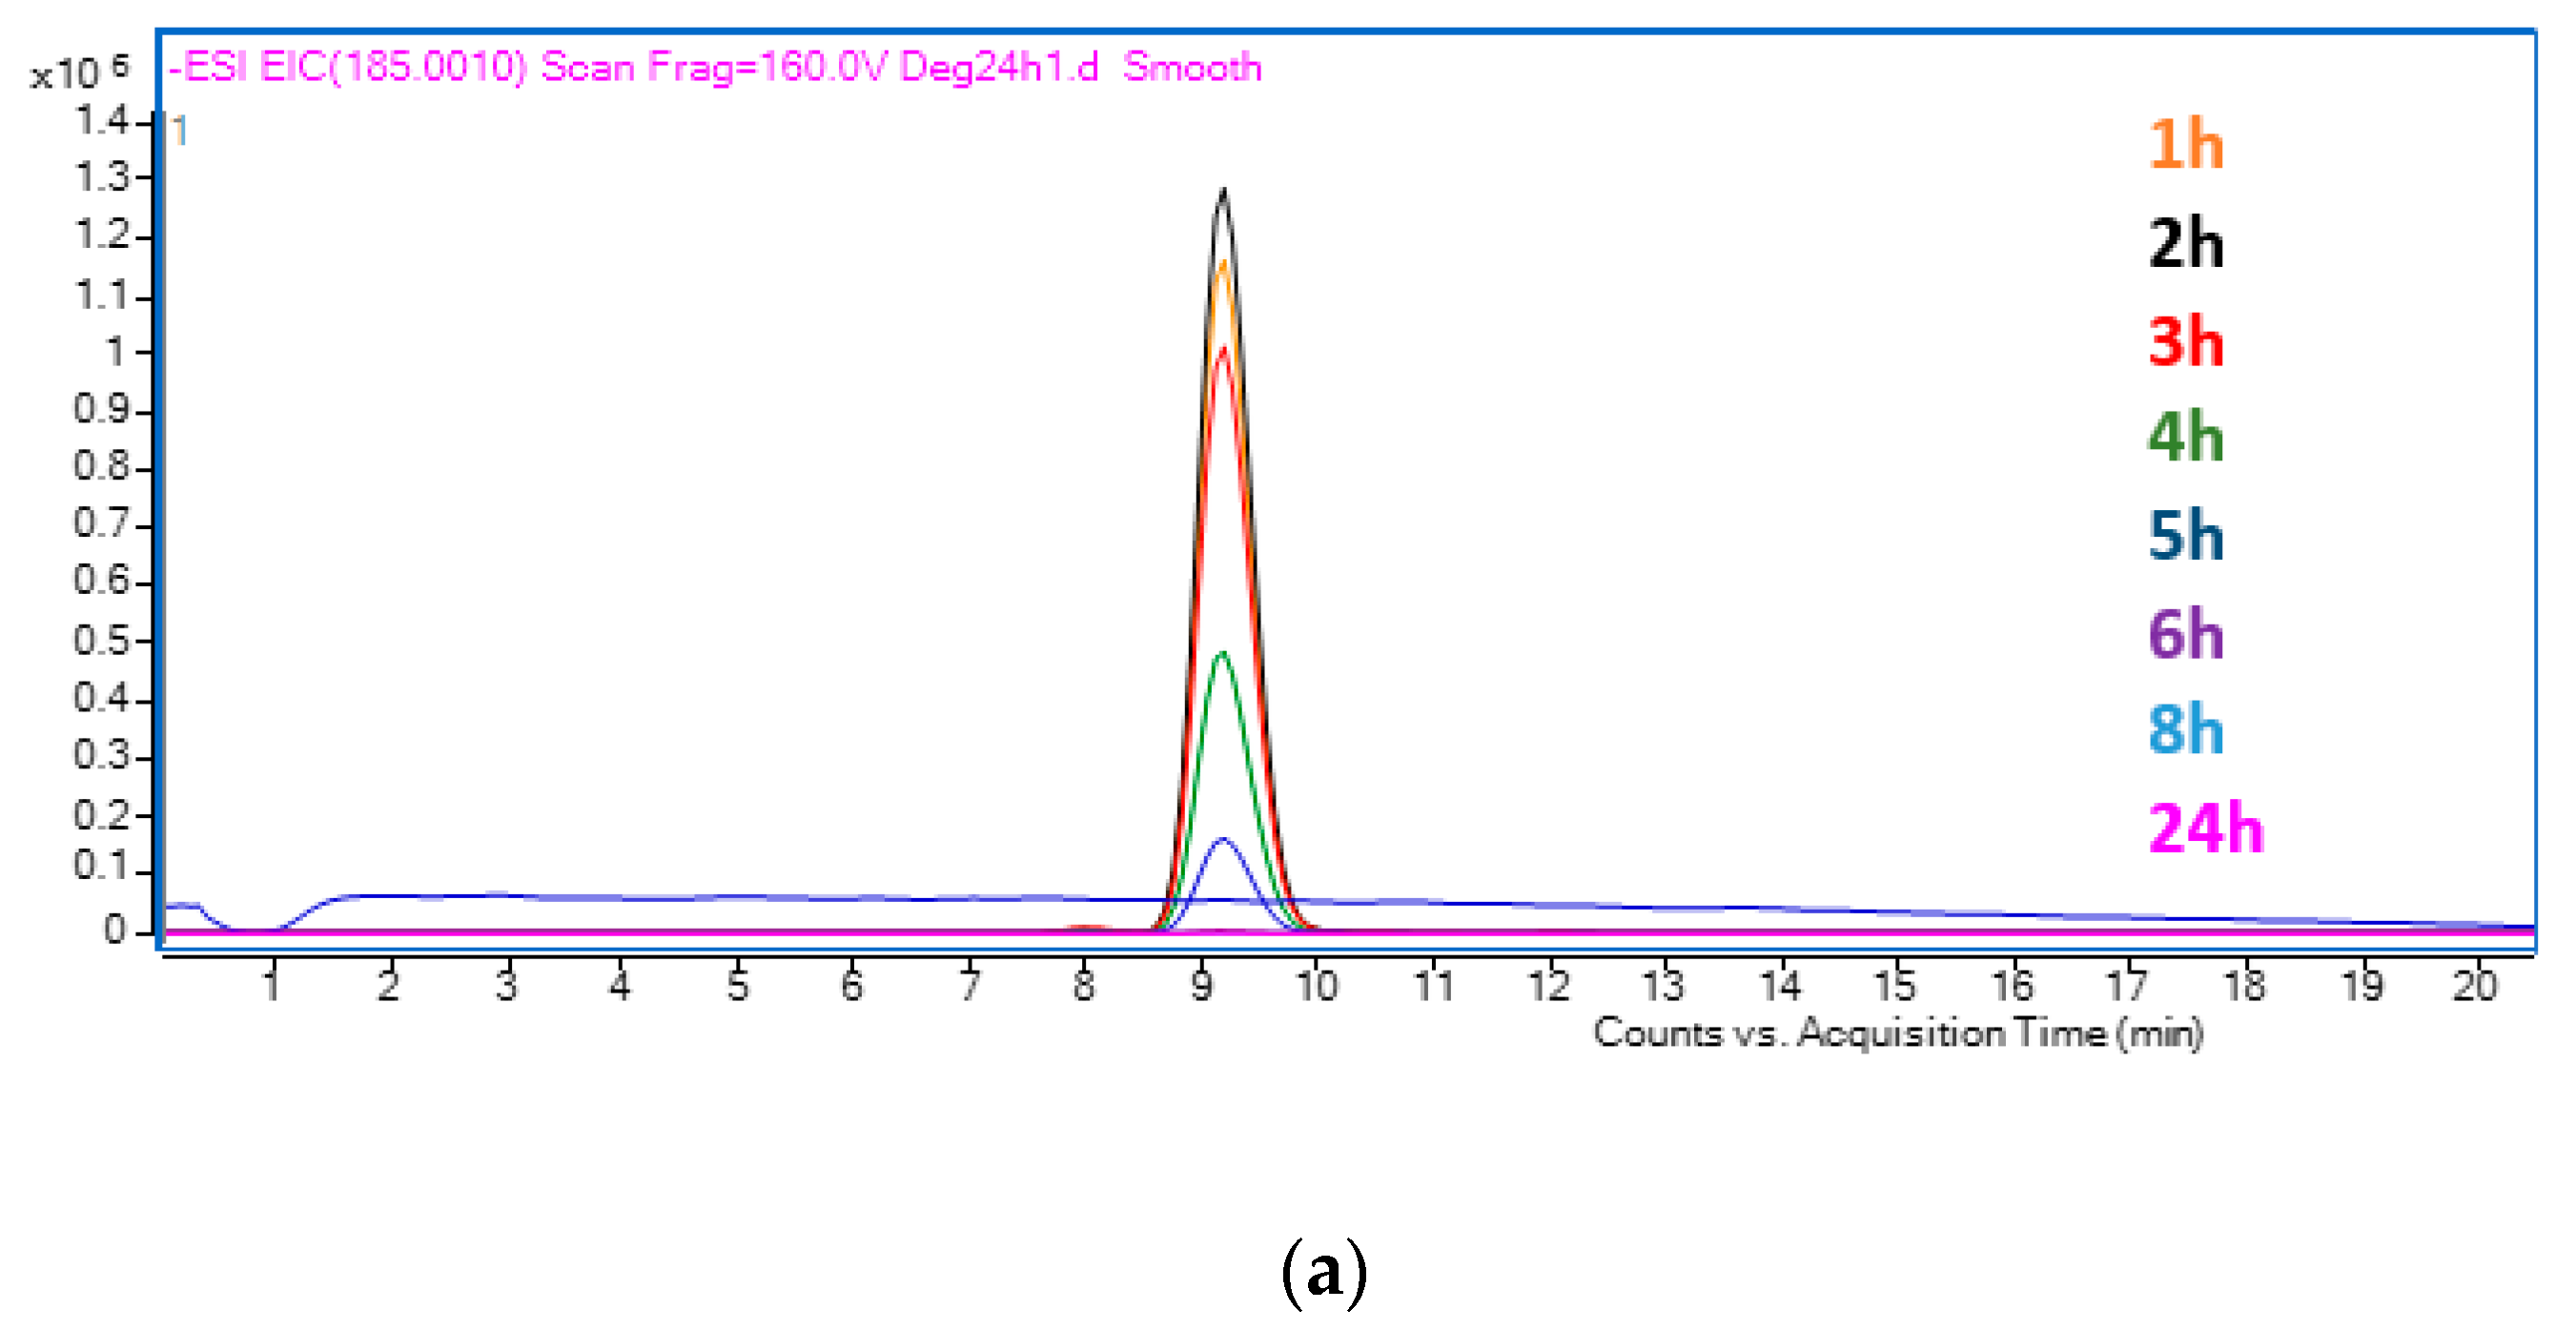
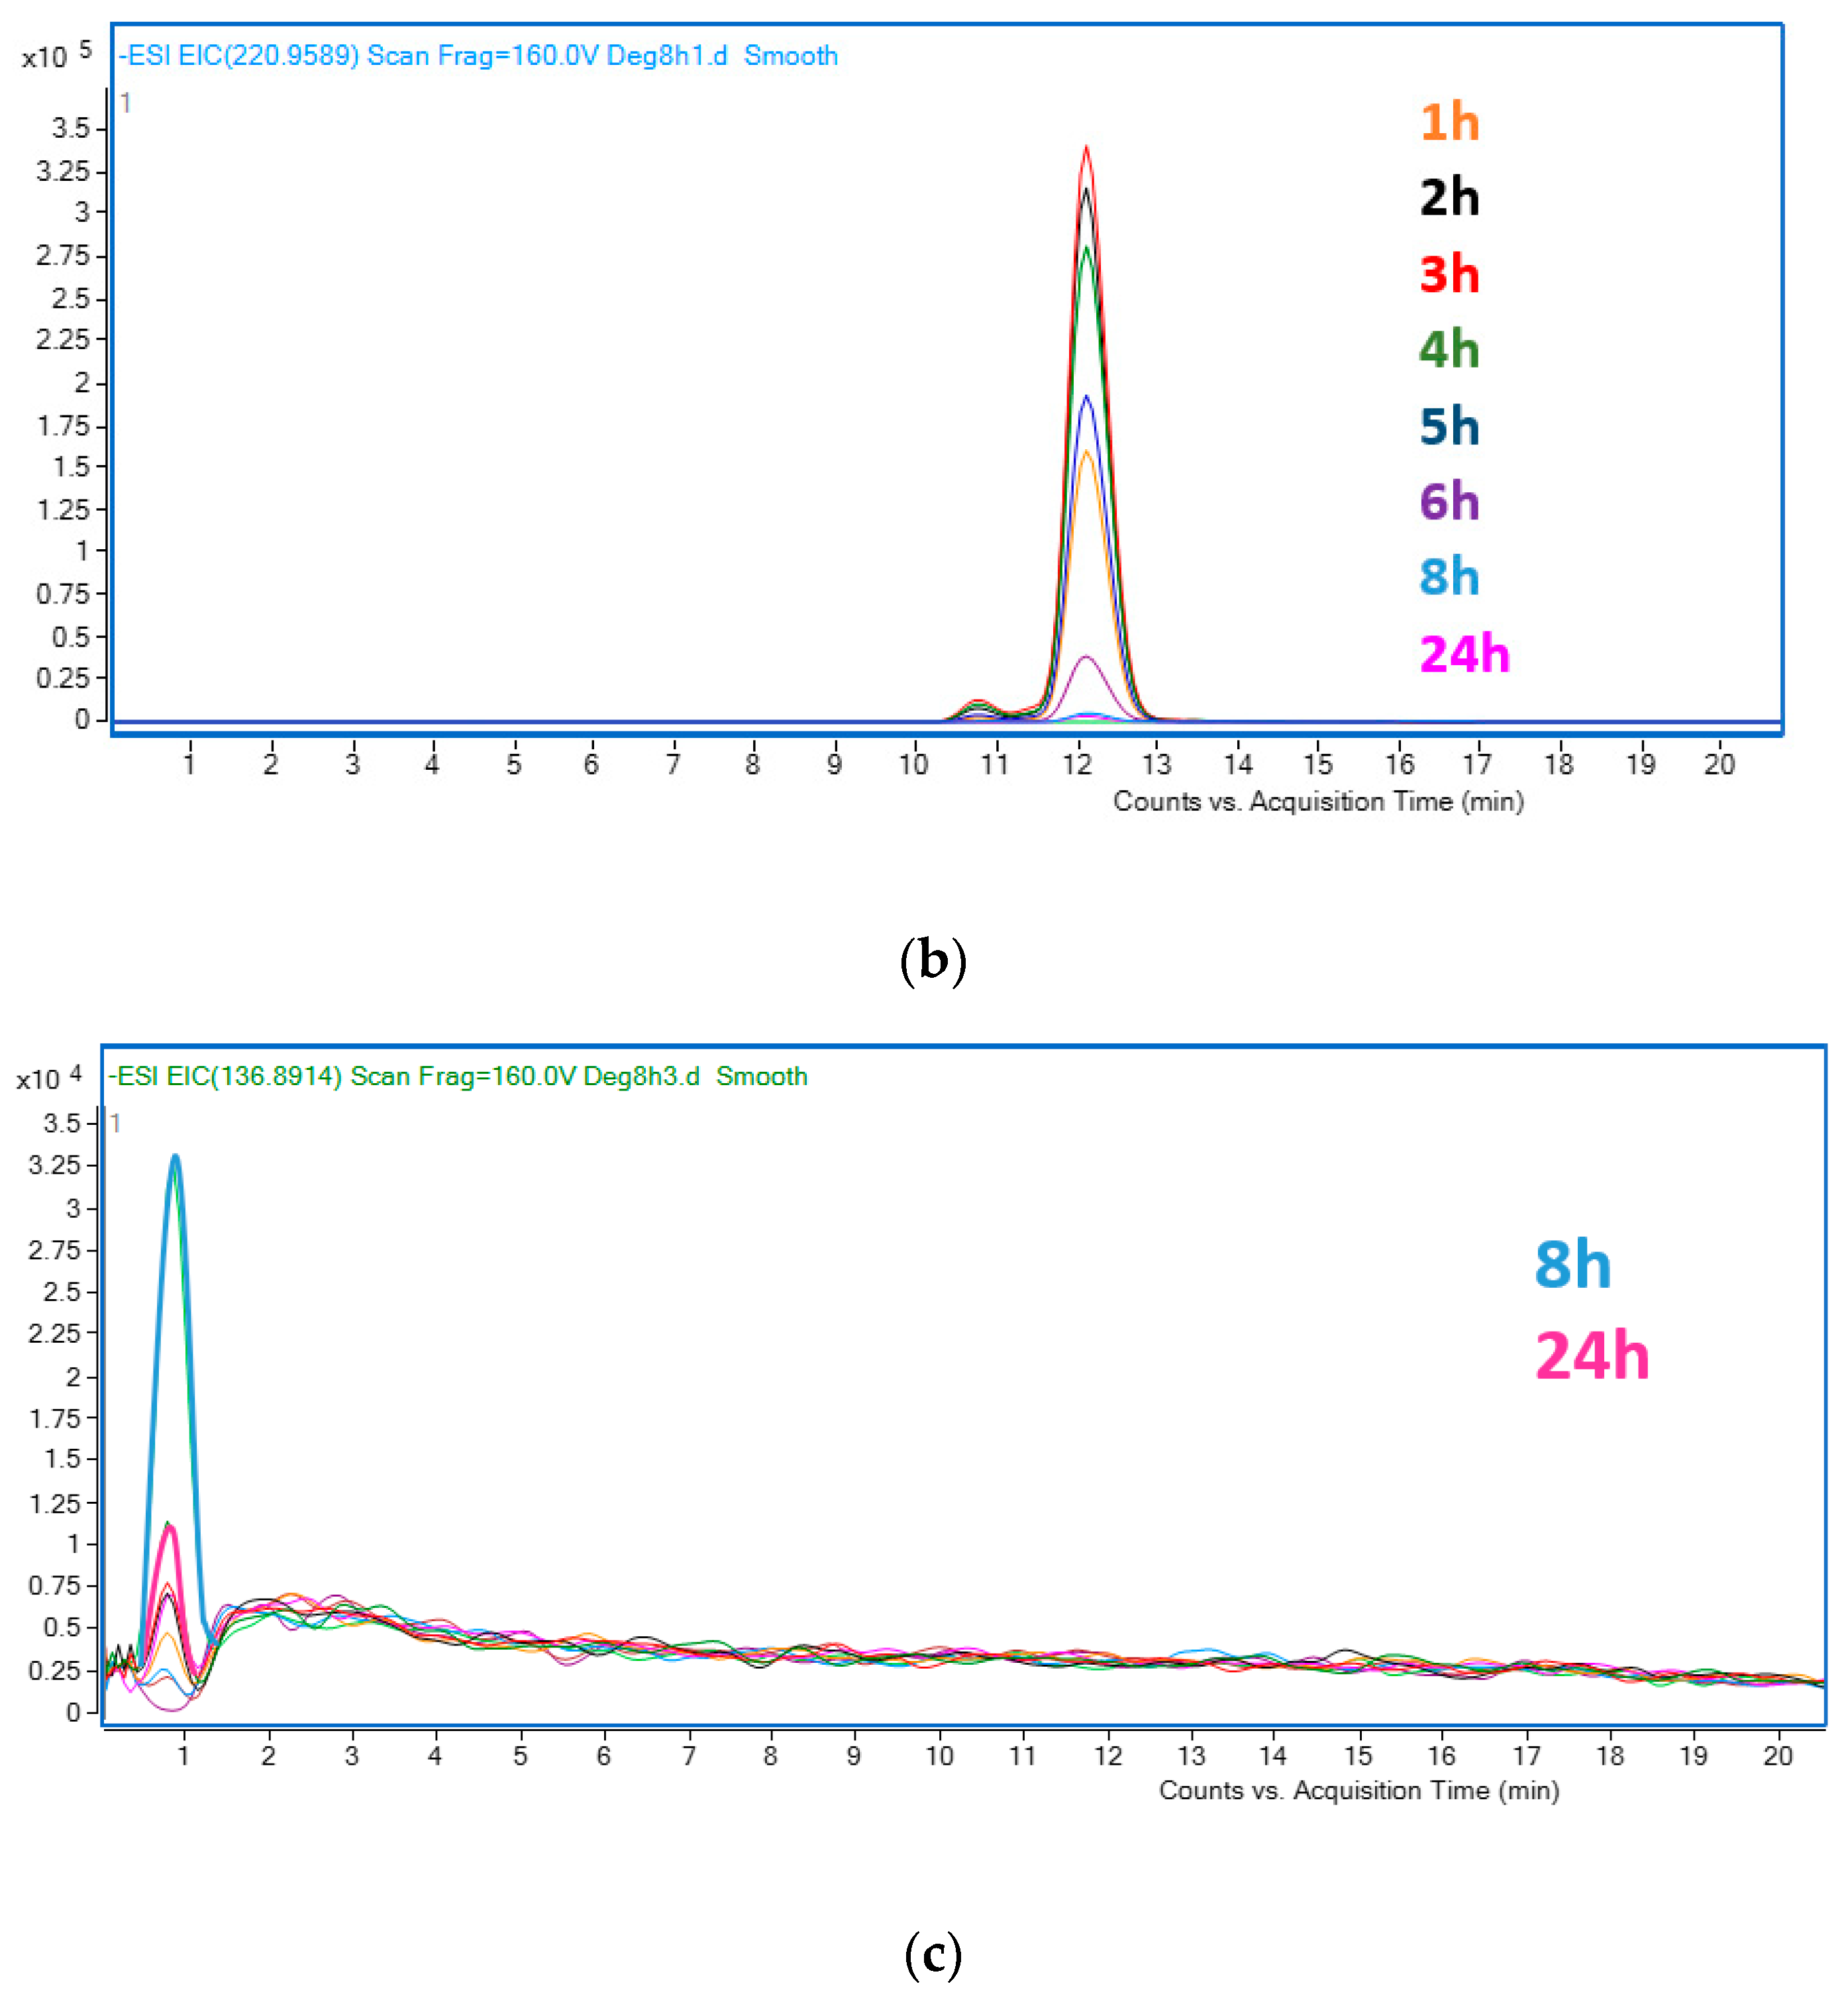
3.9. Photoelectrocatalytic Degradation of Methylparaben
4. Conclusions
Supplementary Materials
Author Contributions
Funding
Data Availability Statement
Acknowledgments
Conflicts of Interest
References
- Marta-Sanchez, A.V.; Caldas, S.S.; Schneider, A.; Cardoso, S.M.V.S.; Primel, E.G. Trace Analysis of Parabens Preservatives in Drinking Water Treatment Sludge, Treated, and Mineral Water Samples. Environ. Sci. Pollut. Res. 2018, 25, 14460–14470. [Google Scholar] [CrossRef] [PubMed]
- Błędzka, D.; Gromadzińska, J.; Wąsowicz, W. Parabens. From Environmental Studies to Human Health. Environ. Int. 2014, 67, 27–42. [Google Scholar] [CrossRef] [PubMed]
- Márquez-Sillero, I.; Aguilera-Herrador, E.; Cárdenas, S.; Valcárcel, M. Determination of Parabens in Cosmetic Products Using Multi-Walled Carbon Nanotubes as Solid Phase Extraction Sorbent and Corona-Charged Aerosol Detection System. J. Chromatogr. A 2010, 1217, 1–6. [Google Scholar] [CrossRef] [PubMed]
- Larsson, K.; Ljung Björklund, K.; Palm, B.; Wennberg, M.; Kaj, L.; Lindh, C.H.; Jönsson, B.A.G.; Berglund, M. Exposure Determinants of Phthalates, Parabens, Bisphenol A and Triclosan in Swedish Mothers and Their Children. Environ. Int. 2014, 73, 323–333. [Google Scholar] [CrossRef] [Green Version]
- Dhaka, S.; Kumar, R.; Khan, M.A.; Paeng, K.J.; Kurade, M.B.; Kim, S.J.; Jeon, B.H. Aqueous Phase Degradation of Methyl Paraben Using UV-Activated Persulfate Method. Chem. Eng. J. 2017, 321, 11–19. [Google Scholar] [CrossRef]
- Soni, M.G.; Taylor, S.L.; Greenberg, N.A.; Burdock, G.A. Evaluation of the Health Aspects of Methyl Paraben: A Review of the Published Literature. Food Chem. Toxicol. 2002, 40, 1335–1373. [Google Scholar] [CrossRef]
- Zúñiga-Benítez, H.; Peñuela, G.A. Degradation of Ethylparaben under Simulated Sunlight Using Photo-Fenton. Water Sci. Technol. 2015, 73, 818–826. [Google Scholar] [CrossRef]
- Zúñiga-Benítez, H.; Peñuela, G.A. Methylparaben Removal Using Heterogeneous Photocatalysis: Effect of Operational Parameters and Mineralization/Biodegradability Studies. Environ. Sci. Pollut. Res. 2017, 24, 6022–6030. [Google Scholar] [CrossRef]
- Zhang, A.; Li, Y. Removal of Phenolic Endocrine Disrupting Compounds from Waste Activated Sludge Using UV, H2O2, and UV/H2O2 Oxidation Processes: Effects of Reaction Conditions and Sludge Matrix. Sci. Total Environ. 2014, 493, 307–323. [Google Scholar] [CrossRef]
- Liu, Z.; Kanjo, Y.; Mizutani, S. Removal Mechanisms for Endocrine Disrupting Compounds (EDCs) in Wastewater Treatment —Physical Means, Biodegradation, and Chemical Advanced Oxidation: A Review. Sci. Total Environ. 2009, 407, 731–748. [Google Scholar] [CrossRef]
- Rahman, M.F.; Yanful, E.K.; Jasim, S.Y.; Bragg, L.M.; Servos, M.R.; Ndiongue, S.; Borikar, D. Advanced Oxidation Treatment of Drinking Water: Part I. Occurrence and Removal of Pharmaceuticals and Endocrine-Disrupting Compounds from Lake Huron Water. Ozone Sci. Eng. 2010, 32, 217–229. [Google Scholar] [CrossRef]
- Lincho, J.; Zaleska-Medynska, A.; Martins, R.C.; Gomes, J. Nanostructured Photocatalysts for the Abatement of Contaminants by Photocatalysis and Photocatalytic Ozonation: An Overview. Sci. Total Environ. 2022, 837, 155776. [Google Scholar] [CrossRef] [PubMed]
- Peleyeju, M.G.; Arotiba, O.A. Recent Trend in Visible-Light Photoelectrocatalytic Systems for Degradation of Organic Contaminants in Water/Wastewater. Environ. Sci. Water Res. Technol. 2018, 4, 1389–1411. [Google Scholar] [CrossRef]
- Daghrir, R.; Drogui, P.; Robert, D. Photoelectrocatalytic Technologies for Environmental Applications. J. Photochem. Photobiol. A Chem. 2012, 238, 41–52. [Google Scholar] [CrossRef]
- Garcia-Segura, S.; Brillas, E. Applied Photoelectrocatalysis on the Degradation of Organic Pollutants in Wastewaters. J. Photochem. Photobiol. C Photochem. Rev. 2017, 31, 1–35. [Google Scholar] [CrossRef]
- Rosello-Marquez, G.; Fernandez-Domene, R.M.; Sanchez-Tovar, R.; Cifre-Herrando, M.; Garcia-Anton, J. Degradation of Diazinon Based on Photoelectrocatalytic Technique Using Enhanced WO3nanostructures: Mechanism and Pathway. J. Environ. Chem. Eng. 2021, 9, 105371. [Google Scholar] [CrossRef]
- Li, W.; Li, J.; Wang, X.; Ma, J.; Chen, Q. Photoelectrochemical and Physical Properties of WO3 Films Obtained by the Polymeric Precursor Method. Int. J. Hydrogen Energy 2010, 35, 13137–13145. [Google Scholar] [CrossRef]
- Roselló-Márquez, G.; Fernández-Domene, R.M.; Sánchez-Tovar, R.; García-Antón, J. Photoelectrocatalyzed Degradation of Organophosphorus Pesticide Fenamiphos Using WO3 Nanorods as Photoanode. Chemosphere 2020, 246, 125677. [Google Scholar] [CrossRef] [PubMed]
- Zheng, H.; Ou, J.Z.; Strano, M.S.; Kaner, R.B.; Mitchell, A.; Kalantar-zadeh, K. Nanostructured Tungsten Oxide–Properties, Synthesis, and Applications. Adv. Funct. Mater. 2011, 21, 2175–2196. [Google Scholar] [CrossRef]
- Roselló-Márquez, G.; Fernández-Domene, R.M.; Sánchez-Tovar, R.; García-Carrión, S.; Lucas-Granados, B.; García-Antón, J. Photoelectrocatalyzed Degradation of a Pesticides Mixture Solution (Chlorfenvinphos and Bromacil) by WO3 Nanosheets. Sci. Total Environ. 2019, 674, 88–95. [Google Scholar] [CrossRef]
- Roselló-Márquez, G.; Fernández-Domene, R.M.; García-Antón, J. Organophosphorus Pesticides (Chlorfenvinphos, Phosmet and Fenamiphos) Photoelectrodegradation by Using WO3 Nanostructures as Photoanode. J. Electroanal. Chem. 2021, 894, 115366. [Google Scholar] [CrossRef]
- Bignozzi, C.A.; Caramori, S.; Cristino, V.; Argazzi, R.; Meda, L.; Tacca, A. Nanostructured Photoelectrodes Based on WO3: Applications to Photooxidation of Aqueous Electrolytes. Chem. Soc. Rev. 2013, 42, 2228–2246. [Google Scholar] [CrossRef] [PubMed]
- Kalanur, S.S.; Duy, L.T.; Seo, H. Recent Progress in Photoelectrochemical Water Splitting Activity of WO3 Photoanodes. Top. Catal. 2018, 61, 1043–1076. [Google Scholar] [CrossRef]
- Zych, M.; Syrek, K.; Zaraska, L.; Sulka, G.D. Improving Photoelectrochemical Properties of Anodic WO3 Layers by Optimizing Electrosynthesis Conditions. Molecules 2020, 25, 2916. [Google Scholar] [CrossRef] [PubMed]
- Pancielejko, A.; Rzepnikowska, M.; Zaleska-Medynska, A.; Łuczak, J.; Mazierski, P. Enhanced Visible Light Active WO3 Thin Films toward Air Purification: Effect of the Synthesis Conditions. Materials 2020, 13, 3506. [Google Scholar] [CrossRef]
- Wu, S.; Li, Y.; Chen, X.; Liu, J.; Gao, J.; Li, G. Fabrication of WO3 · 2H2O Nanoplatelet Powder by Breakdown Anodization. Electrochem. Commun. 2019, 104, 106479. [Google Scholar] [CrossRef]
- Fernández-Domene, R.M.; Sánchez-Tovar, R.; Lucas-Granados, B.; Roselló-Márquez, G.; García-Antón, J. A Simple Method to Fabricate High-Performance Nanostructured WO3 Photocatalysts with Adjusted Morphology in the Presence of Complexing Agents. Mater. Des. 2017, 116, 160–170. [Google Scholar] [CrossRef]
- Fernández-Domene, R.M.; Roselló-Márquez, G.; Sánchez-Tovar, R.; Cifre-Herrando, M.; García-Antón, J. Synthesis of WO3 Nanorods through Anodization in the Presence of Citric Acid: Formation Mechanism, Properties and Photoelectrocatalytic Performance. Surf. Coatings Technol. 2021, 422, 127489. [Google Scholar] [CrossRef]
- Zhu, T.; Chong, M.N.; Phuan, Y.W.; Chan, E.-S. Electrochemically Synthesized Tungsten Trioxide Nanostructures for Photoelectrochemical Water Splitting: Influence of Heat Treatment on Physicochemical Properties, Photocurrent Densities and Electron Shuttling. Colloids Surf. A Physicochem. Eng. Asp. 2015, 484, 297–303. [Google Scholar] [CrossRef]
- Ng, C.; Ng, Y.H.; Iwase, A.; Amal, R. Influence of Annealing Temperature of WO3 in Photoelectrochemical Conversion and Energy Storage for Water Splitting. ACS Appl. Mater. Interfaces 2013, 5, 5269–5275. [Google Scholar] [CrossRef]
- Liu, Y.; Li, Y.; Li, W.; Han, S.; Liu, C. Photoelectrochemical Properties and Photocatalytic Activity of Nitrogen-Doped Nanoporous WO3 Photoelectrodes under Visible Light. Appl. Surf. Sci. 2012, 258, 5038–5045. [Google Scholar] [CrossRef]
- Lassner, E.; Schubert, W.-D. Tungsten: Properties, Chemistry, Technology of the Elements, Alloys, and Chemical Compounds; Springer Science & Business Media: New York, NY, USA; Berlin/Heidelberg, Germany, 1999; ISBN 0306450534. [Google Scholar]
- Fernández-Domene, R.M.; Roselló-Márquez, G.; Sánchez-Tovar, R.; Lucas-Granados, B.; García-Antón, J. Photoelectrochemical Removal of Chlorfenvinphos by Using WO3 Nanorods: Influence of Annealing Temperature and Operation PH. Sep. Purif. Technol. 2019, 212, 458–464. [Google Scholar] [CrossRef]
- Daniel, M.F.; Desbat, B.; Lassegues, J.C.; Gerand, B.; Figlarz, M. Infrared and Raman Study of WO3 Tungsten Trioxides and WO3, XH2O Tungsten Trioxide Tydrates. J. Solid State Chem. 1987, 67, 235–247. [Google Scholar] [CrossRef]
- Cervilla, A.; Ramirez, J.A.; Llopis, E. Compounds of Tungsten (VI) with Citric Acid: A Spectrophotometric, Polarimetric and Hydrogen-1, Carbon-13 NMR Study of the Formation and Interconversion Equilibria in Aqueous Solution. Transit. Met. Chem. 1986, 11, 186–192. [Google Scholar] [CrossRef]
- Cruywagen, J.J.; Krüger, L.; Rohwer, E.A. Complexation of Tungsten (VI) with Citrate. J. Chem. Soc. Dalt. Trans. 1991, 1727–1731. [Google Scholar] [CrossRef]
- Meulenkamp, E.A. Mechanism of WO3 Electrodeposition from Peroxy-Tungstate Solution. J. Electrochem. Soc. 1997, 144, 1664. [Google Scholar] [CrossRef]
- Ou, J.Z.; Rani, R.A.; Balendhran, S.; Zoolfakar, A.S.; Field, M.R.; Zhuiykov, S.; O’Mullane, A.P.; Kalantar-Zadeh, K. Anodic Formation of a Thick Three-Dimensional Nanoporous WO3 Film and Its Photocatalytic Property. Electrochem. Commun. 2013, 27, 128–132. [Google Scholar] [CrossRef]
- Bittencourt, C.; Landers, R.; Llobet, E.; Correig, X.; Calderer, J. The Role of Oxygen Partial Pressure and Annealing Temperature on the Formation of W=O Bonds in Thin WO3 Films. Semicond. Sci. Technol. 2002, 17, 522. [Google Scholar] [CrossRef]
- Wang, C.-K.; Lin, C.-K.; Wu, C.-L.; Wang, S.-C.; Huang, J.-L. Synthesis and Characterization of Electrochromic Plate-like Tungsten Oxide Films by Acidic Treatment of Electrochemical Anodized Tungsten. Electrochim. Acta 2013, 112, 24–31. [Google Scholar] [CrossRef]
- Santato, C.; Odziemkowski, M.; Ulmann, M.; Augustynski, J. Crystallographically Oriented Mesoporous WO3 Films: Synthesis, Characterization, and Applications. J. Am. Chem. Soc. 2001, 123, 10639–10649. [Google Scholar] [CrossRef]
- Amano, F.; Tian, M.; Ohtani, B.; Chen, A. Photoelectrochemical Properties of Tungsten Trioxide Thin Film Electrodes Prepared from Facet-Controlled Rectangular Platelets. J. Solid State Electrochem. 2012, 16, 1965–1973. [Google Scholar] [CrossRef]
- Kim, Y.O.; Yu, S.-H.; Ahn, K.-S.; Lee, S.K.; Kang, S.H. Enhancing the Photoresponse of Electrodeposited WO3 Film: Structure and Thickness Effect. J. Electroanal. Chem. 2015, 752, 25–32. [Google Scholar] [CrossRef]
- Li, W.; Da, P.; Zhang, Y.; Wang, Y.; Lin, X.; Gong, X.; Zheng, G. WO3 Nanoflakes for Enhanced Photoelectrochemical Conversion. ACS Nano 2014, 8, 11770–11777. [Google Scholar] [CrossRef] [PubMed]
- Bertoluzzi, L.; Bisquert, J. Equivalent Circuit of Electrons and Holes in Thin Semiconductor Films for Photoelectrochemical Water Splitting Applications. J. Phys. Chem. Lett. 2012, 3, 2517–2522. [Google Scholar] [CrossRef]
- Cristino, V.; Marinello, S.; Molinari, A.; Caramori, S.; Carli, S.; Boaretto, R.; Argazzi, R.; Meda, L.; Bignozzi, C.A. Some Aspects of the Charge Transfer Dynamics in Nanostructured WO3 Films. J. Mater. Chem. A 2016, 4, 2995–3006. [Google Scholar] [CrossRef]
- Klahr, B.; Gimenez, S.; Fabregat-Santiago, F.; Hamann, T.; Bisquert, J. Water Oxidation at Hematite Photoelectrodes: The Role of Surface States. J. Am. Chem. Soc. 2012, 134, 4294–4302. [Google Scholar] [CrossRef] [Green Version]
- Roselló-Márquez, G.; Fernández-Domene, R.M.; Sánchez-Tovar, R.; García-Antón, J. Influence of Annealing Conditions on the Photoelectrocatalytic Performance of WO3 Nanostructures. Sep. Purif. Technol. 2020, 238, 116417. [Google Scholar] [CrossRef]
- Bertoluzzi, L.; Lopez-Varo, P.; Tejada, J.A.J.; Bisquert, J. Charge Transfer Processes at the Semiconductor/Electrolyte Interface for Solar Fuel Production: Insight from Impedance Spectroscopy. J. Mater. Chem. A 2016, 4, 2873–2879. [Google Scholar] [CrossRef]
- Levinas, R.; Tsyntsaru, N.; Lelis, M.; Cesiulis, H. Synthesis, Electrochemical Impedance Spectroscopy Study and Photoelectrochemical Behaviour of as-Deposited and Annealed WO3 Films. Electrochim. Acta 2017, 225, 29–38. [Google Scholar] [CrossRef]
- Siuzdak, K.; Szkoda, M.; Sawczak, M.; Lisowska-Oleksiak, A.; Karczewski, J.; Ryl, J. Enhanced Photoelectrochemical and Photocatalytic Performance of Iodine-Doped Titania Nanotube Arrays. Rsc Adv. 2015, 5, 50379–50391. [Google Scholar] [CrossRef]
- Ahmadi, E.; Ng, C.Y.; Razak, K.A.; Lockman, Z. Preparation of Anodic Nanoporous WO3 Film Using Oxalic Acid as Electrolyte. J. Alloys Compd. 2017, 704, 518–527. [Google Scholar] [CrossRef]
- Roselló-Márquez, G. Eliminación de Pesticidas Organofosforados Mediante Fotoelectrocatálisis; 2021; Available online: https://m.riunet.upv.es/handle/10251/174712 (accessed on 29 November 2022).
- Upadhyay, S.B.; Mishra, R.K.; Sahay, P.P. Enhanced Acetone Response in Co-Precipitated WO3 Nanostructures upon Indium Doping. Sensors Actuators B Chem. 2015, 209, 368–376. [Google Scholar] [CrossRef]
- Acuña, R.H.; Romero, J.L.; Muñoz, E.M.R.; Francis, E.R.; Cedeño, B.C.; Delgado, F.P. Síntesis Hidrotérmica de Nanoestructuras de Óxido de Tungsteno (WO3) Monoclínico. In Proceedings of the Memorias del XXXIV Encuentro Nacional y III Congreso Internacional de la AMIDIQ, Mazatlán, México, 7–10 May 2013; pp. 2076–21079. [Google Scholar]
- Lethy, K.J.; Beena, D.; Kumar, R.V.; Pillai, V.P.M.; Ganesan, V.; Sathe, V. Structural, Optical and Morphological Studies on Laser Ablated Nanostructured WO3 Thin Films. Appl. Surf. Sci. 2008, 254, 2369–2376. [Google Scholar] [CrossRef]
- Chakib, A.; Mohamed, K.; Elaziouti, A.; Touati, W.; Allah, I.K.; Benhamed, A.; Bekka, A. Solvothermal Synthesis and Characterization of Monoclinic WO 3 Nanoplatelets. Investigation of Their Photocatalytic Performance. Res. Sq. 2022. preprint. [Google Scholar] [CrossRef]
- Di, J.; Gai, X.; Jamakanga, R.; Lou, J.; Zhu, M.; Li, Y.; Yang, R.; Ma, Q. Synthesis of 1D WO3 Nanostructures Using Different Capping Agents for Pseudocapacitor Applications. J. Nanoparticle Res. 2022, 24, 218. [Google Scholar] [CrossRef]
- Navío, C.; Vallejos, S.; Stoycheva, T.; Llobet, E.; Correig, X.; Snyders, R.; Blackman, C.; Umek, P.; Ke, X.; Van Tendeloo, G.; et al. Gold Clusters on WO 3 Nanoneedles Grown via AACVD: XPS and TEM Studies. Mater. Chem. Phys. 2012, 134, 809–813. [Google Scholar] [CrossRef]
- Bittencourt, C.; Felten, A.; Mirabella, F.; Ivanov, P.; Llobet, E.; Silva, M.A.P.; Nunes, L.A.O.; Pireaux, J.J. High-Resolution Photoelectron Spectroscopy Studies on WO3 Films Modified by Ag Addition. J. Phys. Condens. Matter 2005, 17, 6813–6822. [Google Scholar] [CrossRef]
- Shpak, A.P.; Korduban, A.M.; Medvedskij, M.M.; Kandyba, V.O. XPS Studies of Active Elements Surface of Gas Sensors Based on WO3− x Nanoparticles. J. Electron Spectrosc. Relat. Phenom. 2007, 156, 172–175. [Google Scholar] [CrossRef]
- Wang, L.; Xu, X.; Wu, S.; Cao, F. Nonstoichiometric Tungsten Oxide Residing in a 3D Nitrogen Doped Carbon Matrix, a Composite Photocatalyst for Oxygen Vacancy Induced VOC Degradation and H 2 Production. Catal. Sci. Technol. 2018, 8, 1366–1374. [Google Scholar] [CrossRef]
- Zych, M.; Syrek, K.; Pisarek, M.; Sulka, G.D. Synthesis and Characterization of Anodic WO3 Layers in Situ Doped with C, N during Anodization. Electrochim. Acta 2022, 411, 140061. [Google Scholar] [CrossRef]
- Wang, G.; Wang, H.; Ling, Y.; Tang, Y.; Yang, X.; Fitzmorris, R.C.; Wang, C.; Zhang, J.Z.; Li, Y. Hydrogen-Treated TiO2 Nanowire Arrays for Photoelectrochemical Water Splitting. Nano Lett. 2011, 11, 3026–3033. [Google Scholar] [CrossRef] [PubMed]
- Gmurek, M.; Rossi, A.F.; Martins, R.C.; Quinta-Ferreira, R.M.; Ledakowicz, S. Photodegradation of Single and Mixture of Parabens—Kinetic, by-Products Identification and Cost-Efficiency Analysis. Chem. Eng. J. 2015, 276, 303–314. [Google Scholar] [CrossRef]
- Chuang, L.C.; Luo, C.H. Photocatalytic Degradation of Parabens in Aquatic Environment: Kinetics and Degradation Pathway. Kinet. Catal. 2015, 56, 412–418. [Google Scholar] [CrossRef]
- Steter, J.R.; Brillas, E.; Sirés, I. Solar Photoelectro-Fenton Treatment of a Mixture of Parabens Spiked into Secondary Treated Wastewater Effluent at Low Input Current. Appl. Catal. B Environ. 2018, 224, 410–418. [Google Scholar] [CrossRef]
- Steter, J.R.; Rocha, R.S.; Dionísio, D.; Lanza, M.R.V.; Motheo, A.J. Electrochemical Oxidation Route of Methyl Paraben on a Boron-Doped Diamond Anode. Electrochim. Acta 2014, 117, 127–133. [Google Scholar] [CrossRef]
- Zúñiga-Benítez, H.; Muñoz-Calderón, A.; Peñuela, G.A. Removal of a Mix of Benzophenones and Parabens Using Solar Photo-Fenton and a Cylinder Parabolic Collector in Aqueous Solutions. J. Environ. Chem. Eng. 2018, 6, 7347–7357. [Google Scholar] [CrossRef]
- Steter, J.R.; Dionisio, D.; Lanza, M.R.V.; Motheo, A.J. Electrochemical and Sonoelectrochemical Processes Applied to the Degradation of the Endocrine Disruptor Methyl Paraben. J. Appl. Electrochem. 2014, 44, 1317–1325. [Google Scholar] [CrossRef]
- Velegraki, T.; Hapeshi, E.; Fatta-Kassinos, D.; Poulios, I. Solar-Induced Heterogeneous Photocatalytic Degradation of Methyl-Paraben. Appl. Catal. B Environ. 2015, 178, 2–11. [Google Scholar] [CrossRef]
- Dionisio, D.; Motheo, A.J.; Sáez, C.; Cañizares, P.; Rodrigo, M.A. Effects of Ultrasound Irradiation on the Electrochemical Treatment of Wastes Containing Micelles. Appl. Catal. B Environ. 2019, 248, 108–114. [Google Scholar] [CrossRef]
- Lin, Y.; Ferronato, C.; Deng, N.; Wu, F.; Chovelon, J.M. Photocatalytic Degradation of Methylparaben by TiO2: Multivariable Experimental Design and Mechanism. Appl. Catal. B Environ. 2009, 88, 32–41. [Google Scholar] [CrossRef]


| Time (h) | Area (Counts) | Concentration (ppm) | Degradation (%) |
|---|---|---|---|
| 0 | 55,747,948 | 10.00 | 0.00% |
| 1 | 36,171,413 | 6.24 | 37.64% |
| 2 | 10,440,169 | 1.80 | 81.59% |
| 3 | 3,693,070 | 0.64 | 93.44% |
| 4 | 328,399 | 0.06 | 99.42% |
| 5 | 88,928 | 0.02 | 99.84% |
| 6 | 65,237 | 0.01 | 99.88% |
| 8 | 0 | 0.00 | 100.00% |
| 24 | 0 | 0.00 | 100.00% |
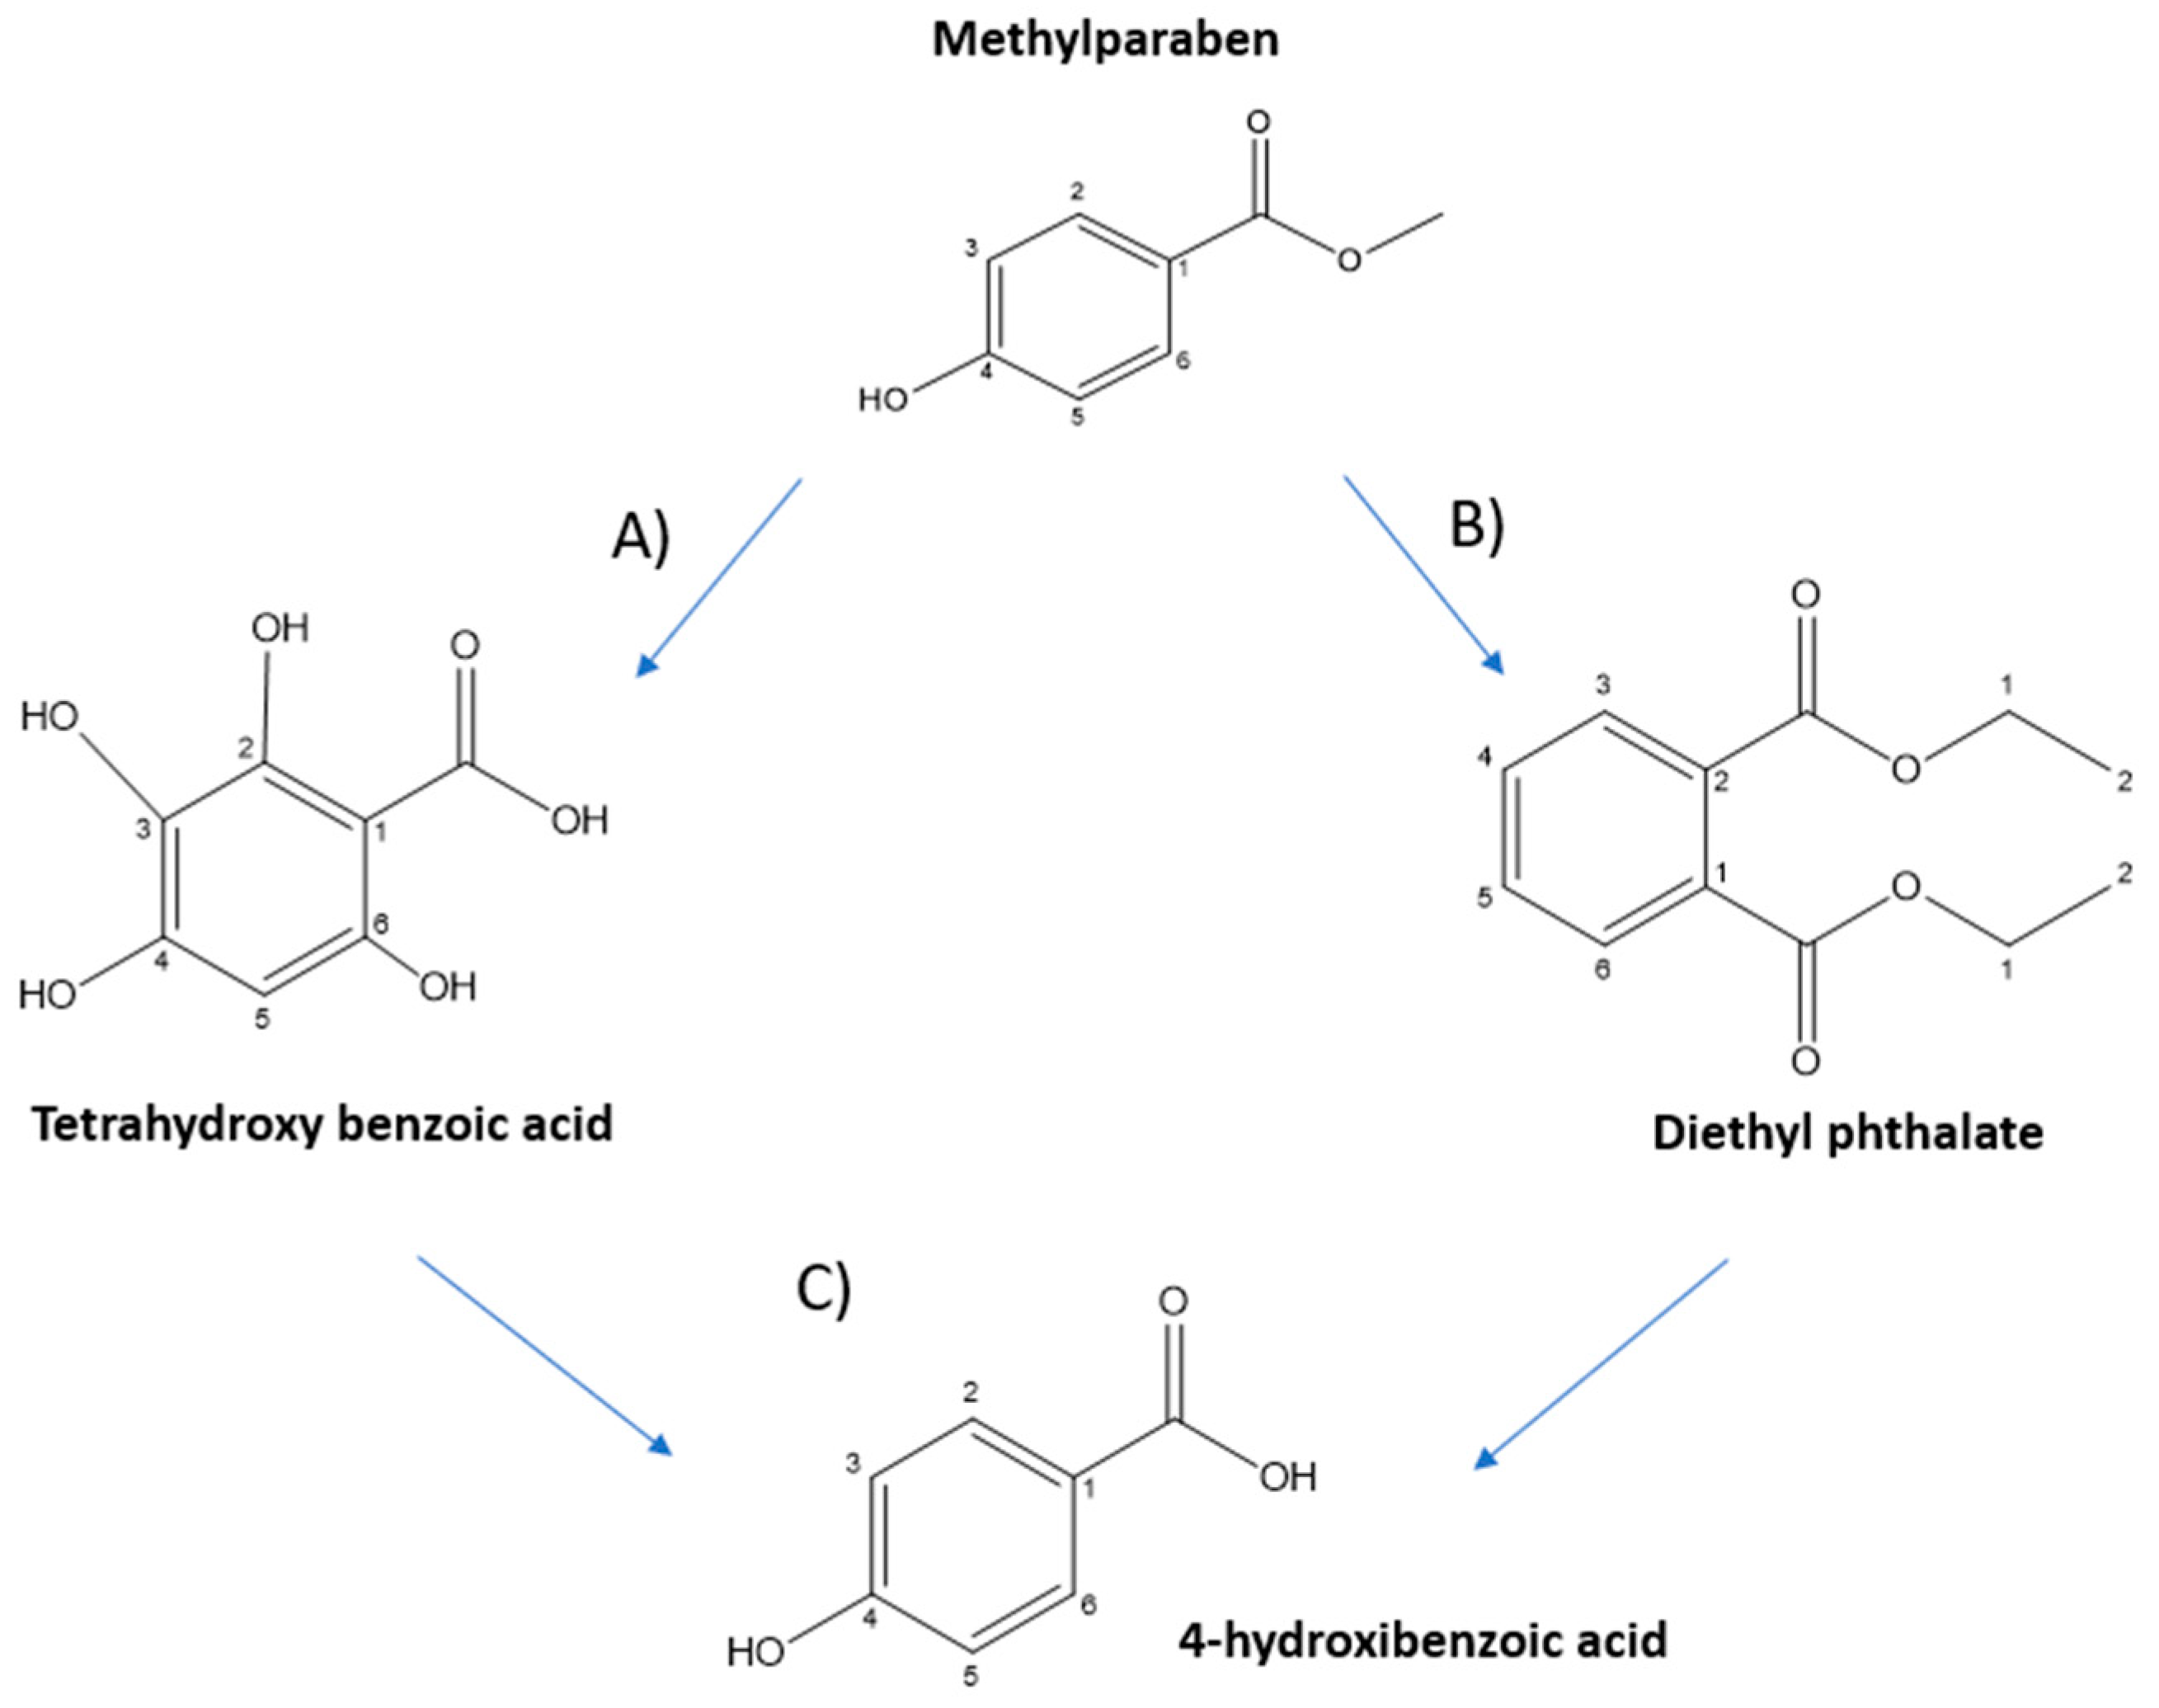
| Compound Identification | Compound | Molecular Formula | Retention Time (min) | m/z Value |
|---|---|---|---|---|
| A | Tetrahydroxy benzoic acid | C7H6O6 | 9.2 | 185.0013 |
| B | Diethyl phthalate | C12H14O4 | 11 | 220.9586 |
| C | 4-Hydroxibenzoic acid | C7H6O3 | 0.9 | 136.8914 |
Publisher’s Note: MDPI stays neutral with regard to jurisdictional claims in published maps and institutional affiliations. |
© 2022 by the authors. Licensee MDPI, Basel, Switzerland. This article is an open access article distributed under the terms and conditions of the Creative Commons Attribution (CC BY) license (https://creativecommons.org/licenses/by/4.0/).
Share and Cite
Cifre-Herrando, M.; Roselló-Márquez, G.; García-García, D.M.; García-Antón, J. Degradation of Methylparaben Using Optimal WO3 Nanostructures: Influence of the Annealing Conditions and Complexing Agent. Nanomaterials 2022, 12, 4286. https://doi.org/10.3390/nano12234286
Cifre-Herrando M, Roselló-Márquez G, García-García DM, García-Antón J. Degradation of Methylparaben Using Optimal WO3 Nanostructures: Influence of the Annealing Conditions and Complexing Agent. Nanomaterials. 2022; 12(23):4286. https://doi.org/10.3390/nano12234286
Chicago/Turabian StyleCifre-Herrando, M., G. Roselló-Márquez, D. M. García-García, and J. García-Antón. 2022. "Degradation of Methylparaben Using Optimal WO3 Nanostructures: Influence of the Annealing Conditions and Complexing Agent" Nanomaterials 12, no. 23: 4286. https://doi.org/10.3390/nano12234286