
Structural and Optical Properties of Graphene Quantum Dots−Polyvinyl Alcohol Composite Thin Film and Its Potential in Plasmonic Sensing of Carbaryl
 , and
, and
Abstract
:1. Introduction
2. Materials and Method
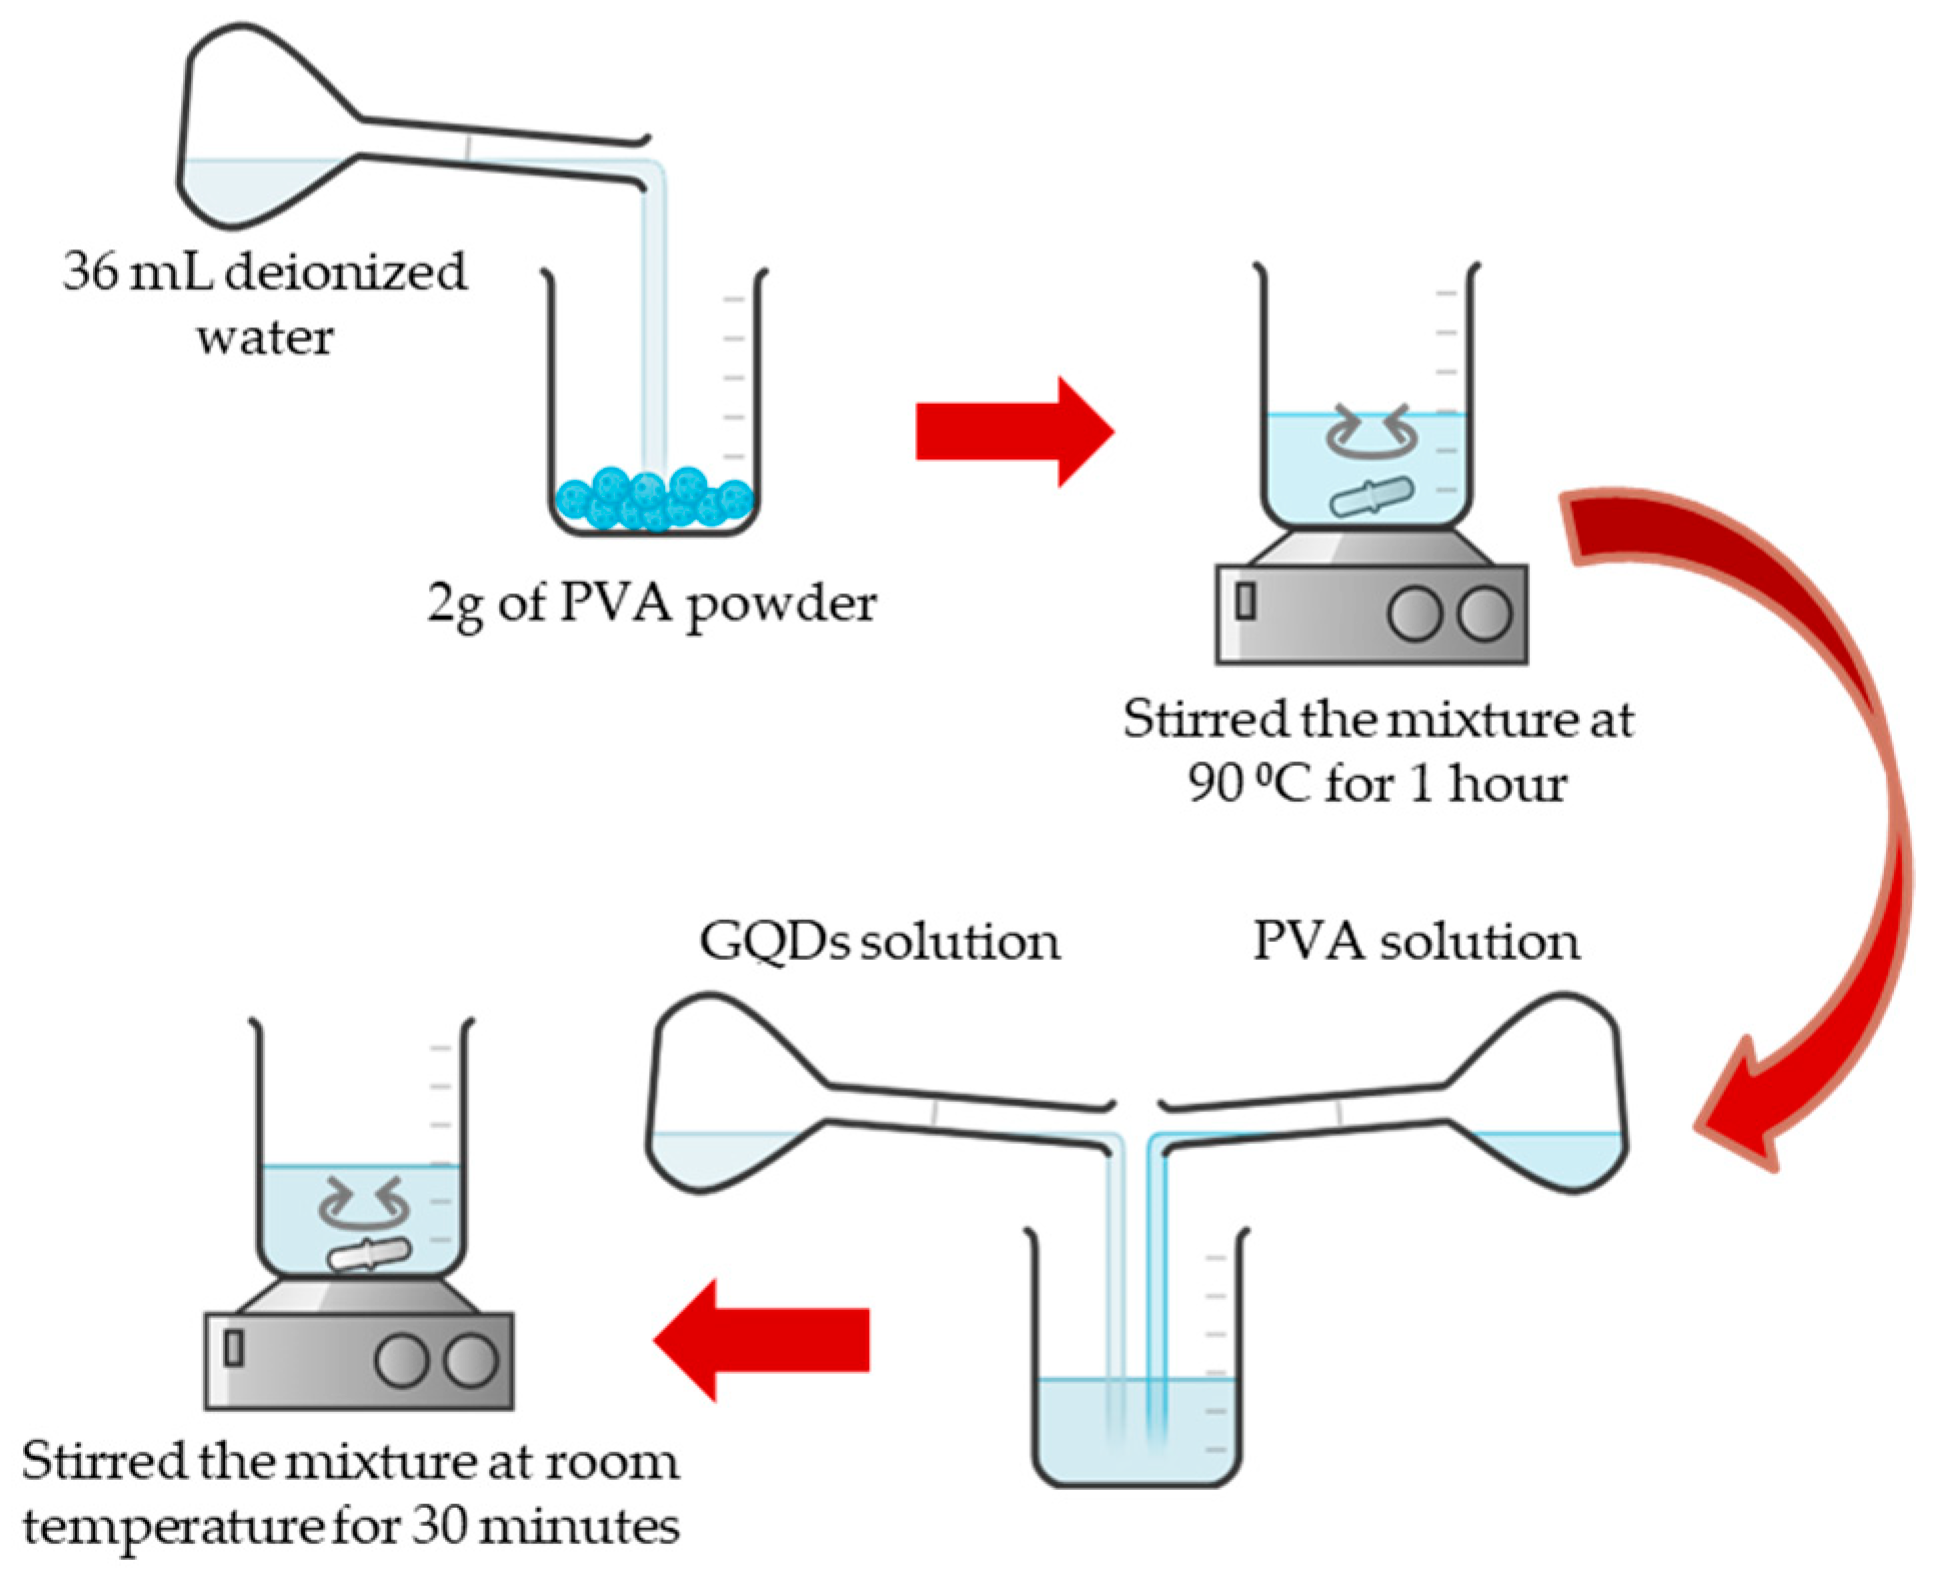
2.1. Material Preparation
- M1 = Stock concentration
- V1 = Stock volume
- M2 = Desired concentration
- V2 = Desired volume
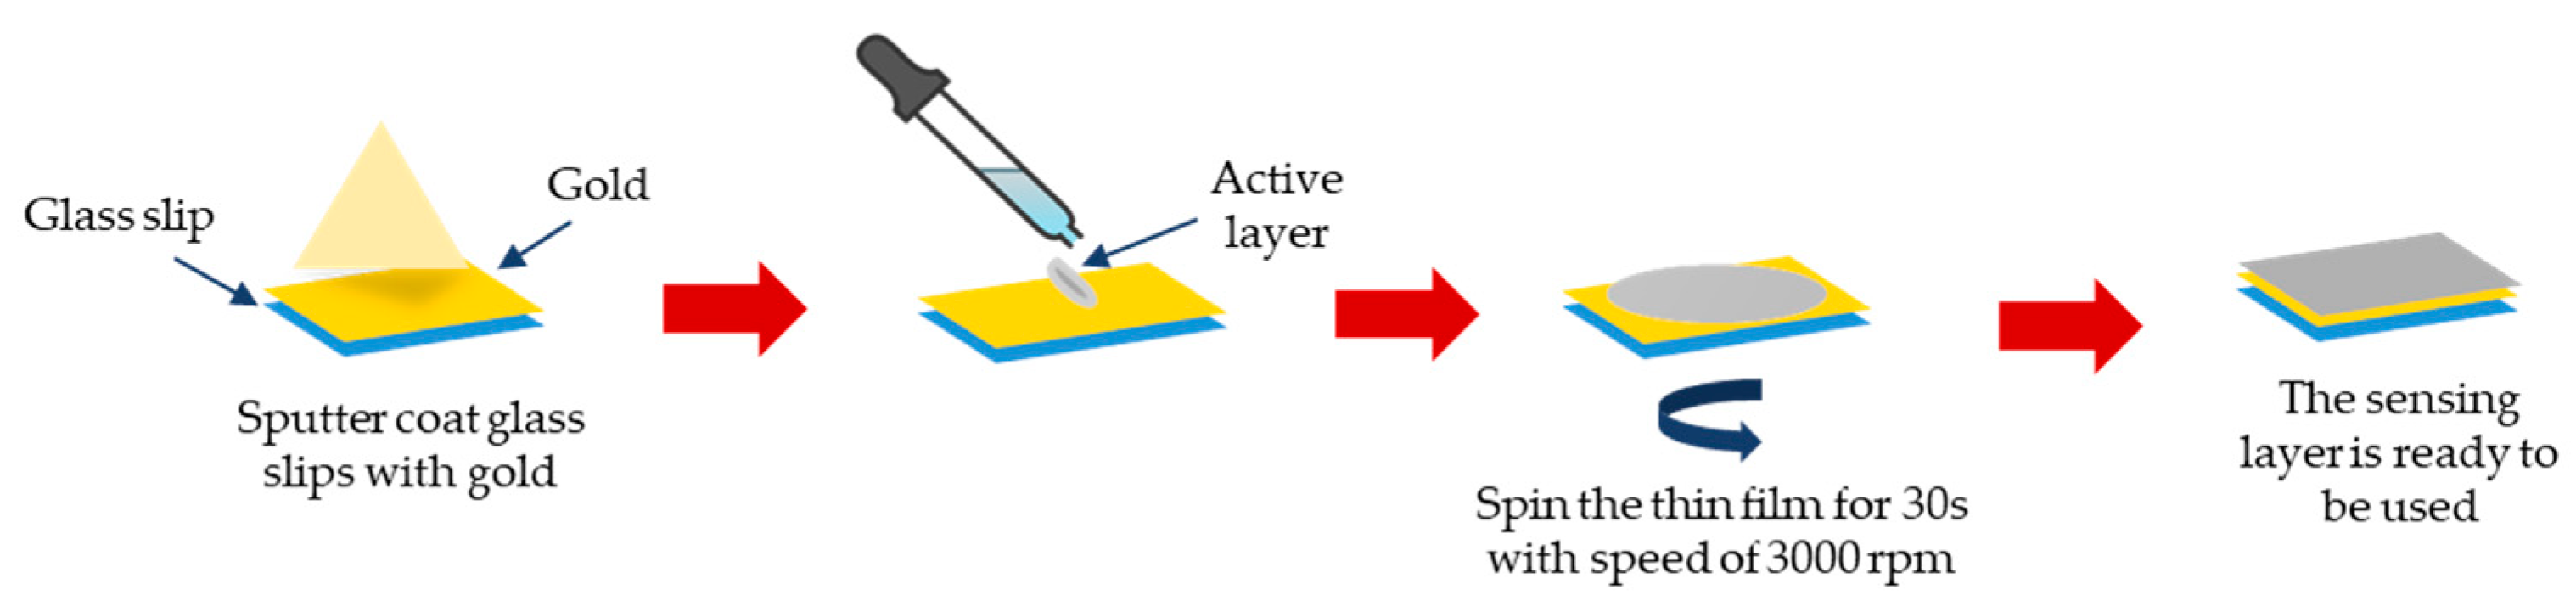
2.2. Sensing Layer Preparation
2.3. Characterization
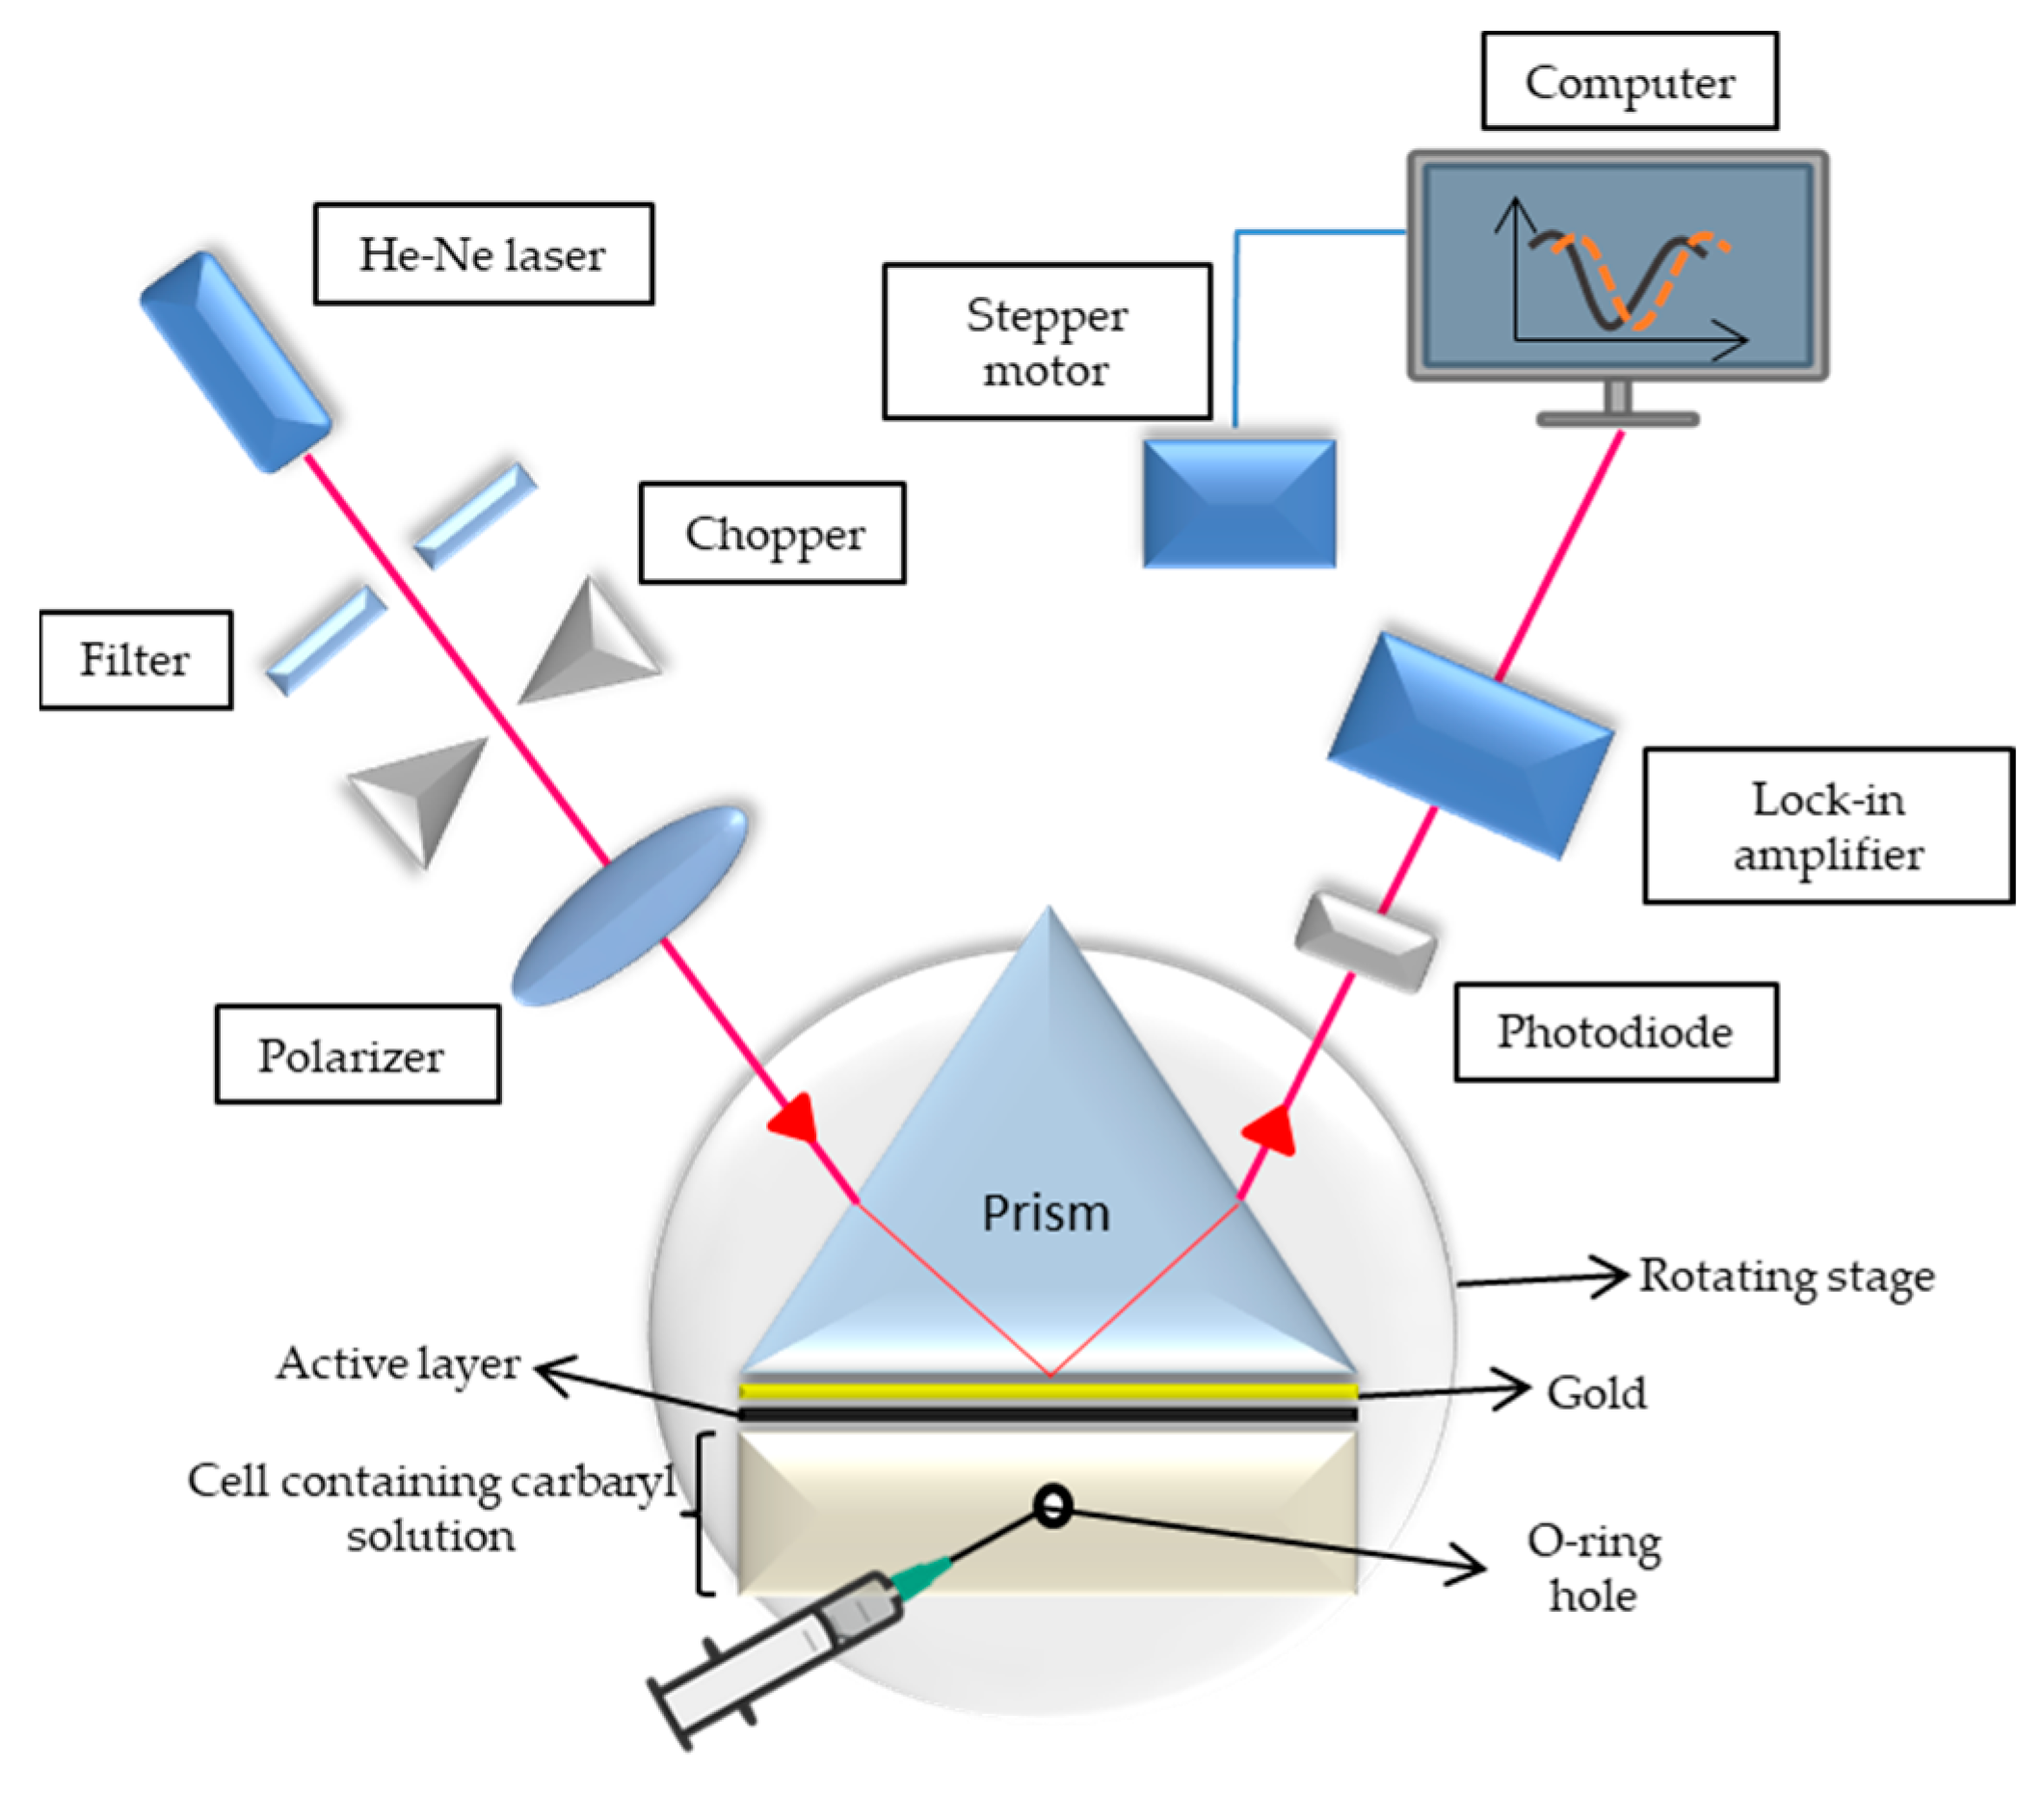
2.4. SPR Spectroscopy
3. Results and Discussion
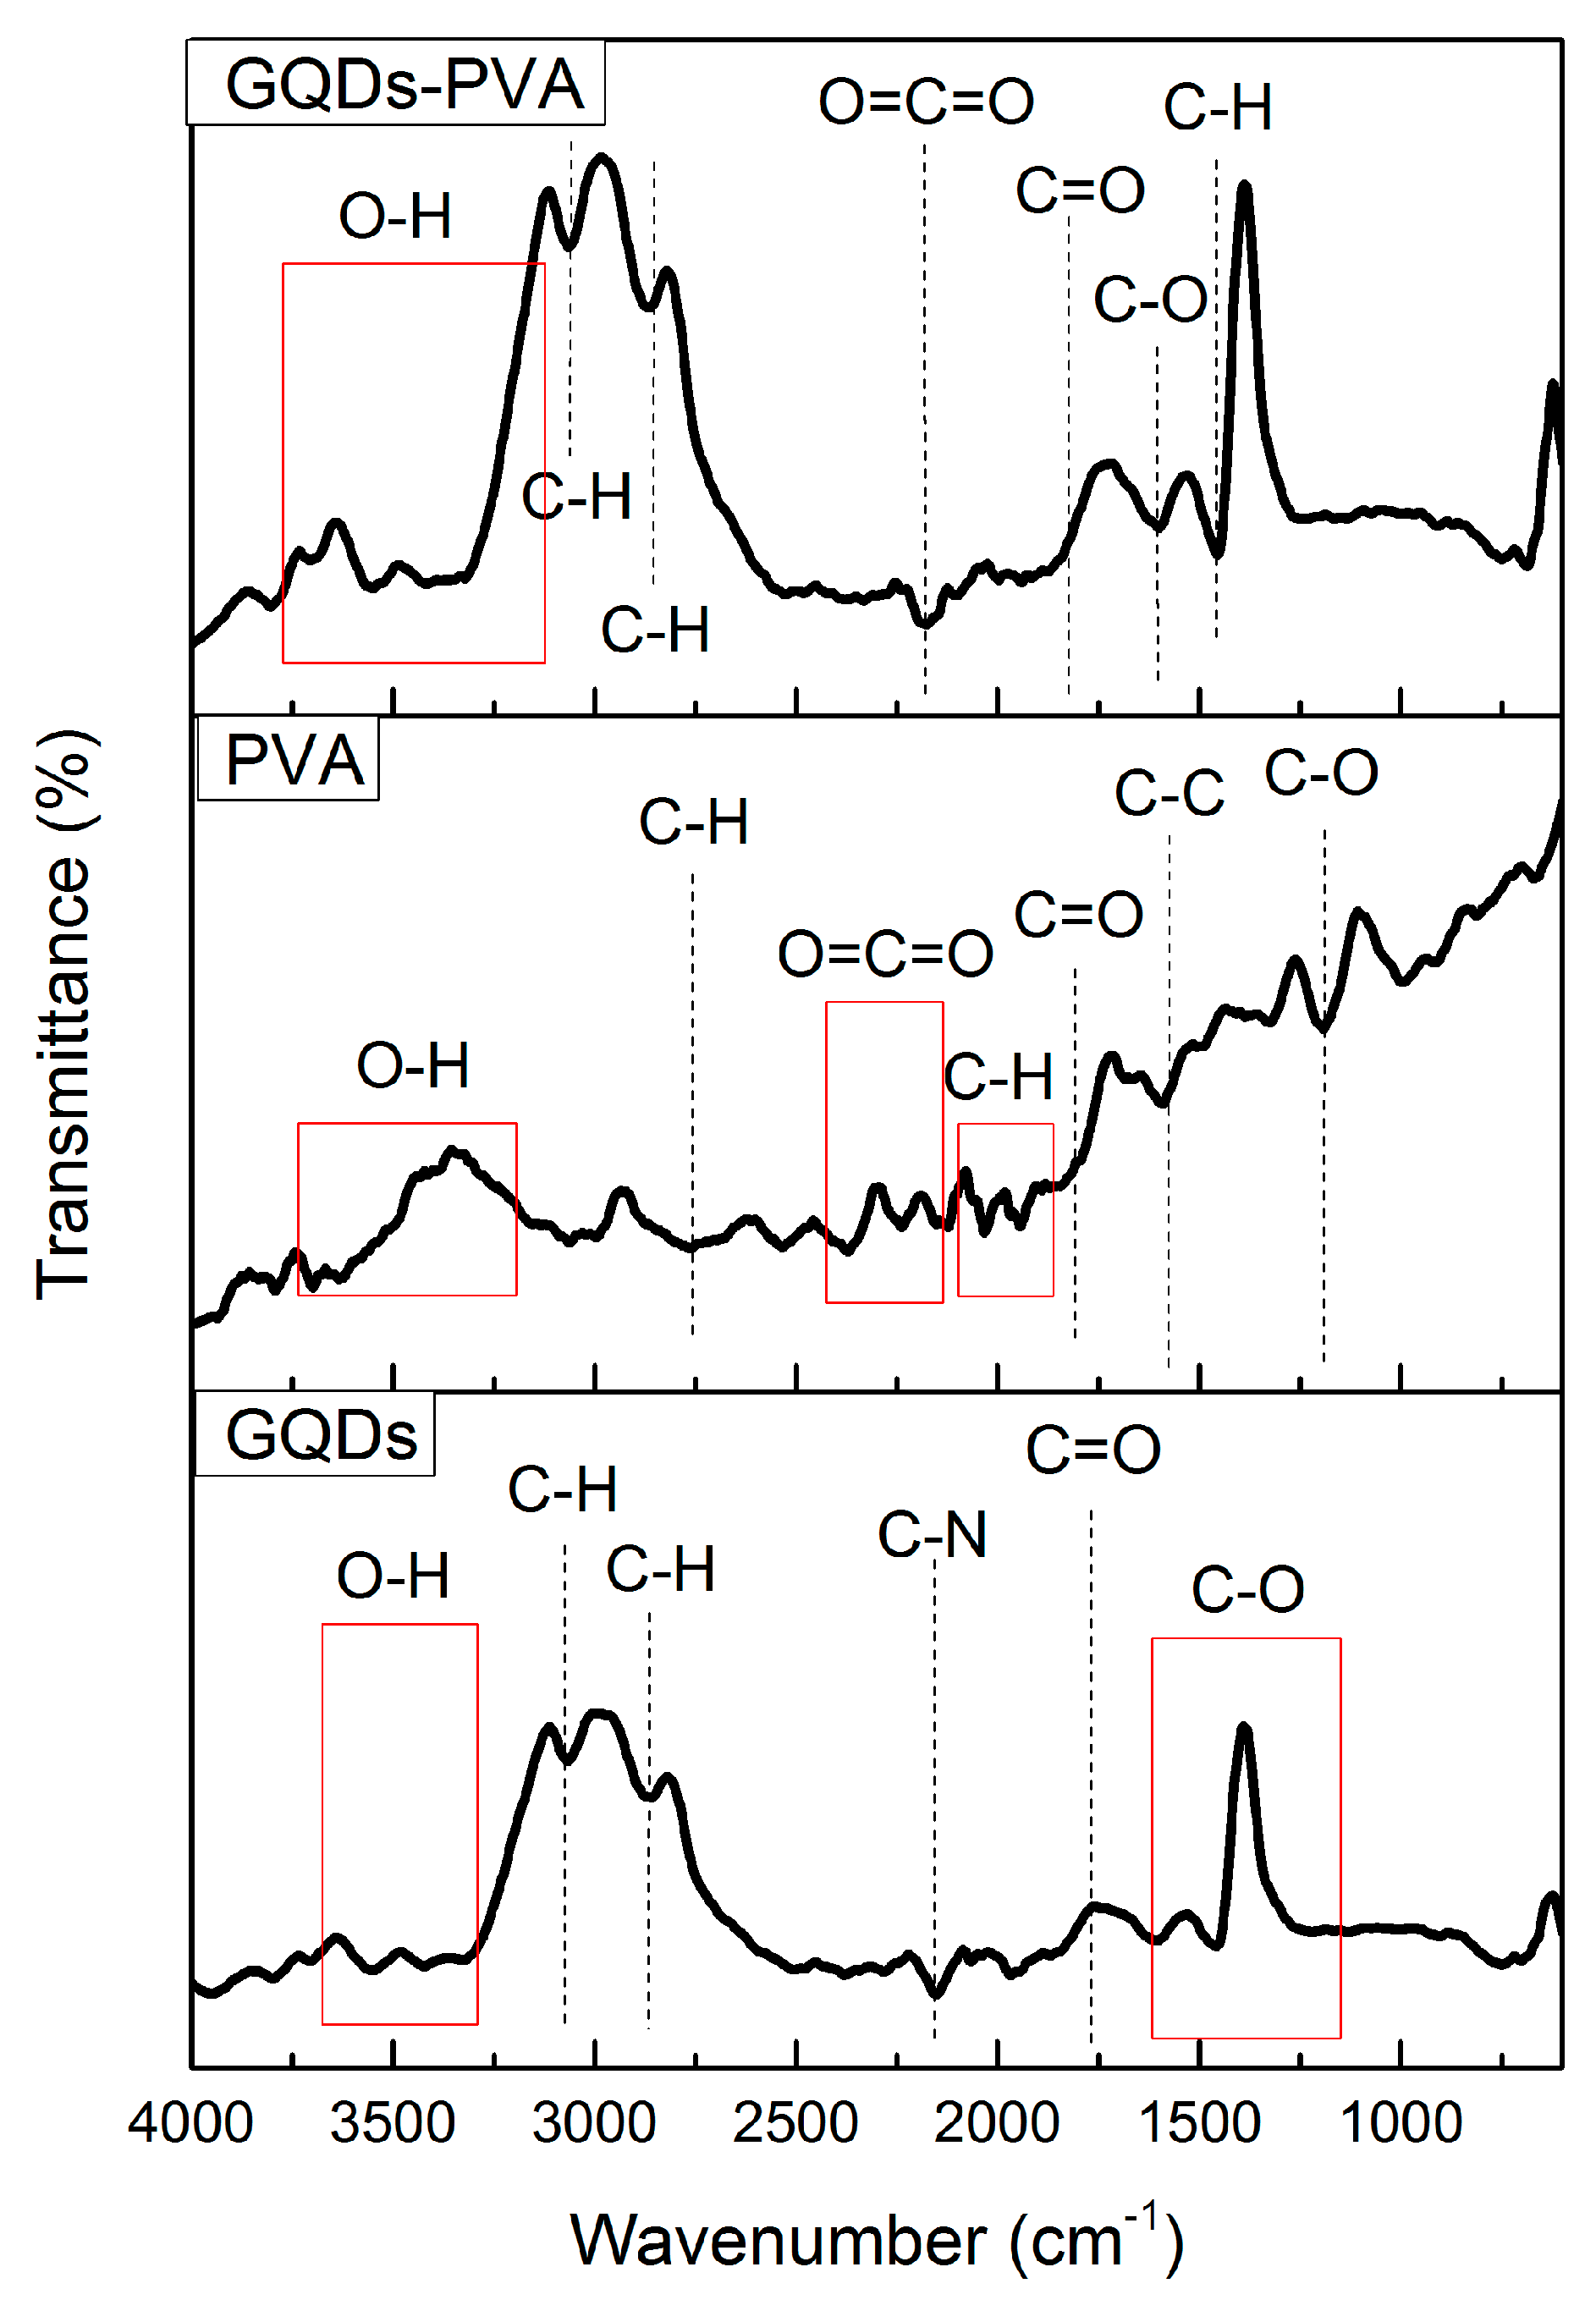
3.1. Fourier Transform Infrared Spectroscopy
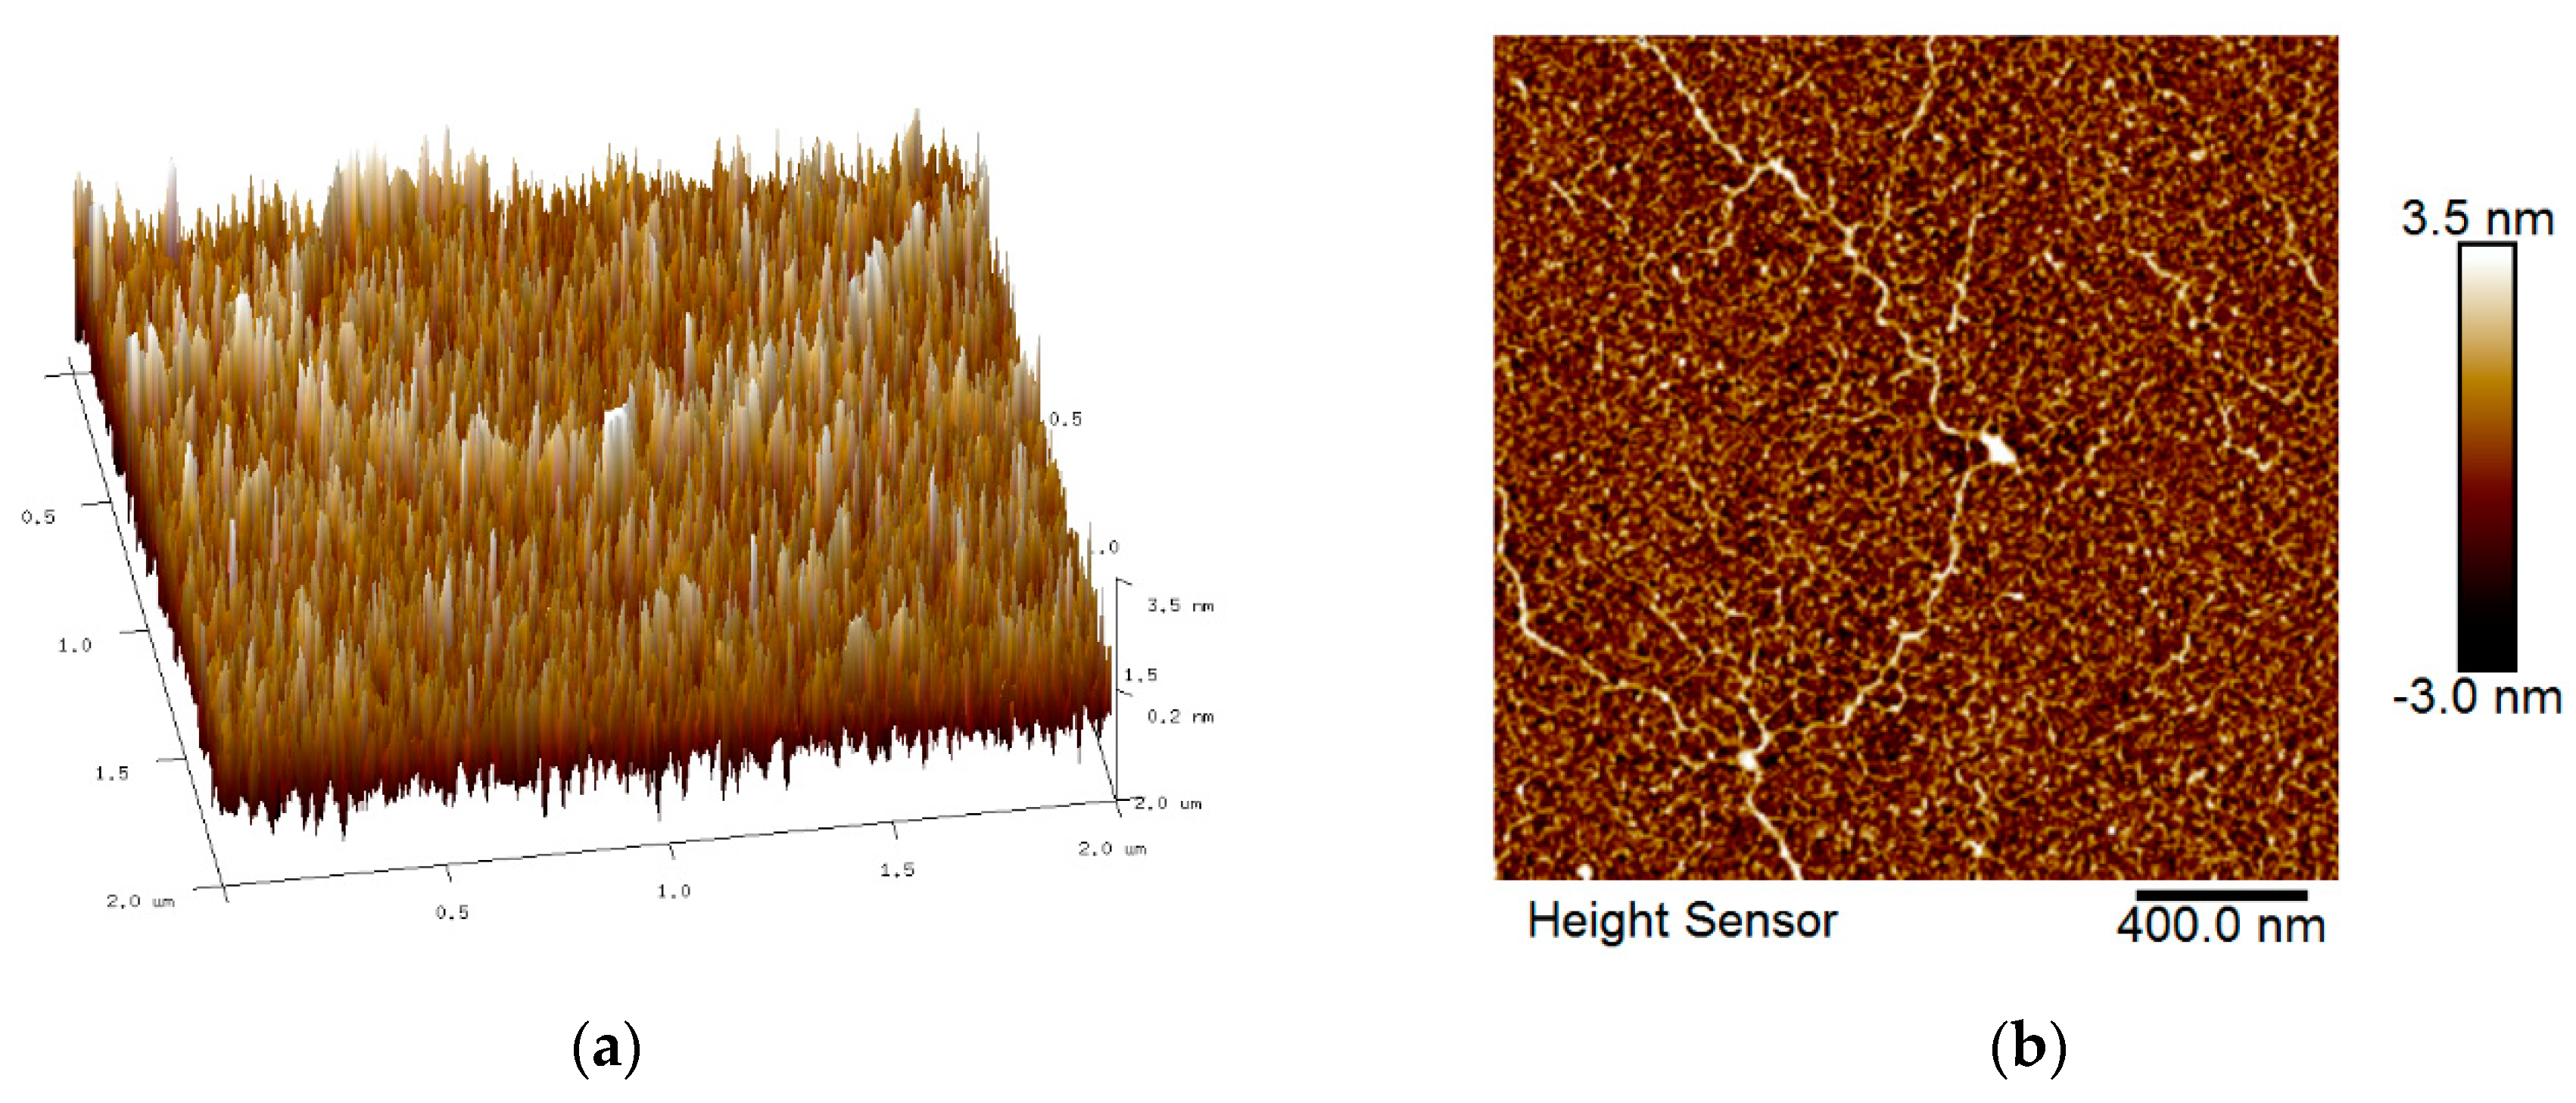
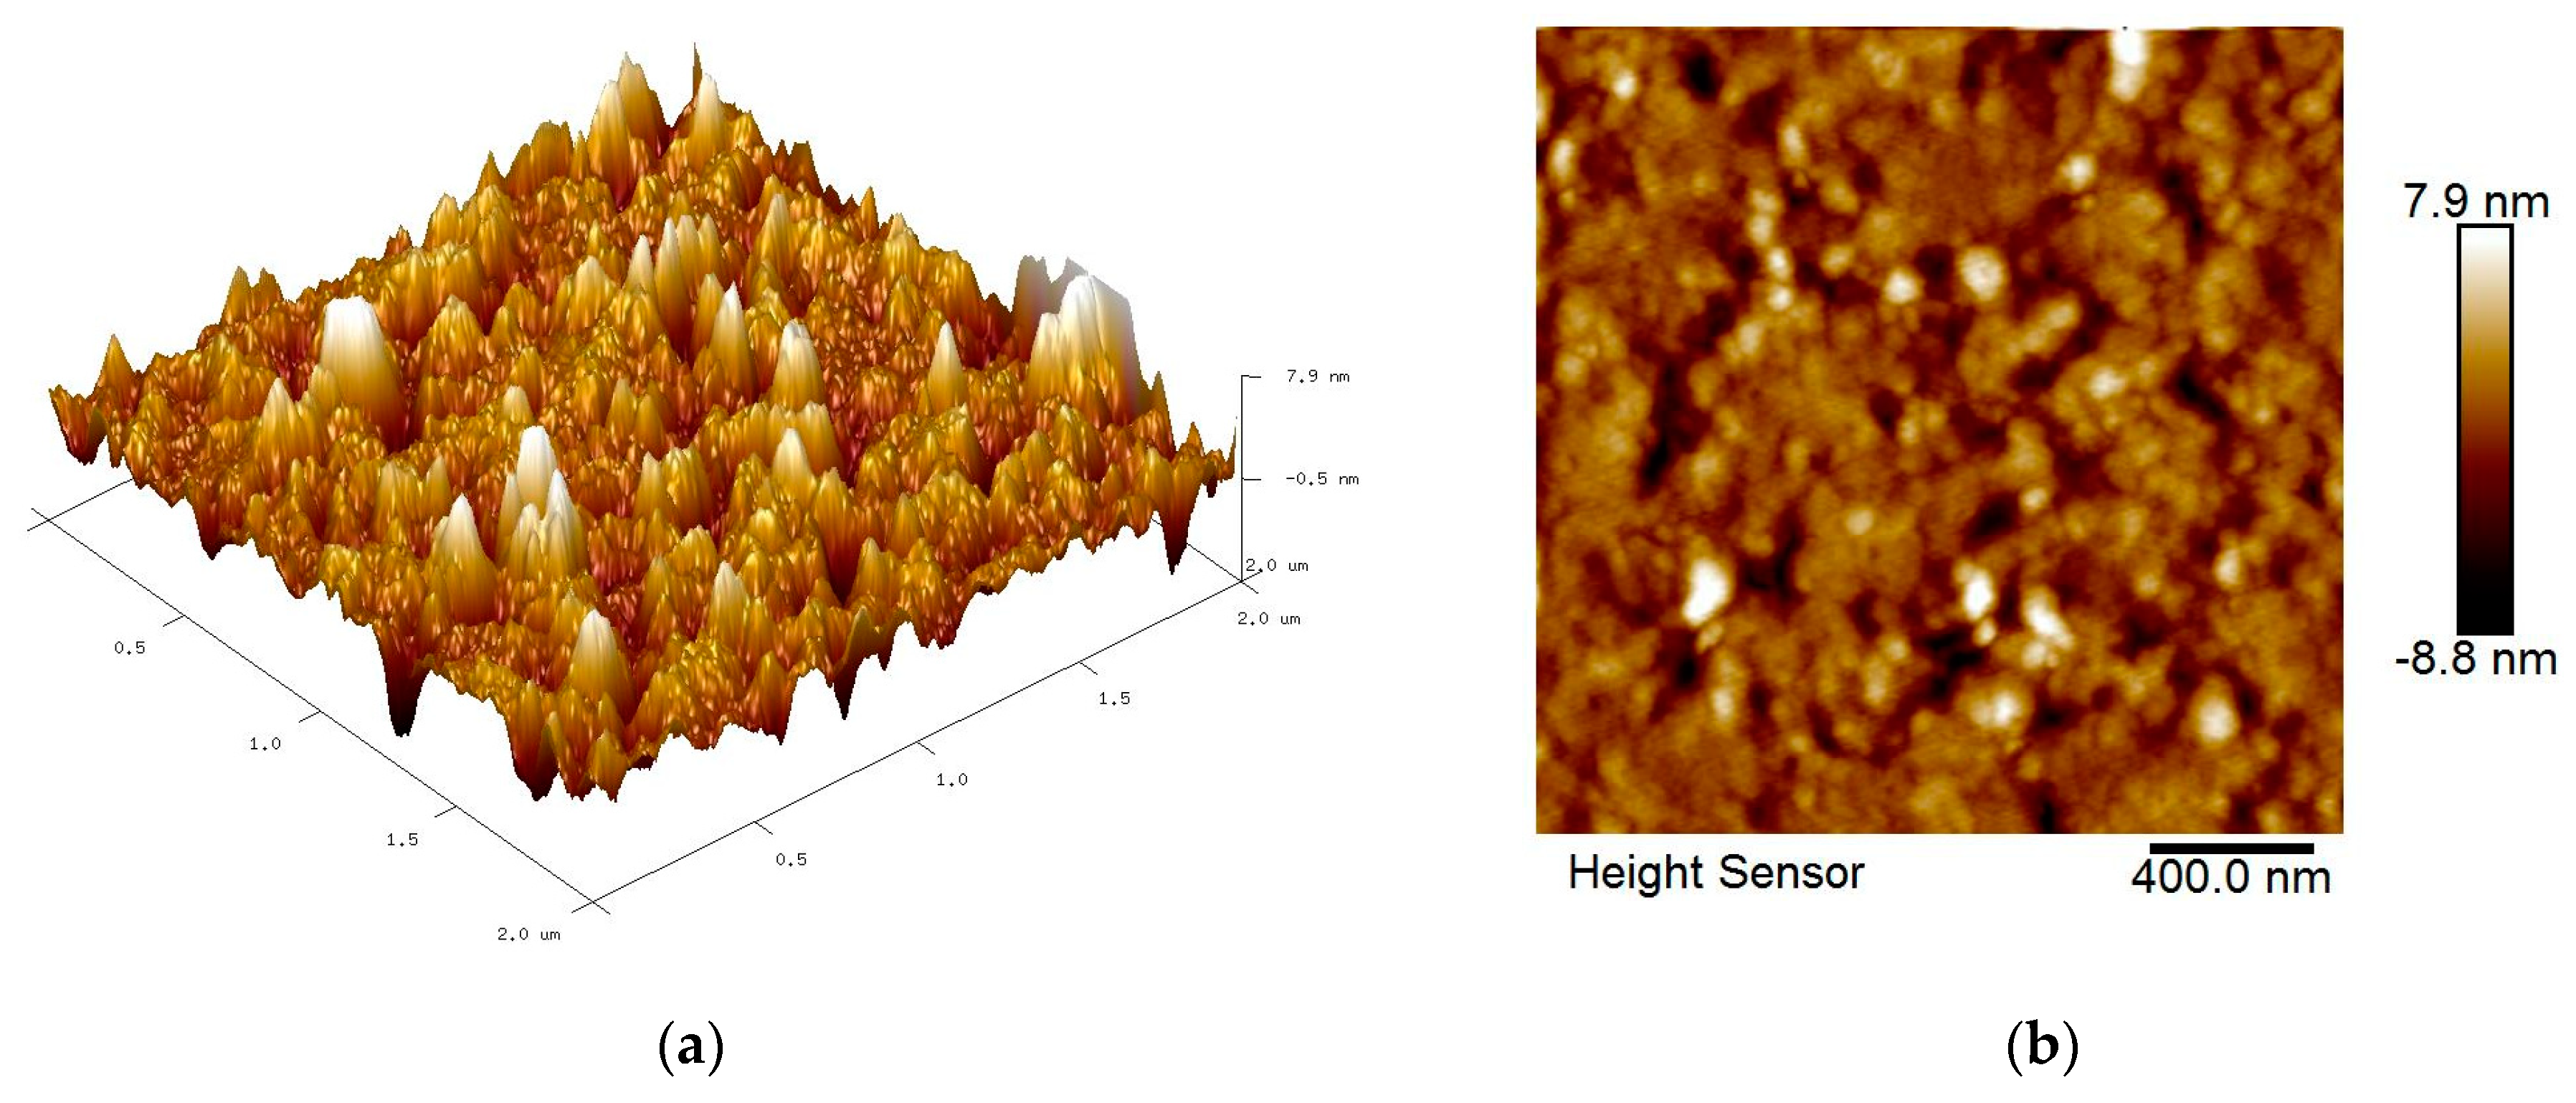
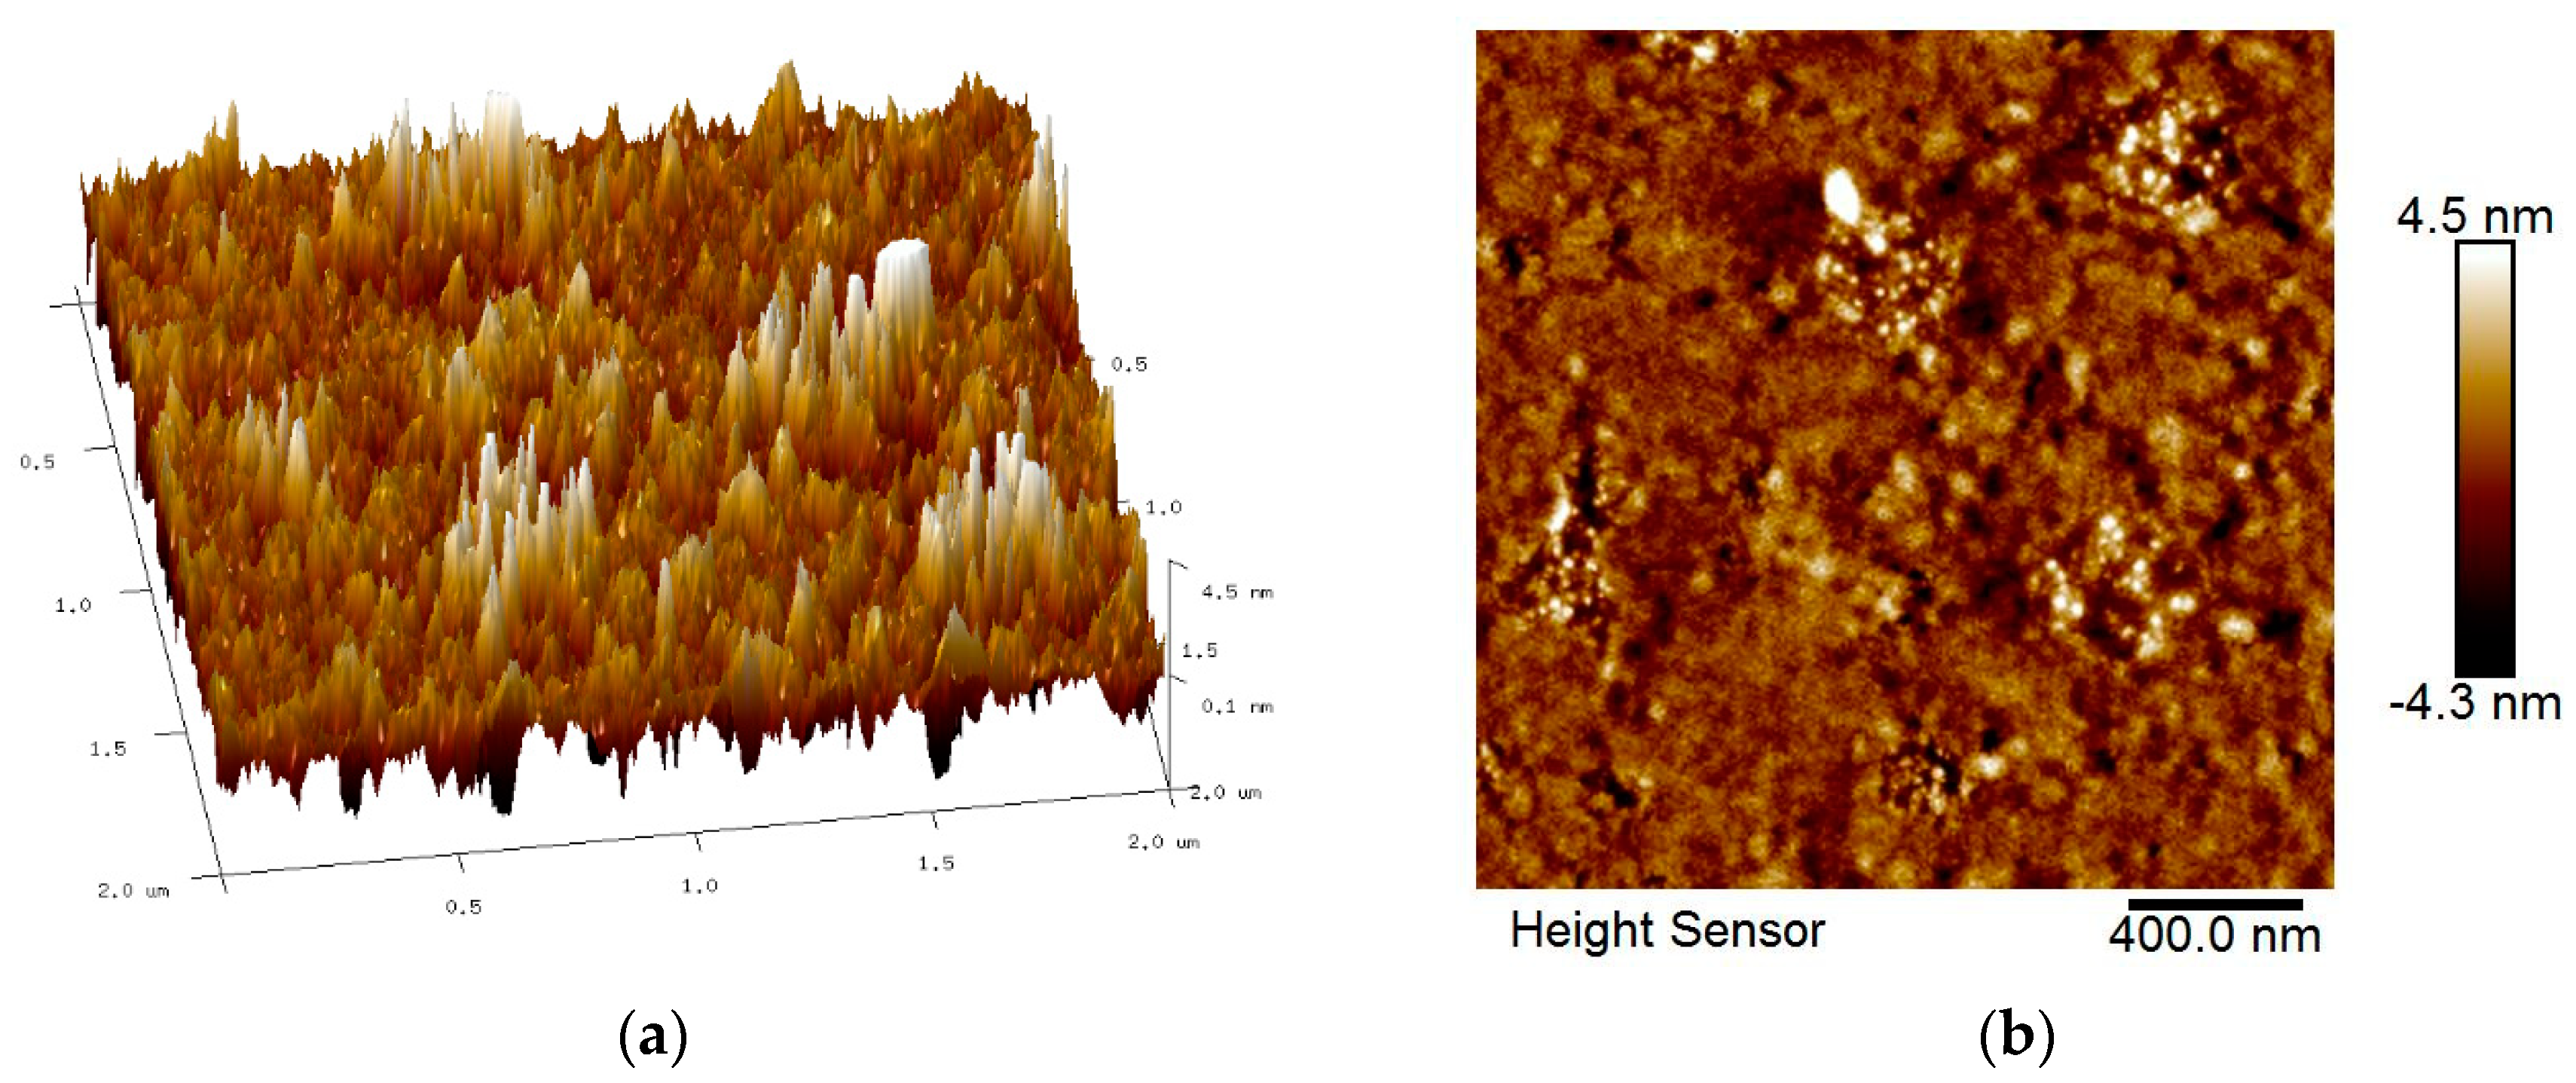
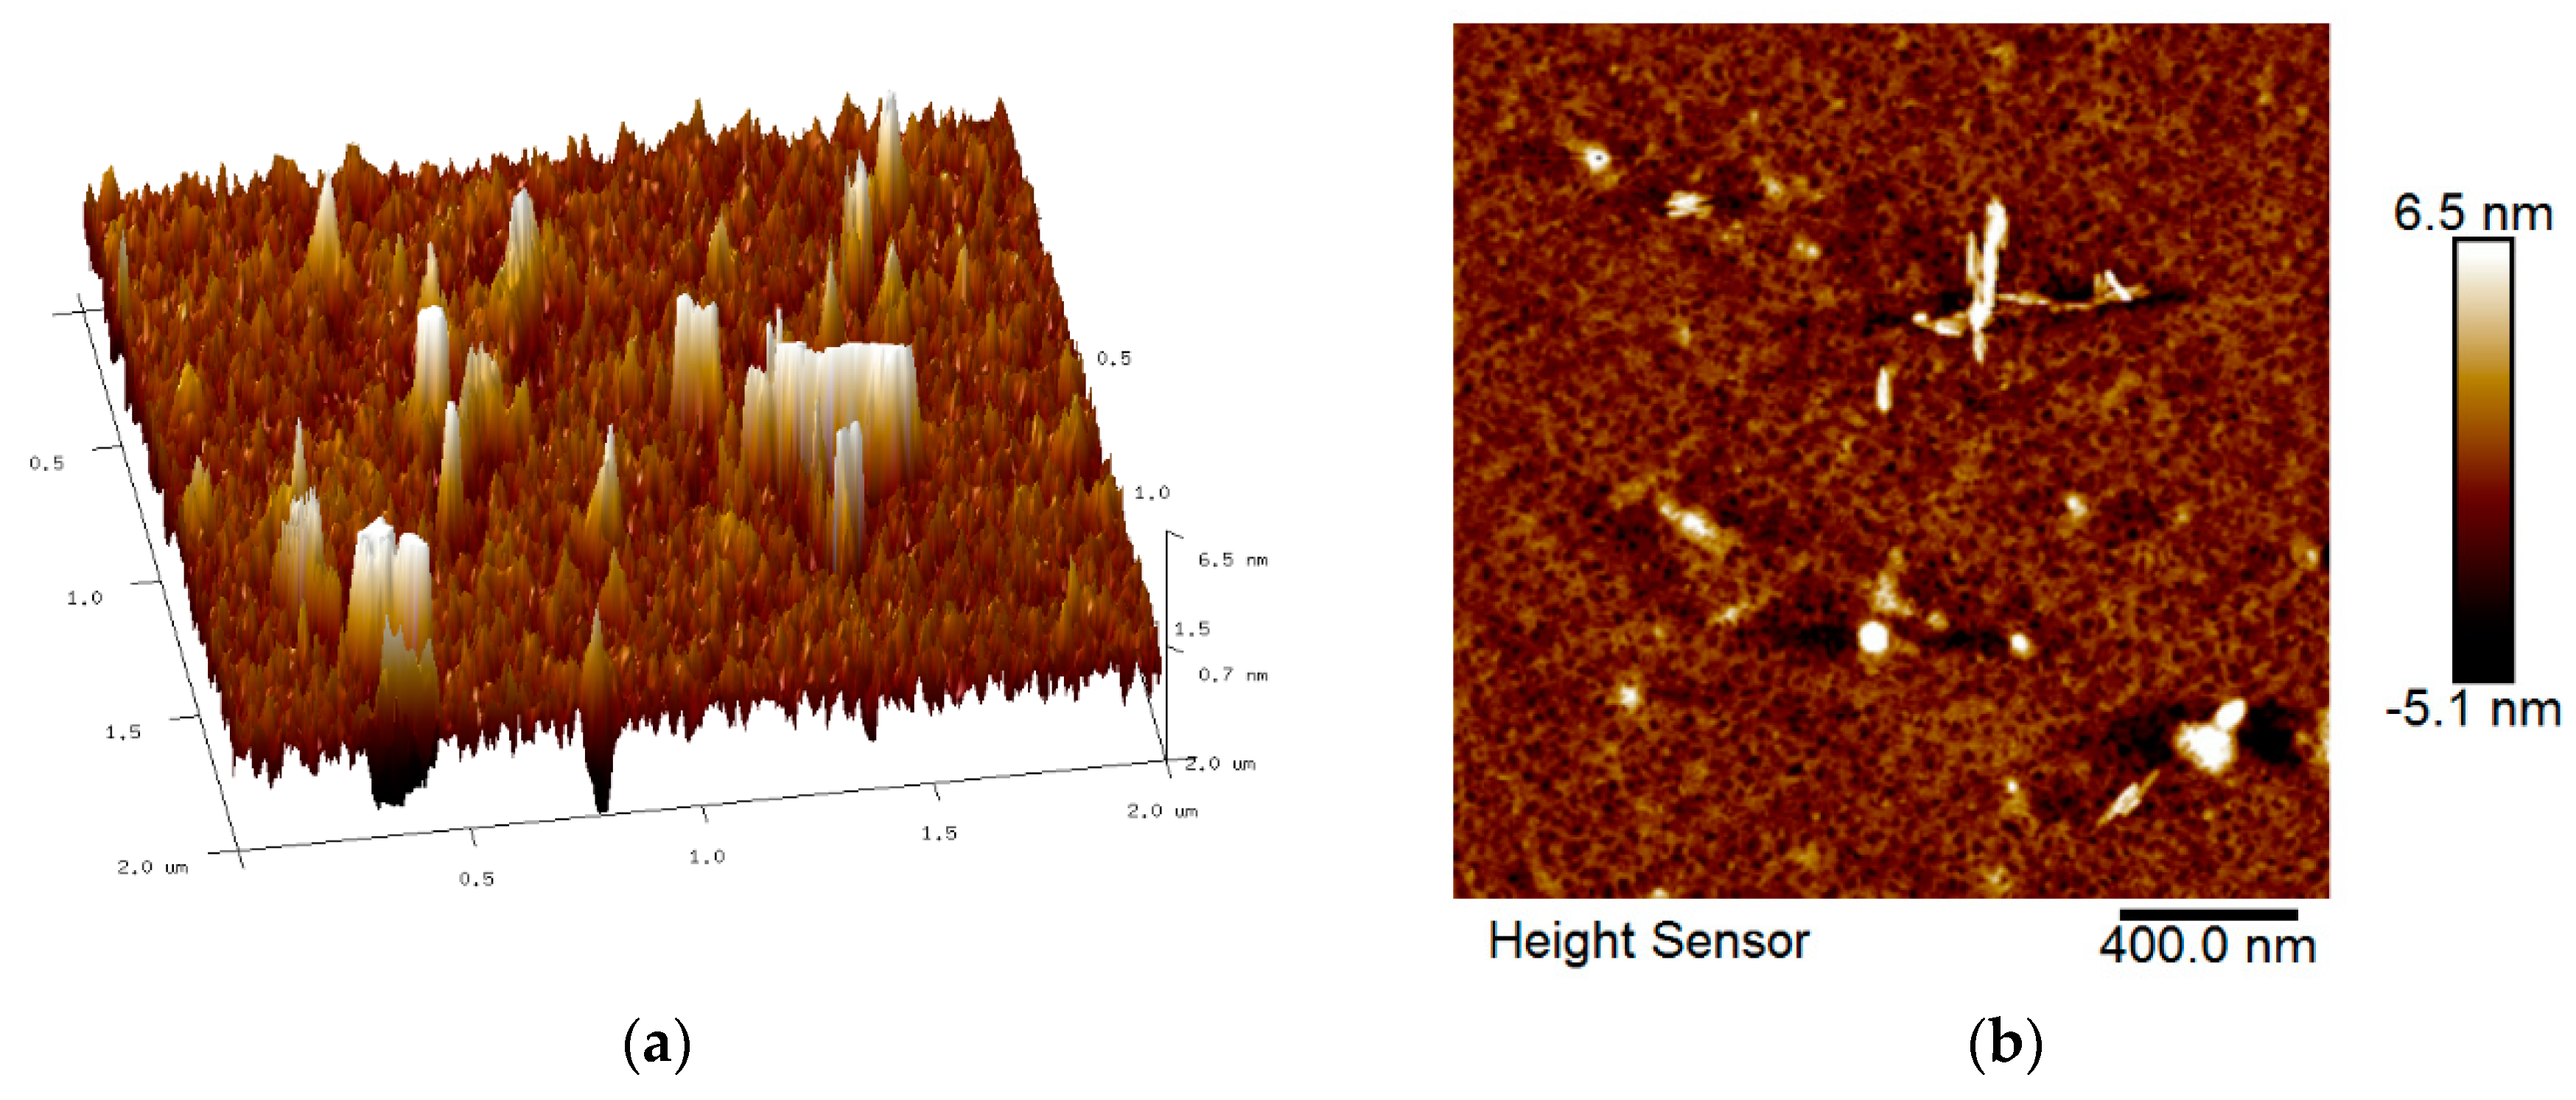
3.2. Surface Morphology
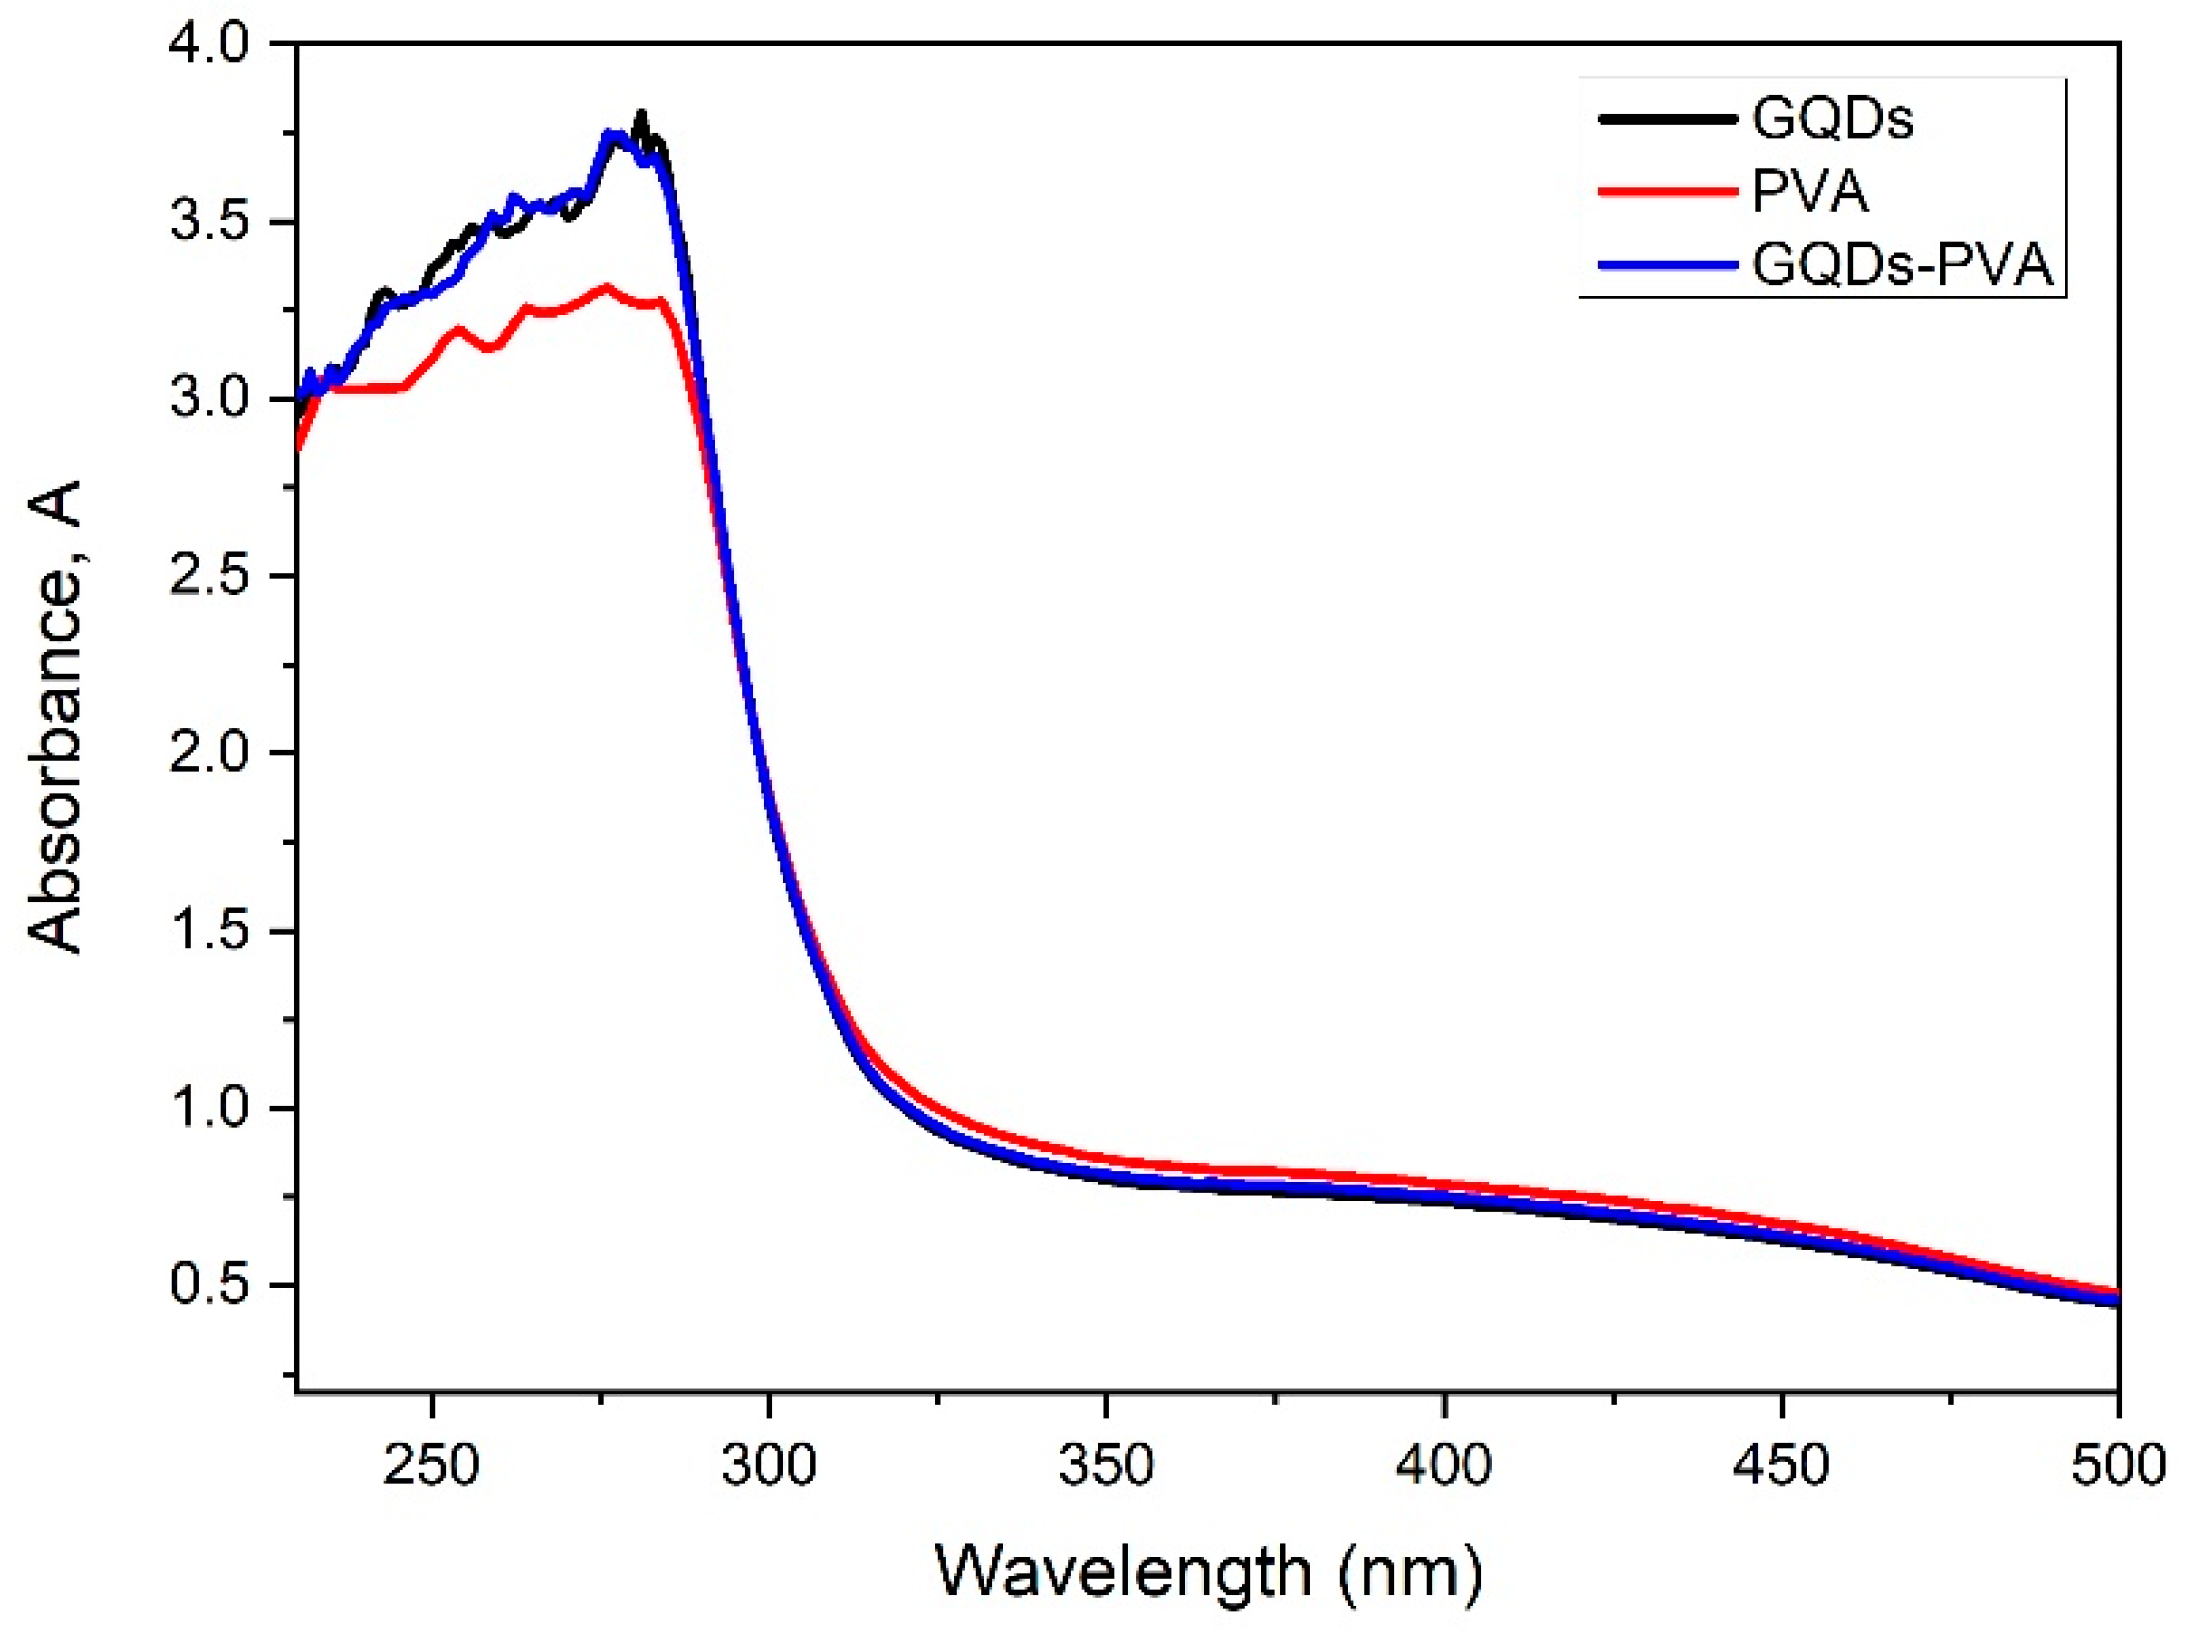
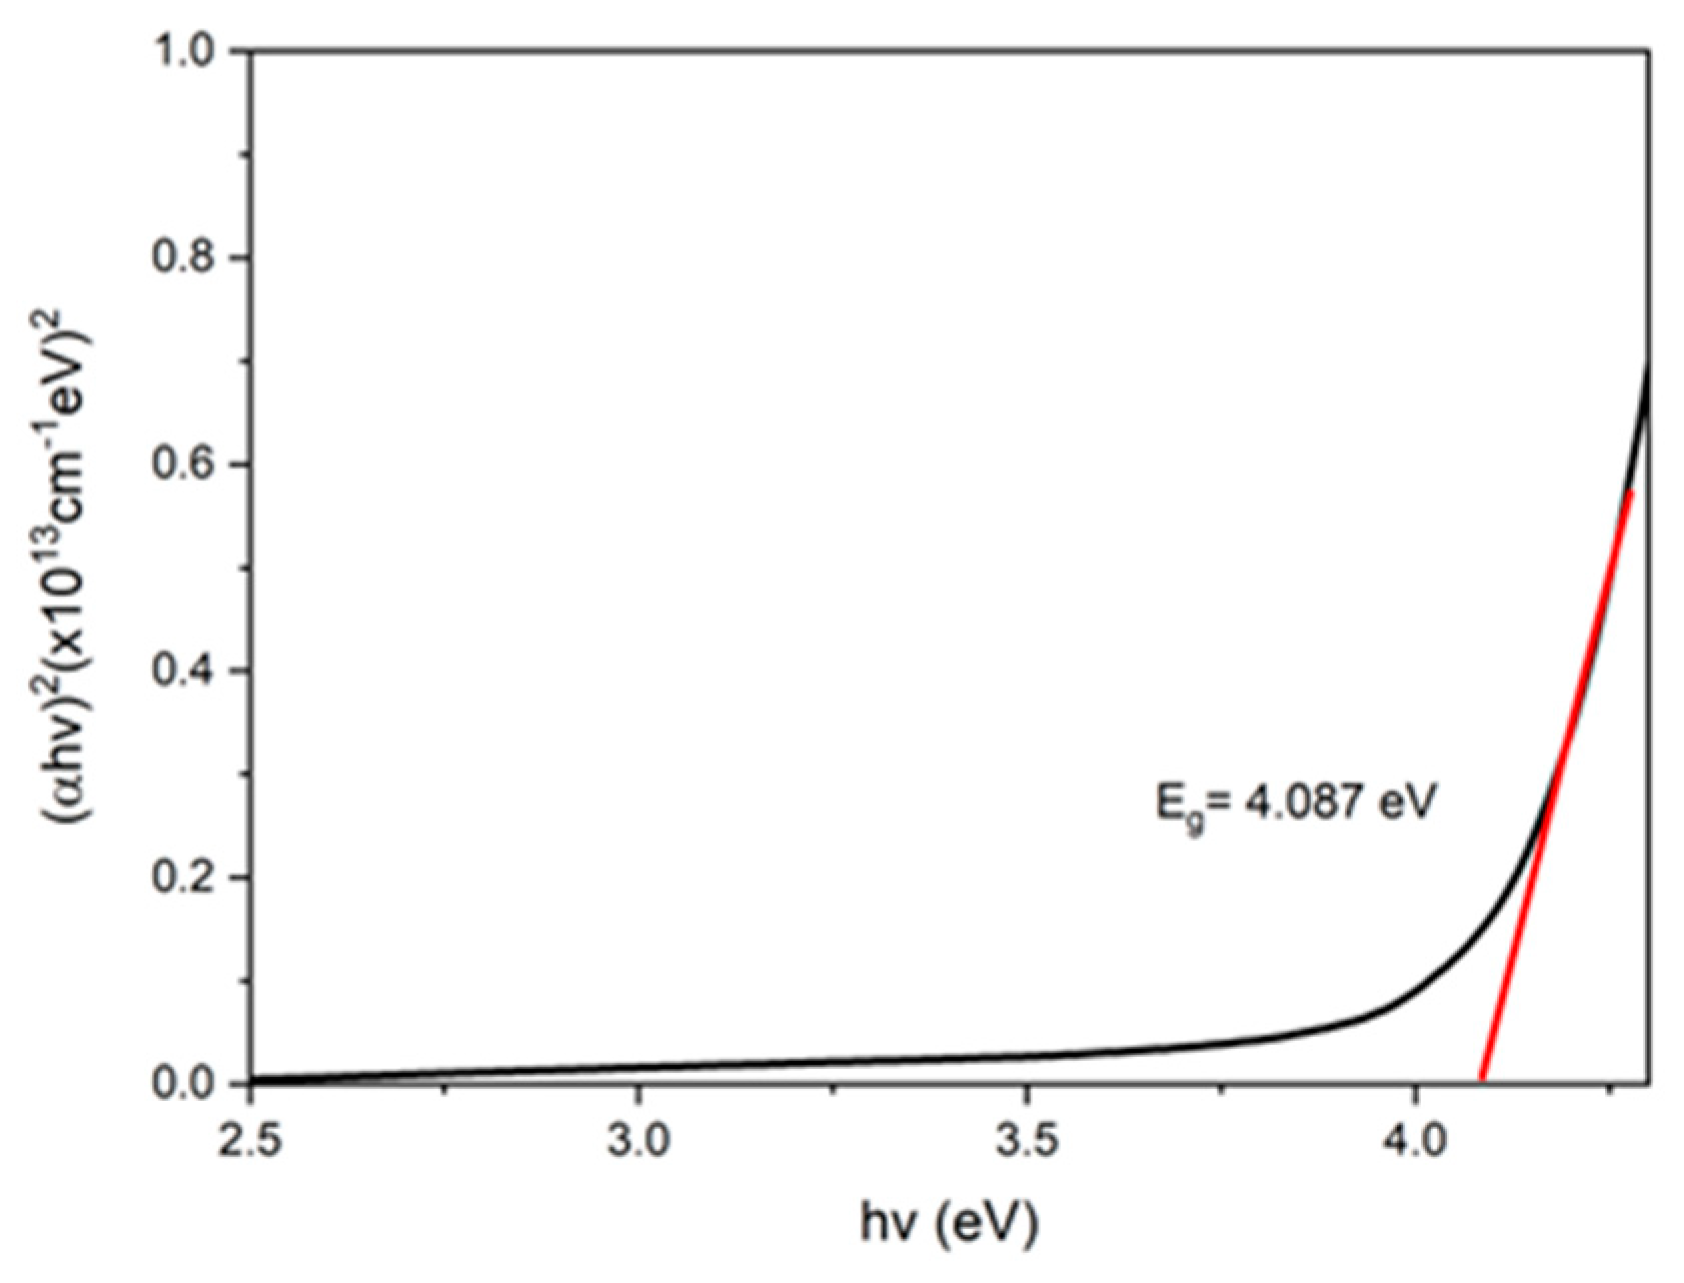
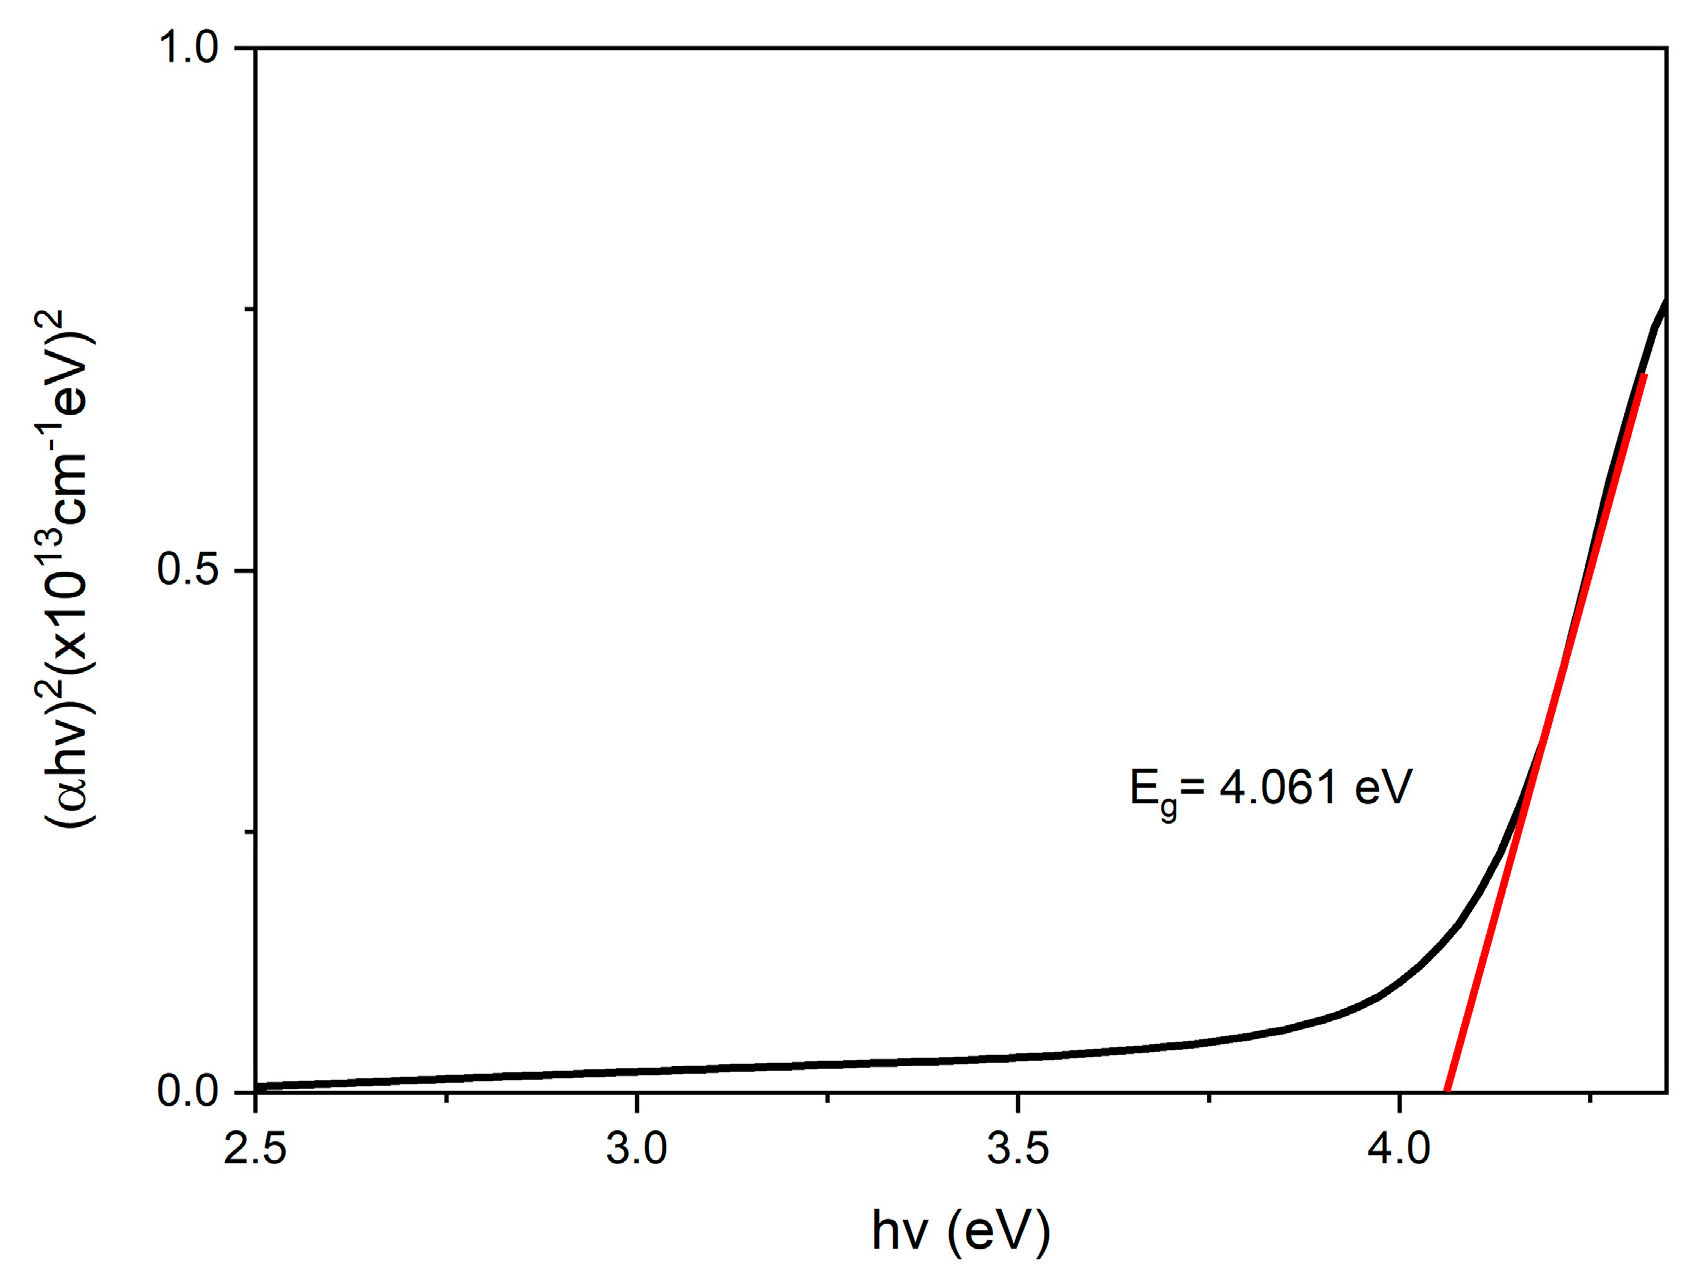
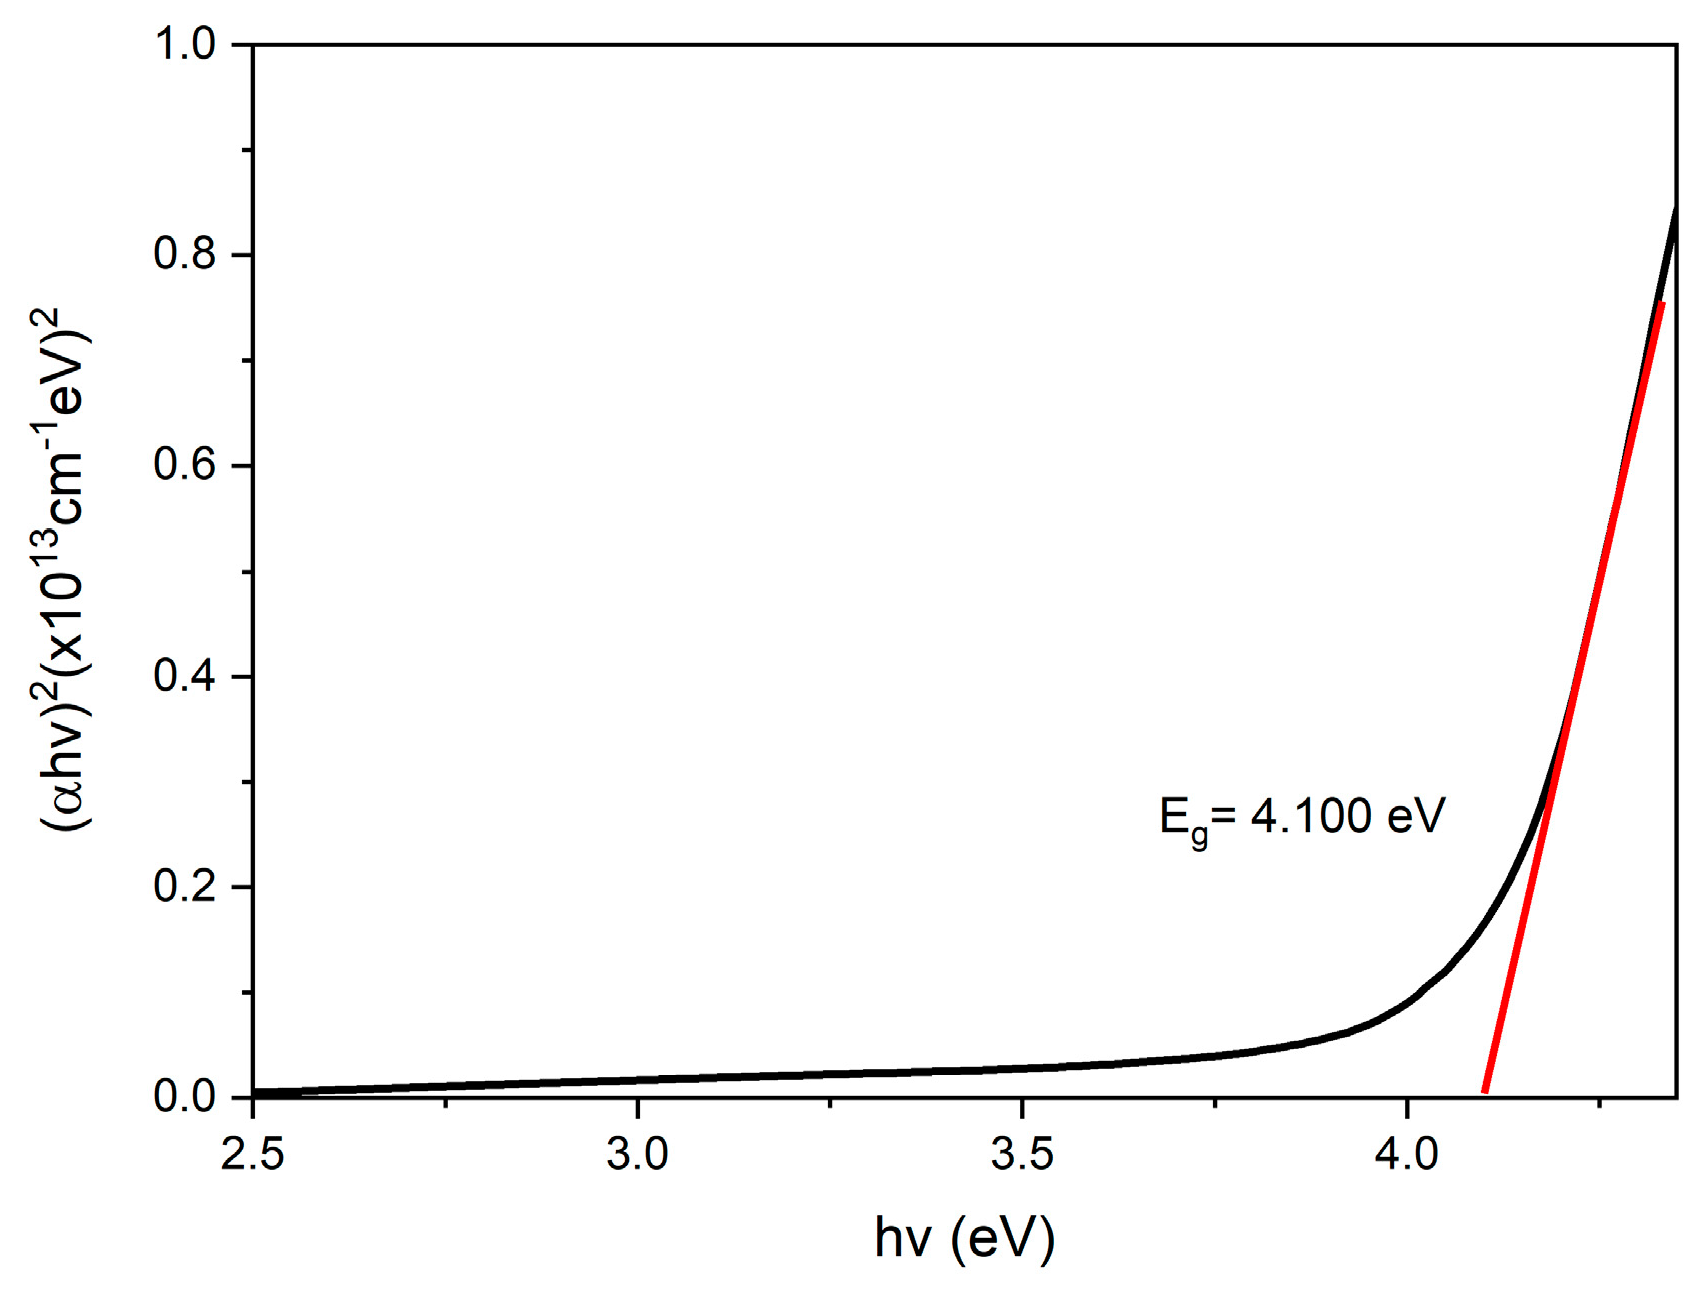
3.3. Optical Properties
3.4. Potential Plasmonic Sensing
4. Conclusions
Author Contributions
Funding
Data Availability Statement
Acknowledgments
Conflicts of Interest
References
- Riesen, H.; Wiebeler, C.; Schumacher, S. Optical spectroscopy of graphene quantum dots: The case of C132. J. Phys. Chem. 2014, 118, 5189–5195. [Google Scholar]
- Kalluri, A.; Debnath, D.; Dharmadhikari, B.; Patra, P. Chapter Twelve—Graphene quantum dots: Synthesis and applications. Methods Enzymol. 2018, 609, 335–354. [Google Scholar] [PubMed]
- Rahmandoust, M. Computational evaluation of the mechanical properties of synthesized graphene quantum dots under consideration of defects. Carbon Lett. 2020, 31, 427–440. [Google Scholar] [CrossRef]
- Zheng, X.T.; Ananthanarayanan, A.; Luo, K.Q.; Chen, P. Glowing graphene quantum dots and carbon dots: Properties, syntheses, and biological applications. Nano Micro Small 2015, 11, 1620–1636. [Google Scholar] [CrossRef] [PubMed]
- Lee, N.E.; Jeong, J.; Lim, H.S.; Lee, S.Y.; Cho, S.O. Ultraviolet/blue light emitting high-quality graphene quantum dots and their biocompatibility. Carbon N. Y. 2020, 170, 213–219. [Google Scholar] [CrossRef]
- Zhu, C.; Yang, S.; Wang, G.; Mo, R.; He, P.; Sun, J.; Di, Z.; Yuan, N.; Ding, J.; Ding, G.; et al. Negative induction effect of “graphite” N on graphene quantum dots: Tunable band gap photoluminescence. J. Mater. Chem. C 2015, 3, 8810–8816. [Google Scholar] [CrossRef]
- Chen, Z.; Wang, D.; Wang, X.; Yang, J. Preparation and formaldehyde sensitive properties of N-GQDs/SnO2 nanocomposite. Chin. Chem. Lett. 2019, 31, 2063–2066. [Google Scholar] [CrossRef]
- Khojasteh, H.; Salavati-niasari, M.; Safajou, H.; Safardoust-hojaghan, H. Facile reduction of graphene using urea in solid phase and surface modification by N-doped graphene quantum dots for adsorption of organic dyes. Diam. Relat. Mater. 2017, 79, 133–144. [Google Scholar]
- Li, M.; Chen, T.; Gooding, J.J.; Liu, J. A review of carbon and graphene quantum dots for sensing. ACS Sens. 2019, 4, 1732–1748. [Google Scholar] [CrossRef]
- Yan, Y.; Gong, J.; Chen, J.; Zeng, Z.; Huang, W.; Pu, K.; Liu, J.; Chen, P. Recent advances on graphene quantum dots: From chemistry and physics to applications. Adv. Mater. 2019, 31, 1808283. [Google Scholar] [CrossRef]
- Prabhu, S.A.; Kavithayeni, V.; Suganthy, R.; Geetha, K. Graphene quantum dots synthesis and energy application: A review. Carbon Lett. 2021, 31, 1–12. [Google Scholar] [CrossRef]
- Yang, S.; Li, W.; Ye, C.; Wang, G.; Tian, H.; Zhu, C.; He, P.; Ding, G.; Xie, X.; Liu, Y.; et al. C3N—A 2D crystalline, hole-free, tunable-narrow-bandgap semiconductor with ferromagnetic properties. Adv. Mater. 2017, 29, 1605625. [Google Scholar] [CrossRef] [PubMed]
- Fan, H.; Yu, X.; Wang, K.; Yin, Y.; Tang, Y.; Tang, Y.; Liang, X. Graphene quantum dots (GQDs)-based nanomaterials for improving photodynamic therapy in cancer treatment. Eur. J. Med. Chem. 2019, 182, 111620. [Google Scholar] [CrossRef] [PubMed]
- Li, J.; Yang, S.; Deng, Y.; Chai, P.; Yang, Y.; He, X.; Xie, X.; Kang, Z.; Ding, G.; Zhou, H.; et al. Emancipating target-functionalized carbon dots from autophagy vesicles for a novel visualized tumor therapy. Adv. Funct. Mater. 2018, 28, 1800881. [Google Scholar] [CrossRef]
- Zhao, C.; Song, X.; Liu, Y.; Fu, Y.; Ye, L.; Wang, N.; Wang, F.; Li, L.; Mohammadniaei, M.; Zhang, M.; et al. Synthesis of graphene quantum dots and their applications in drug delivery. J. Nanobiotechnol. 2020, 18, 142. [Google Scholar] [CrossRef]
- Chung, S.; Revia, R.A.; Zhang, M. Graphene quantum dots and their applications in bioimaging, biosensing, and therapy. Adv. Mater. 2021, 33, 1–26. [Google Scholar] [CrossRef]
- Li, Y.; Dong, H.; Tao, Q.; Ye, C.; Yu, M.; Li, J.; Zhou, H.; Yang, S.; Ding, G.; Xie, X. Enhancing the magnetic relaxivity of MRI contrast agents via the localized superacid microenvironment of graphene quantum dots. Biomaterials 2020, 250, 120056. [Google Scholar] [CrossRef]
- Mahalingam, S.; Manap, A.; Omar, A.; Low, F.W.; Afandi, N.F.; Chia, C.H.; Rahim, N.A. Functionalized graphene quantum dots for dye-sensitized solar cell: Key challenges, recent developments and future prospects. Renew. Sustain. Energy Rev. 2021, 144, 110999. [Google Scholar] [CrossRef]
- Zor, E.; Morales-Narváez, E.; Zamora-Gálvez, A.; Bingol, H.; Ersoz, M.; Merkoçi, A. Graphene quantum dots-based photoluminescent sensor: A multifunctional composite for pesticide detection. ACS Appl. Mater. Interfaces 2015, 36, 20272–20279. [Google Scholar] [CrossRef]
- Liu, Y.; Cao, N.; Gui, W.; Ma, Q. Nitrogen-doped graphene quantum dots-based fluorescence molecularly imprinted sensor for thiacloprid detection. Talanta 2018, 183, 339–344. [Google Scholar] [CrossRef]
- Nair, R.V.; Thomas, R.T.; Mohamed, A.P.; Pillai, S. Fluorescent turn-off sensor based on sulphur-doped graphene quantum dots in colloidal and film forms for the ultrasensitive detection of carbamate pesticides. Microchem. J. 2020, 157, 104971. [Google Scholar] [CrossRef]
- De Almeida, L.K.S.; Chigome, S.; Torto, N.; Frost, C.L.; Pletschke, B.I. A novel colorimetric sensor strip for the detection of glyphosate in water. Sens. Actuators B Chem. 2015, 206, 357–363. [Google Scholar] [CrossRef]
- Aksornneam, L.; Kanatharana, P.; Thavarungkui, P.; Thammakhet, C. 5-aminofluorescein doped polyvinyl alcohol film for the detection of formaldehyde in vegetables and seafood. Anal. Methods 2016, 8, 1249–1256. [Google Scholar] [CrossRef]
- Thi, P.; Hong, K.; Jang, C. Sensitive and label-free liquid crystal-based optical sensor for the detection of malathion. Anal. Biochem. 2020, 593, 113589. [Google Scholar]
- Chamuah, N.; Bhuyan, N.; Das, P.P.; Ojah, N.; Choudhary, A.J.; Medhi, T.; Nath, P. Gold-coated electrospun PVA nano fibers as SERS substrate for detection of pesticides. Sens. Actuators B Chem. 2018, 273, 710–717. [Google Scholar] [CrossRef]
- Kong, L.; Huang, M.; Chen, J.; Lin, M. In situ detection of thiram in fruits and vegetables by colorimetry/surface- In situ detection of thiram in fruits and vegetables by colorimetry/surface-enhanced Raman spectroscopy. Laser Phys. 2020, 30, 65602. [Google Scholar] [CrossRef]
- Solaro, R.; Corti, A.; Chiellini, E. Biodegradation of poly (vinyl alcohol) with different molecular weights and degree of hydrolysis. Polym. Adv. Technol. 2000, 878, 873–878. [Google Scholar] [CrossRef]
- Zhang, Y.; Liu, X.; Wu, X.; Liu, Q.; Wang, Z. A carbon black/polyvinyl alcohol-based composite thin film sensor integrating strain and humidity sensing using the droplet deposition method. Crystals 2022, 12, 1316. [Google Scholar] [CrossRef]
- Liu, B.; Zhang, J.; Guo, H. Research progress of polyvinyl alcohol water-resistant film materials. Membranes 2022, 12, 347. [Google Scholar] [CrossRef]
- Kouser, S.; Prabhu, A.; Prashantha, K.; Nagaraja, G.K.; Neetha, J.; Navada, K.M.; Qurashi, A.; Manasa, D.J. Modified halloysite nanotubes with Chitosan incorporated PVA/PVP bionanocomposite films: Thermal, mechanical properties and biocompatibility for tissue engineering. Colloids Surf. A Physicochem. Eng. Asp. 2022, 634, 127941. [Google Scholar] [CrossRef]
- El Fawal, G.F.; Hassan, S.; El-aassar, M.R.; Elkady, M.F. Electrospun polyvinyl alcohol nanofibers containing titanium dioxide for gas sensor applications. Arab. J. Sci. Eng. 2019, 44, 251–257. [Google Scholar] [CrossRef]
- Husain, M.S.B.; Gupta, A.; Alashwal, B.Y.; Sharma, S. Synthesis of PVA/PVP based hydrogel for biomedical applications: A review. Energy Sources Part A Recover. Util. Environ. Eff. 2018, 40, 2388–2393. [Google Scholar] [CrossRef]
- Shagholani, H.; Ghoreishi, S.M.; Mousazadeh, M. Improvement of interaction between PVA and chitosan via magnetite nanoparticles for drug delivery application. Int. J. Biol. Macromol. 2015, 78, 130–136. [Google Scholar] [CrossRef] [PubMed]
- de Souza Gomes, A.; Filho, J.C.D. Hybrid membranes of PVA for direct ethanol fuel cells (DEFCs) applications. Int. J. Hydrogen Energy 2012, 37, 6246–6252. [Google Scholar] [CrossRef]
- Fauzi, N.I.M.; Fen, Y.W.; Omar, N.A.S.; Hashim, H.S. Recent advances on detection of insecticides using optical sensors. Sensors 2021, 21, 3856. [Google Scholar] [CrossRef] [PubMed]
- Mauriz, E.; Calle, A.; Abad, A.; Montoya, A.; Hildebrandt, A.; Barcel, D.; Lechuga, L.M. Determination of carbaryl in natural water samples by a surface plasmon resonance flow-through immunosensor. Biosens. Bioelectron. 2006, 21, 2129–2136. [Google Scholar] [CrossRef] [PubMed]
- Hossain, S.M.Z.; Luckham, R.E.; McFadden, M.J.; Brennan, J.D. Reagentless bidirectional lateral flow bioactive paper sensors for detection of pesticides in beverage and food samples. Anal. Chem. 2009, 81, 9055–9064. [Google Scholar] [CrossRef]
- Minha, P.N.; Hoangb, V.-T.; Ngo Xuan Dinh; Van Hoang, O.; Van Cuong, N.; Hop, D.T.B.; Tuanc, T.Q.; Khi, N.T.; Huy, T.Q.; Le, A.-T. Reduced graphene oxide-wrapped silver nanoparticles for applications to ultrasensitive colorimetric detection of Cr (VI) ions and carbaryl pesticide. New J. Chem. 2020, 44, 7611–7620. [Google Scholar] [CrossRef]
- Chen, Y.; Qin, X.; Yuan, C.; Shi, R.; Wang, Y. Double responsive analysis of carbaryl pesticide based on carbon quantum dots and Au nanoparticles. Dye. Pigment. 2020, 181, 108529. [Google Scholar] [CrossRef]
- Shahdost-fard, F.; Fahimi-Kashani, N.; Hormozi-nezhad, M. A ratiometric fluorescence nanoprobe using CdTe QDs for fast detection of carbaryl insecticide in apple. Talanta 2020, 221, 121467. [Google Scholar] [CrossRef]
- Tsagkaris, A.S.; Uttl, L.; Pulkrabova, J.; Hajslova, J. Screening of carbamate and organophosphate pesticides in food matrices using an affordable and simple spectrophotometric acetylcholinesterase assay. Appl. Sci. 2020, 10, 565. [Google Scholar] [CrossRef] [Green Version]
- Arcadio, F.; Seggio, M.; Prete, D.D.; Buonanno, G.; Mendes, J.; Coelho, L.C.C.; Jorge, P.A.S.; Zeni, L.; Bossi, A.M.; Cennamo, N. A plasmonic biosensor based on light-diffusing fibers functionalized with molecularly imprinted nanoparticles for ultralow sensing of proteins. Nanomaterials 2022, 9, 1400. [Google Scholar] [CrossRef] [PubMed]
- Ramdzan, N.S.M.; Fen, Y.W.; Omar, N.A.S.; Anas, N.A.A.; Liew, J.Y.C.; Daniyal, W.M.E.M.M.; Hashim, H.S. Detection of mercury ion using surface plasmon resonance spectroscopy based on nanocrystalline cellulose/poly (3,4-ethylenedioxythiophene) thin film. Measurement 2021, 182, 109728. [Google Scholar] [CrossRef]
- Daniyal, W.M.E.M.M.; Fen, Y.W.; Jaafar, A.; Sadrolhosseini, A.R.; Mahdi, M.A. Design and optimization of surface plasmon resonance spectroscopy for optical constant characterization and potential sensing application: Theoretical and experimental approaches. Photonics 2021, 8, 361. [Google Scholar] [CrossRef]
- Hashim, H.S.; Fen, Y.W.; Omar, N.A.S.; Abdullah, J.; Daniyal, W.M.E.M.M.; Saleviter, S. Detection of phenol by incorporation of gold modified-enzyme based graphene oxide thin film with surface plasmon resonance technique. Opt. Express 2020, 28, 9738–9752. [Google Scholar] [CrossRef]
- Fauzi, N.I.M.; Fen, Y.W.; Jaafar, A.; Kamarudin, M.A.; Omar, N.A.S.; Eddin, F.B.K.; Ramdzan, N.S.M.; Daniyal, M.E.M.M. Evaluation of structural and optical properties of graphene oxide-polyvinyl alcohol thin film and its potential for pesticide detection using an optical method. Photonics 2022, 9, 300. [Google Scholar] [CrossRef]
- Eddin, F.B.K.; Fen, Y.W. The principle of nanomaterials based surface plasmon resonance biosensors and its potential for dopamine detection. Molecules 2020, 25, 2769. [Google Scholar] [CrossRef]
- Park, J.H.; Cho, Y.W.; Kim, T.H. Recent advances in surface plasmon resonance sensors for sensitive optical detection of pathogens. Biosensors 2022, 3, 180. [Google Scholar] [CrossRef]
- Potdar, R.P.; Khollam, Y.B.; Shaikh, S.F.; More, P.S.; Rana, A.H. Polyvinylpyrrolidone-capped silver nanoparticles for highly sensitive and selective optical fiber-based ammonium sensor. Nanomaterials 2022, 19, 3373. [Google Scholar] [CrossRef]
- Singh, P. SPR biosensors: Historical perspectives and current challenges. Sens. Actuators B Chem. 2016, 229, 110–130. [Google Scholar] [CrossRef]
- Eddin, F.B.K.; Fen, Y.W.; Fauzi, N.I.M.; Daniyal, W.M.E.M.M.; Omar, N.A.S.; Anuar, M.F.; Hashim, H.S.; Sadrolhosseini, A.R.; Abdullah, H. Direct and sensitive detection of dopamine using carbon quantum dots based refractive index surface plasmon resonance sensor. Nanomaterials 2022, 12, 1799. [Google Scholar] [CrossRef] [PubMed]
- Puiu, M.; Bala, C. SPR and SPR Imaging: Recent trends in developing nanodevices for detection and real-time monitoring of biomolecular events. Sensors 2016, 6, 870. [Google Scholar] [CrossRef] [PubMed]
- Saleviter, S.; Fen, Y.W.; Daniyal, W.M.E.M.M.; Abdullah, J.; Sadrolhosseini, A.R.; Omar, N.A.S. Design and analysis of surface plasmon resonance optical sensor for determining cobalt ion based on chitosan-graphene oxide decorated quantum dots-modified gold active layer. Opt. Express 2019, 27, 32294–32307. [Google Scholar] [CrossRef] [PubMed]
- Ramdzan, N.S.M.; Fen, Y.W.; Anas, N.A.A.; Omar, N.A.S.; Saleviter, S. Development of biopolymer and conducting polymer-based optical sensors for heavy metal ion detection. Molecules 2020, 25, 2548. [Google Scholar] [CrossRef]
- Fauzi, N.I.M.; Fen, Y.W.; Omar, N.A.S.; Saleviter, S.; Daniyal, W.M.E.M.M.; Hashim, H.S.; Nasrullah, M. Nanostructured chitosan/maghemite composites thin film for potential optical detection of mercury ion by surface plasmon resonance investigation. Polymers 2020, 12, 1497. [Google Scholar] [CrossRef]
- Ashley, J.; Piekarska, M.; Segers, C.; Trinh, L.; Rodgers, T.; Willey, R.; Tothill, I.E. An SPR based sensor for allergens detection. Biosens. Bioelectron. 2017, 88, 109–113. [Google Scholar] [CrossRef] [Green Version]
- Fen, Y.W.; Yunus, W.M.M.; Moksin, M.M.; Talib, Z.A.; Yusof, N.A. Surface plasmon resonance optical sensor for mercury ion detection by crosslinked chitosan thin film. J. Optoelectron. Adv. Mater. 2011, 13, 279–285. [Google Scholar]
- Pope, C.; Karanth, S.; Liu, J. Pharmacology and toxicology of cholinesterase inhibitors: Uses and misuses of a common mechanism of action. Environ. Toxicol. Pharmacol. 2005, 19, 433–446. [Google Scholar] [CrossRef]
- Leung, M.C.K.; Meyer, J.N. Mitochondria as a target of organophosphate and carbamate pesticides: Revisiting common mechanisms of action with new approach methodologies. Reprod. Toxicol. 2019, 89, 83–92. [Google Scholar] [CrossRef]
- Rosddi, N.N.M.; Fen, Y.W.; Anas, N.A.A.; Omar, N.A.S.; Ramdzan, N.S.M.; Daniyal, W.M.E.M.M. Cationically modified nanocrystalline cellulose/carboxyl-functionalized graphene quantum dots nanocomposite thin film: Characterization and potential sensing application. Crystals 2020, 10, 875. [Google Scholar] [CrossRef]
- Fen, Y.W.; Yunus, W.M.M.; Yusof, N.A. Optical properties of cross-linked chitosan thin film for copper ion detection using surface plasmon resonance technique. Opt. Appl. 2011, 41, 999–1013. [Google Scholar]
- Omar, N.A.S.; Fen, Y.W.; Abd, J.; Yasmin, M. Sensitive detection of dengue virus type 2 E-Proteins signals using self-assembled monolayers/reduced graphene oxide-PAMAM dendrimer thin film-SPR optical sensor. Sci. Rep. 2020, 10, 2374. [Google Scholar] [CrossRef] [PubMed] [Green Version]
- Roshidi, M.D.A.; Fen, Y.W.; Omar, N.A.S.; Saleviter, S.; Daniyal, W.M.E.M.M. Optical studies of graphene oxide/poly(amidoamine) dendrimer composite thin film and its potential for sensing Hg2+ using surface plasmon resonance spectroscopy. Sens. Mater. 2019, 31, 1147–1156. [Google Scholar] [CrossRef] [Green Version]
- Saleviter, S.; Fen, Y.W.; Omar, N.A.S.; Daniyal, W.M.E.M.M.; Abdullah, J.; Zaid, M.H.M. Structural and optical studies of cadmium sulfide quantum dot- graphene oxide-chitosan nanocomposite thin film as a novel SPR spectroscopy active layer. J. Nanomater. 2018, 2018, 1–8. [Google Scholar] [CrossRef] [Green Version]
- Daniyal, W.M.E.M.M.; Fen, Y.W.; Anas, N.A.A.; Omar, N.A.S.; Ramdzan, N.S.M.; Nakajima, H.; Mahdi, M.A. Enhancing the sensitivity of a surface plasmon resonance-based optical sensor for zinc ion detection by the modification of a gold thin film. RSC Adv. 2019, 9, 41729–41736. [Google Scholar] [CrossRef] [PubMed]
- Daniyal, W.M.E.M.M.; Fen, Y.W.; Fauzi, N.I.M.; Hashim, H.S.; Ramdzan, N.S.; Omar, N.A.S. Recent advances in surface plasmon resonance optical sensors for potential application in environmental monitoring. Sens. Mater. 2020, 32, 4191–4200. [Google Scholar] [CrossRef]
- Li, Z.; Munro, K.; Ebralize, I.I.; Narouz, M.R.; Padmos, J.D.; Hao, H.; Crudden, C.M.; Horton, J.H. N-heterocyclic carbene self-assembled monolayers on gold as surface plasmon resonance biosensors. J. Am. Chem. Soc. 2017, 49, 13936–13944. [Google Scholar] [CrossRef]
- Ramdzan, N.S.; Fen, Y.W.; Liew, J.Y.C.; Omar, N.A.S.; Anas, N.A.A.; Daniyal, W.M.E.M.M.; Fauzi, N.I.M. Exploration on structural and optical properties of nanocrystalline cellulose/poly(3,4-ethylenedioxythiophene) thin film for potential plasmonic sensing application. Photonics 2021, 8, 419. [Google Scholar] [CrossRef]
- Hashim, H.S.; Fen, Y.W.; Omar, N.A.S.; Daniyal, W.M.E.M.M.; Saleviter, S.; Abdullah, J. Structural, optical and potential sensing properties of tyrosinase immobilized graphene oxide thin film on gold surface. Optik—Int. J. Light Electron Opt. 2020, 212, 164786. [Google Scholar] [CrossRef]
- Jin, Y.; Kang, X.; Song, Y.; Zhang, B.; Cheng, G.; Dong, S. Controlled nucleation and growth of surface-confined gold nanoparticles on a (3-aminopropyl)trimethoxysilane-modified glass slide: A strategy for SPR substrates. Anal. Chem. 2001, 73, 2843–2849. [Google Scholar] [CrossRef]
- Paterno, G.M.; Goudappagouda; Chen, Q.; Lanzani, G.; Scotognella, F.; Narita, A. Large polycyclic aromatic hydrocarbons as graphene quantum dots: From synthesis to spectroscopy and photonics. Adv. Opt. Mater. 2021, 9, 2100508. [Google Scholar] [CrossRef]
- Yang, S.; Lei, P.; Shan, Y.; Zhang, D. Preparation and characterization of antibacterial electrospun chitosan/poly(vinyl) alcohol/graphene oxide composite nanofibrous membrane. Appl. Surf. Sci. 2018, 435, 832. [Google Scholar] [CrossRef]
- Salunke, A.S.; Salunke, S.T.; Deokate, R.J.; Kale, B.B. Tuning of photoluminescence behavior of gold coated chitosan-polyvinyl alcohol binding with graphene quantum dots. Mater. Today Proc. 2022, 62, 1752–1757. [Google Scholar] [CrossRef]
- Anas, N.A.A.; Fen, Y.W.; Omar, N.A.S.; Ramdzan, N.S.M.; Daniyal, W.M.E.M.M.; Saleviter, S.; Zainudin, A.A. Optical properties of chitosan/hydroxyl-functionalized graphene quantum dots thin film for potential optical detection of ferric (III) ion. Opt. Laser Technol. 2019, 120, 105724. [Google Scholar] [CrossRef]
- Zhao, Y.; Tong, R.J.; Chen, M.Q.; Xia, F. Relative humidity sensor based on hollow core fiber filled with GQDs-PVA. Sens. Actuators B Chem. 2019, 284, 96–102. [Google Scholar] [CrossRef]
- Felipe, B.H.S.; Cabral, R.L.B.; Ladchumananandasivam, R.; Zille, A.; Kim, S.; Fechine, P.B.A.; Nascimento, J.H.O. Nanocoating on cotton fabric with nitrogen-doped graphene quantum dots/titanium dioxide/PVA: An erythemal UV protection and photoluminescent finishin. J. Mater. Res. Technol. J. 2022, 18, 2435–2450. [Google Scholar] [CrossRef]
- Swinehart, D.F. The Beer-Lambert Law. J. Chem. Educ. 1962, 39, 333–335. [Google Scholar] [CrossRef]
- Sangiorgi, N.; Aversa, L.; Tatti, R.; Verucchi, R.; Sanson, A. Spectrophotometric method for optical band gap and electronic transitions determination of semiconductor materials. Opt. Mater. 2017, 64, 18–25. [Google Scholar] [CrossRef]
- Abdulla, H.S.; Abbo, A.I. Optical and electrical properties of thin films of polyaniline and polypyrrole. Int. J. Electrochem. Sci. 2012, 7, 10666–10678. [Google Scholar]
- Bhatnagar, D.; Singh, S.; Yadav, S.; Kumar, A.; Kaur, I. Experimental and theoretical investigation of relative optical band gaps in graphene generations. Mater. Res. Express 2017, 4, 15101. [Google Scholar] [CrossRef]
- Efros, A.L.; Nesbitt, D.J. Origin and control of blinking in quantum dots. Nat. Publ. Gr. 2016, 11, 661–671. [Google Scholar] [CrossRef] [PubMed]
- Zhu, S.; Song, Y.; Wang, J.; Wan, H.; Zhang, Y.; Ning, Y. Photoluminescence mechanism in graphene quantum dots: Quantum confinement effect and surface/edge state. Nano Today 2017, 13, 10–14. [Google Scholar] [CrossRef]
- Qi, Y.Y.; Tai, Z.X.; Sun, D.F.; Chen, J.T.; Ma, H.B.; Yan, X.B.; Liu, B.; Xue, Q.J. Fabrication and characterization of poly (vinyl alcohol)/graphene oxide nanofibrous biocomposite scaffolds. J. Appl. Polym. Sci. 2012, 127, 1885–1894. [Google Scholar] [CrossRef]
- Yi, Y.; Zhu, G.; Liu, C.; Huang, Y.; Zhang, Y.; Li, H.; Zhao, J.; Yao, S. A Label-free silicon quantum dots-based photoluminescence sensor for ultrasensitive detection of pesticides. Anal. Chem. 2013, 85, 11464–11470. [Google Scholar] [CrossRef] [PubMed]
- He, Y.; Xu, B.; Li, W.; Yu, H. Silver nanoparticle-based chemiluminescent sensor array for pesticide discrimination. J. Agric. Food Chem. 2015, 63, 2930–2934. [Google Scholar] [CrossRef] [PubMed]
- Zhang, C.; Cui, H.; Cai, J.; Duan, Y.; Liu, Y. Development of fluorescence sensing material based on CdSe/ZnS quantum dots and molecularly imprinted polymer for the detection of carbaryl in rice and chinese cabbage. J. Agric. Food Chem. 2015, 63, 5–11. [Google Scholar] [CrossRef]
- Cervera-chiner, L.; Carmen, M.; Antonio, A. Detection of DDT and carbaryl pesticides in honey by means of immunosensors based on High Fundamental Frequency Quartz Crystal Microbalance (HFF-QCM). J. Sci. Food Agric. 2020, 100, 2468–2472. [Google Scholar] [CrossRef]
- Soriano, M.L.; Jimenez-Sanchez, A.; Cardenas, S. Passivated graphene quantum dots for carbaryl determination in juices. J. Sep. Sci. 2021, 44, 1652–1661. [Google Scholar] [CrossRef]
- Zhang, Y.; Gao, L.; Ma, S.; Hu, T. Porous MB@Cd-MOF obtained by post-modification: Self-calibrated fluorescent turn-on sensor for highly sensitive detection of carbaryl. Cryst. Growth Des. 2022, 22, 2662–2669. [Google Scholar] [CrossRef]
- Chen, J.; Liu, Z.; Fang, J.; Wang, Y.; Cao, Y.; Xu, W.; Ma, Y.; Meng, X.; Wang, B. A turn-on fluorescence biosensor for sensitive detection of carbaryl using flavourzyme-stabilized gold nanoclusters. LWT 2022, 157, 113099. [Google Scholar] [CrossRef]
- Fen, Y.W.; Mahmood, W.; Yunus, M.; Yusof, N.A. Detection of mercury and copper ions using surface plasmon resonance optical sensor. Sens. Materials 2011, 23, 325–334. [Google Scholar]
- Omar, N.A.S.; Fen, Y.W.; Abdullah, J.; Zaid, M.H.M.; Daniyal, W.M.E.M.M.; Mahdi, M.A. Sensitive surface plasmon resonance performance of cadmium sulfide quantum dots-amine functionalized graphene oxide based thin film towards dengue virus E-protein. Opt. Laser Technol. 2019, 114, 204–208. [Google Scholar] [CrossRef]
- Maharana, P.K.; Srivastava, T. On the performance of highly sensitive and accurate graphene-on-aluminum and silicon-based SPR biosensor for visible and near infrared. Plasmonics 2014, 9, 1113–1120. [Google Scholar] [CrossRef]
- Chiu, N.; Tu, Y.; Huang, T. Enhanced sensitivity of anti-symmetrically structured surface plasmon resonance sensors with zinc oxide intermediate layers. Sensors 2014, 14, 170–187. [Google Scholar] [CrossRef] [PubMed] [Green Version]
- Rahman, M.S.; Rikta, K.A.; Faisal, L.; Anower, M.S. Enhanced performance of SnSe-Graphene hybrid photonic surface plasmon refractive sensor for biosensing applications. Photonics Nanostruct.-Fundam. Appl. 2020, 39, 100779. [Google Scholar] [CrossRef]
- Sharma, A.K.; Gupta, B.D. On the sensitivity and signal to noise ratio of a step-index fiber optic surface plasmon resonance sensor with bimetallic layers. Opt. Commun. 2005, 245, 159–169. [Google Scholar] [CrossRef]


| Method | Material | Limit of Detection (ppb) | Reference |
|---|---|---|---|
| Surface plasmon resonance | Monoclonal antibody | 1.380 | [36] |
| Gold modified GQDs-PVA | 0.001 | This study | |
| Colorimetry | Idophenyl acetate-acetylcholinesterase | 2.010 | [37] |
| Gold nanoparticles | 1.500 | [38] | |
| Silver reduced-graphene oxide Carbon quantum dots-AuNPs-acetylcholinesterase | 0.200 | [39] | |
| p-acetamidobenzenesulfonyl azide–AuNPs | 50.000 | [83] | |
| Fluorescence | Cadmium telluride quantum dots | 0.120 | [40] |
| Graphene quantum dots | 0.360 | [88] | |
| 3,5-di(2′,5′-dicarboxylphenyl)pyridine | 6.700 | [89] | |
| Flavourzyme-stabilized gold nanoclusters | 0.470 | [90] | |
| Photoluminescence | Silicon quantum dots- acetylcholinesterase/choline oxidase | 0.007 | [84] |
| Chemiluminescence | Lum-AgNP | 1000 | [85] |
| Colorimetry and Chemiluminescence | Dual-graphitic carbon nitride/bismuth ferrite | 0.033 | [86] |
| High Fundamental Frequency Quartz Crystal Microbalance | Monoclonal antibody | 0.050 | [87] |
| Liquid Chromatography with tandem mass spectrometry | Acetylcholinesterase | 20.000 | [41] |
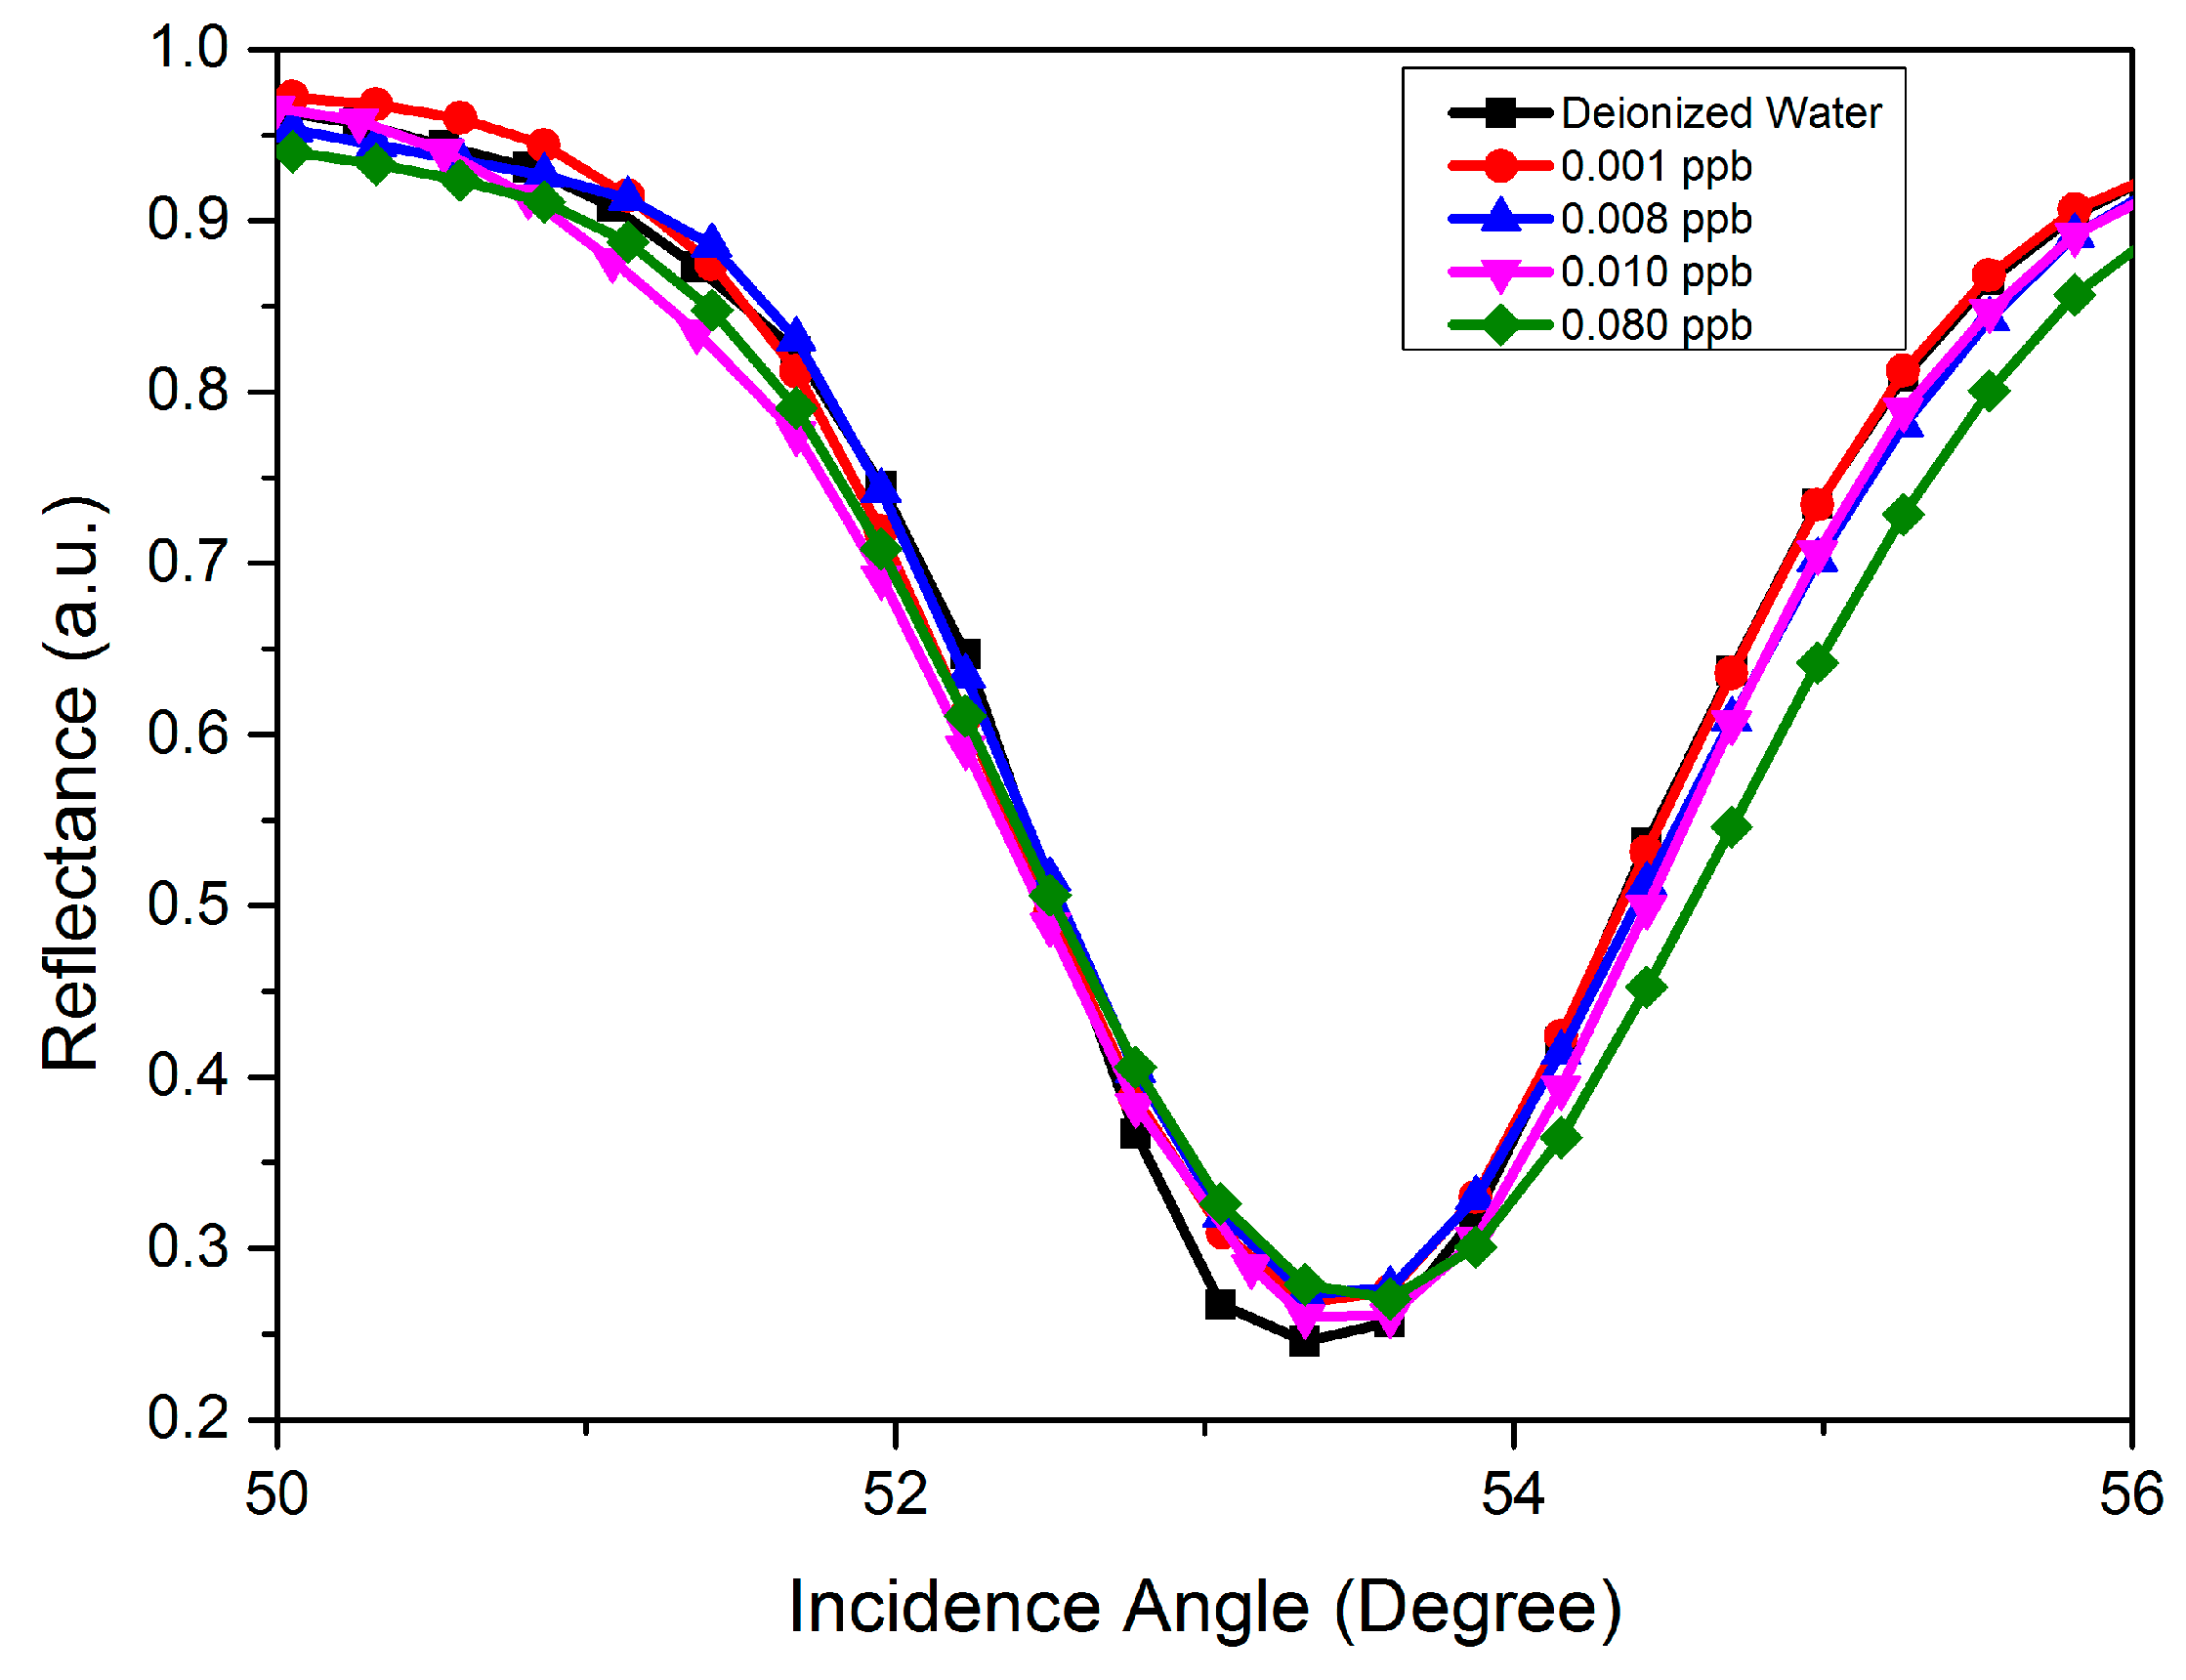
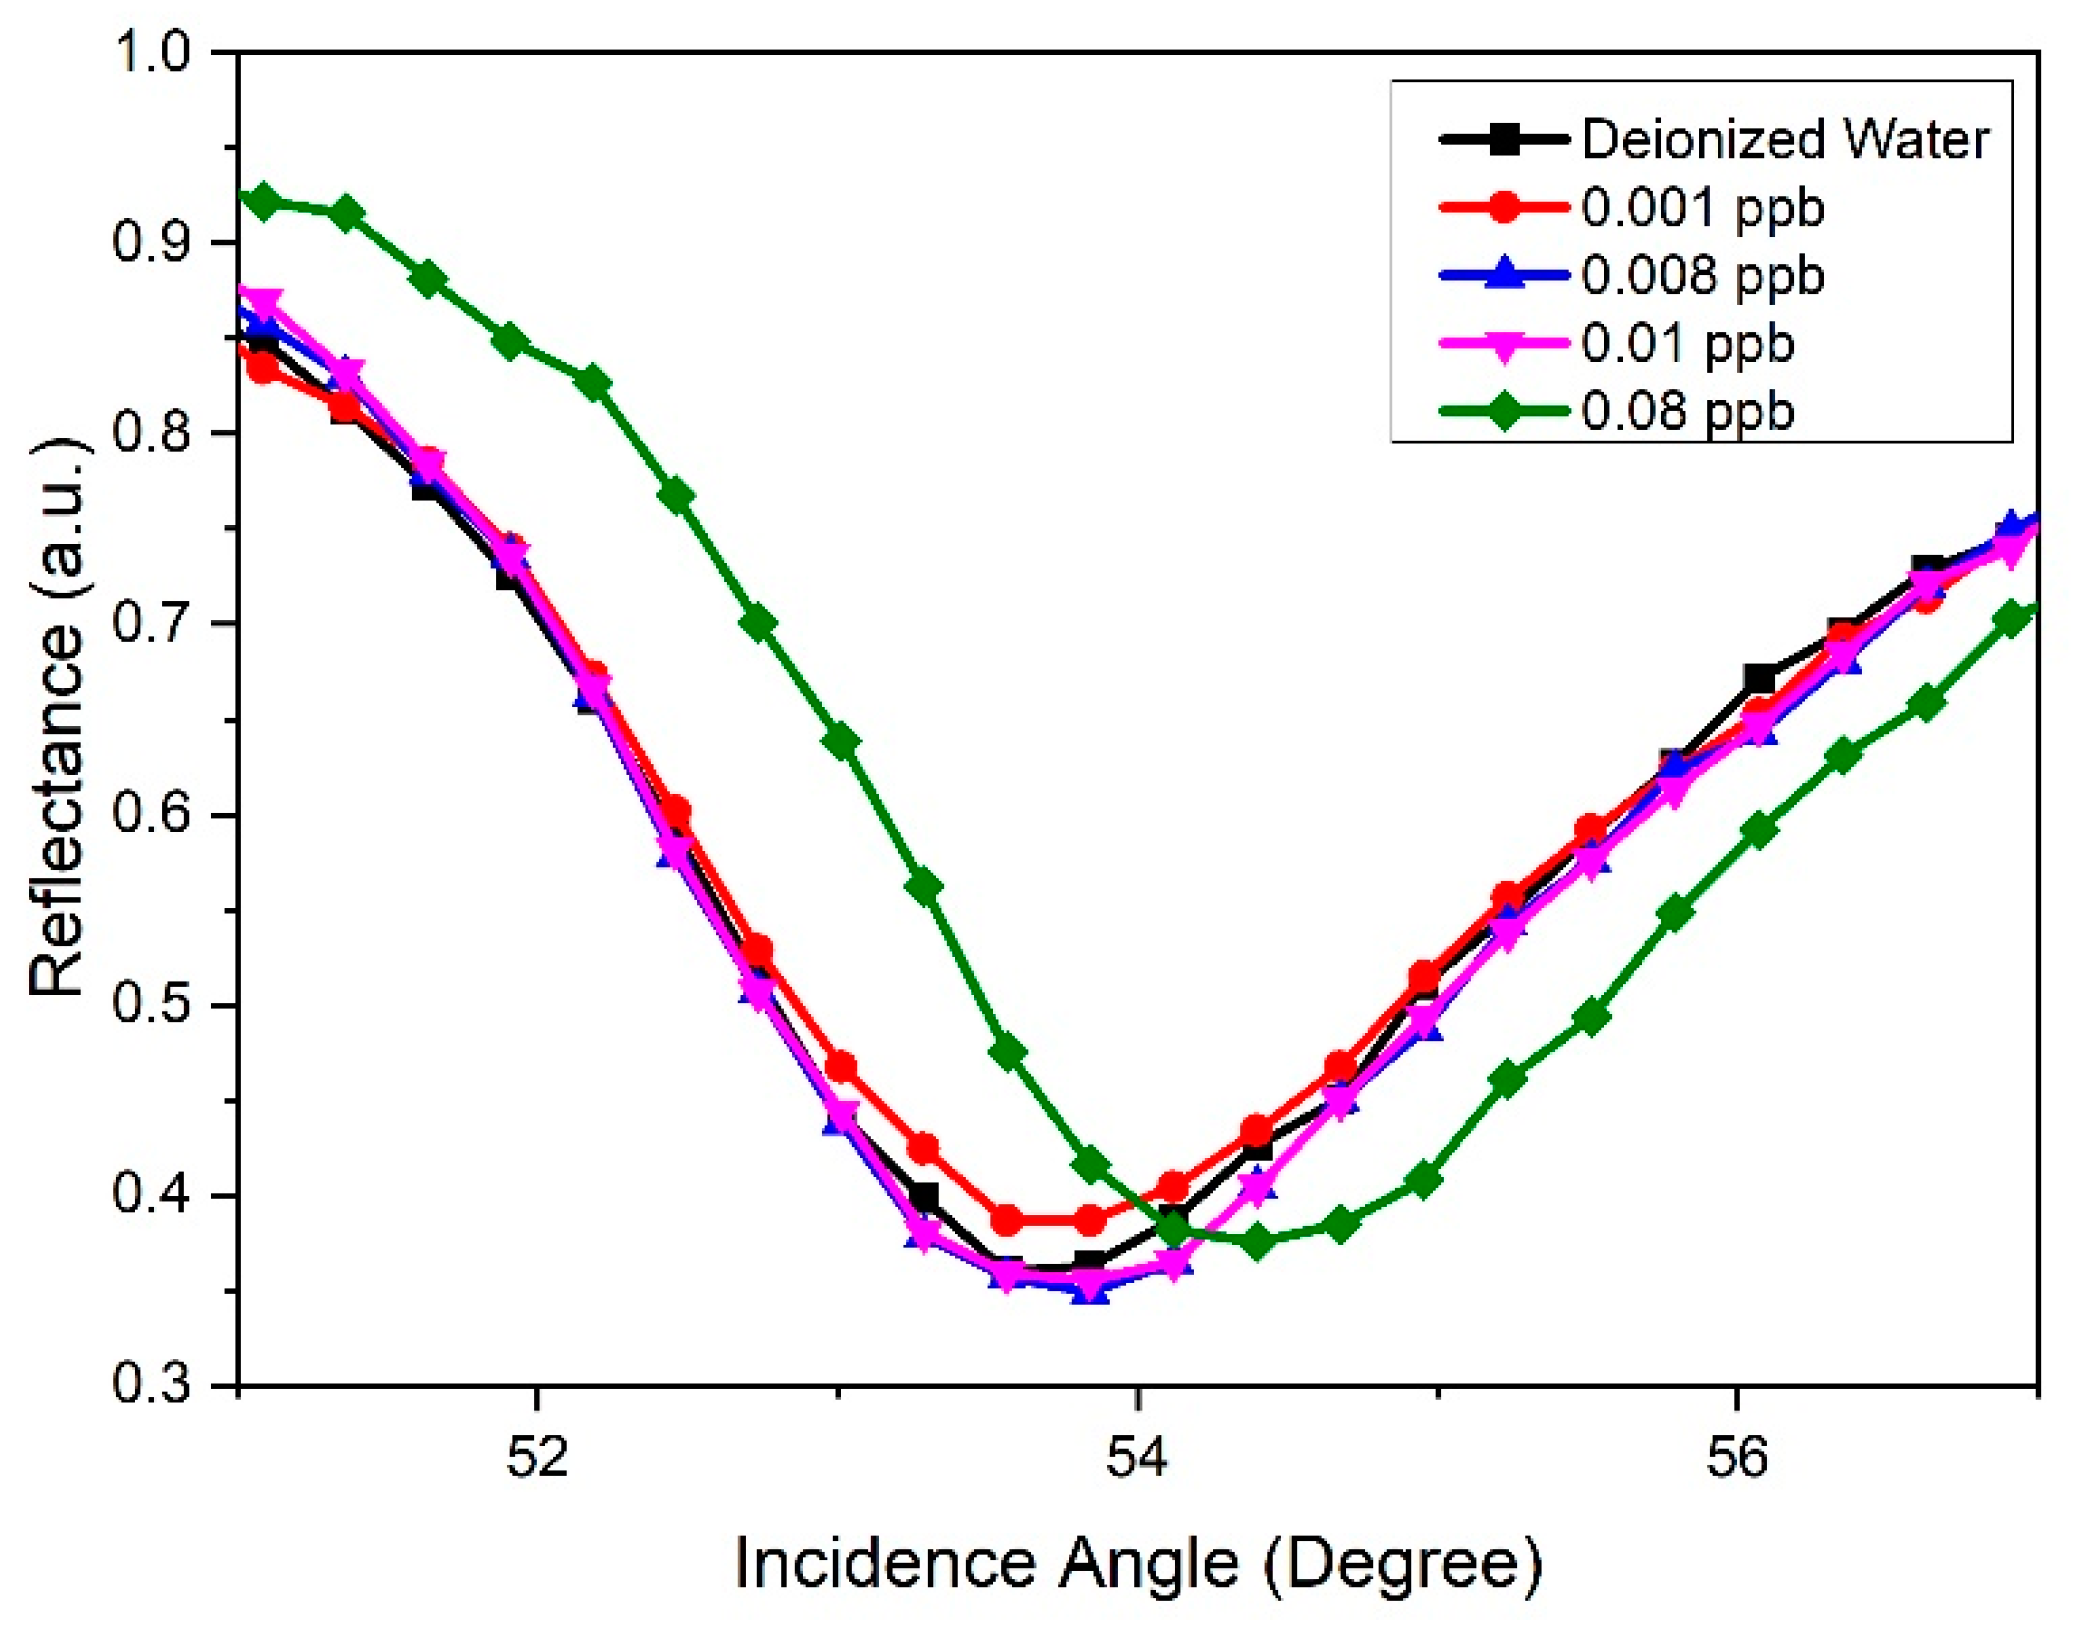
| Concentration of Carbaryl (ppb) | Resonance Angle, θ (Degree) | Shift of Resonance Angle, Δθ (Degree) |
|---|---|---|
| 0 | 53.694 | 0 |
| 0.001 | 53.709 | 0.015 |
| 0.008 | 53.787 | 0.093 |
| 0.01 | 53.809 | 0.115 |
| 0.08 | 54.390 | 0.697 |
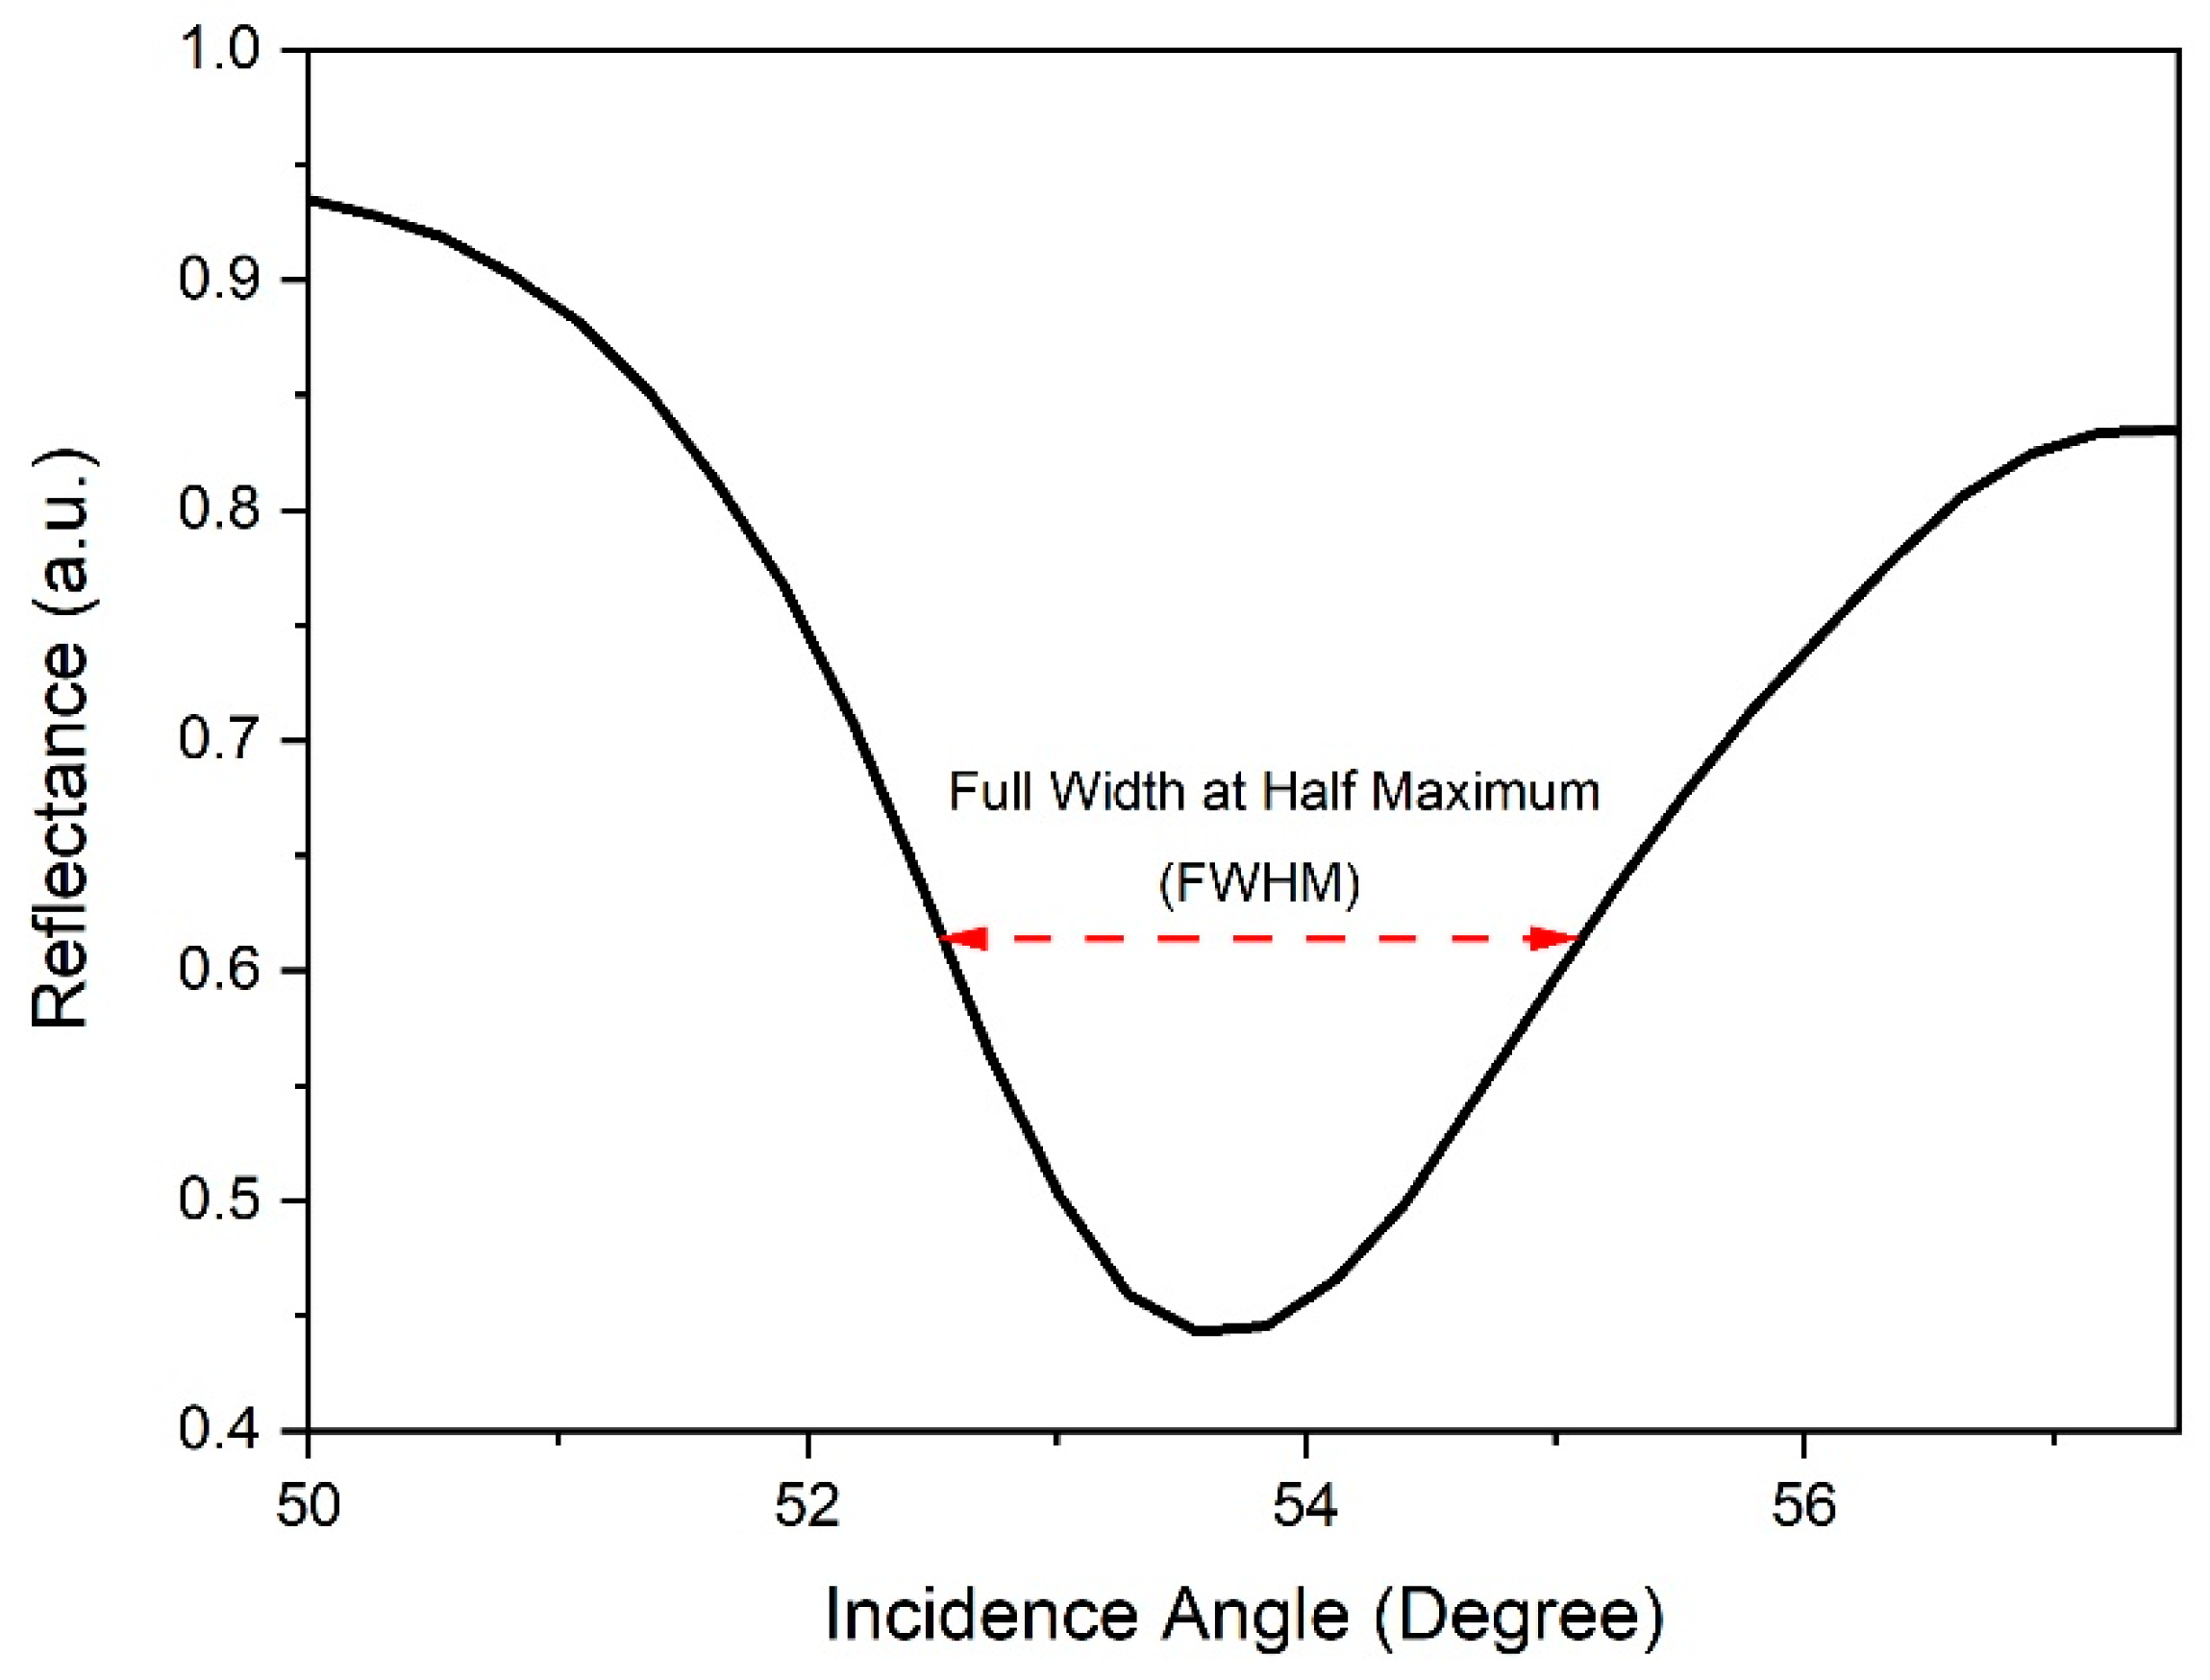
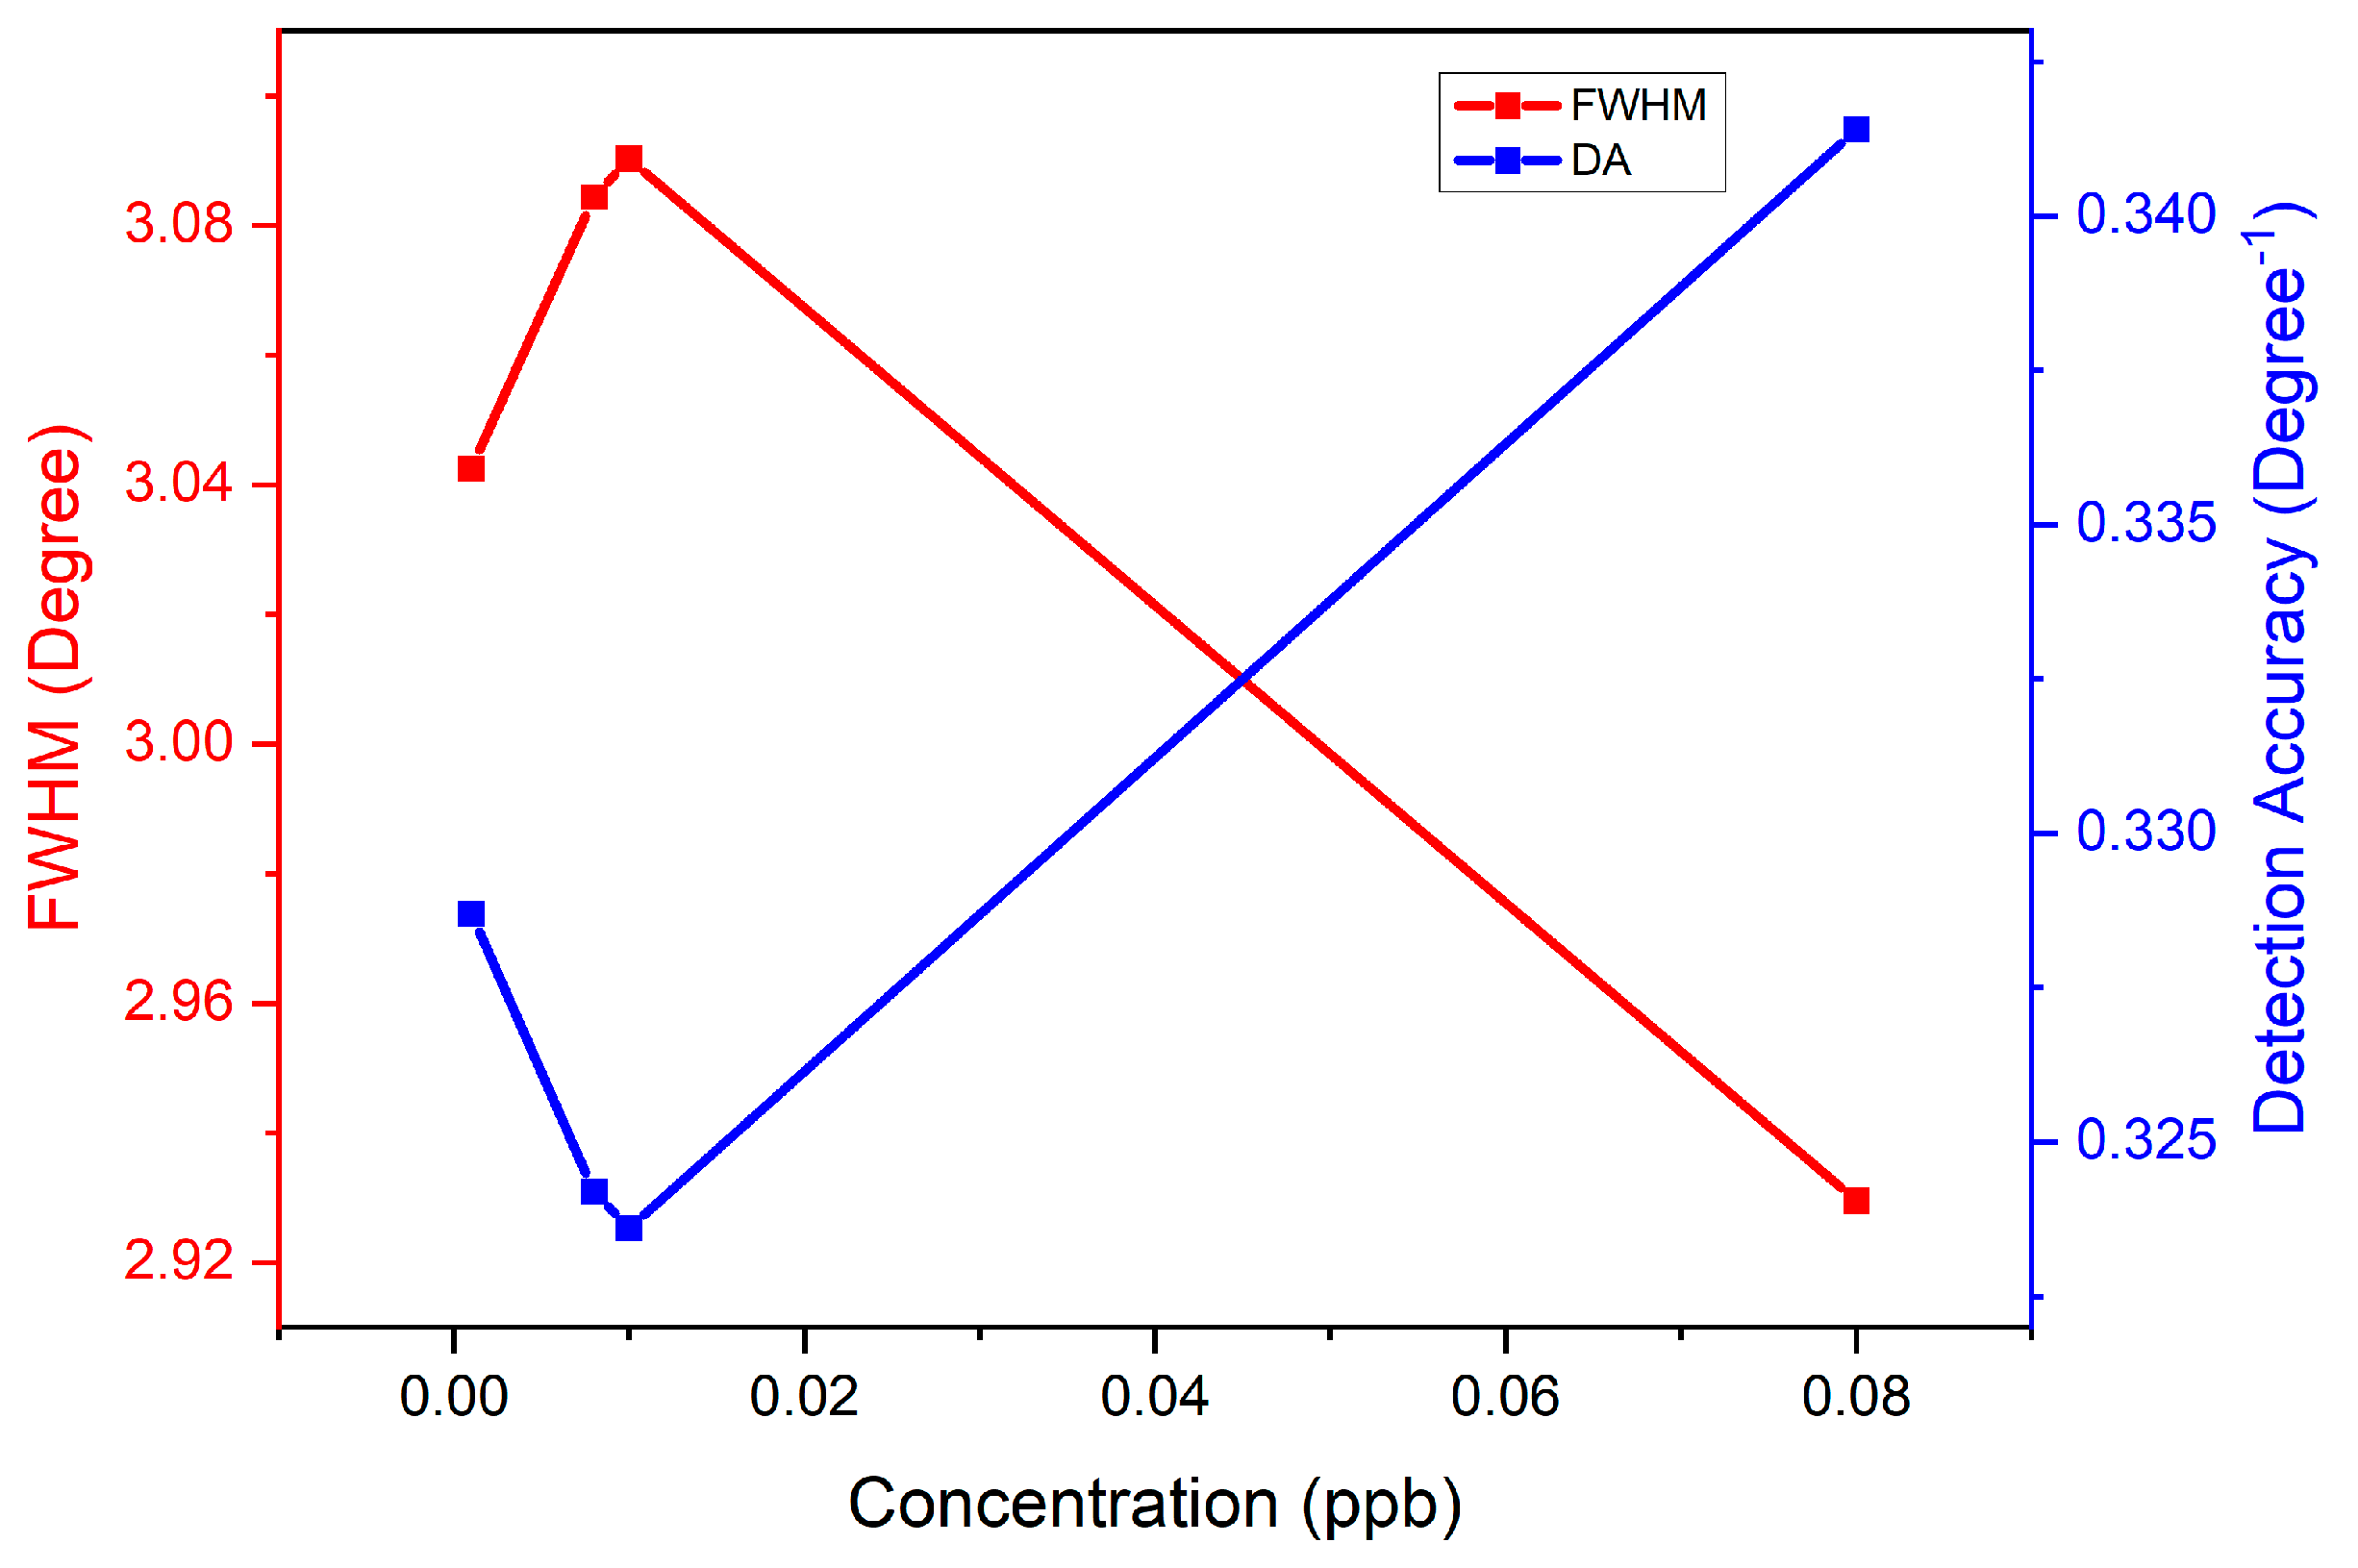
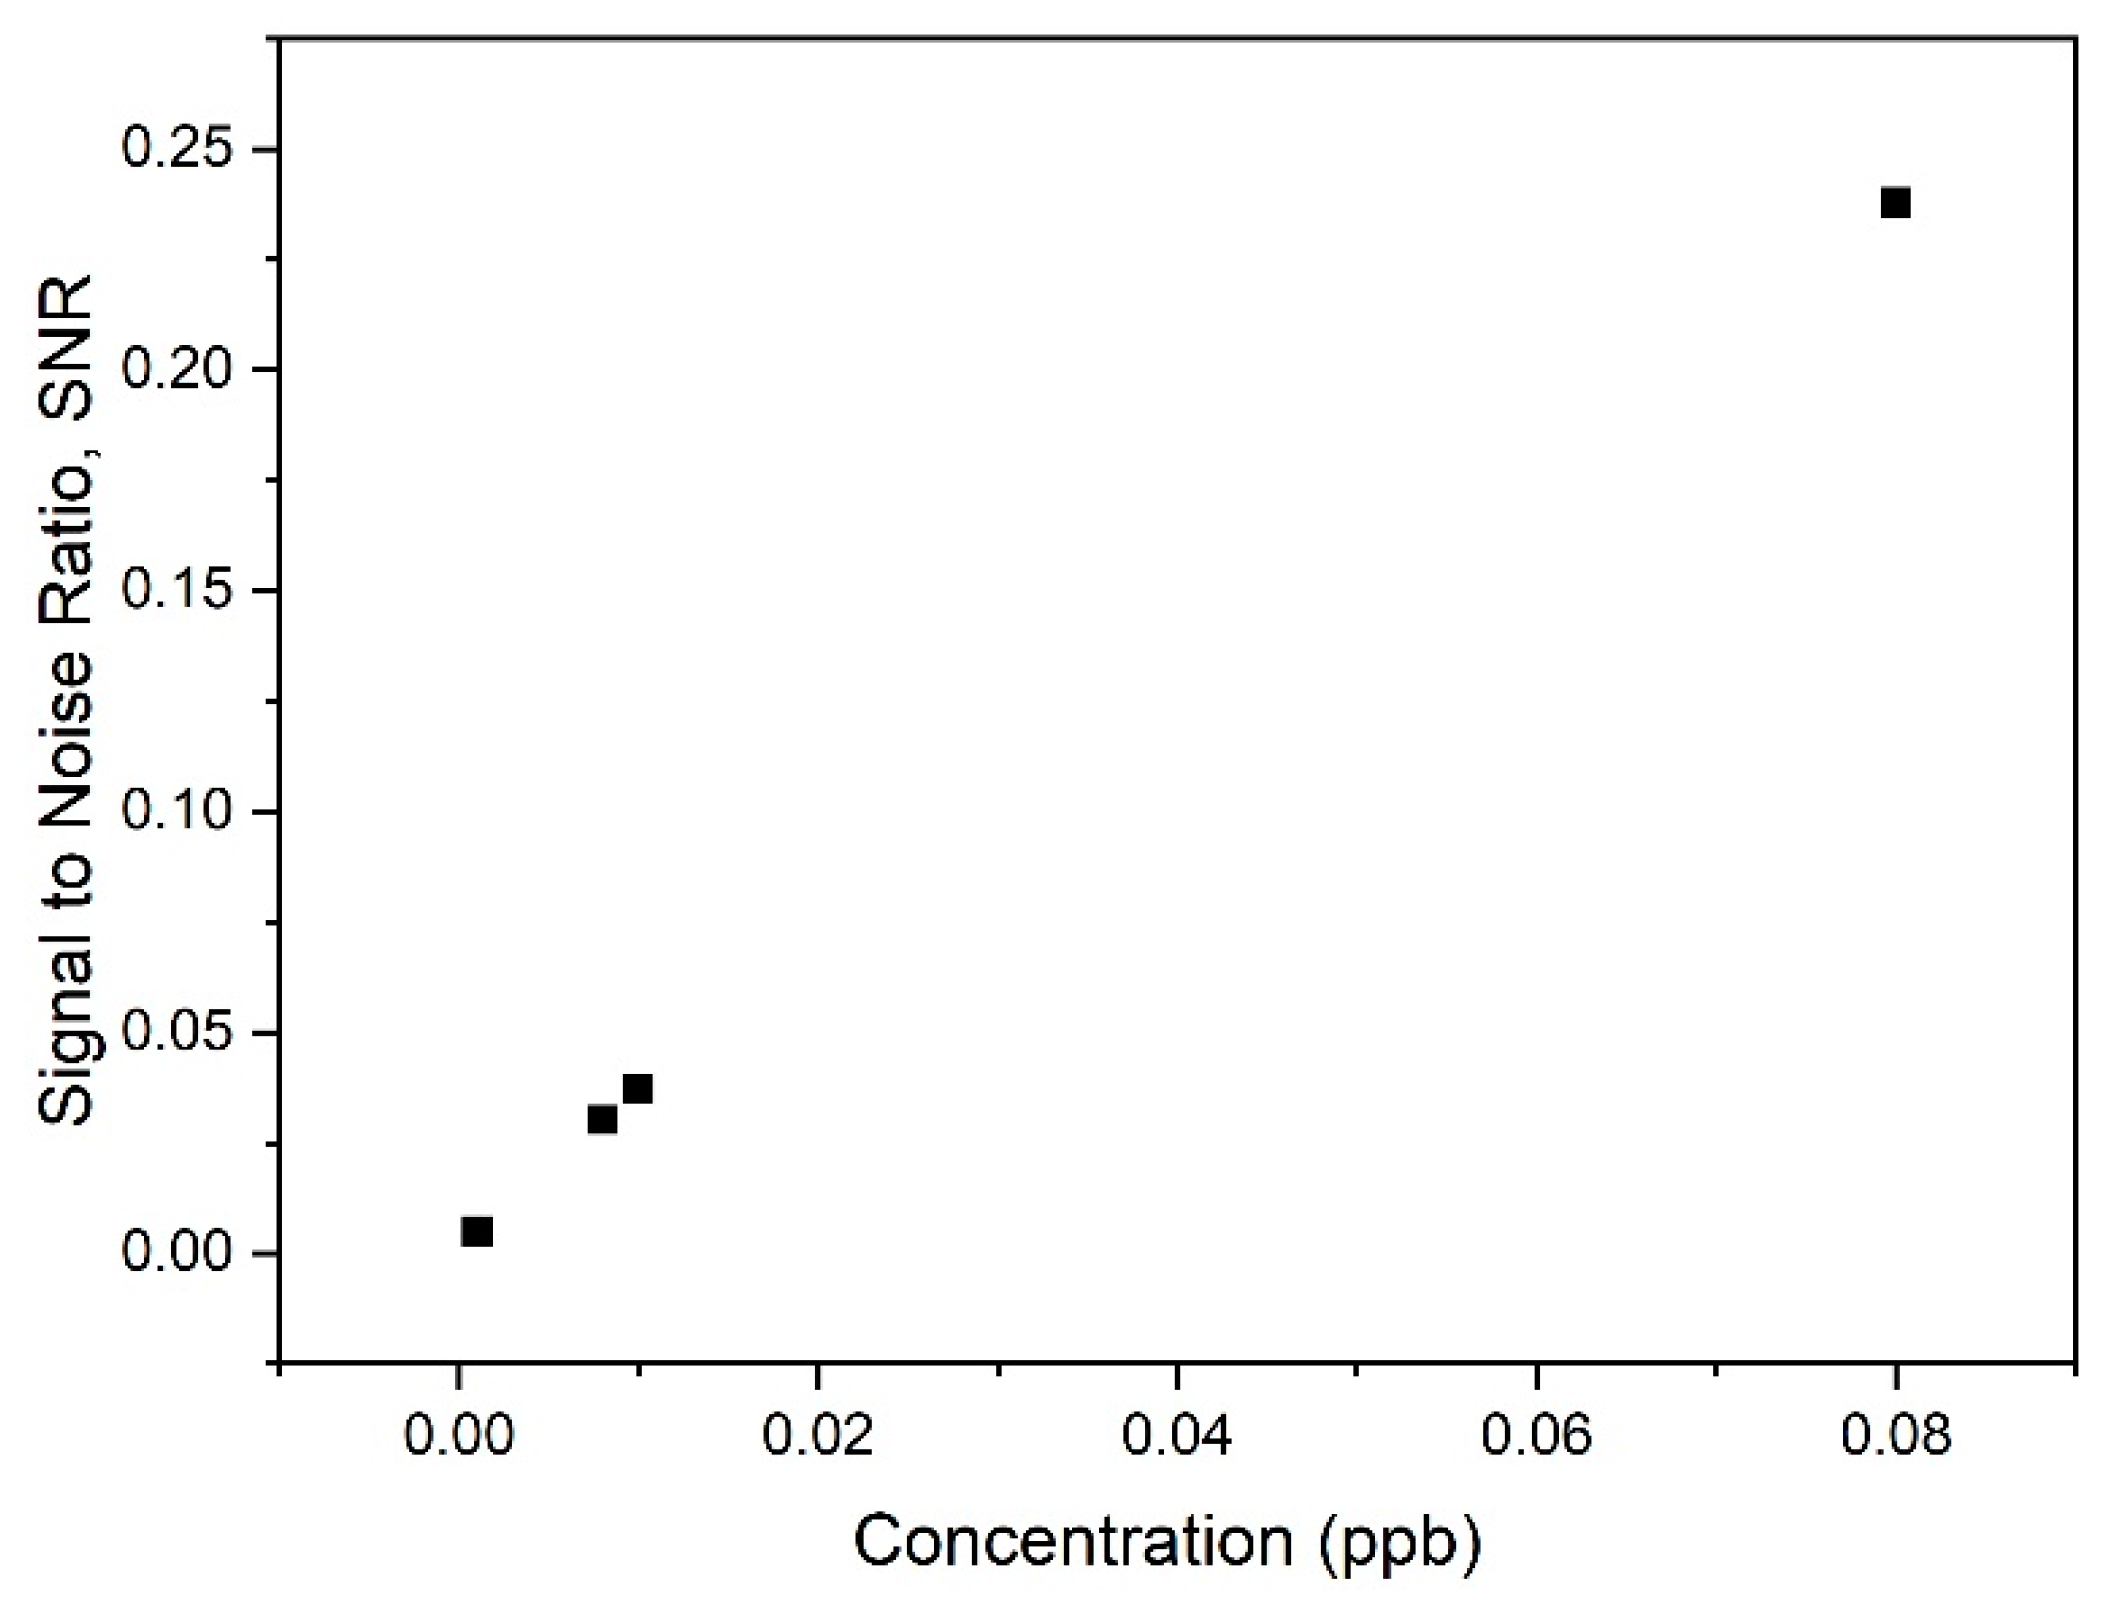
| Concentration of Carbaryl (ppb) | Full Width Half Maximum (Degree) | Detection Accuracy (Degree−1) | Signal-to-Noise-Ratio |
|---|---|---|---|
| 0.001 | 3.043 | 0.329 | 0.005 |
| 0.008 | 3.084 | 0.324 | 0.030 |
| 0.01 | 3.090 | 0.324 | 0.037 |
| 0.08 | 2.930 | 0.341 | 0.238 |
Publisher’s Note: MDPI stays neutral with regard to jurisdictional claims in published maps and institutional affiliations. |
© 2022 by the authors. Licensee MDPI, Basel, Switzerland. This article is an open access article distributed under the terms and conditions of the Creative Commons Attribution (CC BY) license (https://creativecommons.org/licenses/by/4.0/).
Share and Cite
Fauzi, N.I.M.; Fen, Y.W.; Eddin, F.B.K.; Daniyal, W.M.E.M.M. Structural and Optical Properties of Graphene Quantum Dots−Polyvinyl Alcohol Composite Thin Film and Its Potential in Plasmonic Sensing of Carbaryl. Nanomaterials 2022, 12, 4105. https://doi.org/10.3390/nano12224105
Fauzi NIM, Fen YW, Eddin FBK, Daniyal WMEMM. Structural and Optical Properties of Graphene Quantum Dots−Polyvinyl Alcohol Composite Thin Film and Its Potential in Plasmonic Sensing of Carbaryl. Nanomaterials. 2022; 12(22):4105. https://doi.org/10.3390/nano12224105
Chicago/Turabian StyleFauzi, Nurul Illya Muhamad, Yap Wing Fen, Faten Bashar Kamal Eddin, and Wan Mohd Ebtisyam Mustaqim Mohd Daniyal. 2022. "Structural and Optical Properties of Graphene Quantum Dots−Polyvinyl Alcohol Composite Thin Film and Its Potential in Plasmonic Sensing of Carbaryl" Nanomaterials 12, no. 22: 4105. https://doi.org/10.3390/nano12224105