
An Optical Modeling Framework for Coronavirus Detection Using Graphene-Based Nanosensor


Abstract
:1. Introduction
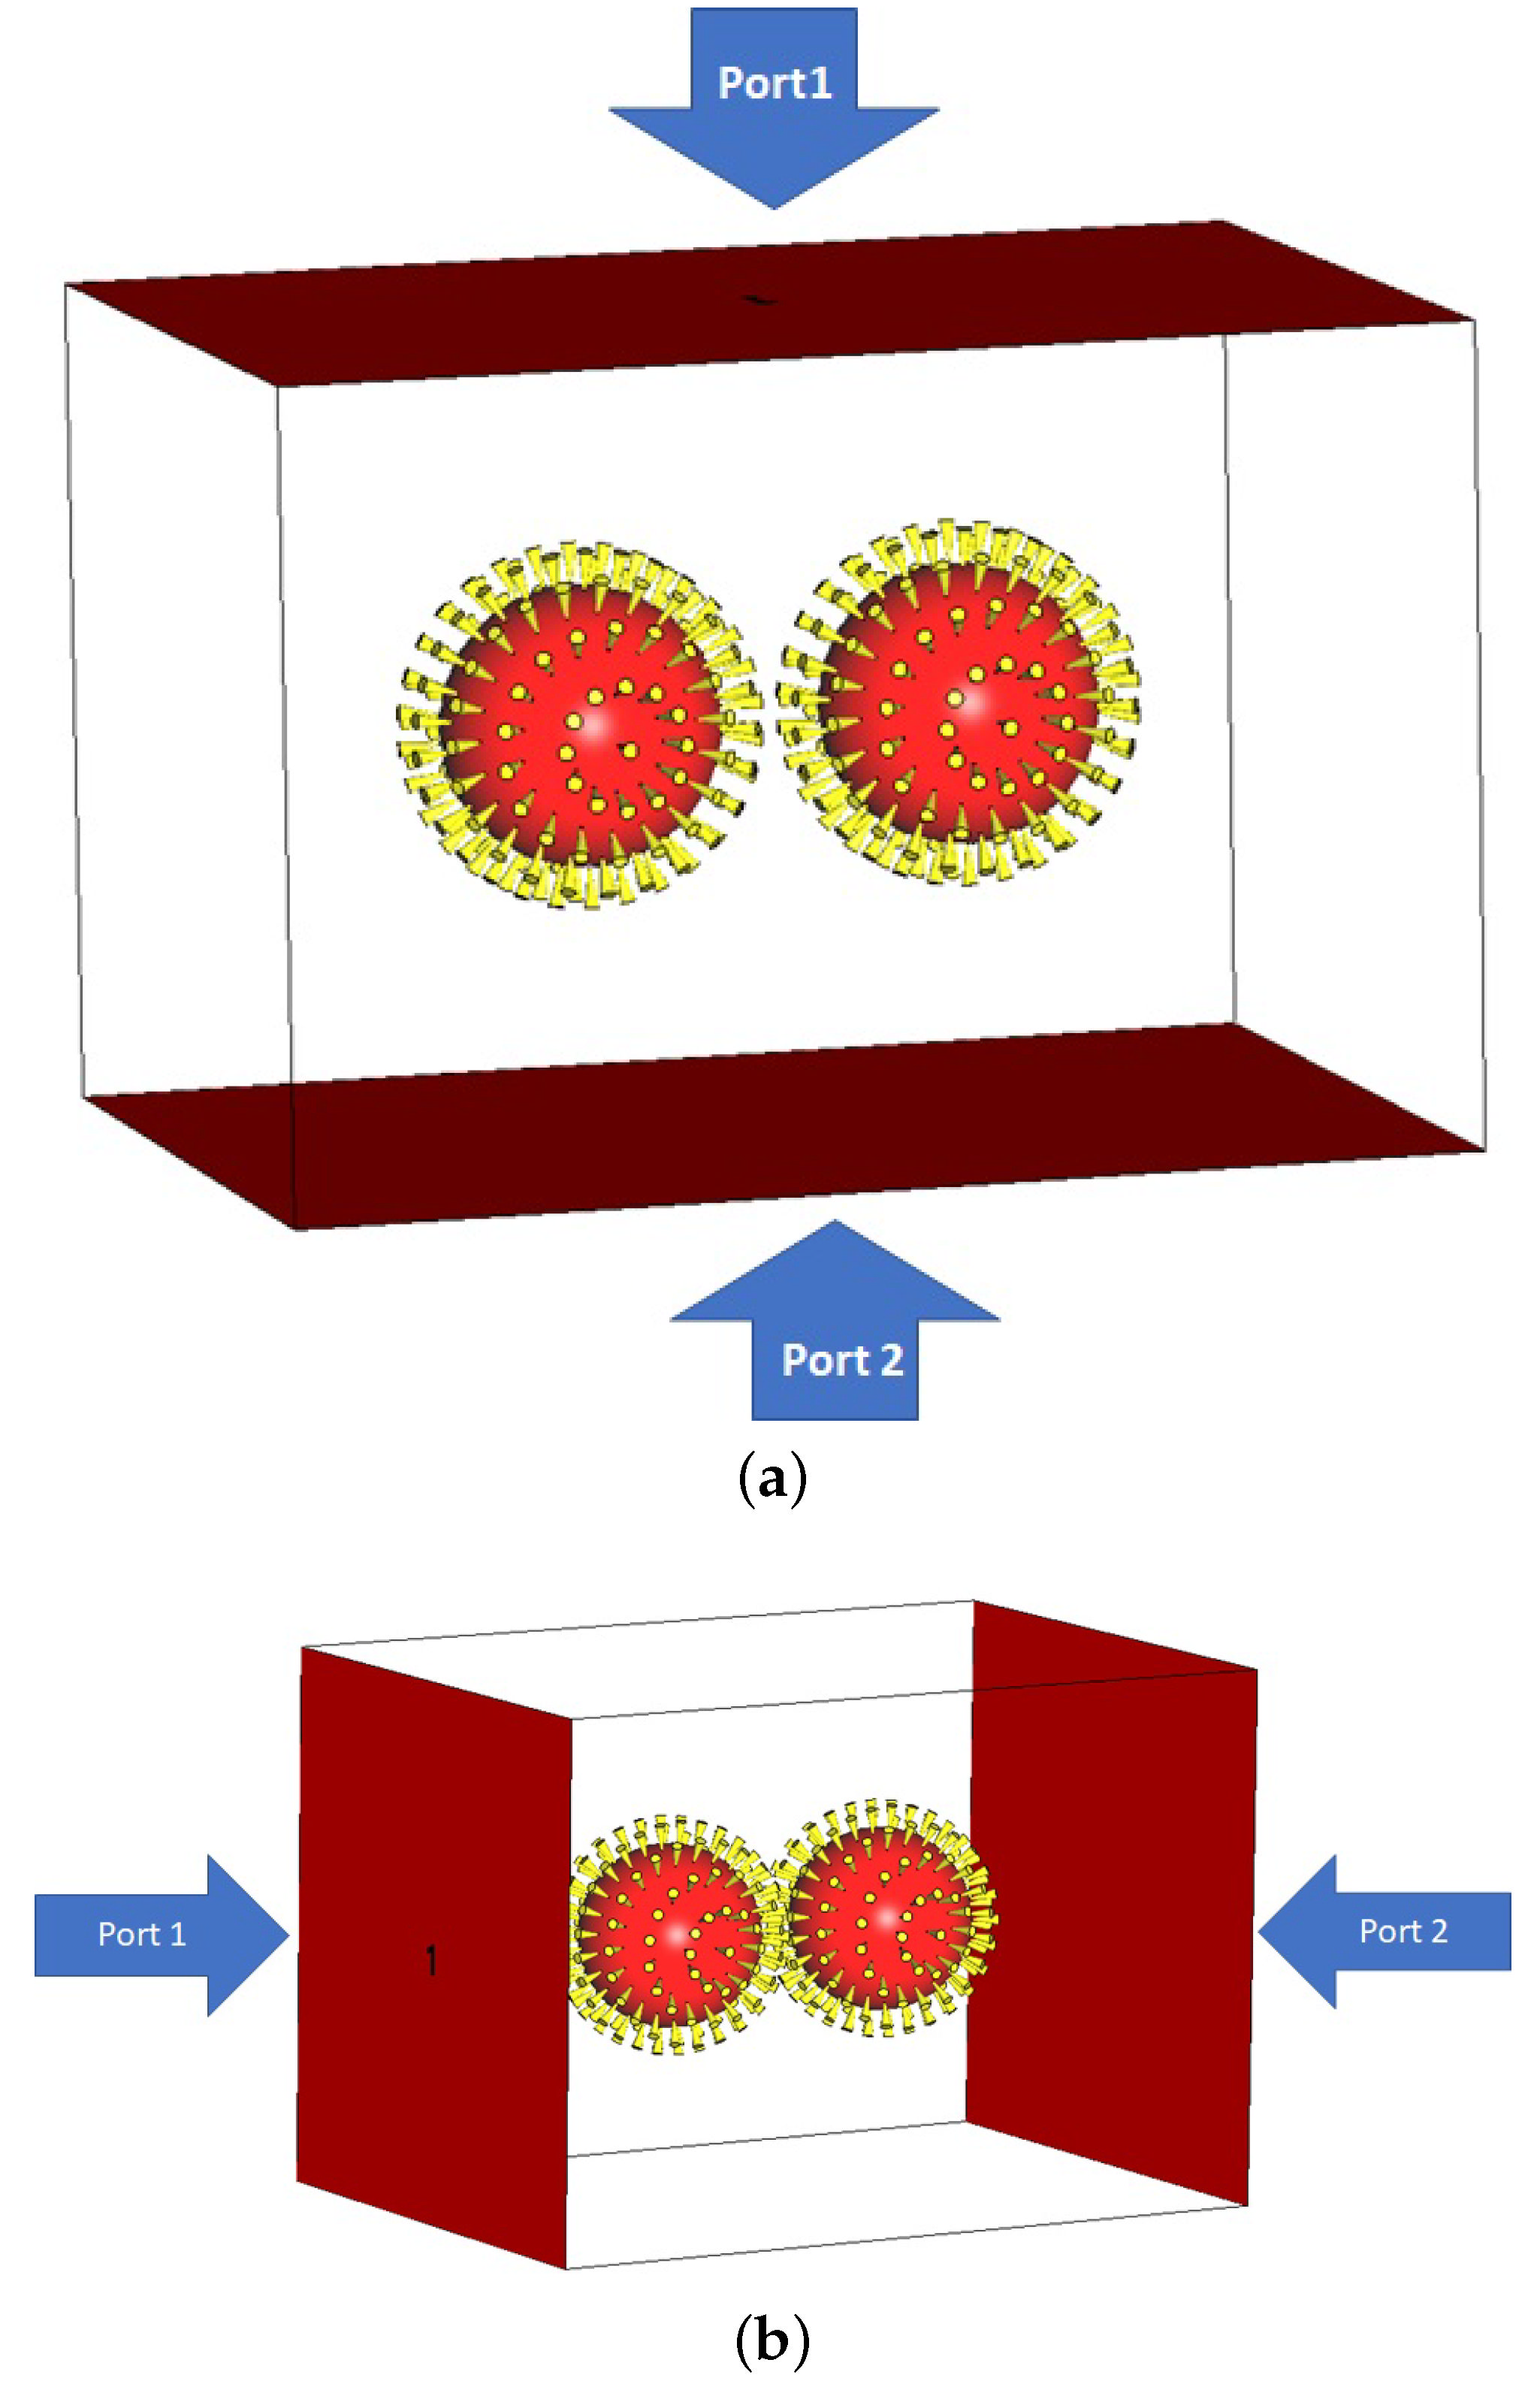
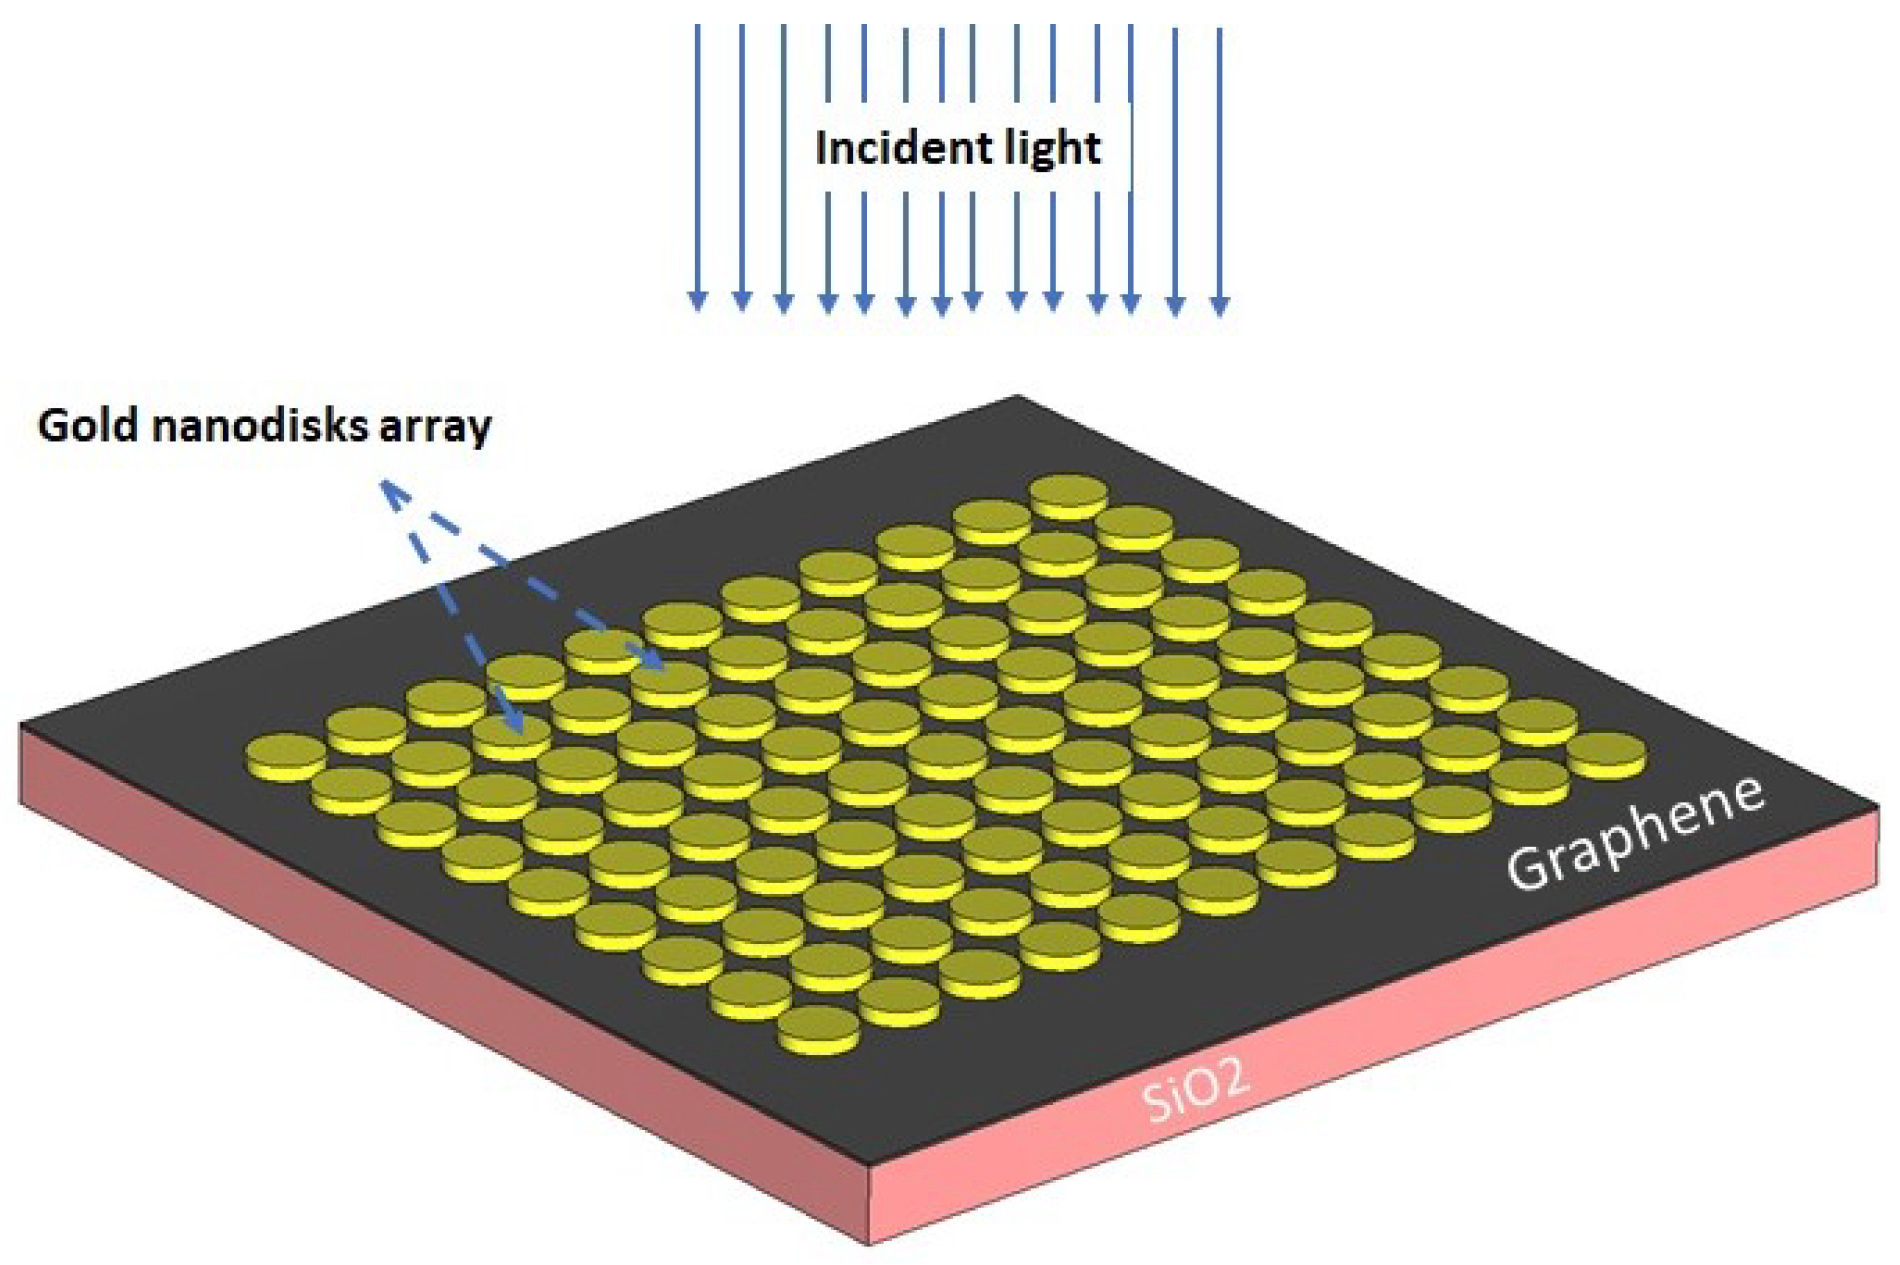
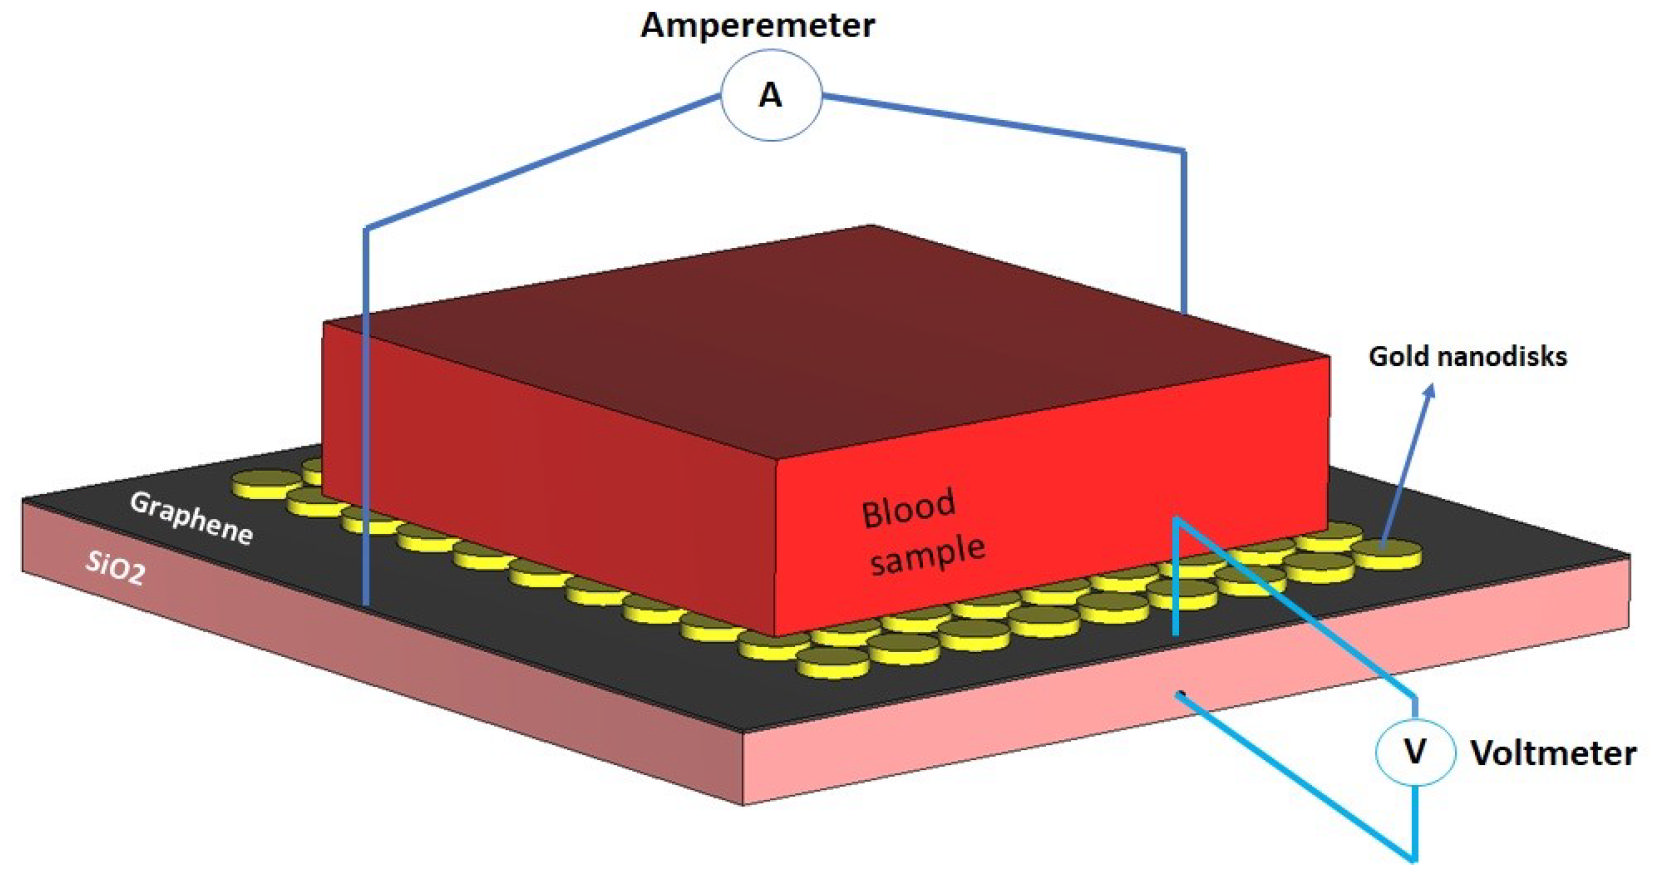
2. Model System
3. Simulation Results
3.1. Optical Modeling and Characterization of COVID-19 Particle
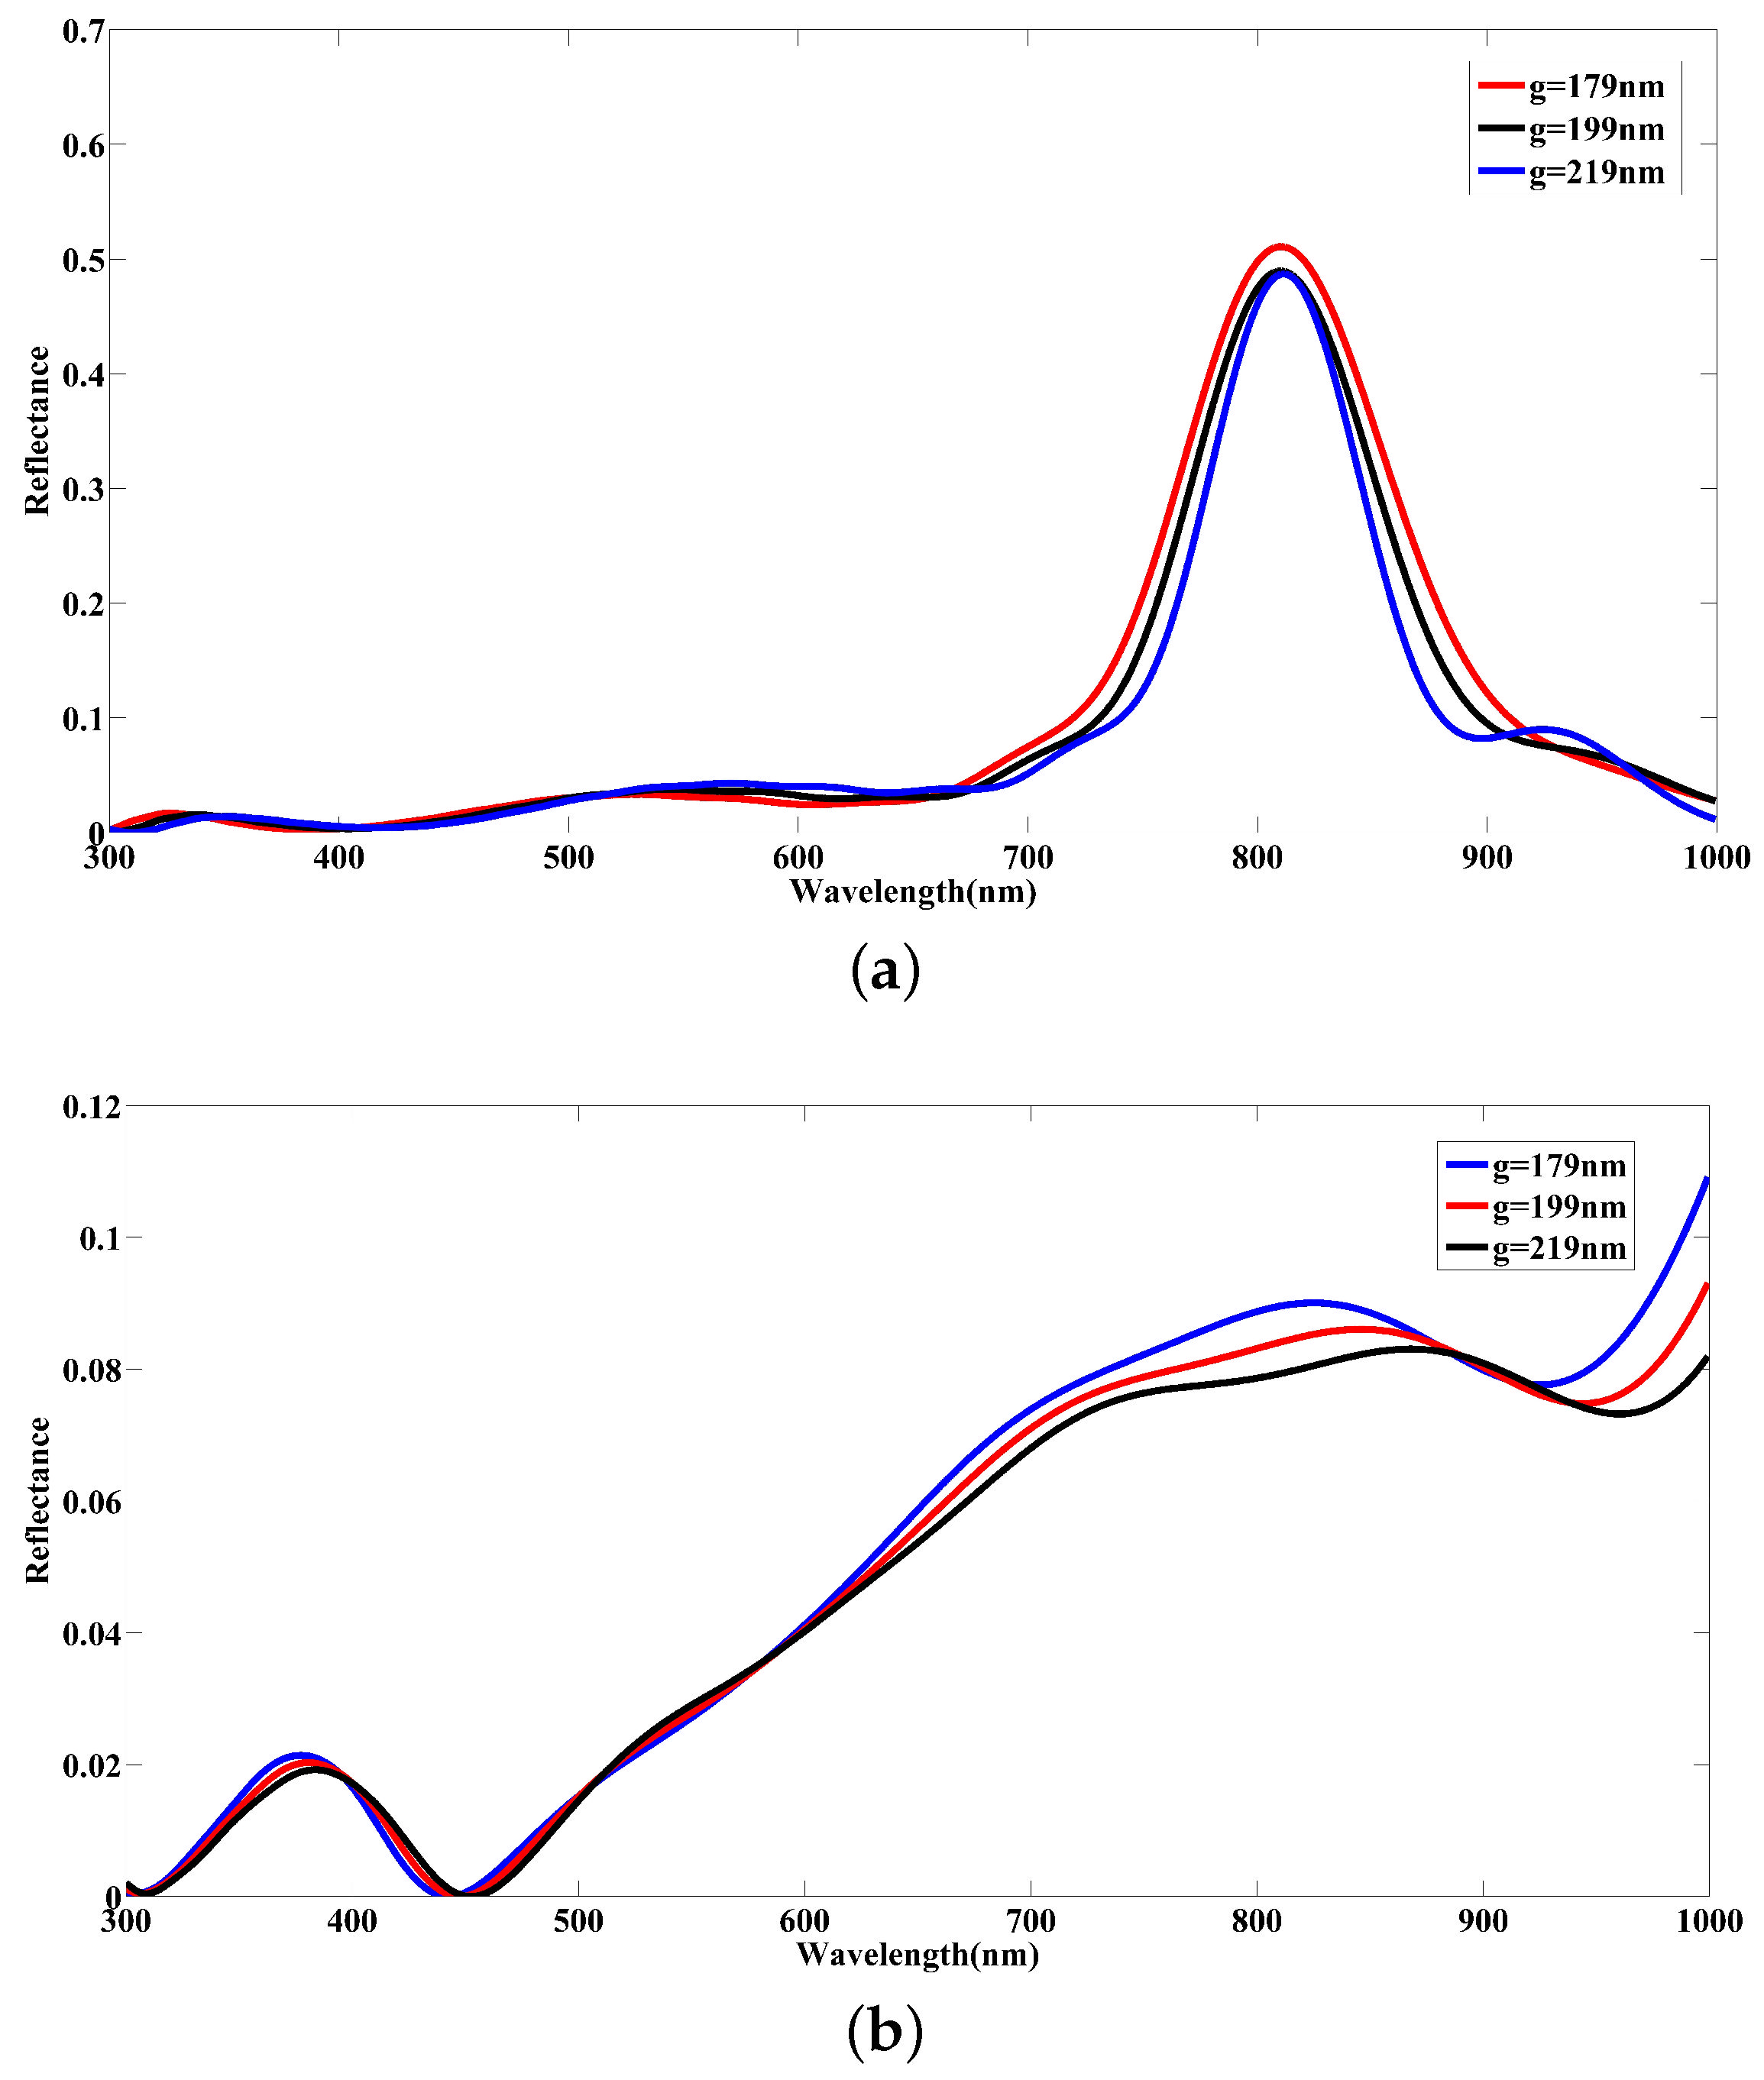
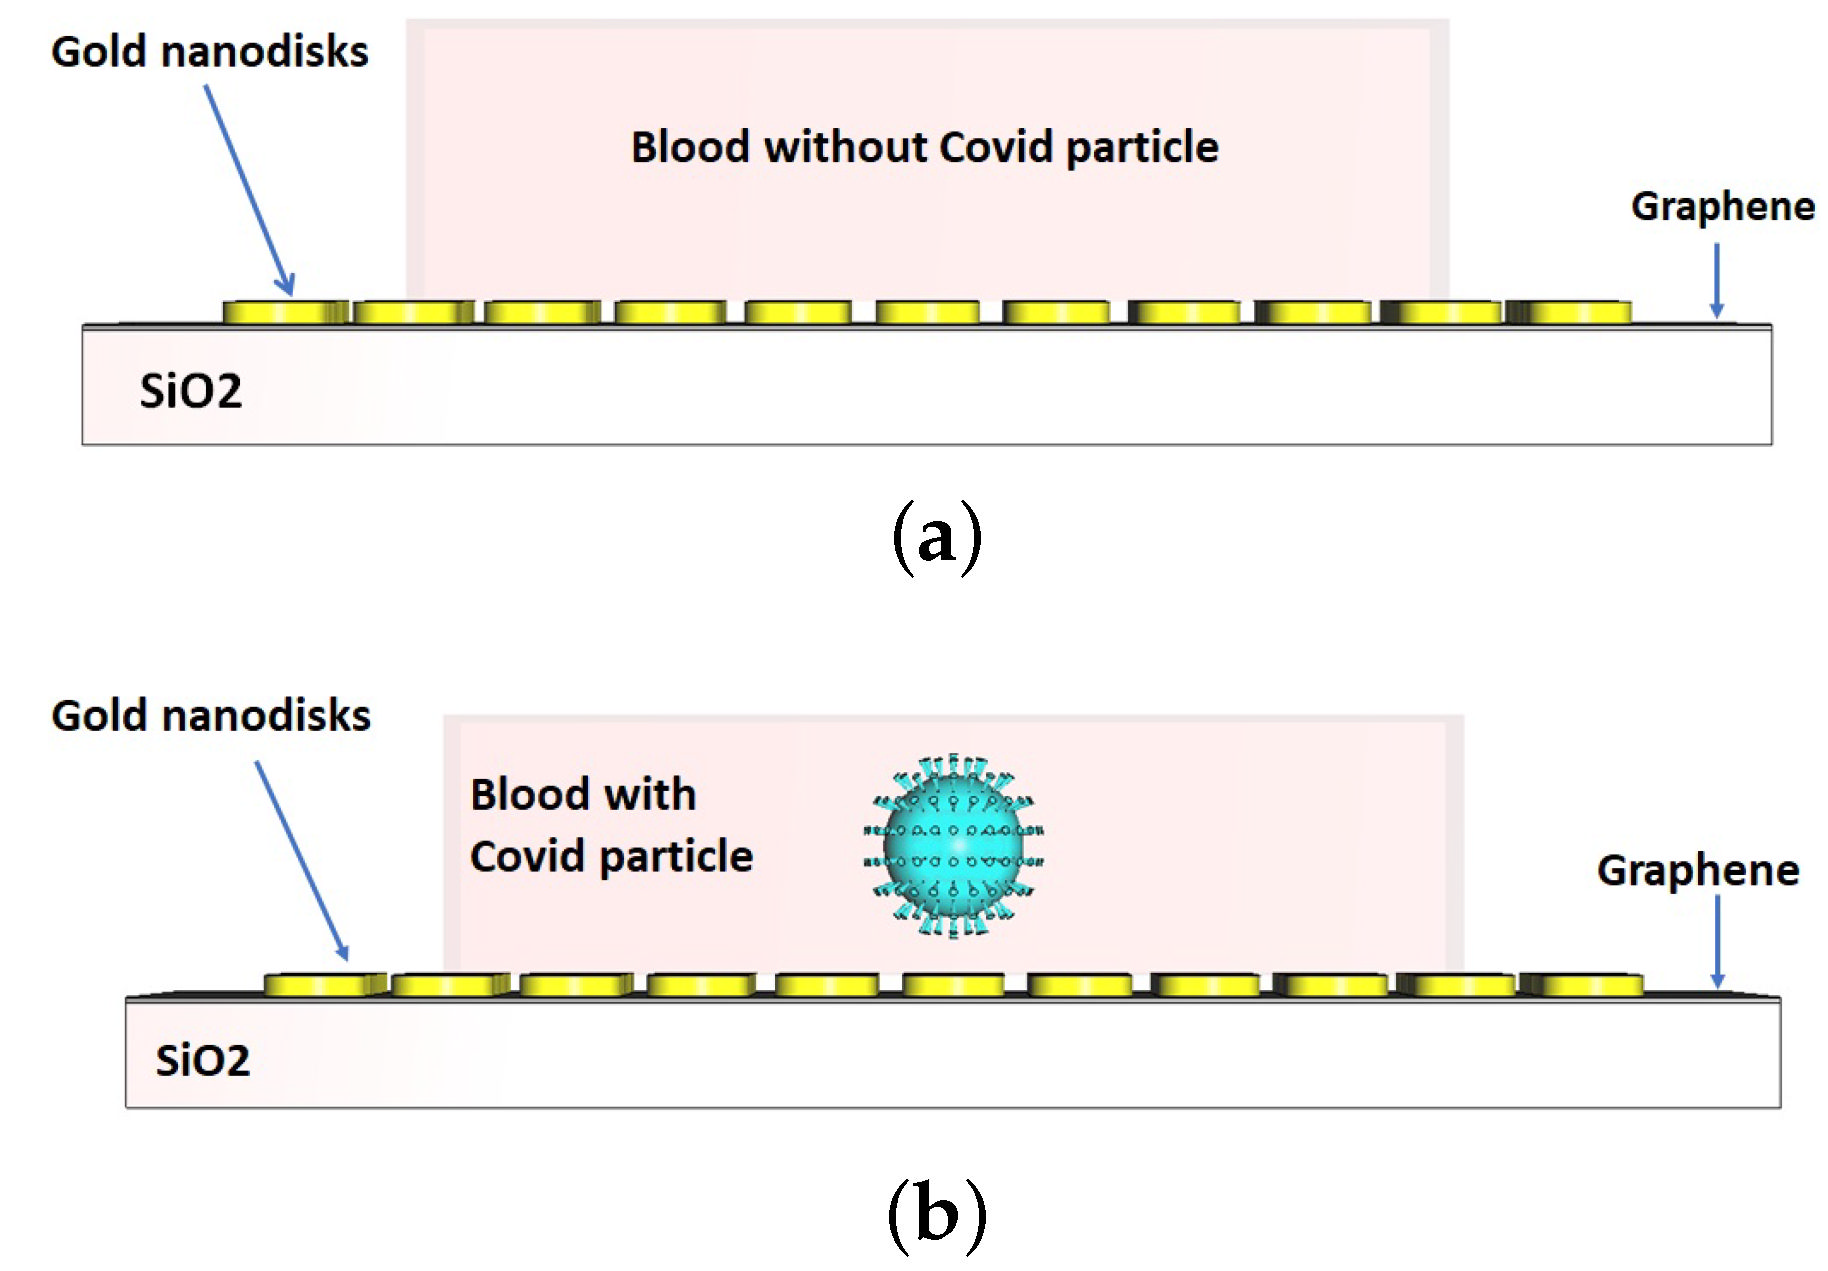
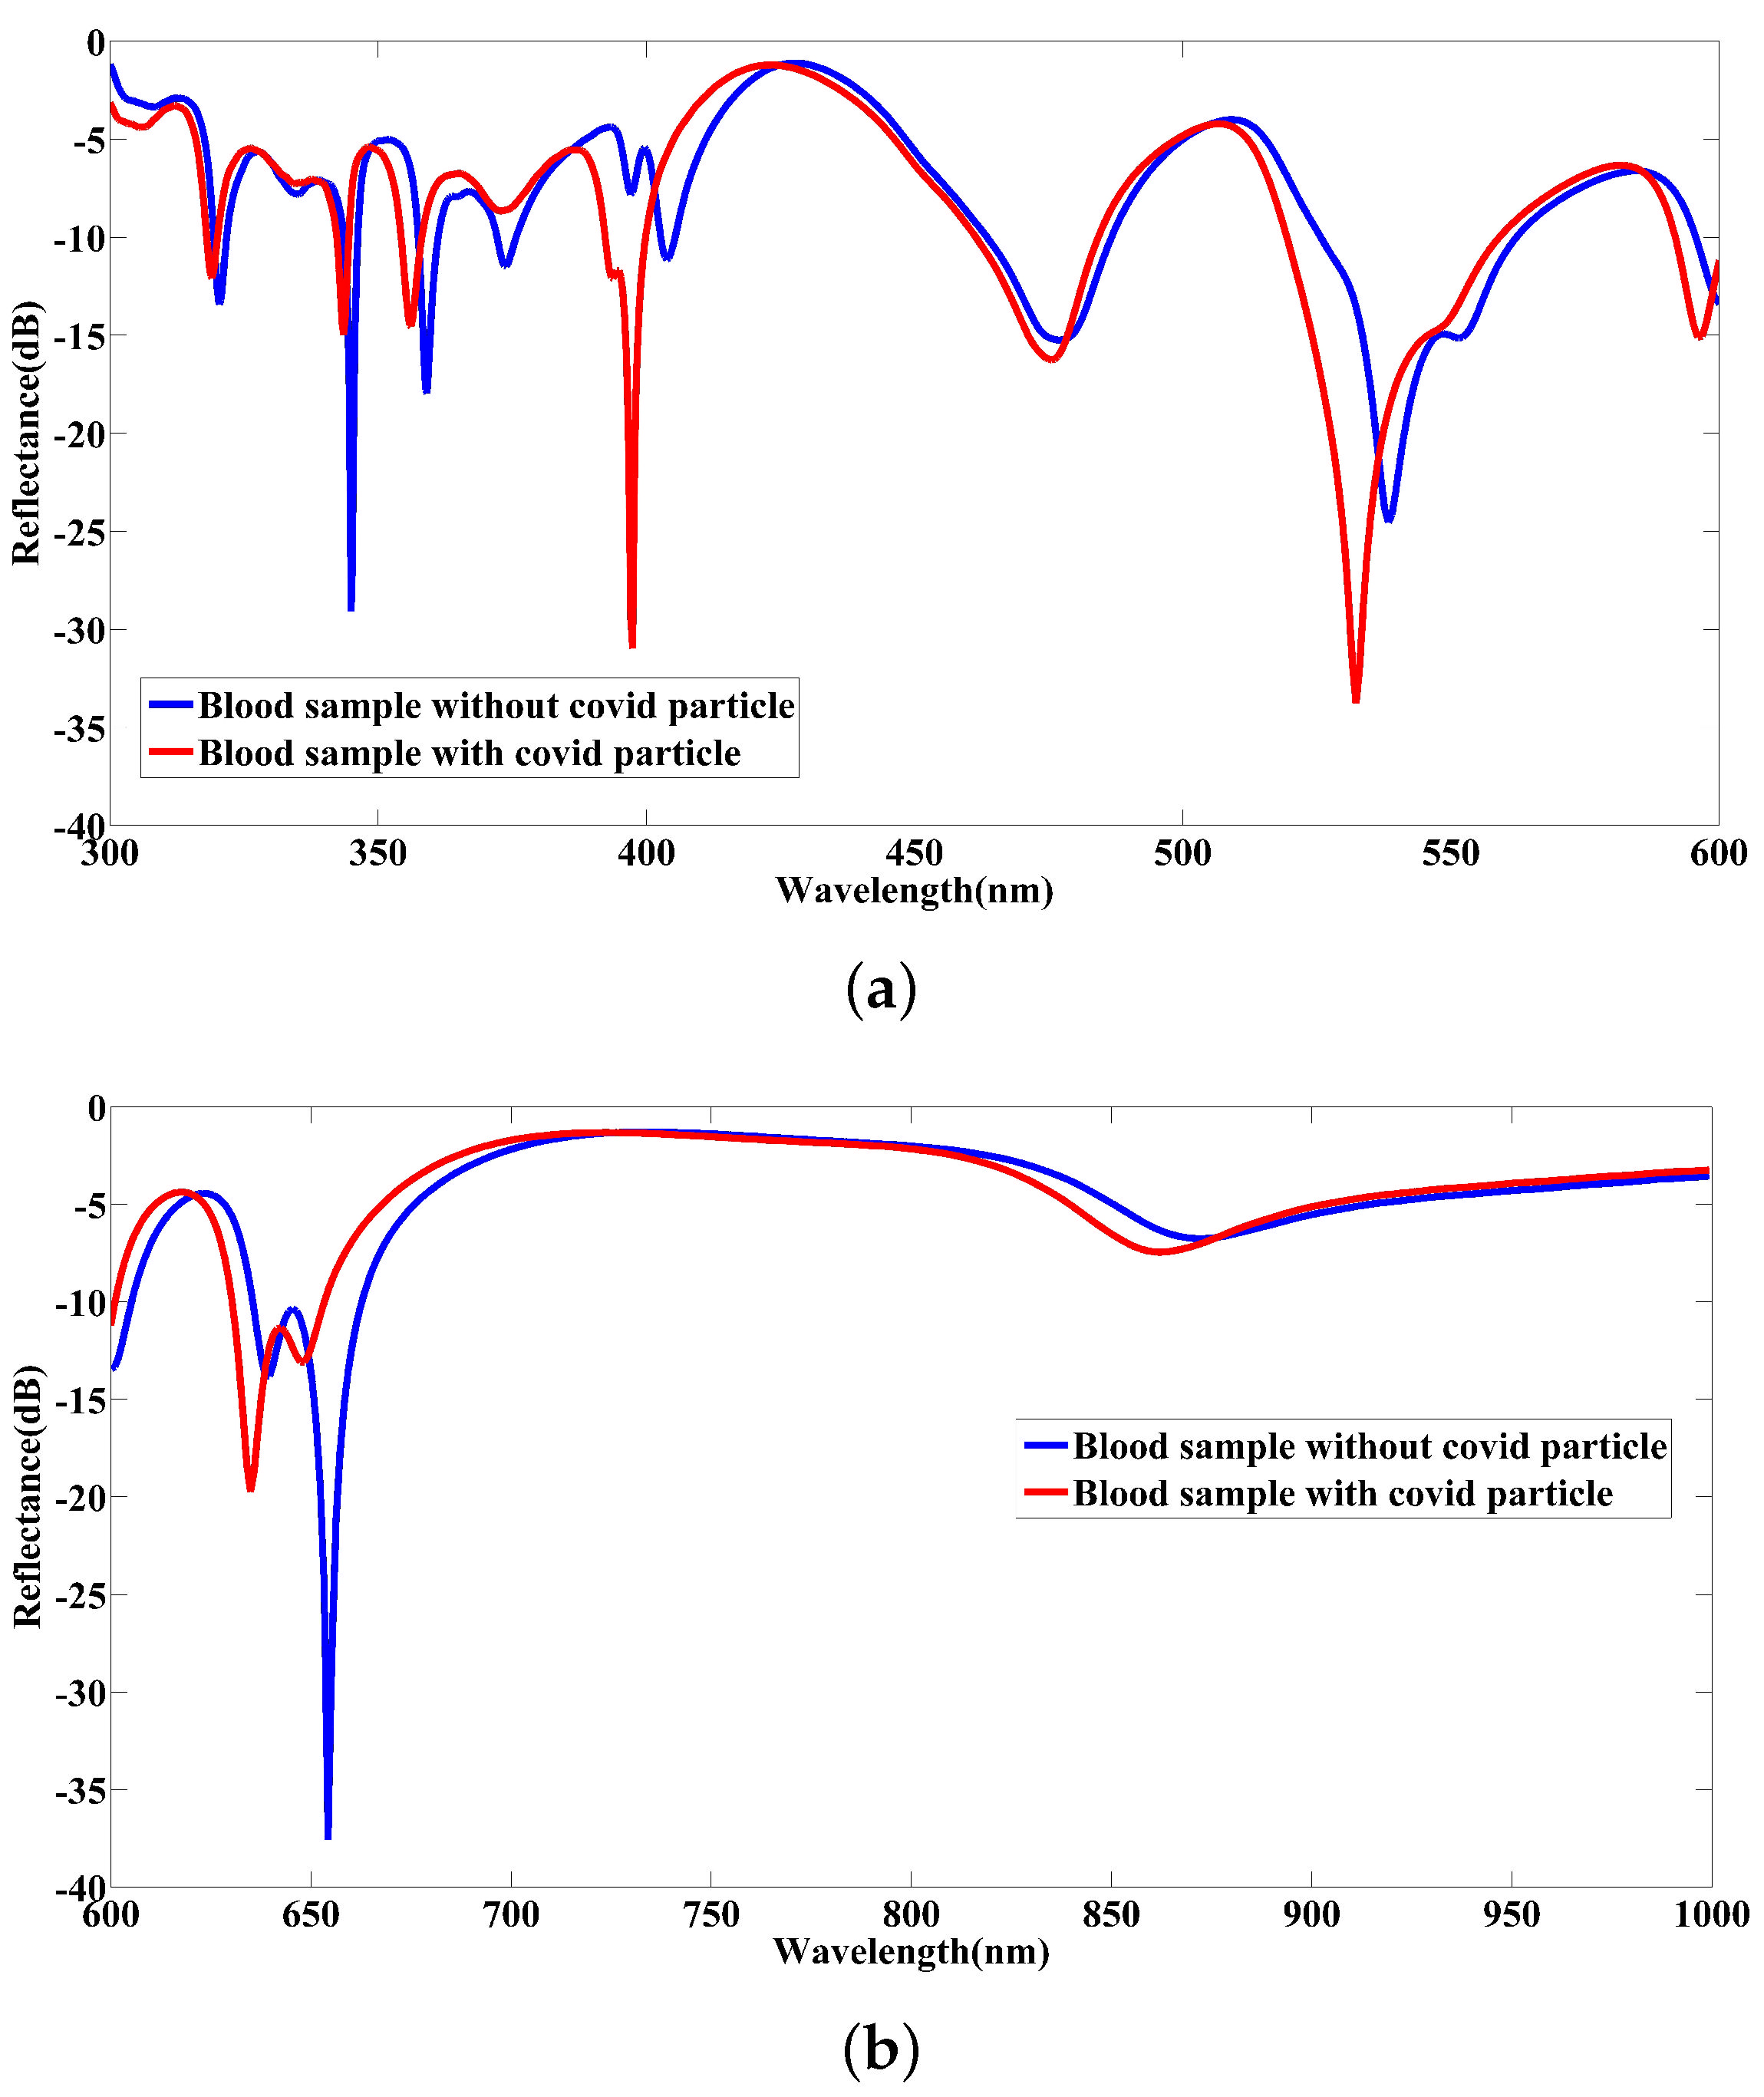
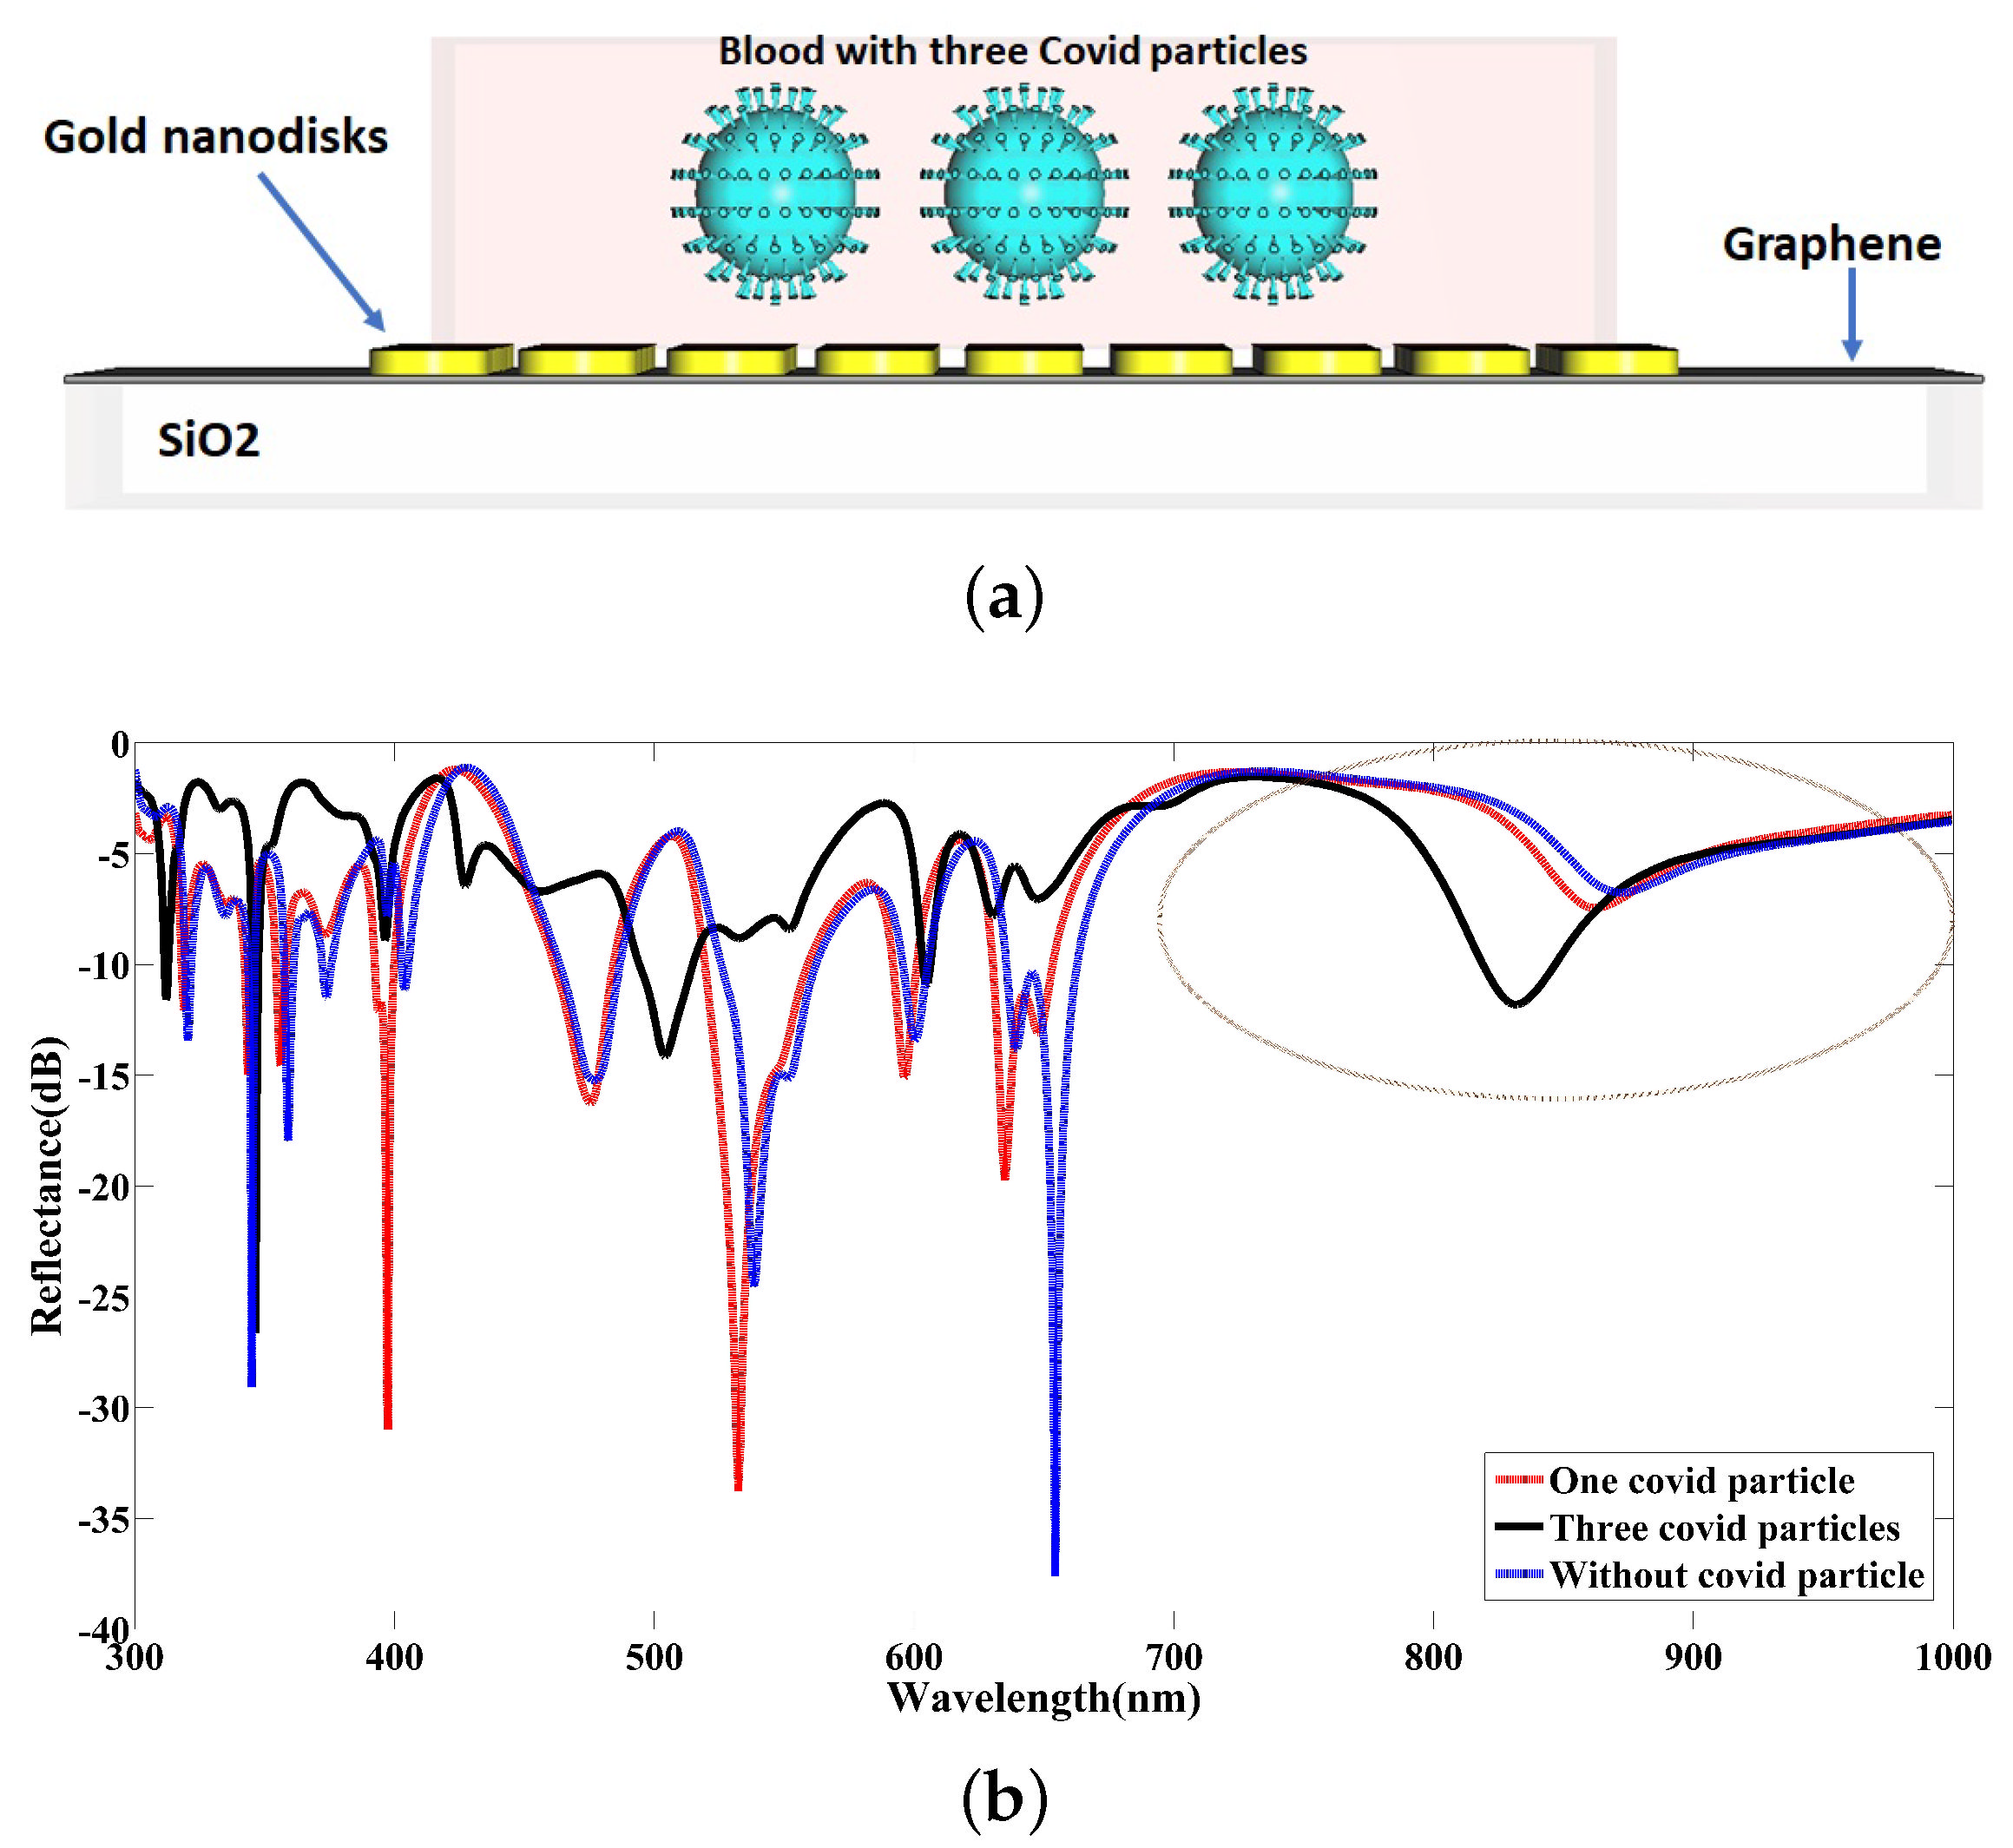
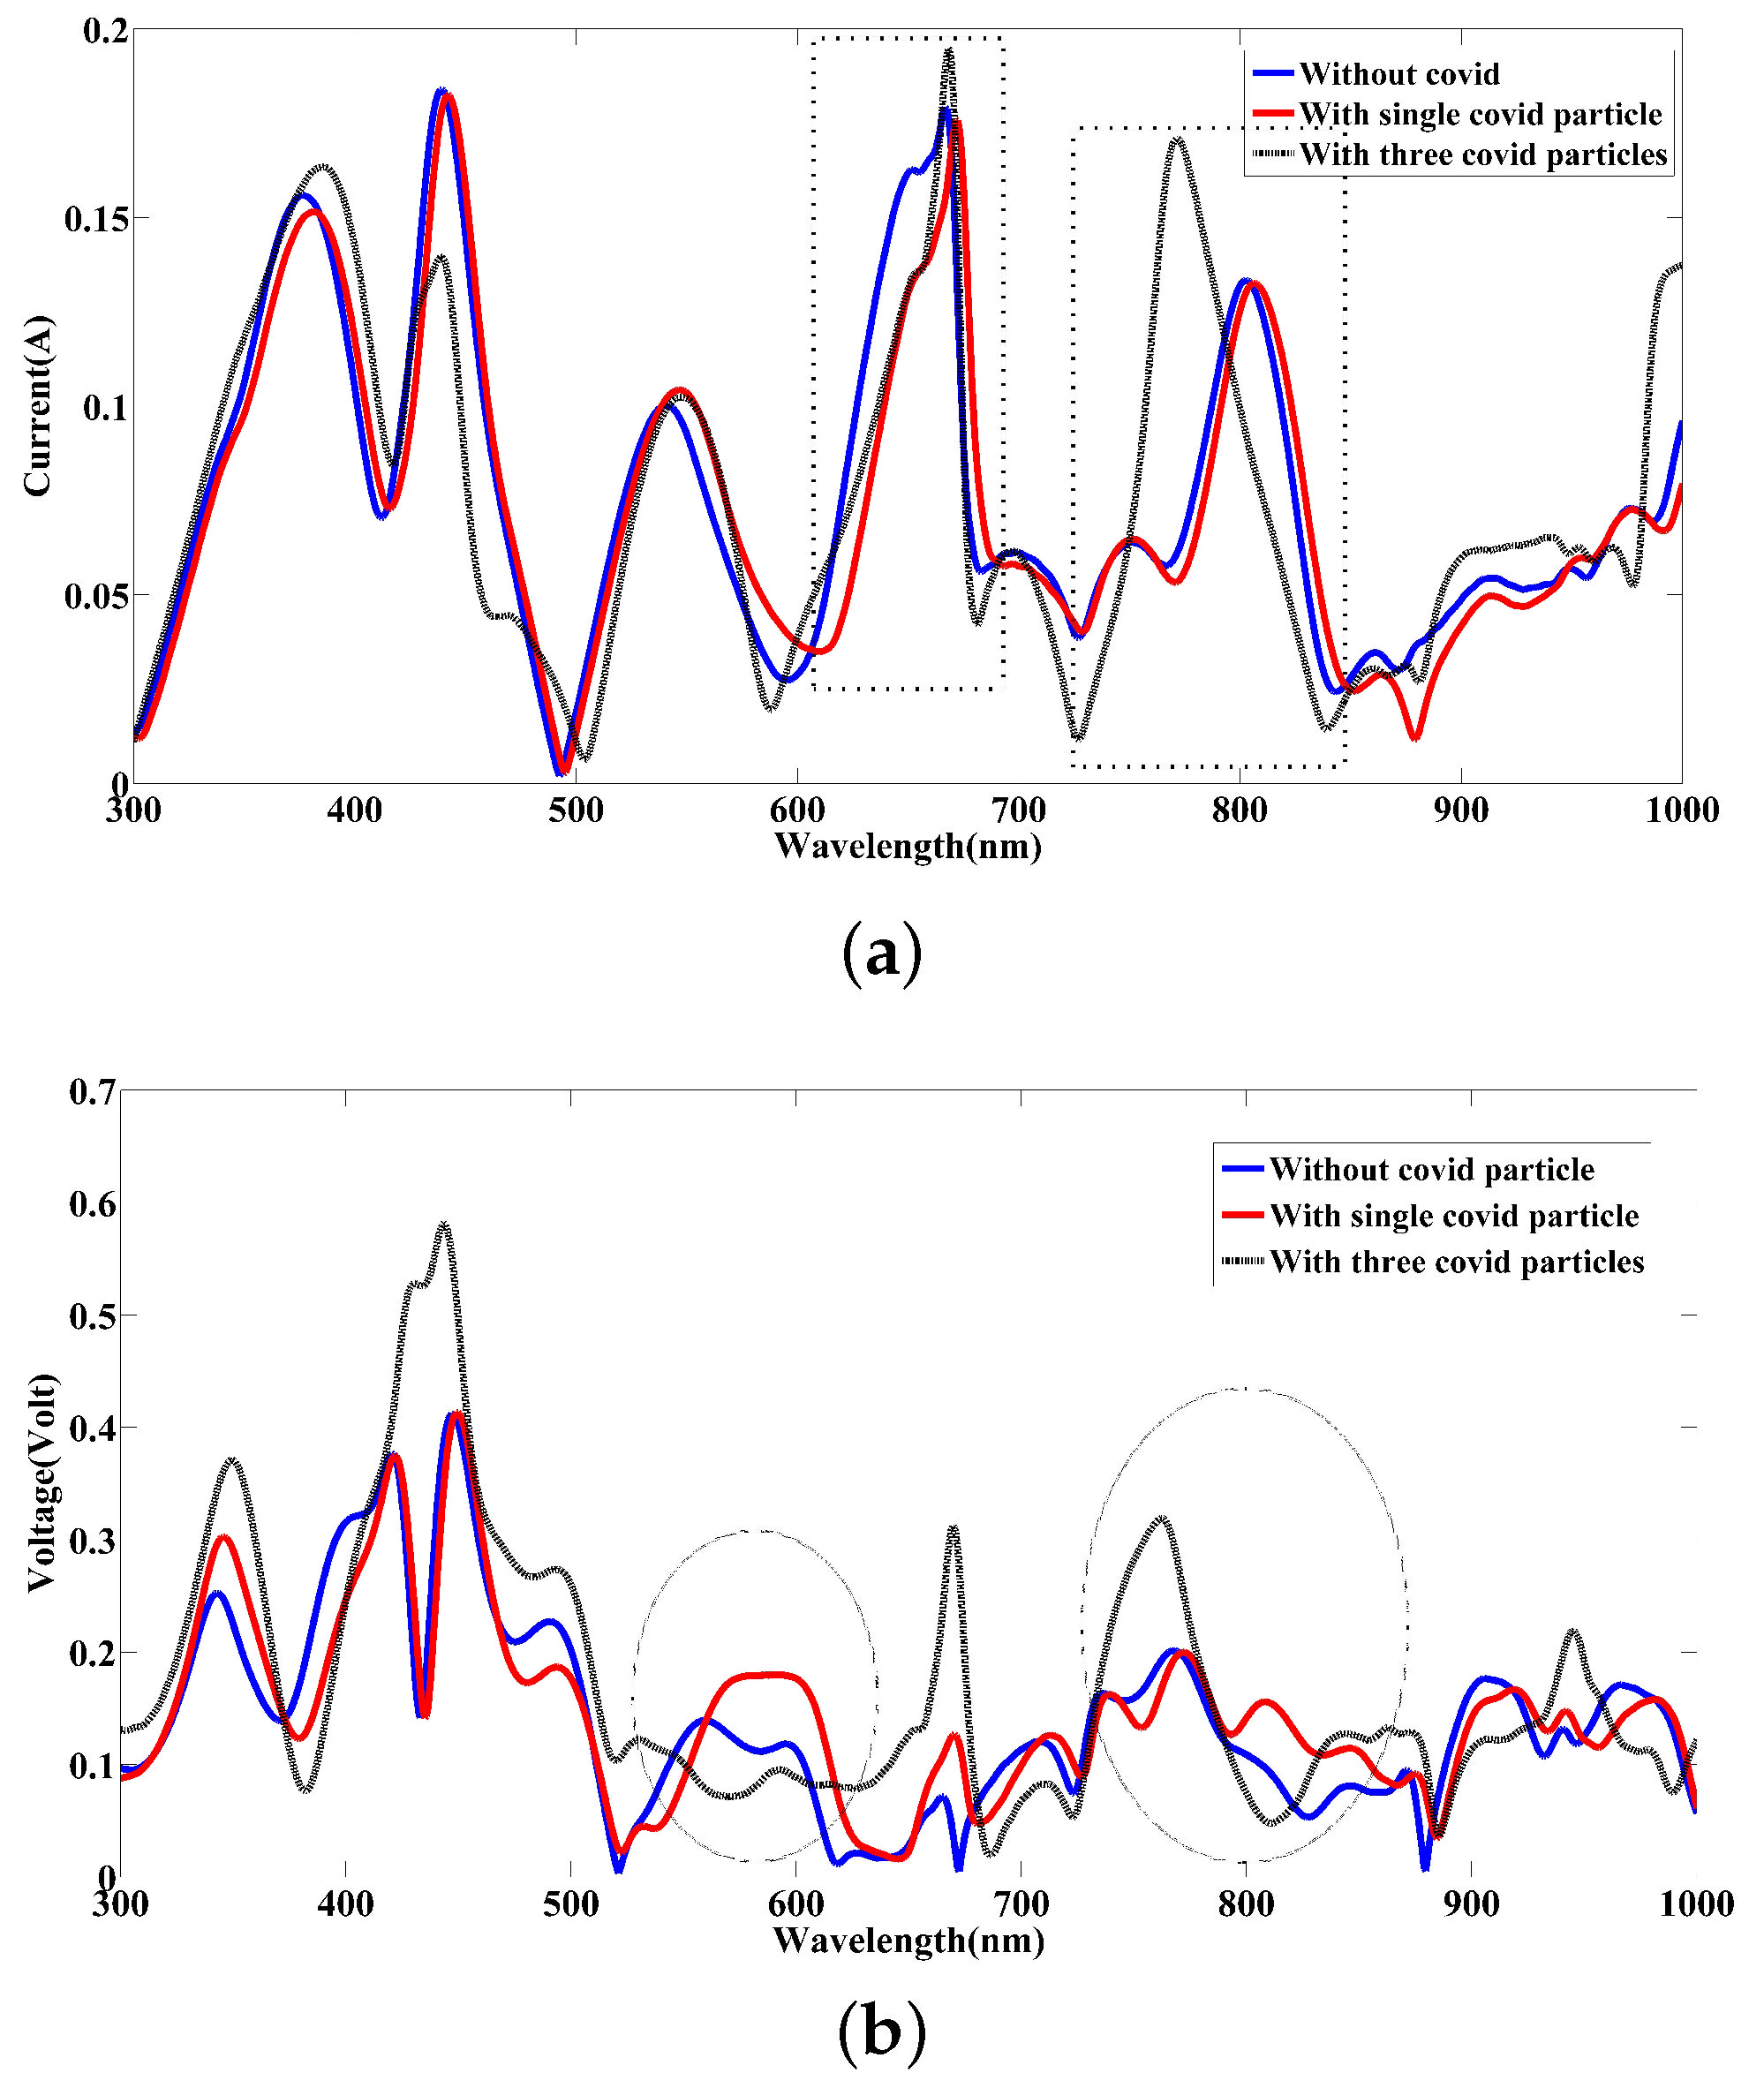
3.2. Coronavirus Detection Using Graphene-Based Nanosensor
4. Conclusions
Author Contributions
Funding
Institutional Review Board Statement
Informed Consent Statement
Data Availability Statement
Conflicts of Interest
References
- WHO. Coronavirus Disease 2019 (COVID-19): Situation Report, 52; World Health Organization: Geneva, Switzerland, 2020. [Google Scholar]
- Land, K.J.; Boeras, D.I.; Chen, X.-S.; Ramsay, A.R.; Peeling, R.W. REASSURED diagnostics to inform disease control strategies, strengthen health systems and improve patient outcomes. Nat. Microbiol. 2019, 4, 46–54. [Google Scholar] [CrossRef] [PubMed]
- Sengupta, J.; Hussain, C.M. Graphene-based field-effect transistor biosensors for the rapid detection and analysis of viruses: A perspective in view of COVID-19. Carbon Trends 2021, 2, 100011. [Google Scholar] [CrossRef]
- Yu, X.; Yang, R. COVID-19 transmission through asymptomatic carriers is a challenge to containment. Influenza Other Respir. Viruses 2020, 14, 474–475. [Google Scholar] [CrossRef] [PubMed] [Green Version]
- World Health Organization. Transmission of SARS-CoV-2: Implications for Infection Prevention Precautions: Scientific Brief; World Health Organization: Geneva, Switzerland, 2020. [Google Scholar]
- Hassan, M.; Sium, F.; Islam, F.; Choudhury, S. A review on plasmonic nano-biosensors for virus detection with a focus on coronavirus. Sens.-Bio-Sens. Res. 2021, 33, 100429. [Google Scholar]
- Esbin, M.N.; Whitney, O.N.; Chong, S.; Maurer, A.; Darzacq, X.; Tjian, R. Overcoming the bottleneck to widespread testing: A rapid review of nucleic acid testing approaches for COVID-19 detection. RNA 2020, 26, 771–783. [Google Scholar] [CrossRef] [PubMed]
- Bastos, M.L.; Tavaziva, G.; Abidi, S.K.; Campbell, J.R.; Haraoui, L.-P.; Johnston, J.C.; Lan, Z.; Law, S.; MacLean, E.; Trajman, A. Diagnostic accuracy of serological tests for COVID-19: Systematic review and meta-analysis. BMJ 2020, 370, m2516. [Google Scholar]
- Pinals, R.L.; Ledesma, F.; Yang, D.; Navarro, N.; Jeong, S.; Pak, J.E.; Kuo, L.; Chuang, Y.-C.; Cheng, Y.-W.; Sun, H.-Y. Rapid SARS-CoV-2 spike protein detection by carbon nanotube-based nearinfrared nanosensors. Nano Lett. 2021, 21, 2272–2280. [Google Scholar] [CrossRef] [PubMed]
- Sharma, S.; Saini, S.; Khangembam, M.; Singh, V. Nanomaterials-based biosensors for COVID-19 detection—A review. IEEE Sensors J. 2020, 21, 5598–5611. [Google Scholar] [CrossRef]
- Alhalaili, B.; Popescu, I.N.; Kamoun, O.; Alzubi, F.; Alawadhia, S.; Vidu, R. Nanobiosensors for the detection of novel coronavirus 2019-nCoV and other pandemic/epidemic respiratory viruses: A review. Sensors 2020, 20, 6591. [Google Scholar] [CrossRef]
- Seo, G.; Lee, G.; Kim, M.J.; Baek, S.-H.; Choi, M.; Ku, K.B.; Lee, C.-S.; Jun, S.; Park, D.; Kim, H.G. Rapid detection of COVID-19 causative virus (SARS-CoV-2) in human nasopharyngeal swab specimens using field-effect transistor-based biosensor. ACS Nano 2020, 14, 5135–5142. [Google Scholar] [CrossRef] [Green Version]
- Late, D.J.; Bhat, A.; Rout, C.S. Fundamentals and properties of 2D materials in general and sensing applications. In Fundamentals and Sensing Applications of 2D Materials; Elsevier: Amsterdam, The Netherlands, 2019; pp. 5–24. [Google Scholar]
- Morgan, H.; Rout, C.S.; Late, D.J. Future prospects of 2D materials for sensing applications. In Fundamentals and Sensing Applications of 2D Materials; Woodhead Publishing: Cambridge, UK, 2019; pp. 481–482. [Google Scholar]
- Cai, L.; Zhang, Z.; Xiao, H.; Chen, S.; Fu, J. An eco-friendly imprinted polymer based on graphene quantum dots for fluorescent detection of p-nitroaniline. RSC Adv. 2019, 9, 41383–41391. [Google Scholar] [CrossRef] [PubMed] [Green Version]
- Tang, N.; Li, Y.; Chen, F.; Han, Z. In situ fabrication of a direct Z-scheme photocatalyst by immobilizing CdS quantum dots in the channels of graphene-hybridized and supported mesoporous titanium nanocrystals for high photocatalytic performance under visible light. RSC Adv. 2018, 8, 42233–42245. [Google Scholar] [CrossRef] [PubMed] [Green Version]
- Long, F.; Zhang, Z.; Wang, J.; Yan, L.; Zhou, B. Cobalt-nickel bimetallic nanoparticles decorated graphene sensitized imprinted electrochemical sensor for determination of octylphenol. Electrochim. Acta 2015, 168, 337–345. [Google Scholar] [CrossRef]
- Zhang, Z.; Cai, R.; Long, F.; Wang, J. Development and application of tetrabromobisphenol A imprinted electrochemical sensor based on graphene/carbon nanotubes three-dimensional nanocomposites modified carbon electrode. Talanta 2015, 134, 435–442. [Google Scholar] [CrossRef]
- Chen, H.; Chen, Z.; Yang, H.; Wen, L.; Yi, Z.; Zhou, Z.; Dai, B.; Zhang, J.; Wu, X.; Wu, P. Multi-mode surface plasmon resonance absorber based on dart-type single-layer graphene. RSC Adv. 2022, 12, 7821–7829. [Google Scholar] [CrossRef]
- Georgakilas, V.; Otyepka, M.; Bourlinos, A.B.; Chandra, V.; Kim, N.; Kemp, K.C.; Hobza, P.; Zboril, R.; Kim, K.S. Functionalization of Graphene: Covalent and Non-Covalent Approaches, Derivatives and Applications. Chem. Rev. 2012, 112, 6156–6214. [Google Scholar] [CrossRef]
- Lee, C.; Wei, X.; Kysar, J.W.; Hone, J. Measurement of the elastic properties and intrinsic strength of monolayer graphene. Science 2008, 321, 385–388. [Google Scholar] [CrossRef]
- Pourmadadi, M.; Yazdian, F.; Hojjati, S.; Khosravi-Darani, K. Detection of microorganisms using graphene-based nanobiosensors. Food Technol. Biotechnol. 2021, 59, 496–506. [Google Scholar] [CrossRef]
- Korsman, S.N.J.; van Zyl, G.U.; Nutt, L.; Andersson, M.I.; Preiser, W. Human coronaviruses. In Virology; Korsman, S.N.J., van Zyl, G.U., Nutt, L., Andersson, M.I., Preiser, W., Eds.; Churchill Livingstone: Edinburgh, UK, 2012; pp. 94–95. [Google Scholar]
- Petrov, D. Photopolarimetrical properties of coronavirus model particles: Spike proteins number influence. J. Quant. Spectrosc. Radiat. Transf. 2020, 248, 107005. [Google Scholar] [CrossRef]
- Serra, N.; Di Carlo, P.; Rea, T.; Sergi, C.M. Diffusion modeling of COVID-19 under lockdown. Phys. Fluids 2021, 33, 041903. [Google Scholar] [CrossRef]
- Peiris, J.S.; Guan, Y.; Yuen, K. Severe acute respiratory syndrome. Nat. Med. 2004, 10, S88–S97. [Google Scholar] [CrossRef] [PubMed]
- Antiochia, R. Nanobiosensors as new diagnostic tools for SARS, MERS and COVID-19: From past to perspectives. Microchim. Acta 2020, 187, 1–13. [Google Scholar] [CrossRef] [PubMed]
- Bustin, S.A. Real-time, fluorescence-based quantitative PCR: A snapshot of current procedures and preferences. Expert Rev. Mol. Diagn. 2005, 5, 493–498. [Google Scholar] [CrossRef] [PubMed]
- Rajendran, D.K.; Rajagopal, V.; Alagumanian, S.; Santhosh Kumar, T.; Sathiya Prabhakaran, S.P.; Kasilingam, D. Systematic literature review on novel corona virus SARS-CoV-2: A threat to human era. Virus Dis. 2020, 31, 161–173. [Google Scholar] [CrossRef]
- Cascella, M.; Rajnik, M.; Aleem, A.; Dulebohn, S.C.; Di Napoli, R. Features, Evaluation, and Treatment of Coronavirus (COVID-19). In 2022 Statpearls [internet]. Available online: https://www.ncbi.nlm.nih.gov/books/NBK554776/ (accessed on 30 June 2022).
- Jones, A.T.; Barker, H. Idaeovirus. In Encyclopedia of Virology, 3rd ed.; Mahy, B.W.J., Van Regenmortel, M.H.V., Eds.; Academic Press: Oxford, UK, 2008; pp. 37–41. [Google Scholar]
- Fehr, A.R.; Perlman, S. Coronaviruses: An overview of their replication and pathogenesis. In Methods in Molecular Biology; Humana Press: New York, NY, USA, 2015; Volume 1282, pp. 1–23. [Google Scholar]
- Pellett, P.E.; Mitra, S.; Holland, T.C. Chapter 2—Basics of virology. In Handbook of Clinical Neurology; Tselis, A.C., Booss, J., Eds.; Elsevier: Amsterdam, The Netherlands, 2014; Volume 123, pp. 45–66. [Google Scholar]
- Johari, P.; Jornet, J.M. Nanoscale optical wireless channel model for intra-body communications: Geometrical, time, and frequency domain analyses. IEEE Trans. Commun. 2017, 66, 1579–1593. [Google Scholar] [CrossRef]
- Elayan, H.; Shubair, R.M.; Jornet, J.M.; Johari, P. Terahertz channel model and link budget analysis for intrabody nanoscale communication. IEEE Trans. Nanobiosc. 2017, 16, 491–503. [Google Scholar] [CrossRef]
- O’Neil, D. Blood Components; Palomar College: San Marcos, TX, USA, 2012. [Google Scholar]
- Ke, Z.; Oton, J.; Qu, K.; Cortese, M.; Zila, V.; McKeane, L.; Nakane, T.; Zivanov, J.; Neufeldt, C.J.; Cerikan, B. Structures and distributions of SARS-CoV-2 spike proteins on intact virions. Nature 2020, 588, 498–502. [Google Scholar] [CrossRef]
- Kuppuswamy, S.; Swain, K.; Nayak, S.; Palai, G. Computation of refractive indices of corona viruses through reverse calculation. Curr. Opt. Photonics 2020, 4, 566–570. [Google Scholar]
- Sebastian, M.T.; Ubic, R.; Jantunen, H. Microwave Materials and Applications; John Wiley & Sons: Hoboken, NJ, USA, 2017. [Google Scholar]
- Harrington, R.F. Time-Harmonic Electromagnetic Fields; Wiley: Chichester, UK, 2001. [Google Scholar]
- Ji, T.; Liu, Z.; Wang, G.; Guo, X.; Akbar Khan, S.; Lai, C.; Chen, H.; Huang, S.; Xia, S.; Chen, B.; et al. Detection of COVID-19: A review of the current literature and future perspectives. Biosens. Bioelectron. 2020, 166, 112455. [Google Scholar] [CrossRef]
- Behera, S.; Rana, G.; Satapathy, S.; Mohanty, M.; Pradhan, S.; Panda, M.K.; Ningthoujam, R.; Hazarika, B.N.; Singh, Y.D. Biosensors in diagnosing COVID-19 and recent development. Sens. Int. 2020, 1, 100054. [Google Scholar] [CrossRef]
- Joshi, R.K.; Bhansali, S. Nanosensor Technology. J. Nanomater. 2008, 2008, 840390. [Google Scholar] [CrossRef] [Green Version]
- Sengupta, J.; Adhikari, A.; Hussain, C.M. Graphene-based analytical lab-on-chip devices for detection of viruses: A review. Carbon Trends 2021, 4, 100072. [Google Scholar] [CrossRef]
- Geim, A.K.; Novoselov, K.S. The rise of graphene. Nat. Mater. 2007, 6, 183–191. [Google Scholar] [CrossRef]
- Novoselov, K.S.; Geim, A.K.; Morozov, S.V.; Jiang, D.; Zhang, Y.; Dubonos, S.V.; Grigorieva, I.V.; Firsov, A.A. Electric Field Effect in Atomically Thin Carbon Films. Science 2004, 306, 666–669. [Google Scholar] [CrossRef] [Green Version]
- Palik, E.D. Handbook of Optical Constants of Solids; Academic Press: Cambridge, MA, USA, 1998; Volume 3. [Google Scholar]
- Polyanskiy, M. RefractiveIndex. INFO-Refractive Index Database. RefractiveIndex. INFO. Available online: http://refractiveindex.info/ (accessed on 25 January 2016).
- Dash, S.; Patnaik, A. Performance of Graphene Plasmonic Antenna in Comparison with Their Counterparts for Low-Terahertz Applications. Plasmonics 2018, 13, 2353–2360. [Google Scholar] [CrossRef]
- Vorobev, A.S.; Bianco, G.V.; Bruno, G.; D’Orazio, A.; O’Faolain, L.; Grande, M. Tuning of Graphene-Based Optical Devices Operating in the Near-Infrared. Appl. Sci. 2021, 11, 8367. [Google Scholar] [CrossRef]
- Maghoul, A.; Rostami, A.; Barzinjy, A.A.; Mirtaheri, P. Electrically Tunable Perfect Terahertz Absorber Using Embedded Combline Graphene Layer. Appl. Sci. 2021, 11, 10961. [Google Scholar] [CrossRef]
- Piper, J.R.; Fan, S. Total Absorption in a Graphene Monolayer in the Optical Regime by Critical Coupling with a Photonic Crystal Guided Resonance. ACS Photonics 2014, 1, 347–353. [Google Scholar] [CrossRef]
- Araujo, P.T.; Terrones, M.; Dresselhaus, M.S. Defects and impurities in graphene-like materials. Mater. Today 2012, 15, 98–109. [Google Scholar] [CrossRef] [Green Version]
- Xing, F.; Liu, Z.-B.; Deng, Z.-C.; Kong, X.-T.; Yan, X.-Q.; Chen, X.-D.; Ye, Q.; Zhang, C.-P.; Chen, Y.-S.; Tian, J.-G. Sensitive Real-Time Monitoring of Refractive Indexes Using a Novel GrapheneBased Optical Sensor. Sci. Rep. 2012, 2, 908. [Google Scholar] [CrossRef] [Green Version]
- Jabbarzadeh, F.; Heydari, M.; Habibzadeh-Sharif, A. A comparative analysis of the accuracy of Kubo formulations for graphene plasmonics. Mater. Res. Express 2019, 6, 86209. [Google Scholar] [CrossRef]
- Maghoul, A.; Rostami, A.; Gnanakulasekaran, N.; Balasingham, I. Design and Simulation of Terahertz Perfect Absorber with Tunable Absorption Characteristic Using Fractal-Shaped Graphene Layers. Photonics 2021, 8, 375. [Google Scholar] [CrossRef]
- Stoliar, P.; Calò, A.; Valle, F.; Biscarini, F. Fabrication of Fractal Surfaces by Electron Beam Lithography. IEEE Trans. Nanotechnol. 2010, 9, 229–236. [Google Scholar] [CrossRef]


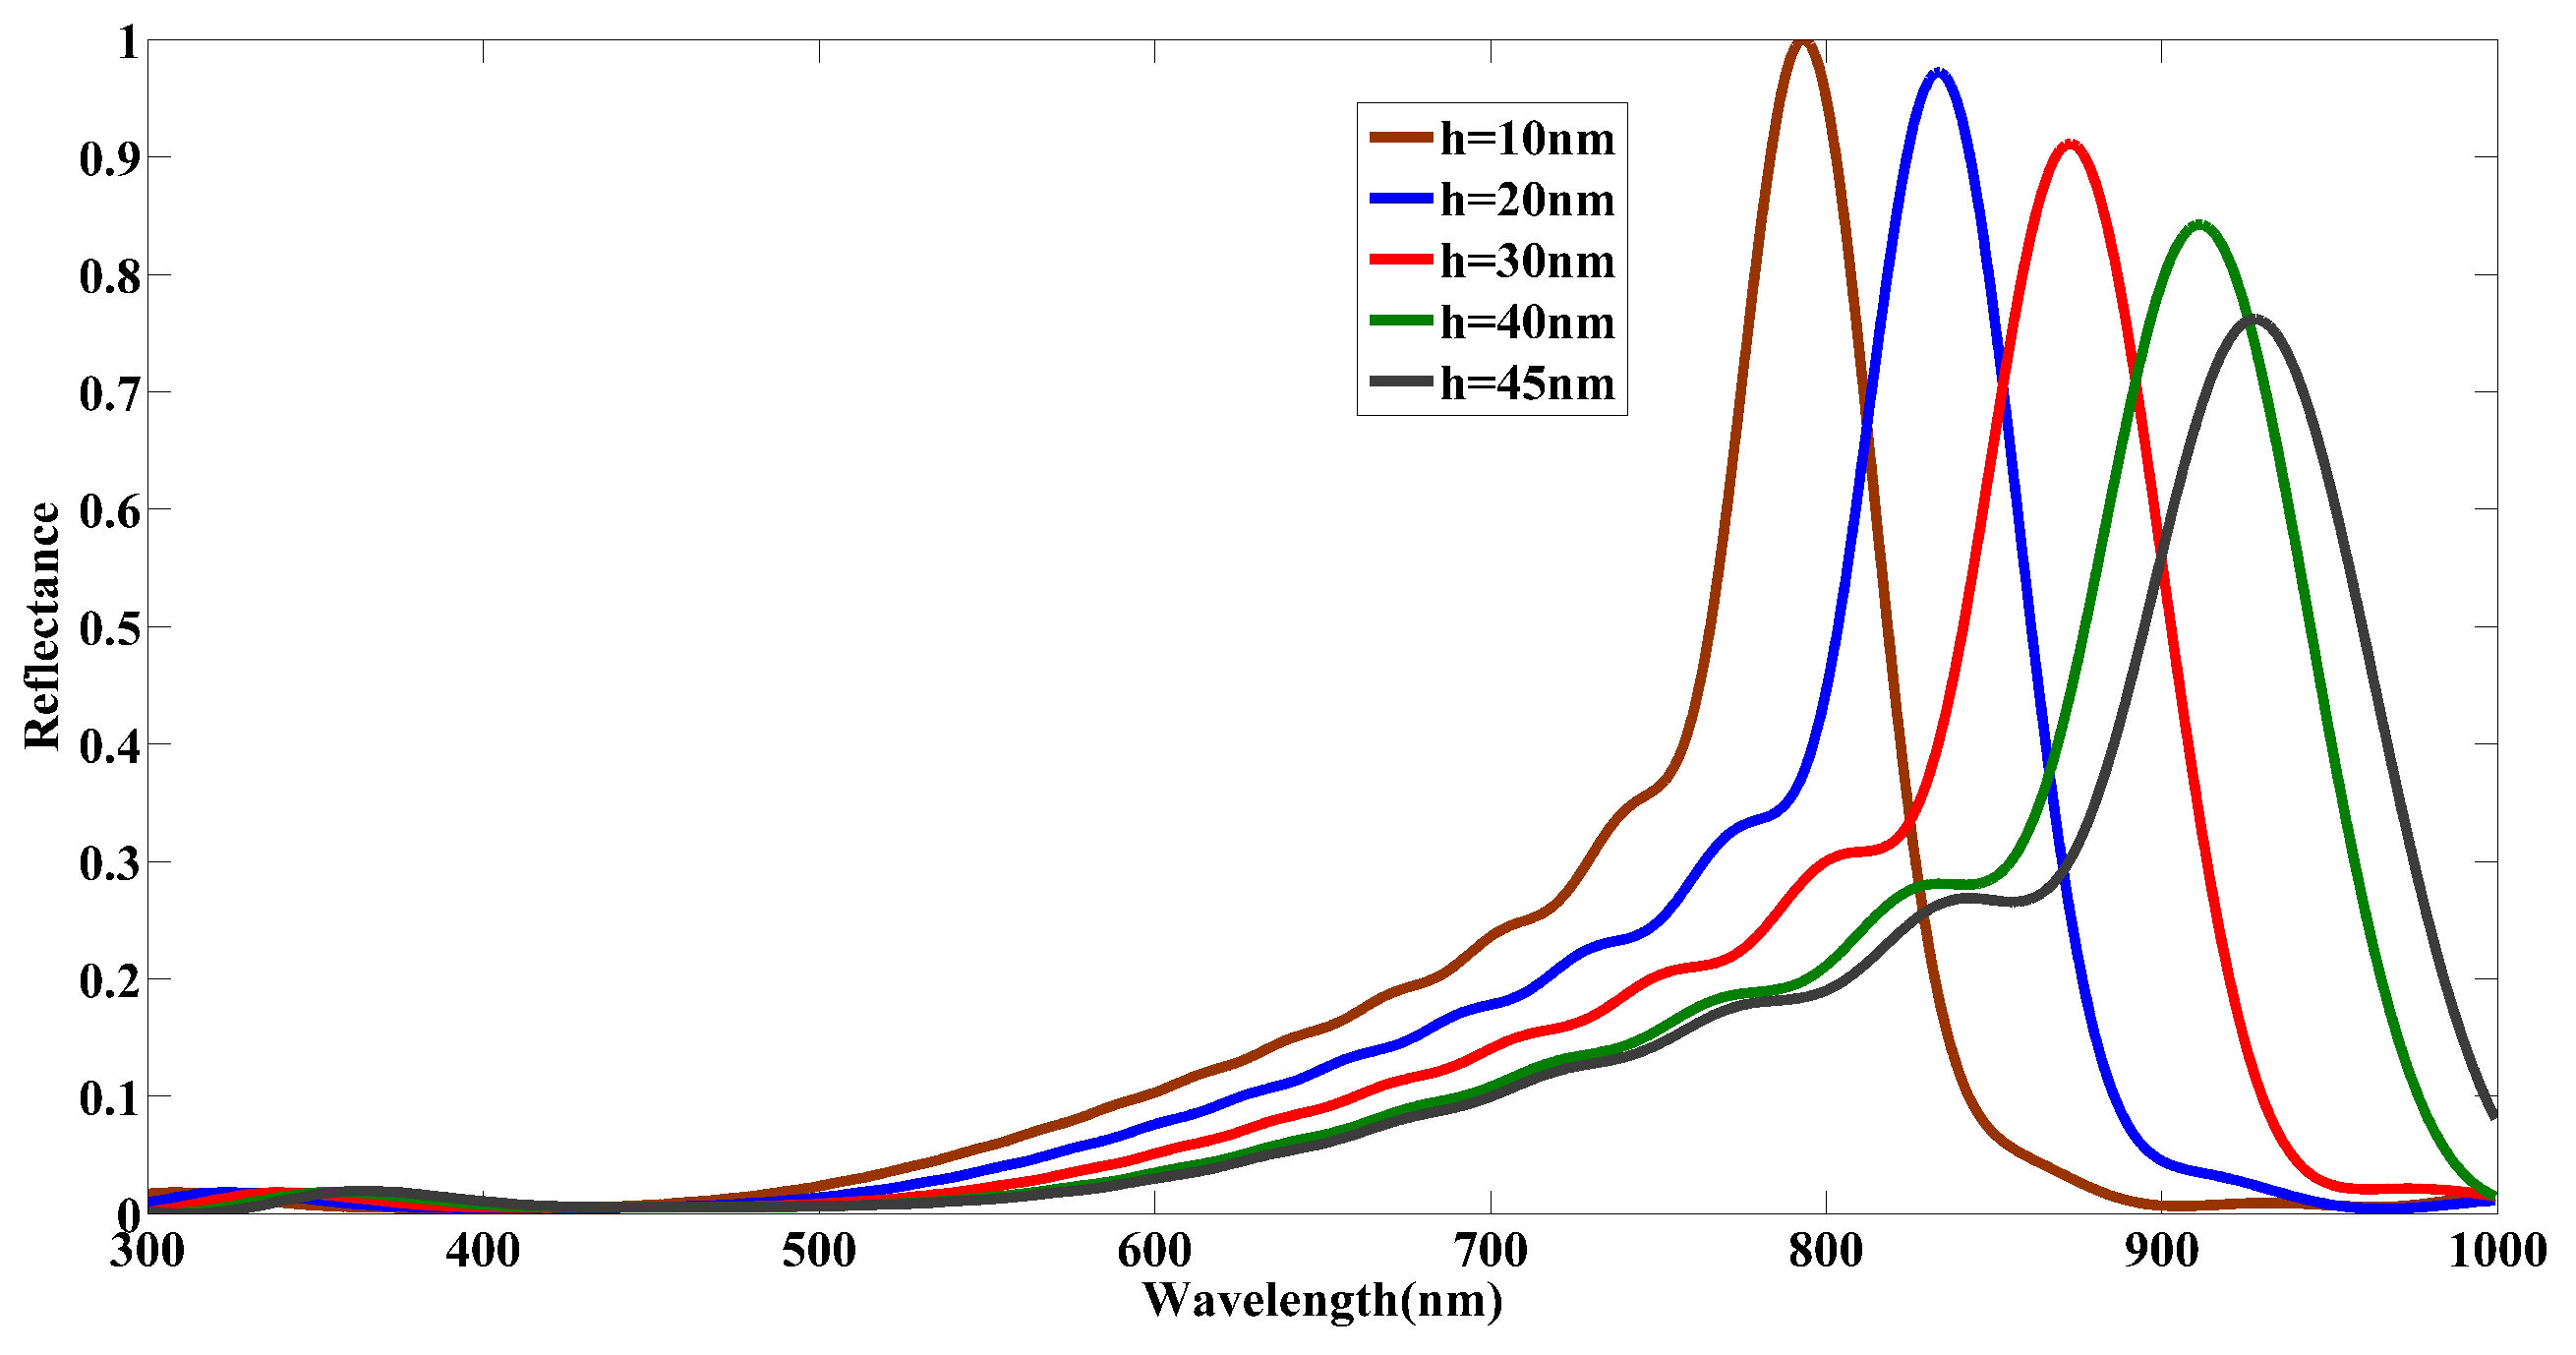
| Spike Length (nm) | Wavelength (nm) | Reflectance |
|---|---|---|
| 793.73 | 0.9989 | |
| 833.92 | 0.9723 | |
| 873.01 | 0.9115 | |
| 912.05 | 0.8424 | |
| 927.86 | 0.7621 |
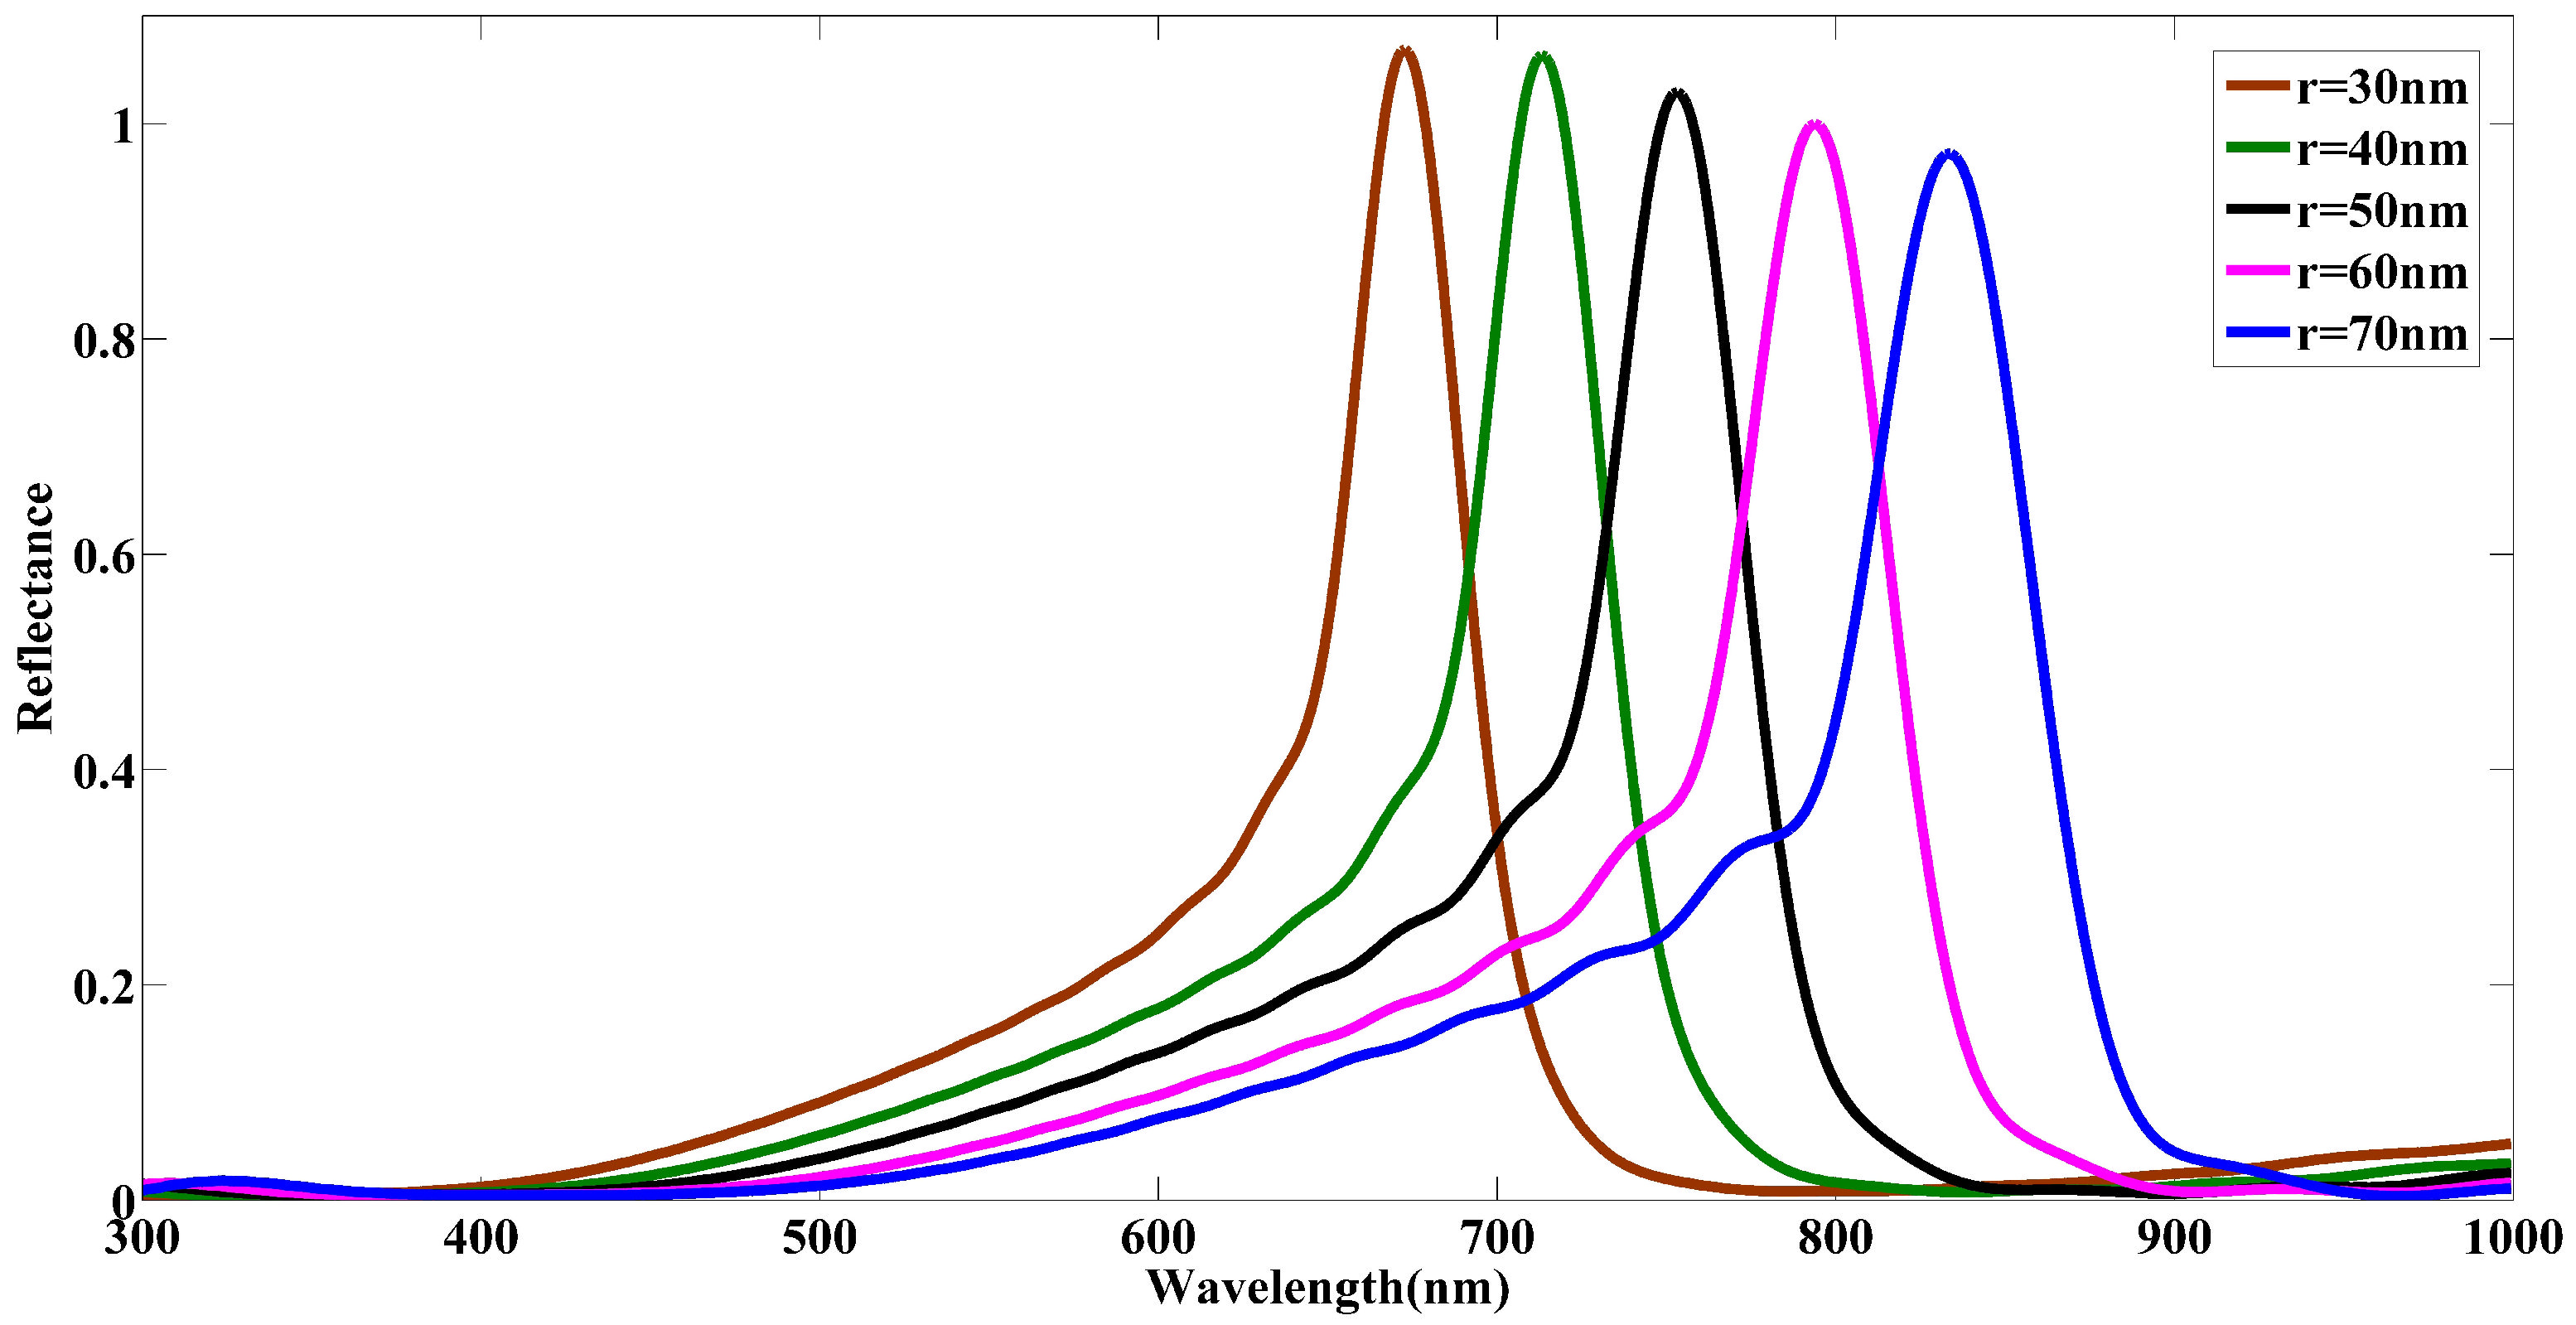
| The Radius of the COVID-19 Model (nm) | Wavelength (nm) | Reflectance |
|---|---|---|
| 672.78 | 1.0689 | |
| 713.11 | 1.0639 | |
| 753.25 | 1.0295 | |
| 793.73 | 0.9996 | |
| 833.92 | 0.9723 |
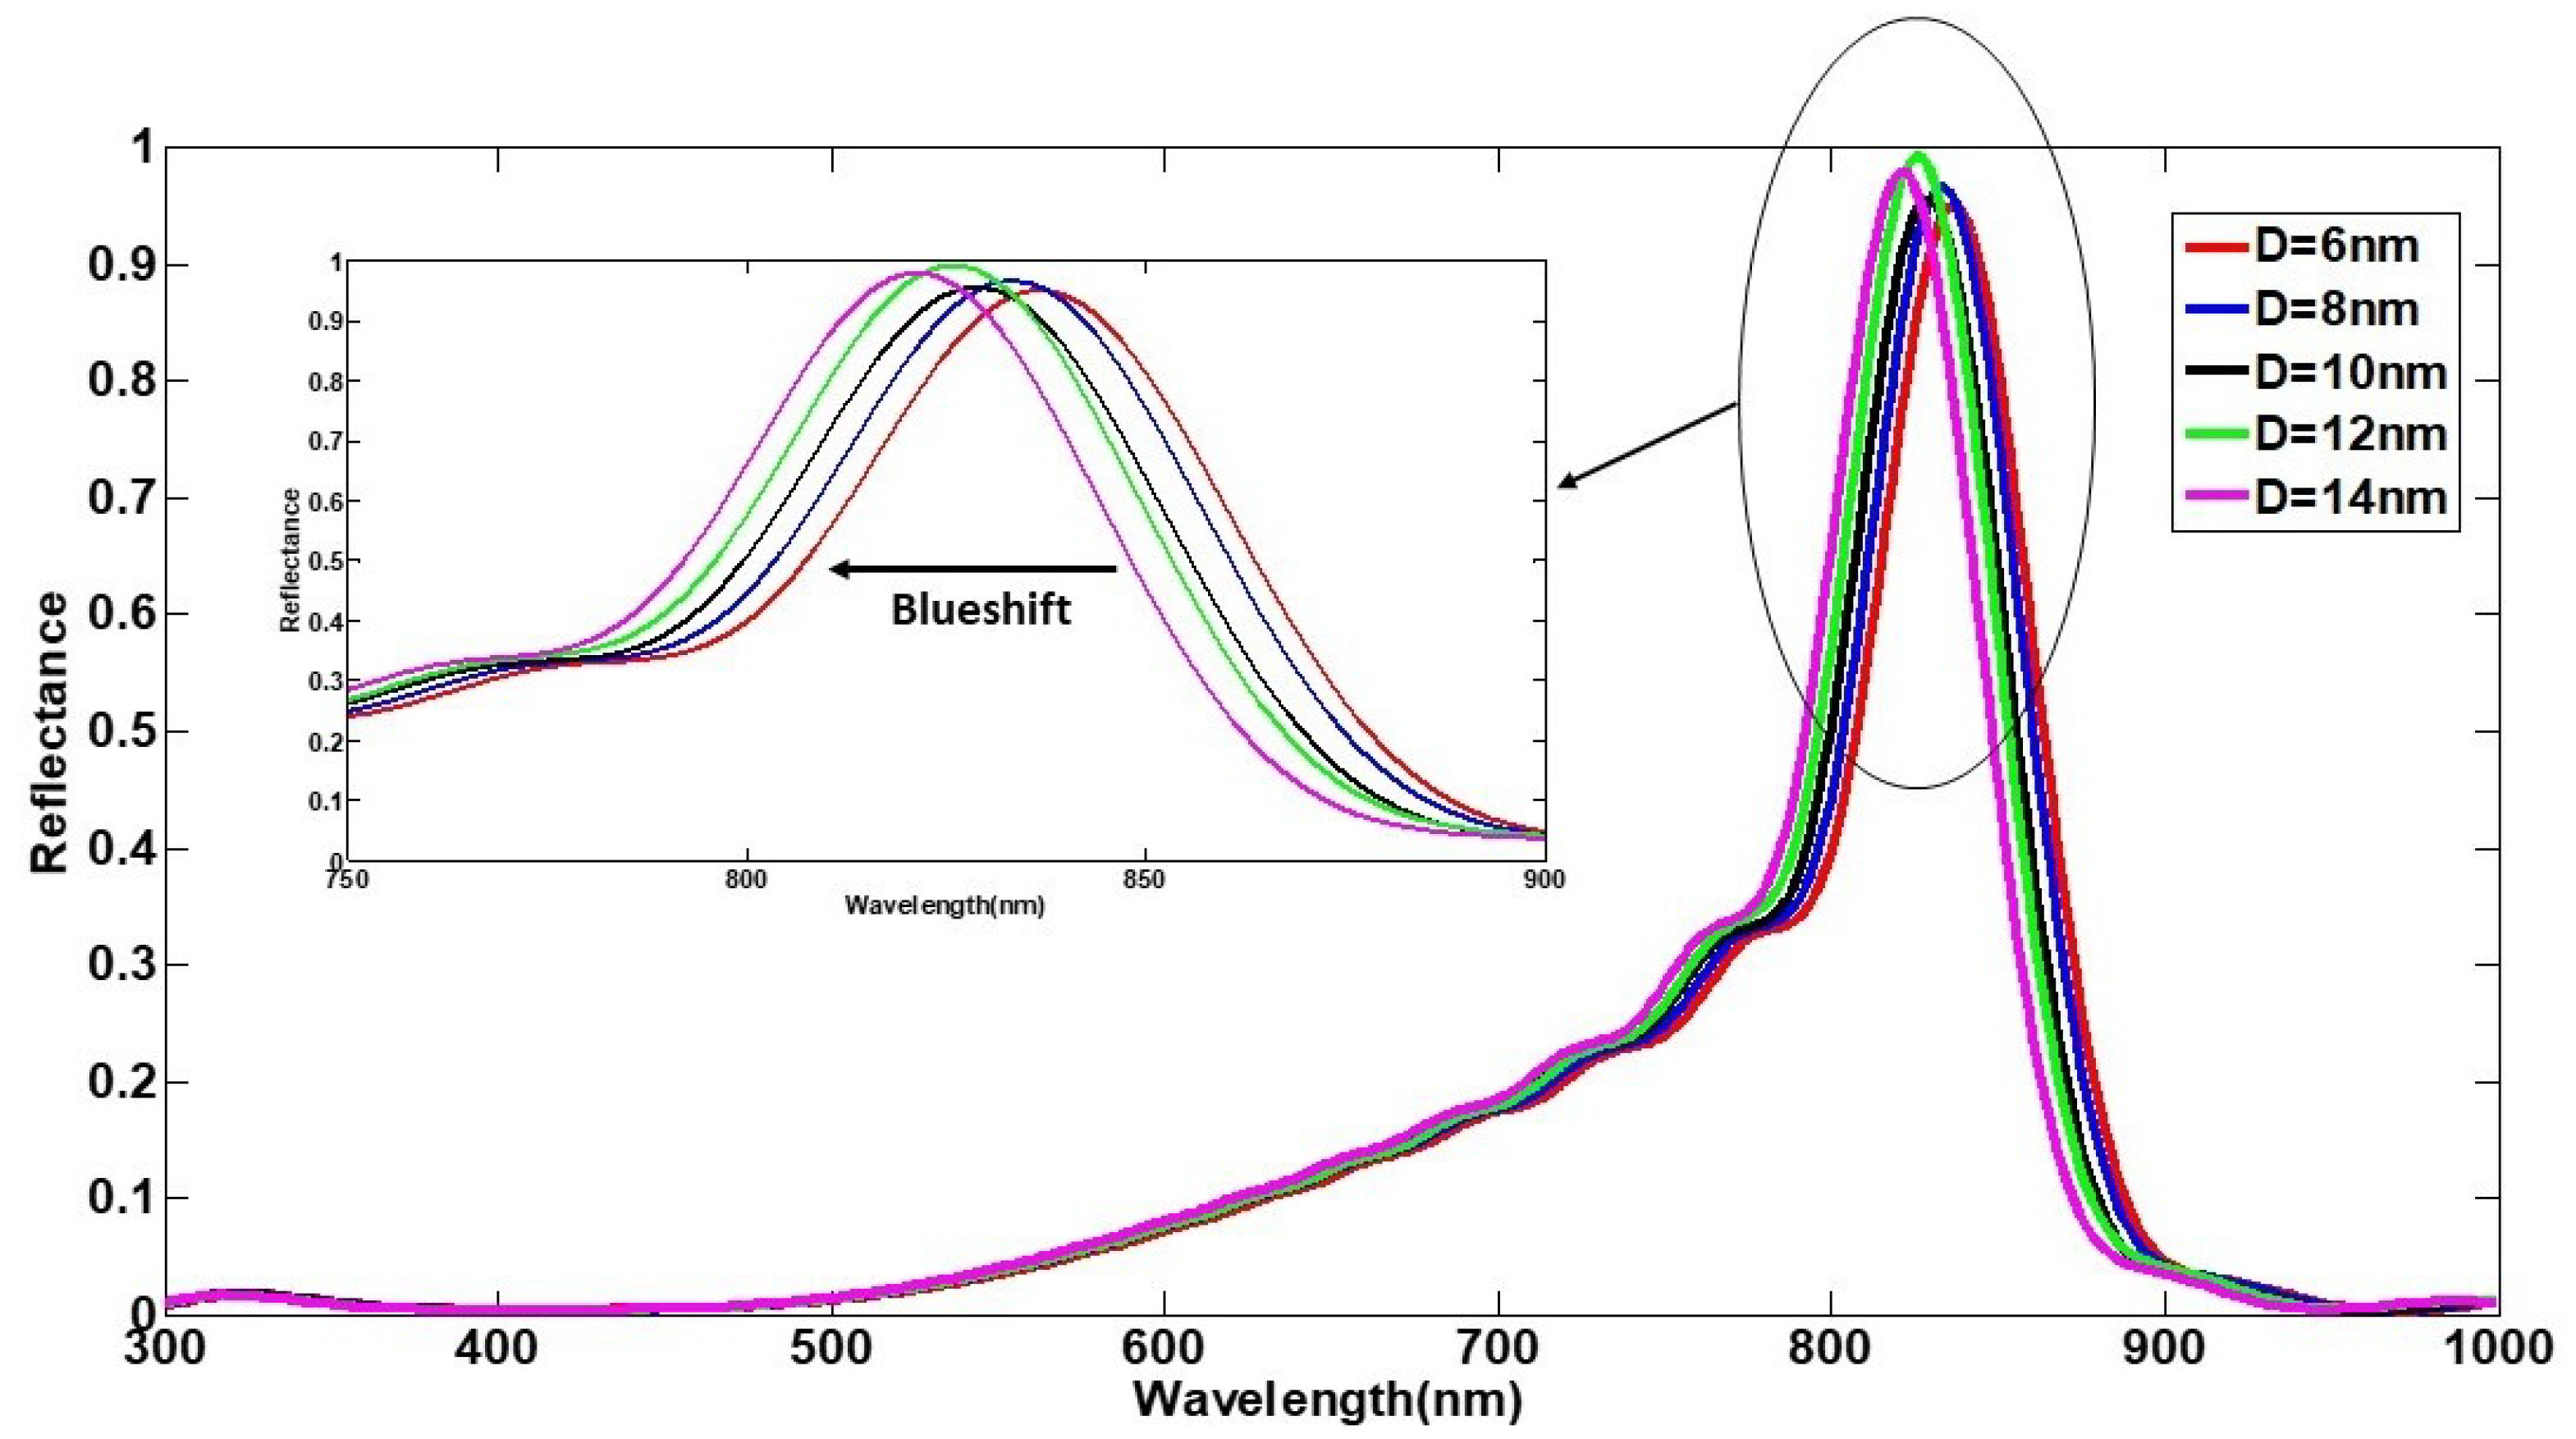
| The Base Diameter of the Conical Spikes (nm) | Wavelength (nm) | Reflectance |
|---|---|---|
| 837.18 | 0.9509 | |
| 833.92 | 0.9663 | |
| 829.07 | 0.9556 | |
| 825.87 | 0.9924 | |
| 821.12 | 0.9792 |
Publisher’s Note: MDPI stays neutral with regard to jurisdictional claims in published maps and institutional affiliations. |
© 2022 by the authors. Licensee MDPI, Basel, Switzerland. This article is an open access article distributed under the terms and conditions of the Creative Commons Attribution (CC BY) license (https://creativecommons.org/licenses/by/4.0/).
Share and Cite
Maghoul, A.; Simonsen, I.; Rostami, A.; Mirtaheri, P. An Optical Modeling Framework for Coronavirus Detection Using Graphene-Based Nanosensor. Nanomaterials 2022, 12, 2868. https://doi.org/10.3390/nano12162868
Maghoul A, Simonsen I, Rostami A, Mirtaheri P. An Optical Modeling Framework for Coronavirus Detection Using Graphene-Based Nanosensor. Nanomaterials. 2022; 12(16):2868. https://doi.org/10.3390/nano12162868
Chicago/Turabian StyleMaghoul, Amir, Ingve Simonsen, Ali Rostami, and Peyman Mirtaheri. 2022. "An Optical Modeling Framework for Coronavirus Detection Using Graphene-Based Nanosensor" Nanomaterials 12, no. 16: 2868. https://doi.org/10.3390/nano12162868