
Effect of Fabrication Method on the Thermo Mechanical and Electrical Properties of Graphene Doped PVDF Nanocomposites


Abstract
:1. Introduction
2. Materials
3. Experimental Section
3.1. Fabrication of PVDF-GR Nanocomposites
3.2. Solution Casting PVDF
3.3. Melt Blending
4. Characterization
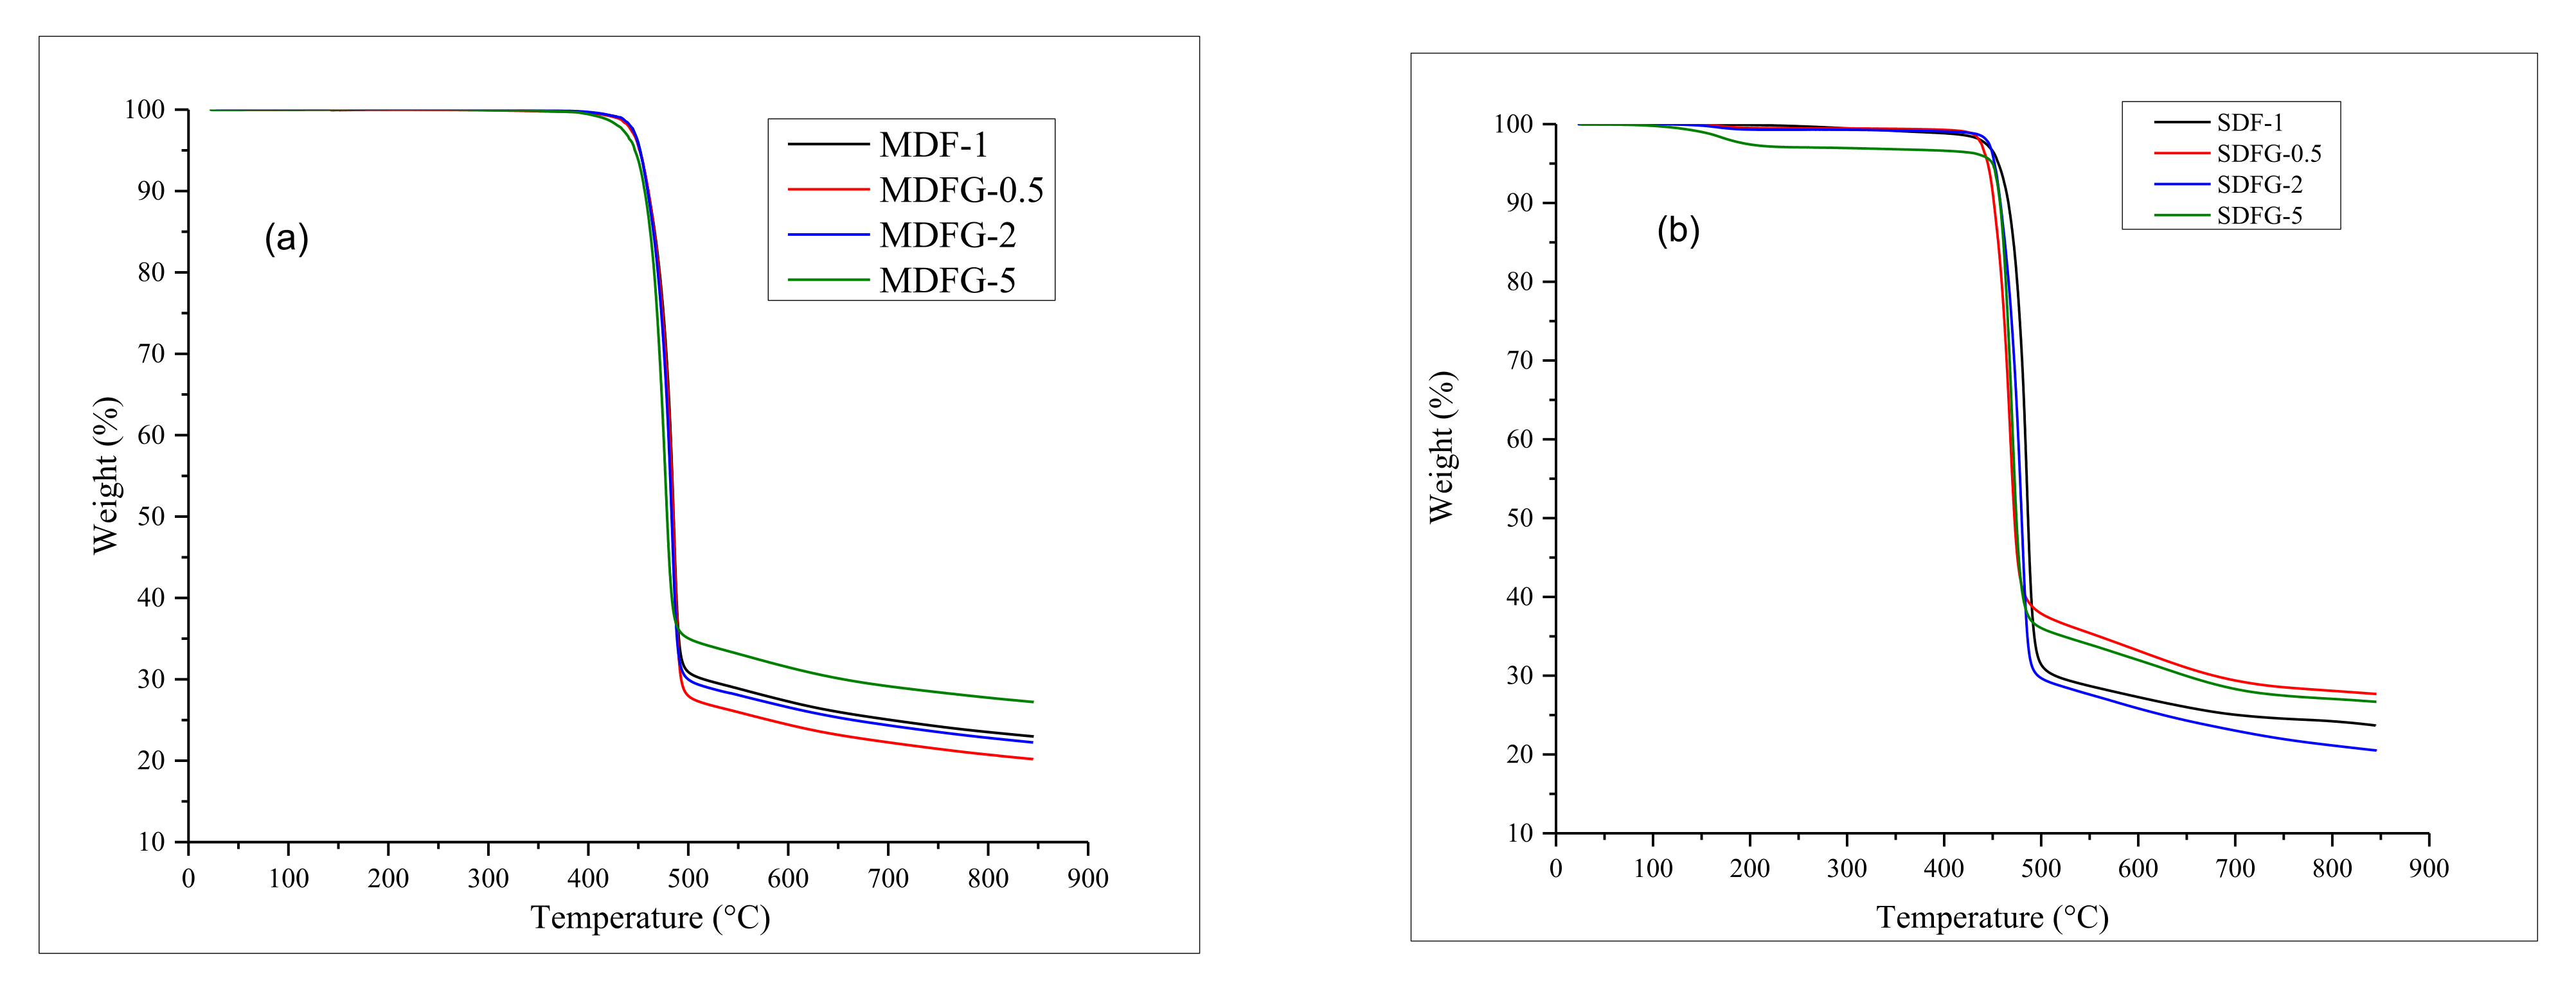
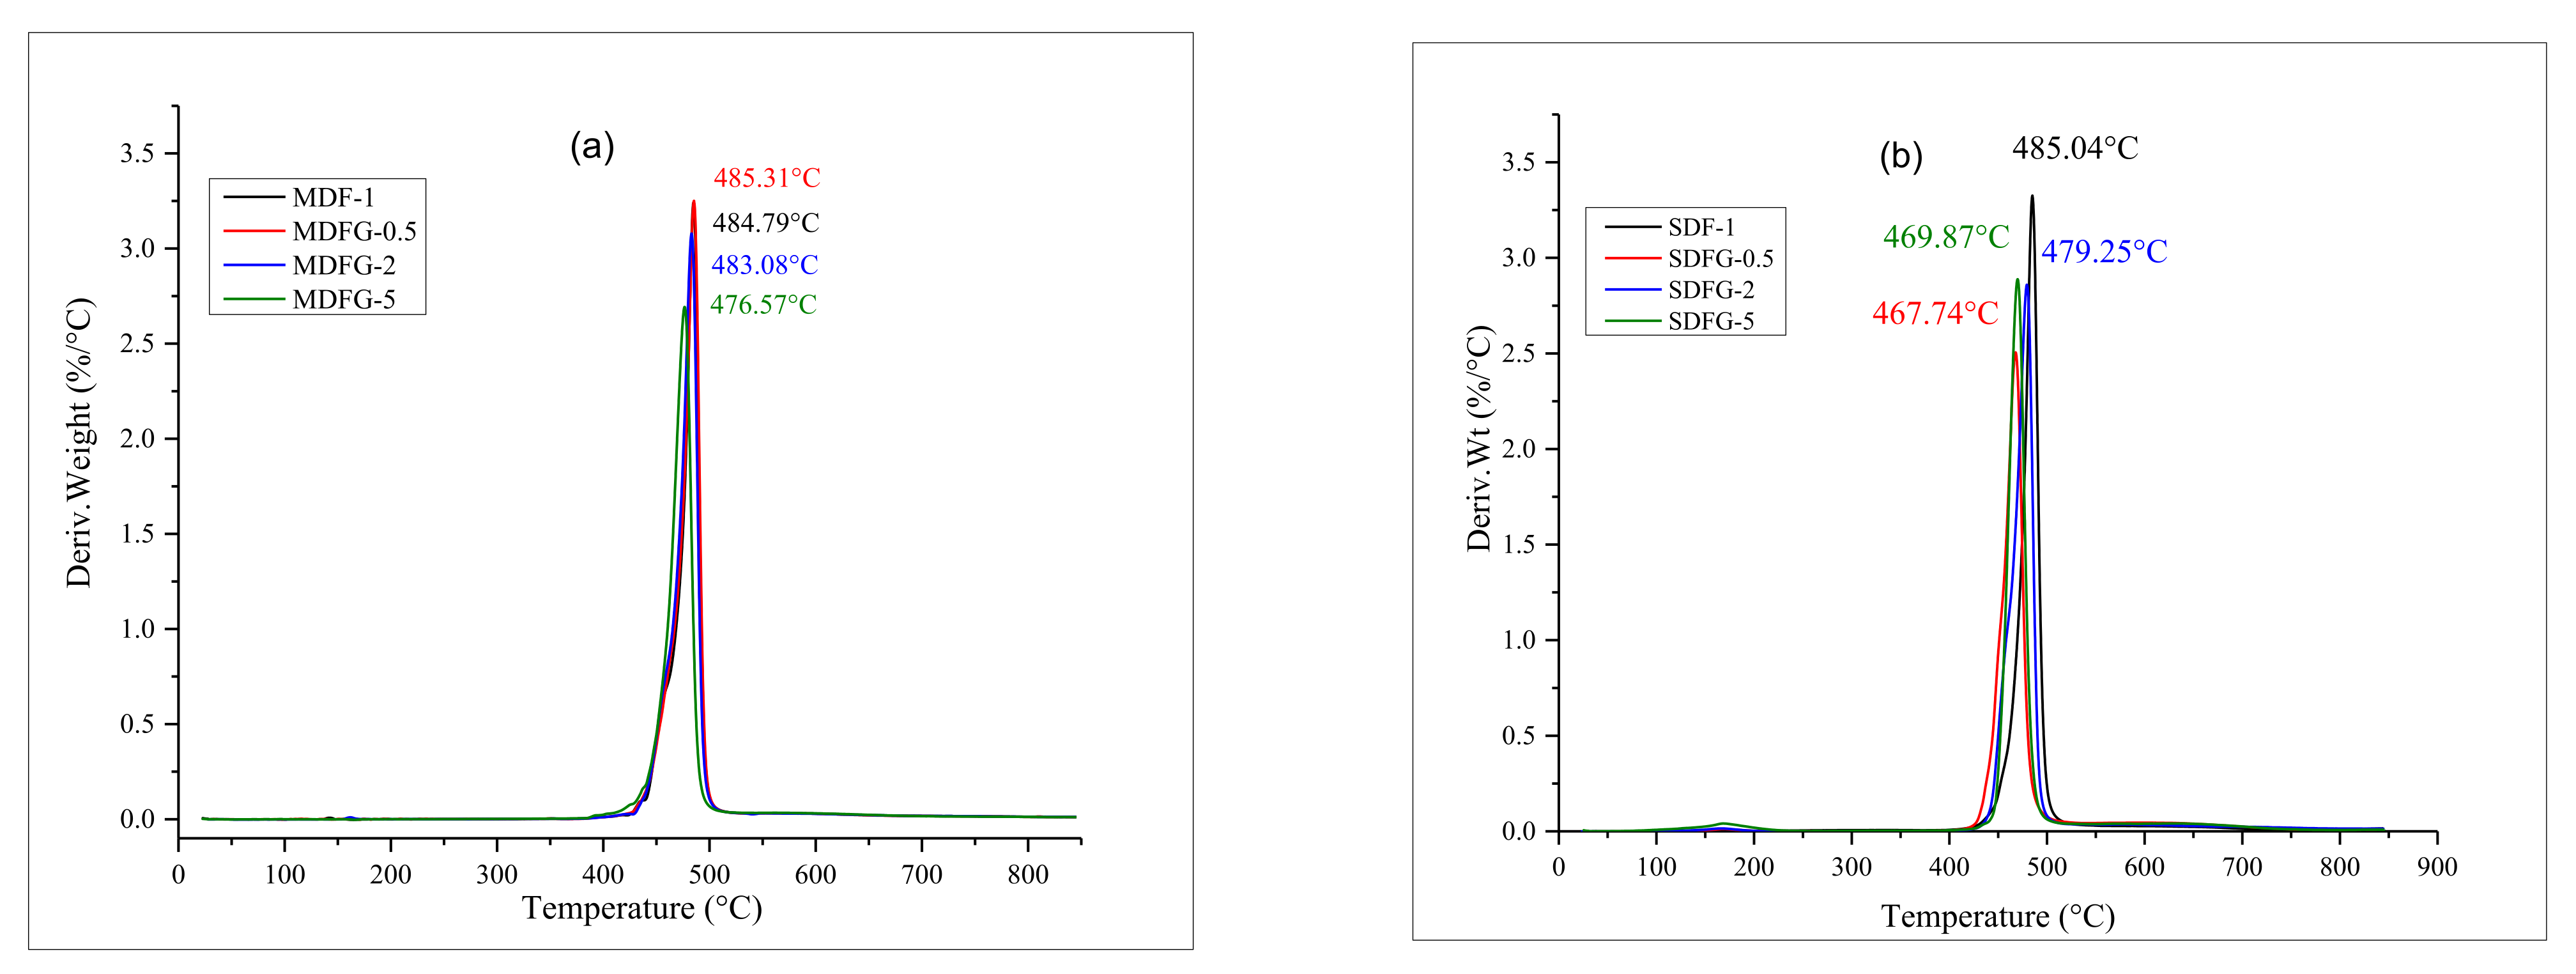
4.1. Thermogravimetric Analysis (TGA)
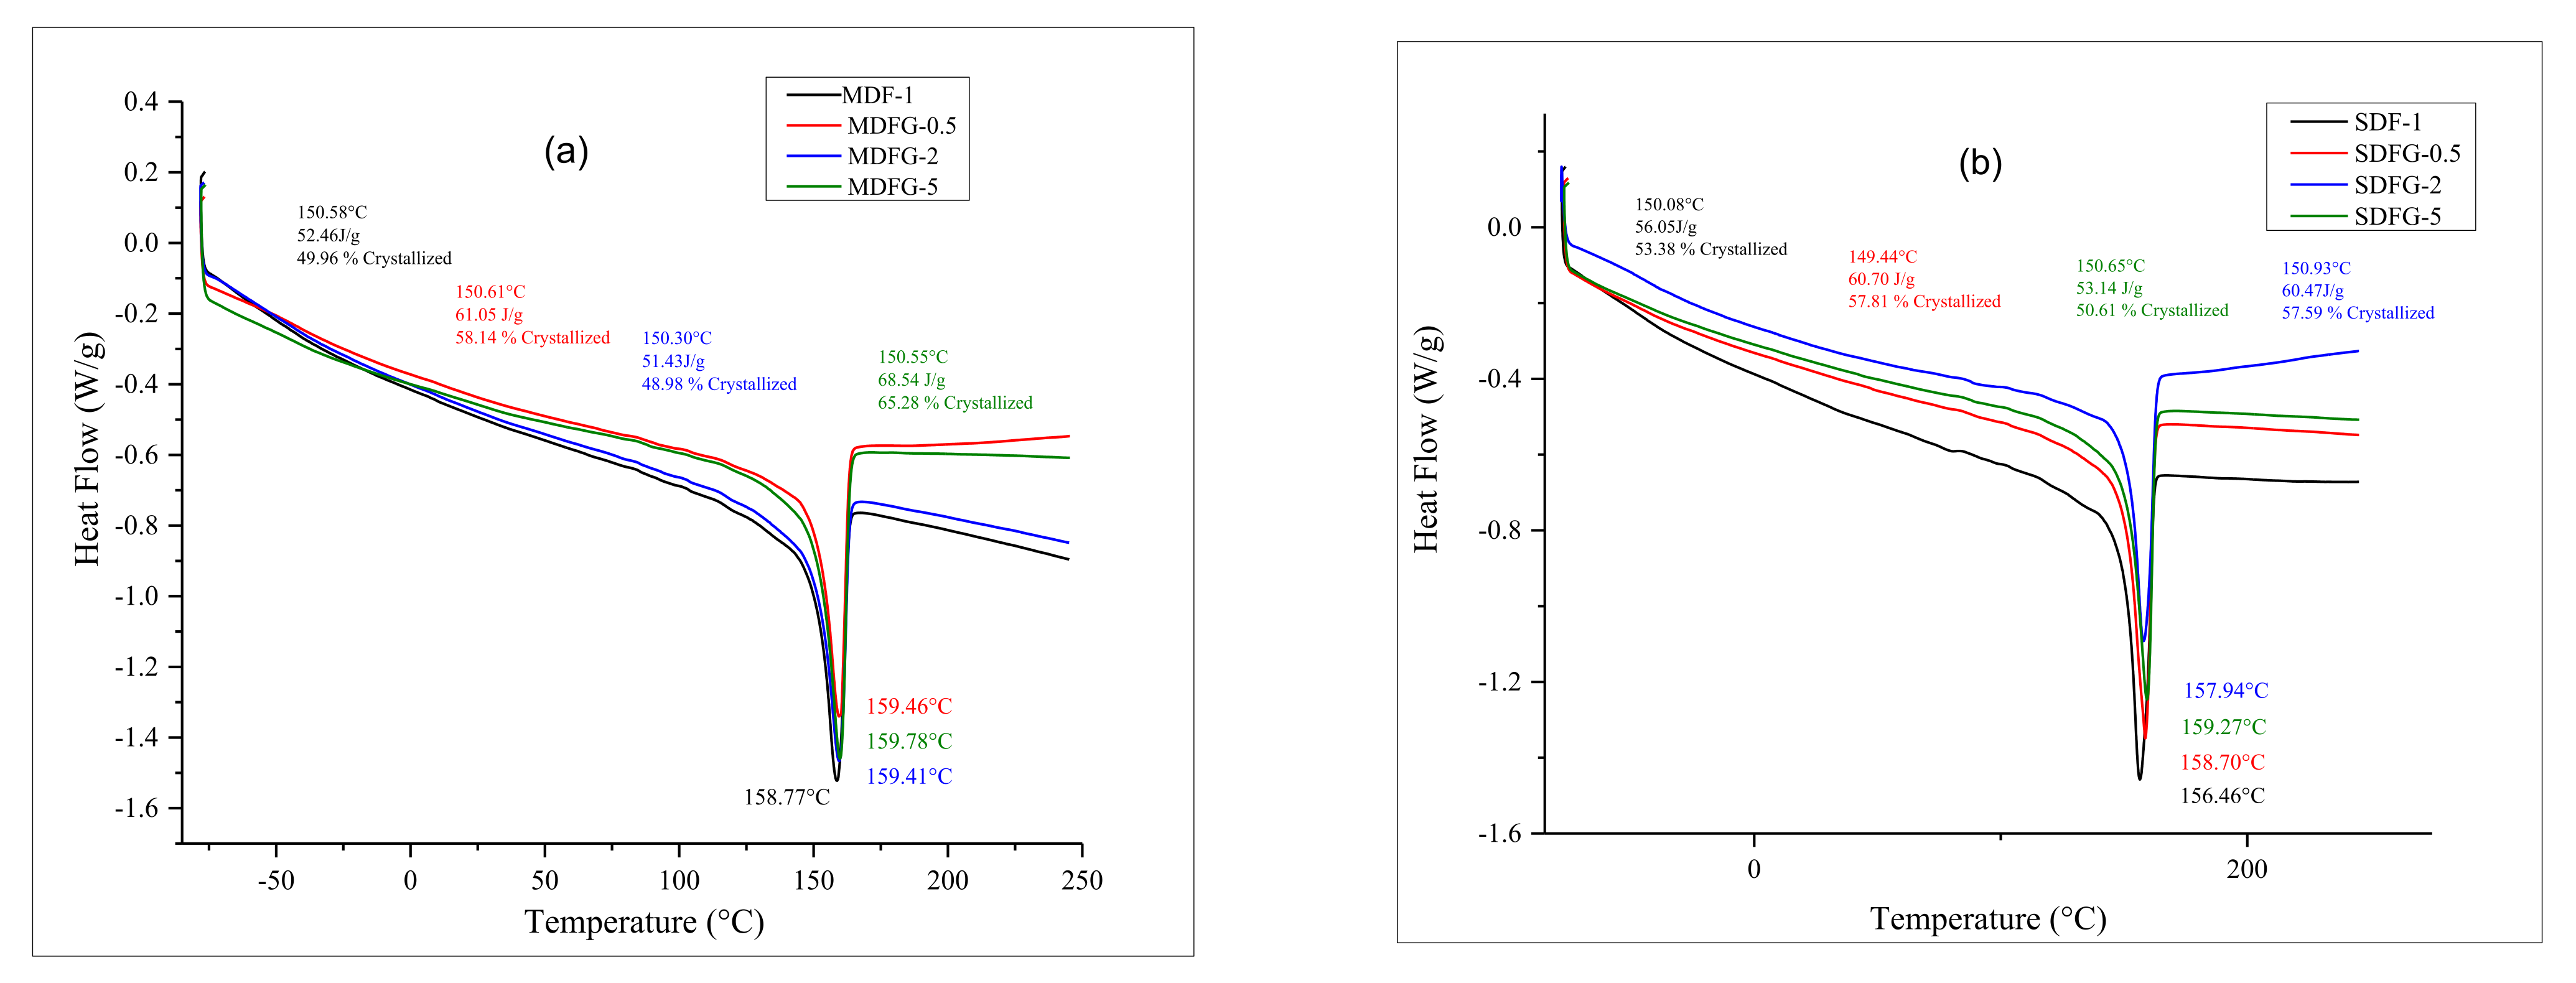
4.2. Differential Scanning Calorimetry (DSC)
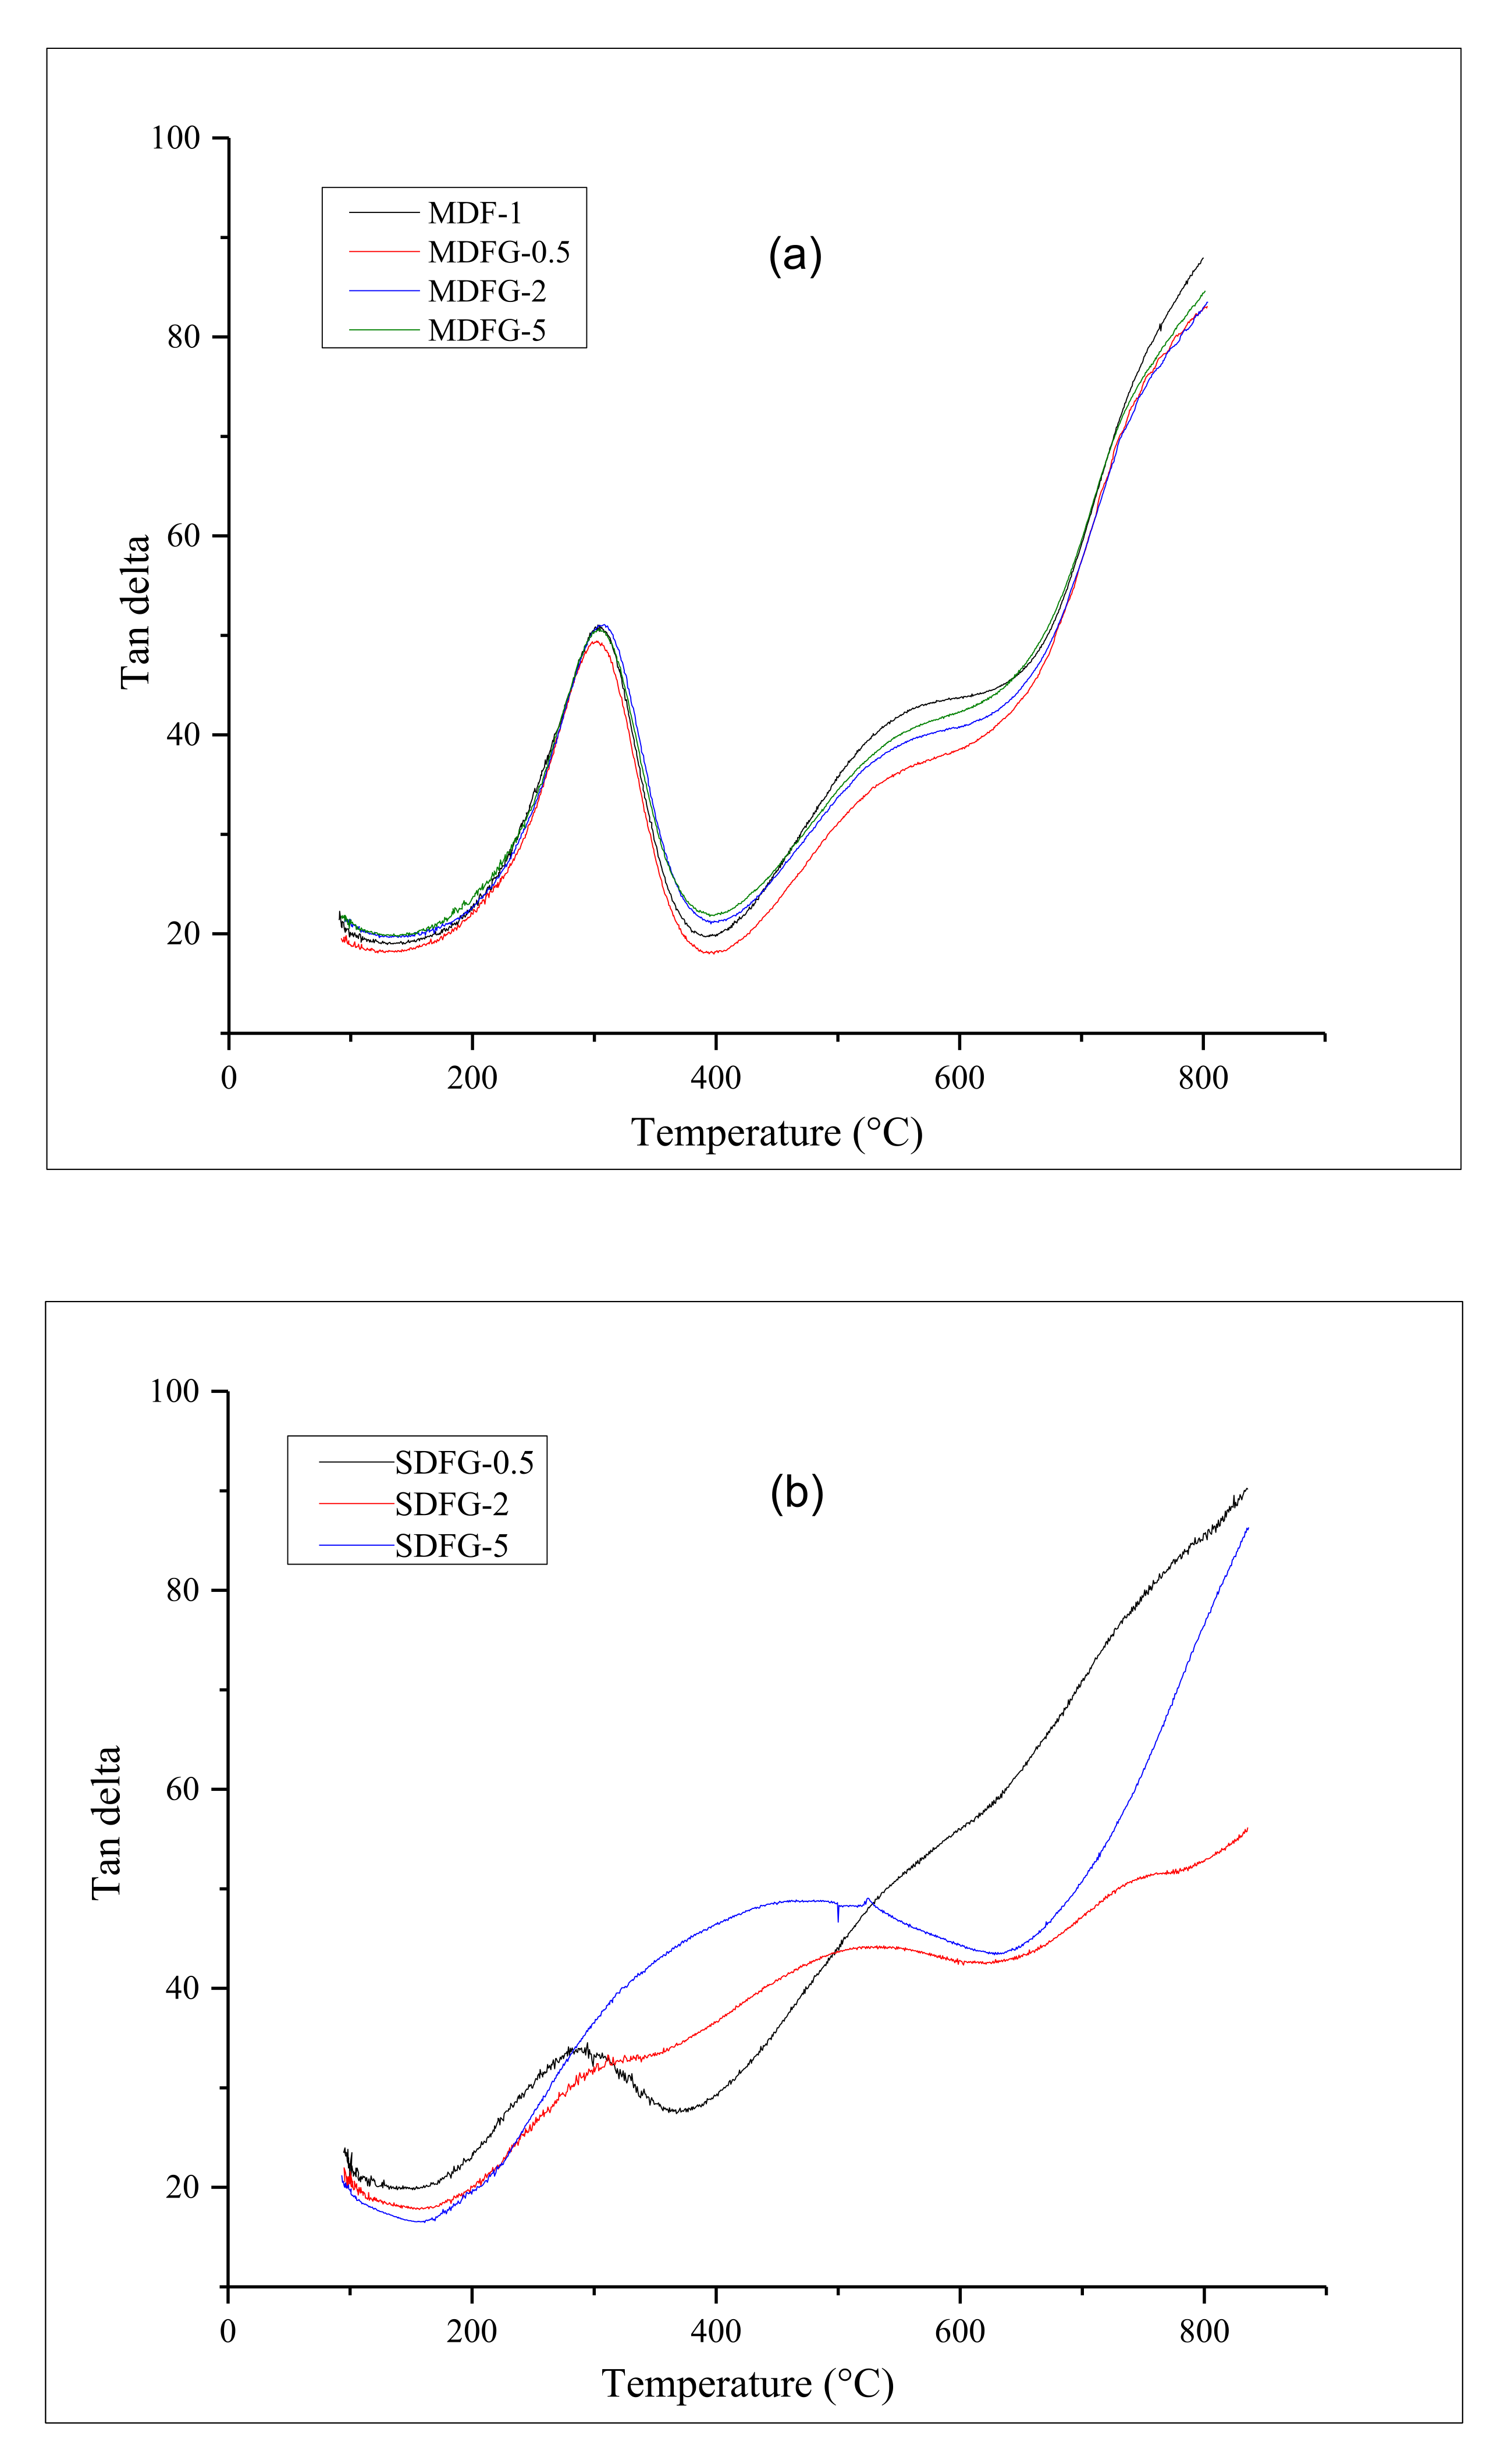
4.3. DMA
4.4. Thermal Conductivity
5. Results and Discussion
6. Conclusions
Author Contributions
Funding
Institutional Review Board Statement
Informed Consent Statement
Data Availability Statement
Acknowledgments
Conflicts of Interest
References
- Kang, G.-D.; Cao, Y.-M. Application and modification of poly(vinylidene fluoride) (PVDF) membranes—A review. J. Membr. Sci. 2014, 463, 145–165. [Google Scholar] [CrossRef]
- Lei, Y.L.; Luo, Y.J.; Chen, F.; Mei, L.H. Sulfonation process and desalination effect of polystyrene/PVDF semi-interpenetrating polymer network cation exchange membrane. Polymers 2014, 6, 1914–1928. [Google Scholar] [CrossRef] [Green Version]
- Yuan, Q.; Liu, P.; Baker, G.L. Sulfonated polyimide and PVDF based blend proton exchange membranes for fuel cell applications. J. Mater. Chem. A 2015, 3, 3847–3853. [Google Scholar] [CrossRef]
- Duarte, J.; Cherubini, C.C.; Dos Santos, V.; Schneider, A.; Zeni, M. Poly(vinylidene fluoride) (PVDF) and nylon 66 (PA66) membranes applied the process of gas separation. Procedia Eng. 2012, 44, 1146–1149. [Google Scholar] [CrossRef] [Green Version]
- Kang, D.H.; Kim, N.K.; Kang, H.W. Electrostatic charge retention in pvdf nanofiber-nylon mesh multilayer structure for effective fine particulate matter filtration for face masks. Polymers 2021, 13, 3235. [Google Scholar] [CrossRef] [PubMed]
- Chiu, F.C. Poly(vinylidene fluoride)/polycarbonate blend-based nanocomposites with enhanced rigidity—Selective localization of carbon nanofillers and organoclay. Polym. Test. 2017, 62, 115–123. [Google Scholar] [CrossRef]
- Chen, R.; Luo, T.; Geng, D.; Shen, Z.; Zhou, W. Facile fabrication of a fast-response flexible temperature sensor via laser reduced graphene oxide for contactless human-machine interface. Carbon 2022, 187, 35–46. [Google Scholar] [CrossRef]
- Tian, X.; Liu, Z.; Chu, J.; Liu, Z.; Luo, Z.; Wu, X.; Qiao, F.; Wang, X.; Li, G.; Wu, J.; et al. Dual-Mode Sensor and Actuator to Learn Human-Hand Tracking and Grasping. IEEE Trans. Electron Devices 2019, 66, 5407–5410. [Google Scholar] [CrossRef]
- Zhao, Q.; Yang, L.; Ma, Y.; Huang, H.; He, H.; Ji, H.; Wang, Z.; Qiu, J. Highly sensitive, reliable and flexible pressure sensor based on piezoelectric PVDF hybrid film using MXene nanosheet reinforcement. J. Alloys Compd. 2021, 886, 161069. [Google Scholar] [CrossRef]
- Sukumaran, S.; Chatbouri, S.; Rouxel, D.; Tisserand, E.; Thiebaud, F.; Ben Zineb, T. Recent advances in flexible PVDF based piezoelectric polymer devices for energy harvesting applications. J. Intell. Mater. Syst. Struct. 2021, 32, 746–780. [Google Scholar] [CrossRef]
- An, N.; Liu, S.; Fang, C.; Yu, R.; Zhou, X.; Cheng, Y. Preparation and properties of β-phase graphene oxide/PVDF composite films. J. Appl. Polym. Sci. 2015, 132. [Google Scholar] [CrossRef]
- Al-Saygh, A.; Ponnamma, D.; AlMaadeed, M.A.A.; Poornima Vijayan, P.; Karim, A.; Hassan, M.K. Flexible pressure sensor based on PVDF nanocomposites containing reduced graphene oxide-titania hybrid nanolayers. Polymers 2017, 9, 33. [Google Scholar] [CrossRef] [PubMed] [Green Version]
- Chen, D.; Wang, M.; Zhang, W.D.; Liu, T. Preparation and characterization of poly(vinylidene fluoride) nanocomposites containing multiwalled carbon nanotubes. J. Appl. Polym. Sci. 2009, 113, 644–650. [Google Scholar] [CrossRef]
- Mazhar, H.; Shehzad, F.; Hong, S.G.; Al-harthi, M.A. Degradation kinetics and thermomechanical properties of in-situ polymerized layered double hydroxides-ethylene-propylene copolymer. J. Appl. Polym. Sci. 2022, 139, 52002. [Google Scholar] [CrossRef]
- Kim, S.; Kavitha, D. Identification of pyrolysis reaction model of linear low density polyethylene (LLDPE). Chem. Lett. 2006, 35, 446–447. [Google Scholar] [CrossRef]
- Thiyagu, C.; Manjubala, I.; Narendrakumar, U. Thermal and morphological study of graphene based polyurethane composites. Mater. Today Proc. 2019, 45, 3982–3985. [Google Scholar] [CrossRef]
- Charmi, J.; Nosrati, H.; Mostafavi Amjad, J.; Mohammadkhani, R.; Danafar, H. Polyethylene glycol (PEG) decorated graphene oxide nanosheets for controlled release curcumin delivery. Heliyon 2019, 5, e01466. [Google Scholar] [CrossRef] [PubMed] [Green Version]
- Roopaa, T.S.; Narasimha Murthy, H.N.; Praveen Kumar, V.V.; Krishna, M. Development and Characterization of PVDF Thin Films for pressure sensors. Mater. Today Proc. 2018, 5, 21082–21090. [Google Scholar] [CrossRef]
- Jung, K.C.; Chang, S.H. Performance evaluation of smart grid fabrics comprising carbon dry fabrics and PVDF ribbon sensors for structural health monitoring. Compos. Part B Eng. 2019, 163, 690–701. [Google Scholar] [CrossRef]
- Lopes, A.C.; Gutiérrez, J.; Barandiarán, J.M. Direct fabrication of a 3D-shape film of polyvinylidene fluoride (PVDF) in the piezoelectric β-phase for sensor and actuator applications. Eur. Polym. J. 2018, 99, 111–116. [Google Scholar] [CrossRef]
- Yin, Z.; Sun, S.; Salim, T.; Wu, S.; Huang, X.; He, Q.; Lam, Y.M.; Zhang, H. Organic photovoltaic devices using highly flexible reduced graphene oxide films as transparent electrodes. ACS Nano 2010, 4, 5263–5268. [Google Scholar] [CrossRef] [PubMed]
- Shi, W.; Zhu, J.; Sim, D.H.; Tay, Y.Y.; Lu, Z.; Zhang, X.; Sharma, Y.; Srinivasan, M.; Zhang, H.; Hng, H.H.; et al. Achieving high specific charge capacitances in Fe3O 4/reduced graphene oxide nanocomposites. J. Mater. Chem. 2011, 21, 3422–3427. [Google Scholar] [CrossRef]
- Zhu, J.; Zhu, T.; Zhou, X.; Zhang, Y.; Lou, X.W.; Chen, X.; Zhang, H.; Hng, H.H.; Yan, Q. Facile synthesis of metal oxide/reduced graphene oxide hybrids with high lithium storage capacity and stable cyclability. Nanoscale 2011, 3, 1084–1089. [Google Scholar] [CrossRef] [PubMed]
- Ramanathan, T.; Abdala, A.A.; Stankovich, S.; Dikin, D.A.; Herrera-Alonso, M.; Piner, R.D.; Adamson, D.H.; Schniepp, H.C.; Chen, X.; Ruoff, R.S.; et al. Functionalized graphene sheets for polymer nanocomposites. Nat. Nanotechnol. 2008, 3, 327–331. [Google Scholar] [CrossRef]
- Sadeghi, F.; Sarvi, A.; Sundararaj, U. PVDF/carbonnanotubes/nanoclay composites for piezoelectric applications. Int. Polym. Process. 2014, 29, 81–87. [Google Scholar] [CrossRef]
- Gong, S.; Schwalb, W.; Wang, Y.; Chen, Y.; Tang, Y.; Si, J.; Shirinzadeh, B.; Cheng, W. A wearable and highly sensitive pressure sensor with ultrathin gold nanowires. Nat. Commun. 2014, 5, 3132. [Google Scholar] [CrossRef] [Green Version]
- Lipomi, D.J.; Vosgueritchian, M.; Tee, B.C.K.; Hellstrom, S.L.; Lee, J.A.; Fox, C.H.; Bao, Z. Skin-like pressure and strain sensors based on transparent elastic films of carbon nanotubes. Nat. Nanotechnol. 2011, 6, 788–792. [Google Scholar] [CrossRef]
- Yao, H.-B.; Ge, J.; Wang, C.F.; Wang, X.; Hu, W.; Zheng, Z.J.; Ni, Y.; Yu, S.H. A flexible and highly pressure-sensitive graphene-polyurethane sponge based on fractured microstructure design. Adv. Mater. 2013, 25, 6692–6698. [Google Scholar] [CrossRef]
- Kim, K.K.; Hong, S.; Cho, H.M.; Lee, J.; Suh, Y.D.; Ham, J.; Ko, S.H. Highly Sensitive and Stretchable Multidimensional Strain Sensor with Prestrained Anisotropic Metal Nanowire Percolation Networks. Nano Lett. 2015, 15, 5240–5247. [Google Scholar] [CrossRef]
- Guo, H.; Liu, J.; Wang, Q.; Liu, M.; Du, C.; Li, B.; Feng, L. High thermal conductive poly(vinylidene fluoride)-based composites with well-dispersed carbon nanotubes/graphene three-dimensional network structure via reduced interfacial thermal resistance. Compos. Sci. Technol. 2019, 181, 107713. [Google Scholar] [CrossRef]
- Thayumanavan, N.; Tambe, P.; Joshi, G.; Shukla, M. Effect of sodium alginate modification of graphene (by ‘anion-π’ type of interaction) on the mechanical and thermal properties of polyvinyl alcohol (PVA) nanocomposites. Compos. Interfaces 2014, 21, 487–506. [Google Scholar] [CrossRef]
- Shehzad, F.; Daud, M.; Al-Harthi, M.A. Synthesis, characterization and crystallization kinetics of nanocomposites prepared by in situ polymerization of ethylene and graphene. J. Therm. Anal. Calorim. 2016, 123, 1501–1511. [Google Scholar] [CrossRef]
- Jabbarzadeh, A. The Origins of Enhanced and Retarded Crystallization in Nanocomposite Polymers. Nanomaterials 2019, 9, 1472. [Google Scholar] [CrossRef] [Green Version]
- Cheng, S.; Chen, X.; Hsuan, Y.G.; Li, C.Y. Reduced Graphene Oxide-Induced Polyethylene Crystallization in Solution and Nanocomposites. Macromolecules 2012, 45, 993–1000. [Google Scholar] [CrossRef]
- Shehzad, F.; Al-Harthi, M.A. Graphite-LDH hybrid supported zirconocene for ethylene polymerization: Influence of the support on the crystallization kinetics and thermal stability of polyethylene. Appl. Clay Sci. 2021, 202, 105947. [Google Scholar] [CrossRef]
- Zhao, S.; Zhang, G.; Gao, Y.; Deng, L.; Li, J.; Sun, R.; Wong, C.P. Strain-driven and ultrasensitive resistive sensor/switch based on conductive alginate/nitrogen-doped carbon-nanotube-supported Ag hybrid aerogels with pyramid design. ACS Appl. Mater. Interfaces 2014, 6, 22823–22829. [Google Scholar] [CrossRef] [PubMed]
- Park, J.W.; Jang, J. Fabrication of graphene/free-standing nanofibrillar PEDOT/P(VDF-HFP) hybrid device for wearable and sensitive electronic skin application. Carbon 2016, 87, 275–281. [Google Scholar] [CrossRef]
- Yan, C.; Wang, J.; Kang, W.; Cui, M.; Wang, X.; Foo, C.Y.; Chee, K.J.; Lee, P.S. Highly stretchable piezoresistive graphene–nano cellulose nano paper for strain sensors. Adv. Mater 2014, 26, 2022–2027. [Google Scholar] [CrossRef]
- Wu, D.; Huang, S.; Xiao, Z.; Yu, L.; Wang, L.; Sun, D.; Lin, L. Poly (vinylidene fluoride) piezoelectric nanofibers fabricated by non-uniform field electrospinning. Int. J. Nanomanuf. 2015, 11, 297–310. [Google Scholar] [CrossRef]
- Stassi, S.; Cauda, V.; Canavese, G.; Pirri, C.F. Flexible tactile sensing based on piezoresistive composites: A review. Sensors 2014, 14, 5296–5332. [Google Scholar] [CrossRef] [Green Version]
- El Achaby, M.; Arrakhiz, F.Z.; Vaudreuil, S.; Essassi, E.M.; Qaiss, A.; Bousmina, M. Preperation and chracteriztion of melt-blending graphene nanosheets-PVDF nanocomposites with enhanced properties. J. Appl. Polym. Sci. 2013, 127, 4697–4707. [Google Scholar] [CrossRef]
- Her, S.C.; Lin, K.Y. Dynamic mechanical analysis of carbon nanotube-reinforced nanocomposites. J. Appl. Biomater. Funct. Mater. 2017, 15, S13–S18. [Google Scholar] [CrossRef] [PubMed] [Green Version]
- Bhawal, P.; Ganguly, S.; Chaki, T.K.; Das, N.C. Synthesis and characterization of graphene oxide filled ethylene methyl acrylate hybrid nanocomposites. RSC Adv. 2016, 6, 20781–20790. [Google Scholar] [CrossRef]
- Bhandari, S.; Rahaman, M. Thermal properties of polymer-graphene composites. In Polymer Nanocomposites Containing Graphene; Elsevier: Amsterdam, The Netherlands, 2022; pp. 163–181. [Google Scholar]
- Jyoti, J.; Babal, A.S.; Sharma, S.; Dhakate, S.R.; Singh, B.P. Significant improvement in static and dynamic mechanical properties of graphene oxide–carbon nanotube acrylonitrile butadiene styrene hybrid composites. J. Mater. Sci. 2018, 53, 2520–2536. [Google Scholar] [CrossRef]
- Tang, L.-C.; Wan, Y.-J.; Yan, D.; Pei, Y.-B.; Zhao, L.; Li, Y.-B.; Wu, L.-B.; Jiang, J.-X.; Lai, G.-Q. The effect of graphene dispersion on the mechanical properties of graphene/epoxy composites. Carbon 2013, 60, 16–27. [Google Scholar] [CrossRef]
- Monti, M.; Rallini, M.; Puglia, D.; Peponi, L.; Torre, L.; Kenny, J.M. Morphology and electrical properties of graphene-epoxy nanocomposites obtained by different solvent assisted processing methods. Compos. Part A Appl. Sci. Manuf. 2013, 46, 166–172. [Google Scholar] [CrossRef]
- Wang, J.; Jin, Y.; Wang, C.; Wang, Y.; Han, Z. Electrical conductivity, dielectric permittivity and dynamic mechanical properties of graphene/epoxy nanocomposites. Dig. J. Nanomater. Biostruct. 2018, 13, 959–967. [Google Scholar]
- Elimat, Z.M. AC-impedance and dielectric properties of hybrid polymer composites. J. Compos. Mater. 2015, 49, 3–15. [Google Scholar] [CrossRef]
- Kara, O.A.M.A.H. In chineses. Pap. Knowl. Towar. Media Hist. Doc. 2014, 7, 107–115. [Google Scholar]
- Lv, R.; Ren, Y.; Guo, H.; Bai, S. Recent progress on thermal conductivity of graphene filled epoxy composites. Nano Mater. Sci. 2021, in press. [Google Scholar] [CrossRef]
- Li, A.; Zhang, C.; Zhang, Y.-F. Thermal Conductivity of Graphene-Polymer Composites: Mechanisms, Properties, and Applications. Polymers 2017, 9, 437. [Google Scholar] [CrossRef] [PubMed] [Green Version]
- Xia, J.; Qin, Y.; Wei, X.; Li, L.; Li, M.; Kong, X.; Xiong, S.; Cai, T.; Dai, W.; Lin, C.-T.; et al. Enhanced Thermal Conductivity of Polymer Composite by Adding Fishbone-like Silicon Carbide. Nanomaterials 2021, 11, 2891. [Google Scholar] [CrossRef] [PubMed]
- Layek, R.K.; Nandi, A.K. Physical and mechanical properties of Poly(methyl methacrylate) functionalized graphene/PVDF nanocomposites: Piezoelectric Β polymorph formation. Polymer 2010, 51, 5846. [Google Scholar] [CrossRef]
- Chen, K.; Susner, M.A.; Vyazovkin, S. Effect of the brush structure on the degradation mechanism of polystyrene-clay nanocomposites. Macromol. Rapid Commun. 2005, 26, 690–695. [Google Scholar] [CrossRef]
- Chen, K.; Wilkie, C.A.; Vyazovkin, S. Nanoconfinement revealed in degradation and relaxation studies of two structurally different polystyrene-clay systems. J. Phys. Chem. B 2007, 111, 12685–12692. [Google Scholar] [CrossRef]
- Zhang, F.; Li, Q.; Liu, Y.; Zhang, S.; Wu, C.; Guo, W. Improved thermal conductivity of polycarbonate composites filled with hybrid exfoliated graphite/multi-walled carbon nanotube fillers. J. Therm. Anal. Calorim. 2016, 123, 431–437. [Google Scholar] [CrossRef]
- Yu, J.; Huang, X.; Wu, C.; Jiang, P. Permittivity, thermal conductivity and thermal stability of poly(vinylidene fluoride)/graphene nanocomposites. IEEE Trans. Dielectr. Electr. Insul. 2011, 18, 478–484. [Google Scholar] [CrossRef]
- Patnaik, A.; Abdula, M.; Biswas, S.; Satapathy, A. Thermal conductivity of particulate filled polymer composites. J. Appl. Polym. Sci. 2003, 17, 3819–3820. [Google Scholar]
- Weber, E.; Clingerman, M.; King, J. Thermally conductive nylon 6,6 and polycarbonate-based resins. I. Synergistic effects of carbon fillers. J. Appl. Polym. Sci. 2003, 88, 112–122. [Google Scholar] [CrossRef]
- Keblinski, P.; Phillpot, S.R.; Choi, S.U.S.; Eastman, J.A. Mechanics of heat flow in suspensions of nano-sized particles (nanofluids). Int. J. Heat Mass Transf. 2002, 45, 855–863. [Google Scholar] [CrossRef]
- Jang, J.W.; Min, B.G.; Yeum, J.H.; Jeong, Y.G. Structures and physical properties of graphene/PVDF nanocomposite films prepared by solution-mixing and melt-compression. Fibers Polym. 2013, 14, 1332–1338. [Google Scholar] [CrossRef]
- Indolia, A.P.; Gaur, M.S. Investigation of structural and thermal characteristics of PVDF/ZnO nanocomposites. J. Therm. Anal. Calorim. 2013, 113, 821–830. [Google Scholar] [CrossRef]
- Huang, E.-Q.; Zhao, J.; Zha, J.-W.; Zhang, L.; Liao, R.-J.; Dang, Z.-M. Preparation and wide-frequency dielectric properties of (Ba0.5Sr0.4Ca0.1)TiO3/poly(vinylidene fluoride) composites. J. Appl. Phys. 2014, 115, 194102. [Google Scholar] [CrossRef]
- Bormashenko, Y.; Pogreb, R.; Stanevsky, O.; Bormashenko, E. Vibrational spectrum of PVDF and its interpretation. Polym. Test. 2004, 23, 791–796. [Google Scholar] [CrossRef]
- Gregorio, R., Jr.; Capitao, R.C. Morphology and phase transformation of high melt temperature crystalized PVDF. J. Mater. Sci. 2000, 35, 299–306. [Google Scholar] [CrossRef]
- Salimi, A.; Yousefi, A.A. FTIR studies of β-phase crystal formation in stretched PVDF films. Polym. Test. 2003, 22, 699–704. [Google Scholar] [CrossRef]
- Boccaccio, T.; Bottino, A.; Capannelli, G.; Piaggio, P. Characterization of PVDF membranes by vibrational spectroscopy. J. Membr. Sci. 2002, 210, 315–329. [Google Scholar] [CrossRef]
- Li, J.C.; Wang, C.L.; Zhong, W.L.; Zhang, P.L.; Wang, Q.H.; Webb, J.F. Vibrational mode analysis of β-phase poly(vinylidene fluoride). Appl. Phys. Lett. 2002, 81, 2223–2225. [Google Scholar] [CrossRef]
- Wang, C.L.; Li, J.C.; Zhong, W.L.; Zhang, P.L.; Wang, Q.H. IR vibrational modes of PVDF chains. Synth. Met. 2003, 135–136, 469–470. [Google Scholar] [CrossRef]
- Ma, W.; Zhang, J.; Wang, X. Effect of Initial Polymer Concentration on the Crystallization of Poly (Vinylidene Fluoride)/Poly (Methyl Methacrylate) Blend from Solution Casting. J. Macromol. Sci. Part B 2007, 47, 139–149. [Google Scholar] [CrossRef]
- Crist, B.; Schultz, J.M. Polymer spherulites: A critical review. Prog. Polym. Sci. 2016, 56, 1–63. [Google Scholar] [CrossRef]


| Sl. No | Sample Name | Composition | Preparation Method | Sl No | Sample Name | Composition | Preparation Method |
|---|---|---|---|---|---|---|---|
| 1 | MDF-1 | Virgin PVDF | Melt mixing | 5 | SDF-1 | Virgin PVDF | Sol. casting |
| 2 | MDFG-0.5 | PVDF + 0.5% graphene | Melt mixing | 6 | SDFG-0.5 | PVDF + 0.5% graphene | Sol. casting |
| 3 | MDFG-0.2 | PVDF + 2% graphene | Melt mixing | 7 | SDFG-2 | PVDF + 2% graphene | Sol. casting |
| 4 | MDFG-5 | PVDF + 5% graphene | Melt mixing | 8 | SDFG-5 | PVDF + 5% graphene | Sol. casting |
| Sl. No | Sample Name | Tc onset Temp °C | Tc Peak Temp °C | Xc% | Hc (J/g) | Sample Name | Onset Temp °C | Peak Temp | Xc% | ΔHc (J/g) |
|---|---|---|---|---|---|---|---|---|---|---|
| 1 | MDF-1 | 150.38 | 158.77 | 49.96 | 52.46 | SDF-1 | 150.88 | 156.46 | 53.38 | 56.05 |
| 2 | MDFG-0.5 | 150.61 | 159.46 | 58.14 | 60.05 | SDFG-0.5 | 149.44 | 158.70 | 58.81 | 60.70 |
| 3 | MDFG-2.0 | 150.30 | 159.78 | 48.98 | 51.43 | SDFG-2.0 | 150.05 | 157.94 | 60.61 | 53.14 |
| 4 | MDFG-5.0 | 150.55 | 159.41 | 68.54 | 68.54 | SDFG-5.0 | 150.93 | 159.27 | 57.59 | 60.47 |
| Sl. No | Sample Name | Tdegrad onset Temp °C | Tdegrad Peak Temp °C | Residue wt% | Sample Name | Tdegrad onset Temp °C | Tdegrad Peak Temp °C | Residue wt% |
|---|---|---|---|---|---|---|---|---|
| 1 | MDF-1 | 425 | 484.79 | 21 | SDF-1S | 432 | 485.04 | 23 |
| 2 | MDFG-0.5 | 423 | 485.31 | 20 | SDFG-0.5 | 433 | 467.74 | 28 |
| 3 | MDFG-2.0 | 427 | 483.08 | 22 | SDFG-2.0 | 440 | 479.25 | 22 |
| 4 | MDFG-5.0 | 429 | 476.57 | 30 | SDFG-5.0 | 437 | 469.87 | 20 |
| Sl. No | Sample Name | Average Temp °C | Av. Conductivity (W/m∙K) | Sl No | Sample Name | Average Temp °C | Av. Conductivity (W/m∙K) |
|---|---|---|---|---|---|---|---|
| 1 | MDF-1 | 22.5 | 0.184 | 5 | SDF-1 | 22.5 | - |
| 32.5 | 0.184 | 32.5 | - | ||||
| 42.5 | 0.183 | 42.5 | - | ||||
| 2 | MDFG-0.5 | 22.7 | 0.157 | 6 | SDFG-0.5 | 22.7 | - |
| 32.5 | 0.157 | 32.5 | - | ||||
| 42.5 | 0.157 | 42.5 | - | ||||
| 3 | MDFG-0.2 | 22.5 | 0.173 | 7 | SDFG-2 | 22.5 | 0.202 |
| 32.5 | 0.173 | 32.5 | 0.204 | ||||
| 42.5 | 0.172 | 42.5 | 0.205 | ||||
| 4 | MDFG-5 | 22.5 | 0.157 | 8 | SDFG-5 | 22.5 | 0.250 |
| 32.5 | 0.159 | 32.5 | 0.252 | ||||
| 42.5 | 0.159 | 42.5 | 0.252 |
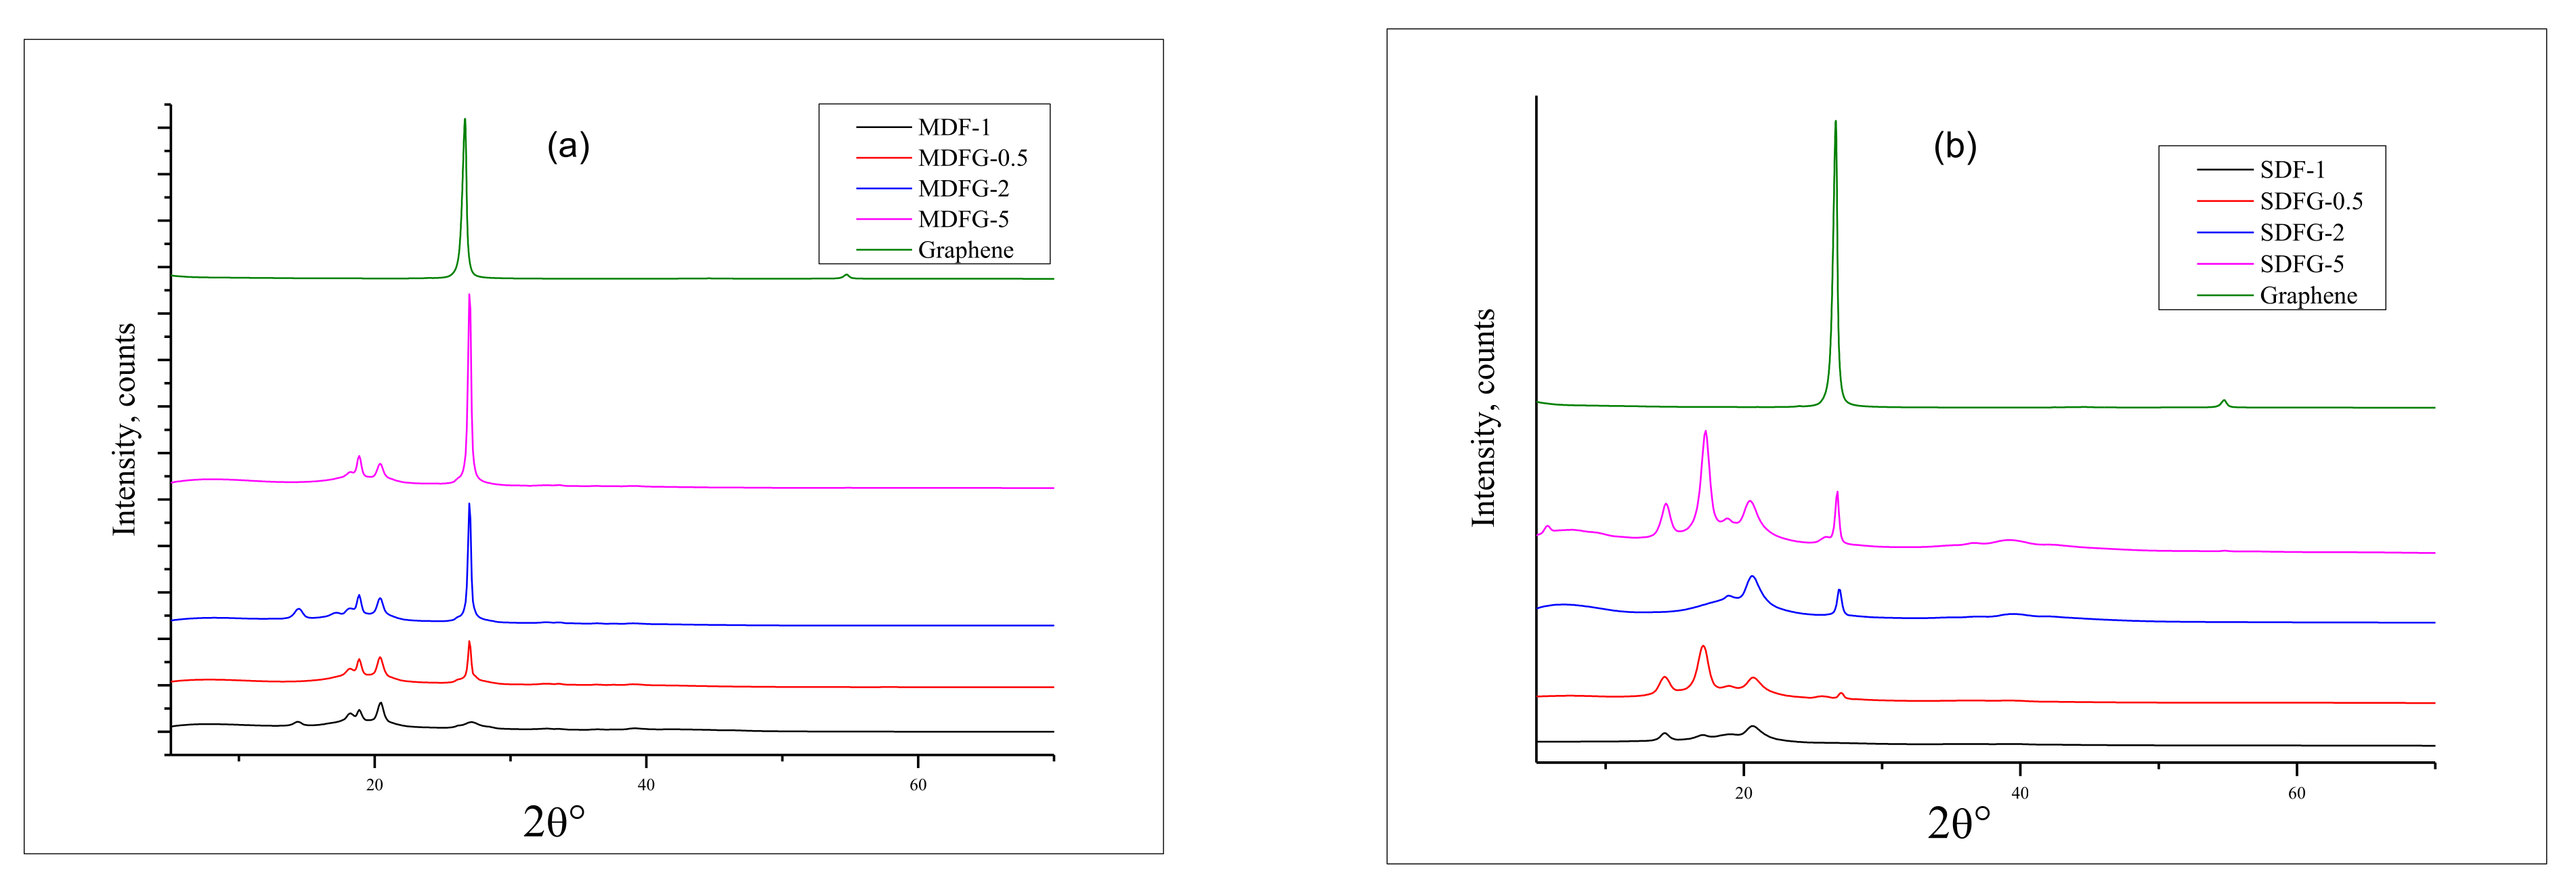
| Sl. No | Sample Name | 2 θ Angle (Degrees) | Spacing (Å) | Sl. No | Sample Name | 2 θ Angle (degrees) | Spacing (Å) |
|---|---|---|---|---|---|---|---|
| 1 | MDF-1 | 14.3 16.9 17.6 20.65 39.38 | 6.2 5.2 5.6 4.3 2.28 | 5 | SDF-1 | 14.4 16.9 17.6 20.65 39.38 | 6.2 5.2 5.0 4.29 2.28 |
| 2 | MDFG-0.5 | 18.1 18.82 20.33 26.95 39.23 | 4.89 4.7 4.36 3.30 2.29 | 6 | SDFG-0.5 | 17.0 18.8 20.7 25.75 27.02 38.22 | 5.2 4.6 4.28 3.45 3.29 2.35 |
| 3 | MDFG-0.2 | 14.4 18.5 18.84 20.39 26.96 39.26 | 6.14 4.79 4.7 4.35 3.30 2.29 | 7 | SDFG-2 | 18.94 20.5 26.9 36.67 | 4.68 4.32 3.31 2.24 |
| 4 | MDFG-5 | 14.3 18.83 20.38 26.97 39.25 | 4.88 4.7 4.35 3.3 2.29 | 8 | SDFG-5 | 14.17 18.7 20.5 26.75 36.6 | 6.15 4.9 4.33 3.4 2.45 |
Publisher’s Note: MDPI stays neutral with regard to jurisdictional claims in published maps and institutional affiliations. |
© 2022 by the authors. Licensee MDPI, Basel, Switzerland. This article is an open access article distributed under the terms and conditions of the Creative Commons Attribution (CC BY) license (https://creativecommons.org/licenses/by/4.0/).
Share and Cite
Al-Harthi, M.A.; Hussain, M. Effect of Fabrication Method on the Thermo Mechanical and Electrical Properties of Graphene Doped PVDF Nanocomposites. Nanomaterials 2022, 12, 2315. https://doi.org/10.3390/nano12132315
Al-Harthi MA, Hussain M. Effect of Fabrication Method on the Thermo Mechanical and Electrical Properties of Graphene Doped PVDF Nanocomposites. Nanomaterials. 2022; 12(13):2315. https://doi.org/10.3390/nano12132315
Chicago/Turabian StyleAl-Harthi, Mamdouh A., and Manwar Hussain. 2022. "Effect of Fabrication Method on the Thermo Mechanical and Electrical Properties of Graphene Doped PVDF Nanocomposites" Nanomaterials 12, no. 13: 2315. https://doi.org/10.3390/nano12132315