
Non-Biological Slaughterhouse Wastewater Treatment with Membrane Processes—An Opportunity for Water Recycling


Abstract
:
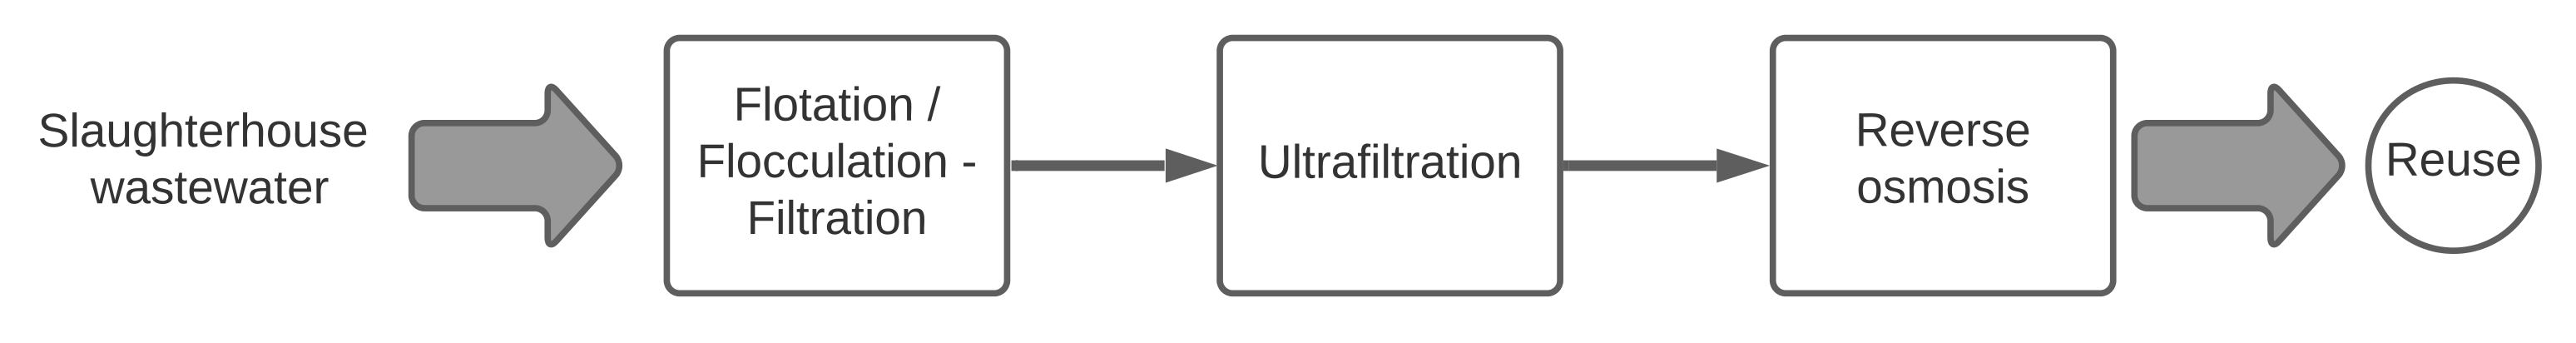
1. Introduction
2. Materials and Methods
2.1. Slaughterhouse Wastewater
2.2. Analytical Methods
2.3. Experimental Setup
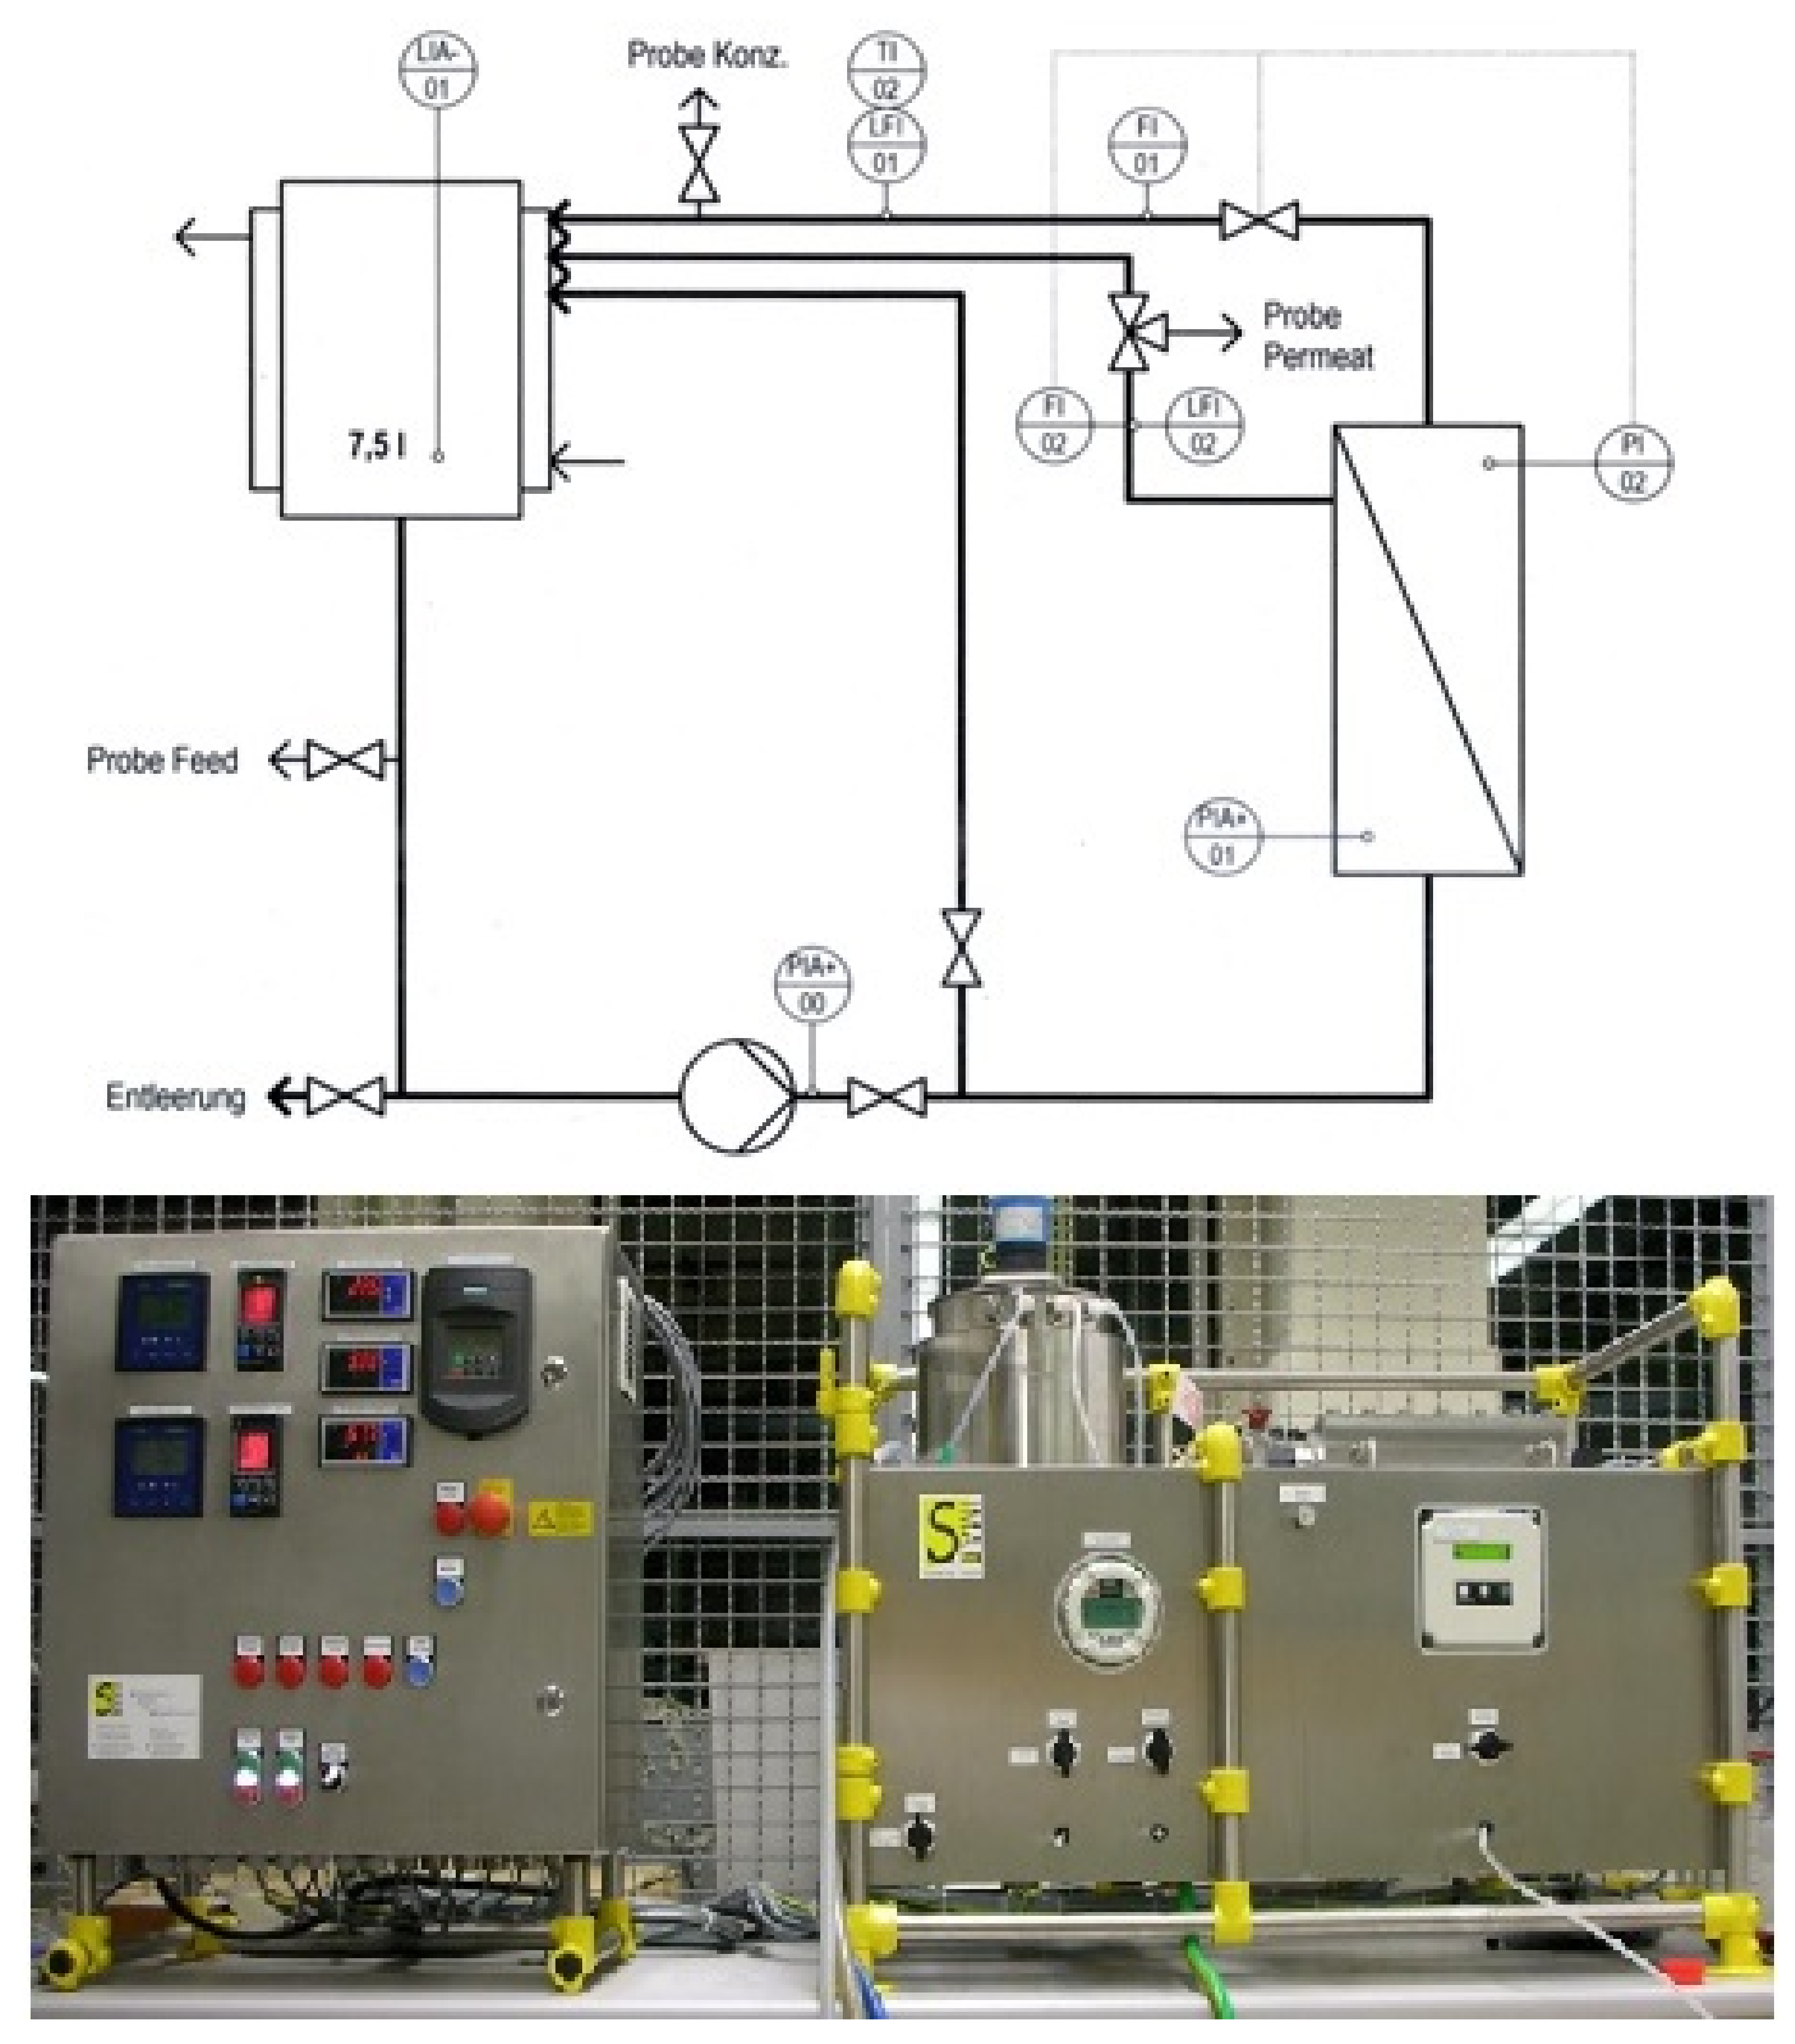
2.3.1. Ultrafiltration Small-Scale Experiments
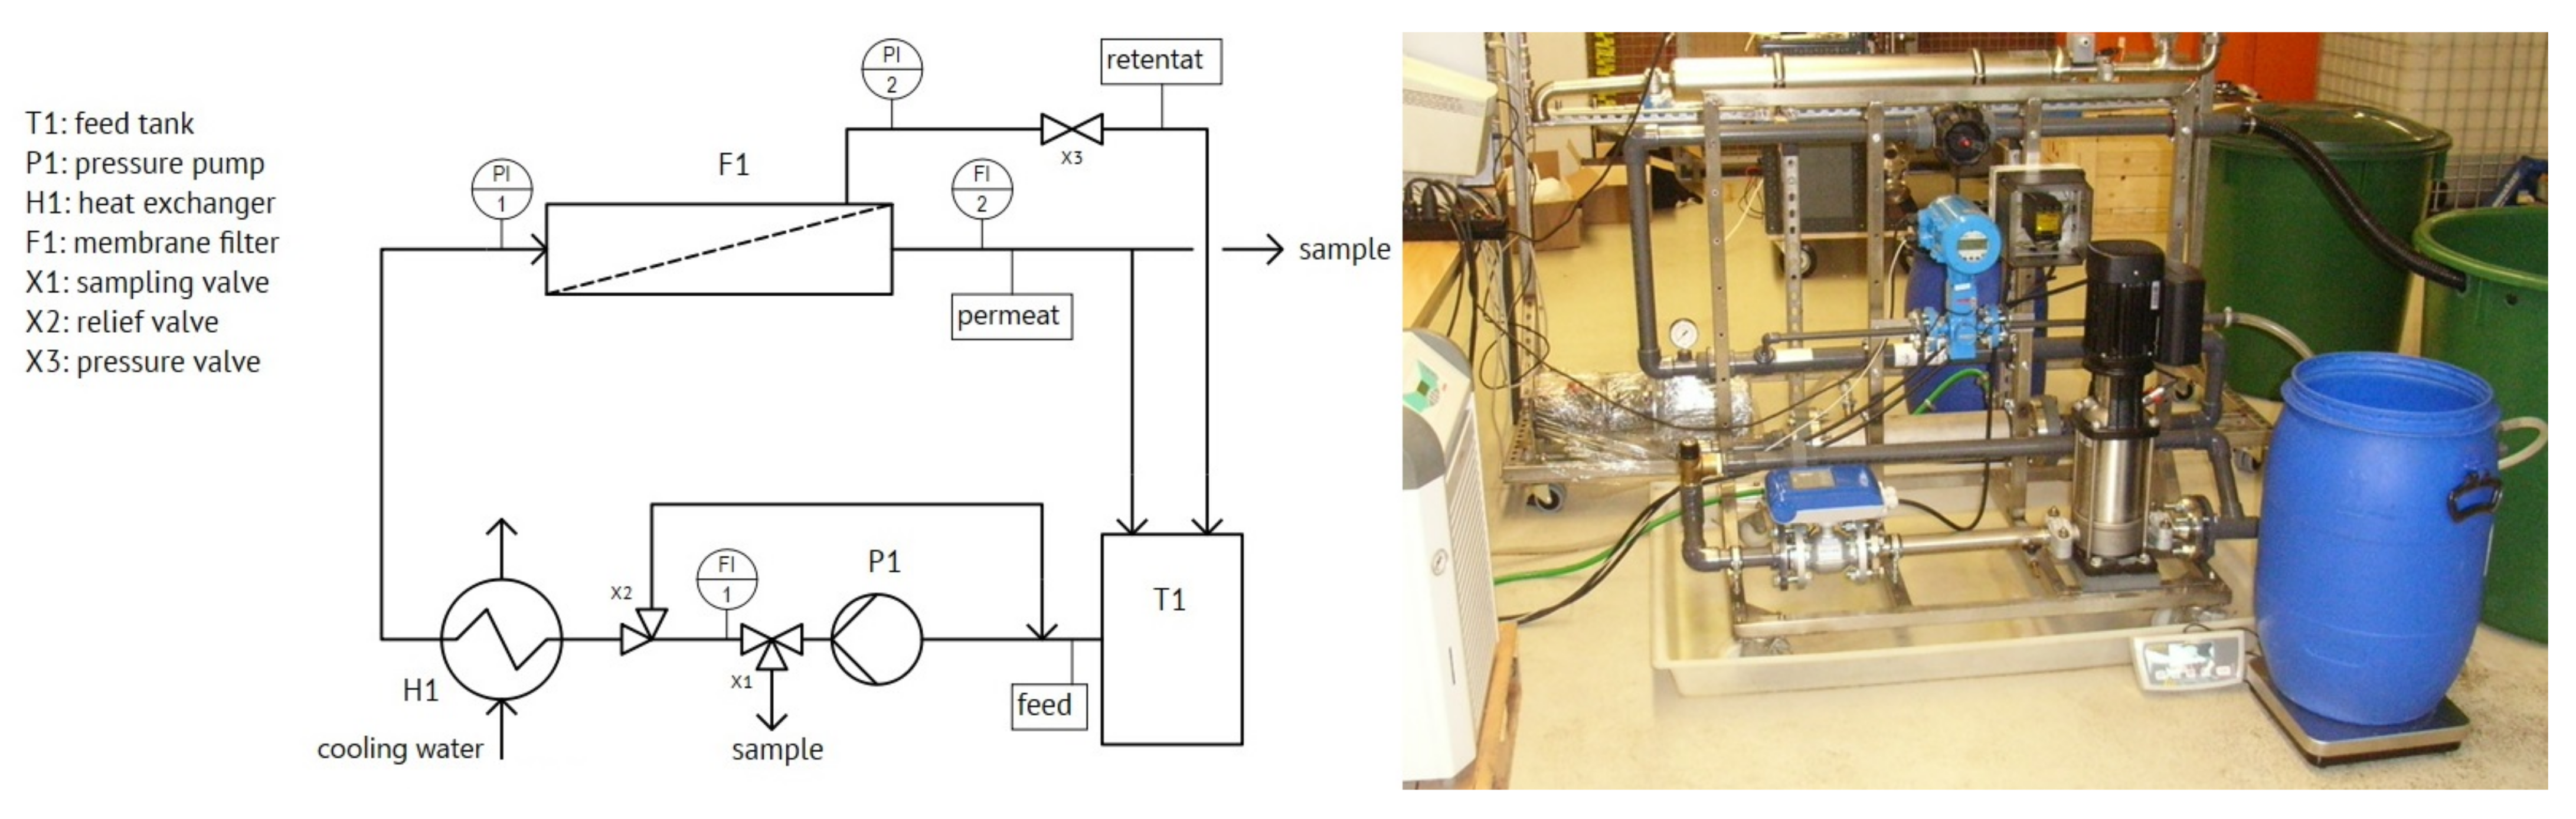
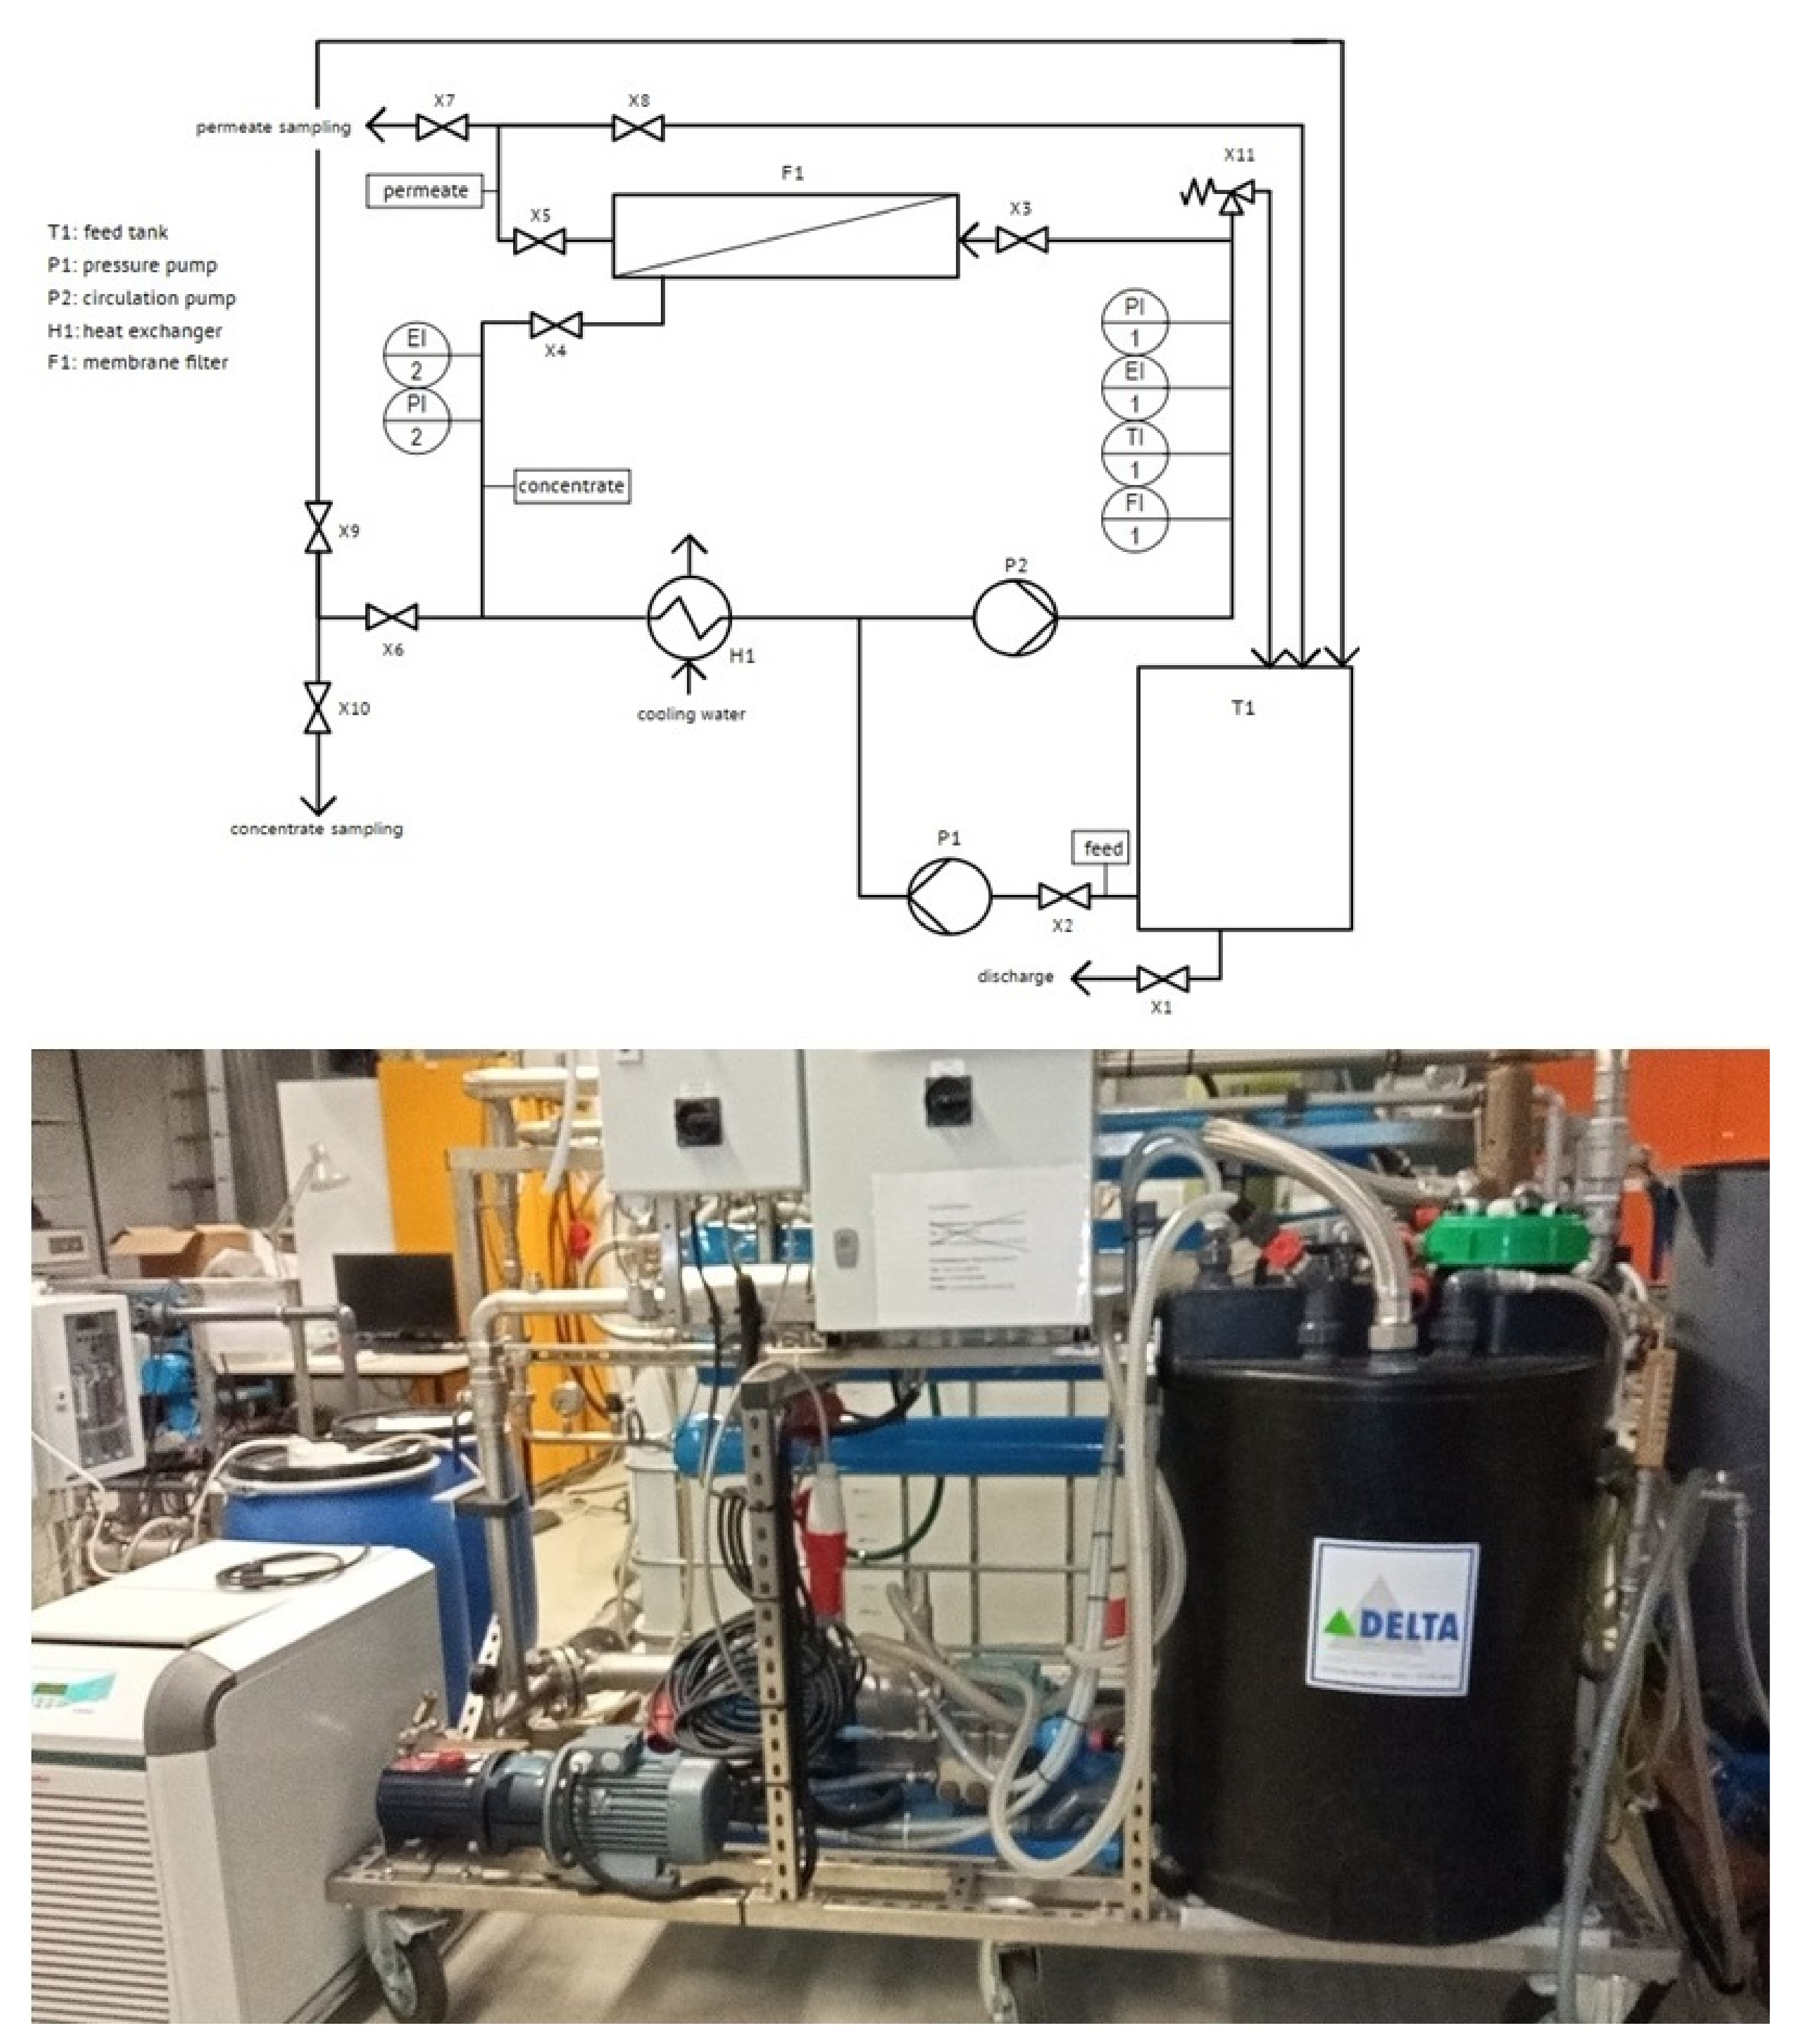
2.3.2. Ultrafiltration Bench-Scale Plant, Long-Term Experiment
2.3.3. Reverse Osmosis Small-Scale Experiments
2.3.4. Reverse Osmosis Bench-Scale Plant
3. Results and Discussions
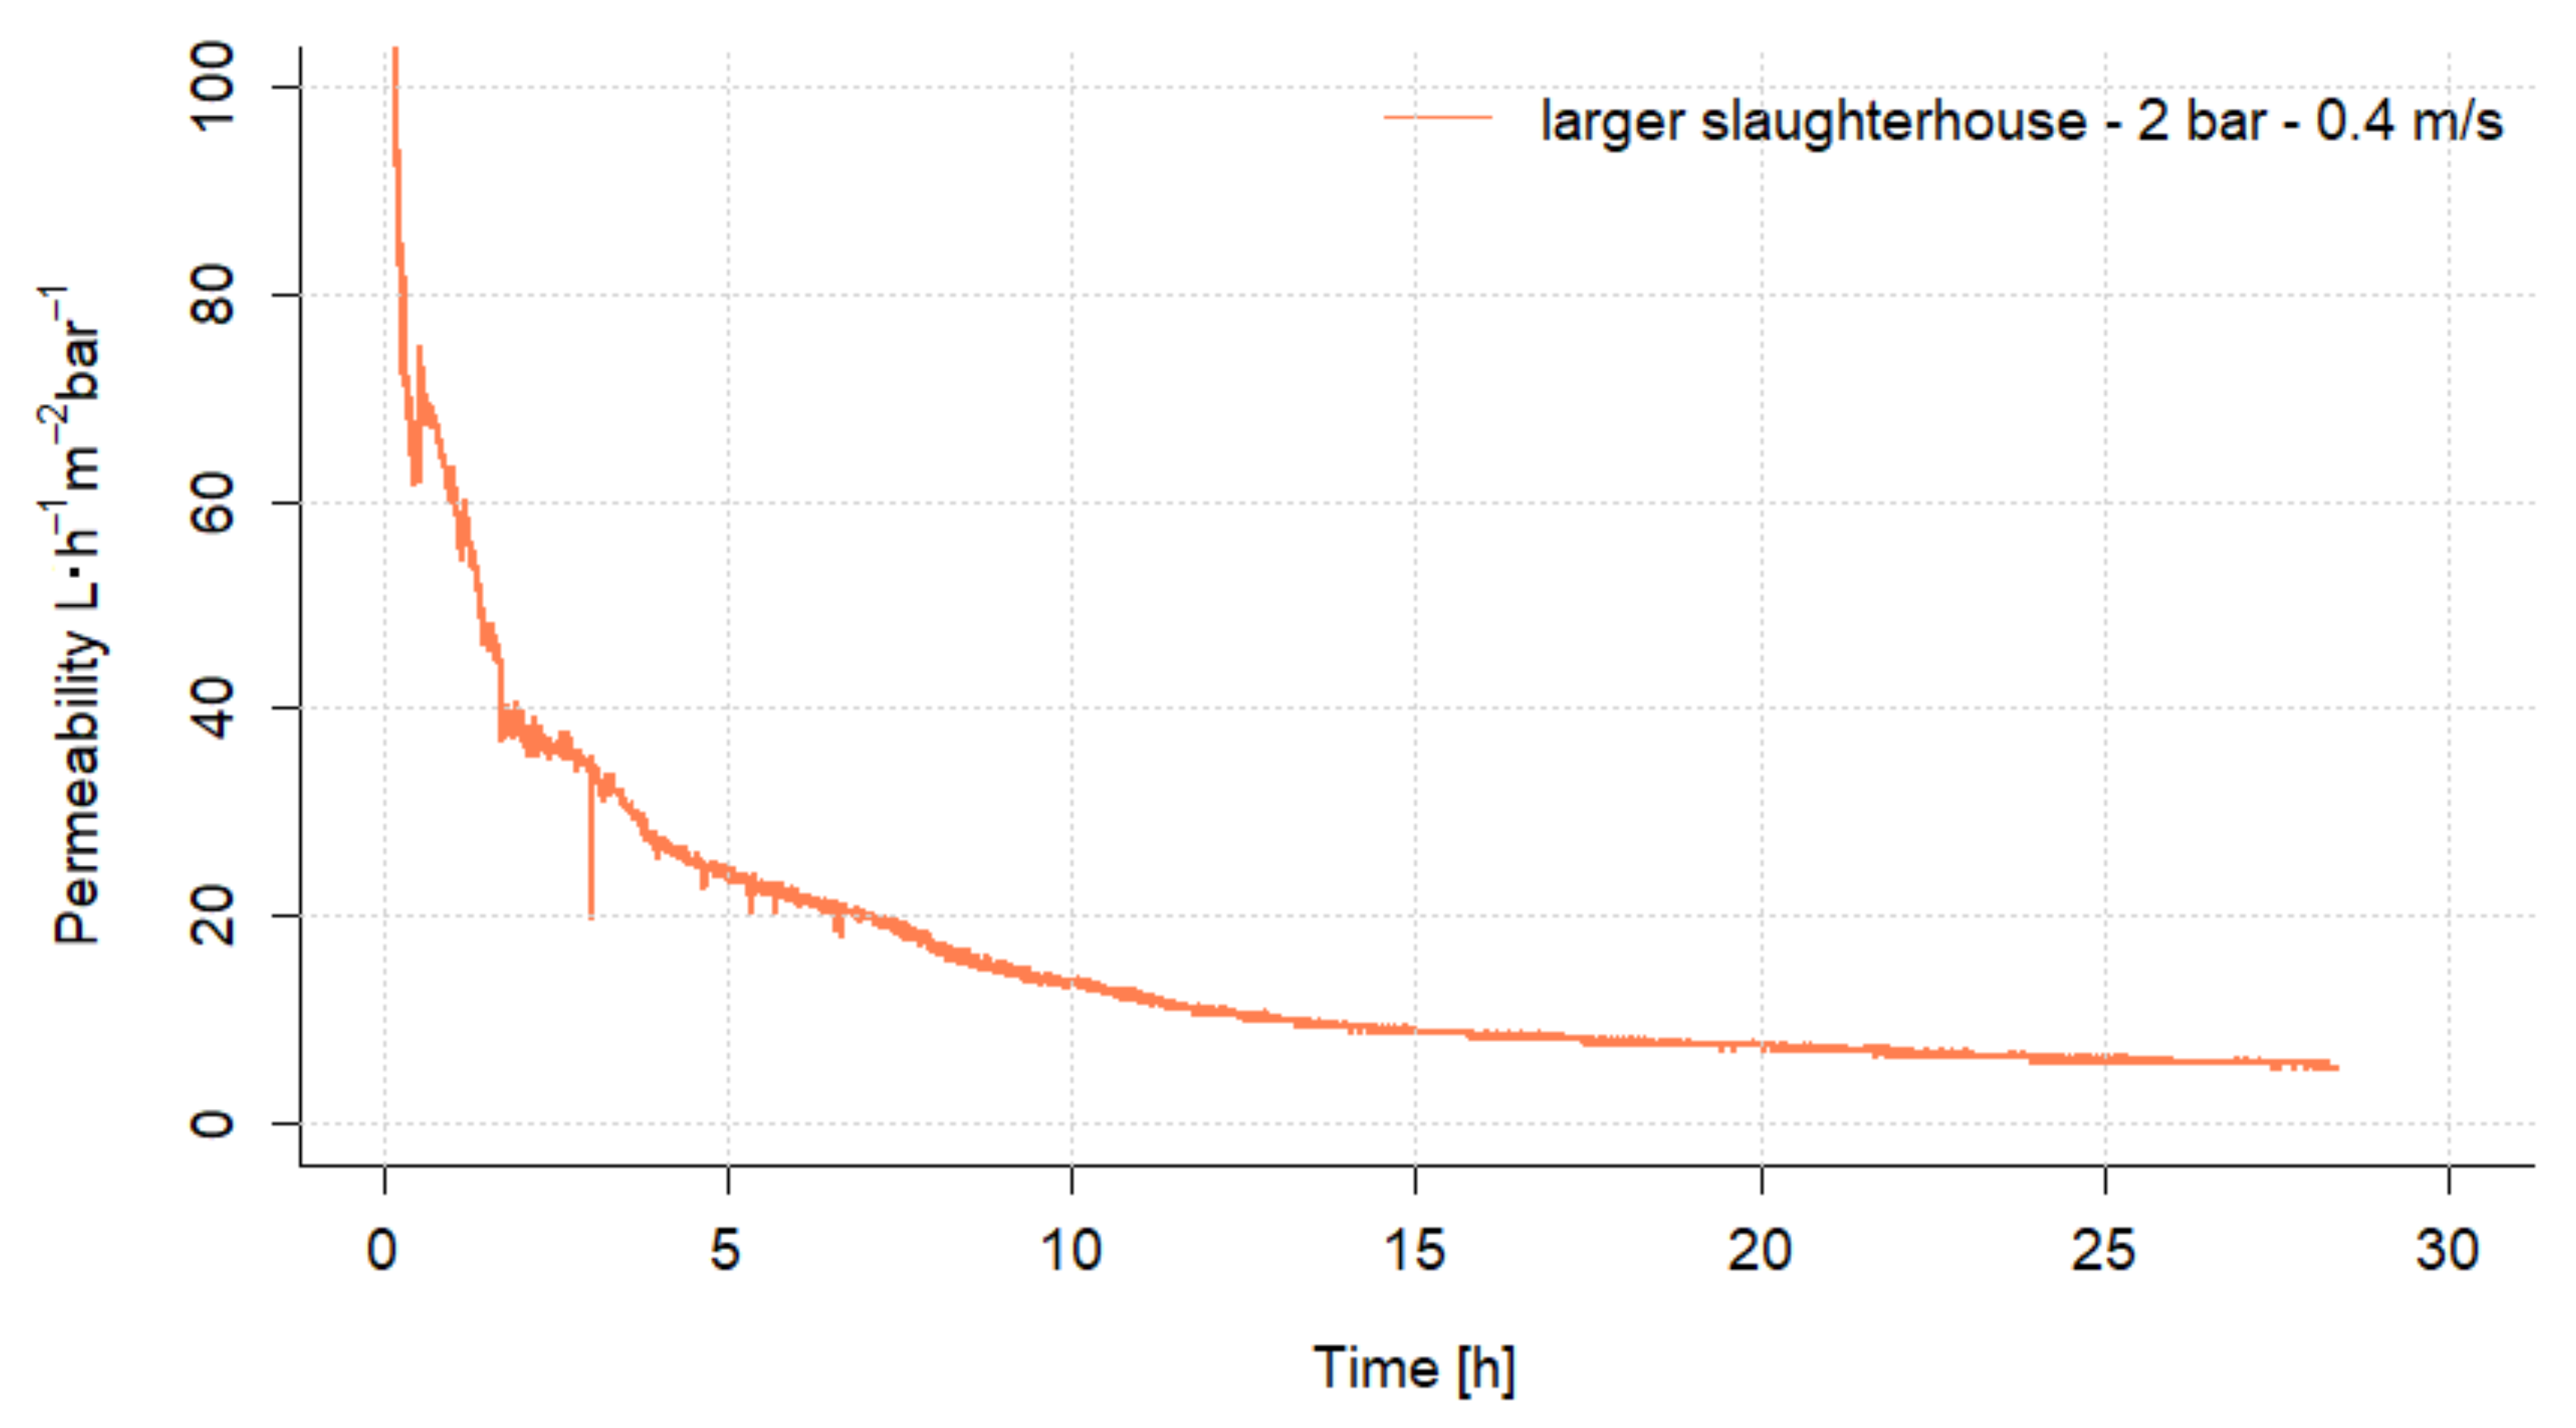
3.1. Ultrafiltration Preliminary Experiments
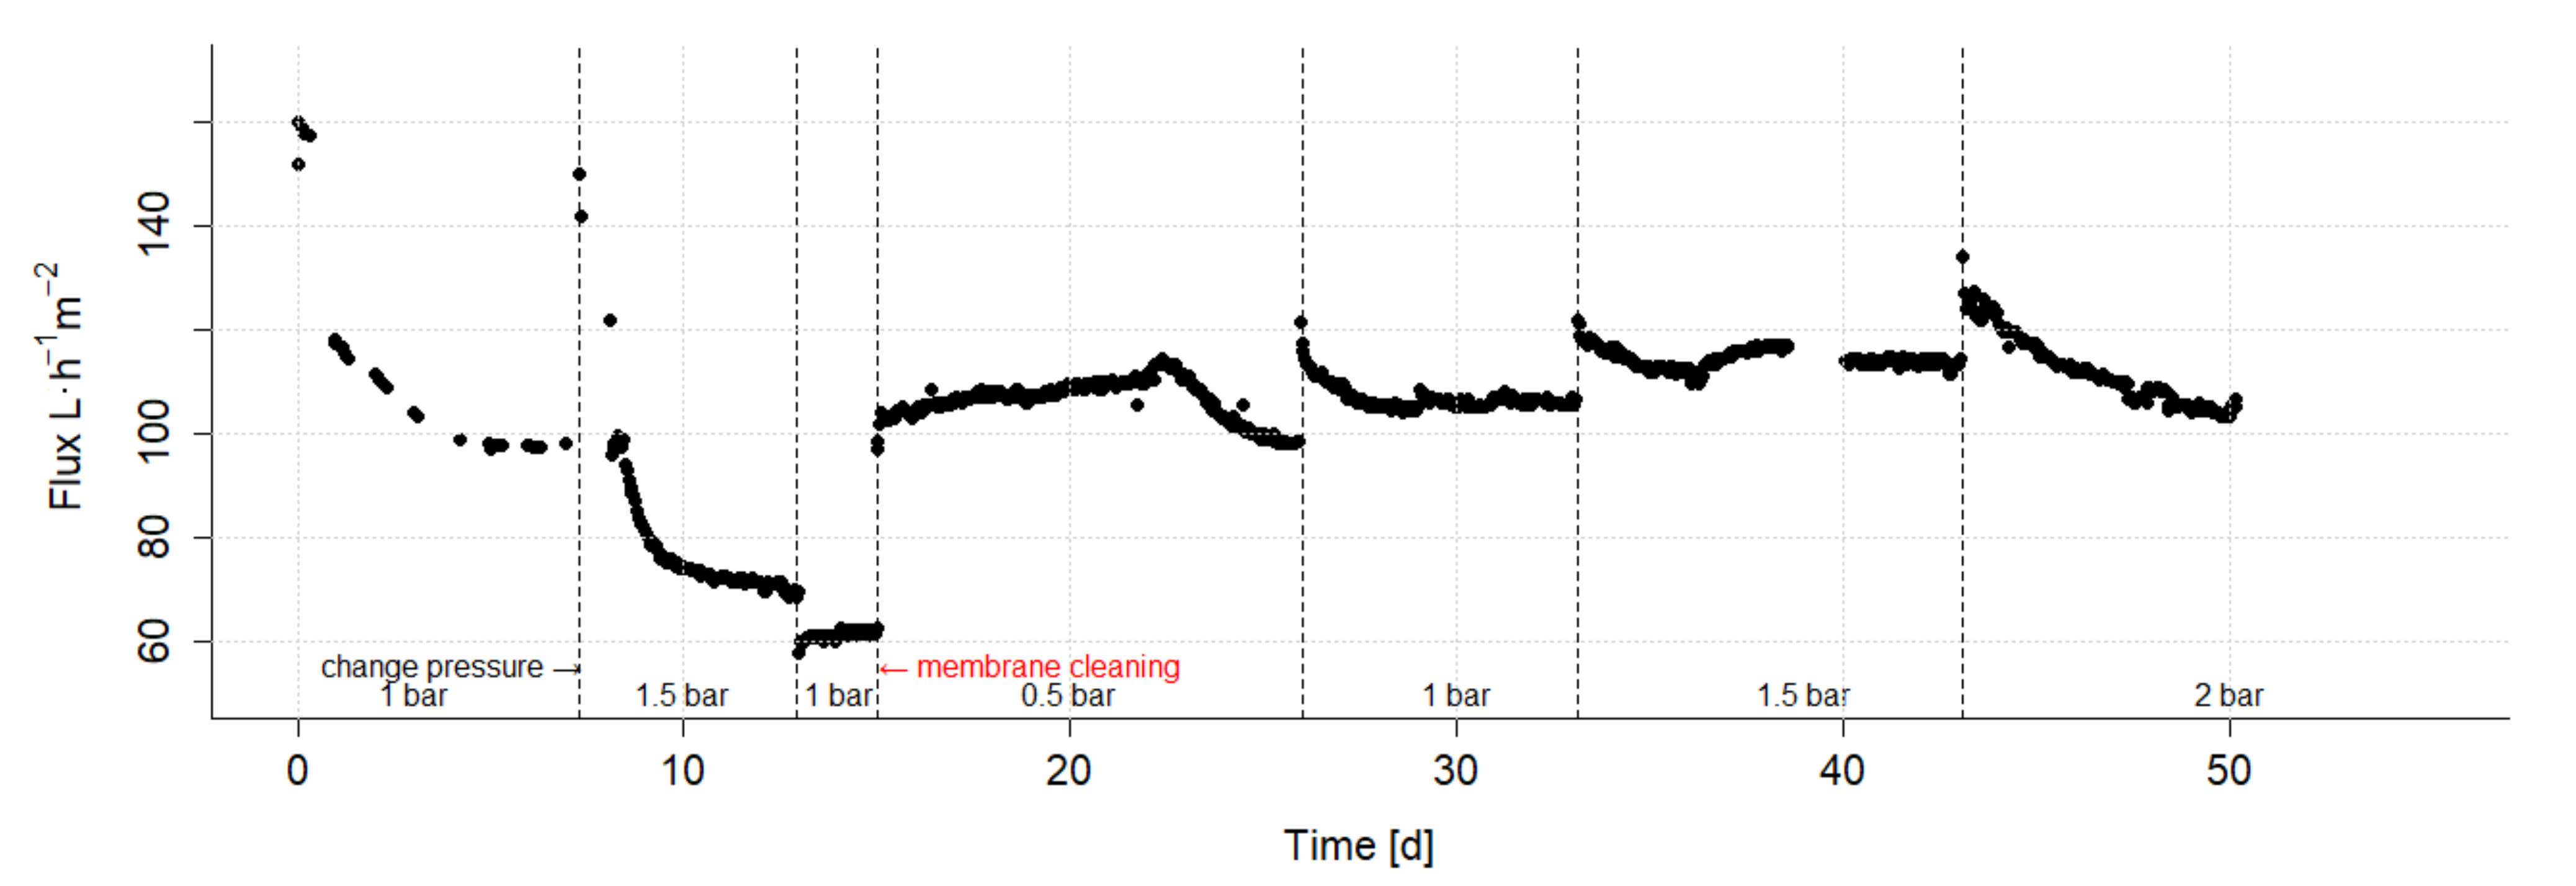
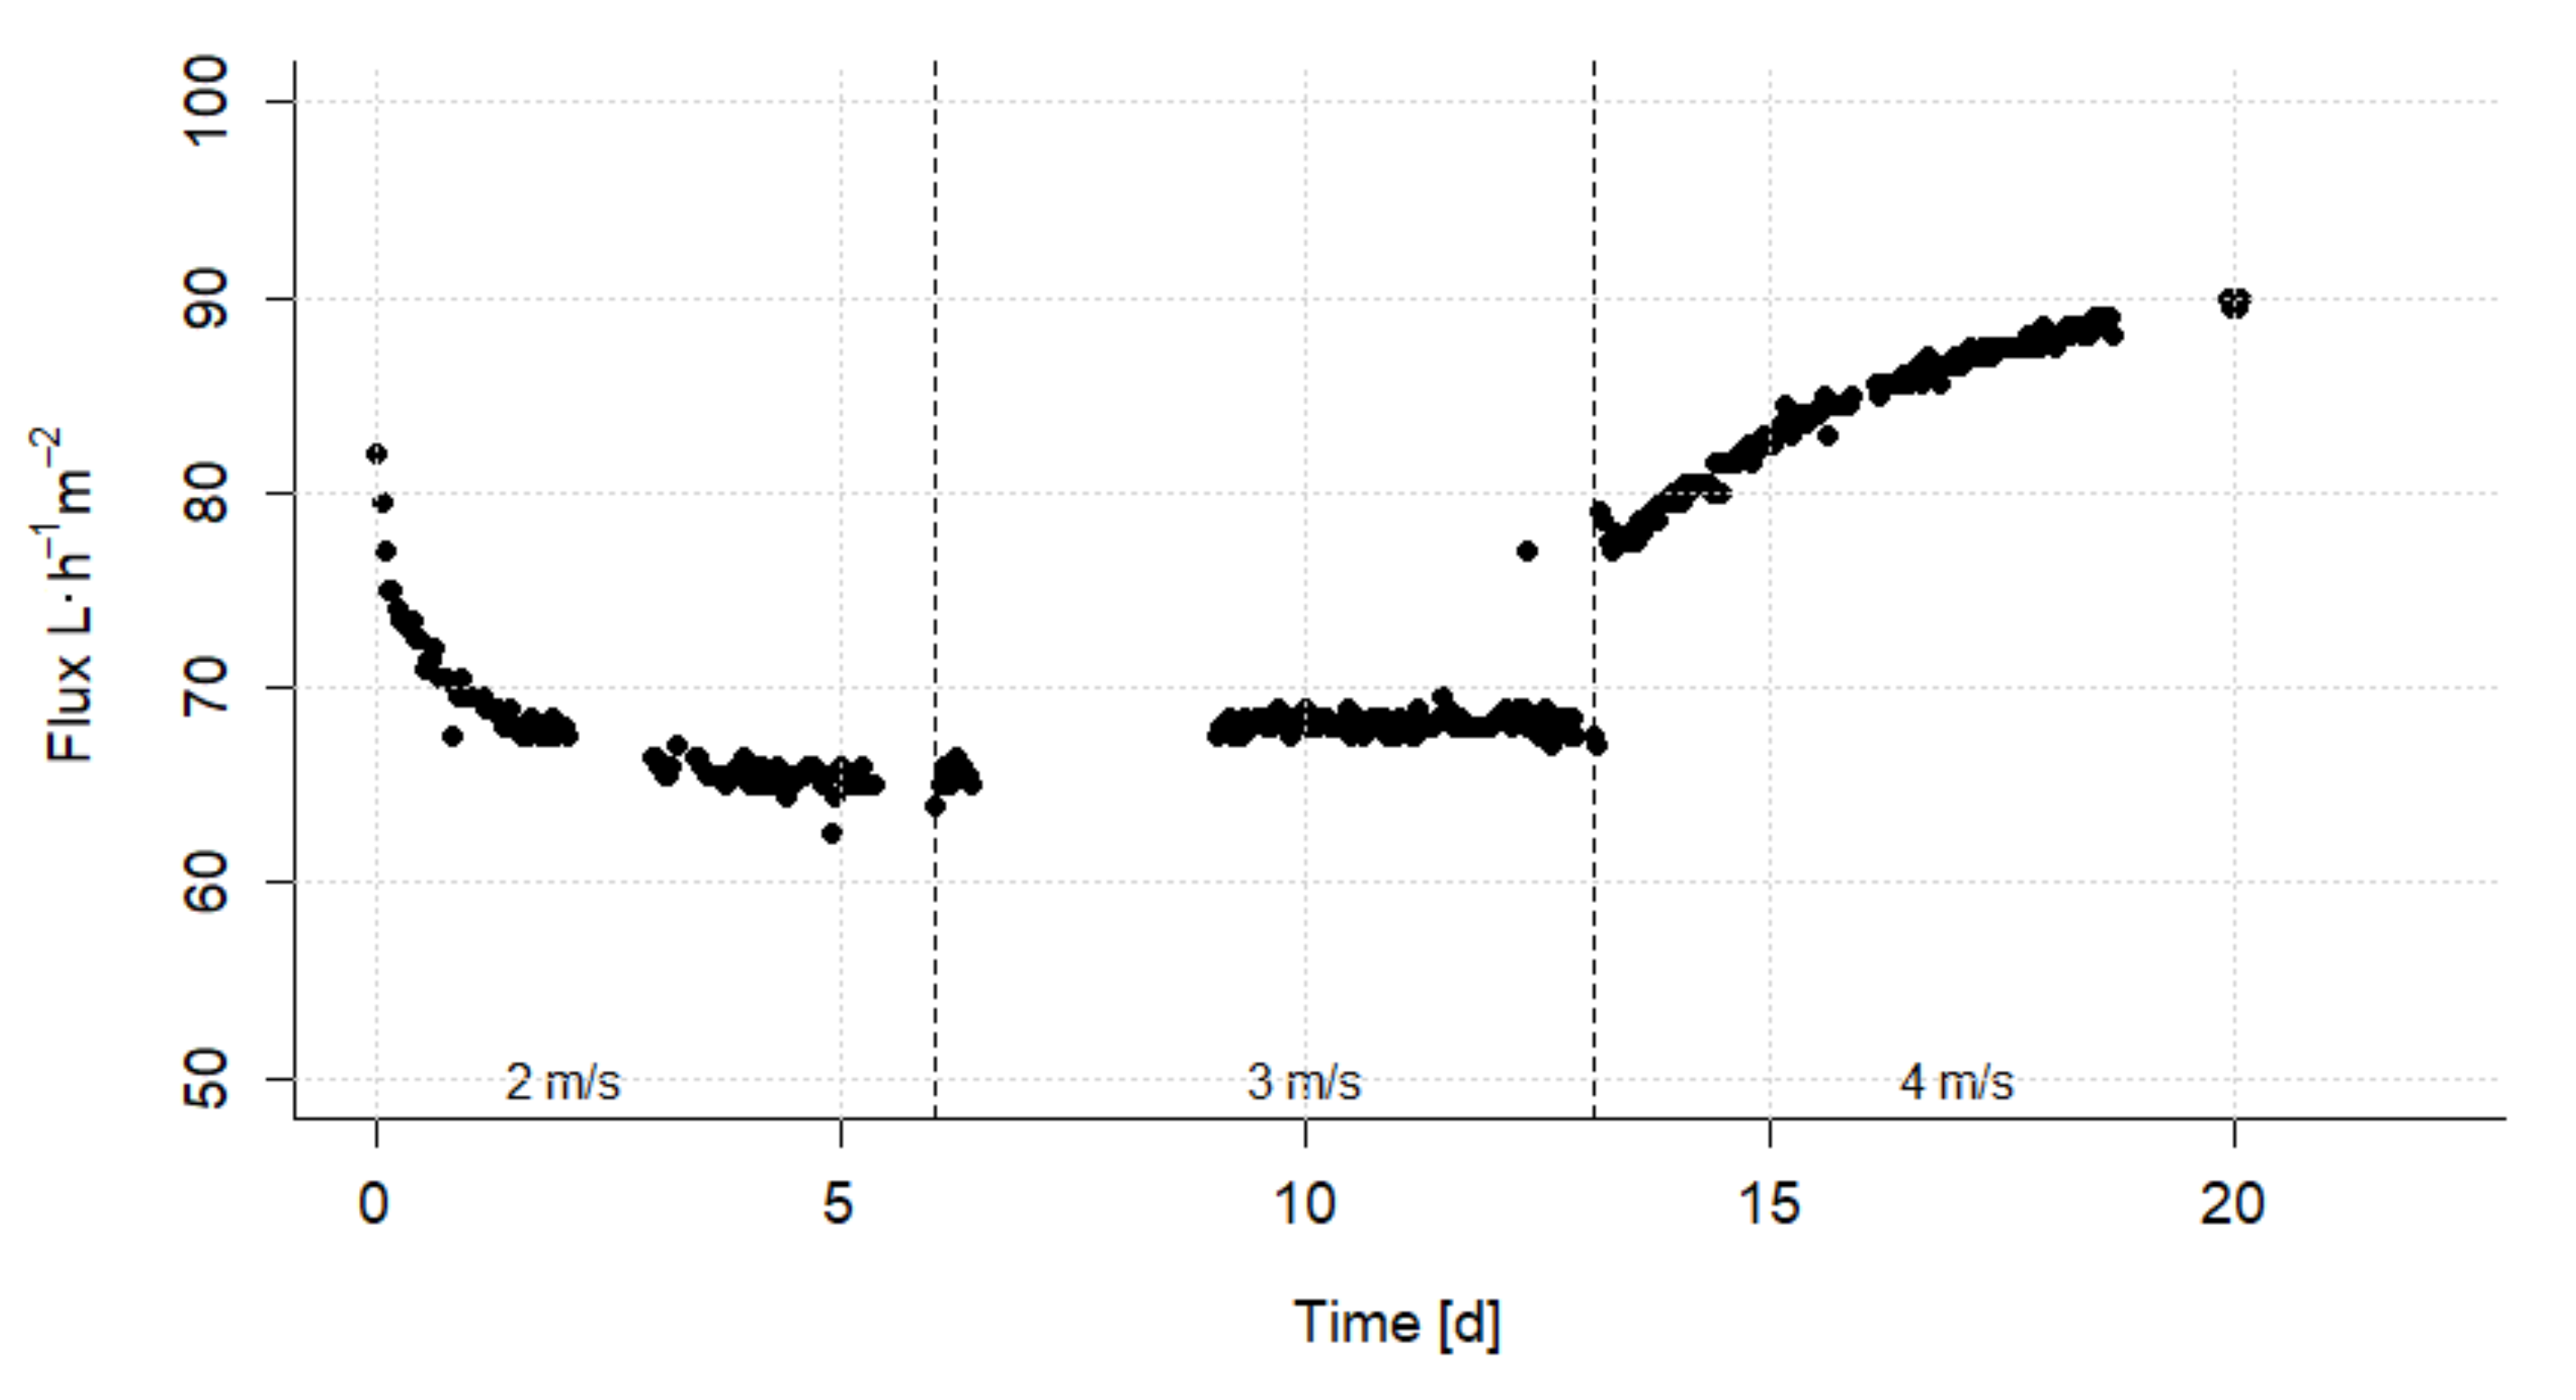
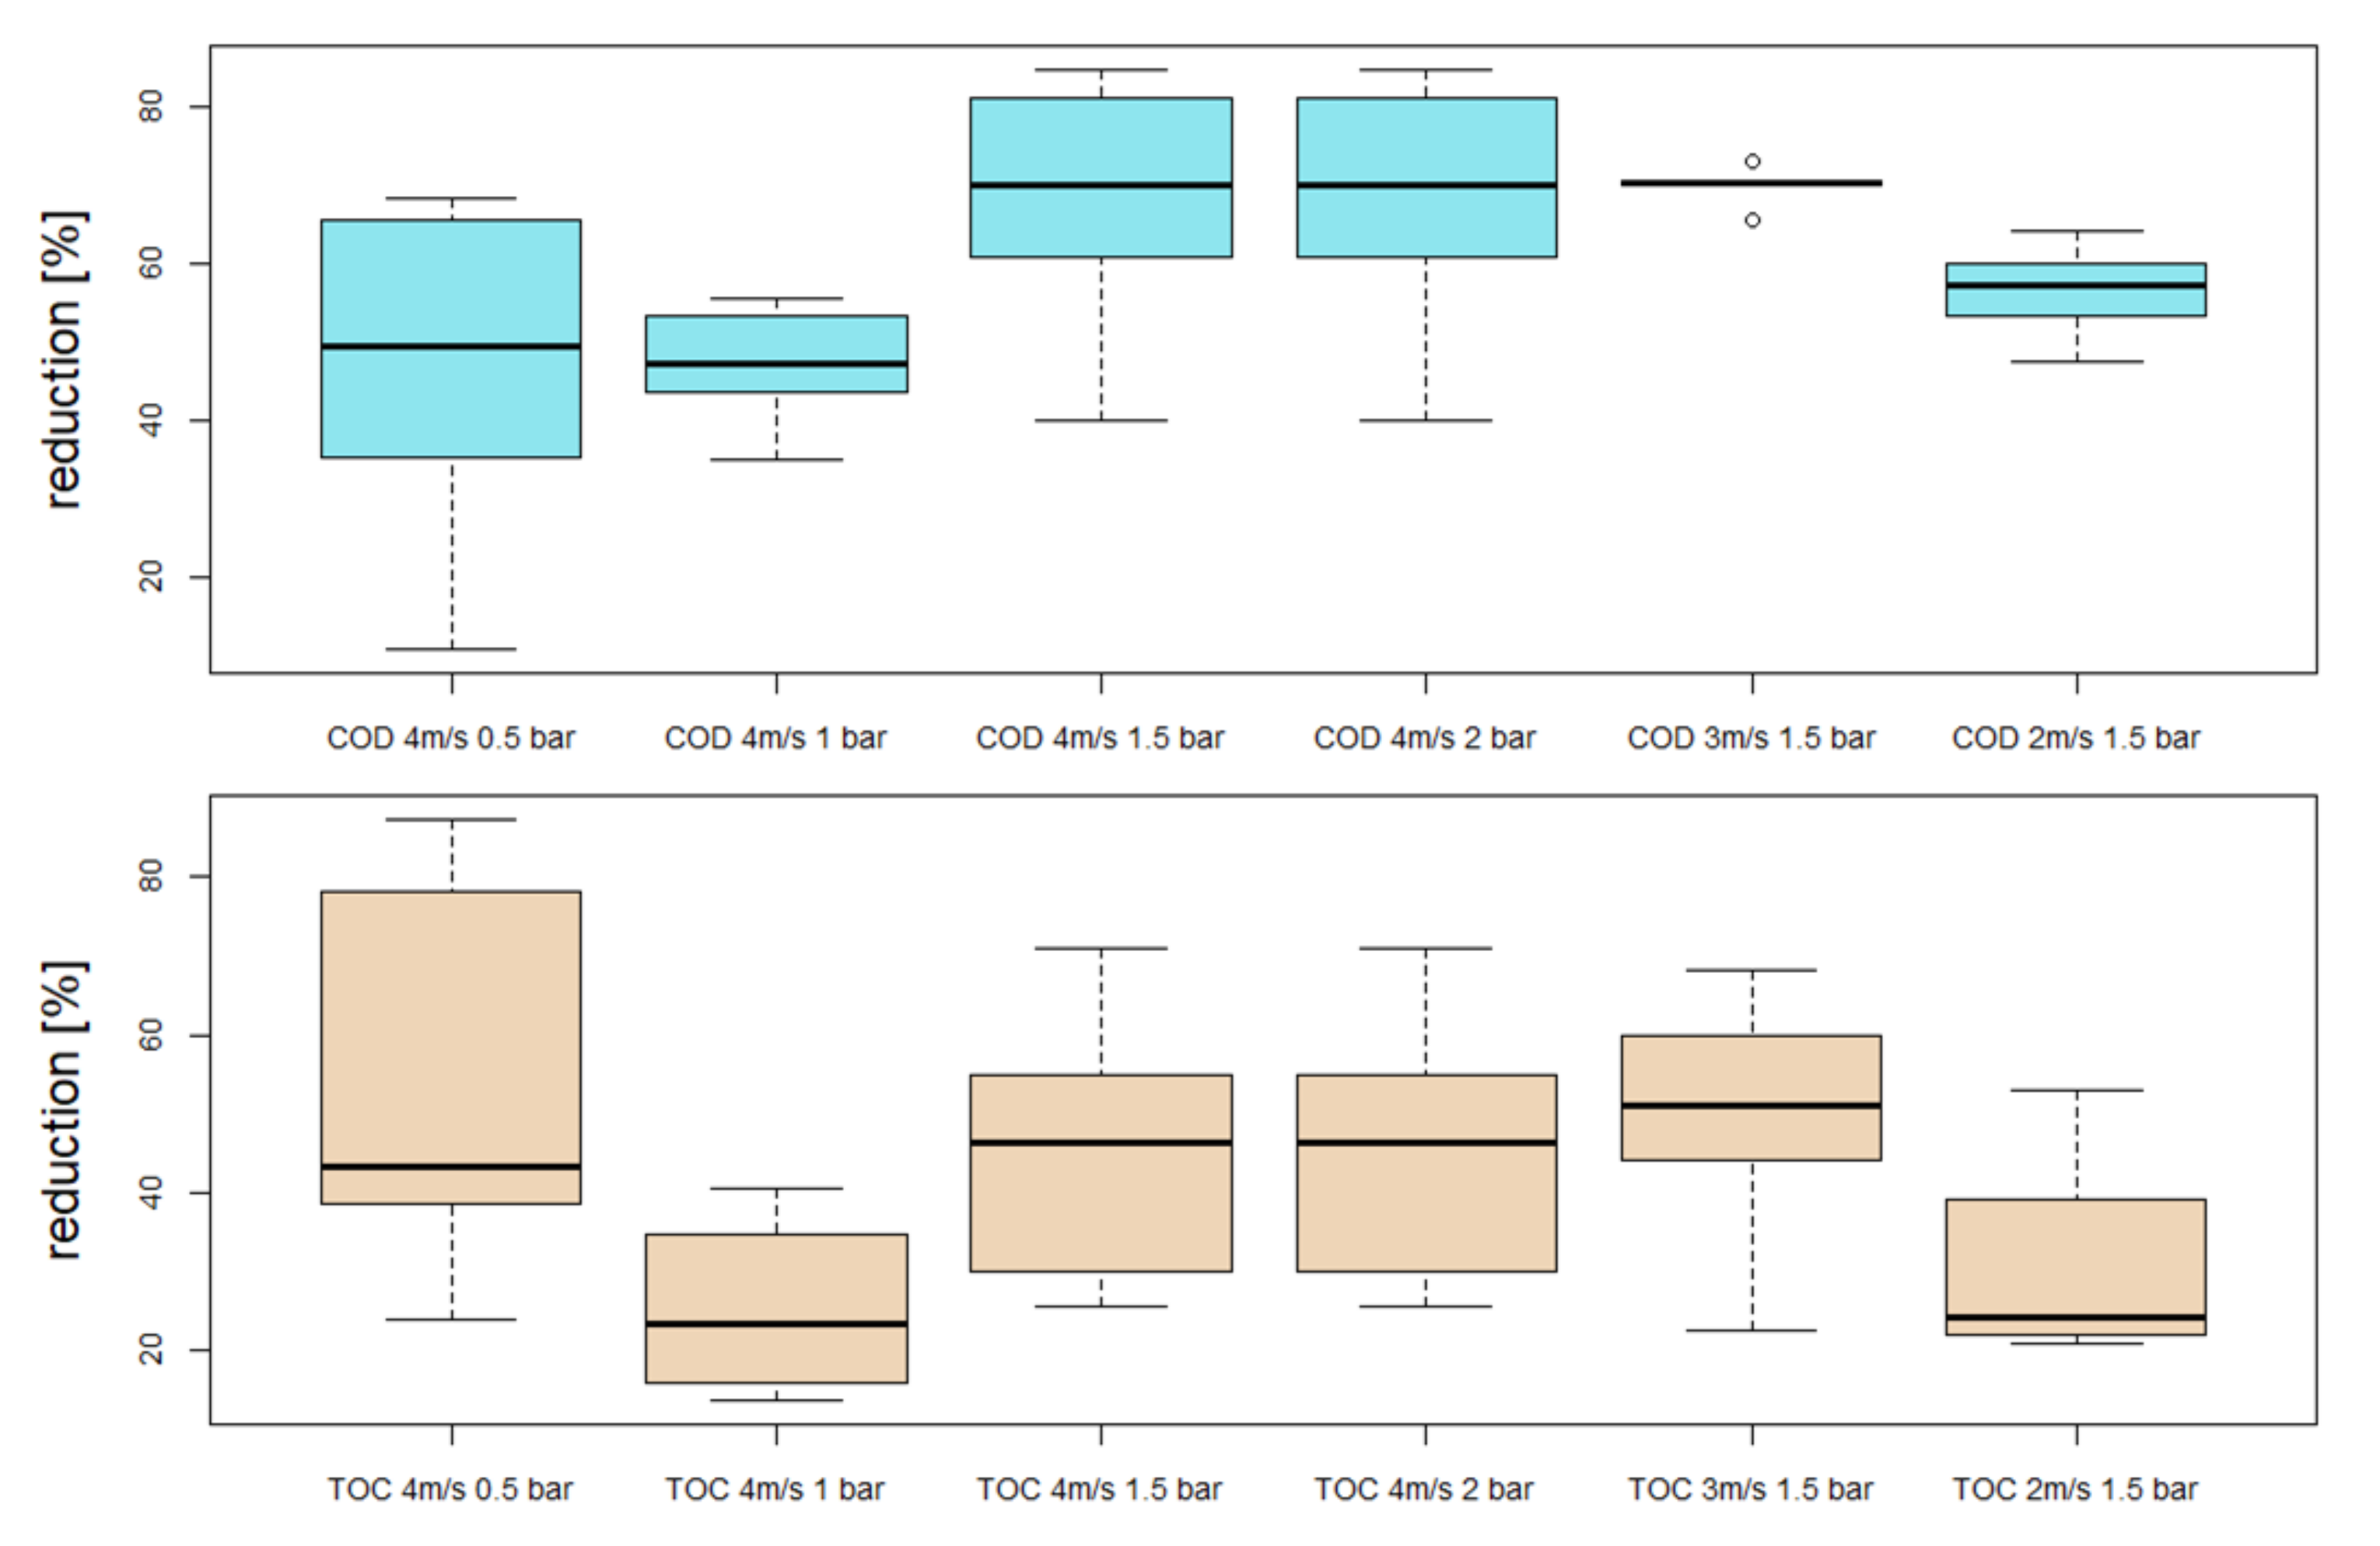
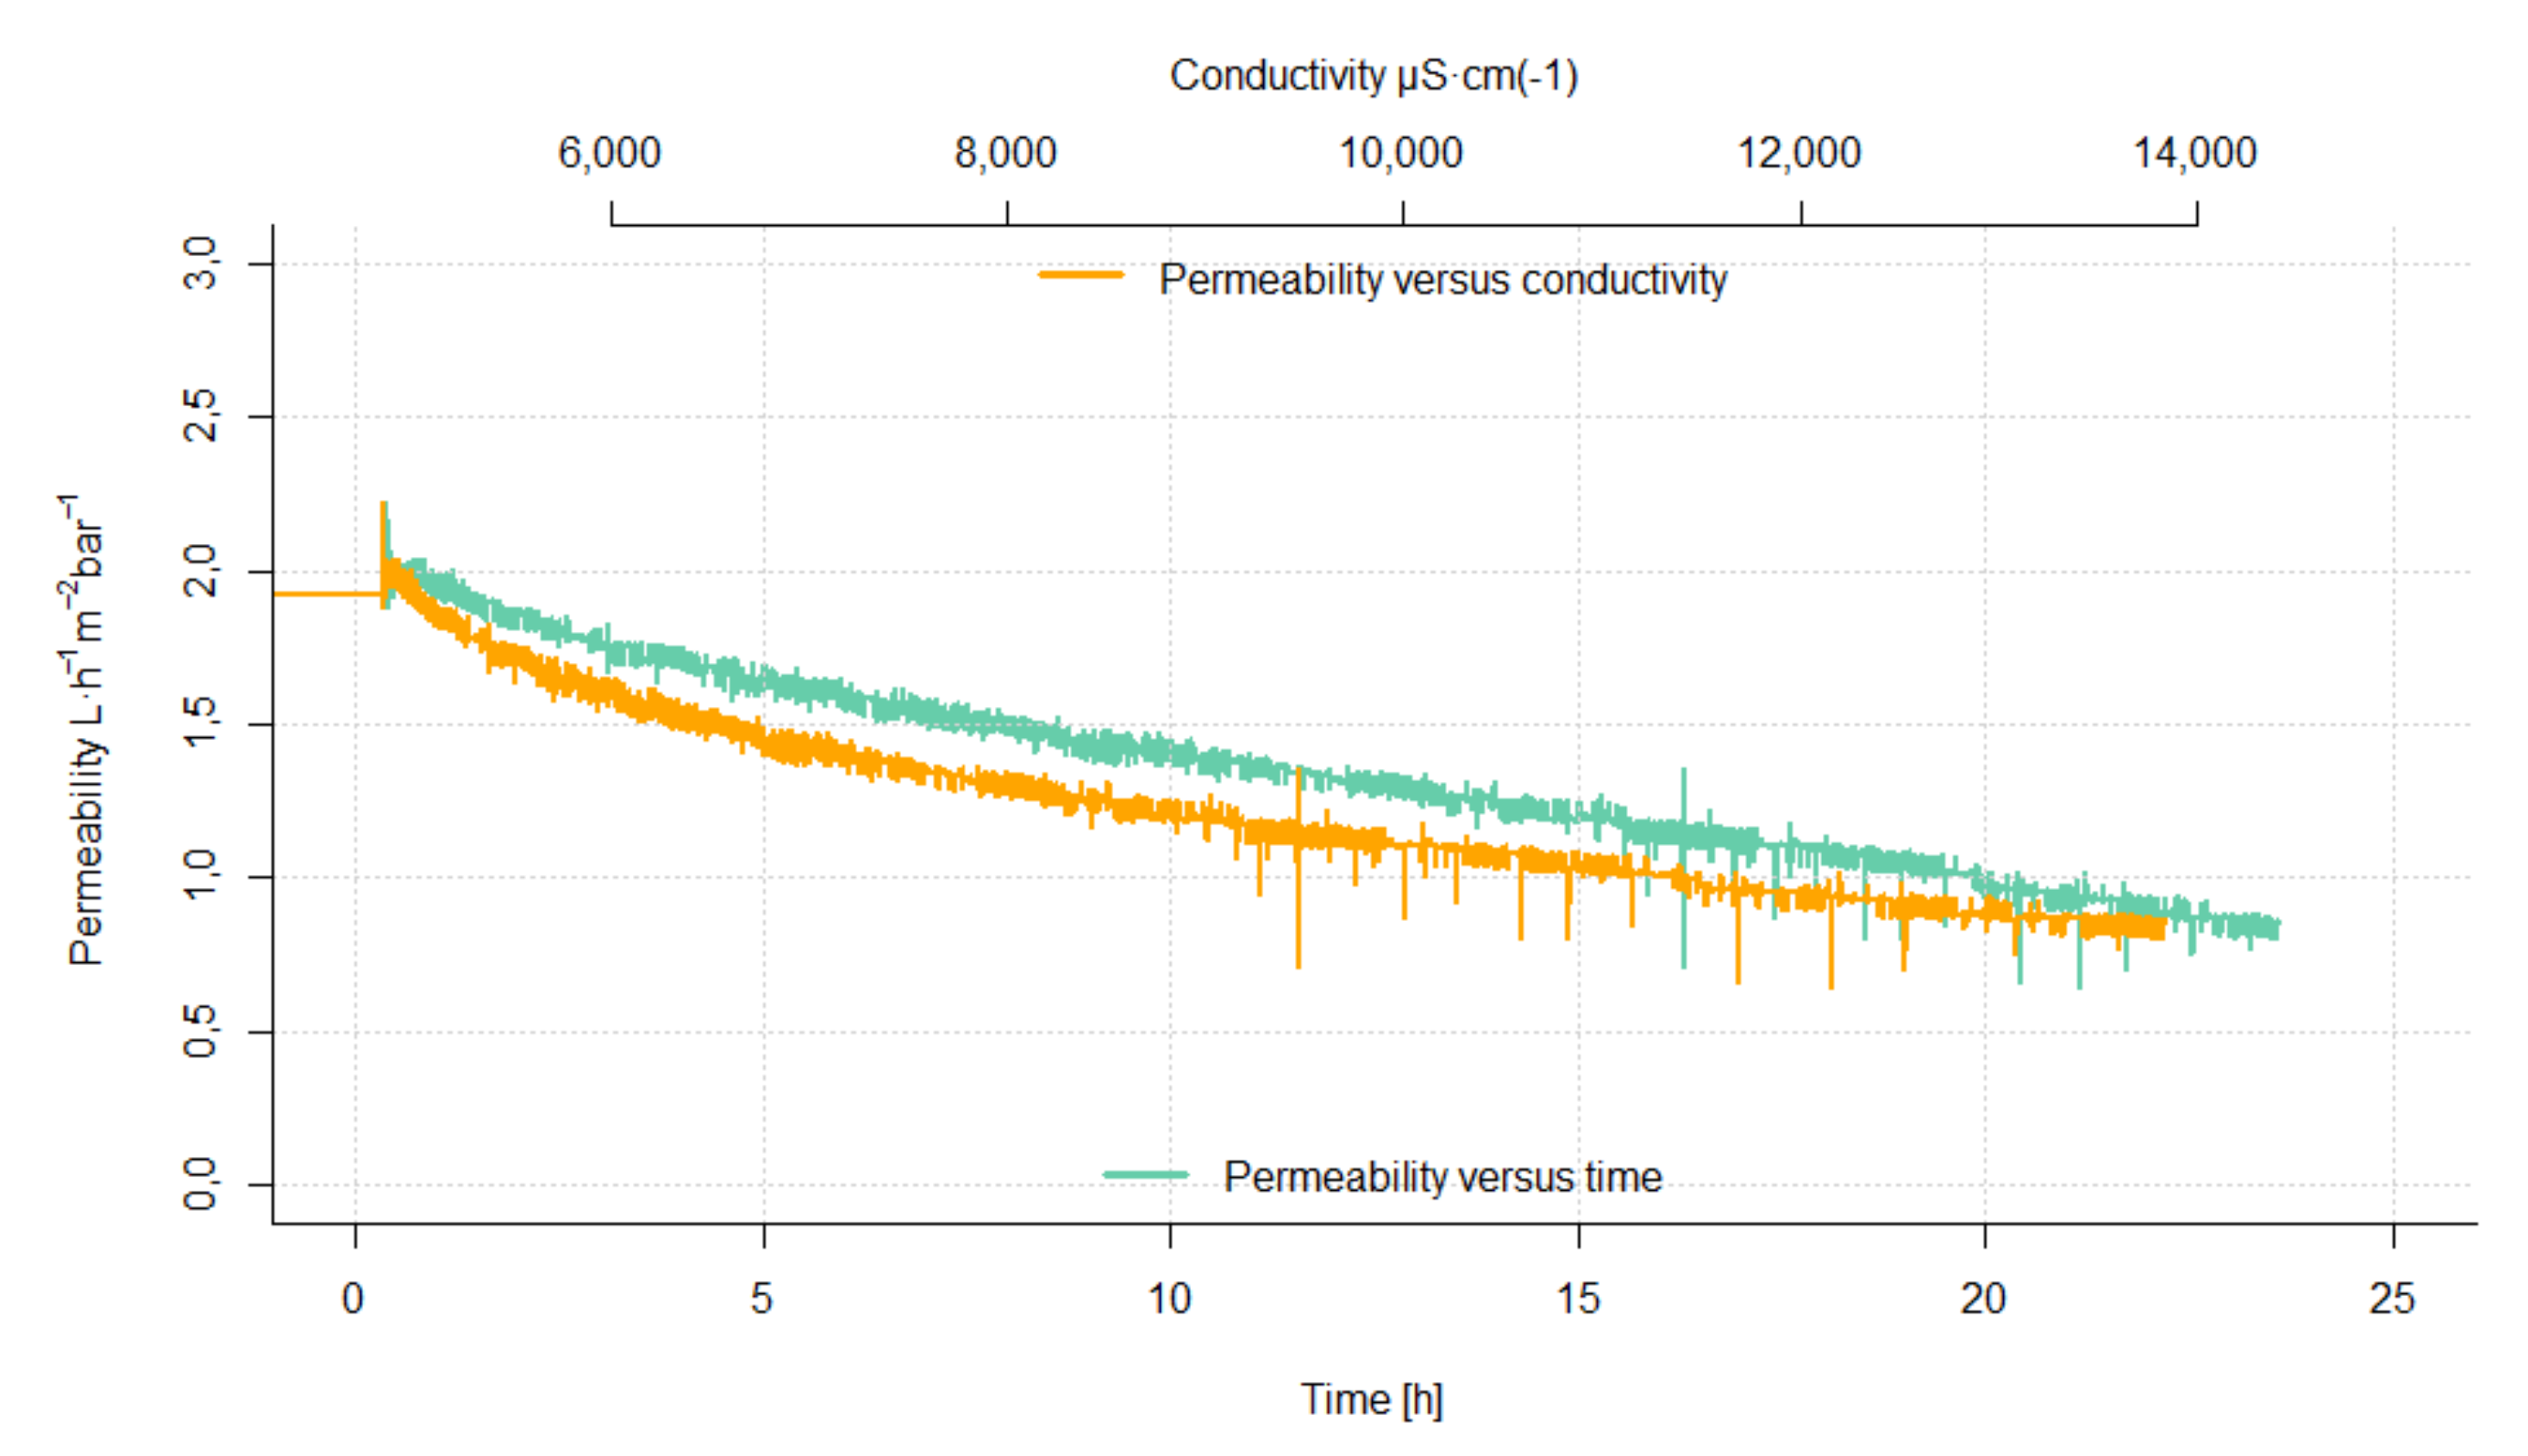
3.2. Ultrafiltration Bench-Scale Plant, Long-Term Experiment
3.3. Reverse Osmosis Small-Scale Experiments
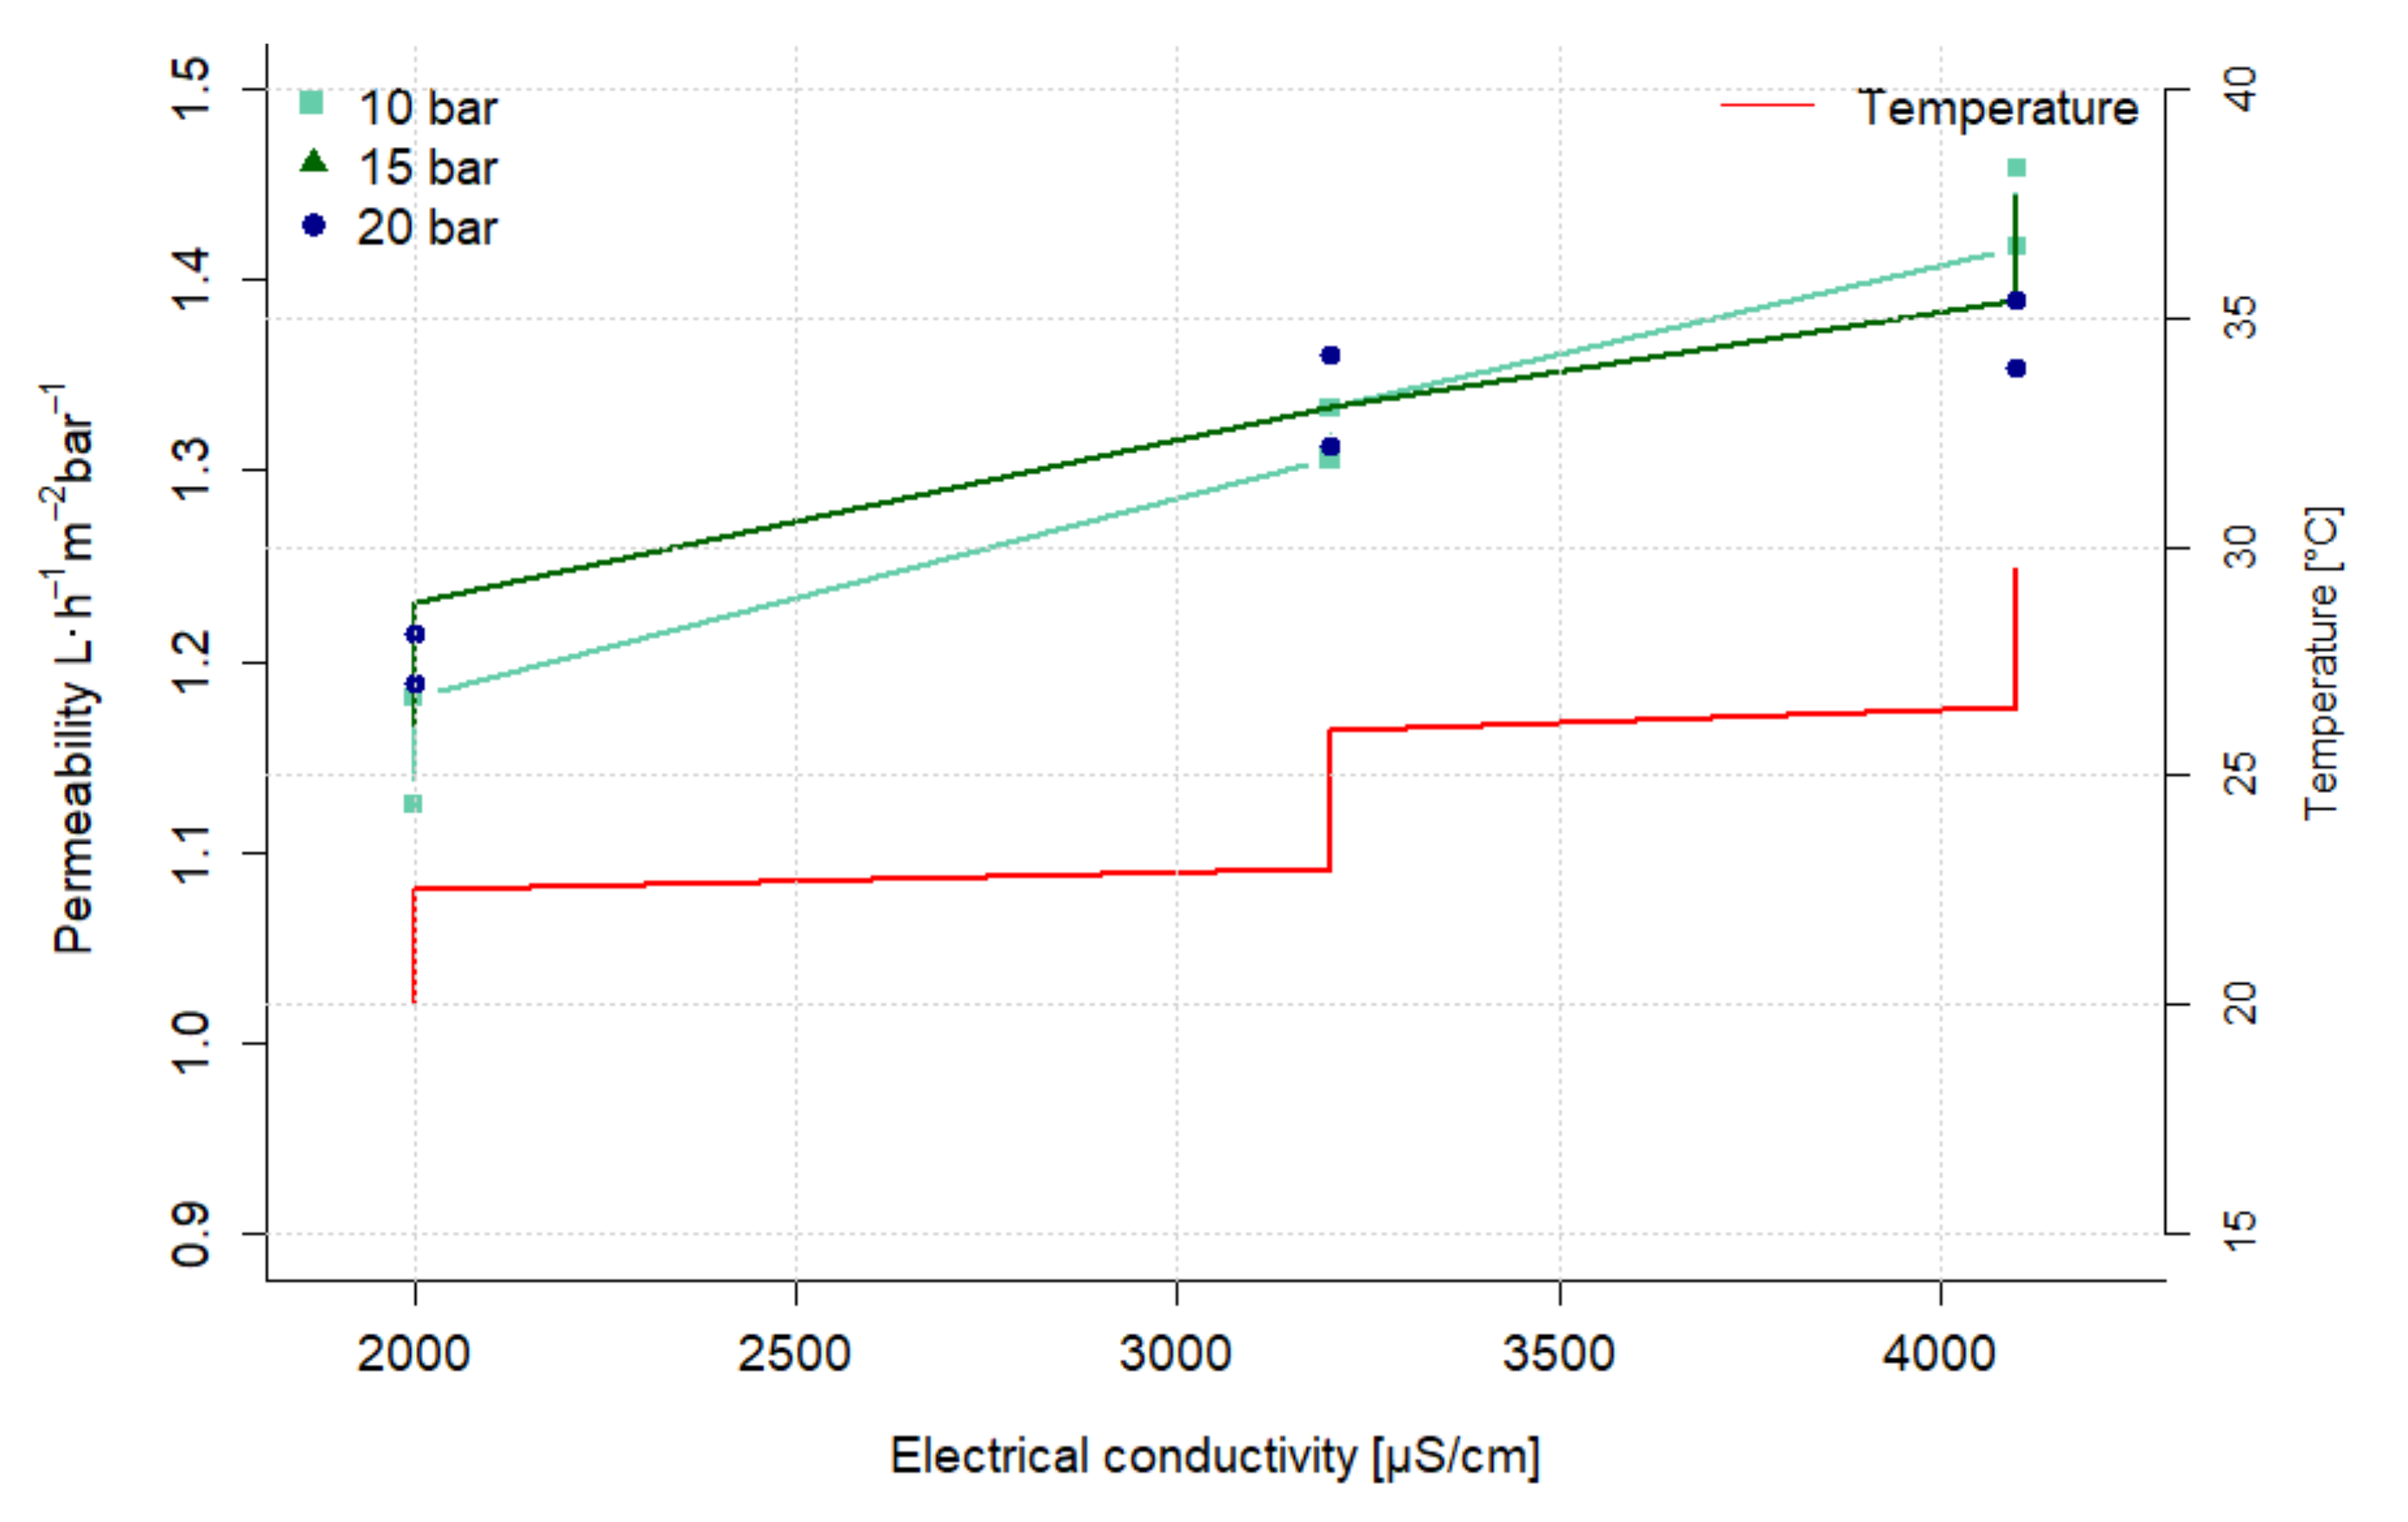
3.4. Reverse Osmosis Bench-Scale Plant Experiments
4. Conclusions
Author Contributions
Funding
Institutional Review Board Statement
Informed Consent Statement
Data Availability Statement
Acknowledgments
Conflicts of Interest
Abbreviations
| BOD5 | biological oxygen demand |
| COD | chemical oxygen demand |
| DAF | dissolved air flotation |
| DOC | dissolved organic carbon |
| EDX | energy dispersive X-ray spectroscopy |
| NF | nanofiltration |
| RO | reverse osmosis |
| SBR | sequencing batch reactor |
| SEM | scanning electron microscopy |
| SWW | slaughterhouse wastewater |
| TMP | transmembrane pressure |
| TN | total nitrogen |
| TOC | total organic carbon |
| TSS | total suspended solids |
| UF | ultrafiltration |
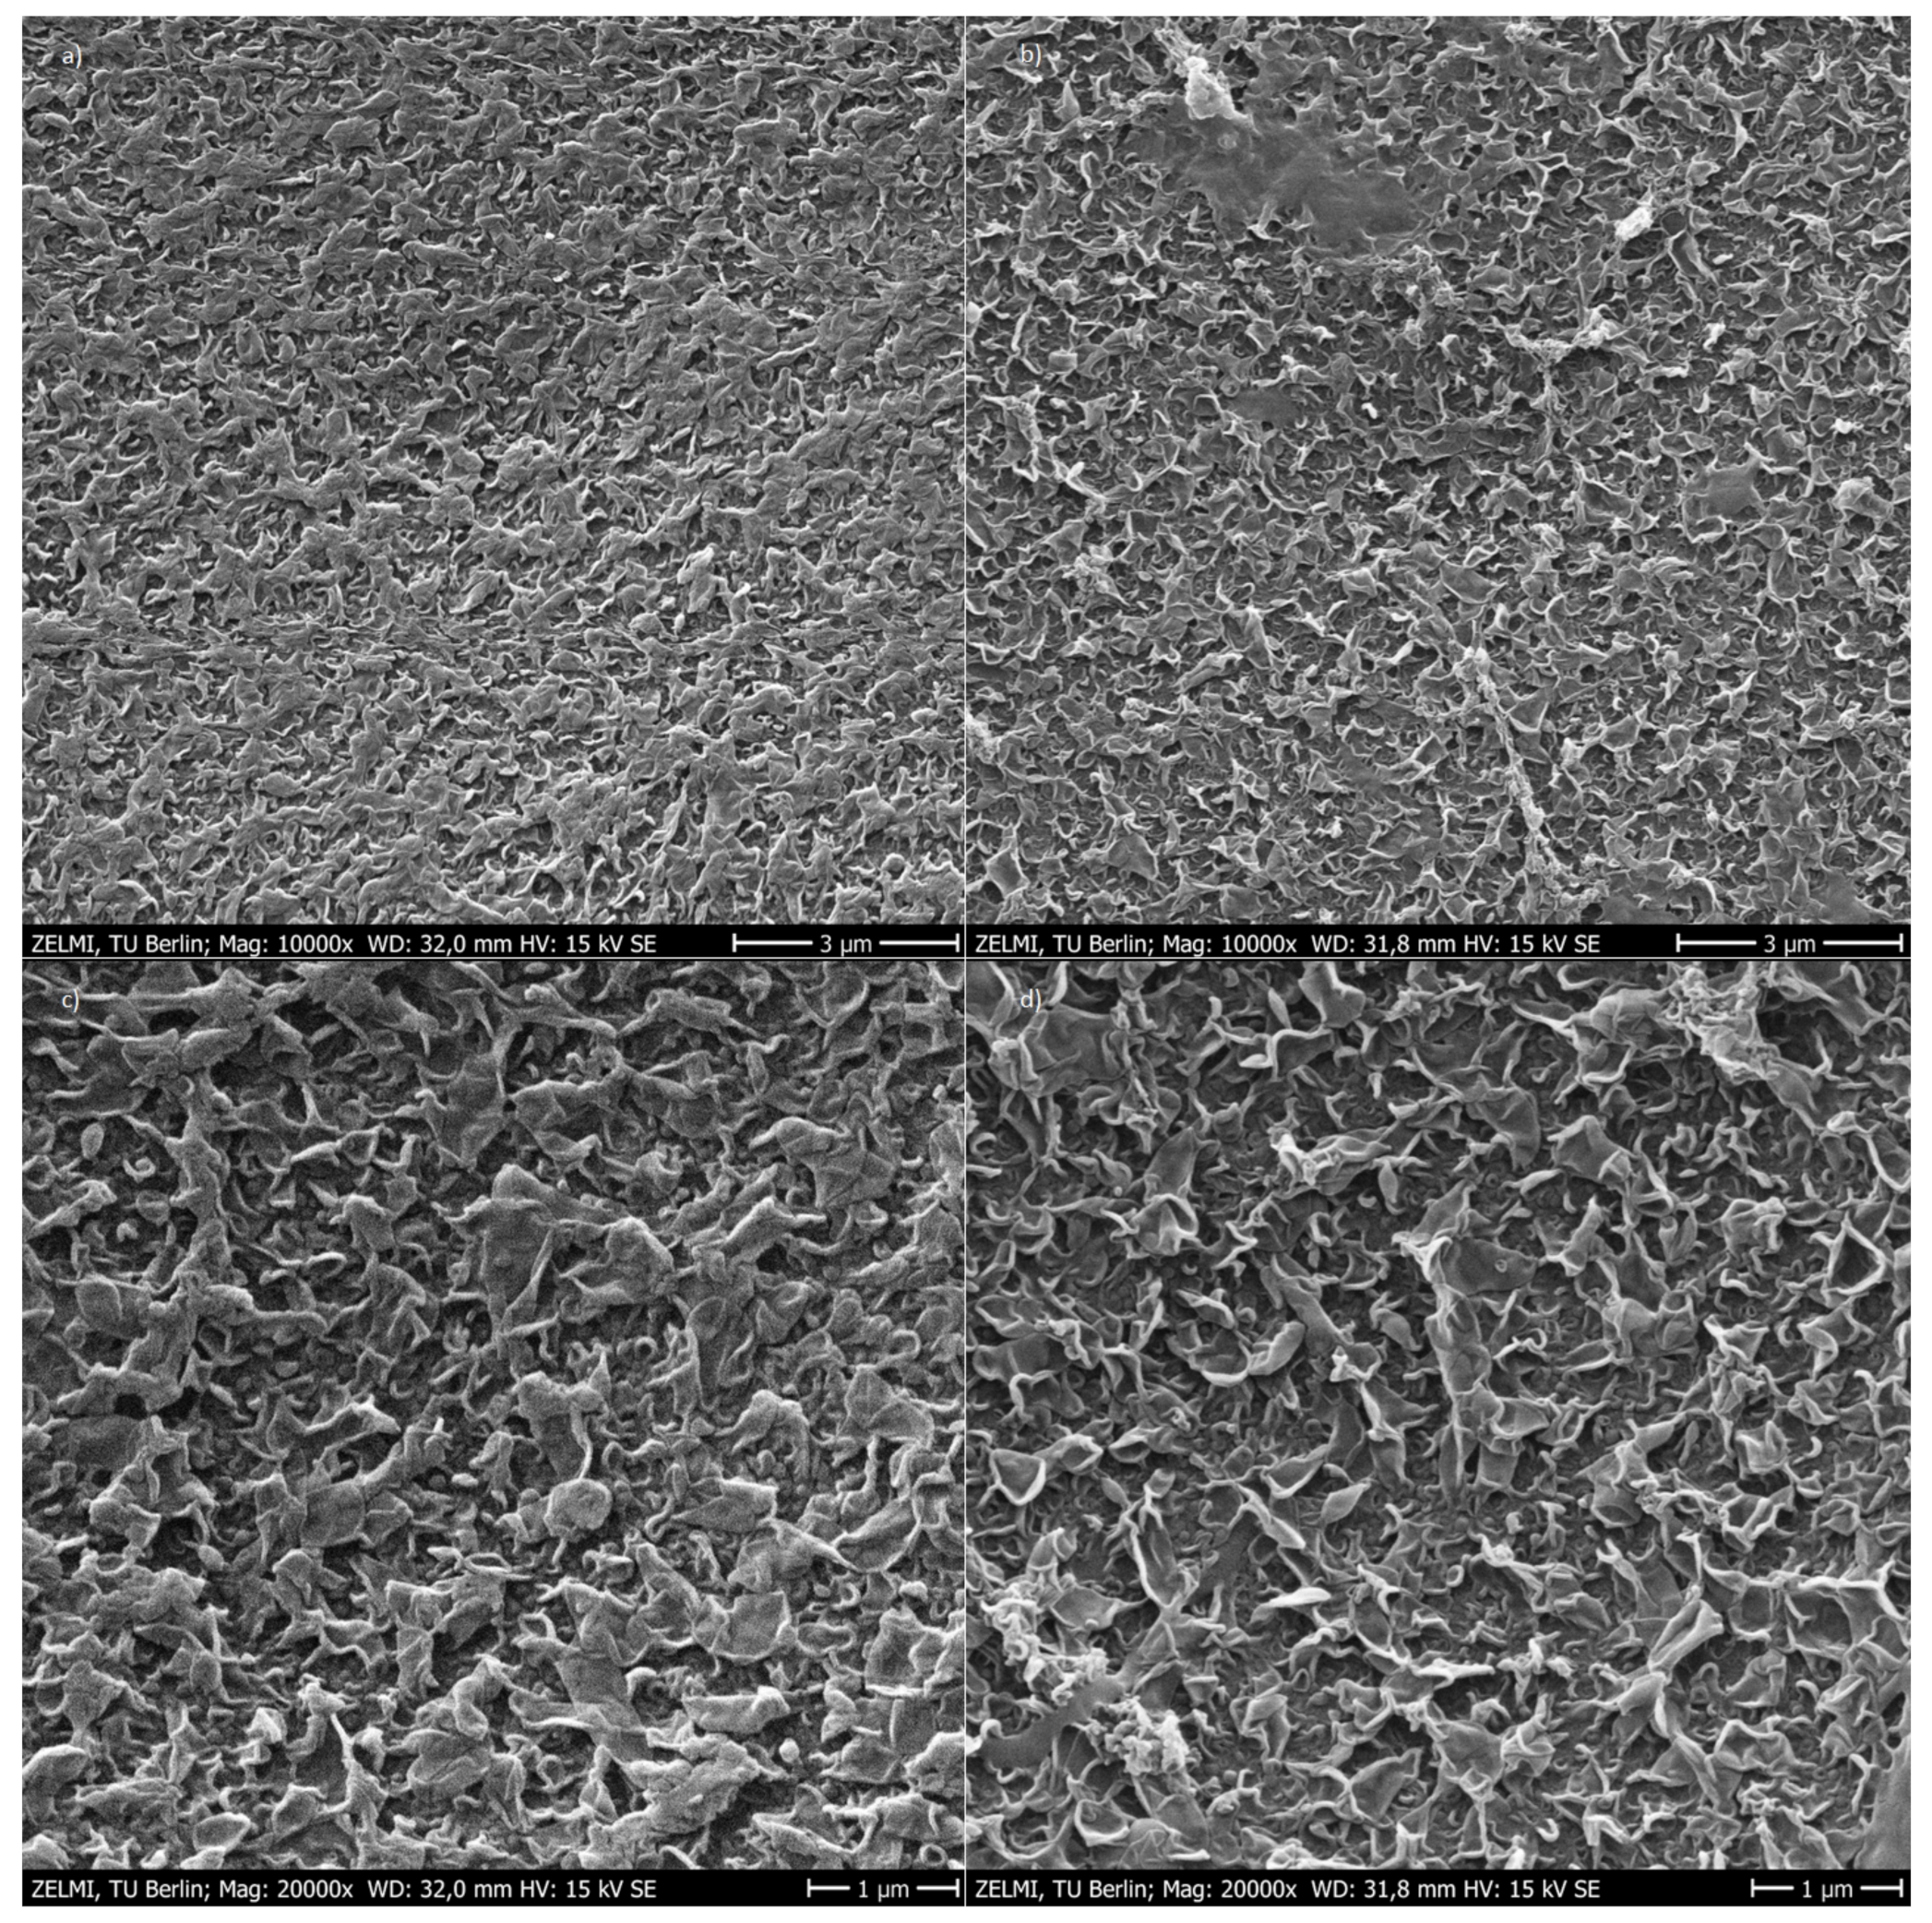
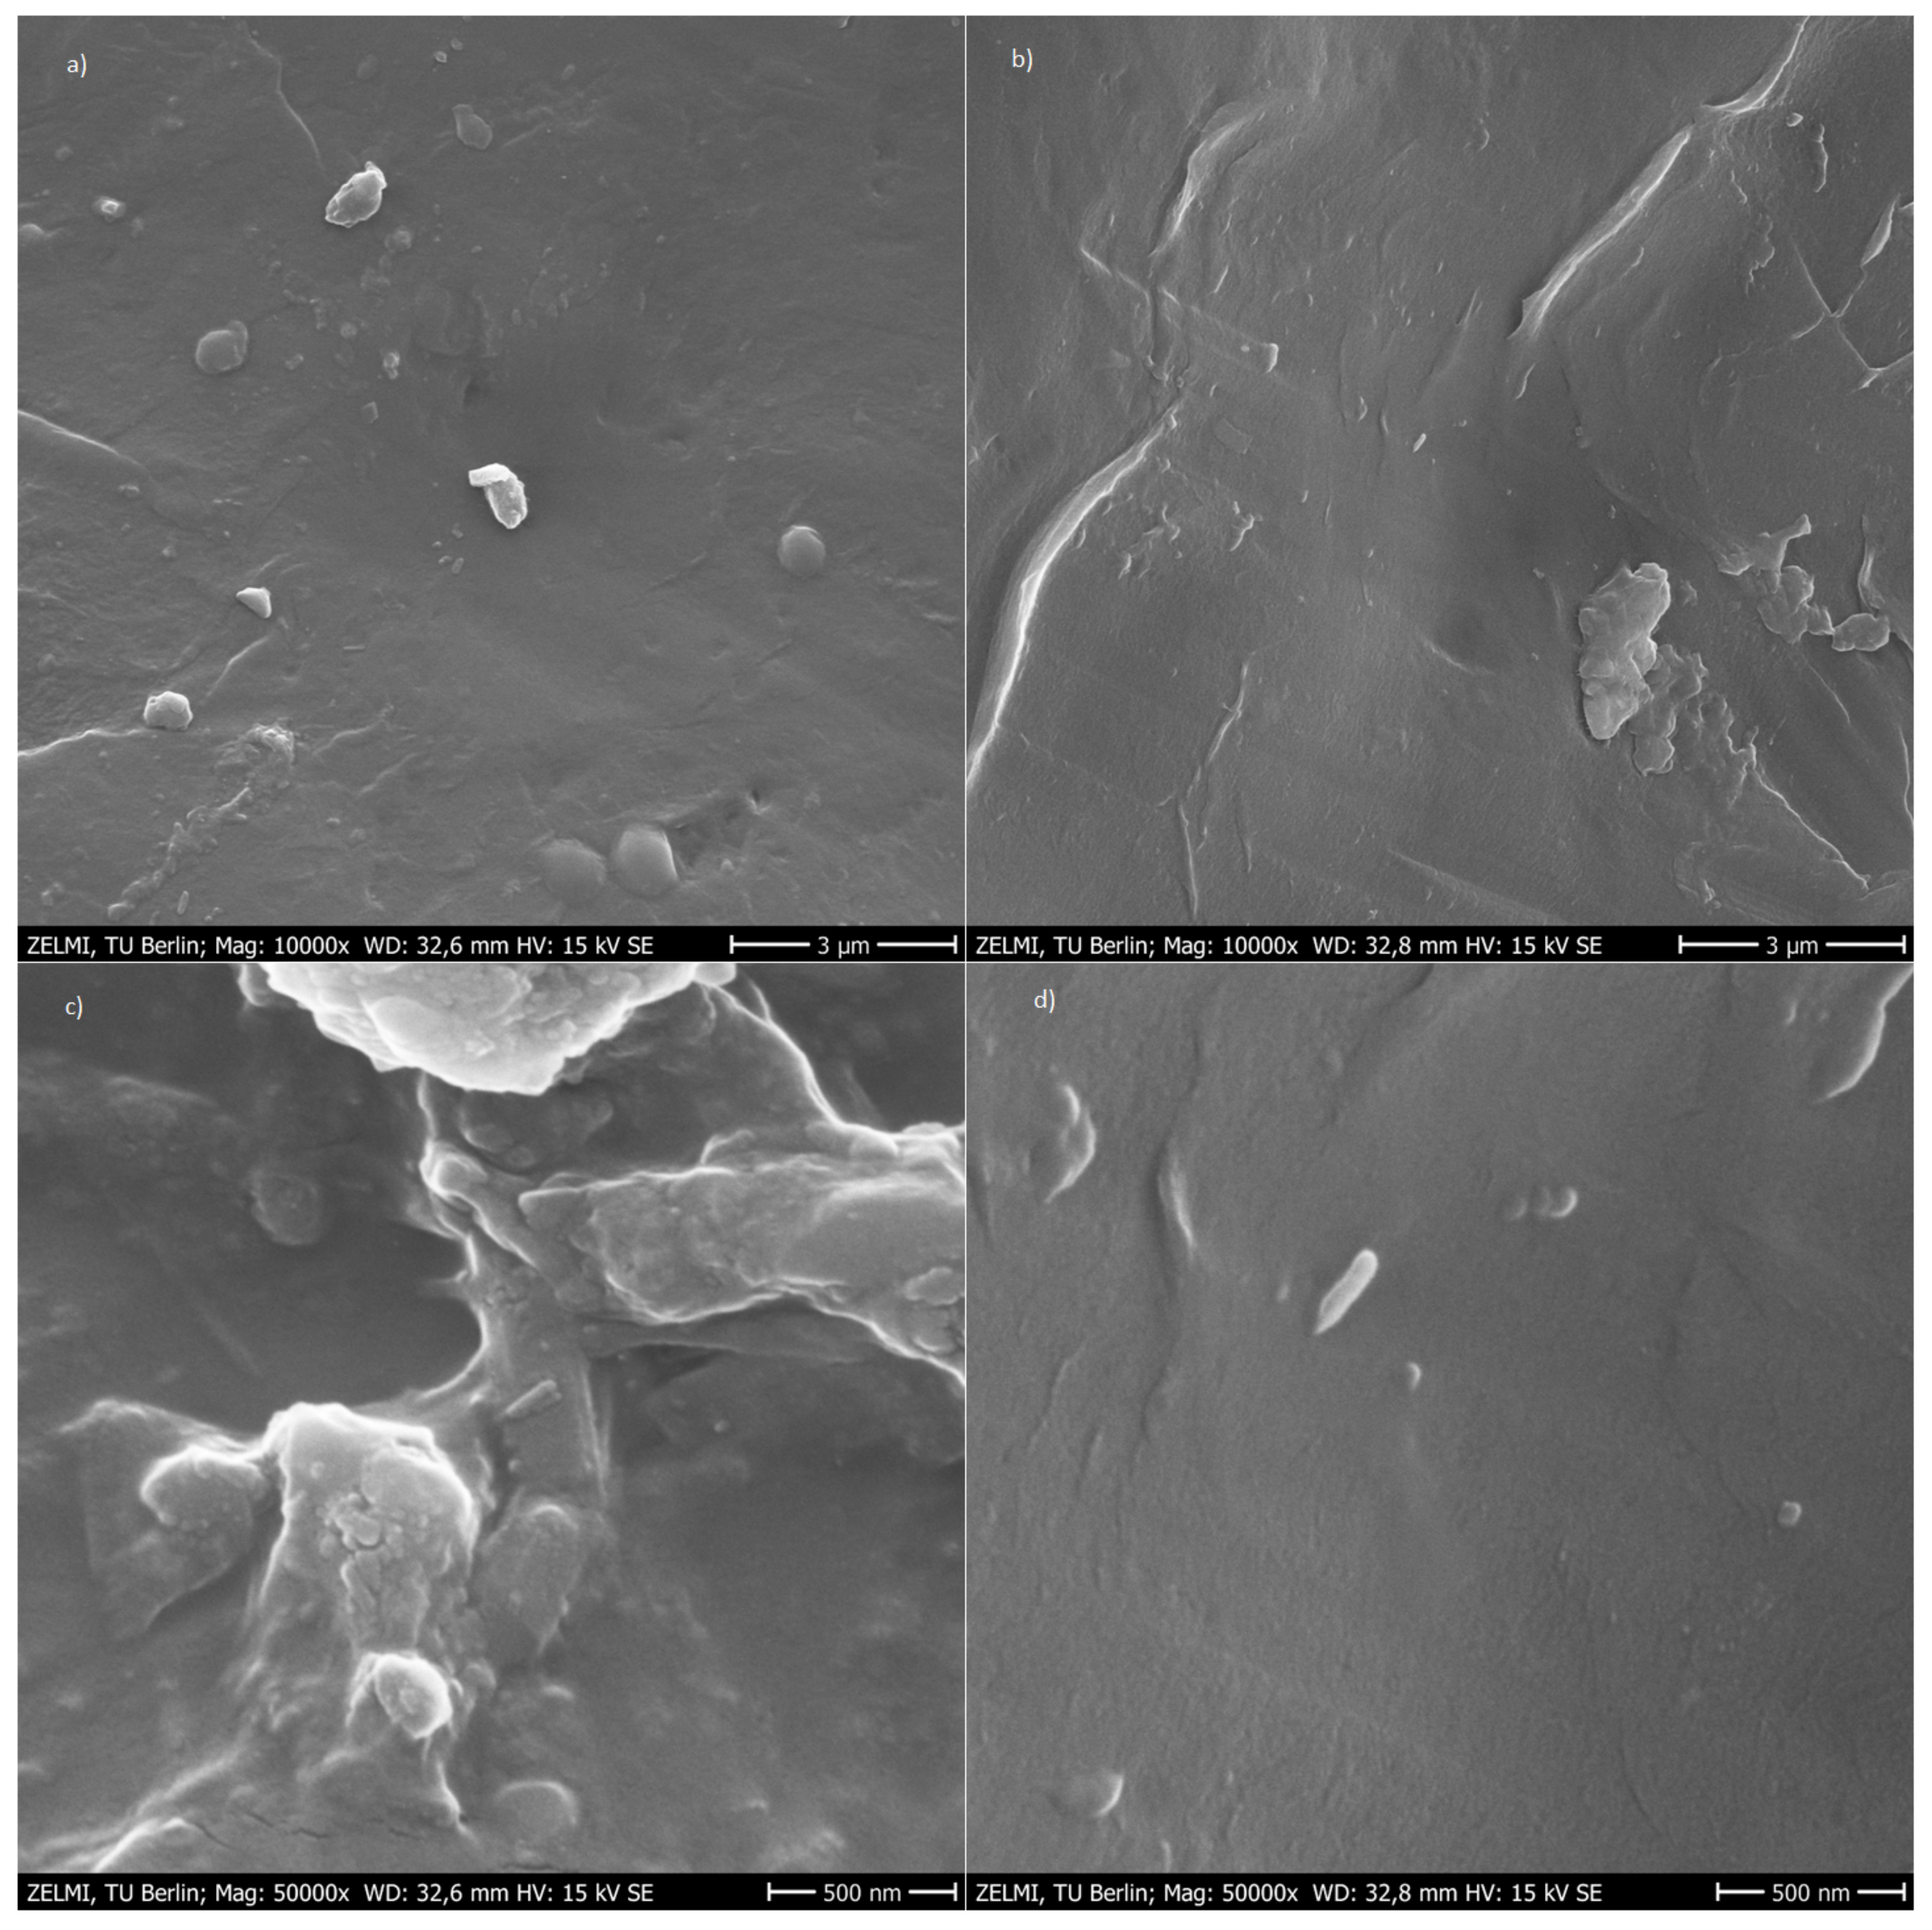
Appendix A. Sem
Appendix A.1. Ultrafiltration Flat Sheet Membranes Scanning Electron Microscope (Sem)

References
- Feng, H.; Hu, L.; Mahmood, Q.; Fang, C.; Qiu, C.; Shen, D. Effects of temperature and feed strength on a carrier anaerobic baffled reactor treating dilute wastewater. Desalination 2009, 239, 111–121. [Google Scholar] [CrossRef]
- Leitao, R.; Vanhaandel, A.; Zeeman, G.; Lettinga, G. The effects of operational and environmental variations on anaerobic wastewater treatment systems: A review. Bioresour. Technol. 2006, 97, 1105–1118. [Google Scholar] [CrossRef] [PubMed]
- Koo, C.H.; Mohammad, A.W.; Suja, F. Recycling of oleochemical wastewater for boiler feed water using reverse osmosis membranes–A case study. Desalination 2011, 271, 178–186. [Google Scholar] [CrossRef]
- Fatima, F.; Du, H.; Kommalapati, R.R. Treatment of Poultry Slaughterhouse Wastewater with Membrane Technologies: A Review. Water 2021, 13, 1905. [Google Scholar] [CrossRef]
- Somma, S.; Reverchon, E.; Baldino, L. Water Purification of Classical and Emerging Organic Pollutants: An Extensive Review. ChemEngineering 2021, 5, 47. [Google Scholar] [CrossRef]
- Bustillo-Lecompte, C.F.; Mehrvar, M. Slaughterhouse wastewater characteristics, treatment, and management in the meat processing industry: A review on trends and advances. J. Environ. Manag. 2015, 161, 287–302. [Google Scholar] [CrossRef] [PubMed]
- Philipp, M.; Jabri, K.M.; Wellmann, J.; Akrout, H.; Bousselmi, L.; Geißen, S.U. Slaughterhouse Wastewater Treatment: A Review on Recycling and Reuse Possibilities. Water 2021, 13, 3175. [Google Scholar] [CrossRef]
- Rosenwinkel, K.H.; Haun, U.A.; Köster, S.; Beier, M. Taschenbuch der Industrieabwasserreinigung, 2nd ed.; Vulkan Verlag GmbH: Essen, Germany, 2020. [Google Scholar]
- EUROPEAN COMMISSION. Reference Document on Best Available Techniques in the Slaughterhouses and Animal ByPproducts Industries; European Commission: Brussels, Belgium, May 2005. [Google Scholar]
- Racar, M.; Dolar, D.; Špehar, A.; Košutić, K. Application of UF/NF/RO membranes for treatment and reuse of rendering plant wastewater. Process. Saf. Environ. Prot. 2017, 105, 386–392. [Google Scholar] [CrossRef]
- Coskun, T.; Debik, E.; Kabuk, H.A.; Demir, N.M.; Basturk, I.; Yildirim, B.; Temizel, D.; Kucuk, S. Treatment of poultry slaughterhouse wastewater using a membrane process, water reuse, and economic analysis. Desalin. Water Treat. 2015, 57, 4944–4951. [Google Scholar] [CrossRef]
- Council of European Union. Council Directive 98/83/EC. 1998. Available online: https://eur-lex.europa.eu/legal-content/EN/TXT/?uri=CELEX:31998L0083 (accessed on 21 February 2022).
- Council of European Union. Regulation (EU) 2020/741 of the European Parliament and of the Council of 25 May 2020 on Minimum Requirements for Qater Reuse. 2020. Available online: https://eur-lex.europa.eu/legal-content/DE/TXT/PDF/?uri=CELEX:32020R0741&from=EN (accessed on 11 May 2021).
- Götz, G.; Geißen, S.U.; Ahrens, A.; Reimann, S. Adjustment of the wastewater matrix for optimization of membrane systems applied for water reuse in breweries. J. Membr. Sci. 2014, 465, 68–77. [Google Scholar] [CrossRef]
- Malmali, M.; Askegaard, J.; Sardari, K.; Eswaranandam, S.; Sengupta, A.; Wickramasinghe, S.R. Evaluation of ultrafiltration membranes for treating poultry processing wastewater. J. Water Process. Eng. 2018, 22, 218–226. [Google Scholar] [CrossRef]
- Sardari, K.; Askegaard, J.; Chiao, Y.H.; Darvishmanesh, S.; Kamaz, M.; Wickramasinghe, S.R. Electrocoagulation followed by ultrafiltration for treating poultry processing wastewater. J. Environ. Chem. Eng. 2018, 6, 4937–4944. [Google Scholar] [CrossRef]
- Boyle-Gotla, A.; Jensen, P.; Yap, S.; Pidou, M.; Wang, Y.; Batstone, D. Dynamic multidimensional modelling of submerged membrane bioreactor fouling. J. Membr. Sci. 2014, 467, 153–161. [Google Scholar] [CrossRef] [Green Version]
- Thomassen, J.; Faraday, D.; Underwood, B.; Cleaver, J. The effect of varying transmembrane pressure and crossflow velocity on the microfiltration fouling of a model beer. Sep. Purif. Technol. 2005, 41, 91–100. [Google Scholar] [CrossRef]


| Parameter | Unit | Process Water Reuse [12] | Reuse without |
|---|---|---|---|
| (Drinking Water Quality) | Product Contact [13] | ||
| BOD5 | [mg·L] | <1 | - |
| COD | [mg·L] | 5 | - |
| Nitrate | [mg·L] | 50 | - |
| TOC | [mg·L] | No abnormal change | - |
| E. coli. | (cfu· 1 L) | 0 | 0 |
| Legionella spp. | (cfu· L) | - | <1000 |
| Turbidity | [NTU] | 10 | 5 |
| Conductivity | [µS·cm] | 2500 | - |
| Na+ | [mg·L] | 200 | - |
| NH4+ | [mg·L] | 0.5 | - |
| F− | [mg·L] | 1.5 | - |
| Cl− | [mg·L] | 250 | - |
| NO3− | [mg·L] | 50 | - |
| SO42− | [mg·L] | 250 | - |
| Parameter | Unit | Small Slaughterhouse | Large Slaughterhouse | BREF [9] |
|---|---|---|---|---|
| TOC | [mg·L] | 700–900 | 900 | |
| TN | [mg·L] | 250–440 | 260 | 40–300 |
| COD | [mg·L] | 2000–3000 | 400 | 1000–5000 |
| BOD5 | [mg·L] | 600–800 | 500–2500 | |
| TP | [mg·L] | 70–90 | 75 | |
| TSS | [mg·L] | 1600–1900 | 2600 | 1000–2000 |
| PH | 7.5–8.3 | 7.6 | 6.0–9.0 | |
| Conductivity | [µS·cm] | 2500–3300 | 3100 |
| Parameter | Unit | Small Slaughterhouse | Large Slaughterhouse |
|---|---|---|---|
| TOC | [mg·L] | 250–360 | 360 |
| TN | [mg·L] | 100–200 | 140 |
| COD | [mg·L] | 400–1100 | 1080 |
| TSS | [mg·L] | 150–300 | 260 |
| Conductivity | [µS·cm] | 2800–4000 | 3600 |
| Experiment | Membrane | Module | Comment |
|---|---|---|---|
| ultrafiltration | UH030 PES-30 kDa | flat sheet | permeate withdrawal |
| small scale experiments | Mann + Hummel | LSta80 | up to 80% yield |
| ultrafiltration | M-C32-08-1200 | tubular 0.2 m2 | permeate circulated |
| bench-plant | VFU 100 kDA-PVC-U | 7-channel | Long-term experiment |
| reverse osmosis | BW30 | flat sheet | permeate withdrawal |
| small scale experiments | polyacrylonitrile | LSta80 | up to 80% yield |
| reverse osmosis | BW30-4040 | spiral wound | permeate circulated |
| bench-plant | FilmTec™ | 7.2 m 2 | at different TMP levels |
| Parameter | Unit | Feed | Permeate | Reduction [%] |
|---|---|---|---|---|
| TOC | [mg·L] | 180 | 150 | 15 |
| TN | [mg·L] | 60 | 50 | 18 |
| COD | [mg·L] | 475 | 210 | 55 |
| Parameter | Unit | Feed | Permeate | Retentate | Reduction [%] |
|---|---|---|---|---|---|
| TOC | [mg·L] | 280 | 3 | 1400 | 99 |
| TN | [mg·L] | 80 | 5 | 225 | 94 |
| COD | [mg·L] | 500 | 3 | 2,500 | 99 |
| Conductivity | [µS·cm] | 3500 | 110 | 8700 | 97 |
| Parameter | Unit | Feed | Permeate | Retentate | Reduction [%] |
|---|---|---|---|---|---|
| COD | [mg·L] | 135 | 4 | 260 | 97 |
| TN | [mg·L] | 80 | 3 | 180 | 96 |
| TOC | [mg·L] | 25 | <0.5 | 45 | >98 |
| Conductivity | [µS·cm] | 2000 | 50 | 4,000 | 98 |
| Na+ | [mg·L] | 150 | 2 | 270 | 99 |
| NH4+ | [mg·L] | 65 | 3 | 120 | 95 |
| k+ | [mg·L] | 90 | 1 | 160 | 99 |
| Ca2+ | [mg·L] | 70 | <0.5 | 250 | >99 |
| Mg2+ | [mg·L] | 15 | <0.5 | 30 | >97 |
| F− | [mg·L] | <0.5 | <0.5 | 2 | - |
| Cl− | [mg·L] | 270 | 1 | 460 | 99 |
| NO3− | [mg·L] | 5 | <0.5 | 12 | >99 |
| SO42− | [mg·L] | 55 | <0.5 | 80 | >99 |
| PO43− | [mg·L] | 15 | <0.5 | 30 | >99 |
Publisher’s Note: MDPI stays neutral with regard to jurisdictional claims in published maps and institutional affiliations. |
© 2022 by the authors. Licensee MDPI, Basel, Switzerland. This article is an open access article distributed under the terms and conditions of the Creative Commons Attribution (CC BY) license (https://creativecommons.org/licenses/by/4.0/).
Share and Cite
Philipp, M.; Reich, J.; Geißen, S.-U. Non-Biological Slaughterhouse Wastewater Treatment with Membrane Processes—An Opportunity for Water Recycling. Nanomaterials 2022, 12, 2314. https://doi.org/10.3390/nano12132314
Philipp M, Reich J, Geißen S-U. Non-Biological Slaughterhouse Wastewater Treatment with Membrane Processes—An Opportunity for Water Recycling. Nanomaterials. 2022; 12(13):2314. https://doi.org/10.3390/nano12132314
Chicago/Turabian StylePhilipp, Maximilian, Jascha Reich, and Sven-Uwe Geißen. 2022. "Non-Biological Slaughterhouse Wastewater Treatment with Membrane Processes—An Opportunity for Water Recycling" Nanomaterials 12, no. 13: 2314. https://doi.org/10.3390/nano12132314