
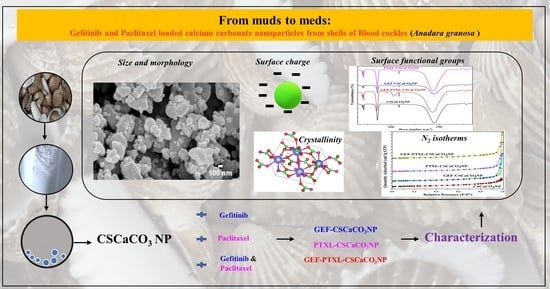
Synthesis and Characterization of Gefitinib and Paclitaxel Mono and Dual Drug-Loaded Blood Cockle Shells (Anadara granosa)-Derived Aragonite CaCO3 Nanoparticles

 ,
,  , , ,
, , ,
Abstract
:
1. Introduction
2. Materials and Methods
2.1. Materials and Reagents
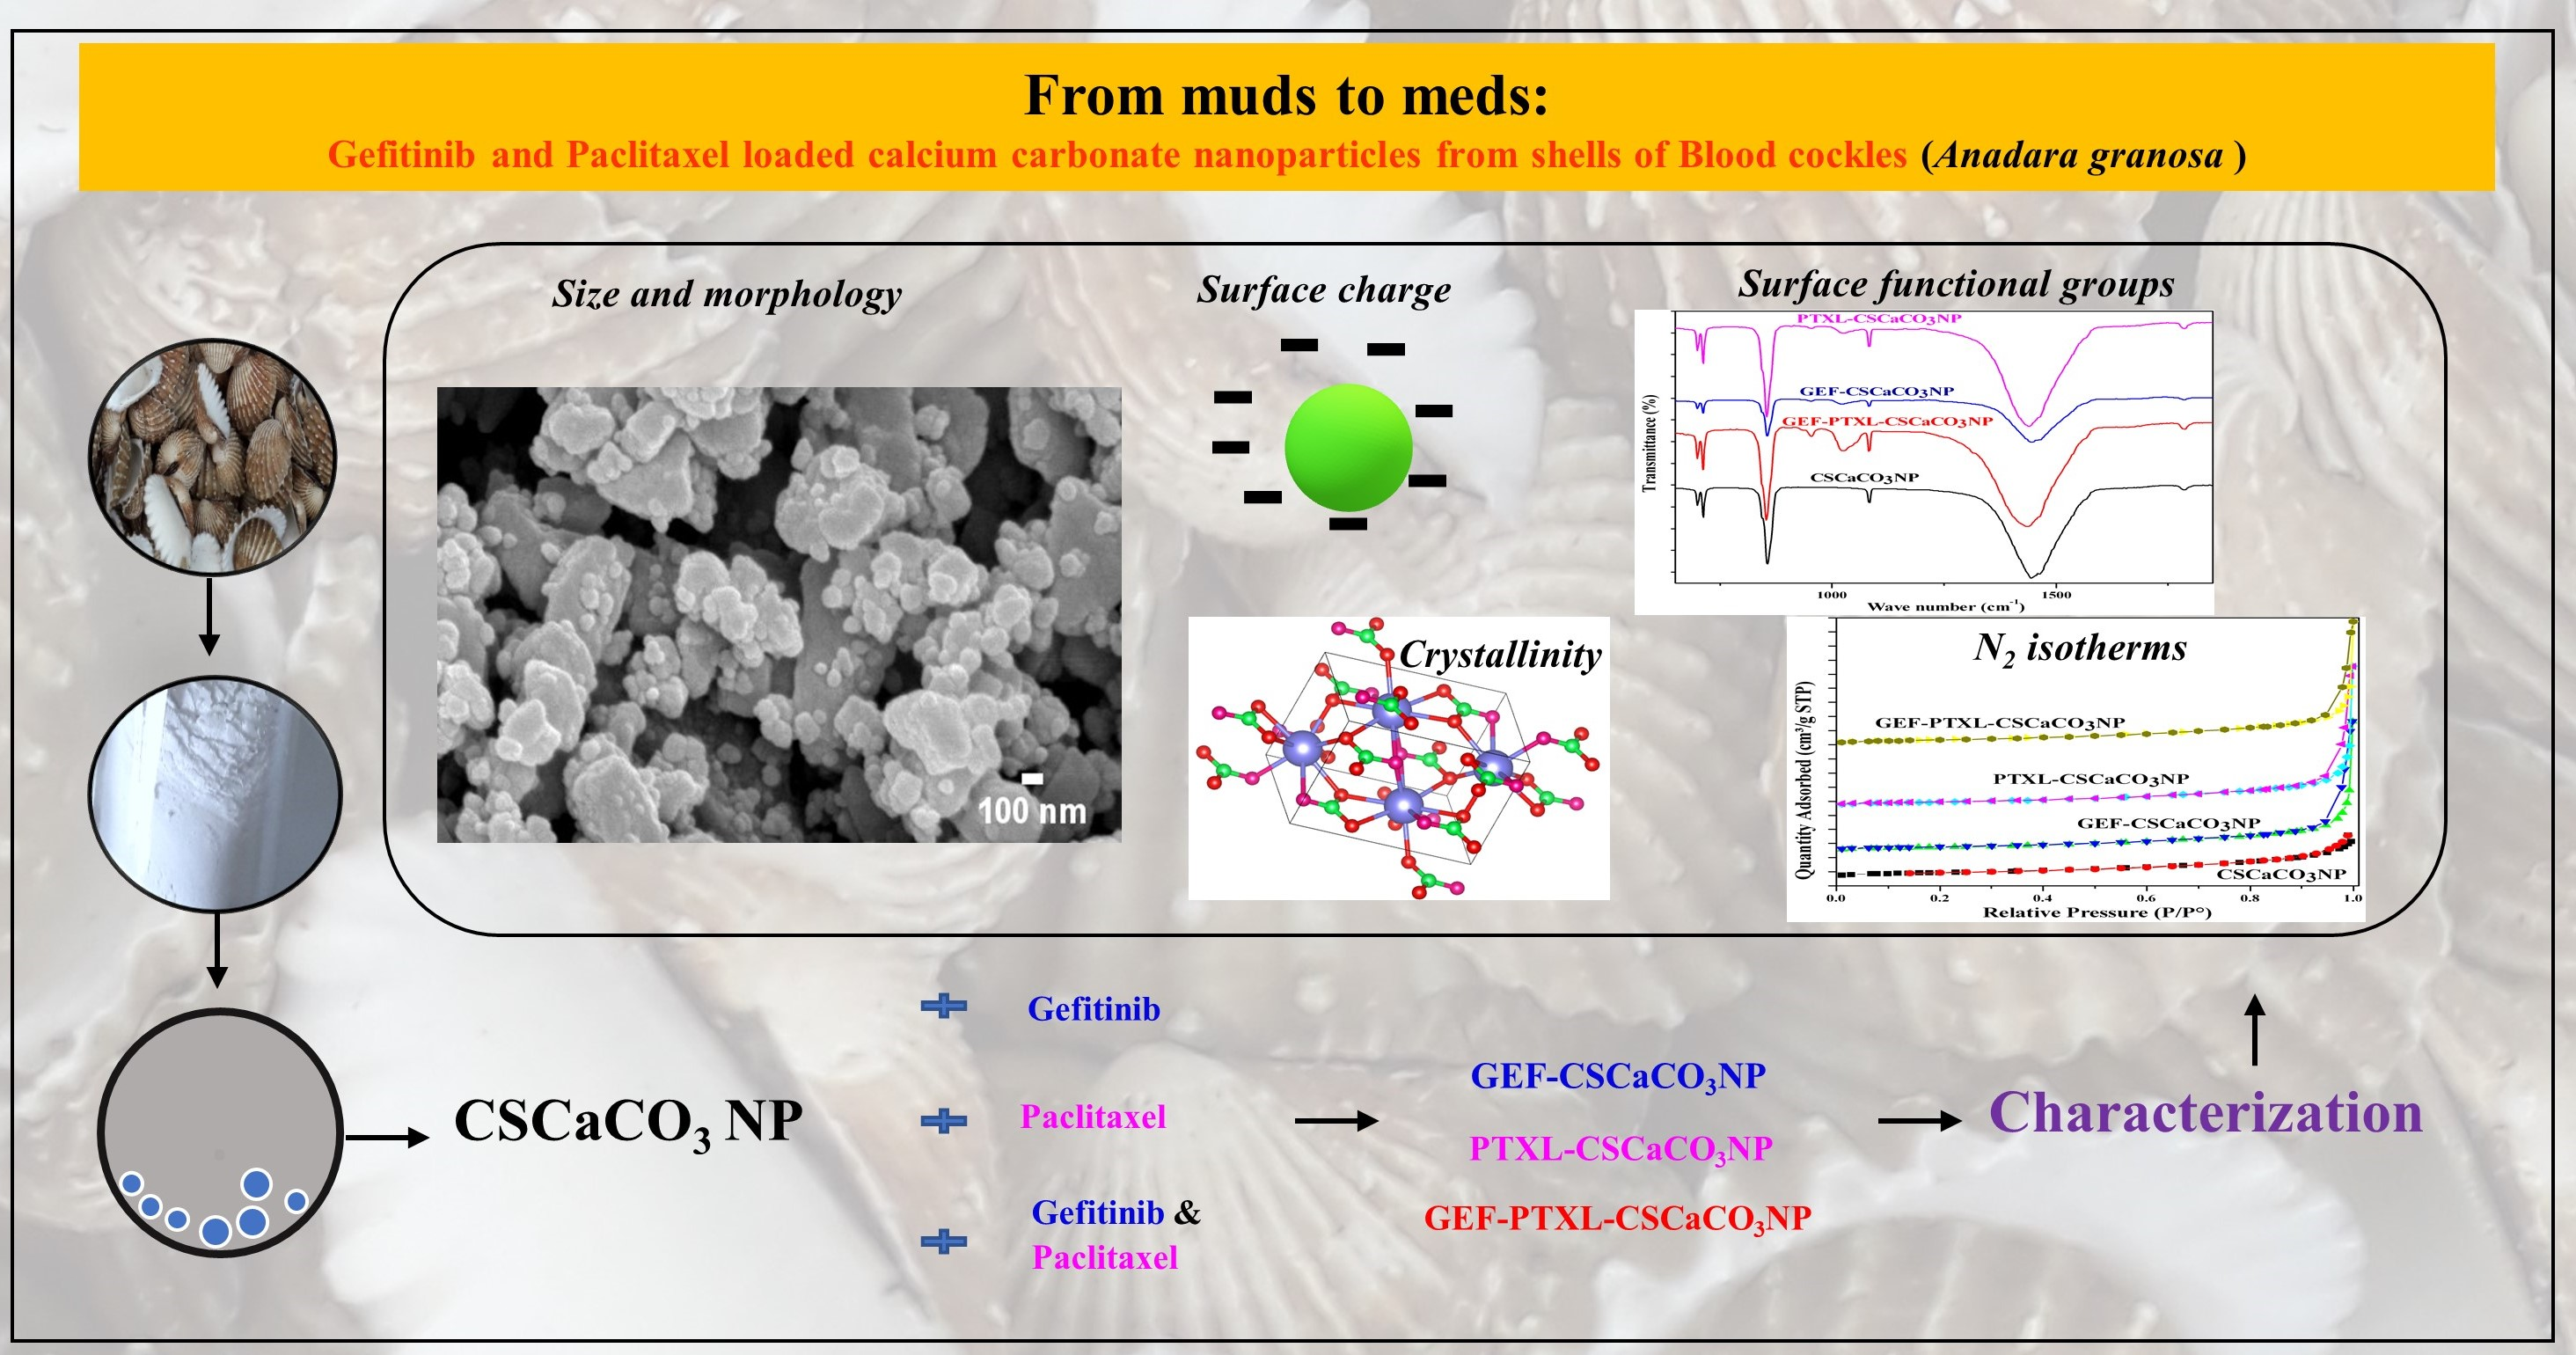
2.2. Synthesis of CSCaCO3NP, GEF-CSCaCO3NP, PTXL-CSCaCO3NP, and GEF-PTXL-CSCaCO3NP
2.2.1. Synthesis of CSCaCO3NP from Cockle Shells Using Tween 80 and Ball Milling
2.2.2. Synthesis of GEF-CSCaCO3NP, PTXL-CSCaCO3NP, and GEF-PTXL-CSCaCO3NP
2.3. Physicochemical Characterization of CSCaCO3NP, GEF-CSCaCO3NP, PTXL-CSCaCO3NP and GEF-PTXL-CSCaCO3NP
2.3.1. UV-Vis Spectrophotometry
2.3.2. Field Emission Scanning Electron Microscopy (FESEM), and Energy Dispersion X-ray (EDX) Spectroscopy
2.3.3. BET and BJH Analysis with N2 Physisorption Isotherms
2.3.4. Dynamic Light Scattering
2.3.5. Powder X-ray Diffraction (PXRD) and Fourier-Transform Infrared Spectroscopy (FTIR)
2.3.6. In Vitro Release Studies of GEF and PTXL
2.3.7. Dissolution Analysis of CSCaCO3NP
2.3.8. Alkalinizing Property of CSCaCO3NP
3. Results
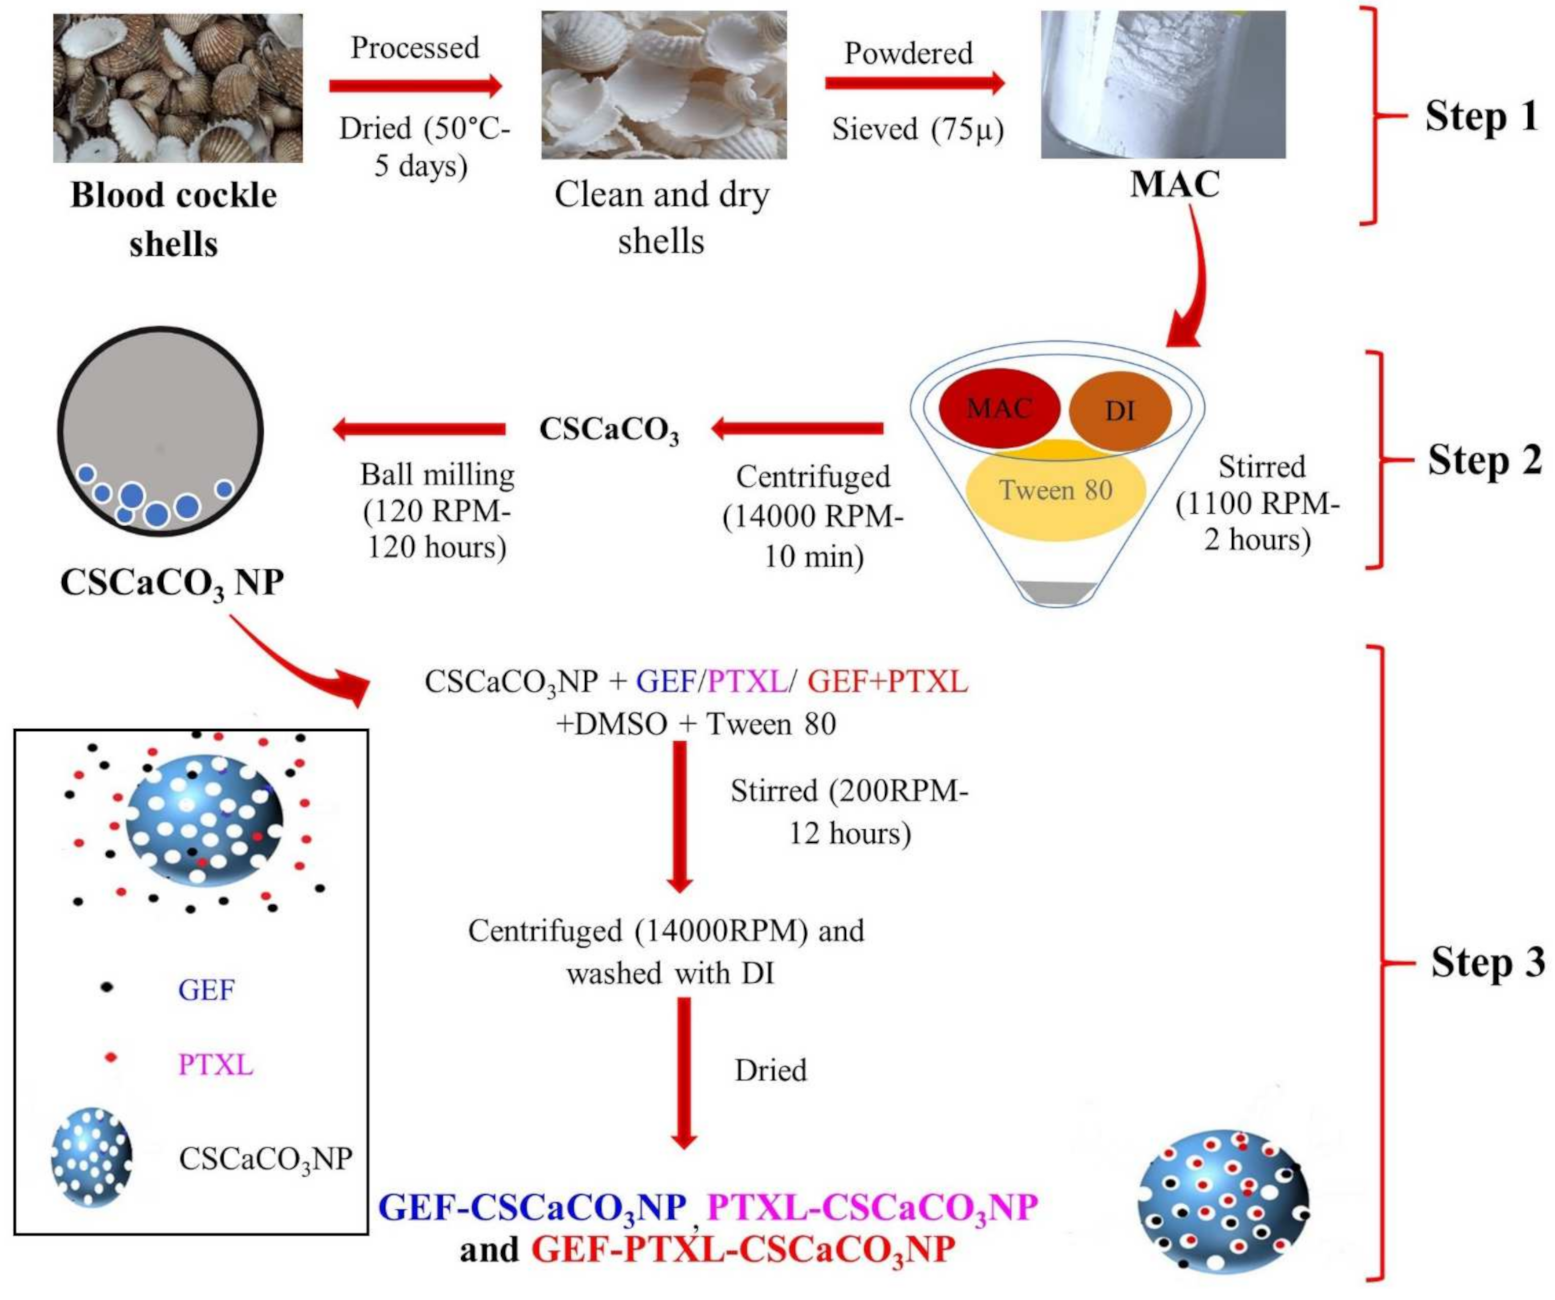
3.1. UV-Vis Spectrophotometry, Drug Loading Content and Encapsulation Efficiency
3.2. Field Emission Scanning Electron Microscopy (FESEM), and Energy Dispersion X-ray (EDX) Spectroscopy
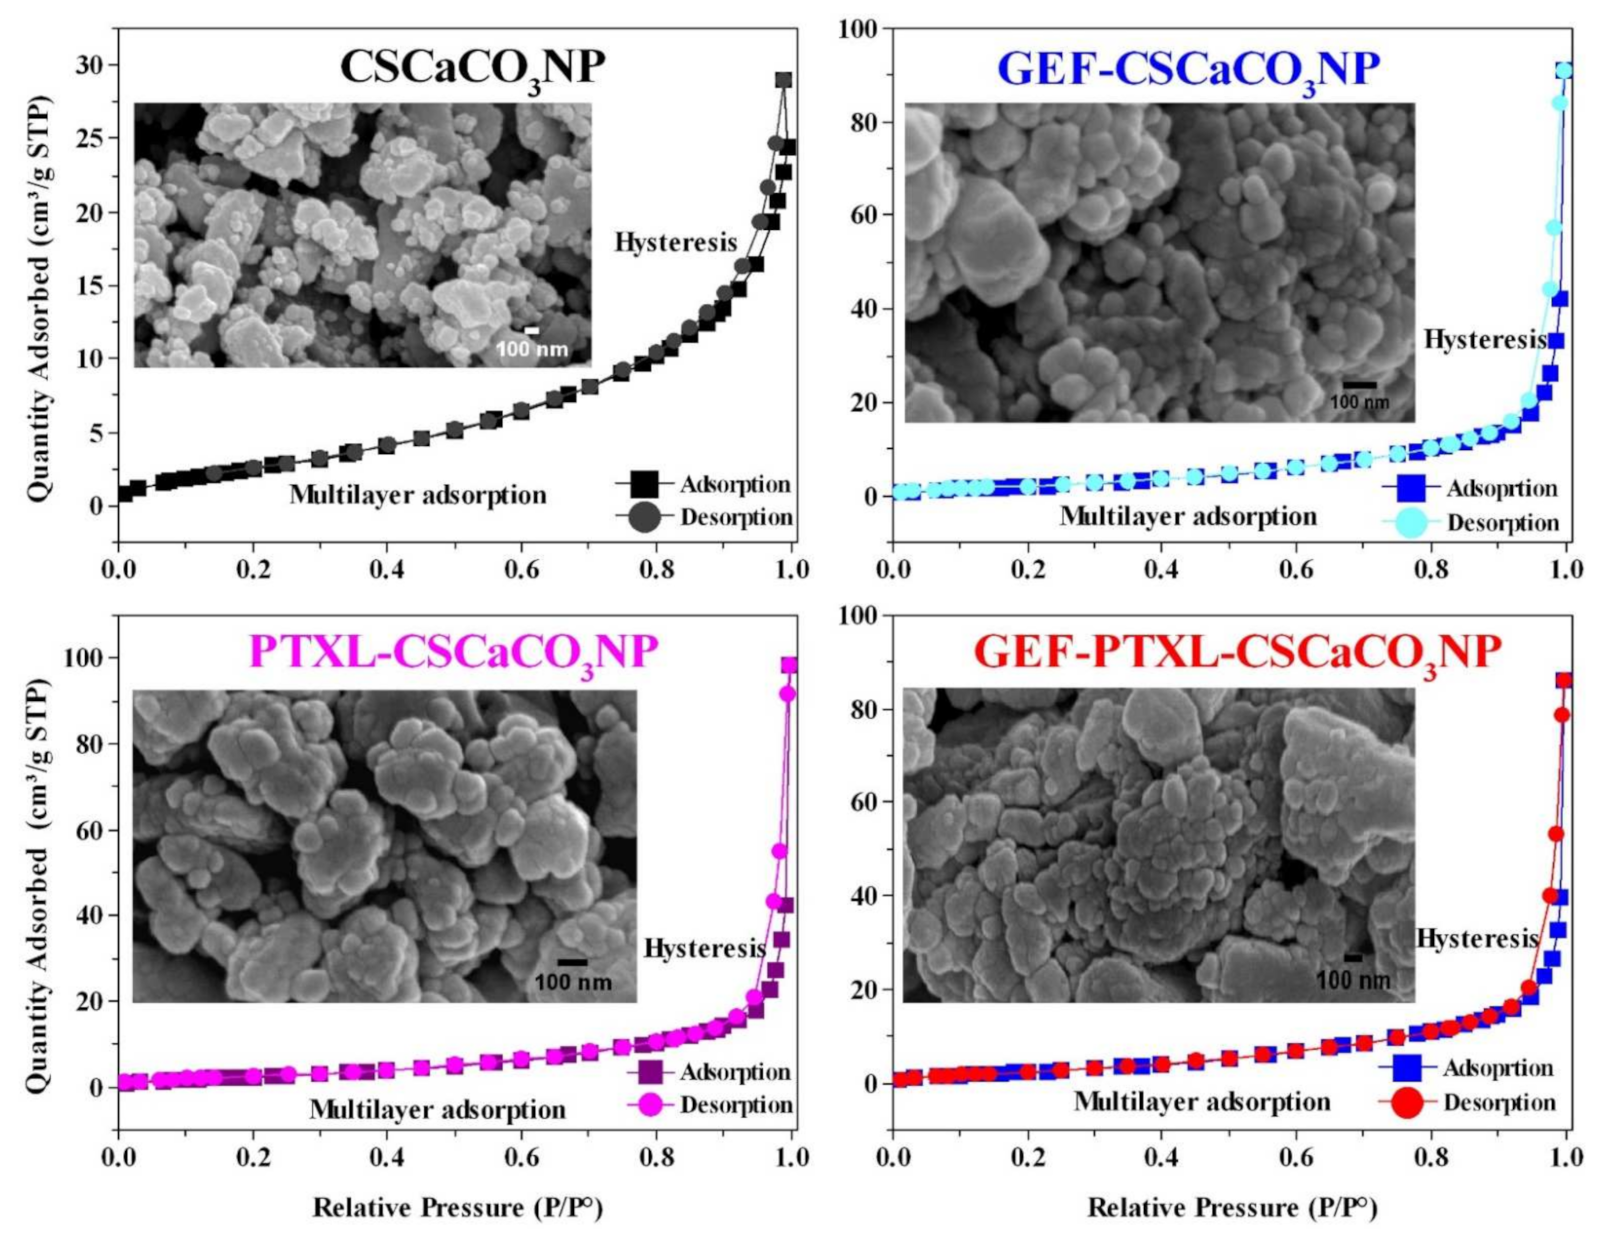
3.3. Specific Surface Area and Pore Size
3.4. Dynamic Light Scattering
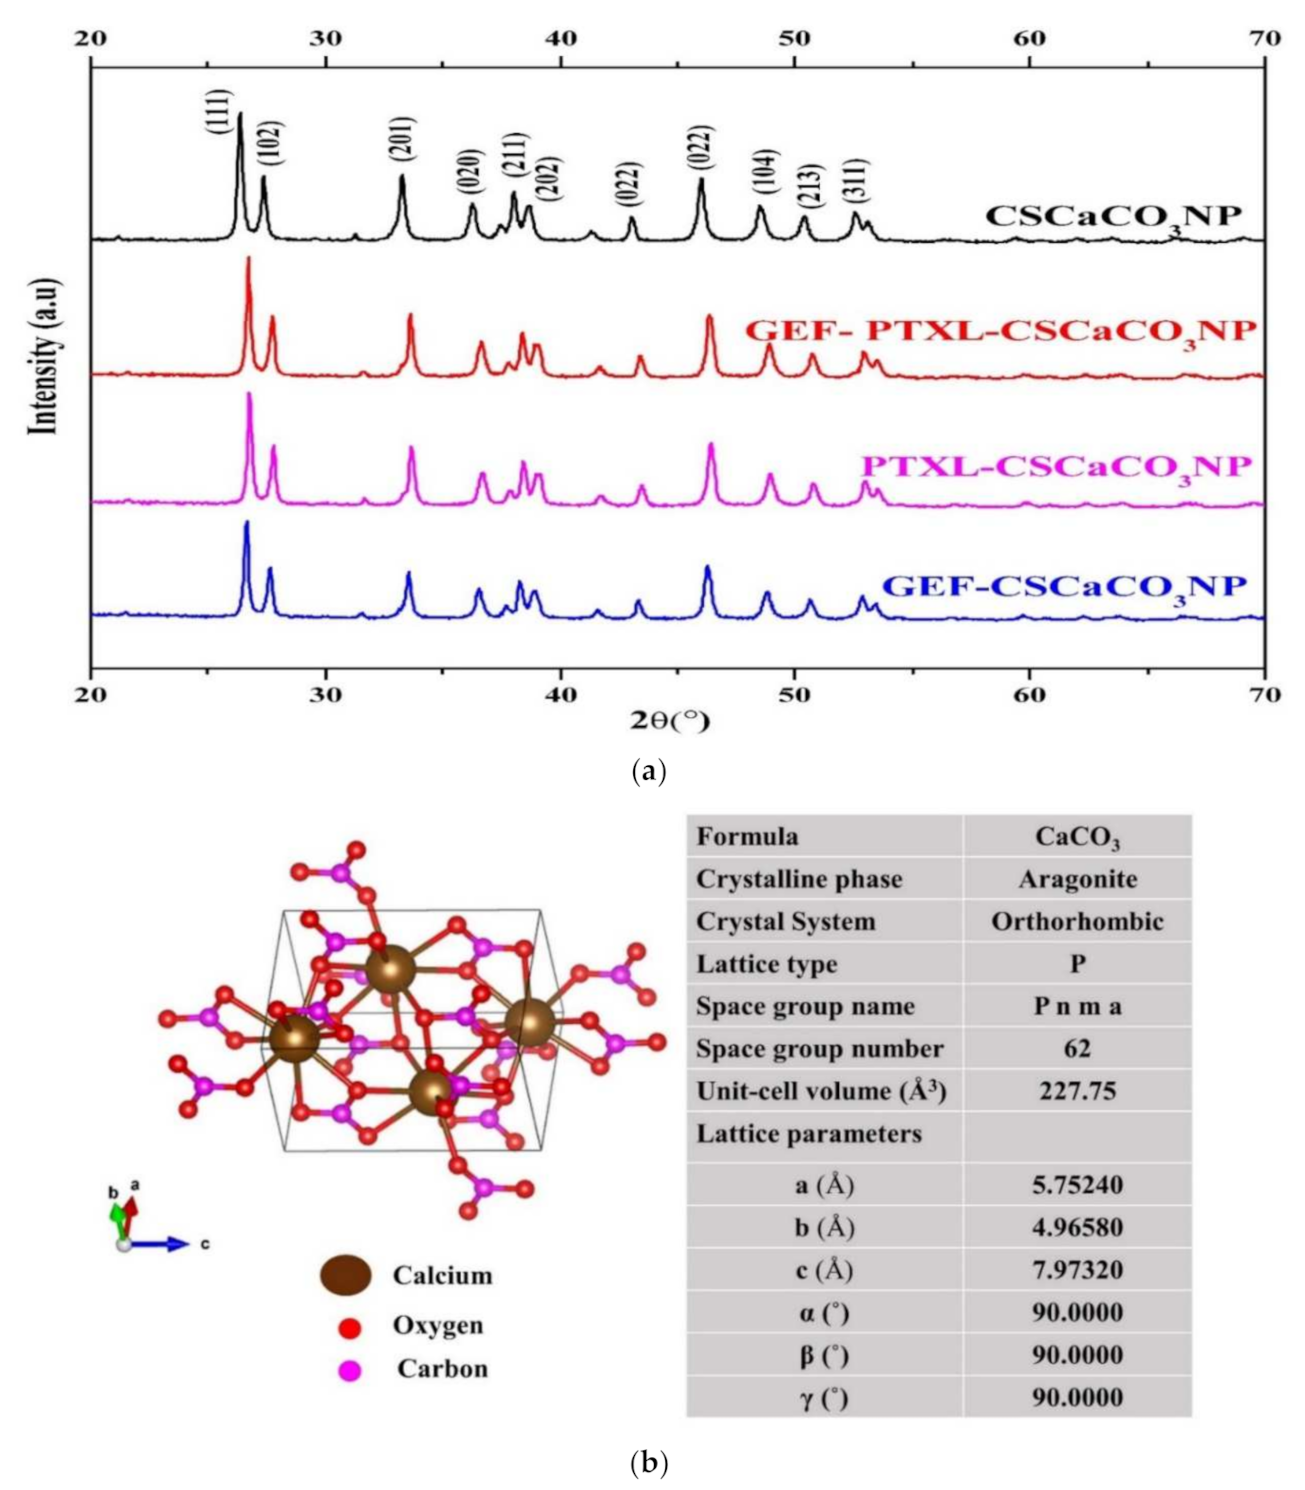
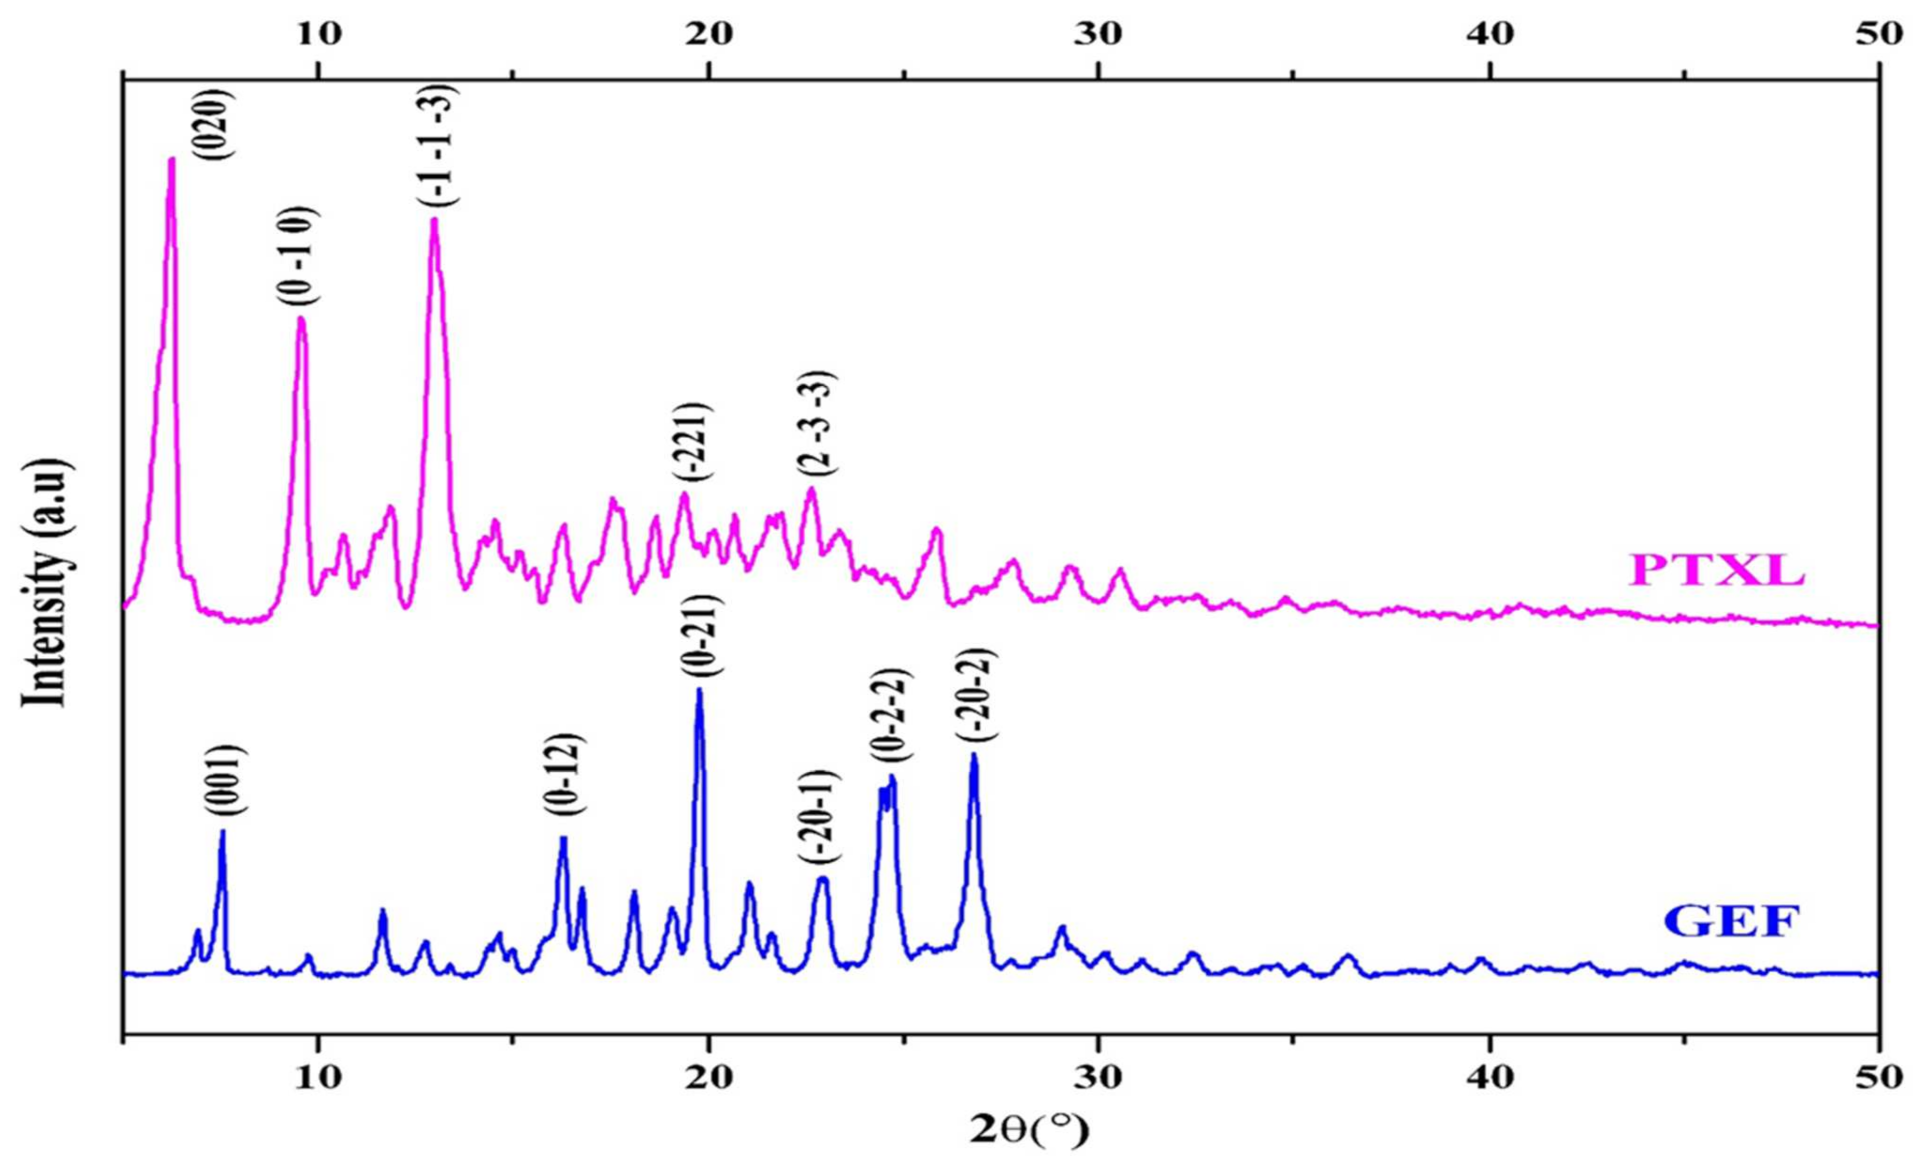
3.5. Powder X-ray Diffraction
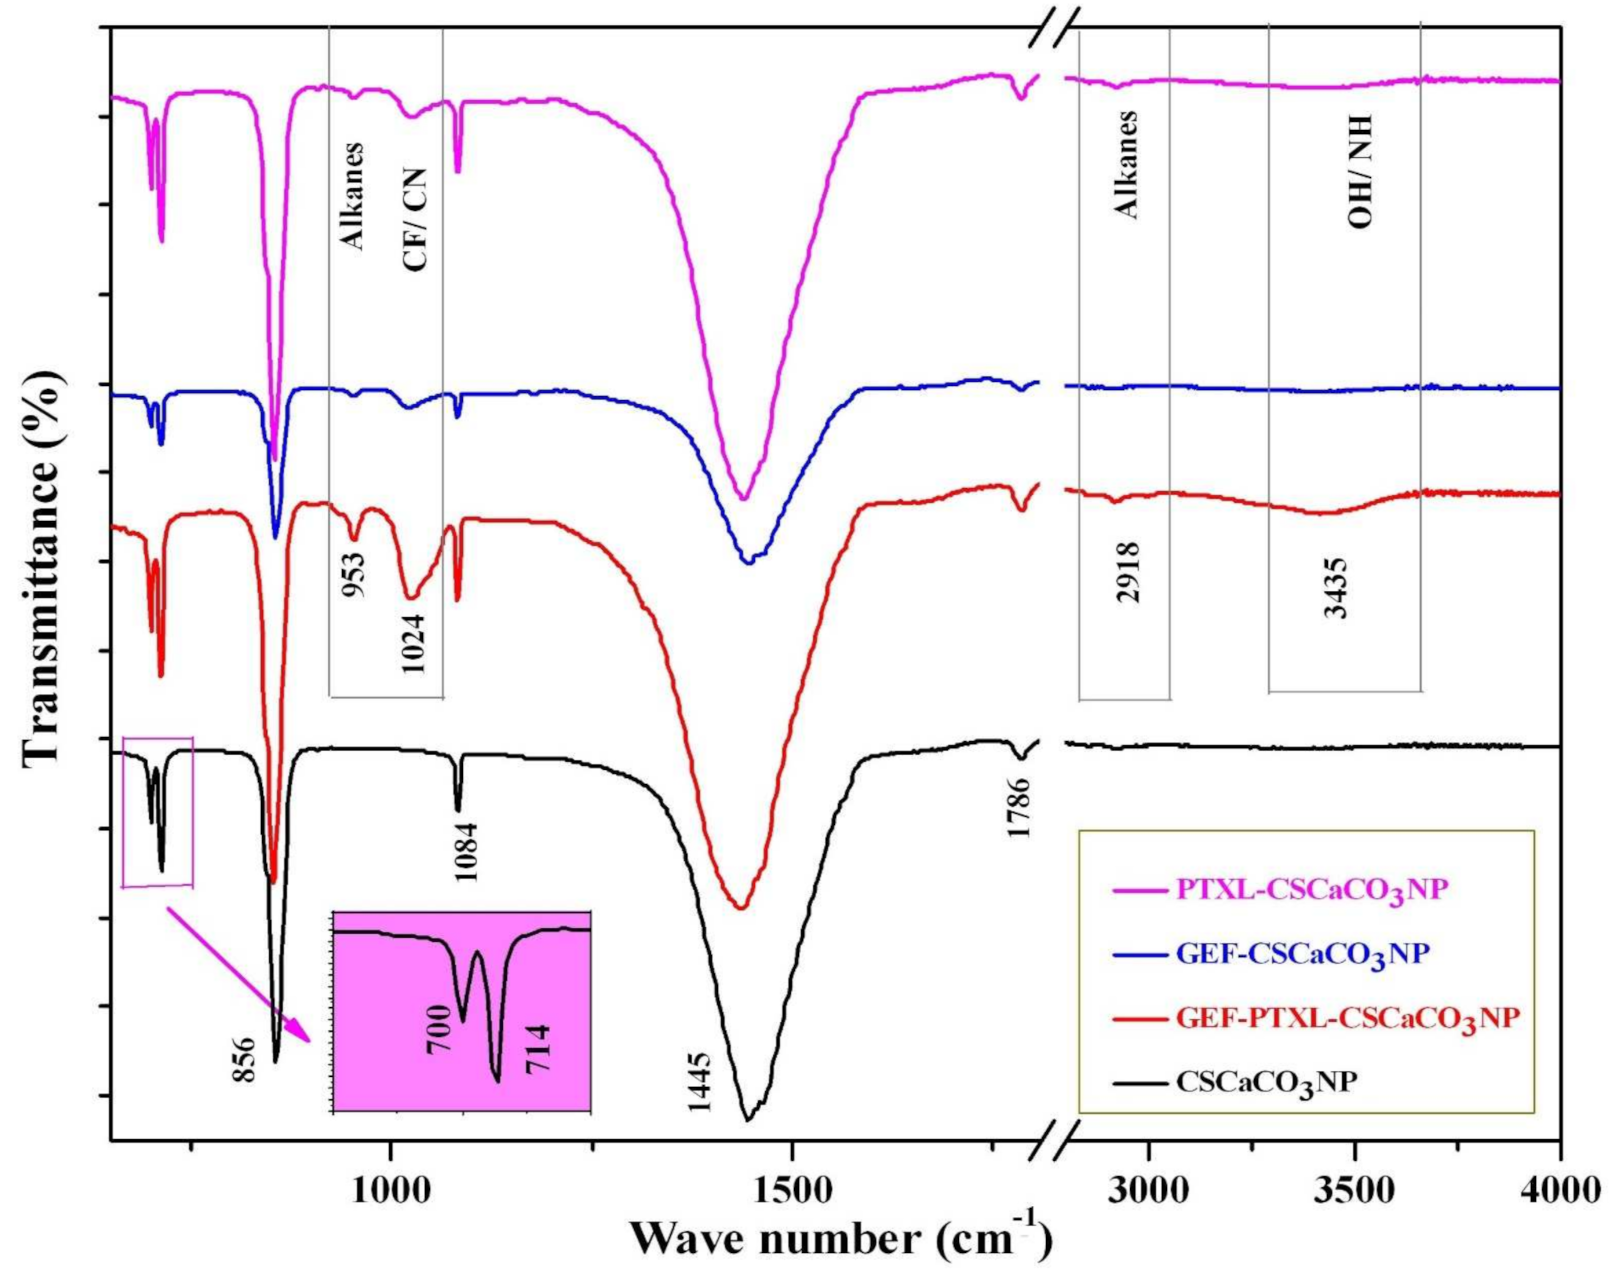
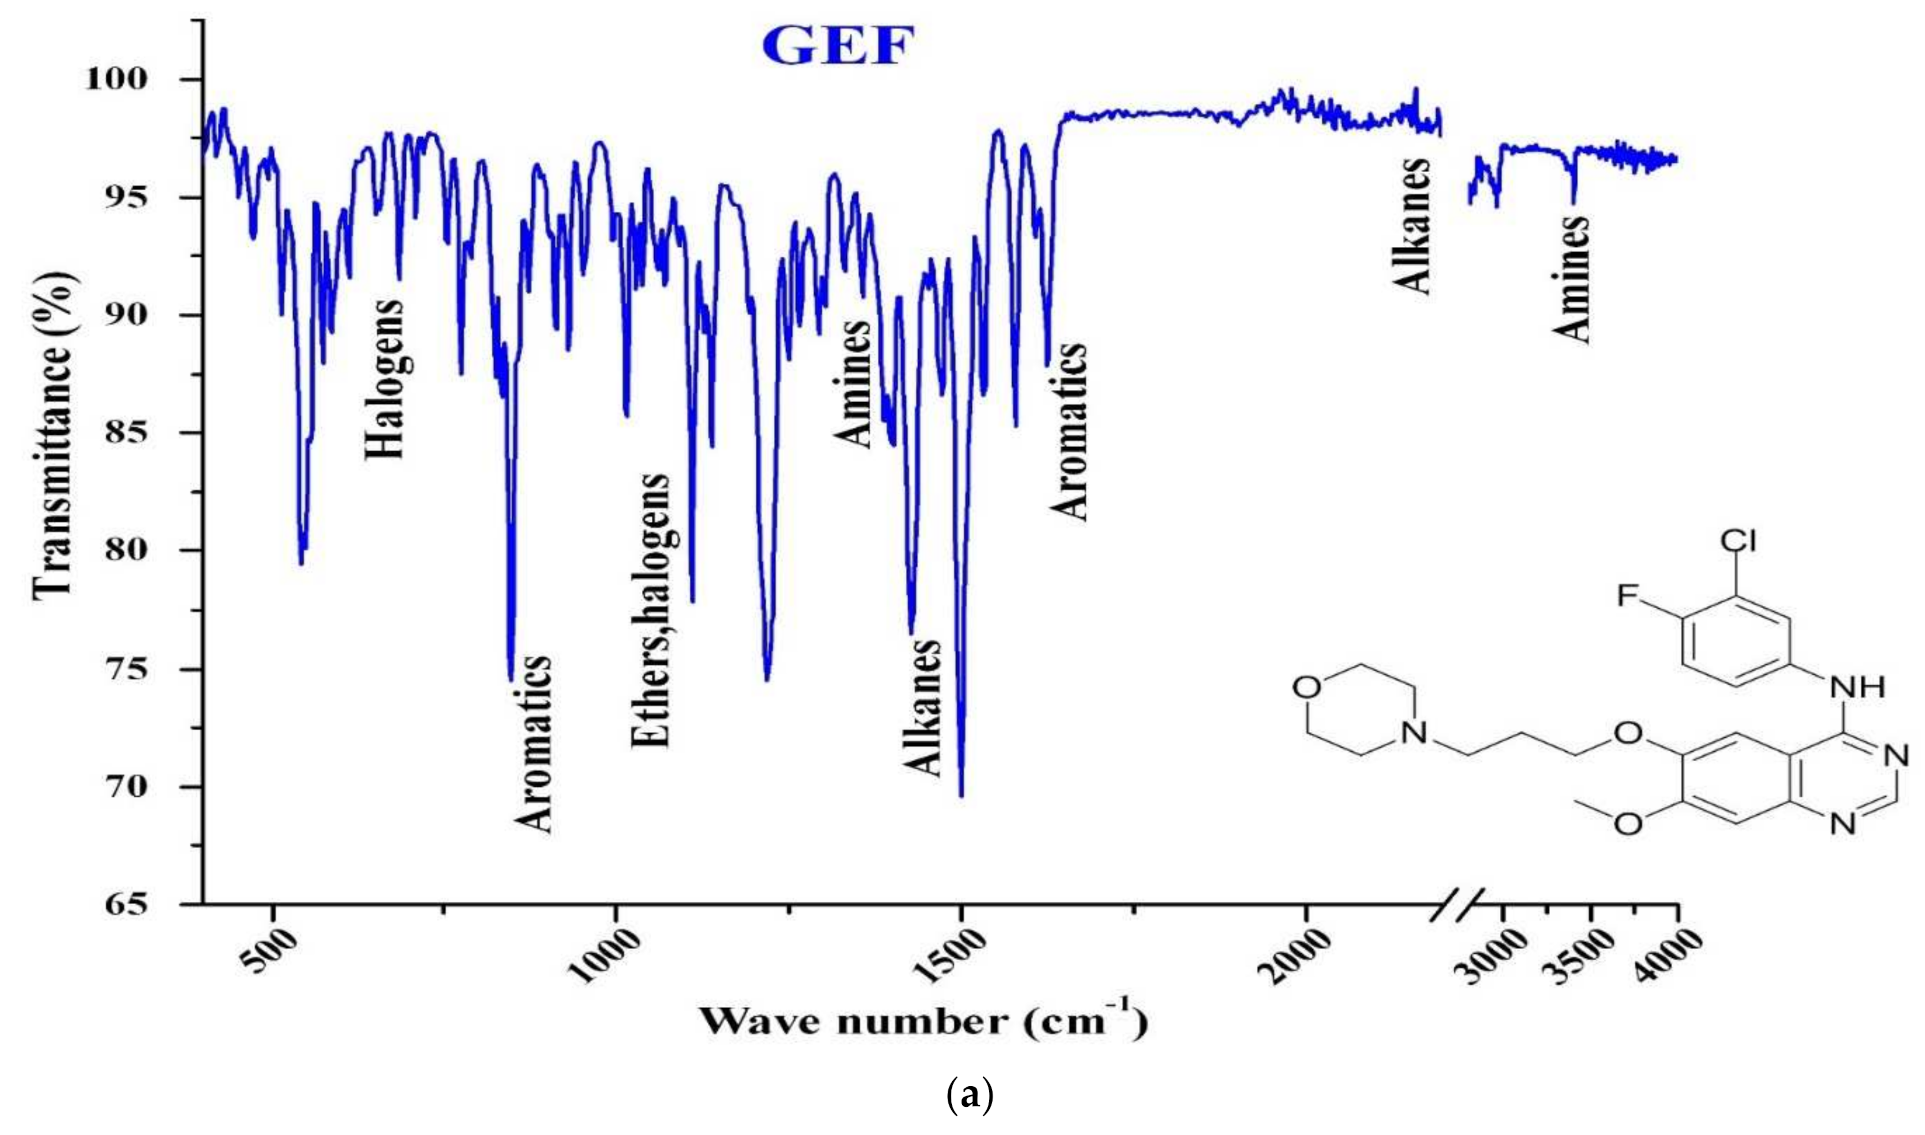
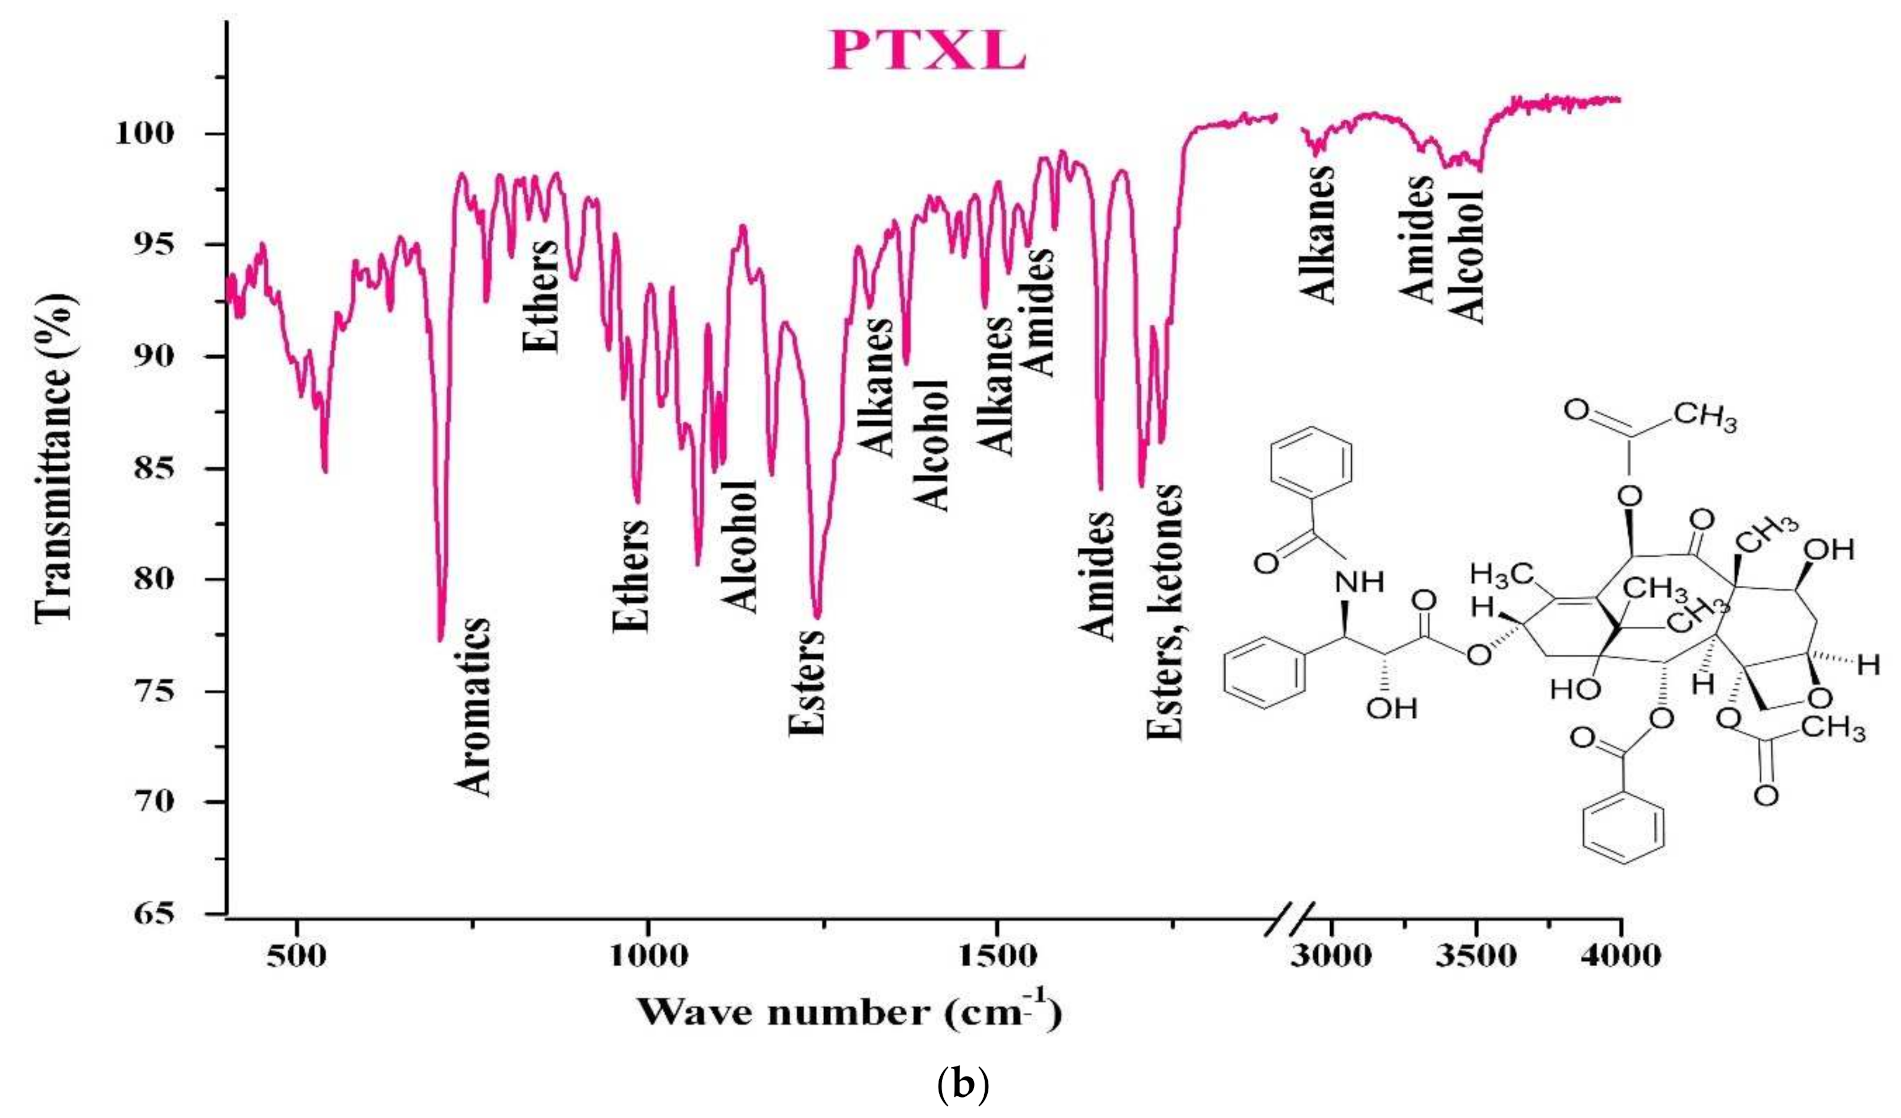
3.6. Fourier-Transform Infrared Spectroscopy (FTIR)
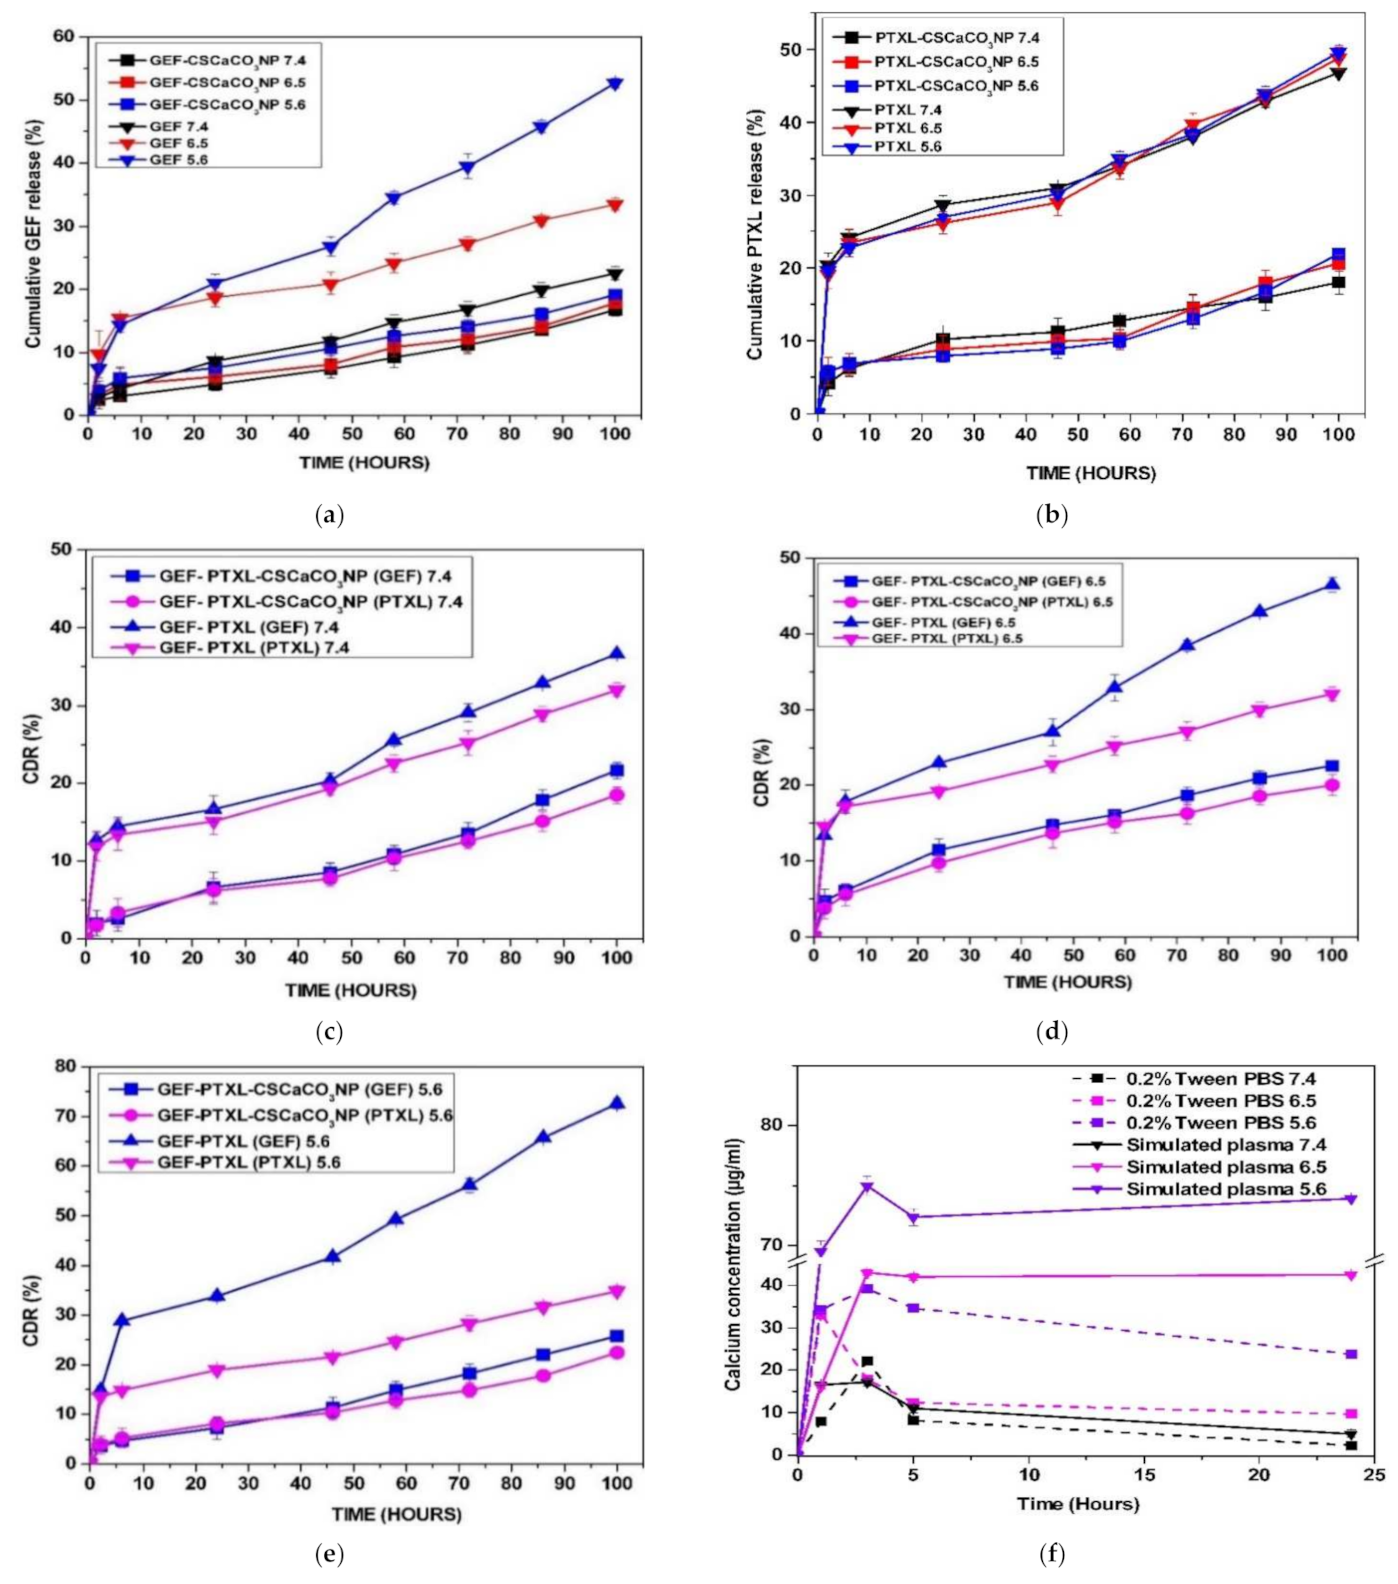
3.7. In Vitro Drug Release
3.8. Dissolution Analysis of CSCaCO3NP
3.9. Alkalinization Profiles of CSCaCO3NP
4. Discussion
5. Conclusions
Author Contributions
Funding
Data Availability Statement
Acknowledgments
Conflicts of Interest
Appendix A
Appendix A.1. Drug Interaction Studies


| GEF | PTXL | ||||
|---|---|---|---|---|---|
| Concentration (µg/mL) | Absorbance (λmax = 332 nm) | Inter-day Absorbance (λmax = 332 nm) | Concentration (µg/mL) | Absorbance (λmax = 248 nm) | Inter-day Absorbance (λmax = 248 nm) |
| 1.25 | 0.06±0.00 | 0.07 ±0.01 | 10.00 | 0.13 ± 0.03 | 0.11 ± 0.04 |
| 2.50 | 0.10 ± 0.02 | 0.11 ± 0.02 | 20.00 | 0.23 ±0.07 | 0.23 ± 0.08 |
| 5.00 | 0.19 ± 0.01 | 0.19 ± 0.01 | 30.00 | 0.34 ± 0.06 | 0.38 ± 0.09 |
| 10.00 | 0.37 ± 0.04 | 0.36± 0.04 | 50.00 | 0.55 ± 0.05 | 0.54 ± 0.08 |
| 15.00 | 0.58 ± 0.00 | 0.58 ± 0.01 | 70.00 | 0.75 ± 0.05 | 0.72 ± 0.07 |
| 20.00 | 0.76 ± 0.01 | 0.76 ± 0.01 | 90.00 | 0.92 ± 0.03 | 0.90 ± 0.06 |
| 25.00 | 0.95 ± 0.02 | 0.95 ± 0.02 | - | ||
| GEF | PTXL | ||||
|---|---|---|---|---|---|
| Concentration (µg/mL) | Absorbance (λmax = 332 nm) | Inter-day Absorbance (λmax = 332 nm) | Concentration (µg/mL) | Absorbance (λmax = 248 nm) | Inter-day Absorbance (λmax = 248 nm) |
| 2.50 | 0.10 ± 0.01 | 0.10 ± 0.01 | 1.25 | 0.18 ± 0.03 | 0.18 ± 0.04 |
| 5.00 | 0.21 ± 0.01 | 0.21 ± 0.01 | 2.50 | 0.36 ± 0.03 | 0.35 ± 0.03 |
| 7.50 | 0.31 ± 0.01 | 0.32 ± 0.03 | 3.75 | 0.55 ± 0.05 | 0.57 ± 0.05 |
| 10.00 | 0.37 ± 0.04 | 0.38 ± 0.04 | 5.00 | 0.66 ± 0.05 | 0.67 ± 0.03 |
| 12.50 | 0.50 ± 0.01 | 0.49 ± 0.01 | 6.25 | 0.88 ± 0.03 | 0.87 ± 0.03 |
| 15.00 | 0.58 ± 0.01 | 0.58 ± 0.01 | 7.50 | 1.04 ± 0.03 | 1.03 ± 0.02 |
| 20.00 | 0.77 ± 0.04 | 0.77 ± 0.04 | 10.00 | 1.35 ± 0.06 | 1.35 ± 0.02 |
Appendix A.2. Linearity
| Parameters | GEF | PTXL | DUAL | |
|---|---|---|---|---|
| GEF | PTXL | |||
| λmax (nm) | 332 | 248 | 332 | 248 |
| Beer’s law range (µg/mL) | 2.5–25 | 10–90 | 2.5–20 | 1.25–10 |
| Regression Equation (y = mx +b) | 0.038x + 0.0055 | 0.015x + 0.035 | 0.0379x + 0.0157 | 0.1337x + 0.0301 |
| Regression coefficient (r2) | 0.9995 | 0.9988 | 0.9992 | 0.9988 |
| Recovery (%) | 100.4 | 100.3 | 98.6 | 101.2 |
| Accuracy (mean recovery% ± SD of recovery %) | 100.4 ± 0.6 | 100.3 ± 2.4 | 98.6 ± 5.2 | 101.2 ± 2.0 |
Appendix A.3. Precision and Accuracy
Appendix A.4. Sensitivity, LOD and LOQ
| Drug | Actual Concentration (µg/mL) | Found Concentration (µg/mL) | Recovery (%) | RSD (%) | |
|---|---|---|---|---|---|
| GEF | 10.00 | 10.14 | 101.5 | 1.4 | |
| 15.00 | 15.05 | 100.6 | 0.6 | ||
| 20.00 | 19.88 | 99.4 | 1.3 | ||
| PTXL | 10.00 | 10.13 | 101.3 | 1.0 | |
| 20.00 | 20.53 | 102.7 | 0.5 | ||
| 30.00 | 30.93 | 103.1 | 1.2 | ||
| Dual | GEF | 7.50 | 7.60 | 101.4 | 0.7 |
| 12.50 | 12.71 | 100.7 | 1.0 | ||
| 15.00 | 15.11 | 100.7 | 1.0 | ||
| PTXL | 3.75 | 3.90 | 104.4 | 0.4 | |
| 2.50 | 2.55 | 102.2 | 1.0 | ||
| 7.50 | 7.60 | 102.2 | 2.0 | ||
| Drug | Concentration Added (µg/mL) | Found Concentration (µg/mL) | RSD (%) | LOD (µg/mL) | LOQ (µg/mL) | |
|---|---|---|---|---|---|---|
| GEF | 10.00 | 10.04 ± 0.1 | 0.7 | 1 | 3 | |
| 15.00 | 15.14 ± 0.1 | 0.3 | ||||
| 20.00 | 19.82 ± 0.2 | 1.1 | ||||
| PTXL | 20.00 | 22.66 ± 0.4 | 1.8 | 6.9 | 20.8 | |
| 90.00 | 83.06 ± 0.2 | 0.2 | ||||
| 110.00 | 104.43 ± 1 | 1.0 | ||||
| Dual | GEF | 5.00 | 5.04 ± 0.1 | 1.6 | 1.7 | 4.2 |
| 12.50 | 12.52 ± 0.1 | 0.9 | ||||
| 15.00 | 15.12 ± 0.1 | 0.8 | ||||
| PTXL | 3.75 | 3.96 ± 0.1 | 1.9 | 0.8 | 2.3 | |
| 6.25 | 6.16 ± 0.1 | 1.3 | ||||
| 7.50 | 7.53 ± 0.1 | 0.6 | ||||


References
- Bray, F.; Ferlay, J.; Soerjomataram, I.; Siegel, R.L.; Torre, L.A.; Jemal, A. Global cancer statistics 2018: GLOBOCAN estimates of incidence and mortality worldwide for 36 cancers in 185 countries. CA. Cancer J. Clin. 2018, 68, 394–424. [Google Scholar] [CrossRef] [Green Version]
- WHO Breast Cancer: Globocan 2020. Available online: https://gco.iarc.fr/today/data/factsheets/cancers/20-Breast-fact-sheet.pdf (accessed on 10 February 2021).
- Liao, W.-S.; Ho, Y.; Lin, Y.-W.; Naveen Raj, E.; Liu, K.-K.; Chen, C.; Zhou, X.-Z.; Lu, K.-P.; Chao, J.-I. Targeting EGFR of triple-negative breast cancer enhances the therapeutic efficacy of paclitaxel- and cetuximab-conjugated nanodiamond nanocomposite. Acta Biomater. 2019, 86, 395–405. [Google Scholar] [CrossRef] [PubMed]
- Klijn, J.G.M.; Berns, P.M.J.J.; Schmitz, P.I.M.; Foekens, J.A. The Clinical Significance of Epidermal Growth Factor Receptor (EGF-R) in Human Breast Cancer: A Review on 5232 Patients*. Endocr. Rev. 1992, 13, 3–17. [Google Scholar] [CrossRef] [PubMed] [Green Version]
- Slamon, D.; Godolphin, W.; Jones, L.; Holt, J.; Wong, S.; Keith, D.; Levin, W.; Stuart, S.; Udove, J.; Ullrich, A.; et al. Studies of the HER-2/neu proto-oncogene in human breast and ovarian cancer. Science 1989, 244, 707–712. [Google Scholar] [CrossRef] [PubMed]
- Barker, A.J.; Gibson, K.H.; Grundy, W.; Godfrey, A.A.; Barlow, J.J.; Healy, M.P.; Woodburn, J.R.; Ashton, S.E.; Curry, B.J.; Scarlett, L.; et al. Studies leading to the identification of ZD1839 (iressaTM): An orally active, selective epidermal growth factor receptor tyrosine kinase inhibitor targeted to the treatment of cancer. Bioorg. Med. Chem. Lett. 2001, 11, 1911–1914. [Google Scholar] [CrossRef]
- Ward, W.H.J.; Cook, P.N.; Slater, A.M.; Davies, D.H.; Holdgate, G.A.; Green, L.R. Epidermal growth factor receptor tyrosine kinase. Biochem. Pharmacol. 1994, 48, 659–666. [Google Scholar] [CrossRef]
- Ranson, M.; Mansoor, W.; Jayson, G. ZD1839 (IRESSATM): A selective EGFR-TK inhibitor. Expert Rev. Anticancer Ther. 2002, 2, 161–168. [Google Scholar] [CrossRef]
- Albanell, J.; Rojo, F.; Baselga, J. Pharmacodynamic studies with the epidermal growth factor receptor tyrosine kinase inhibitor ZD1839. Semin. Oncol. 2001, 28, 56–66. [Google Scholar] [CrossRef]
- Yarden, Y.; Baselga, J.; Miles, D. Molecular approach to breast cancer treatment. Semin. Oncol. 2004, 31, 6–13. [Google Scholar] [CrossRef]
- Blanco, E.; Shen, H.; Ferrari, M. Principles of nanoparticle design for overcoming biological barriers to drug delivery. Nat. Biotechnol. 2015, 33, 941–951. [Google Scholar] [CrossRef]
- Danhier, F.; Feron, O.; Préat, V. To exploit the tumor microenvironment: Passive and active tumor targeting of nanocarriers for anti-cancer drug delivery. J. Control. Release 2010, 148, 135–146. [Google Scholar] [CrossRef]
- Matsumura, Y.; Maeda, H. A new concept for macromolecular therapeutics in cancer chemotherapy: Mechanism of tumoritropic accumulation of proteins and the antitumor agent smancs. Cancer Res. 1986, 46, 6387–6392. [Google Scholar] [PubMed]
- Ibiyeye, K.M.; Nordin, N.; Ajat, M.; Zuki, A.B.Z. Ultrastructural changes and antitumor effects of Doxorubicin/Thymoquinone-Loaded CaCO3 nanoparticles on breast cancer cell line. Front. Oncol. 2019, 9, 599. [Google Scholar] [CrossRef] [Green Version]
- Kamba, A.; Ismail, M.; Ibrahim, T.; Zakaria, Z. Biocompatibility of bio based calcium carbonate nanocrystals aragonite polymorph on NIH 3T3 fibroblast cell line. Afr. J. Tradit. Complement. Altern. Med. 2014, 11, 31. [Google Scholar] [CrossRef] [PubMed]
- Jaji, A.Z.; Zakaria, Z.A.B.; Mahmud, R.; Loqman, M.Y.; Hezmee, M.N.M.; Abba, Y.; Isa, T.; Mahmood, S.K. Safety assessments of subcutaneous doses of aragonite calcium carbonate nanocrystals in rats. J. Nanopart. Res. 2017, 19, 175. [Google Scholar] [CrossRef] [Green Version]
- Maleki Dizaj, S.; Barzegar-Jalali, M.; Zarrintan, M.H.; Adibkia, K.; Lotfipour, F. Calcium carbonate nanoparticles as cancer drug delivery system. Expert Opin. Drug Deliv. 2015, 12, 1649–1660. [Google Scholar] [CrossRef]
- Islam, K.N.; Bakar, M.Z.B.A.; Noordin, M.M.; Hussein, M.Z.B.; Rahman, N.S.B.A.; Ali, M.E. Characterisation of calcium carbonate and its polymorphs from cockle shells (Anadara granosa). Powder Technol. 2011, 213, 188–191. [Google Scholar] [CrossRef]
- Som, A.; Raliya, R.; Tian, L.; Akers, W.; Ippolito, J.E.; Singamaneni, S.; Biswas, P.; Achilefu, S. Monodispersed calcium carbonate nanoparticles modulate local pH and inhibit tumor growth in vivo. Nanoscale 2016, 8, 12639–12647. [Google Scholar] [CrossRef] [PubMed] [Green Version]
- Mohamed, M.; Yousuf, S.; Maitra, S. Decomposition study of calcium carbonate in cockle shell. J. Eng. Sci. Technol. 2012, 7, 1–10. [Google Scholar]
- Awang, J.A.; Zakaria, M.Z.A.B.; Mohamed Mustapha, N.; Abu, J.; Yusof, N. Mineral composition of the Cockle (Anadara granosa ) shells of West coast of Peninsular Malaysia and it’s potential as biomaterial for use in bone repair. Artic. J. Anim. Vet. Adv. 2007, 5, 591–594. [Google Scholar]
- Bharatham, H.; Zakaria, M.Z.A.B.; Perimal, E.K.; Yusof, L.M.; Hamid, M. Mineral and physiochemical evaluation of Cockle shell (Anadara granosa) and other selected Molluscan shell as potential biomaterials. Sains Malays. 2014, 43, 1023–1029. [Google Scholar]
- Addadi, L.; Raz, S.; Weiner, S. Taking advantage of disorder: Amorphous calcium carbonate and its roles in biomineralization. Adv. Mater. 2003, 15, 959–970. [Google Scholar] [CrossRef]
- Bello Bugallo, P.M.; Cristóbal Andrade, L.; Magán Iglesias, A.; Torres López, R. Integrated environmental permit through Best Available Techniques: Evaluation of the fish and seafood canning industry. J. Clean. Prod. 2013, 47, 253–264. [Google Scholar] [CrossRef]
- Kwon, Y.T.; Lee, C.W.; Yun, J.H. Development of vermicast from sludge and powdered oyster shell. J. Clean. Prod. 2009, 17, 708–711. [Google Scholar] [CrossRef]
- Seco, N.; Fernández-Sanjurjo, M.J.; Núñez-Delgado, A.; Alvarez, E. Spreading of mixtures including wastes from the mussel shell treatment industry on an acid soil: Effects on the dissolved aluminum species and on pasture production. J. Clean. Prod. 2014, 70, 154–163. [Google Scholar] [CrossRef]
- Herbst, R.S. Review of epidermal growth factor receptor biology. Int. J. Radiat. Oncol. 2004, 59, S21–S26. [Google Scholar] [CrossRef]
- Bulusu, K.C.; Guha, R.; Mason, D.J.; Lewis, R.P.I.; Muratov, E.; Kalantar Motamedi, Y.; Cokol, M.; Bender, A. Modelling of compound combination effects and applications to efficacy and toxicity: State-of-the-art, challenges and perspectives. Drug Discov. Today 2016, 21, 225–238. [Google Scholar] [CrossRef] [Green Version]
- Jia, J.; Zhu, F.; Ma, X.; Cao, Z.W.; Li, Y.X.; Chen, Y.Z. Mechanisms of drug combinations: Interaction and network perspectives. Nat. Rev. Drug Discov. 2009, 8, 111–128. [Google Scholar] [CrossRef]
- Takabatake, D.; Fujita, T.; Shien, T.; Kawasaki, K.; Taira, N.; Yoshitomi, S.; Takahashi, H.; Ishibe, Y.; Ogasawara, Y.; Doihara, H. Tumor inhibitory effect of gefitinib (ZD1839, Iressa) and taxane combination therapy in EGFR-overexpressing breast cancer cell lines (MCF7/ADR, MDA-MB-231). Int. J. Cancer 2006, 120, 181–188. [Google Scholar] [CrossRef] [PubMed] [Green Version]
- Ciardiello, F.; Caputo, R.; Bianco, R.; Damiano, V.; Pomatico, G.; De Placido, S.; Bianco, A.R.; Tortora, G. Antitumor effect and potentiation of cytotoxic drugs activity in human cancer cells by ZD-1839 (Iressa), an epidermal growth factor receptor-selective tyrosine kinase inhibitor 1. Clin. Cancer Res. 2000, 6, 2053–2061. [Google Scholar] [PubMed]
- Estrella, V.; Chen, T.; Lloyd, M.; Wojtkowiak, J.; Cornnell, H.H.; Ibrahim-Hashim, A.; Bailey, K.; Balagurunathan, Y.; Rothberg, J.M.; Sloane, B.F.; et al. Acidity generated by the tumor microenvironment drives local invasion. Cancer Res. 2013, 73, 1524–1535. [Google Scholar] [CrossRef] [Green Version]
- Danmaigoro, A.; Selvarajah, G.T.; Noor, M.H.M.; Mahmud, R.; Zakaria, Z.A.B. Development of Cockleshell (Anadara granosa) derived CaCO3 nanoparticle for Doxorubicin delivery. J. Comput. Theor. Nanosci. 2017, 14, 5074–5086. [Google Scholar] [CrossRef]
- Hamidu, A.; Mokrish, A.; Mansor, R.; Razak, I.S.A.; Danmaigoro, A.; Jaji, A.Z.; Bakar, Z.A. Modified methods of nanoparticles synthesis in pH-sensitive nano-carriers production for doxorubicin delivery on MCF-7 breast cancer cell line. Int. J. Nanomed. 2019, 14, 3615–3627. [Google Scholar] [CrossRef] [Green Version]
- Kamba, A.S.; Ismail, M.; Tengku Ibrahim, T.A.; Zakaria, Z.A.B. A pH-sensitive, biobased Calcium carbonate aragonite nanocrystal as a novel anticancer delivery system. Biomed. Res. Int. 2013, 2013, 587451. [Google Scholar] [CrossRef]
- Ueno, Y.; Futagawa, H.; Takagi, Y.; Ueno, A.; Mizushima, Y. Drug-incorporating calcium carbonate nanoparticles for a new delivery system. J. Control. Release 2005, 103, 93–98. [Google Scholar] [CrossRef]
- Hammadi, N.I.; Abba, Y.; Hezmee, M.N.M.; Razak, I.S.A.; Jaji, A.Z.; Isa, T.; Mahmood, S.K.; Zakaria, M.Z.A.B. Formulation of a sustained release Docetaxel loaded Cockle shell-derived Calcium Carbonate nanoparticles against Breast cancer. Pharm. Res. 2017, 34, 1193–1203. [Google Scholar] [CrossRef] [PubMed]
- Jaji, A.Z.; Zakaria, Z.; Mahmud, R.; Loqman, M.Y.; Hezmee, M.N.M.; Isa, T.; Wenliang, F.; Hammadi, N.I. Synthesis, characterization, and cytocompatibility of potential cockle shell aragonite nanocrystals for osteoporosis therapy and hormonal delivery. Nanotechnol. Sci. Appl. 2017, 10, 23–33. [Google Scholar] [CrossRef] [PubMed] [Green Version]
- Saidykhan, L.; Rukayadi, Y.; Umar Kura, A.; Yazan, L.S.; Abu Bakar, M.Z. Bin Development of nanoantibiotic delivery system using cockle shell-derived aragonite nanoparticles for treatment of osteomyelitis. Int. J. Nanomed. 2016, 11, 661. [Google Scholar] [CrossRef] [Green Version]
- Isa, T.; Zakaria, Z.; Rukayadi, Y.; Mohd Hezmee, M.; Jaji, A.; Imam, M.; Hammadi, N.; Mahmood, S. Antibacterial activity of Ciprofloxacin-encapsulated Cockle shells calcium carbonate (aragonite) nanoparticles and its biocompatability in Macrophage J774A.1. Int. J. Mol. Sci. 2016, 17, 713. [Google Scholar] [CrossRef] [Green Version]
- Chen, S.; Li, F.; Zhuo, R.-X.; Cheng, S.-X. Efficient non-viral gene delivery mediated by nanostructured calcium carbonate in solution-based transfection and solid-phase transfection. Mol. Biosyst. 2011, 7, 2841. [Google Scholar] [CrossRef] [PubMed]
- Wu, J.-L.; Wang, C.-Q.; Zhuo, R.-X.; Cheng, S.-X. Multi-drug delivery system based on alginate/calcium carbonate hybrid nanoparticles for combination chemotherapy. Colloids Surf. B Biointerfaces 2014, 123, 498–505. [Google Scholar] [CrossRef]
- Liang, P.; Zhao, D.; Wang, C.-Q.; Zong, J.-Y.; Zhuo, R.-X.; Cheng, S.-X. Facile preparation of heparin/CaCO3/CaP hybrid nano-carriers with controllable size for anticancer drug delivery. Colloids Surf. B Biointerfaces 2013, 102, 783–788. [Google Scholar] [CrossRef]
- Bobo, D.; Robinson, K.J.; Islam, J.; Thurecht, K.J.; Corrie, S.R. Nanoparticle-based medicines: A review of FDA-approved materials and clinical trials to date. Pharm. Res. 2016, 33, 2373–2387. [Google Scholar] [CrossRef]
- Islam, K.N.; Ali, M.E.; Bakar, M.Z.B.A.; Loqman, M.Y.; Islam, A.; Islam, M.S.; Rahman, M.M.; Ullah, M. A novel catalytic method for the synthesis of spherical aragonite nanoparticles from Cockle shells. Powder Technol. 2013, 246, 434–440. [Google Scholar] [CrossRef]
- European Medicines Agency. ICH Topic Q2 (R1) Validation of Ananlytical Procedures: Text and Methodology; European Medicines Agency: London, UK, 2006; pp. 1–15. [Google Scholar]
- Kamba, S.A.; Ismail, M.; Tengku Ibrahim, T.A.; Zakaria, Z.A.B. Synthesis and characterisation of calcium carbonate aragonite nanocrystals from Cockle shell powder (Anadara granosa). J. Nanomater. 2013, 2013, 398357. [Google Scholar] [CrossRef] [Green Version]
- Abouelmagd, S.A.; Sun, B.; Chang, A.C.; Ku, Y.J.; Yeo, Y. Release kinetics study of poorly water-soluble drugs from nanoparticles: Are we doing it right? Mol. Pharm. 2015, 12, 997–1003. [Google Scholar] [CrossRef] [Green Version]
- Mohd Abd Ghafar, S.L.; Hussein, M.Z.; Abu Bakar Zakaria, Z. Synthesis and characterization of Cockle shell-based Calcium carbonate aragonite polymorph nanoparticles with surface functionalization. J. Nanopart. 2017, 2017, 8196172. [Google Scholar] [CrossRef] [Green Version]
- Som, A.; Raliya, R.; Paranandi, K.; High, R.A.; Reed, N.; Beeman, S.C.; Brandenburg, M.; Sudlow, G.; Prior, J.L.; Akers, W.; et al. Calcium carbonate nanoparticles stimulate tumor metabolic reprogramming and modulate tumor metastasis. Nanomedicine 2019, 14, 169–182. [Google Scholar] [CrossRef] [PubMed]
- Peng, C.; Zhao, Q.; Gao, C. Sustained delivery of doxorubicin by porous CaCO3 and chitosan/alginate multilayers-coated CaCO3 microparticles. Colloids Surf. A Physicochem. Eng. Asp. 2010, 353, 132–139. [Google Scholar] [CrossRef]
- Lauth, V.; Maas, M.; Rezwan, K. An evaluation of colloidal and crystalline properties of CaCO3 nanoparticles for biological applications. Mater. Sci. Eng. C 2017, 78, 305–314. [Google Scholar] [CrossRef]
- Hussein, A.I.; Ab-Ghani, Z.; Che Mat, A.N.; Ab Ghani, N.A.; Husein, A.; Ab Rahman, I. Synthesis and characterization of spherical Calcium carbonate nanoparticles derived from Cockle shells. Appl. Sci. 2020, 10, 7170. [Google Scholar] [CrossRef]
- Chen, H.; Khemtong, C.; Yang, X.; Chang, X.; Gao, J. Nanonization strategies for poorly water-soluble drugs. Drug Discov. Today 2011, 16, 354–360. [Google Scholar] [CrossRef]
- Hosokawa, M.; Nogi, K.; Naito, M.; Yokoyama, T. Nanoparticle Technology Handbook, 1st ed.; Hosokawa, M., Nogi, K., Naito, M., Yokoyama, T., Eds.; Elsevier: Amsterdam, The Netherlands, 2007; ISBN 9780444531223. [Google Scholar]
- Shende, P.; Patil, S.; Gaud, R.S. A combinatorial approach of inclusion complexation and dendrimer synthesization for effective targeting EGFR-TK. Mater. Sci. Eng. C 2017, 76, 959–965. [Google Scholar] [CrossRef] [PubMed]
- Shi, Y.; Su, C.; Cui, W.; Li, H.; Liu, L.; Feng, B.; Liu, M.; Su, R.; Zhao, L. Gefitinib loaded folate decorated bovine serum albumin conjugated carboxymethyl-beta-cyclodextrin nanoparticles enhance drug delivery and attenuate autophagy in folate receptor-positive cancer cells. J. Nanobiotechnol. 2014, 12, 43. [Google Scholar] [CrossRef] [Green Version]
- Wang, L.-Z.; Lim, M.Y.-X.; Chin, T.-M.; Thuya, W.-L.; Nye, P.-L.; Wong, A.; Chan, S.-Y.; Goh, B.-C.; Ho, P.C. Rapid determination of gefitinib and its main metabolite, O-desmethyl gefitinib in human plasma using liquid chromatography–tandem mass spectrometry. J. Chromatogr. B 2011, 879, 2155–2161. [Google Scholar] [CrossRef]
- Faivre, L.; Gomo, C.; Mir, O.; Taieb, F.; Schoemann-Thomas, A.; Ropert, S.; Vidal, M.; Dusser, D.; Dauphin, A.; Goldwasser, F.; et al. A simple HPLC-UV method for the simultaneous quantification of gefitinib and erlotinib in human plasma. J. Chromatogr. B 2011, 879, 2345–2350. [Google Scholar] [CrossRef]
- Kim, M.-J.; Jang, D.-H.; Lee, Y.-I.; Jung, H.S.; Lee, H.-J.; Choa, Y.-H. Preparation, characterization, cytotoxicity and drug release behavior of Liposome-enveloped Paclitaxel/Fe3O4 nanoparticles. J. Nanosci. Nanotechnol. 2011, 11, 889–893. [Google Scholar] [CrossRef] [PubMed]
- Mowafy, H.; Alanazi, F.; Alsarra, I.; Maghraby, G.; Mohsin, K. HPLC method for determination of Paclitaxel in rabbit plasma. Asian J. Chem. 2012, 24, 3352–3356. [Google Scholar]
- Ma, B.; Zhuang, W.; Liu, G.; Wang, Y. A biomimetic and pH-sensitive polymeric micelle as carrier for Paclitaxel delivery. Regen. Biomater. 2018, 5, 15–24. [Google Scholar] [CrossRef] [PubMed]
- Barbosa, M.V.; Monteiro, L.O.F.; Malagutti, A.R.; Oliveira, M.C.; Carvalho-Junior, A.D.; Leite, E.A. Comparative study of First-derivative Spectrophotometry and High Performance Liquid Chromatography methods for quantification of Paclitaxel in liposomal formulation. J. Braz. Chem. Soc. 2015, 26, 1338–1343. [Google Scholar] [CrossRef]
- Savale, S. Simultaneous determination of Curcumin and Gefitinib in pure form by using UV spectrophotometric method. Hygeia J. Drugs Med. 2017, 9, 1–8. [Google Scholar] [CrossRef]
- Patel, C.R.; Joshi, K.A.; Pradhan, P.K.; Dey, S.; Upadhyay, U.M. Simultaneous estimation of Simvastatin and Gefitinib in synthetic mixture by Spectrophotometric and HPLC method. Inven. Rapid Pharm Anal. Qual. Assur. 2013, 2013, 1–7. [Google Scholar]
- Kamal, A.H.; El-Malla, S.F.; Hammad, S.F. A review on UV spectrophotometric methods for simultaneous multicomponent analysis. Eur. J. Pharm. Med. Res. 2016, 3, 348–360. [Google Scholar]
- Lam, A.T.N.; Yoon, J.; Ganbold, E.-O.; Singh, D.K.; Kim, D.; Cho, K.-H.; Lee, S.Y.; Choo, J.; Lee, K.; Joo, S.-W. Colloidal gold nanoparticle conjugates of Gefitinib. Colloids Surf. B Biointerfaces 2014, 123, 61–67. [Google Scholar] [CrossRef] [PubMed]
- Lin, Q.; Liu, G.; Zhao, Z.; Wei, D.; Pang, J.; Jiang, Y. Design of Gefitinib-loaded poly (l-lactic acid) microspheres via a supercritical anti-solvent process for dry powder inhalation. Int. J. Pharm. 2017, 532, 573–580. [Google Scholar] [CrossRef] [PubMed]
- Parashar, P.; Tripathi, C.B.; Arya, M.; Kanoujia, J.; Singh, M.; Yadav, A.; Kaithwas, G.; Saraf, S.A. A synergistic approach for management of lung carcinoma through folic acid functionalized co-therapy of Capsaicin and Gefitinib nanoparticles: Enhanced apoptosis and metalloproteinase-9 down-regulation. Phytomedicine 2019, 53, 107–123. [Google Scholar] [CrossRef]
- Chu, Q.; Yuan, X.; Ji, W.; Chen, S.; Bao, Y.; Tan, S.; Lu, S.; Wu, K. A novel Paclitaxel-loaded poly(D,L-lactide-co-glycolide)-Tween 80 copolymer nanoparticle overcoming multidrug resistance for lung cancer treatment. Int. J. Nanomed. 2016, 11, 2119. [Google Scholar] [CrossRef] [PubMed] [Green Version]
- Li, F.; Li, J.; Wen, X.; Zhou, S.; Tong, X.; Su, P.; Li, H.; Shi, D. Anti-tumor activity of Paclitaxel-loaded chitosan nanoparticles: An in vitro study. Mater. Sci. Eng. C 2009, 29, 2392–2397. [Google Scholar] [CrossRef]
- Xu, Z.; Wang, S.; Li, Y.; Wang, M.; Shi, P.; Huang, X. Covalent functionalization of Graphene Oxide with biocompatible Poly(ethylene glycol) for delivery of Paclitaxel. ACS Appl. Mater. Interfaces 2014, 6, 17268–17276. [Google Scholar] [CrossRef]
- Shen, S.; Wu, Y.; Liu, Y.; Wu, D. High drug-loading nanomedicines: Progress, current status, and prospects. Int. J. Nanomed. 2017, 12, 4085–4109. [Google Scholar] [CrossRef] [Green Version]
- Govender, T.; Riley, T.; Ehtezazi, T.; Garnett, M.C.; Stolnik, S.; Illum, L.; Davis, S.S. Defining the drug incorporation properties of PLA-PEG nanoparticles. Int. J. Pharm. 2000, 199, 95–110. [Google Scholar] [CrossRef]
- Chen, W.; Palazzo, A.; Hennink, W.E.; Kok, R.J. Effect of particle size on drug loading and release kinetics of Gefitinib-loaded PLGA microspheres. Mol. Pharm. 2017, 14, 459–467. [Google Scholar] [CrossRef]
- Magnabosco, G.; Di Giosia, M.; Polishchuk, I.; Weber, E.; Fermani, S.; Bottoni, A.; Zerbetto, F.; Pelicci, P.G.; Pokroy, B.; Rapino, S.; et al. Calcite single crystals as hosts for atomic-scale entrapment and slow release of drugs. Adv. Healthc. Mater. 2015, 4, 1510–1516. [Google Scholar] [CrossRef] [Green Version]
- Maleki Dizaj, S.; Lotfipour, F.; Barzegar-Jalali, M.; Zarrintan, M.-H.; Adibkia, K. Box-Behnken experimental design for preparation and optimization of ciprofloxacin hydrochloride-loaded CaCO3 nanoparticles. J. Drug Deliv. Sci. Technol. 2015, 29, 125–131. [Google Scholar] [CrossRef]
- Falini, G.; Albeck, S.; Weiner, S.; Addadi, L. Control of aragonite or calcite polymorphism by Mollusk Shell Macromolecules. Science 1996, 271, 67–69. [Google Scholar] [CrossRef]
- Islam, K.N.; Zuki, A.B.Z.; Ali, M.E.; Bin Hussein, M.Z.; Noordin, M.M.; Loqman, M.Y.; Wahid, H.; Hakim, M.A.; Abd Hamid, S.B. Facile synthesis of calcium carbonate nanoparticles from Cockle shells. J. Nanomater. 2012, 2012, 1–5. [Google Scholar] [CrossRef]
- Idris, S.B.; Kadir, A.A.; Jesse, F.F.A.; Ramanoon, S.Z.; Basit, M.A.; Zakaria, Z.A.; Zakaria, M.Z.A.B. Synthesis, characterization, and in vitro release of oxytetracycline loaded in pH-responsive CaCO3 nanoparticles. J. Appl. Pharm. Sci. 2019, 9, 19–27. [Google Scholar] [CrossRef] [Green Version]
- Bhattacharjee, S. DLS and zeta potential—What they are and what they are not? J. Control. Release 2016, 235, 337–351. [Google Scholar] [CrossRef]
- Lee, J.-A.; Kim, M.-K.; Kim, H.-M.; Lee, J.K.; Jeong, J.; Kim, Y.-R.; Oh, J.-M.; Choi, S.-J. The fate of calcium carbonate nanoparticles administered by oral route: Absorption and their interaction with biological matrices. Int. J. Nanomed. 2015, 10, 2273–2293. [Google Scholar] [CrossRef] [Green Version]
- Chemmalar, S.; Abu Bakar, M.Z.; Che Azurahanim, C.A.; Abdul Razak, I.S.; Mohamad Yusof, L.H.; Abdul Razak, N.A. Synthesis and characterization of Gefitinib and Paclitaxel dual drug loaded Cockle shell (Anadara granosa) derived Calcium carbonate nanoparticles. Mater. Proc. 2021, 4, 63. [Google Scholar] [CrossRef]
- Eaton, P.; Quaresma, P.; Soares, C.; Neves, C.; de Almeida, M.P.; Pereira, E.; West, P. A direct comparison of experimental methods to measure dimensions of synthetic nanoparticles. Ultramicroscopy 2017, 182, 179–190. [Google Scholar] [CrossRef]
- Gaumet, M.; Vargas, A.; Gurny, R.; Delie, F. Nanoparticles for drug delivery: The need for precision in reporting particle size parameters. Eur. J. Pharm. Biopharm. 2008, 69, 1–9. [Google Scholar] [CrossRef]
- Hoque, M.E.; Shrehryar, M.; Islam, K.N. Processing and Characterization of Cockle shell calcium carbonate (CaCO3) bioceramic for potential application in bone tissue engineering. J. Mater. Sci. Eng. 2013, 2, 1–5. [Google Scholar] [CrossRef]
- Tanaka, R.; Haramura, M.; Tanaka, A.; Hirayama, N. Structure of Gefitinib. Anal. Sci. X-ray Struct. Anal. Online 2004, 20, x173–x174. [Google Scholar] [CrossRef] [Green Version]
- Nikolic, V.D.; Savic, I.M.; Savic, I.M.; Nikolic, L.B.; Stankovic, M.Z.; Marinkovic, V.D. Paclitaxel as an anticancer agent: Isolation, activity, synthesis and stability. Open Med. 2011, 6, 527–536. [Google Scholar] [CrossRef]
- Ibiyeye, K.M.; Zuki, A.B.Z.; Nurdin, N.; Ajat, M. Combine drug delivery of Thymoquinone-Doxorubicin by Cockle shellderived pH-sensitive aragonite CaCO3 nanoparticles. Nanosci. Nanotechnol. Asia 2020, 10, 518–533. [Google Scholar] [CrossRef]
- Almagro, Í.; Drzymała, P.; Rodríguez-Navarro, A.B.; Sainz-Díaz, C.I.; Willinger, M.G.; Bonarski, J.; Checa, A.G. Crystallography and textural aspects of crossed lamellar layers in Arcidae (Bivalvia, Mollusca) Shells. Key Eng. Mater. 2016, 672, 60–70. [Google Scholar] [CrossRef] [Green Version]
- Suzuki, M.; Kim, H.; Mukai, H.; Nagasawa, H.; Kogure, T. Quantitative XRD analysis of {110} twin density in biotic aragonites. J. Struct. Biol. 2012, 180, 458–468. [Google Scholar] [CrossRef]
- Sampath, V.; Huang, P.; Wang, F.; He, D.; Zheng, Z.; Xiao, L.; Ma, C.; Li, C.; Huang, L. Crystalline organization of nacre and crossed lamellar architecture of seashells and their influences in mechanical properties. Materialia 2019, 8, 100476. [Google Scholar] [CrossRef]
- Bragg, W.L. The structure of aragonite. Proc. R. Soc. Lond. A 1924, 105, 16–39. [Google Scholar] [CrossRef] [Green Version]
- Yang, B.; Nan, Z. Abnormal polymorph conversion of calcium carbonate from calcite to vaterite. Mater. Res. Bull. 2012, 47, 521–526. [Google Scholar] [CrossRef]
- Chong, K.Y.; Chia, C.H.; Zakaria, S. Polymorphs calcium carbonate on temperature reaction. AIP Conf. Proc. 2014, 1614, 52–56. [Google Scholar] [CrossRef]
- Coates, J. Interpretation of Infrared spectra, A practical approach. In Encycolpedia of Analytical Chemistry; Meyers, R.A., Ed.; John Wiley & Sons, Ltd.: Chichester, UK, 2000; pp. 10815–10837. [Google Scholar]
- Andersen, F.A.; Brečević, L. Infrared spectra of amorphous and crystalline calcium carbonate. Acta Chem. Scand. 1991, 45, 1018–1024. [Google Scholar] [CrossRef]
- Linga Raju, C.; Narasimhulu, K.; Gopal, N.; Rao, J.; Reddy, B.C. Electron paramagnetic resonance, optical and infrared spectral studies on the marine mussel Arca burnesi shells. J. Mol. Struct. 2002, 608, 201–211. [Google Scholar] [CrossRef]
- Nakamoto, K. Infrared and Raman spectra of inorganic and coordination compounds. Handb. Vib. Spectrosc. 2006, 1872–1892. [Google Scholar] [CrossRef]
- Weir, C.E.; Lippincott, E.R. Infrared studies of aragonite, calcite, and vaterite type structures in the borates, carbonates, and nitrates. J. Res. Natl. Bur. Stand. Sect. A Phys. Chem. 1961, 65A, 173. [Google Scholar] [CrossRef]
- Ni, M.; Ratner, B.D. Differentiating calcium carbonate polymorphs by surface analysis techniques-an XPS and TOF-SIMS study. Surf. Interface Anal. 2008, 40, 1356–1361. [Google Scholar] [CrossRef] [Green Version]
- Weiss, I.M.; Tuross, N.; Addadi, L.; Weiner, S. Mollusc larval shell formation: Amorphous calcium carbonate is a precursor phase for aragonite. J. Exp. Zool. 2002, 293, 478–491. [Google Scholar] [CrossRef]
- Simpson, L.J. Electrochemically generated CaCO3 deposits on Iron studied with FTIR and Raman spectroscopy. Electrochim. Acta 1998, 43, 2543–2547. [Google Scholar] [CrossRef]
- Renuga Devi, T.S.; Gayathri, S. FTIR And FT-Raman spectral analysis of Paclitaxel drugs. Int. J. Pharm. Sci. Rev. Res. 2010, 2, 106–110. [Google Scholar]
- Talari, A.C.S.; Martinez, M.A.G.; Movasaghi, Z.; Rehman, S.; Rehman, I.U. Advances in Fourier transform infrared (FTIR) spectroscopy of biological tissues. Appl. Spectrosc. Rev. 2017, 52, 456–506. [Google Scholar] [CrossRef]
- Sotomayor, F.J.; Cychosz, K.A.; Thommes, M. Characterization of micro/mesoporous materials by physisorption: Concepts and Case studies. Acc. Mater. Surf. Res 2018, 3, 34–50. [Google Scholar]
- Sing, K.S.W. Reporting physisorption data for gas/solid systems with special reference to the determination of surface area and porosity (Recommendations 1984). Pure Appl. Chem. 1985, 57, 603–619. [Google Scholar] [CrossRef]
- Sing, K.S.W. Reporting physiosorption data for gas/solid systems with special reference to the determination of surface area and porosity. Pure Appl. Chem. 1982, 54, 2201–2218. [Google Scholar] [CrossRef]
- Thommes, M.; Kaneko, K.; Neimark, A.V.; Olivier, J.P.; Rodriguez-Reinoso, F.; Rouquerol, J.; Sing, K.S.W. Physisorption of gases, with special reference to the evaluation of surface area and pore size distribution (IUPAC Technical Report). Pure Appl. Chem. 2015, 87, 1051–1069. [Google Scholar] [CrossRef] [Green Version]
- Sing, K.S.W.; Williams, R.T. Physisorption hysteresis loops and the characterization of nanoporous materials. Adsorpt. Sci. Technol. 2004, 22, 773–782. [Google Scholar] [CrossRef]
- ud Din, F.; Aman, W.; Ullah, I.; Qureshi, O.S.; Mustapha, O.; Shafique, S.; Zeb, A. Effective use of nanocarriers as drug delivery systems for the treatment of selected tumors. Int. J. Nanomed. 2017, 12, 7291–7309. [Google Scholar] [CrossRef] [PubMed] [Green Version]
- Sun, R.; Zhang, P.; Bajnóczi, É.G.; Neagu, A.; Tai, C.-W.; Persson, I.; Strømme, M.; Cheung, O. Amorphous calcium carbonate constructed from nanoparticle aggregates with unprecedented surface area and mesoporosity. ACS Appl. Mater. Interfaces 2018, 10, 21556–21564. [Google Scholar] [CrossRef]
- Manchun, S.; Dass, C.R.; Sriamornsak, P. Targeted therapy for cancer using pH-responsive nanocarrier systems. Life Sci. 2012, 90, 381–387. [Google Scholar] [CrossRef] [PubMed]
- Ding, Y.; Zhou, Y.-Y.; Chen, H.; Geng, D.-D.; Wu, D.-Y.; Hong, J.; Shen, W.-B.; Hang, T.-J.; Zhang, C. The performance of thiol-terminated PEG-paclitaxel-conjugated gold nanoparticles. Biomaterials 2013, 34, 10217–10227. [Google Scholar] [CrossRef] [PubMed]
- Mircioiu, C.; Voicu, V.; Anuta, V.; Tudose, A.; Celia, C.; Paolino, D.; Fresta, M.; Sandulovici, R.; Mircioiu, I. Mathematical modeling of release kinetics from supramolecular drug delivery systems. Pharmaceutics 2019, 11, 140. [Google Scholar] [CrossRef] [Green Version]
- Yu, M.; Yuan, W.; Li, D.; Schwendeman, A.; Schwendeman, S.P. Predicting drug release kinetics from nanocarriers inside dialysis bags. J. Control. Release 2019, 315, 23–30. [Google Scholar] [CrossRef] [PubMed]
- Ma-Ham, A.; Wu, H.; Wang, J.; Kang, X.; Zhang, Y.; Lin, Y. Apoferritin-based nanomedicine platform for drug delivery: Equilibrium binding study of daunomycin with DNA. J. Mater. Chem. 2011, 21, 8700. [Google Scholar] [CrossRef]
- Pingitore, N.E.J.; Fretzdorff, S.B.; Seitz, B.P.; Estrada, L.Y.; Borrego, P.M.; Crawford, G.M.; Love, K.M. Dissolution Kinetics of CaCO3 in Common Laboratory Solvents. J. Sediment. Petrol. 1993, 63, 641–645. [Google Scholar]
- Kim, M.-K.; Lee, J.-A.; Jo, M.-R.; Kim, M.-K.; Kim, H.-M.; Oh, J.-M.; Song, N.; Choi, S.-J. Cytotoxicity, uptake behaviors, and oral absorption of food grade calcium carbonate nanomaterials. Nanomaterials 2015, 5, 1938–1954. [Google Scholar] [CrossRef] [PubMed] [Green Version]
- Horie, M.; Nishio, K.; Kato, H.; Endoh, S.; Fujita, K.; Nakamura, A.; Kinugasa, S.; Hagihara, Y.; Yoshida, Y.; Iwahashi, H. Evaluation of cellular influences caused by calcium carbonate nanoparticles. Chem. Biol. Interact. 2014, 210, 64–76. [Google Scholar] [CrossRef]


| Sample | Drug | Drug (µg) | Solvent (mL) 1 | CSCaCO3NP (µg) |
|---|---|---|---|---|
| GEF1-CSCaCO3NP | GEF | 400 | 3 | 10,000 |
| GEF2-CSCaCO3NP | 15,000 | |||
| GEF3-CSCaCO3NP | 20,000 | |||
| PTXL1-CSCaCO3NP | PTXL | 400 | 3 | 10,000 |
| PTXL2-CSCaCO3NP | 15,000 | |||
| PTXL3-CSCaCO3NP | 20,000 | |||
| GEF1-PTXL1-CSCaCO3NP | GEF+PTXL | 400 + 200 | 3 | 10,000 |
| GEF2-PTXL2-CSCaCO3NP | 15,000 | |||
| GEF3-PTXL3-CSCaCO3NP | 20,000 |
| Samples 1 | Elemental Composition (%) | ||||||
|---|---|---|---|---|---|---|---|
| C | O | Na | Ca | N | F | Cl | |
| CSCaCO3NP | 22.44 | 50.09 | 0.21 | 27.26 | ND | ND | ND |
| GEF-CSCaCO3NP | 21.23 | 63.11 | 0.28 | 15.37 | ND | ND | ND |
| PTXL-CSCaCO3NP | 17.53 | 61.41 | 0.30 | 20.76 | ND | ND | ND |
| GEF-PTXL-CSCaCO3NP | 18.53 | 61.65 | 0.30 | 19.53 | ND | ND | ND |
| GEF | 68.33 | 10.85 | ND | ND | 14.02 | 4.53 | 2.28 |
| PTXL | 83.40 | 16.60 | ND | ND | ND | ND | ND |
| Sample 1 | Hydrodynamic Diameter (nm) | PDI | ζ-Potential (mV) |
|---|---|---|---|
| CSCaCO3NP | 179 ± 11 | 0.3 ± 0.1 | −17.0 ± 1.2 |
| GEF-CSCaCO3NP | 188 ± 5 | 0.3 ± 0.1 | −21.5 ± 1.3 |
| PTXL-CSCaCO3NP | 268 ± 20 | 0.3 ± 0.1 | −4.9 ± 3.4 |
| GEF-PTXL-CSCaCO3NP | 274 ± 23 | 0.3 ± 0.1 | −10.3 ± 1.7 |
| GEF | 149 ± 27 | 0.2 ± 0.1 | −4.3 ± 1.0 |
| PTXL | 12 ± 1 | 0.2 ± 0.1 | −9.5 ± 2.4 |
| Formulations | Drug | pH | Kinetics Model | ||||
|---|---|---|---|---|---|---|---|
| Zero Order R2 | First Order R2 | Krosmeyer-Peppas | Higuchi R2 | ||||
| R2 | n | ||||||
| GEF-CSCaCO3NP | GEF | 7.4 | 0.9933 | 0.9904 | 0.9505 | 0.42 # | 0.9803 |
| 6.5 | 0.9816 | 0.9802 | 0.9360 | 0.33 # | 0.968 | ||
| 5.6 | 0.9905 | 0.9886 | 0.9616 | 0.33 # | 0.9894 | ||
| PTXL-CSCaCO3NP | PTXL | 7.4 | 0.9766 | 0.9576 | 0.9662 | 0.35 # | 0.9695 |
| 6.5 | 0.9131 | 0.9012 | 0.8880 | 0.21 # | 0.9063 | ||
| 5.6 | 0.9122 | 0.8916 | 0.8527 | 0.19 # | 0.8741 | ||
| GEF-PTXL-CSCaCO3NP | GEF | 7.4 | 0.9761 | 0.9698 | 0.9727 | 0.54 * | 0.9680 |
| 6.5 | 0.9813 | 0.9776 | 0.9802 | 0.50 * | 0.9758 | ||
| 5.6 | 0.9894 | 0.9832 | 0.9257 | 0.51 * | 0.9849 | ||
| PTXL | 7.4 | 0.9846 | 0.9829 | 0.9734 | 0.56 * | 0.9799 | |
| 6.5 | 0.9878 | 0.9739 | 0.9860 | 0.50 * | 0.9722 | ||
| 5.6 | 0.9913 | 0.9891 | 0.9522 | 0.59 * | 0.9904 | ||
| Normal Vibrational Assignments | Position (cm−1) | |||||
|---|---|---|---|---|---|---|
| Current Study | 1 | 2 | 3 | 4 | ||
| ν1 | Symmetric C-O stretching | 1084 | 1072.29 | 1077 | NA | ~1082 |
| ν2 | CO3 out-of-plane deformation mode | 856 | 854.77 | 851 | 855 | ~855 |
| ν3 | Asymmetric C-O stretching mode | 1445 | 1452 | 1444.05 | 1455.16 | ~1455 |
| ν4 | OCO (in-plane deformation) bending | 714 700 | 707.58 | 707 | 708 | ~709 |
| ν1 + ν4 | 1786 | NA | NA | NA | 1786 | |
| Materials | Names | Surface Area (m2/g) | Pore Width (nm) |
|---|---|---|---|
| Blood cockle shells derived calcium carbonate nanoparticles 1 | CSCaCO3NP * | 10.7 | 5.2 |
| GEF-CSCaCO3NP * | 8.3 | 5.4 | |
| PTXL-CSCaCO3NP * | 9.4 | 5.6 | |
| GEF-PTXL-CSCaCO3NP * | 9.9 | 5.2 | |
| Cockle shells derived CaCO3 NP 2 | CS-CaCO3NP * | 6.18 ± 0.65 | 4.48 |
| Cockle shells derived CaCO3 NP 3 | CaCO3 NP * | 6.95 | 7.12 |
| DTX-CaCO3NP * | 38.73 | 4.03 | |
| Cockle shells derived CaCO3 NP 4 | CaCO3 NP (in various solvents) + | 0.96–26 | 1.8–7.58 |
| Calcium carbonate nanoparticles 5 | N-Cal + | 15.8 | NA |
| Calcium carbonate nanoparticles 6 | Amorphous CaCO3 NP # | ~350 | 8–9 |
Publisher’s Note: MDPI stays neutral with regard to jurisdictional claims in published maps and institutional affiliations. |
© 2021 by the authors. Licensee MDPI, Basel, Switzerland. This article is an open access article distributed under the terms and conditions of the Creative Commons Attribution (CC BY) license (https://creativecommons.org/licenses/by/4.0/).
Share and Cite
Chemmalar, S.; Intan-Shameha, A.R.; Abdullah, C.A.C.; Ab Razak, N.A.; Yusof, L.M.; Ajat, M.; Gowthaman, N.S.K.; Bakar, M.Z.A. Synthesis and Characterization of Gefitinib and Paclitaxel Mono and Dual Drug-Loaded Blood Cockle Shells (Anadara granosa)-Derived Aragonite CaCO3 Nanoparticles. Nanomaterials 2021, 11, 1988. https://doi.org/10.3390/nano11081988
Chemmalar S, Intan-Shameha AR, Abdullah CAC, Ab Razak NA, Yusof LM, Ajat M, Gowthaman NSK, Bakar MZA. Synthesis and Characterization of Gefitinib and Paclitaxel Mono and Dual Drug-Loaded Blood Cockle Shells (Anadara granosa)-Derived Aragonite CaCO3 Nanoparticles. Nanomaterials. 2021; 11(8):1988. https://doi.org/10.3390/nano11081988
Chicago/Turabian StyleChemmalar, S., Abdul Razak Intan-Shameha, Che Azurahanim Che Abdullah, Nor Asma Ab Razak, Loqman Mohamad Yusof, Mokrish Ajat, N. S. K. Gowthaman, and Md Zuki Abu Bakar. 2021. "Synthesis and Characterization of Gefitinib and Paclitaxel Mono and Dual Drug-Loaded Blood Cockle Shells (Anadara granosa)-Derived Aragonite CaCO3 Nanoparticles" Nanomaterials 11, no. 8: 1988. https://doi.org/10.3390/nano11081988