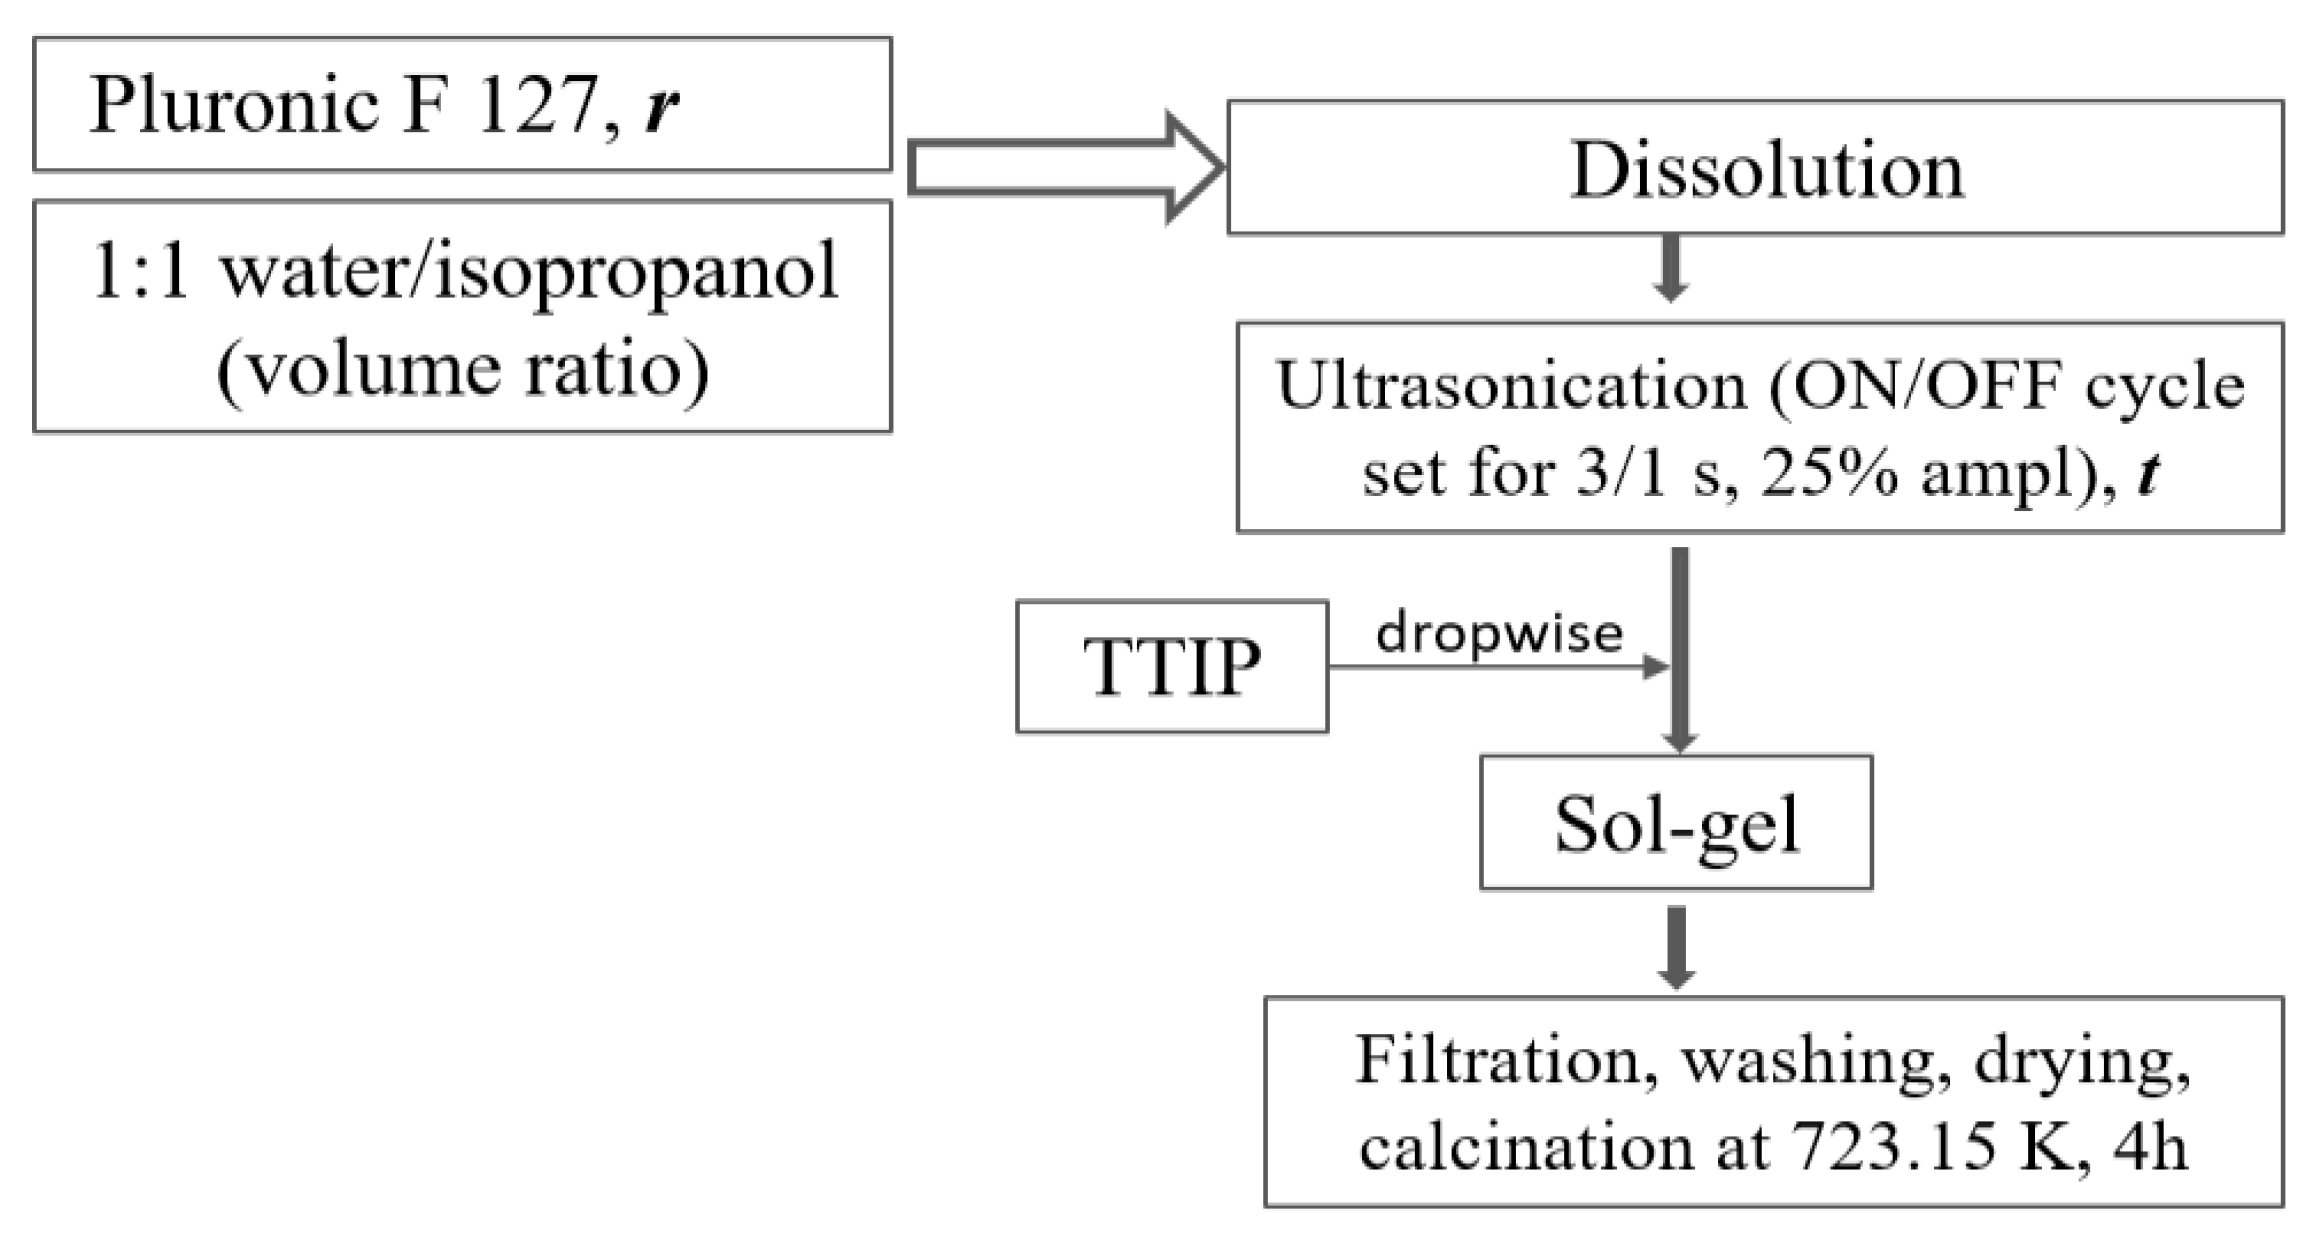
3.1. Design of Experiments and Multiple Regression Modeling
The synthesis of materials was planned according to the design of experiments in order to find out the relationship between factors affecting a process and the output of that process. In this sense, two variables were selected as key factors, namely: (1)
r—the weight ratio of precursors, i.e., the ratio between the quantity of TTIP and the quantity of Pluronic F127; and (2)
t—the sonication time (min) employed for materials synthesis. The actual and coded values of the design variables (key factors) used for materials synthesis are summarized in
Table 1.
Considering these factors and their levels, a central composite design (of rotatable type) was adopted for the experimentation as given in
Table 2. Note that, the design of experiments (DoE) and response surface methodology (RSM) are mathematical-statistical tools frequently used for the systematic investigation of systems and processes [
18,
19]. These tools enabled to study the synthesis process via simultaneous changing of the level factors, thereby employing a smaller number of experimental trials. According to DoE (
Table 2), 11 runs of experimentation were carried out yielding nine types of materials (M1–M9). Note that, the runs no. 9, 10 and 11 were performed in the same conditions to test the reproducibility of the experiments, thereby producing the same type of the material (M9a, M9b and M9c). Each resulted material (M1–M9) according to the design was characterized in terms of surface area (
SBET, m
2/g) and pores volume (
VP, cm
3/g) (outputs) derived from N
2-sorption isotherm, which values can be found in
Table 2. The values of these characterization responses (
SBET and
VP) have been evaluated and it was found that the M4 sample exhibits the greatest
SBET = 132.05 m
2/g and
VP = 0.331 cm
3/g, following the trend of M1<M3<M2<M5<M7<M8<M9a<M6<M4 series, regarding the evolution of the BET specific surface area. As can be observed, not the same trend is followed by the samples, taking into account the total pore volume of the synthesized titania samples (M1<M3<M5<M7<M2<M9a<M8<M6<M4), the series being a little bit modified, but not to a large extent. Even so, the evaluated textural features place the M4 sample at the top of both series, expecting it to be a highly efficient material in adsorption and catalysis processes. Furthermore, each resulted material (M1–M9) was tested (screening assay) for the photodegradation of CR and 2,4-D pollutants using the small-capacity photoreactor (
VR = 50 mL, under external UV-light irradiation). The responses derived from this application are summarized as well in
Table 2 and were referred to as the removal efficiencies of CR dye (
Y1, %) and 2,4-D herbicide (
Y2, %).
On the basis of the experimental design and collected data (according to the
Table 2), four multiple regression models were developed, being expressed in terms of coded variables as:
where
x1 and
x2 are coded variables;
,
,
and
denote predicted responses, respectively.
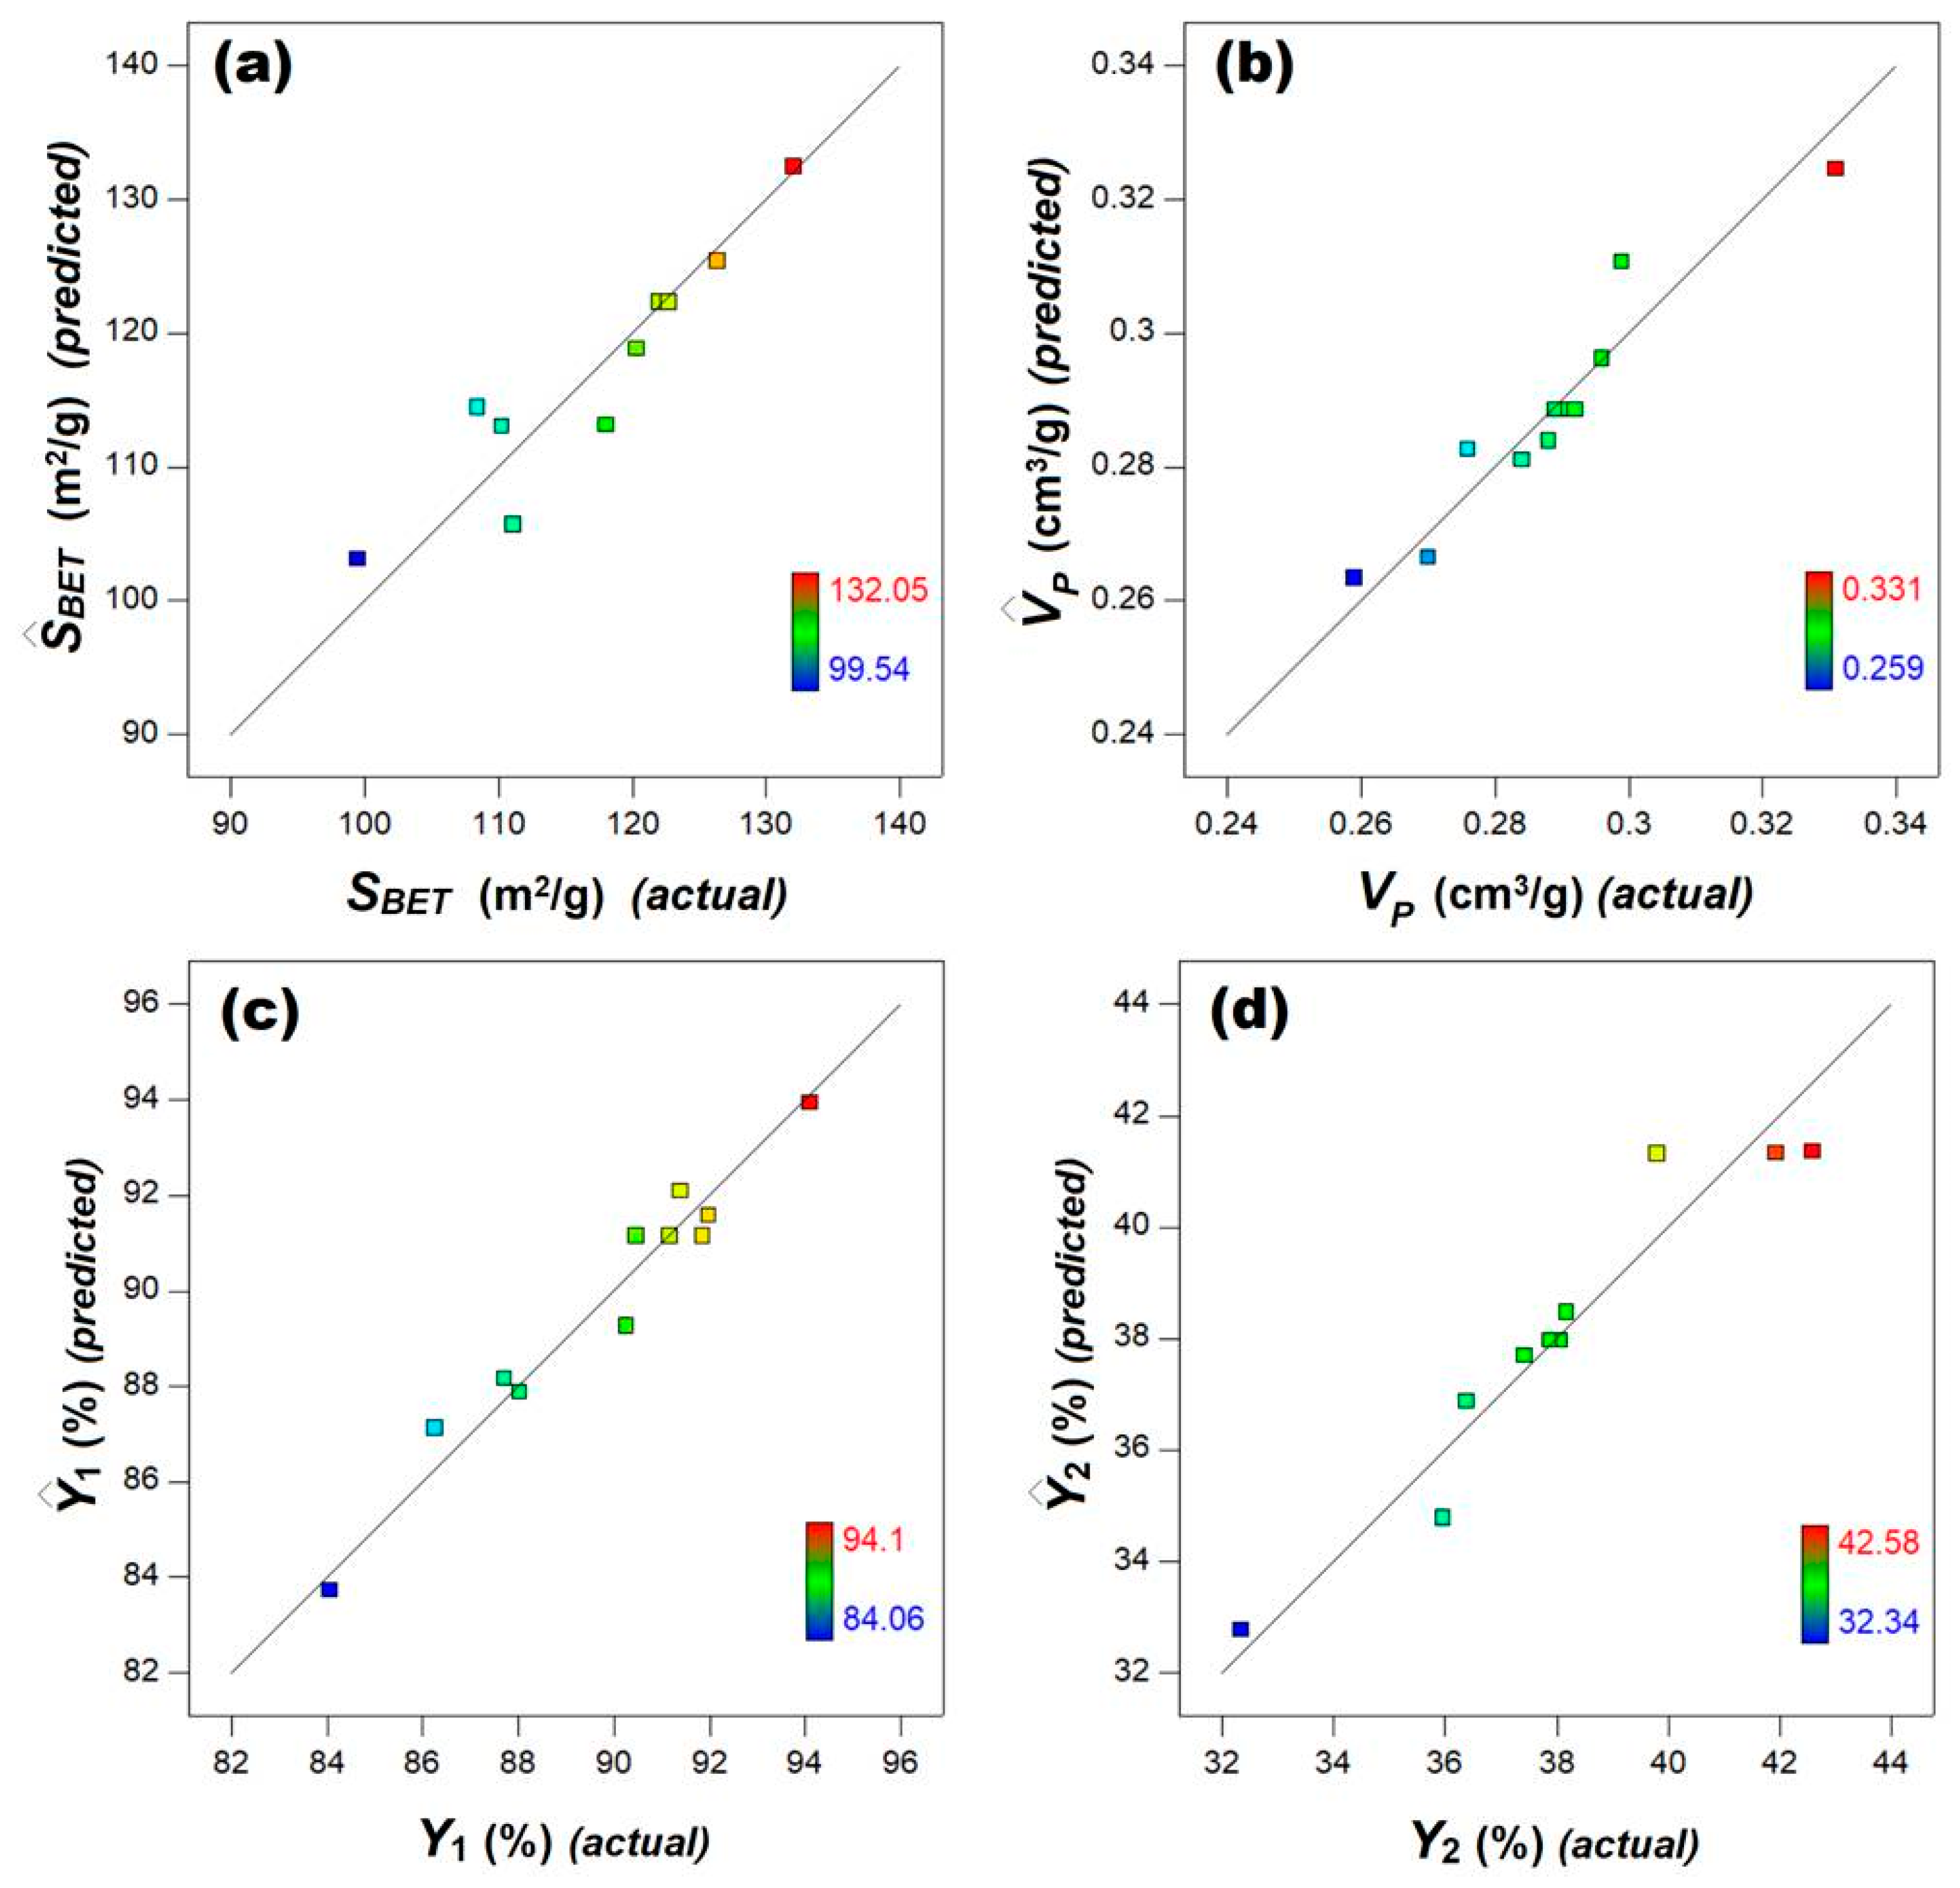
Hence, the fitted models given in Equations (2)–(5) represent the second-order model and interaction equations implying the multiple regression coefficients. Each fitted model was statistically validated by the analysis of variance (ANOVA), which is detailed in the electronic supplemental information (ESI,
Tables S1–S4). The agreements between predicted and observed responses are shown as parity plots in
Figure 1a–d. As one can see, the data are in tolerable vicinity to bisectors, revealing that models are in reasonable agreement with the experimental observations. In summary, the parity plots (
Figure 1) along with ANOVA (ESI,
Tables S1 and S2) confirmed the statistical validation of the developed models. By using the mathematical substitution technique, the final empirical models in terms of actual factors can be expressed as follows:
where,
r and
t denote the actual factors of experimentation, i.e.,
r—weight ratio of the precursors (TTIP/surfactant), and
t—sonication time (min).
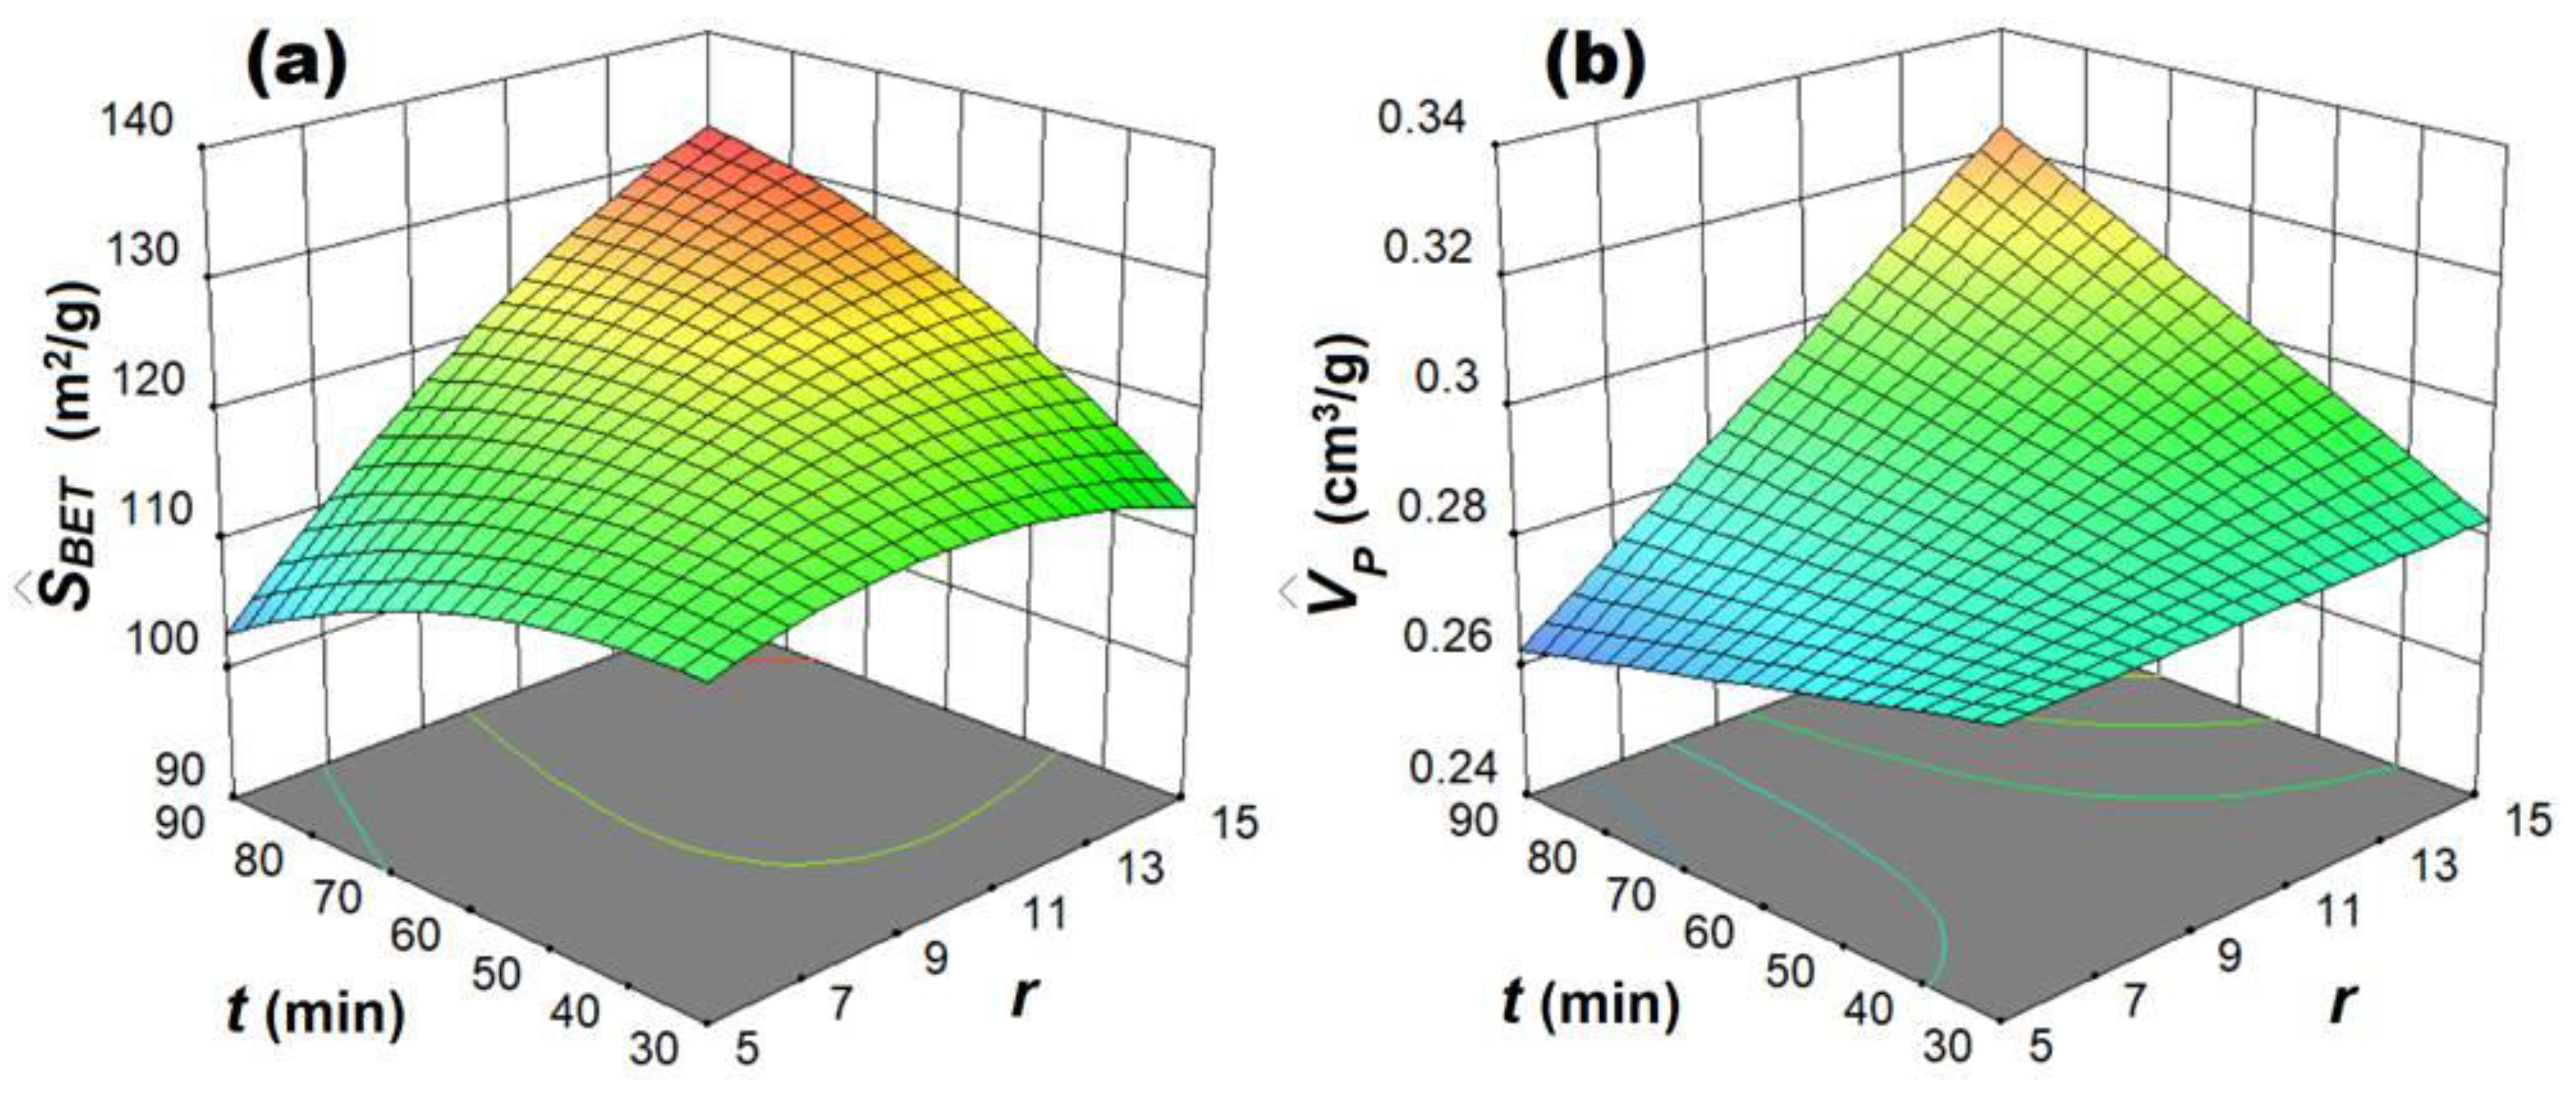
Assuming empirical models given in Equations (6)–(9), we performed the computer-aided simulations to represent the material responses as functions of input variables (factors). Thus,
Figure 2 and
Figure 3 highlight the coupling effects of factors (
r and
t) on the responses of interest (
,
,
and
). The combined effect of factors (
r and
t) on the characterization responses (
and
) is depicted in
Figure 2.
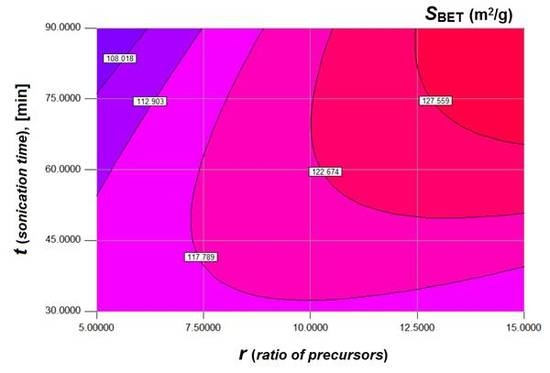
According to
Figure 2, the increment of both factors (
r and
t) results in the increasing of the morphological responses. Hence, both 3D surfaces (given in
Figure 2a,b) show similar trends. However, owing to quadratic terms in the nonlinear model, the response surface associated with the BET area (
Figure 2a) implies a curvature effect. This effect does not appear for the response surface associated with the volume of pores (
Figure 2b). Nevertheless, the interaction effect of factors persists in both cases. For instance, the increasing of the sonication time (
t) at small ratio (
r) conducts to slow decrease of the responses (
and
). In turn, at a greater ratio (
r), the increment of the sonication time (
t) improves both morphological responses (
Figure 2a,b). On the other hand, at low levels of the sonication time, the increasing of the ratio factor (
r) does not affect considerably the values of responses. By contrast, at high levels of the sonication time, the increment of the ratio factor (
r) conducts to significant increasing of responses values (
Figure 2a,b).
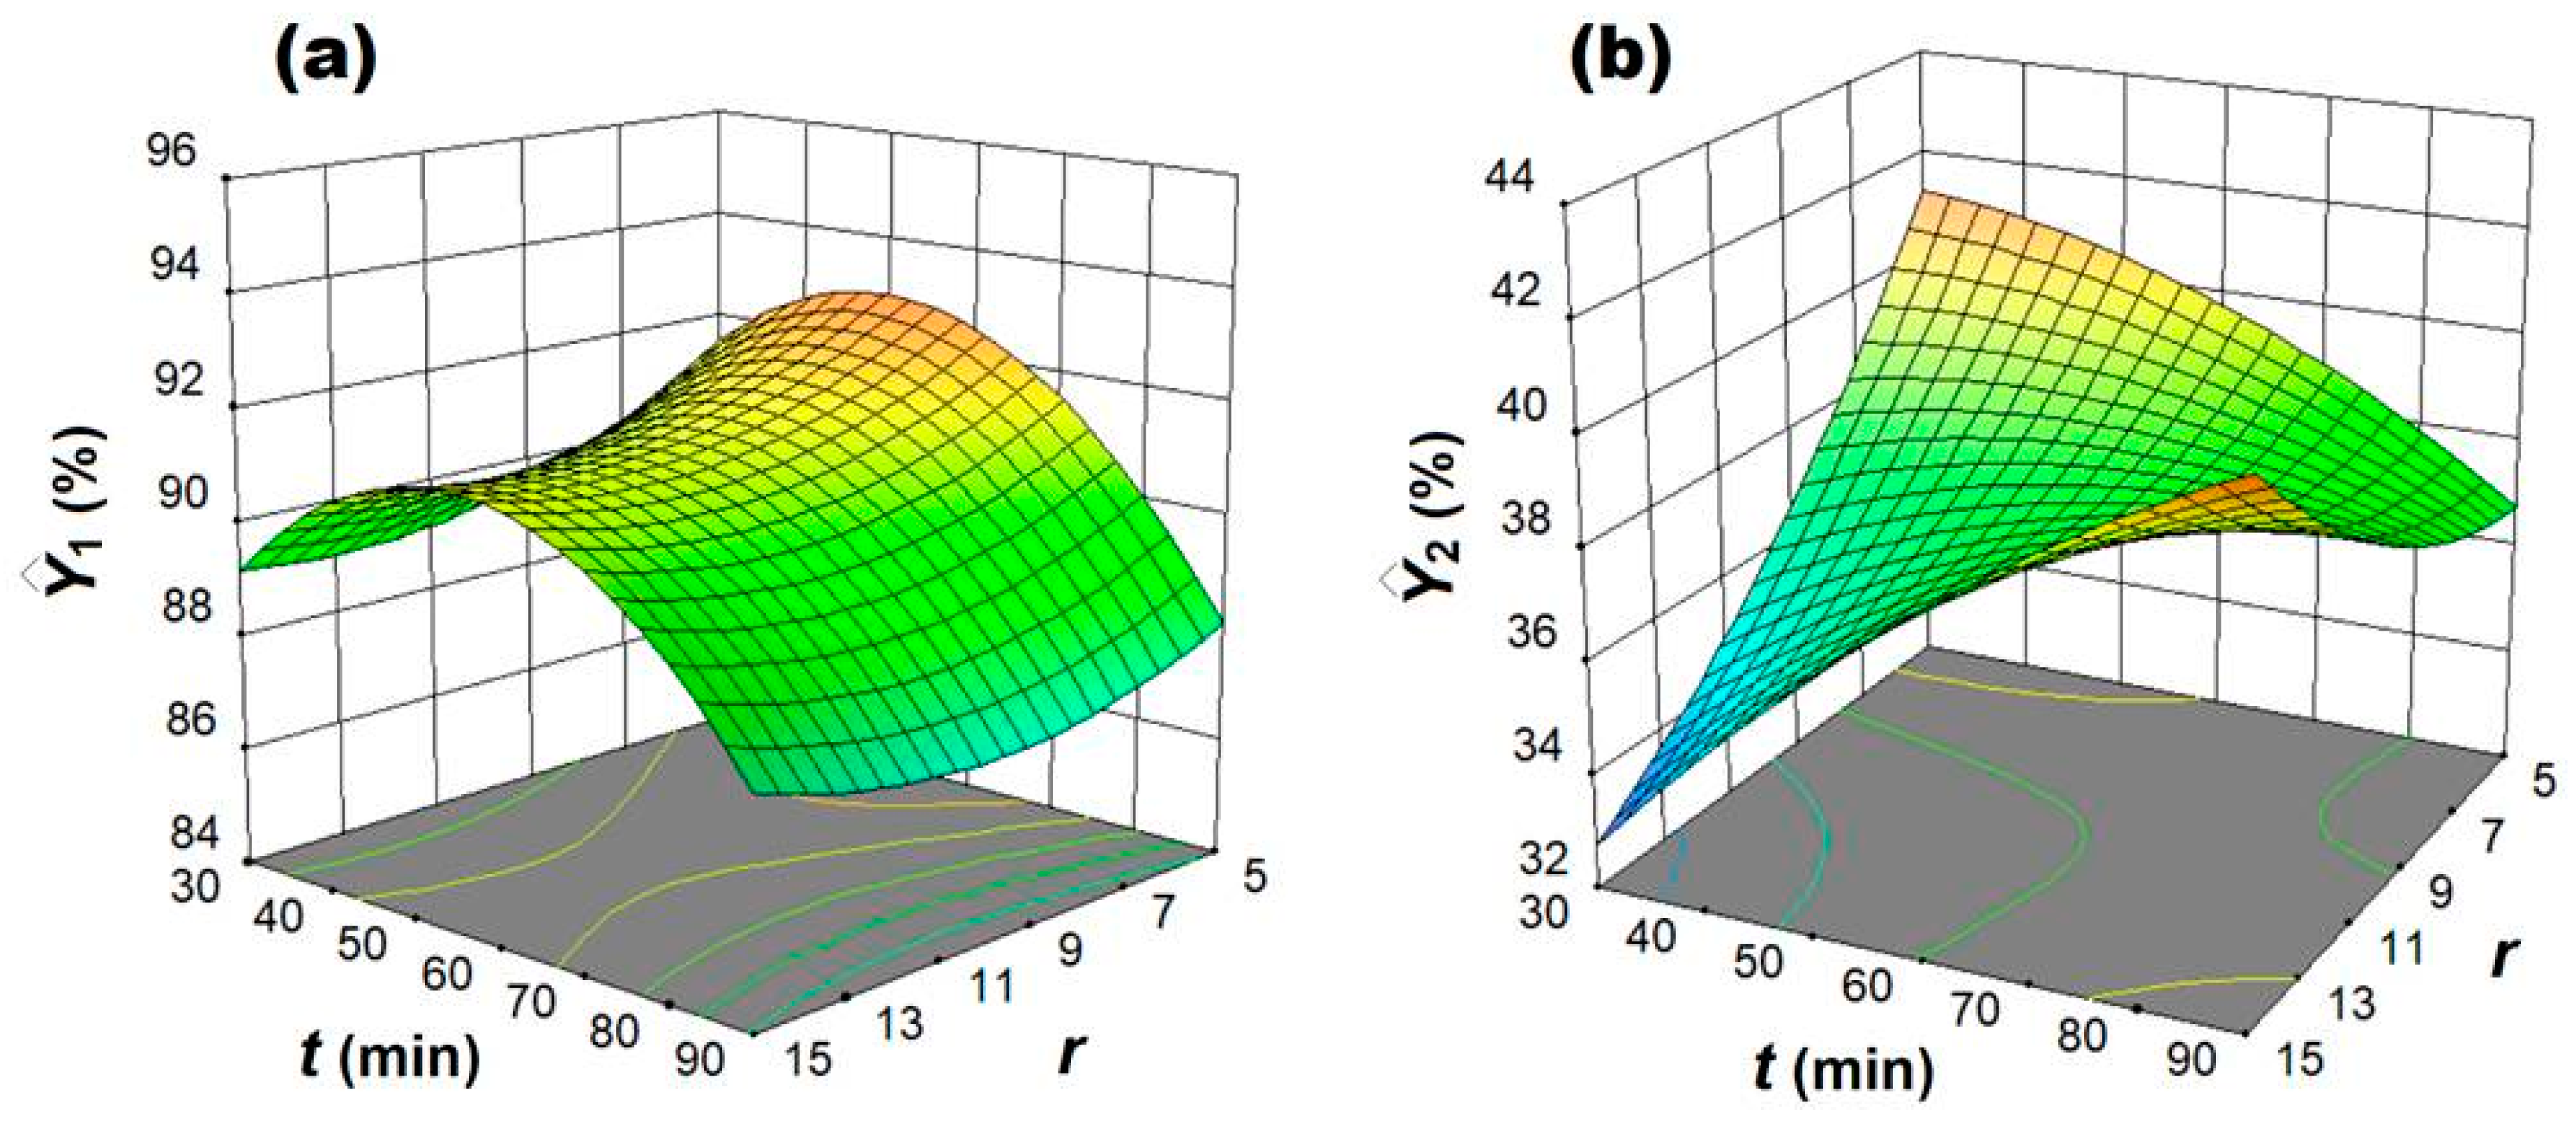
Figure 3 shows the influence of factors (
r and
t) on the removal efficiencies (
and
) that derived from the application of produced materials in photodegradation. As detailed, the response surfaces describe the removal efficiency of CR (
,
Figure 3a) and 2,4-D (
,
Figure 3b), both representing saddle-type surfaces. As one can see from
Figure 3a, the increment of the sonication time conducts to the increasing, and then, to the decreasing of the response
(i.e., curvature effect of
t). Herein, the effect of the ratio factor (
r) is also nonlinear, being less influencing than the sonication time.
The inspection of
Figure 3b indicates a strong interaction effect between factors (
r and
t) for the case of 2,4-D degradation. Hence, as the sonication time is increased, at low ratio factor (
r), the response
is improved. At high ratio factor (
r), the greater the sonication time, the less the response
is. In addition, the increment of the ratio factor (
r) at greater sonication time leads to the increasing of the response
. By contrast, at low sonication time, the increasing of the ratio factor (
r) conducts to diminishing of the response (
Figure 3b).
For a saddle-type surface, there is an inflexion point (saddle point) between the relative minimum and maximum [P1]. For instance, the displacement from the saddle point along two opposite directions can improve or impair the response. Commonly, the visual inspection of the response surface can suggest the optimum region. According to
Figure 3a, the optimal sonication time (for CR photodegradation) is pinpointed in the region of 50–70 min. In turn, the optimal sonication time (for 2,4-D photodegradation) can be extended to a larger region of 30–90 min (
Figure 3b). The optimal precursors ratio (for CR photodegradation, see
Figure 3a) can be distinguished at low levels (
r ≤ 5). For the case of 2,4-D photodegradation (
Figure 3b), the optimal ratio factor can be noticed at both low levels (
r ≤ 5) and high levels (
r ≥ 13), such a situation being typical for the saddle-type surfaces [
20].
3.2. Multi-Objective Optimization
The objective of the design of experiments employed in this study was to figure out optimum conditions for the preparation of the material with improved photocatalytic performance. To select the optimal material from the produced set, we employed the desirability function approach (DFA) [
18,
21]. This method (DFA) is typically exploited to solve the multi-objective optimization problems, where the optimum should be decided based on several criteria (viewpoints). In this study, the optimization criteria of interest implied the enhanced photocatalytic performance and the proper morphology of the developed material. Consequently, we considered three responses for the multi-objective optimization, namely: (1) removal efficiency of CR dye, (2) removal efficiency of 2,4-D herbicide, and (3) BET surface area of the material. These responses were subjected to maximization. Thus, the optimal photocatalytic material should satisfy all these criteria combined into the best synergetic effect.
According to DFA method, the individual desirability functions (
di) must be calculated, firstly, by converting the actual values of responses (see
Table 2) into the normalized values {0,1}. For responses subjected to maximization, the individual desirability functions can be ascertained by the conversion scheme of type LTB (the larger the best) that can be expressed as follows [
18,
21]:
where
Yi is the actual value of the response with index
i;
Yiα is the lower-bound limit and
Yiβ is the upper-bound limit of the response;
di—individual desirability of the response.
To assess the global desirability, the individual desirability function can be powered by a weight coefficient (importance) attributed to every single response. The value of the weight coefficient was equal to
w = 1 (for less important response) and
w = 2 (for more important response). In our case, the responses with more importance (
w1 = 2 and
w2 = 2) were the removal efficiencies of CR dye (
Y1) and 2,4-D herbicide (
Y2). In turn, the response with less importance (
w3 = 1) was attributed to the BET surface area (
SBET). Thus, more emphasis is placed on photodegradation performances rather than on the morphological characteristic of the material. Ultimately, the individual desirability functions (
di) were augmented into a composite function termed as the global desirability (
D). This was calculated as the weighted geometric mean according to the next equation [
18,
21]:
For our case with three responses (
n = 3) powered at different importance (i.e.,
w1 = 2,
w2 = 2, and
w3 = 1), Equation (11) can be written as:
Note that, the global desirability was calculated by taking into account the observed values of responses versus their predicted values. Thus, we calculated two global desirability indicators: (1)
Dobs—assuming actual responses, and (2)
Dcalc—assuming predicted responses.
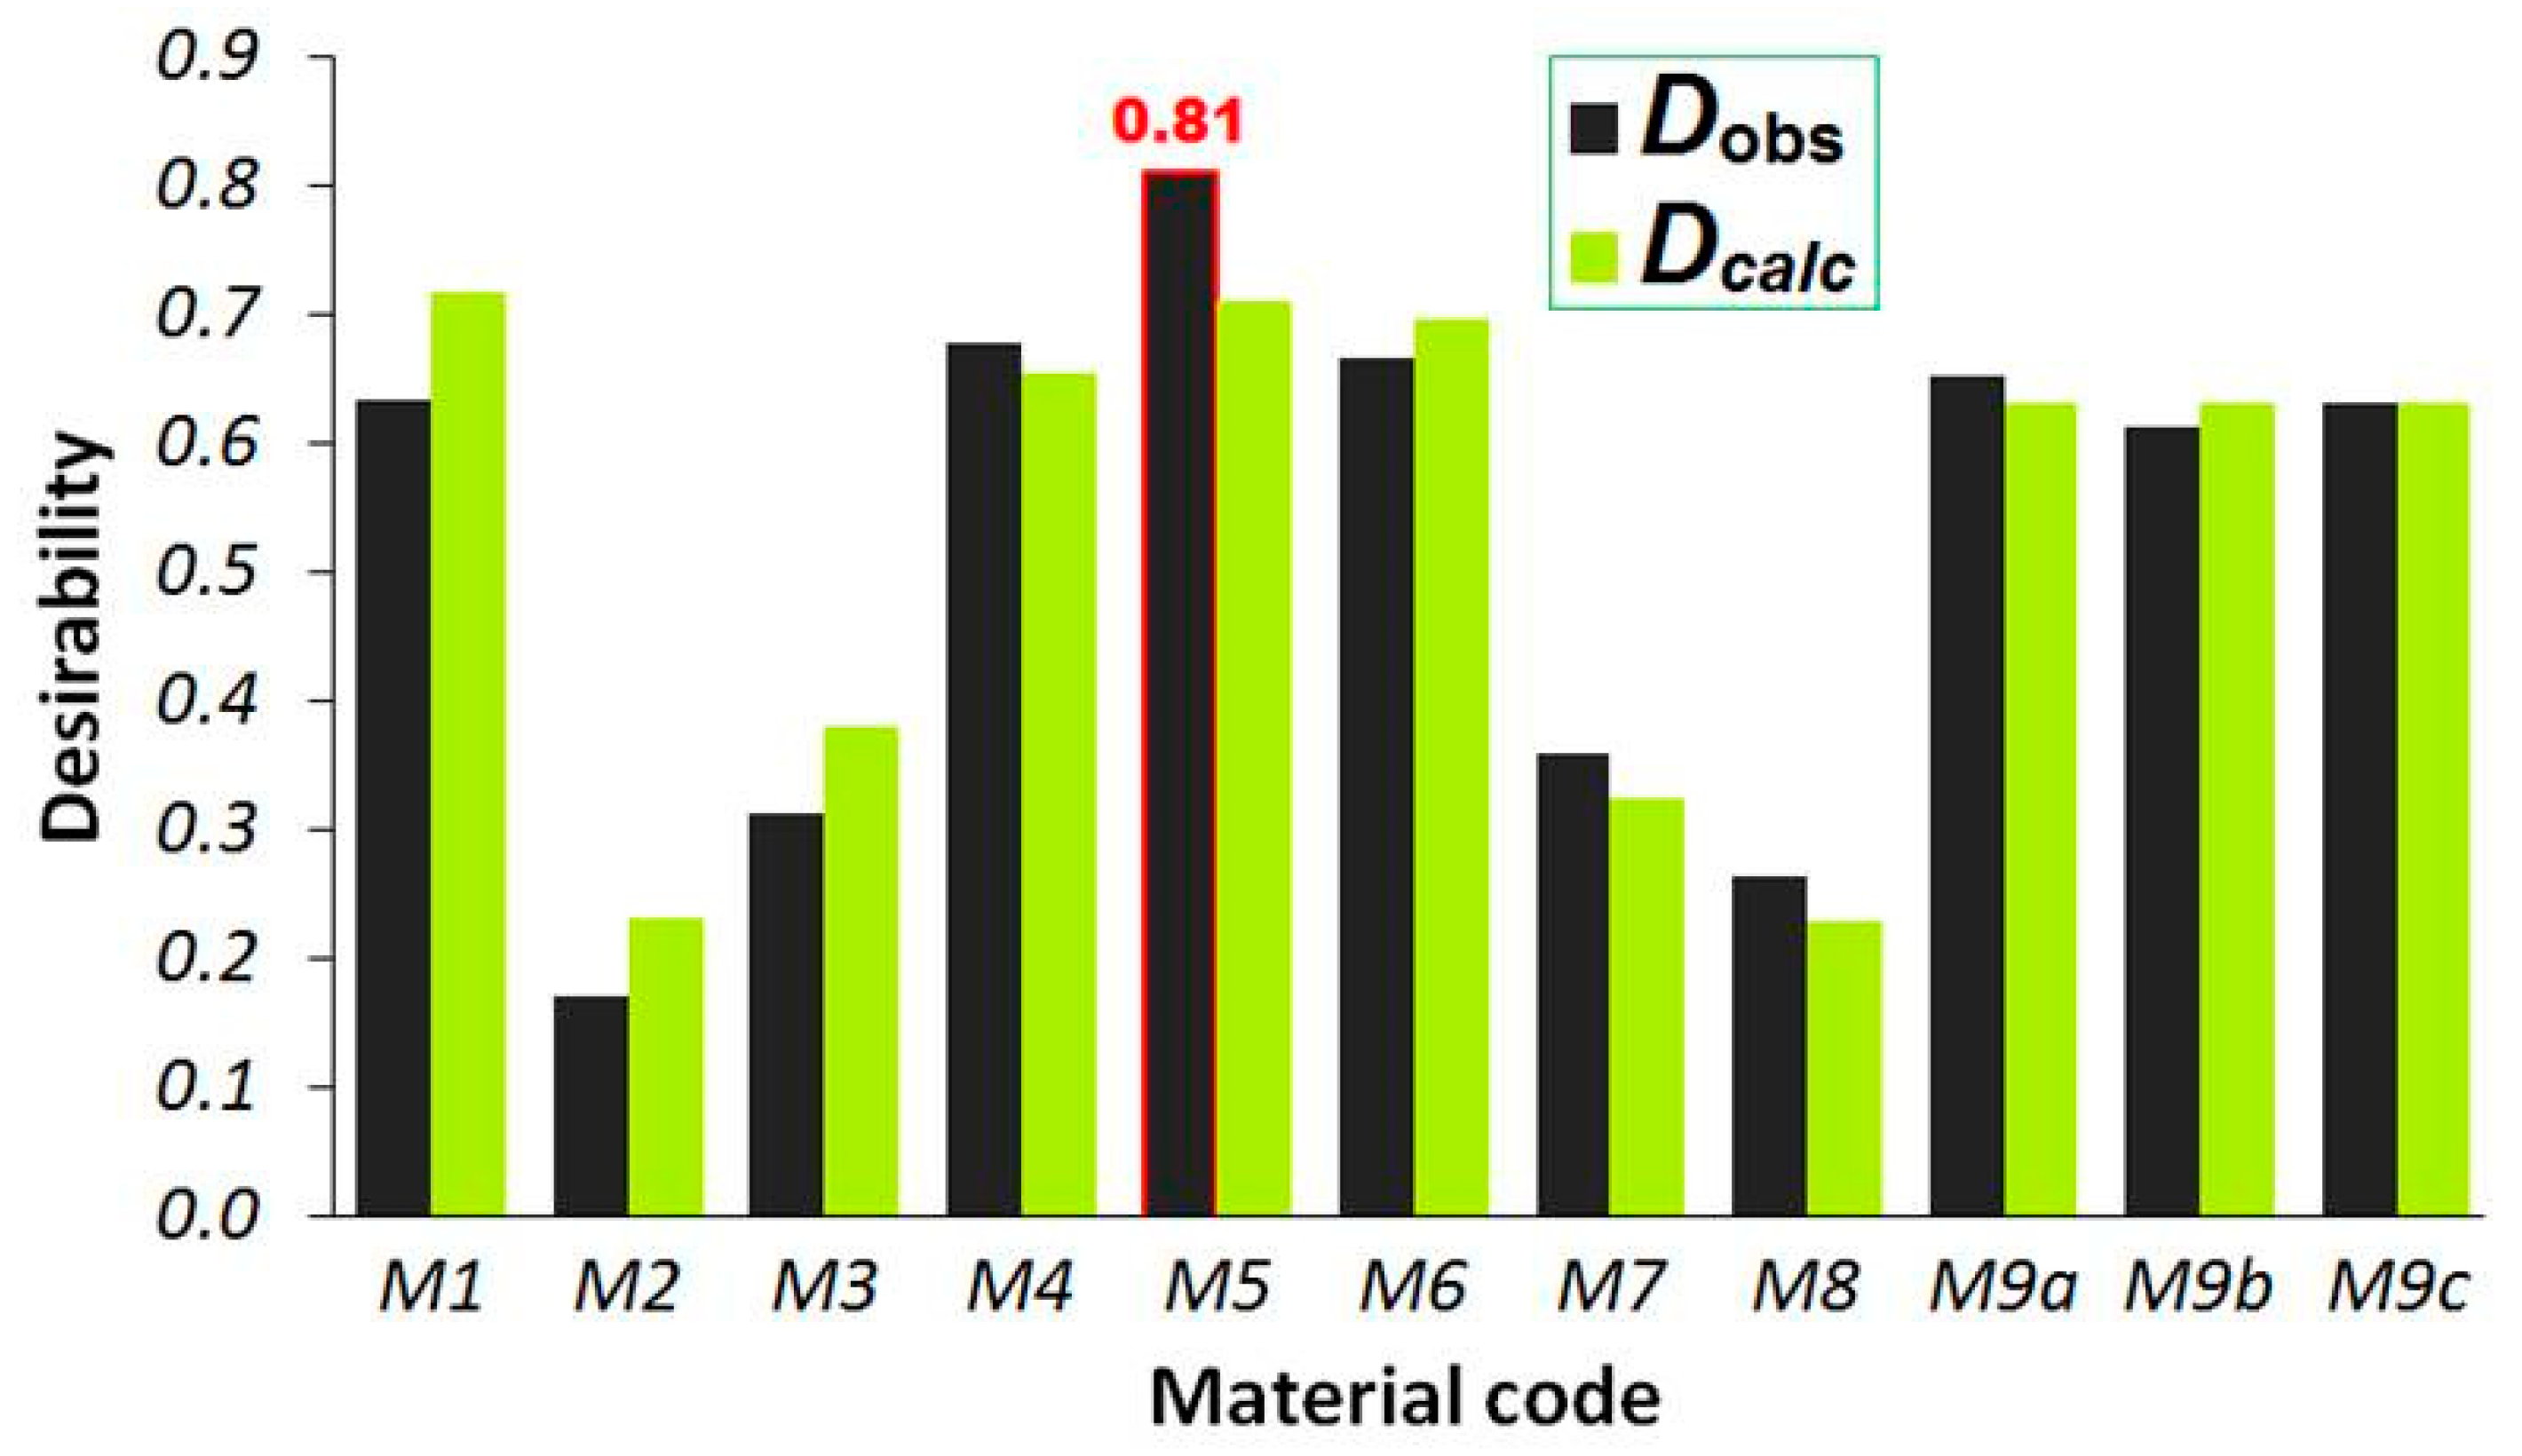
Figure 4 compares the produced catalytic materials (M1–M9) in terms of global desirability. A reasonable agreement was noticed between the observed (
Dobs) and predicted (
Dcalc) values of the global desirability (
Figure 4).
As one can see from
Figure 4, the optimum material for the photocatalytic application was M5 (produced at
r = 3 and
t = 60 min), which yielded the highest observable value of the global desirability (
Dobs = 0.81). Likewise, the material M5 showed the greatest removal efficiencies of CR (
Y1 = 94.10%) and 2,4-D (
Y2 = 42.58%) in the reaction system of
VR = 50 mL capacity. Comparing to the sample M4, showing the best textural features, the optimal sample M5 revealed a smaller surface area, but a better photocatalytic activity, being in good agreement with their structural, textural, and optical properties.
Therefore, this optimum material M5 was retained for supplemental characterizations and additional studies (photodegradation kinetics).
3.3. Characteristics of Optimum Material
The optimal photocatalyst was characterized in terms of texture, structure, surface morphology, chemistry and the obtained results are detailed in Electronic Supporting Information (ESI). According to ESI,
Figure S1, the hysteresis loop of the M5 sample is associated with H2 type (IUPAC classification) [
22] and has a sharp pore emptying at
P/P0 = 0.7, meaning that the desorption of nitrogen occurs via cavitation mechanism. This indicates that the pores are of ink-bottle shape which gives the type H2 hysteresis due to pore percolation effect. Compared to the M4 sample, which exhibits a decreased slope of the desorption branch meaning a switched desorption mechanism to pore blocking, the M5 sample titania structure seems to contain pores with a narrower neck [
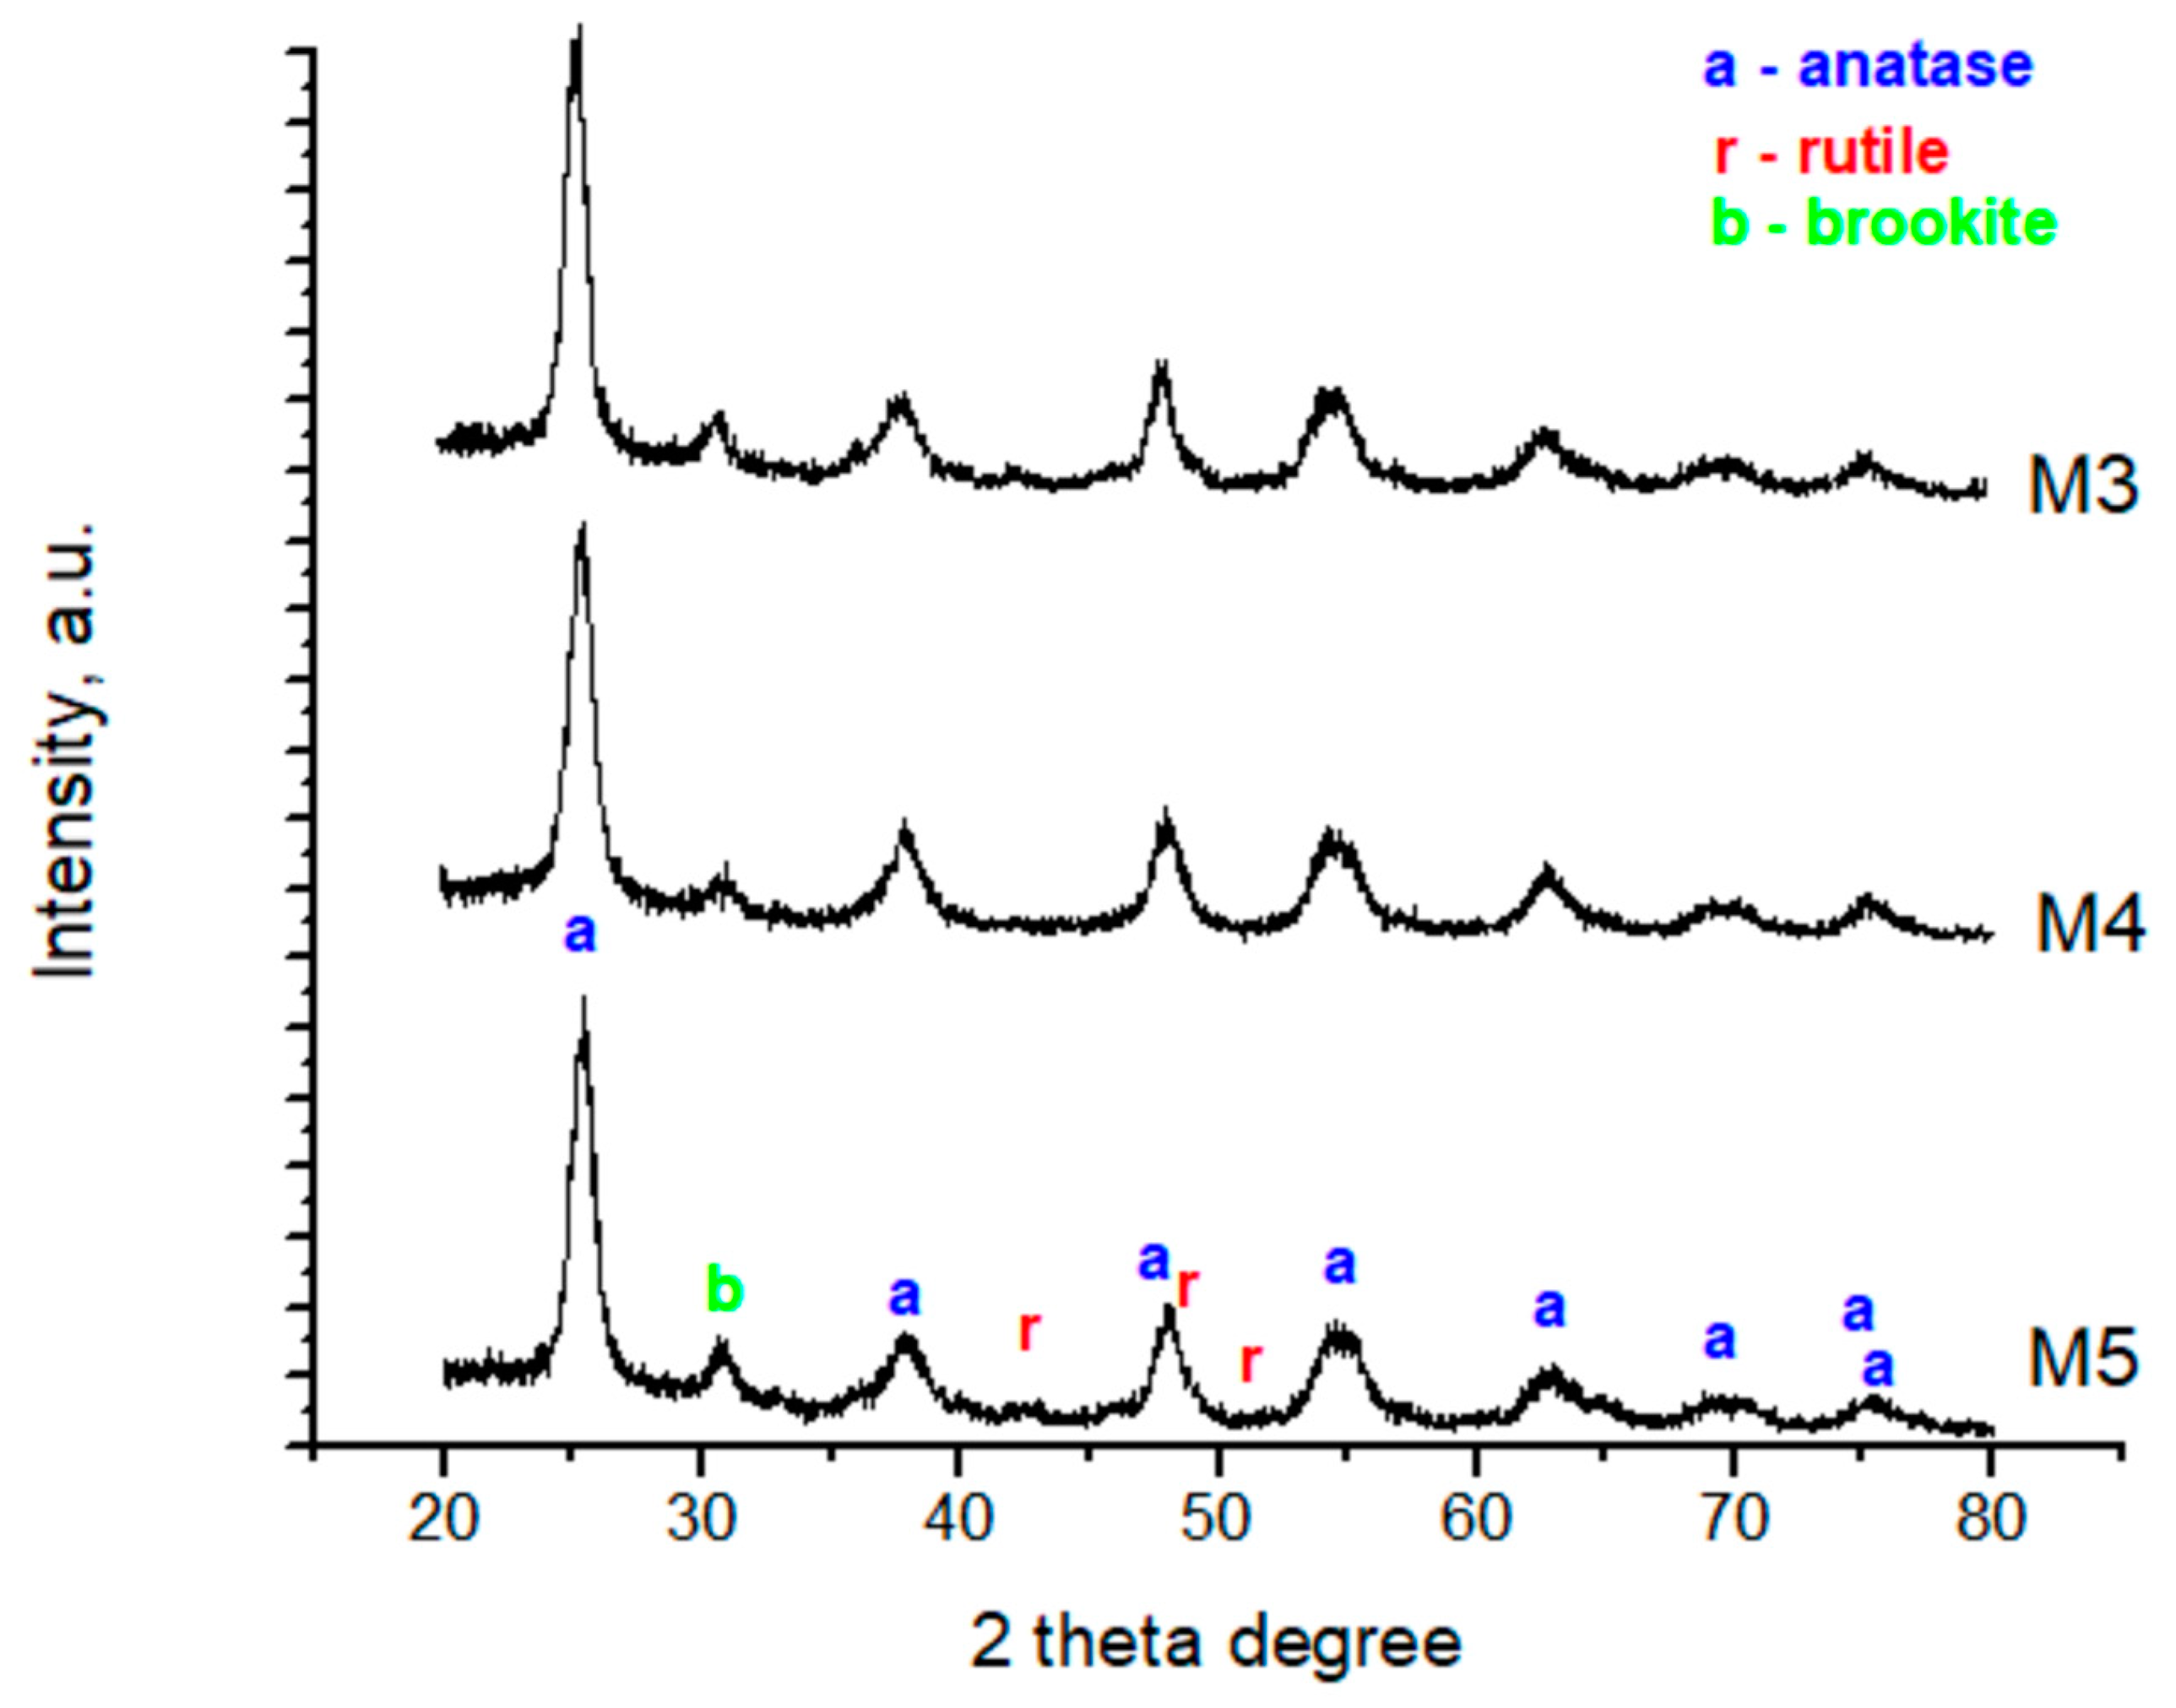
23]. The XRD pattern (
Figure 5) proves the formation of the crystalline anatase phase as the main phase [
12,
17], where the interplanar distance is of
d101 = 0.35 nm and the unit cell parameter is of
a0 = 0.40 nm (
Table 3).
The crystallite size have been calculated as usual with the Scherrer formula (D
Scherrer), but due to the XRD peak broadening that occurs due to the lattice strain (ξ), the Williamson–Hall equation have been considered to be more suited for crystallite size determination (D
W.H.) (
Table 3). Analyzing the calculated values for the crystallite size by both equations, one can be observed that the M5 and M4 samples show not so different size values compared to the M3 sample. In addition, the strain value (ξ) is negative which may be due to lattice shrinkage in the case of the M4 and M5 samples.
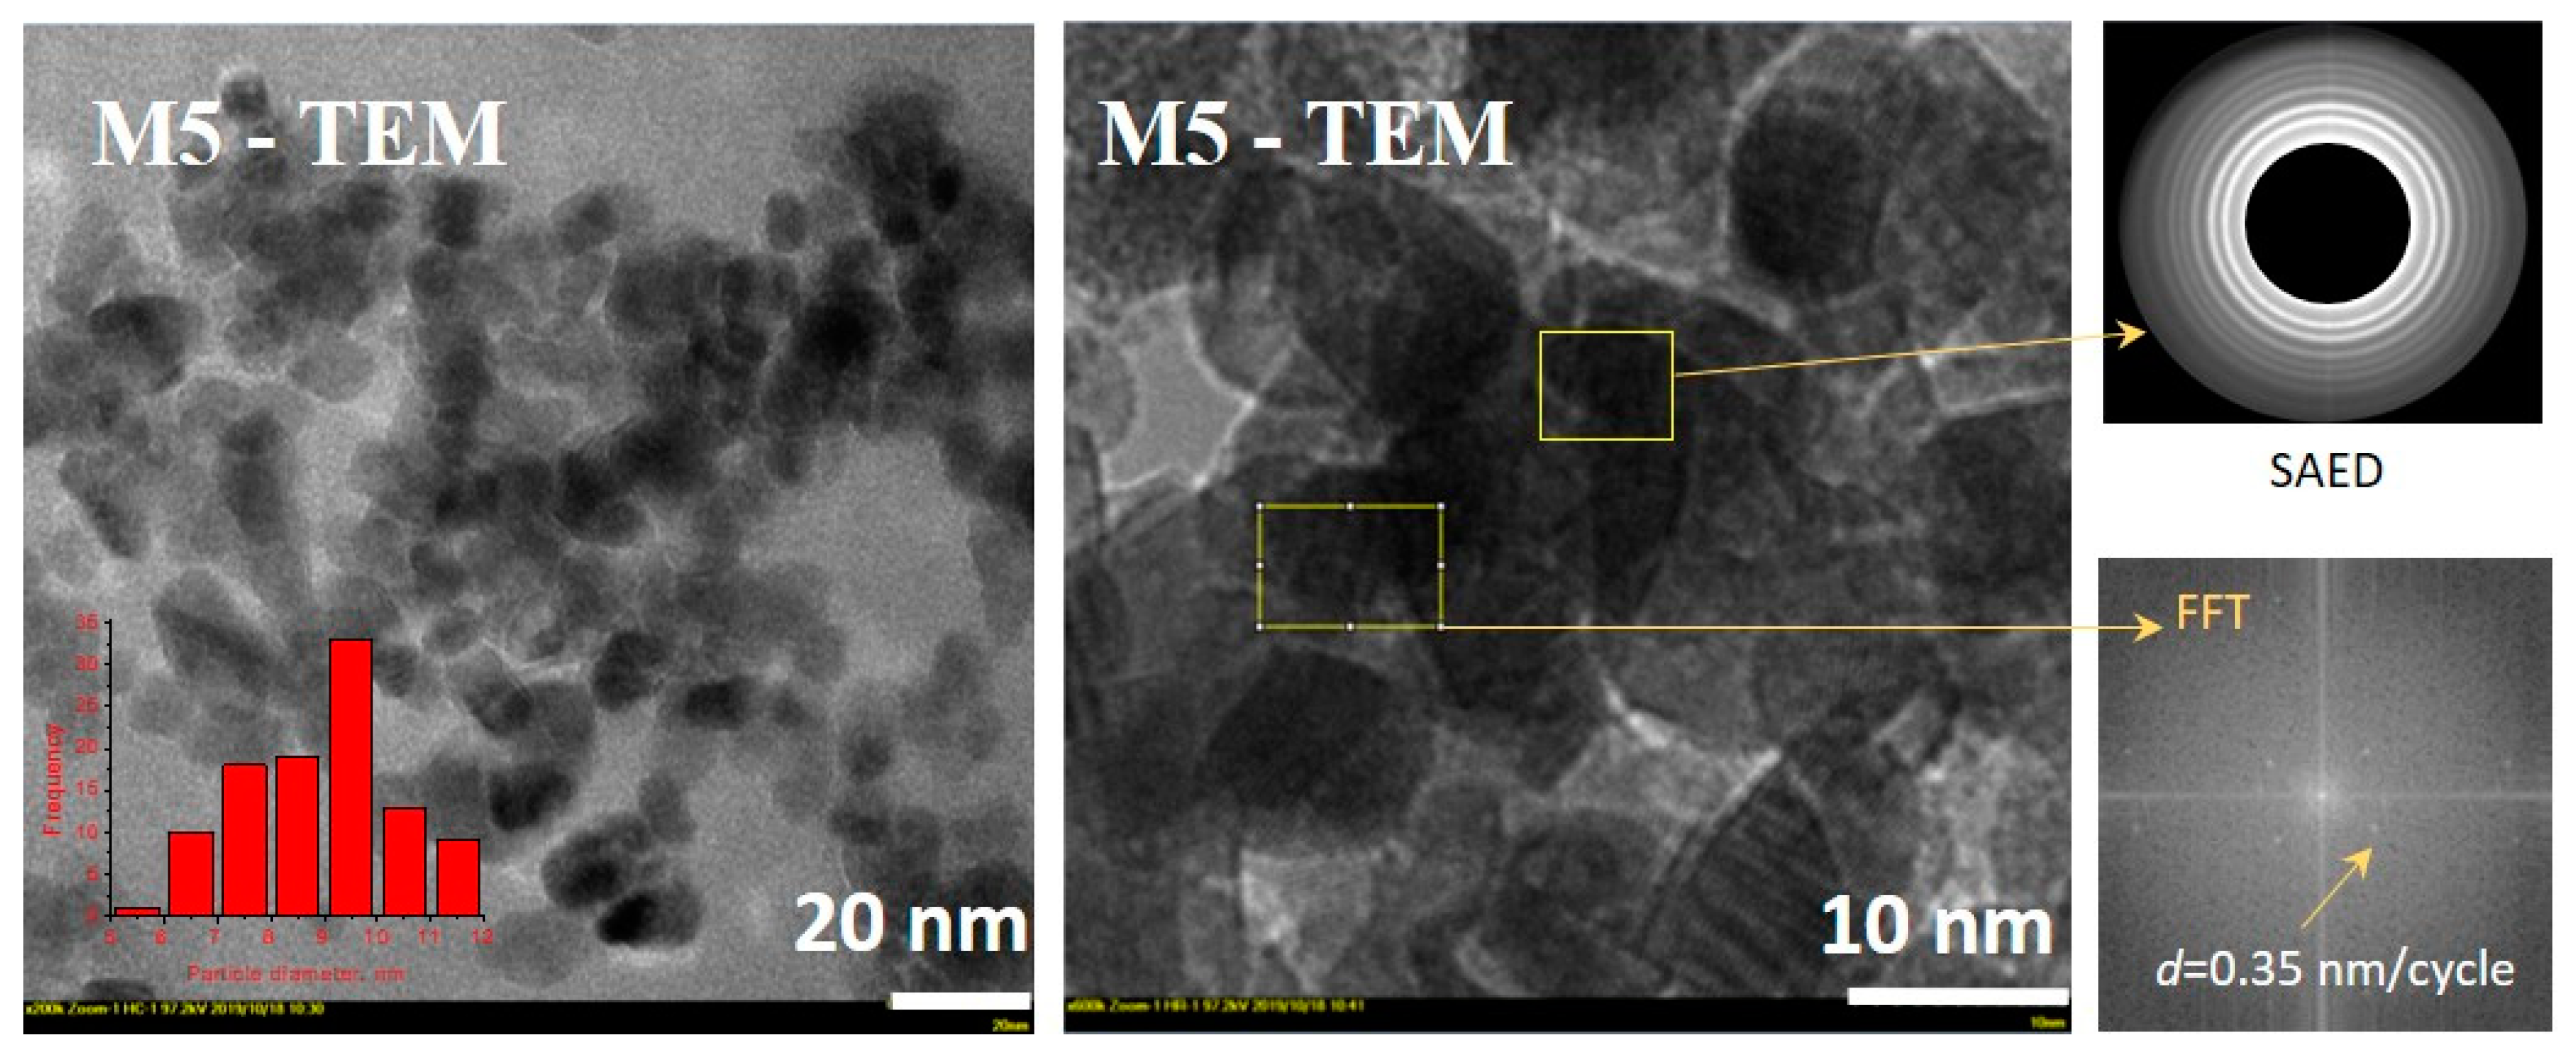
The powder morphology has been investigated by SEM imaging (ESI,
Figure S2) showing more compact agglomerates in the case of the M5 sample, while the M4 titania sample exhibits fine dispersed powder. The mean crystallite size of the sample M5 was found to be of
DTEM = 8.89 nm (the particle size distribution (in red)
Figure 6), whose value is more or less the same as that calculated by Scherrer and Williamson–Hall equations using XRD diffraction patterns. As well, a very nice diffraction picture (TEM-derived SAED,
Figure 6) has been acquired, indicating that the M5 sample have a great diffraction at low angles, indicating the titania pore structure is ordered. As it is very important to be known for the photocatalytic applications, the band gap energy of titania M5 sample has been calculated applying Tauc theory to the registered UVDR spectrum. Thus, from the UVDR-derived Tauc indirect plots, the band gap energy for the M5 titania sample has been found to be
Eg = 3.21 eV, compare to
Eg = 3.22 eV of the M4 sample (ESI,
Figure S3). This band gap energy seems to be a suitable value for a semiconductor material capable to harvest the UV-light. Furthermore, the surface chemistry has been investigated by registering the FTIR spectrum of the M5 titania sample (ESI,
Figure S4), which is a characteristic one, indicating a clear stretching vibration of the hydroxyl groups O-H on the titania nanoparticles (at 3500 cm
−1), bending modes of water Ti-OH (at 1631 cm
−1), and Ti-O modes (400–900 cm
−1). No evident differences between M4 and M5 titania samples could be observed, meaning the variable factors considered in this research do not greatly affect the surface chemistry of the synthesized material.
3.4. Kinetics of the Photocatalytic Process
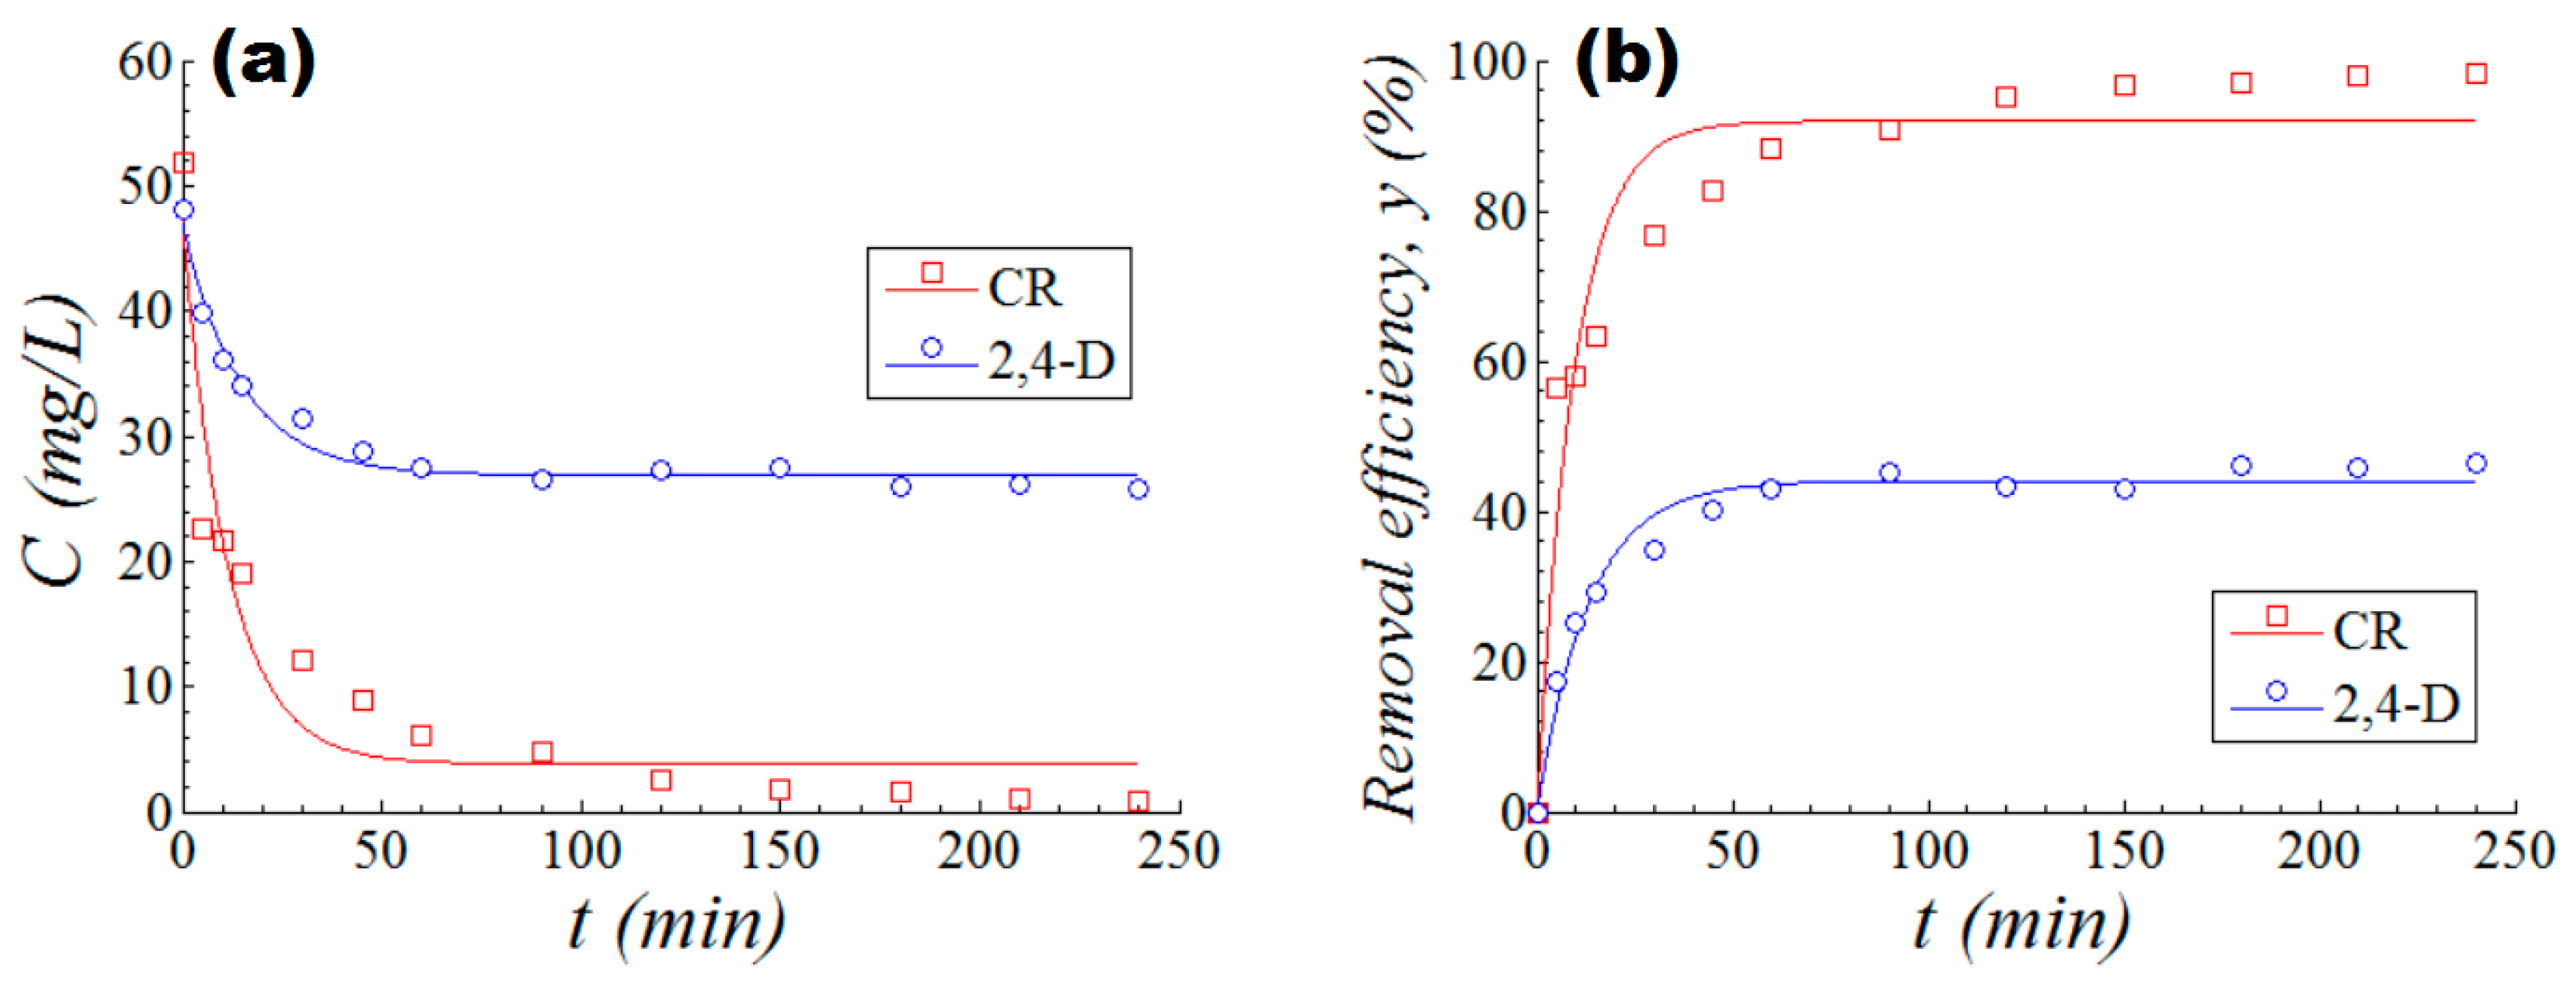
The heterogeneous photocatalytic degradation of water-soluble organic pollutants in the presence of inorganic oxidic catalysts can be expressed by the pseudo first-order kinetics. To reveal the kinetic of the photocatalytic process, a commercial photoreactor (Peschl Ultraviolet/TQ150, Mainz, Germany) with larger volumetric capacity (VR = 600 mL) has been employed. In a typical experiment, the optimum photocatalyst sample M5 (0.1 g TiO2) was added to 600 mL aqueous solution containing 50 mg/L of pollutant (initial concentration). The resulted suspension was magnetically stirred in the dark (for 30 min at 500 rpm) to reach the equilibrium. Then, the solution was irradiated up to 2 h under UV-light. It should be mentioned that the UV-lamp (surrounded by a circulating water jacket) was immersed in the center of the reaction solution. Samples were extracted periodically to monitor the pollutant concentration over the course of the photodegradation reaction. The UV–Vis absorption spectra for the extracted samples were recorded in the range of 200–700 nm (wavelength).
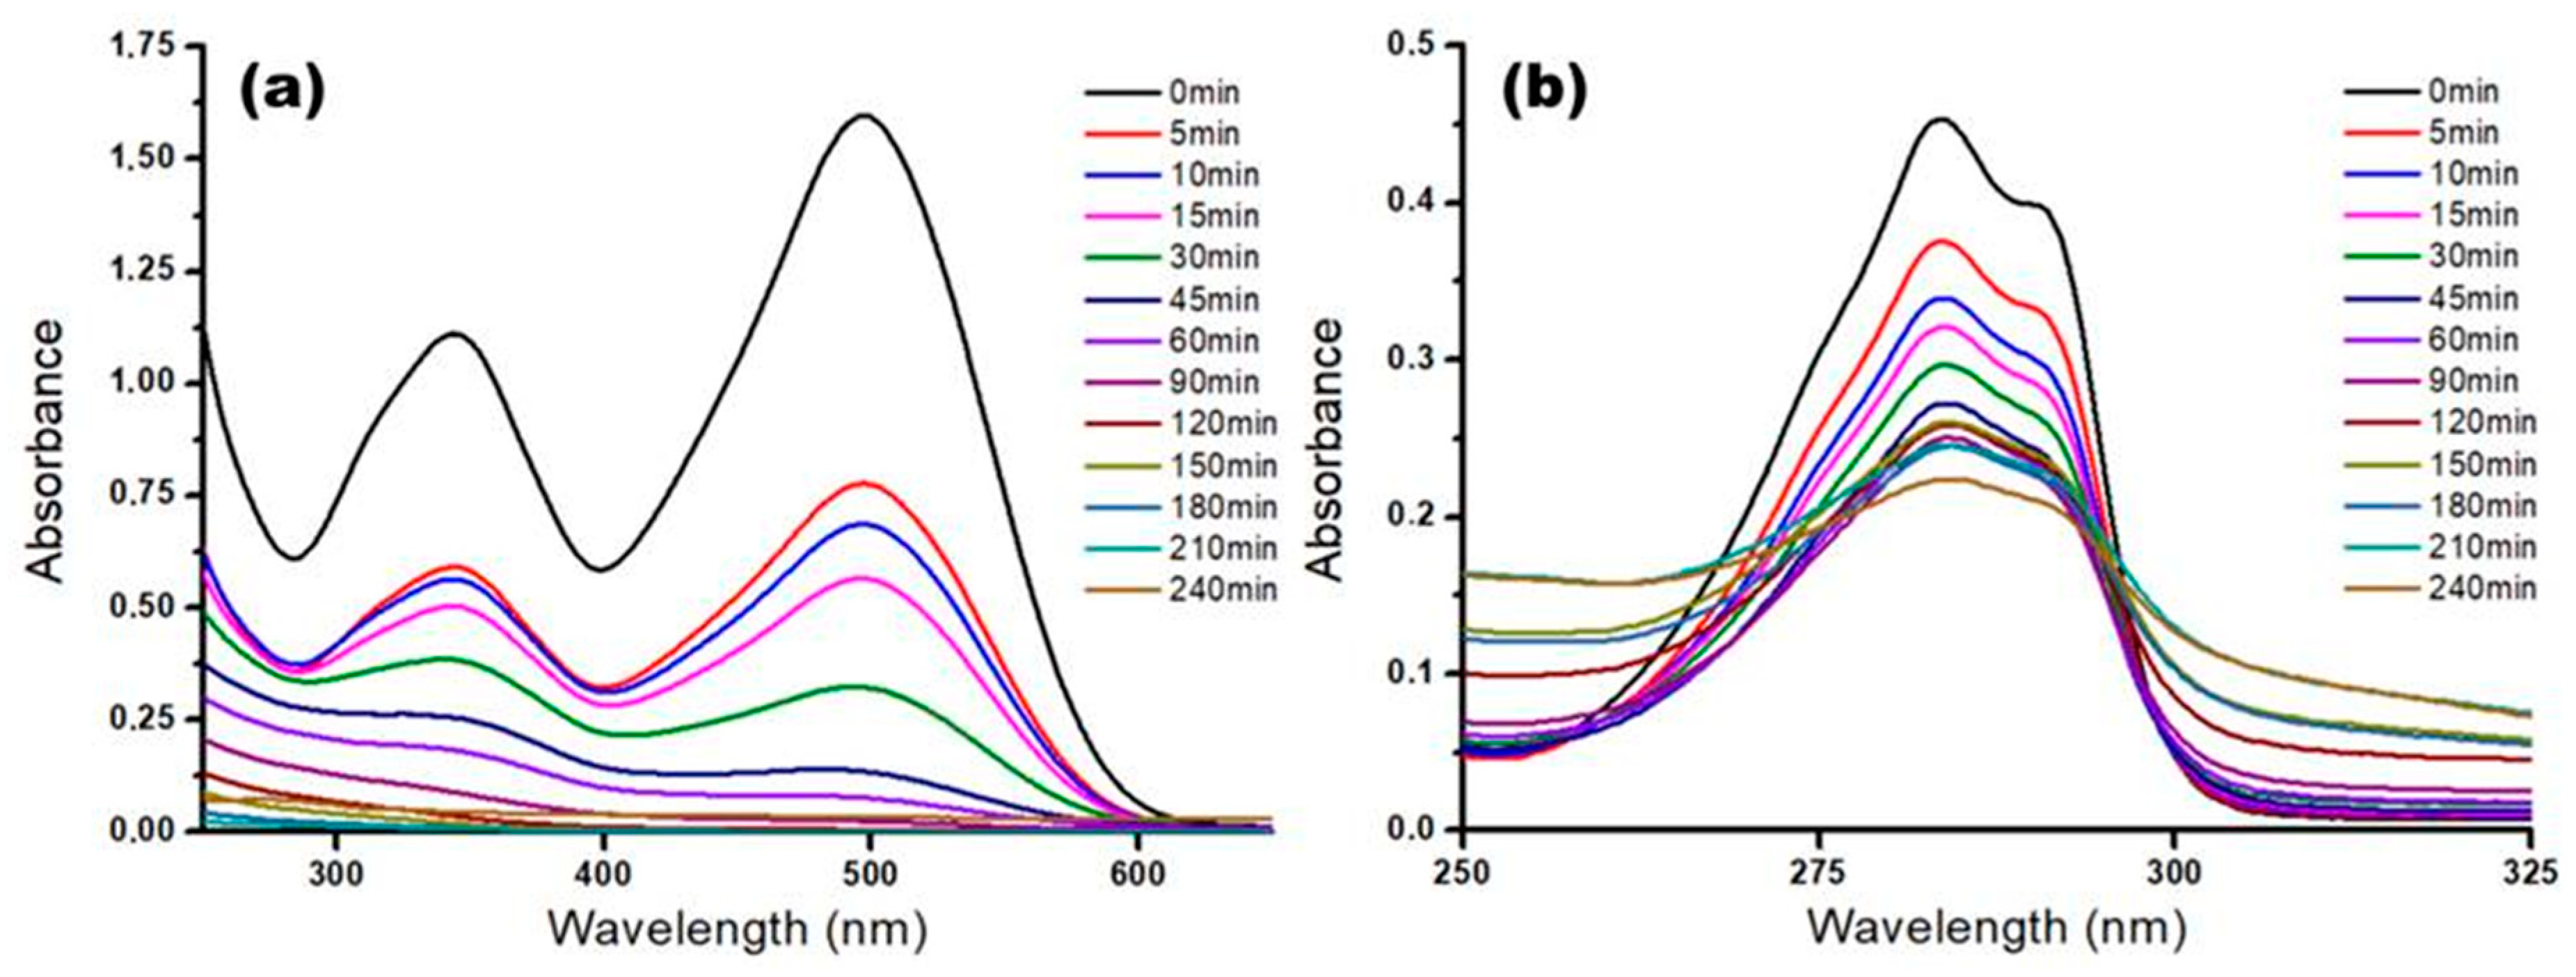
Figure 7 shows the evolution of the UV–Vis absorbance spectra for CR (
Figure 7a) and 2,4-D (
Figure 7b) solutions after irradiation by UV-light in the presence of the M5 photocatalyst. As one can see, in both cases, the intensity of the absorption peaks was diminished with the increment of the irradiation time (
Figure 7).
Assuming the calibration curves, the decay of the pollutants’ concentrations and the evolution of the removal efficiencies have been determined. The resulted kinetic data were interpolated by pseudo first-order models using nonlinear regression techniques. In this regard, the time evolutions of the pollutants’ concentrations, and respective removal efficiencies, were fitted to the pseudo first-order kinetic models with the residual (stable) component [
24,
25], as given by:
where
C0 denotes the initial pollutant concentration (50 mg/L),
Ce—residual pollutant concentration (mg/L),
k—pseudo first-order reaction rate constant (min
−1),
t—irradiation time (min);
γ—pseudo first-order removal rate constant (min
−1);
Ye—removal efficiency (%) emerged due to the residual pollutant concentration (
Ce). Note that, the residual (stable) component (
Ce) is a portion of the initial pollutant concentration, which is extremely persistent [
25]. According to
Figure 8a,b (as well to ESI,
Figure S5), the experimental data were in reasonable agreement with the predictions given by pseudo first-order kinetic models.
The calculated kinetic parameters are summarized in
Table 4. As detailed, the values of pseudo first-order rate constants (
k and
γ) were greater for the system CR + M5, if compared to the system 2,4-D+M5. Thus, the photodegradation of CR dye (
k1 = 8.86 × 10
−2 min
−1) was about 1.3-fold faster than the photodegradation of 2,4-D pesticide (
k2 = 6.84 × 10
−2 min
−1), keeping the same trend of the photodegradation with the external UV-lamp, even if that was less powerful one (6 vs. 150 W). Note that, the ratios between rate constants were found to be quite similar, i.e., (
k1/
k2) ≈ (
γ1/
γ2) (see
Table 4). The final removal efficiency (after
t = 120 min photodegradation) was equal to 98.40% and 46.30%, for CR and 2,4-D, respectively. These values (98.40% and 46.40%) were the greatest ones determined for this study. Hence, the degradation of pollutants in the commercial photoreactor (
VR = 600 mL) equipped with the internal UV-lamp was more intense (by 4% in both cases) than the degradation of pollutants in the smaller-sized photoreactor (
VR = 50 mL) equipped with the external UV-lamp.

 ,
, 


