
Chemical and Structural Assessment of New Dental Composites with Graphene Exposed to Staining Agents
 , ,
, ,  , ,
, ,  ,
,  ,
,
Abstract
:1. Introduction
2. Materials and Methods
2.1. Preparation of GO/SiO2 and GO/ZrO2 Materials
2.2. Composite Formulation
2.3. Investigation Methodology
2.3.1. FT-IR Spectroscopy
2.3.2. Evaluation of Composite Colour Stability
2.3.3. Sorption and Solubility Test
2.3.4. Surface Optical Profilometry
2.3.5. Scanning Electron Microscopy (SEM)
2.3.6. Antibacterial Activity
2.3.7. Statistical Analysis
3. Results
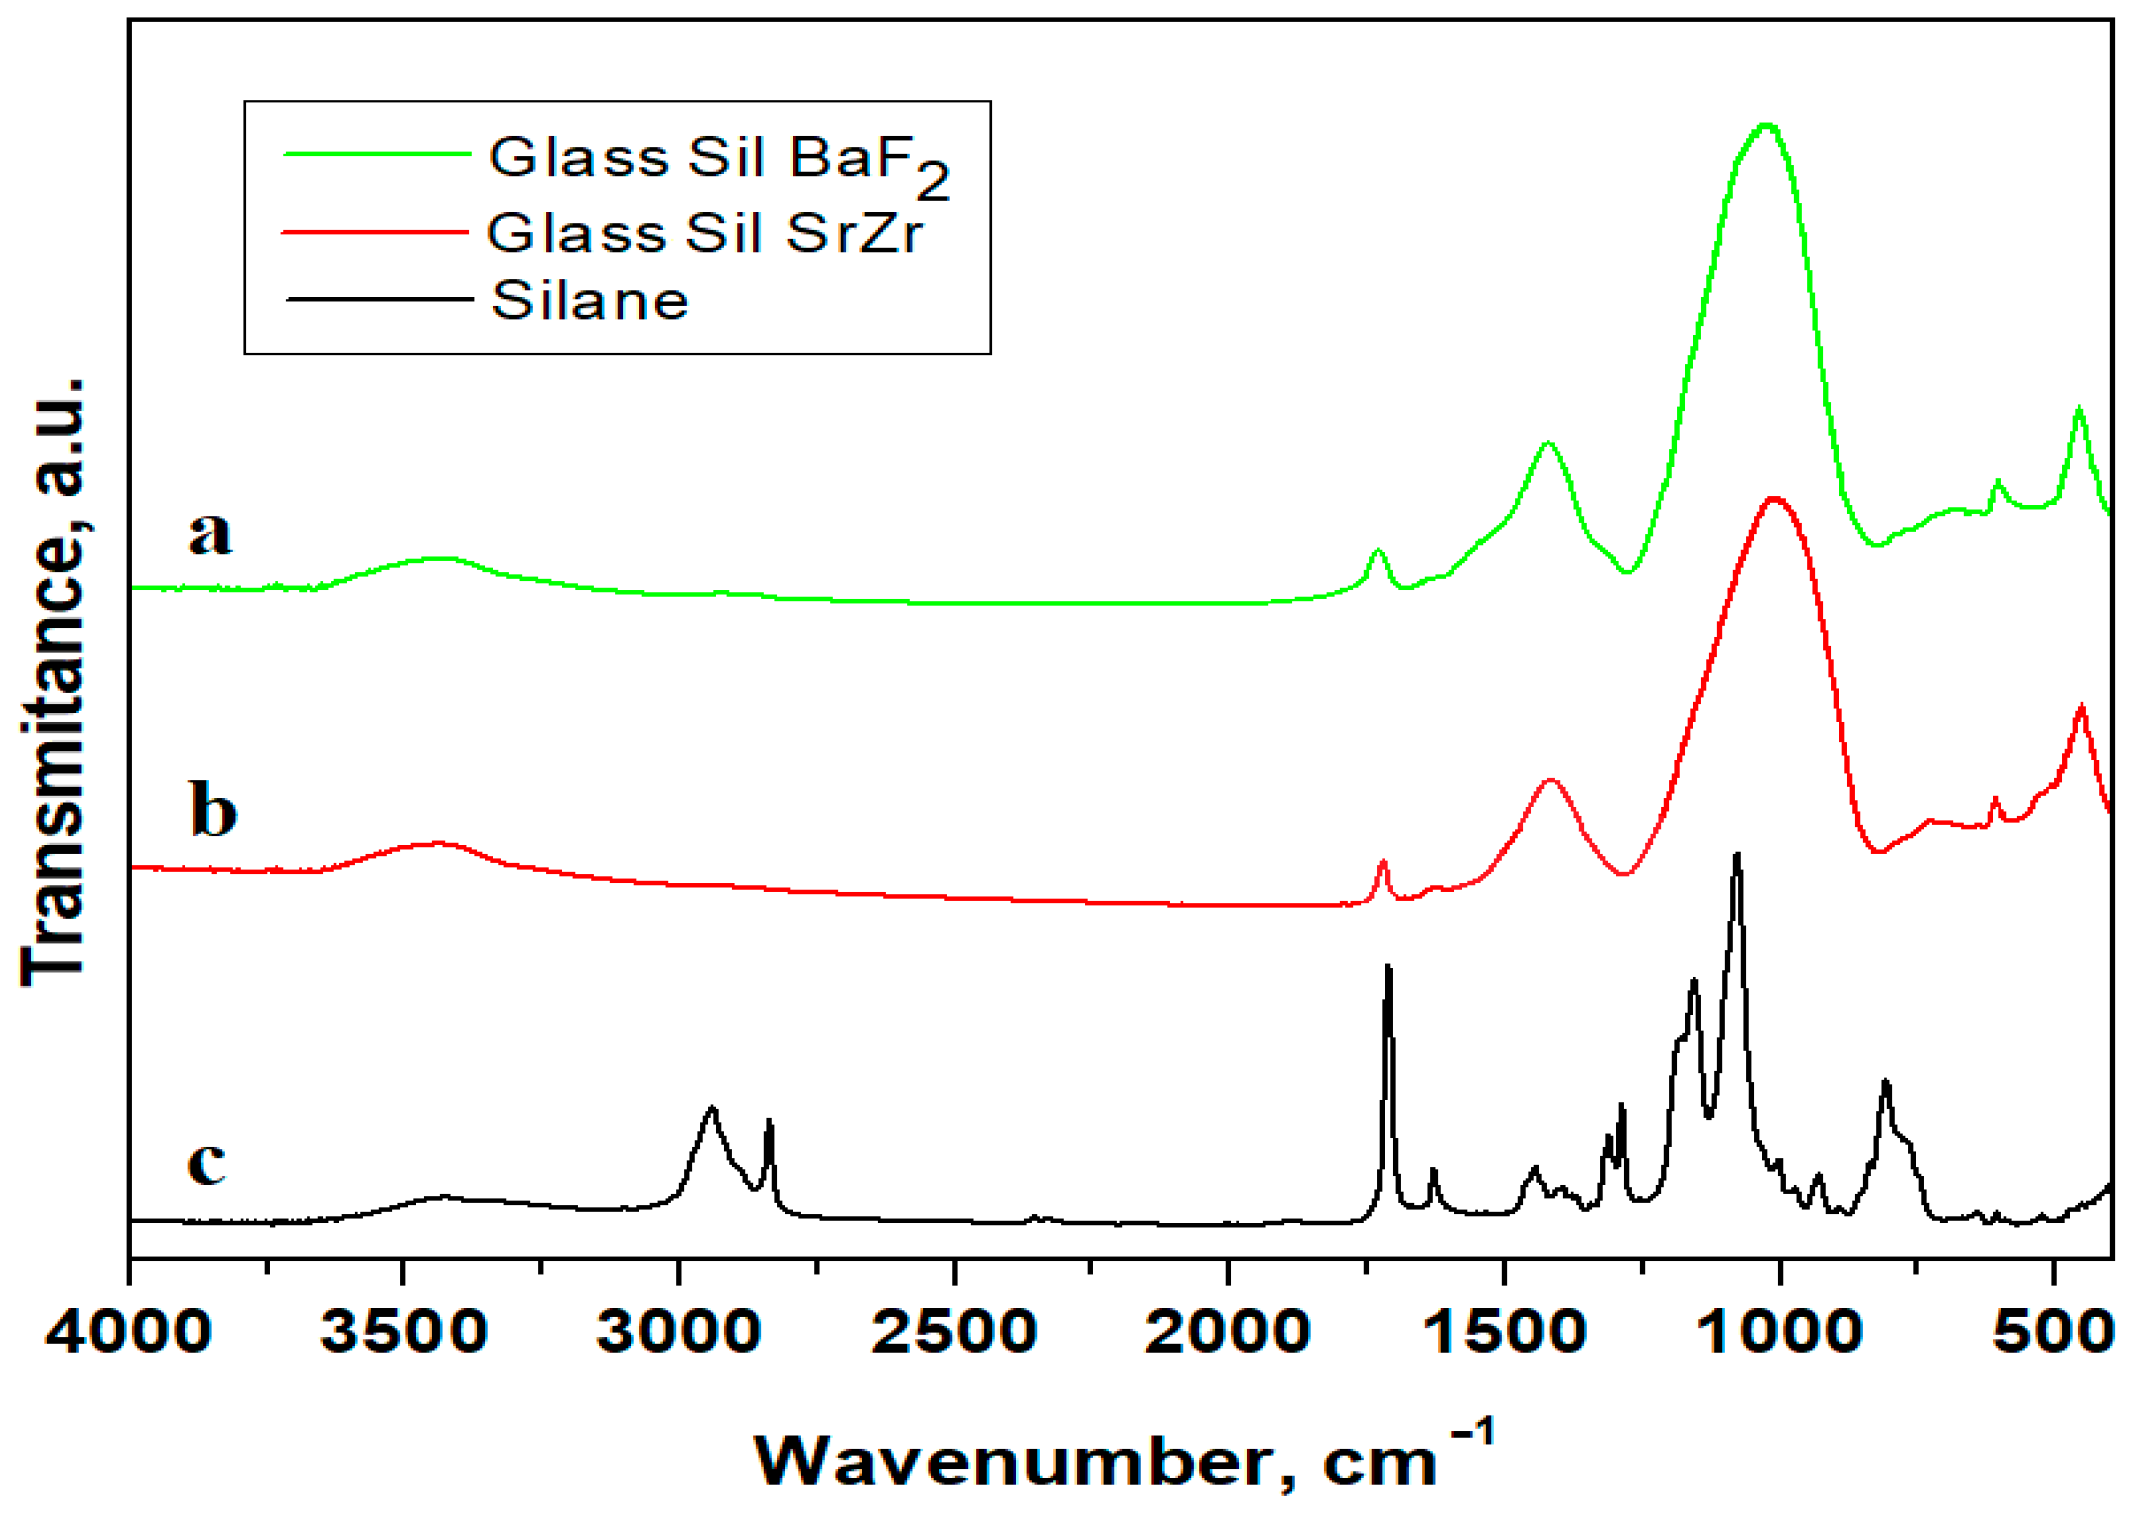
3.1. FT-IR Spectroscopy Analysis
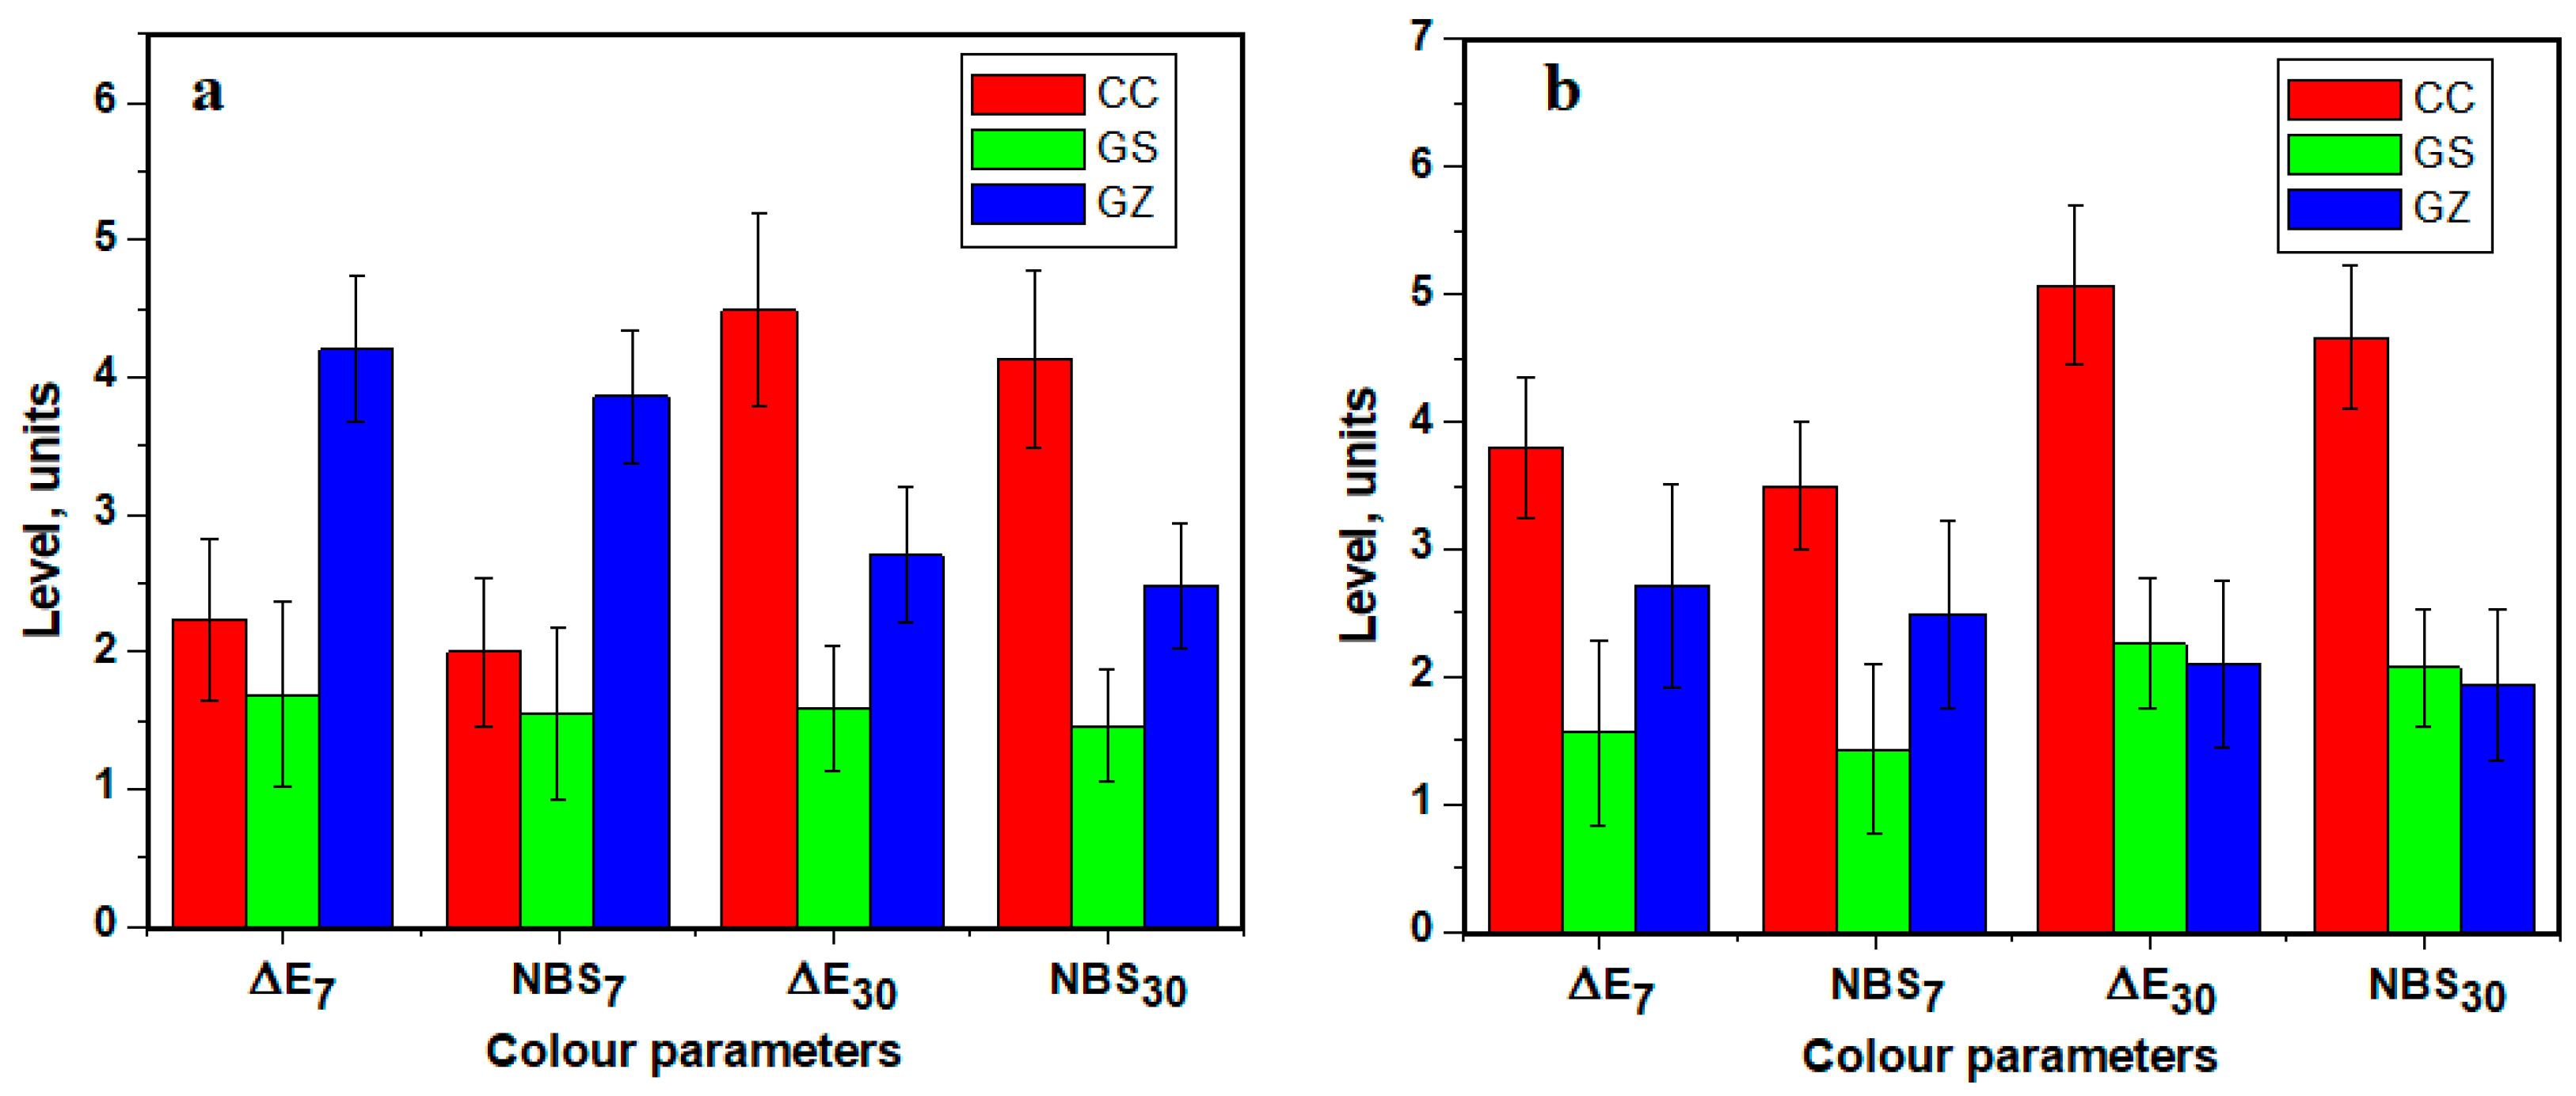
3.2. Colour Stability of Composites
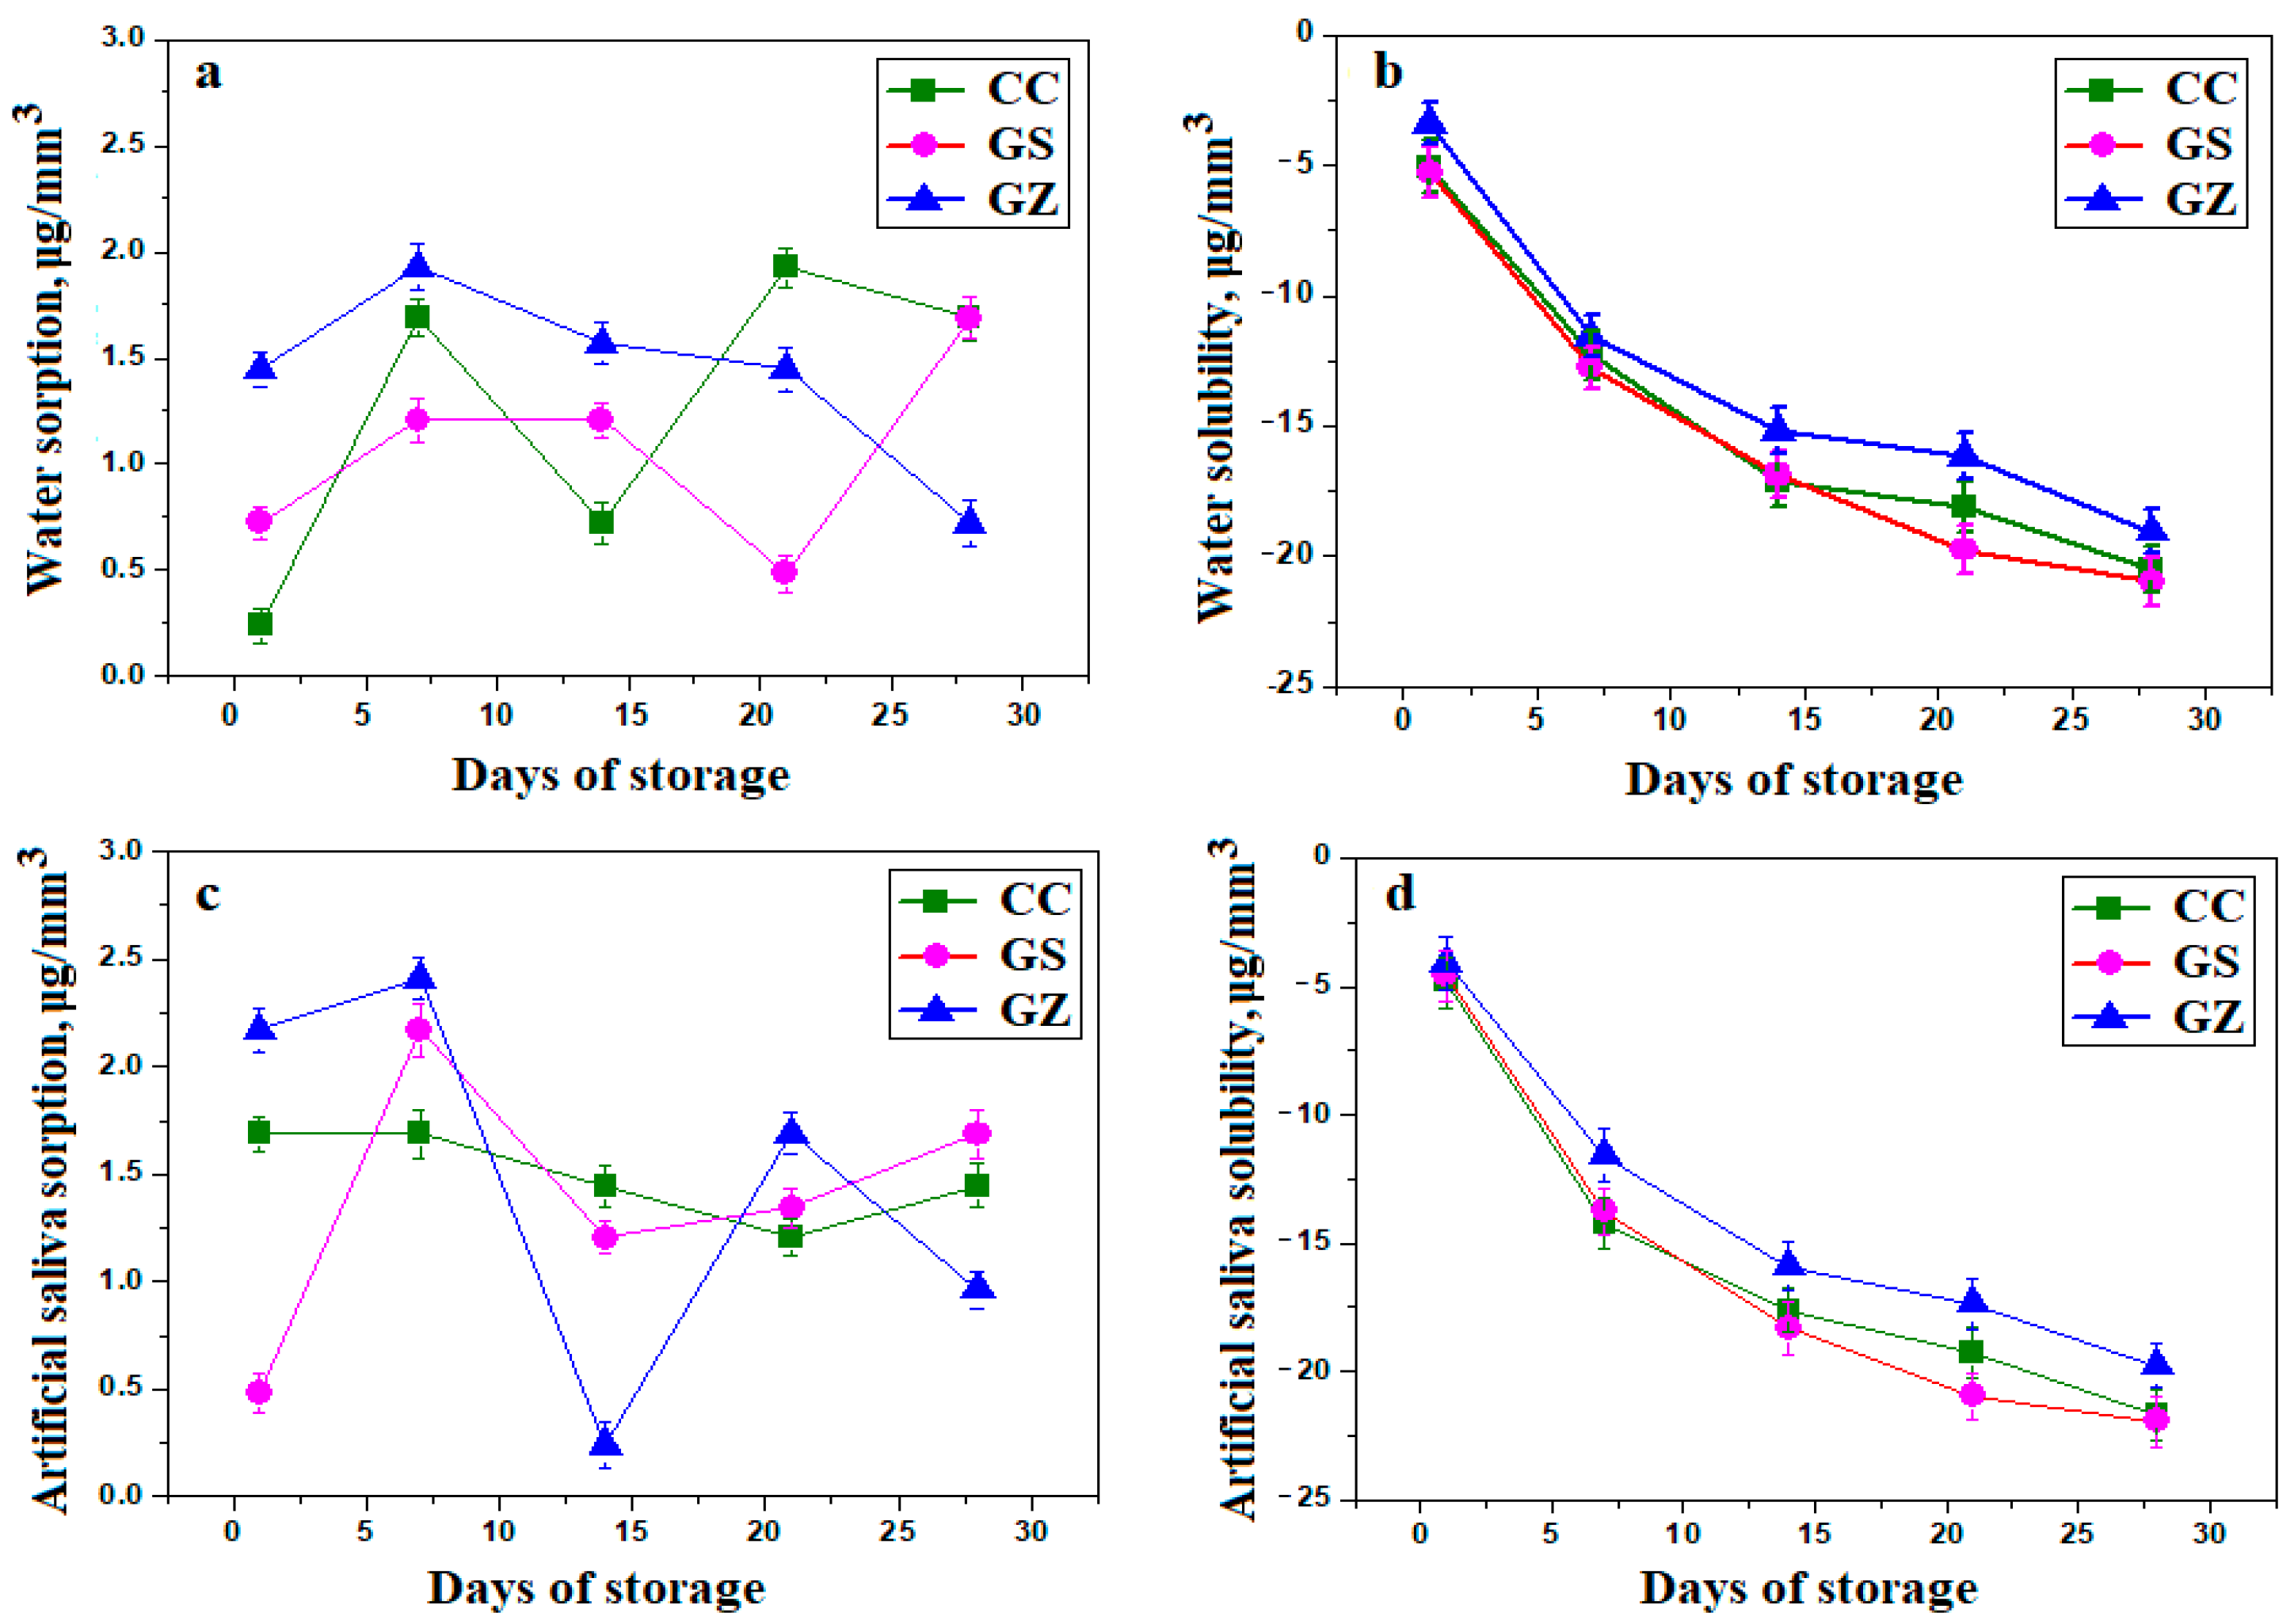
3.3. Sorption and Solubility Test
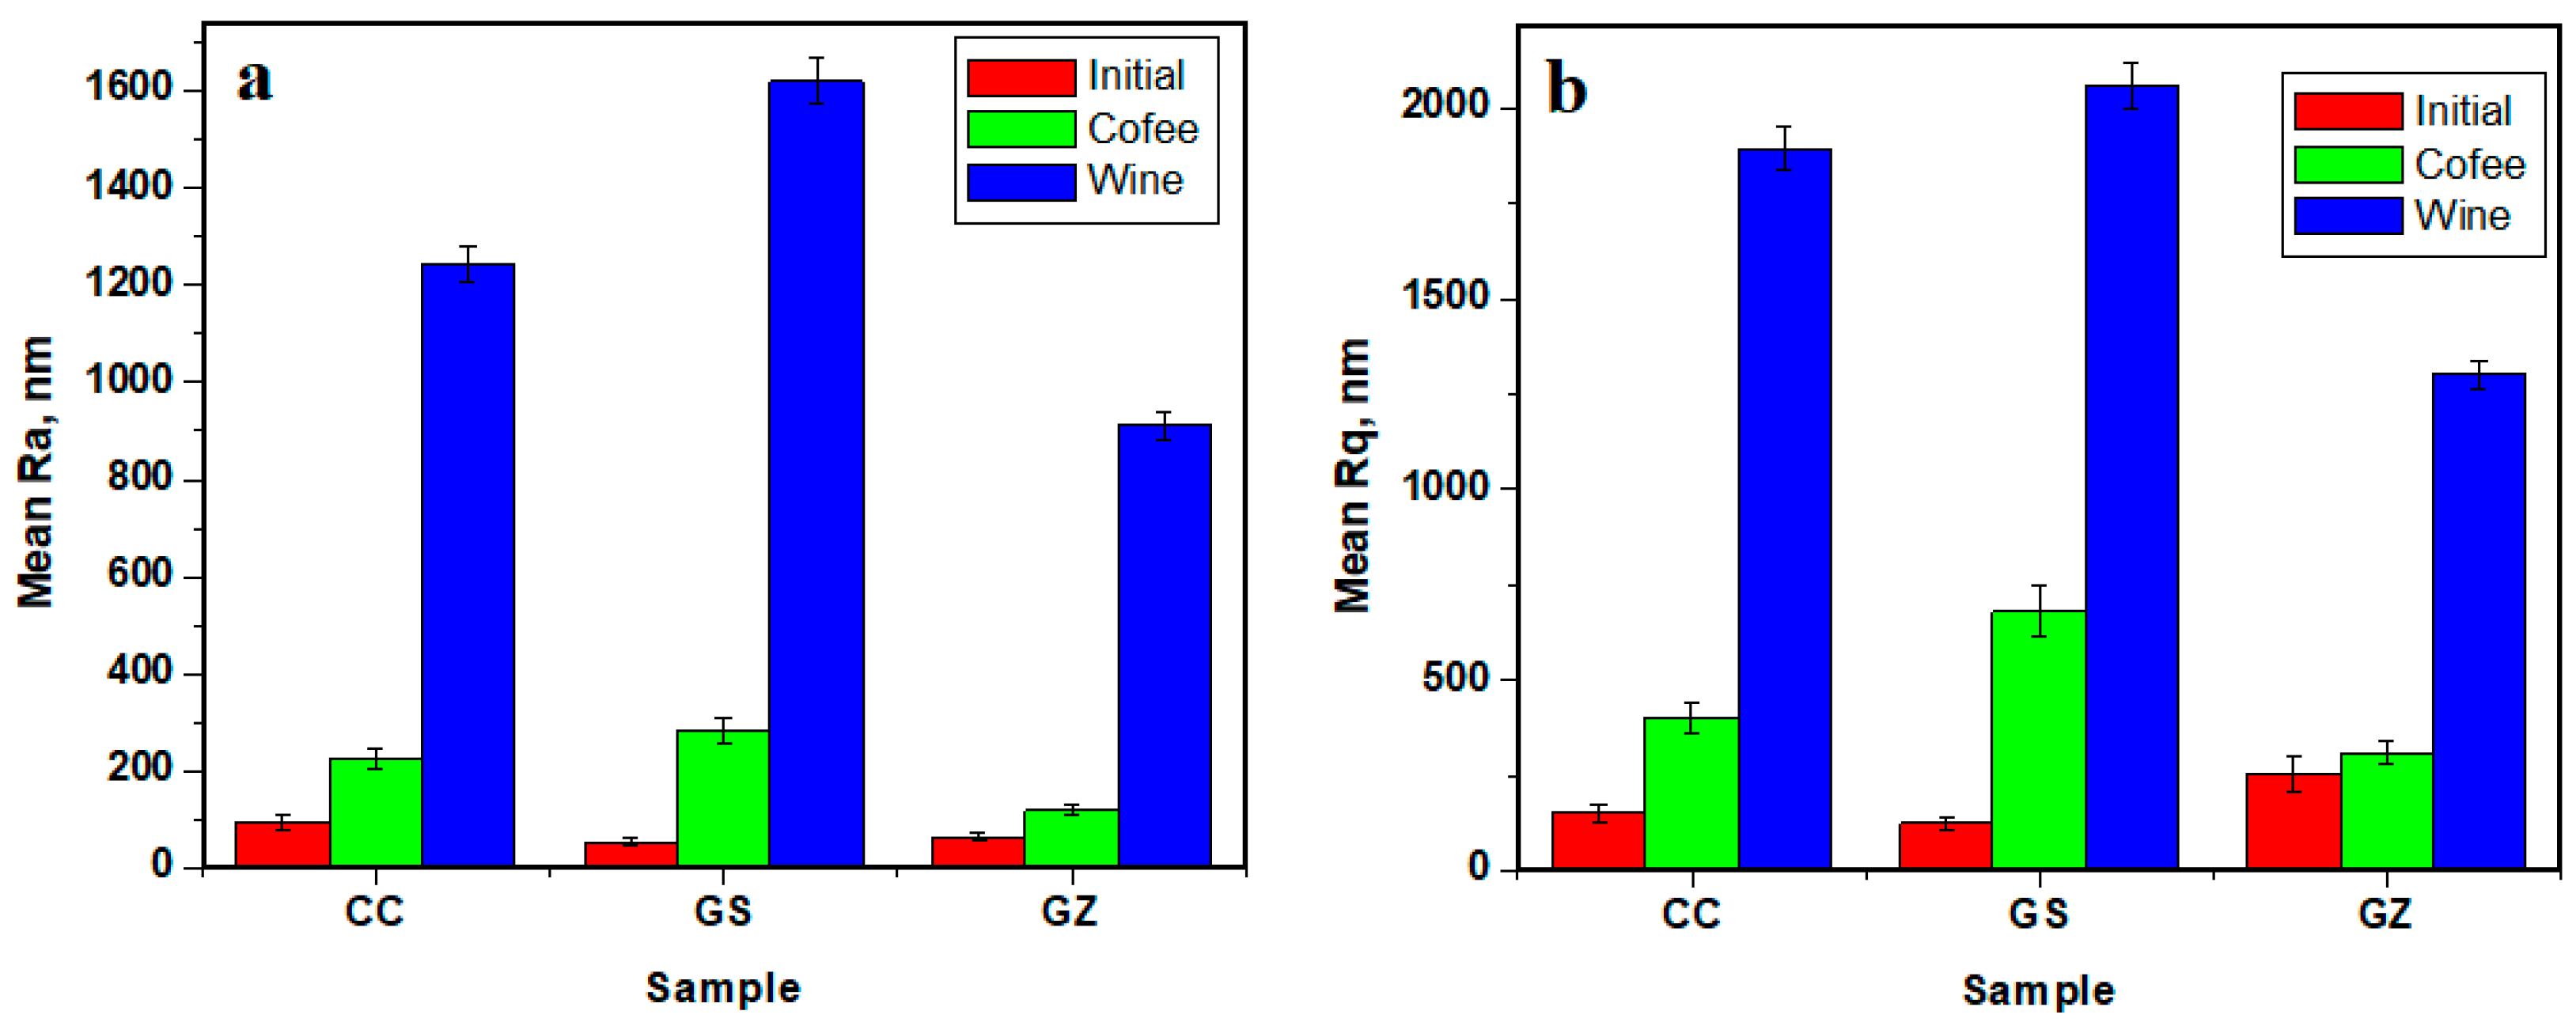
3.4. Optical Profilometry
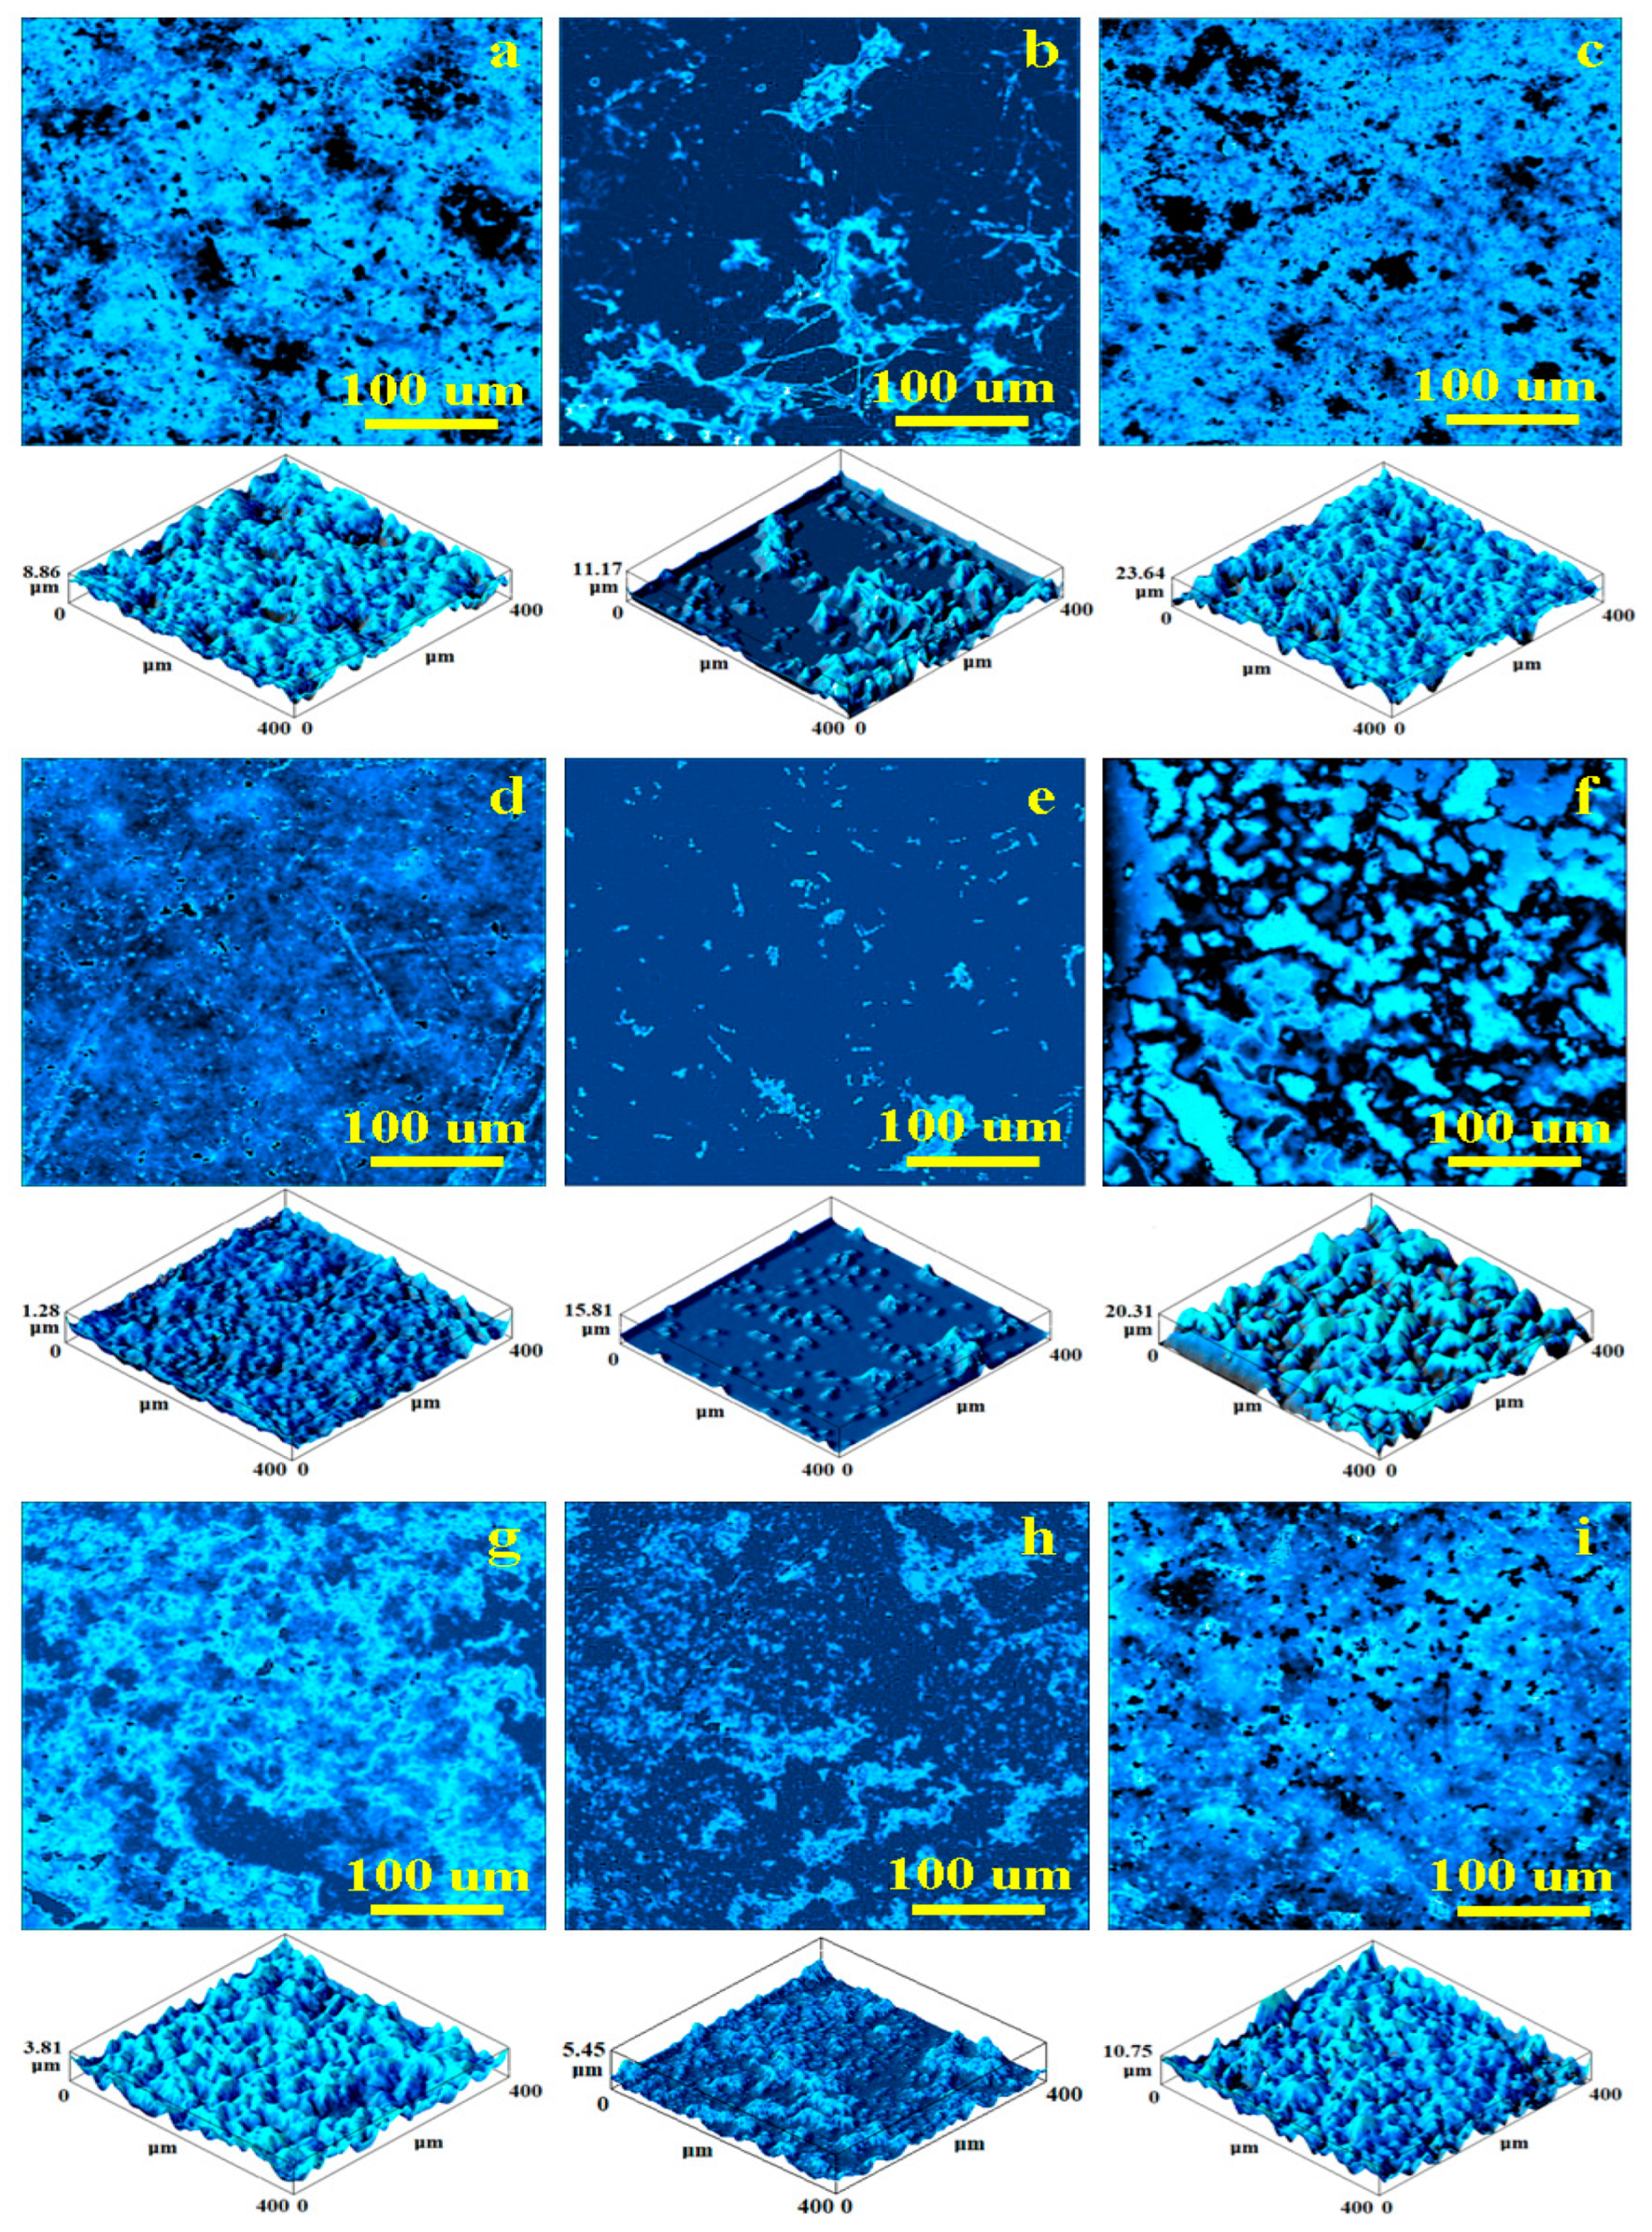
3.5. SEM Investigation of Samples
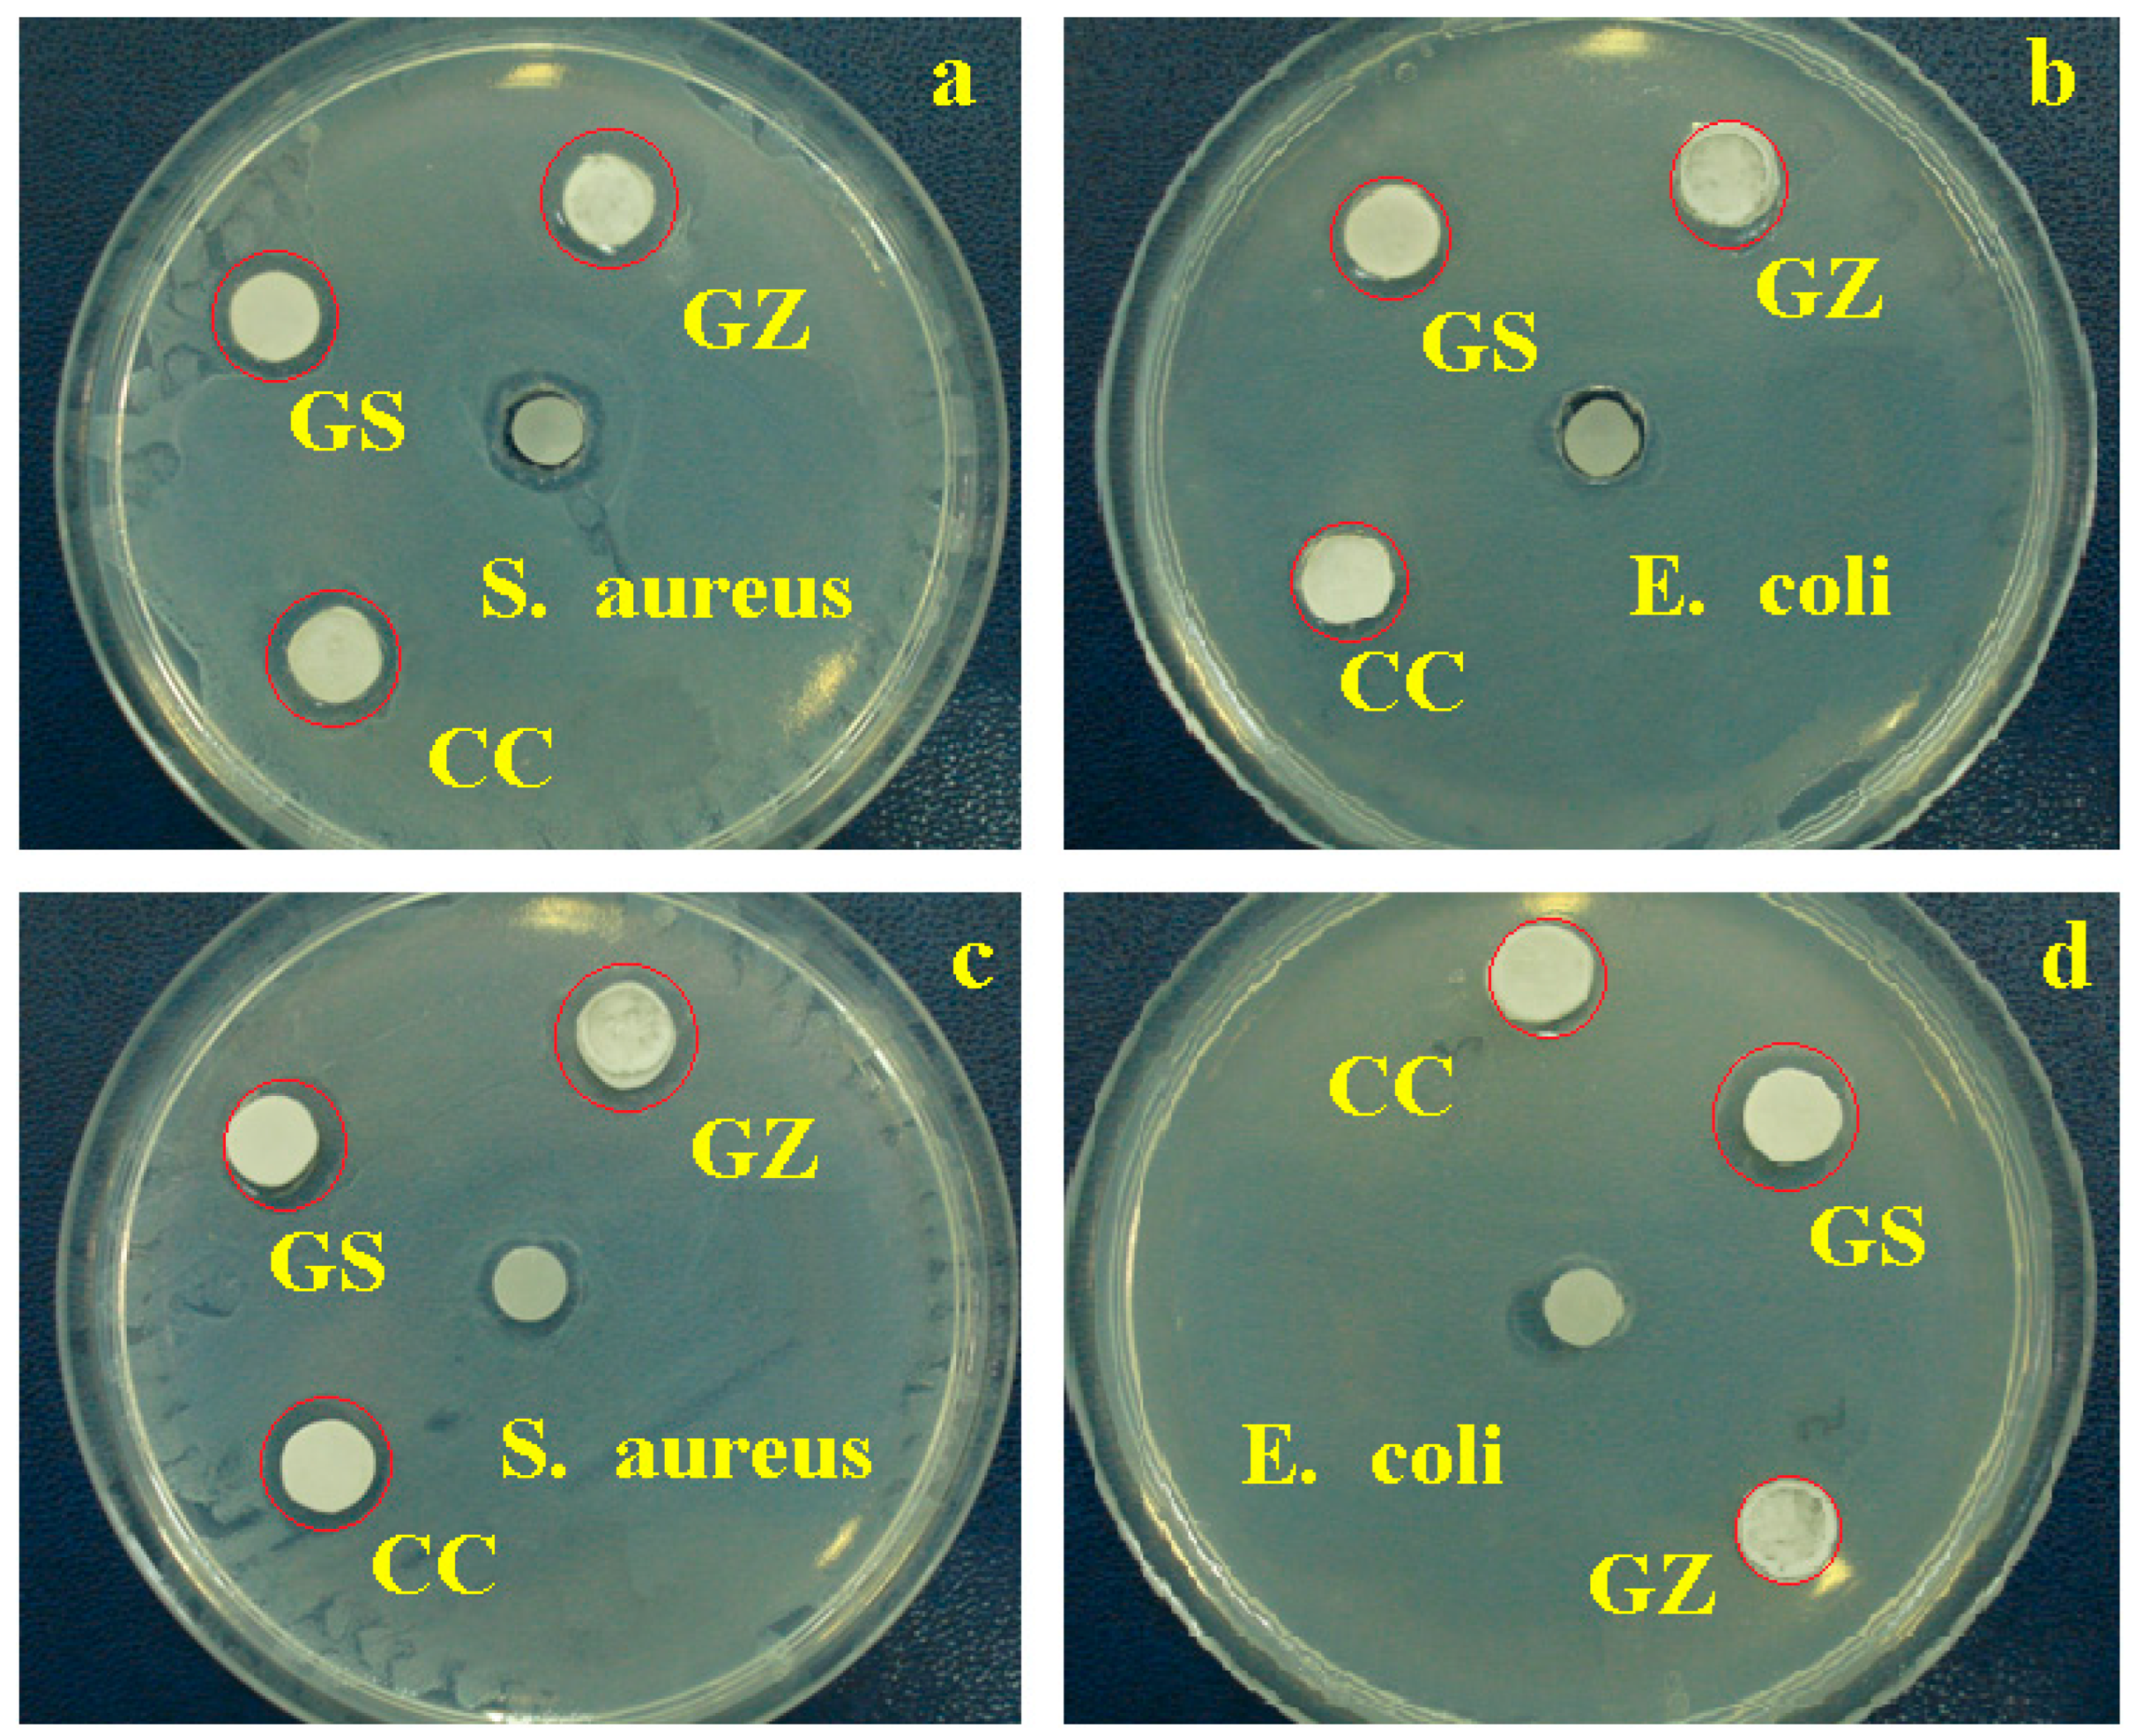
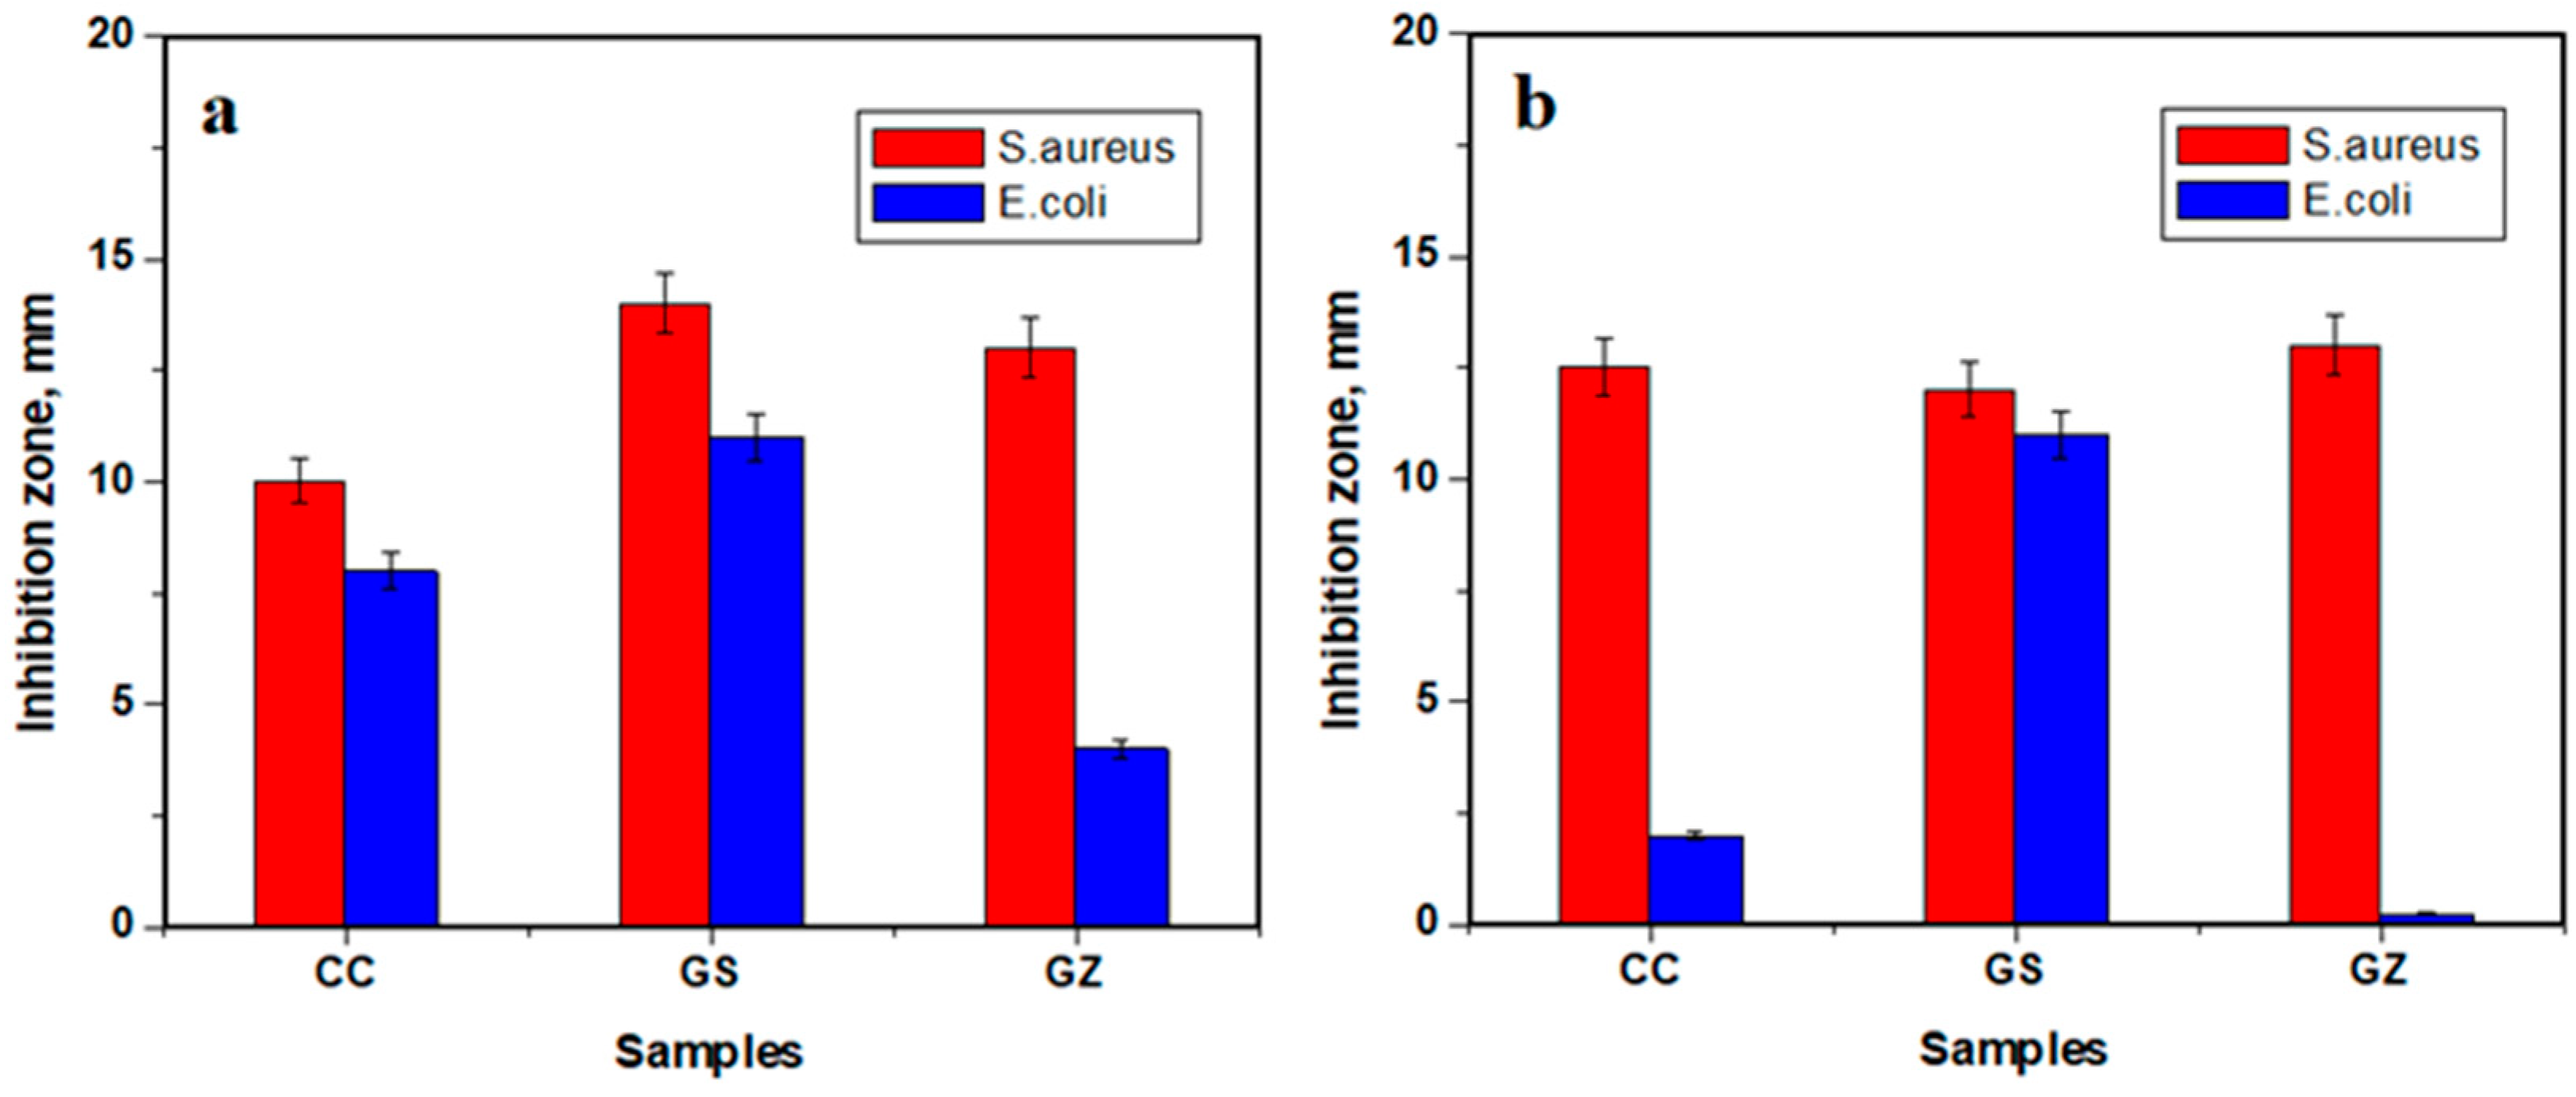
3.6. Antibacterial Activity
4. Discussion
5. Conclusions
Author Contributions
Funding
Institutional Review Board Statement
Informed Consent Statement
Data Availability Statement
Conflicts of Interest
References
- Chokaree, P.; Poovarodom, P.; Chaijareenont, P.; Yavirach, A.; Rungsiyakull, P. Biomaterials and Clinical Applications of Customized Healing Abutment—A Narrative Review. J. Funct. Biomater. 2022, 13, 291. [Google Scholar] [CrossRef] [PubMed]
- Schneider, L.F.J.; Ribeiro, R.B.; Liberato, W.F.; Salgado, V.E.; Moraes, R.R.; Cavalcante, L.M. Curing potential and color stability of different resin-based luting materials. Dent. Mater. 2020, 36, e309–e315. [Google Scholar] [CrossRef]
- Toma, F.R.; Porojan, S.D.; Vasiliu, R.D.; Porojan, L. The Effect of Polishing, Glazing, and Aging on Optical Characteristics of Multi-Layered Dental Zirconia with Different Degrees of Translucency. J. Funct. Biomater. 2023, 14, 68. [Google Scholar] [CrossRef]
- Fan, K.-C.; Lin, Y.-L.; Tsao, H.-W.; Chen, H.; Lee, S.-Y.; Cheng, Y.-C.; Huang, H.-P.; Lin, W.-C. In Vivo Evaluation of the Effects of Sintering Temperature on the Optical Properties of Dental Glass-Ceramics. Nanomaterials 2022, 12, 2187. [Google Scholar] [CrossRef] [PubMed]
- Kolb, C.; Gumpert, K.; Wolter, H.; Sextl, G. Highly translucent dental resin composites through refractive index adaption using zirconium dioxide nanoparticles and organic functionalization. Dent. Mater. 2020, 36, 1332–1342. [Google Scholar] [CrossRef] [PubMed]
- Elfakhri, F.; Alkahtani, R.; Li, C.; Khaliq, J. Influence of filler characteristics on the performance of dental composites: A comprehensive review. Ceram. Int. 2022, 48, 27280–27294. [Google Scholar] [CrossRef]
- Li, Q.; Coleman, N.J. Impact of Bi2O3 and ZrO2 Radiopacifiers on the Early Hydration and C–S–H Gel Structure of White Portland Cement. J. Funct. Biomater. 2019, 10, 46. [Google Scholar] [CrossRef] [Green Version]
- Cai, M.; Ratnayake, J.; Cathro, P.; Gould, M.; Ali, A. Investigation of a Novel Injectable Chitosan Oligosaccharide—Bovine Hydroxyapatite Hybrid Dental Biocomposite for the Purposes of Conservative Pulp Therapy. Nanomaterials 2022, 12, 3925. [Google Scholar] [CrossRef] [PubMed]
- Badr, C.; Spagnuolo, G.; Amenta, F.; Khairallah, C.; Mahdi, S.S.; Daher, E.; Battineni, G.; Baba, N.Z.; Zogheib, T.; Qasim, S.S.B.; et al. A Two-Year Comparative Evaluation of Clinical Performance of a Nanohybrid Composite Resin to a Flowable Composite Resin. J. Funct. Biomater. 2021, 12, 51. [Google Scholar] [CrossRef] [PubMed]
- De Kuijper, M.C.F.M.; Cune, M.S.; Özcan, M.; Gresnigt, M.M. Clinical performance of direct composite resin versus indirect restorations on endodontically treated posterior teeth: A systematic review and meta-analysis. J. Prosthet. Dent. 2021. Corrected Proof. [Google Scholar] [CrossRef]
- Şişmanoğlu, S.; Sengez, G. Effects of Acidic Beverages on Color Stability of Bulk-Fill Composites with Different Viscosities. Odovtos Int. J. Dent. Sci. 2022, 24, 90–99. [Google Scholar] [CrossRef]
- Chakravarthy, Y.; Clarence, S. The effect of red wine on colour stability of three different types of esthetic restorative materials: An in vitro study. J. Conserv. Dent. 2018, 21, 319–323. [Google Scholar] [CrossRef] [PubMed]
- Dara, L.; Buchi, D.; Mantena, S.R.; Varma, M.; Rao, D.; Chandrappa, V. Recent Advances in Dental Composites: An Overview. Int. J. Dent. Mater. 2019, 1, 48–54. [Google Scholar] [CrossRef]
- Dimitrova, M.; Chuchulska, B.; Zlatev, S.; Kazakova, R. Colour Stability of 3D-Printed and Prefabricated Denture Teeth after Immersion in Different Colouring Agents—An In Vitro Study. Polymers 2022, 14, 3125. [Google Scholar] [CrossRef] [PubMed]
- Voina, C.; Delean, A.; Muresan, A.; Valeanu, M.; Moldovan, A.M.; Popescu, V.; Petean, I.; Ene, R.; Moldovan, M.; Pandrea, S. Antimicrobial Activity and the Effect of Green Tea Experimental Gels on Teeth Surfaces. Coatings 2020, 10, 537. [Google Scholar] [CrossRef]
- Malekipour, M.R.; Sharafi, A.; Kazemi, S.; Khazaei, S.; Shirani, F. Comparison of color stability of a composite resin in different color media. Dent. Res. J. 2012, 9, 441–446. [Google Scholar]
- Alnassar, T.M. Color Stability of Monolithic Zirconia in Various Staining Liquids: An In Vitro Study. Appl. Sci. 2022, 12, 9752. [Google Scholar] [CrossRef]
- Manno, S.H.C.; Manno, F.A.M.; Ahmed, I.; Ahmed, R.; Shu, L.; Li, L.; Xu, S.; Xie, F.; Li, V.W.T.; Ho, J.; et al. Spectroscopic examination of enamel staining by coffee indicates dentin erosion by sequestration of elements. Talanta 2018, 189, 550–559. [Google Scholar] [CrossRef]
- Rikihisa, N.; Watanabe, S.; Saito, Y.; Sakai, H. Artificial Red Blood Cells as Potential Photosensitizers in Dye Laser Treatment Against Port-Wine Stains. J. Funct. Biomater. 2017, 8, 14. [Google Scholar] [CrossRef]
- Minute, F.; Giotto, F.; Filipe-Ribeiro, L.; Cosme, F.; Nunes, F.M. Alternative Methods for Measuring the Susceptibility of White Wines to Pinking Alteration: Derivative Spectroscopy and CIEL*a*b* Colour Analysis. Foods 2021, 10, 553. [Google Scholar] [CrossRef]
- Paolone, G.; Mandurino, M.; De Palma, F.; Mazzitelli, C.; Scotti, N.; Breschi, L.; Gherlone, E.; Cantatore, G.; Vichi, A. Color Stability of Polymer-Based Composite CAD/CAM Blocks: A Systematic Review. Polymers 2023, 15, 464. [Google Scholar] [CrossRef] [PubMed]
- Lee, W.-F.; Takahashi, H.; Huang, S.-Y.; Zhang, J.-Z.; Teng, N.-C.; Peng, P.-W. Effects of At-Home and In-Office Bleaching Agents on the Color Recovery of Esthetic CAD-CAM Restorations after Red Wine Immersion. Polymers 2022, 14, 3891. [Google Scholar] [CrossRef] [PubMed]
- Rewak-Soroczynska, J.; Nowak, N.; Targonska, S.; Piecuch, A.; Wiglusz, R.J. The Study of Nanosized Silicate-Substituted Hydroxyapatites Co-Doped with Sr2+ and Zn2+ Ions Related to Their Influence on Biological Activities. Curr. Issues Mol. Biol. 2022, 44, 6229–6246. [Google Scholar] [CrossRef] [PubMed]
- Padmanabhan, S.K.; Nitti, P.; Stanca, E.; Rochira, A.; Siculella, L.; Raucci, M.G.; Madaghiele, M.; Licciulli, A.; Demitri, C. Mechanical and Biological Properties of Magnesium- and Silicon-Substituted Hydroxyapatite Scaffolds. Materials 2021, 14, 6942. [Google Scholar] [CrossRef]
- Bie, H.; Chen, H.; Shan, L.; Tan, C.Y.; Al-Furjan, M.S.H.; Ramesh, S.; Gong, Y.; Liu, Y.F.; Zhou, R.G.; Yang, W.; et al. 3D Printing and Performance Study of Porous Artificial Bone Based on HA-ZrO2-PVA Composites. Materials 2023, 16, 1107. [Google Scholar] [CrossRef]
- Alrahlah, A.; Khan, R.; Al-Odayni, A.-B.; Saeed, W.S.; Bautista, L.S.; Vohra, F. Evaluation of Synergic Potential of rGO/SiO2 as Hybrid Filler for BisGMA/TEGDMA Dental Composites. Polymers 2020, 12, 3025. [Google Scholar] [CrossRef]
- Dreanca, A.; Sarosi, C.; Parvu, A.E.; Blidaru, M.; Enacrachi, G.; Purdoiu, R.; Nagy, A.; Sevastre, B.; Oros, N.A.; Marcus, I.; et al. Systemic and Local Biocompatibility Assessment of Graphene Composite Dental Materials in Experimental Mandibular Bone Defect. Materials 2020, 13, 2511. [Google Scholar] [CrossRef]
- Ahn, J.H.; Kim, I.-R.; Kim, Y.; Kim, D.-H.; Park, S.-B.; Park, B.-S.; Bae, M.-K.; Kim, Y.-I. The Effect of Mesoporous Bioactive Glass Nanoparticles/Graphene Oxide Composites on the Differentiation and Mineralization of Human Dental Pulp Stem Cells. Nanomaterials 2020, 10, 620. [Google Scholar] [CrossRef] [Green Version]
- Ilie, N.; Sarosi, C.; Rosu, M.C.; Moldovan, M. Synthesis and characterization of graphene oxide-zirconia (GO-ZrO2) and hydroxyapatite-zirconia (HA-ZrO2) nano-fillers for resin-based composites for load-bearing applications. J. Dent. 2021, 105, 103557. [Google Scholar] [CrossRef] [PubMed]
- Ilie, N.; Serfözö, N.E.; Prodan, D.; Diegelmann, J.; Moldovan, M. Synthesis and performance of experimental resin-based dental adhesives reinforced with functionalized graphene and hydroxyapatite fillers. Mater. Des. 2022, 221, 110985. [Google Scholar] [CrossRef]
- Moldovan, M.; Prodan, D.; Sarosi, C.; Carpa, R.; Socaci, C.; Rosu, M.-C.; Pruneanu, S. Synthesis, morpho-structural properties and antibacterial effect of silicate-based composites containing graphene oxide/hydroxyapatite. Mater. Chem. Phys. 2018, 217, 48–53. [Google Scholar] [CrossRef]
- Cramer, N.B.; Stansbury, J.W.; Bowman, C.N. Recent Advances and Developments in Composite Dental Restorative Materials. J. Dent. Res. 2011, 90, 402–416. [Google Scholar] [CrossRef] [Green Version]
- Tarle, Z.; Marović, D.; Pandurić, P. Contemporary concepts on composite materials. Rad 514 Med. Sci. 2012, 38, 23–38. [Google Scholar]
- Domingos, P.A.D.S.; Garcia, P.P.N.S.; De Oliveira, A.L.B.M.; Palma-Dibb, R.G. Composite resin color stability: Influence of light sources and immersion media. J. Appl. Oral Sci. 2011, 19, 204–211. [Google Scholar] [CrossRef] [PubMed]
- Sarkis, E. Color change of some aesthetic dental materials: Effect of immersion solutions and finishing of their surfaces. Saudi Dent. J. 2012, 24, 85–89. [Google Scholar] [CrossRef] [Green Version]
- American National Standard. American Dental Association Specification No. 27 for Resin-Based Filling Materials; American National Standard: Washington, DC, USA, 1993. [Google Scholar]
- International Standards Organization ISO 4049. Dentistry-Polymer-Based Filling, Restorative and Luting Materials; International Standards Organization: Geneva, Switzerland, 2000. [Google Scholar]
- Paolone, G.; Mazzitelli, C.; Zechini, G.; Scolavino, S.; Goracci, C.; Scotti, N.; Cantatore, G.; Gherlone, E.; Vichi, A. Influence of Modeling Liquids and Universal Adhesives Used as Lubricants on Color Stability and Translucency of Resin-Based Composites. Coatings 2023, 13, 143. [Google Scholar] [CrossRef]
- Tantanuch, S.; Kukiattrakoon, B.; Peerasukprasert, T.; Chanmanee, N.; Chaisomboonphun, P.; Rodklai, A. Surface roughness and erosion of nanohybrid and nanofilled resin composites after immersion in red and white wine. J. Conserv. Dent. 2016, 19, 51–55. [Google Scholar] [CrossRef]
- Al-Samadani, K.H. The Effect of Preventive Agents (Mouthwashes/Gels) on the Color Stability of Dental Resin-Based Composite Materials. Dent. J. 2017, 5, 18. [Google Scholar] [CrossRef]
- Crăciun, A.; Bȃldea, I.; Ispas, A.; Badea, M.E.; Petean, I.; Sarosi, C.; Moldovan, M.; Cuc, S.; Ene, R.; Crişan, M. Evaluation of Surface Characteristics and Cytotoxicity of Dental Composites. Coatings 2020, 10, 749. [Google Scholar] [CrossRef]
- AlShaafi, M.M. Factors affecting polymerization of resin-based composites: A literature review. Saudi Dent. J. 2017, 29, 48–58. [Google Scholar] [CrossRef]
- Iosif, C.; Cuc, S.; Prodan, D.; Moldovan, M.; Petean, I.; Badea, M.E.; Sava, S.; Tonea, A.; Chifor, R. Effects of Acidic Environments on Dental Structures after Bracket Debonding. Int. J. Mol. Sci. 2022, 23, 15583. [Google Scholar] [CrossRef] [PubMed]
- Iosif, C.; Cuc, S.; Prodan, D.; Moldovan, M.; Petean, I.; Labunet, A.; Tudoran, L.B.; Badea, I.C.; Man, S.C.; Badea, M.E.; et al. Mechanical Properties of Orthodontic Cements and Their Behavior in Acidic Environments. Materials 2022, 15, 7904. [Google Scholar] [CrossRef] [PubMed]
- Yildiz, E.; Karaarslan, E.S.; Simsek, M.; Ozsevik, A.S.; Usumez, A. Color stability and surface roughness of polished anterior restorative materials. Dent. Mater. J. 2015, 34, 629–639. [Google Scholar] [CrossRef] [PubMed] [Green Version]
- Poggio, C.; Vialba, L.; Berardengo, A.; Federico, R.; Colombo, M.; Beltrami, R.; Scribante, A. Color Stability of New Esthetic Restorative Materials: A Spectrophotometric Analysis. J. Funct. Biomater. 2017, 8, 26. [Google Scholar] [CrossRef] [PubMed] [Green Version]
- Omata, Y.; Uno, S.; Nakaoki, Y.; Tanaka, T.; Sano, H.; Yoshida, S.; Sidhu, S.K. Staining of Hybrid Composites with Coffee, Oolong Tea, or Red Wine. Dent. Mater. J. 2006, 25, 125–131. [Google Scholar] [CrossRef] [Green Version]
- Alzahrani, K.M.; Alhaqbani, M.M.; Basalem, S.A.; Alsubaie, F.; AlRabiah, M.; Alzahrani, A.; AlAali, K.A.; Farooq, I.; Vohra, F.; Abduljabbar, T. Effect of Staining Drinks on the Color Stability of Grit Blasted and Non-Grit Blasted Monolithic Zirconia: An In Vitro Study. Crystals 2022, 12, 1331. [Google Scholar] [CrossRef]
- Suriyasangpetch, S.; Sivavong, P.; Niyatiwatchanchai, B.; Osathanon, T.; Gorwong, P.; Pianmee, C.; Nantanapiboon, D. Effect of Whitening Toothpaste on Surface Roughness and Colour Alteration of Artificially Extrinsic Stained Human Enamel: In Vitro Study. Dent. J. 2022, 10, 191. [Google Scholar] [CrossRef]


| Type | Materials | Manufacturer | Monomers Matrix 20 wt% | Total Fillercontent 80 wt% |
|---|---|---|---|---|
| light-curing composite | CC | UBB-ICCRR, Cluj-Napoca Romania | Bis-GMA; TEGDMA | HA-Ag(particle size 0.01–60 μm and 5–8 nm); Sr-Zr glass (particle size 0.01–0.035 μm and 2–6 nm); Quartz |
| light-curing composite | GS | UBB-ICCRR, Cluj-Napoca Romania | Bis-GMA; TEGDMA | 0.3 GO/SiO2 HA-SiO2(particle size 0.01–60 μm and 5–8 nm); Sr-Zr glass (particle size 0.01–0.035 μm and 2–6 nm); Quartz |
| light-curing composite | GZ | UBB-ICCRR, Cluj-Napoca Romania | Bis-GMA; TEGDMA | 0.3 GO/ZrO2 HA-ZrO2 (particle size 0.01–60 μm and 5–8 nm); silica; barium glass (BaO) (particle size 0.01-0.035 μm and 2–6 nm); quartz;;silica; glass filler (with BaF2) (size 2–6 nm) |
Disclaimer/Publisher’s Note: The statements, opinions and data contained in all publications are solely those of the individual author(s) and contributor(s) and not of MDPI and/or the editor(s). MDPI and/or the editor(s) disclaim responsibility for any injury to people or property resulting from any ideas, methods, instructions or products referred to in the content. |
© 2023 by the authors. Licensee MDPI, Basel, Switzerland. This article is an open access article distributed under the terms and conditions of the Creative Commons Attribution (CC BY) license (https://creativecommons.org/licenses/by/4.0/).
Share and Cite
Moldovan, M.; Dudea, D.; Cuc, S.; Sarosi, C.; Prodan, D.; Petean, I.; Furtos, G.; Ionescu, A.; Ilie, N. Chemical and Structural Assessment of New Dental Composites with Graphene Exposed to Staining Agents. J. Funct. Biomater. 2023, 14, 163. https://doi.org/10.3390/jfb14030163
Moldovan M, Dudea D, Cuc S, Sarosi C, Prodan D, Petean I, Furtos G, Ionescu A, Ilie N. Chemical and Structural Assessment of New Dental Composites with Graphene Exposed to Staining Agents. Journal of Functional Biomaterials. 2023; 14(3):163. https://doi.org/10.3390/jfb14030163
Chicago/Turabian StyleMoldovan, Marioara, Diana Dudea, Stanca Cuc, Codruta Sarosi, Doina Prodan, Ioan Petean, Gabriel Furtos, Andrei Ionescu, and Nicoleta Ilie. 2023. "Chemical and Structural Assessment of New Dental Composites with Graphene Exposed to Staining Agents" Journal of Functional Biomaterials 14, no. 3: 163. https://doi.org/10.3390/jfb14030163