1. Introduction
Nepal’s geographical makeup and political position set its tourist industry apart from that of other tourism-dependent countries. Nepal has its own quirks, commercial circumstances, social and political context, and unique technical environment. It is therefore important to understand the tourism business in Nepal through its own lens. The various studies on tourism and technology in Nepal have suggested that ICT is a primary component that needs investigating for the overall growth and development of the tourism business. It is further noted that due to information asymmetry and scattered information, a tourism recommendation system is a crucial system needed at the current time. The tourism industry may benefit from a well-designed recommender system, which will also make traveling to Nepal more convenient for visitors. The design and creation of a tourist recommender system for Nepal is the specific focus of this paper. An extensive study was conducted on tourist planning assessment, tourist spending nature, preference indicators, and satisfaction in order to learn about the characteristics of tourists visiting Pokhara, Nepal. A total of 2800 questionnaires were distributed in order to gather data using structured and semi-structured questionnaires, including in-person distribution through friends and peer groups and the use of online media platforms, including social media, Google Forms, and emails. The survey respondents included both domestic (40%) and international (60%) tourist.
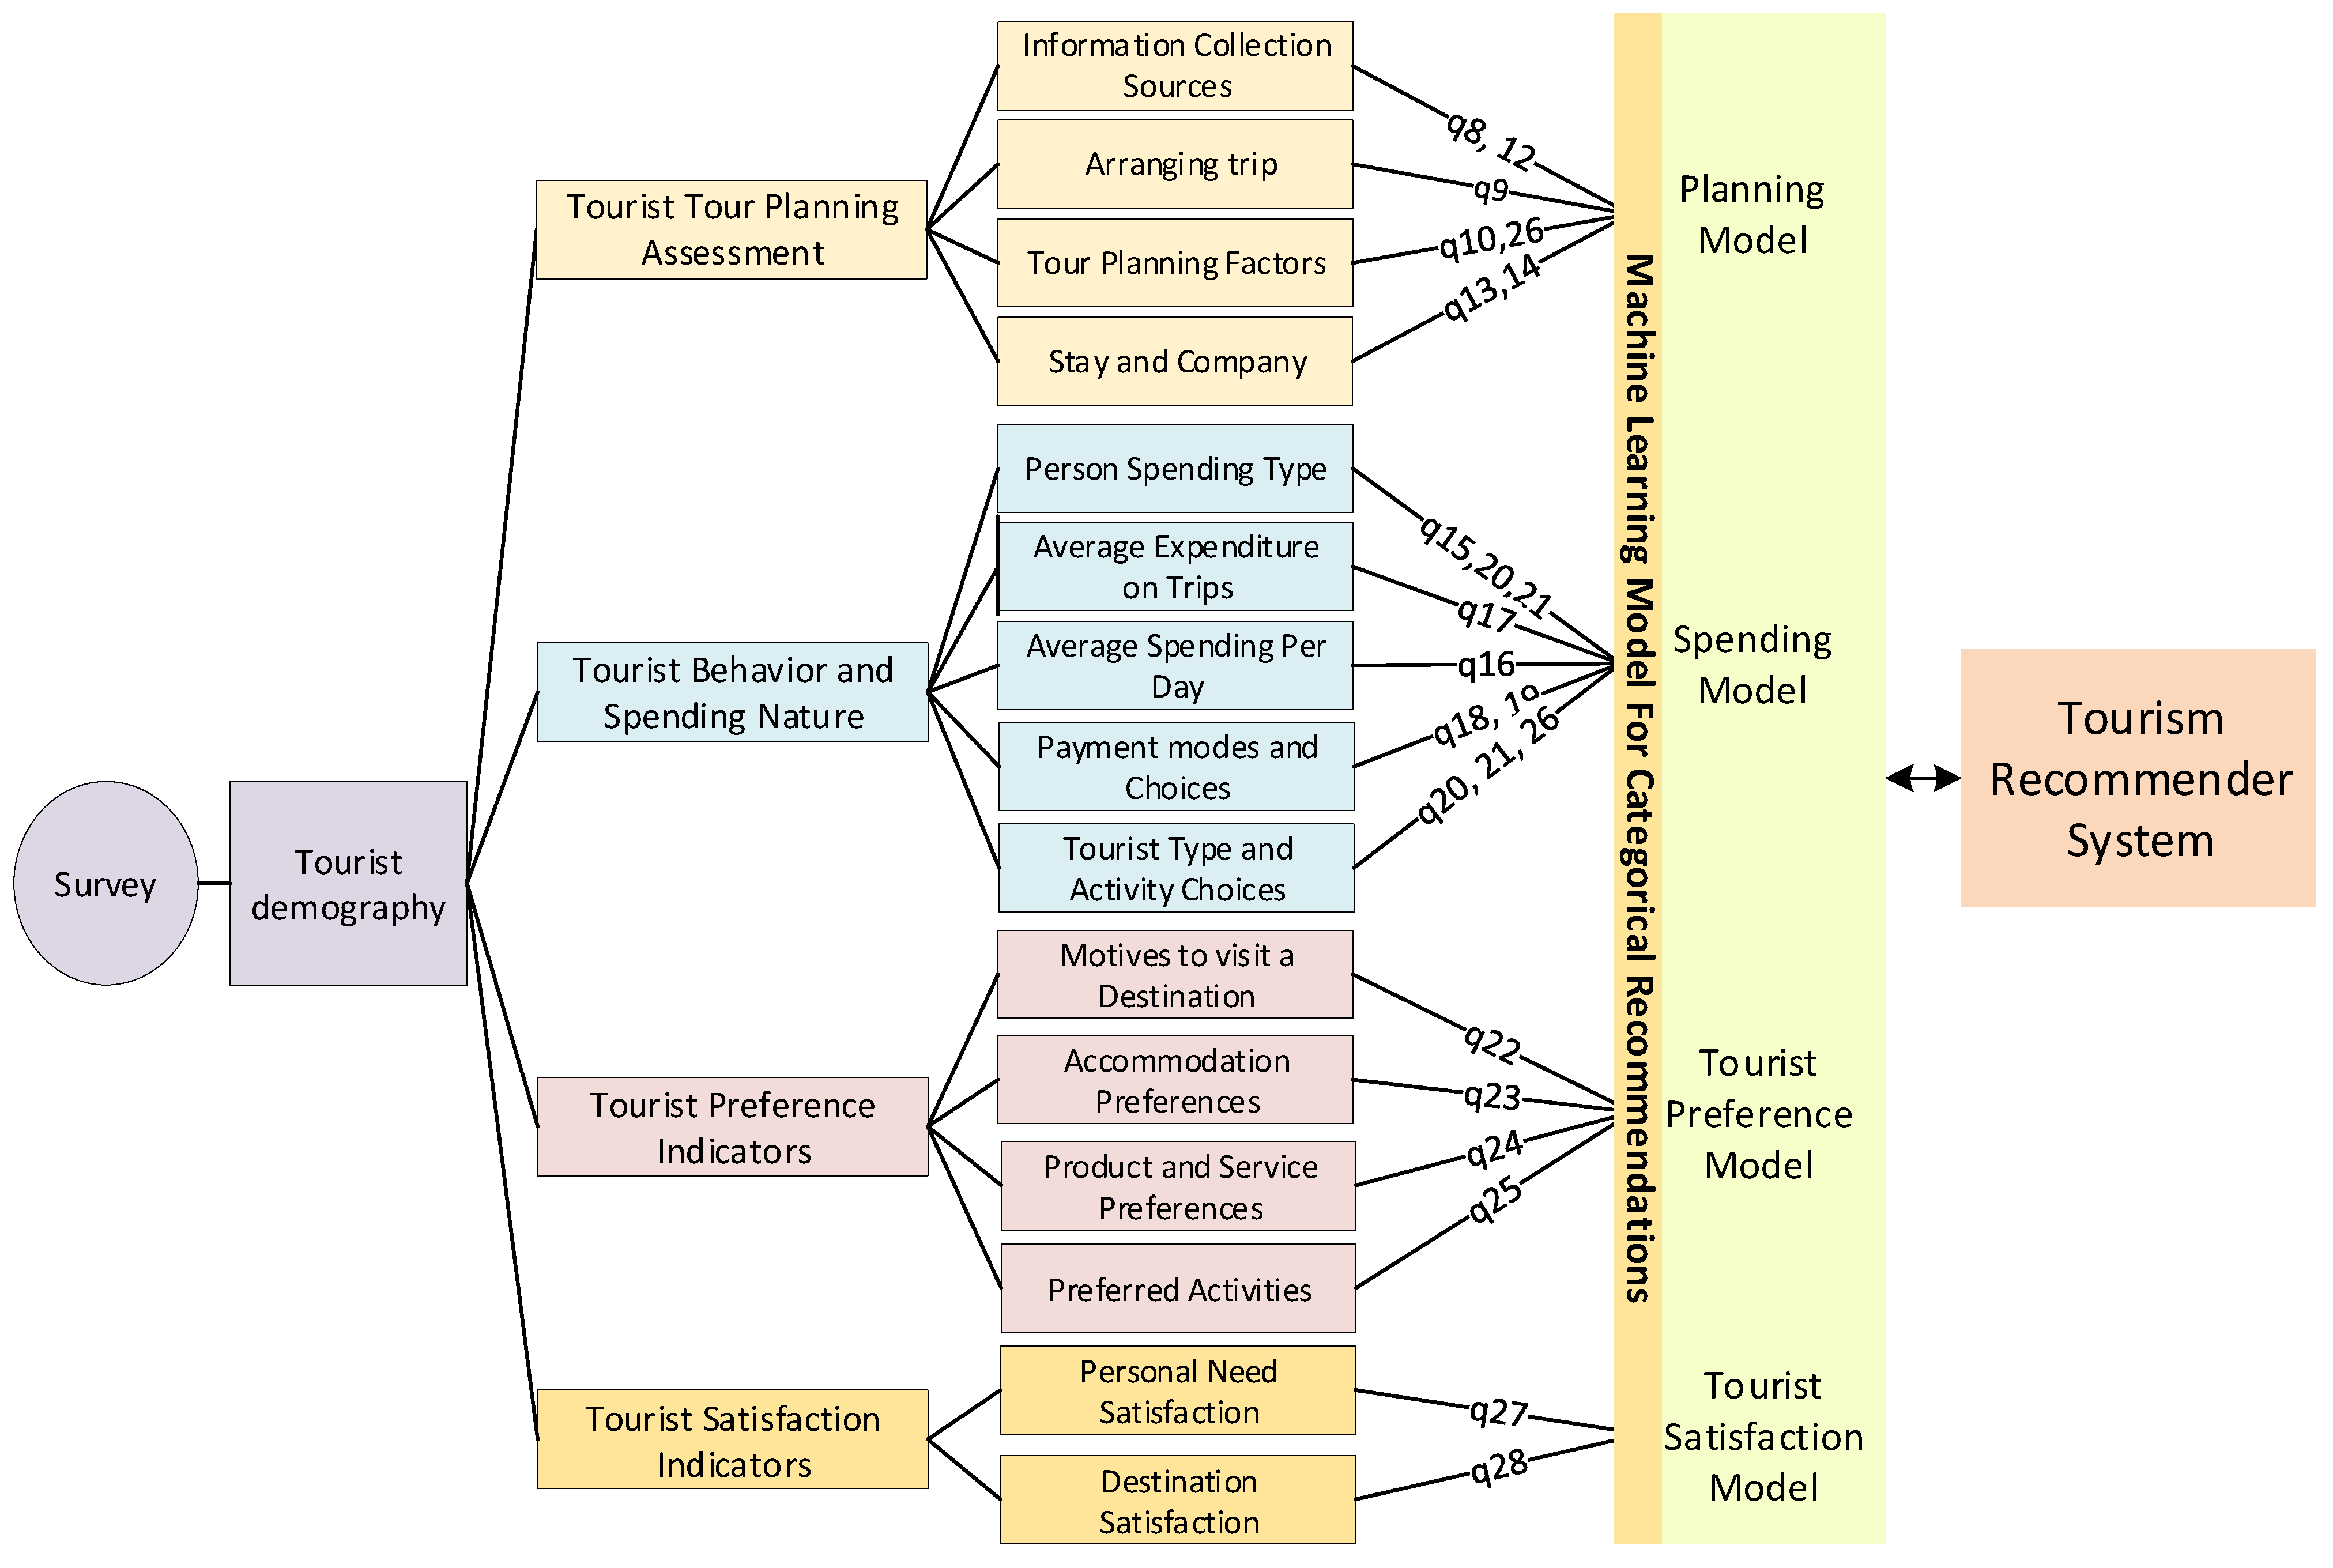
To guarantee the accuracy of the data, rigorous preprocessing was used on the 2500 responses. The preprocessing included dealing with duplicate entries, missing data, outliers, and sparse feature removal. As a result, a dataset containing 2400 occurrences and 125 variables was obtained. Included in these variables were 120 characteristics, 99 of which were categorical and 21 numerical. It was discovered that there were no missing values in the final dataset, strengthening the accuracy and integrity of the data. The dataset was split into four sub-models to make subsequent analysis easier, as shown in
Figure 1. The four sub-models included the tourist tour planning assessment, tourist behavior and spending nature, tourist preference indicators, and tourist satisfaction indictors, alongside the seven demographic characteristics, including country, gender, age group, occupation, education, and income level. Supervised machine-learning techniques were used to fully use the dataset after considering important features. By combining iterative input and industry knowledge from both visitors and specialists, data labeling was completed. Machine-learning algorithms were trained using the labeled dataset in order to create the best models possible for each sub-model under investigation.
Finally, a novel algorithm was developed to utilize the machine-learning output into tailored real-world recommendations. Multiple determining factors, including location, cost, popularity, rating, ranking, and current trends, were taken into account by this algorithm. Weights were given to the criteria based on user-significance data, enabling the creation of a comprehensive score that guided the algorithm in providing the best recommendations to visitors.
2. Literature Review
The literature shows that recommender systems are a subset of decision-support systems [
1] and use three basic components to make a recommendation. The three fields include the user interface, the information retrieval system, and data mining technologies [
1]. A recommender system is a system that works to recommend a product or a service based on its utility in the system. These systems were first used on e-commerce websites such as Amazon, Alibaba, and Netflix and have since expanded to e-governance, tourism, and social networking sites such as Facebook and LinkedIn [
2]. A comprehensive summary of the overall literature on recommender systems is beyond the scope of this work; hence, this study focuses exclusively on the application of recommender systems in the tourism industry of Nepal, also referred to as Tourist Recommender Systems (TRSs) or Tourism Recommender Systems.
Tourist Recommender Systems are specifically designed and developed for different contexts and are deployed in web applications, travel sites, mobile apps, and similar platforms [
3]. The basic design of a TRS typically involves user demographics, interests, priorities, estimates, and making recommendations for accommodations, Points of Interest (POIs), tourism products, services, etc. The design of a TRS is generally dictated by business needs, data sources, and the current state of technology development [
4]. It may integrate various subsystems and supporting information systems, utilizing the different attributes of the tourist and additional information from related entities. Typically, TRSs provide suggestions on accommodations (based on location, rates, distance from the city, nearby POIs, etc.), activities (tailored to the tourist’s type, whether single, group, age, sex, gender), budget, time, and travel goals. The Tourist Recommender System operates on user data collected both explicitly and implicitly. Many TRSs require users to provide some basic information or to register, thereby allowing the collection of user data and information from other related sources. The most common method for presenting recommendations to users is through a spatial web service or Google API. Various approaches to the design of recommender systems exist.
The design of a recommendation system can utilize either a personalization technique or continue with a non-personalization technique. The degree of personalization significantly impacts the quality of a recommender system, with systems that offer long-term personalization typically being more effective. Studies in the literature reveal that recommendation systems predominantly employ three types of filtering methods: content-based, collaborative, and hybrid approaches [
5]. Collaborative filtering, a widely used method, is further categorized into model-based and memory-based filtering. This method recommends products and items by leveraging a popularity index, which is determined by users who share similar attributes with the prospective buyer. However, this approach faces challenges with new products or users due to the cold start problem. Collaborative filtering includes model-based and memory-based techniques. Model-based filtering employs statistical, data mining, artificial intelligence, and machine-learning approaches to construct models. In contrast, memory-based filtering uses heuristic algorithms to compare a user’s historical data against other data in the database [
5,
6,
7]. Research on Tourism Recommender Systems (TRSs) has explored clustering, association mining, Bayesian networks, and deep learning [
8,
9,
10,
11]. Studies have also investigated demand forecasting through hierarchical pattern recognition and forecasting tourism demands using Support Vector Machines (SVMs) and backpropagation neural networks [
12,
13]. Other notable works include developing a Tourist Recommender System using feature extraction and proposing a framework for tourism learning based on recommender systems [
14,
15]. A summary of additional related works in TRSs is presented in
Table 1.
The literature on recommender systems in the Nepalese context are limited. There are notably two authors [
25,
26,
27,
28,
29,
30] who have worked on the study of Tourist Recommender Systems for Nepalese tourism industries. In their papers [
25,
26,
27,
28,
29,
30], the author studied different aspects related to tweets and POI and the generation and distribution of geotagged tweets in Nepal, while [
27] used volunteered geographic information and night-time light remote sensing data to identify tourism areas of interest [
28]. The other author [
29] worked on the design of religious tourist recommender systems and conducted a preliminary analysis on the design of a Tourist Recommender System for Nepal [
30].
The latest studies, published in the journal
State of the Art in Recommendation and Mobile Systems for Tourism, provide an insight into the developments. The personalized tourism recommender systems have made significant strides by integrating advanced technologies to enhance the traveler’s experience. Key areas of development include mobile tourist guides, context-aware systems that take into account the user’s current situation, and group recommenders that cater to collective preferences [
31]. One noteworthy advancement is the utilization of matrix factorization techniques, such as Non-negative Matrix Factorization (NMF), Singular Value Decomposition (SVD), and SVD++, which have proven effective in predicting user preferences for restaurant recommendations in Riyadh, based on user reviews and ratings. Another innovative approach is the development of a tourist trip design problem that integrates crowd dynamics, leveraging mobile tracking data to minimize perceived crowding and maximize destination value, using a two-stage optimization strategy. This method has been shown to outperform traditional algorithms such as NSGA-II and MOPSO in dynamic, personalized tour route generation, reducing real-time crowding by an average of 7%. These advancements underscore the importance of leveraging complex algorithms and contextual data to improve recommendation quality and personalization in the tourism sector [
32]. Besides these works there are no other works existing in the area of tourism and recommendation systems in the context of Nepal. It can be seen that there have been many different kinds of recommender system developments in the recent past using various techniques and dimensions, but research in the area of model-based filtering using a combination of tourist attributes (planning, behavioral, preferences, and satisfaction), social data, and machine learning is not available. Moreover, in the case of Nepal, there are no TRSs existing in the local context that can explore the tourist products and services more accurately and precisely.
3. Research Questions
How can a data-driven and machine-learning approach be effectively employed to design a personalized tourist recommendation system for Nepal, with a focus on Pokhara City?
What are the key attributes of tourists, including demographics, behaviors, preferences, and satisfaction, that contribute to the development of sub-models for data collection and machine learning in the personalized tourist recommendation system?
How do the intermediate categorical recommendations generated by the machine-learning models contribute to the subsequent personalized recommender algorithm, and how are six specific factors computed with assigned weights to provide precise recommendations to individual tourists?
How can the insights gained from this study’s unique approach to designing a personalized tourist recommendation system be generalized or adapted for other tourist destinations beyond Nepal, and what lessons can be learned for similar applications in different contexts?
4. Conceptual Architecture
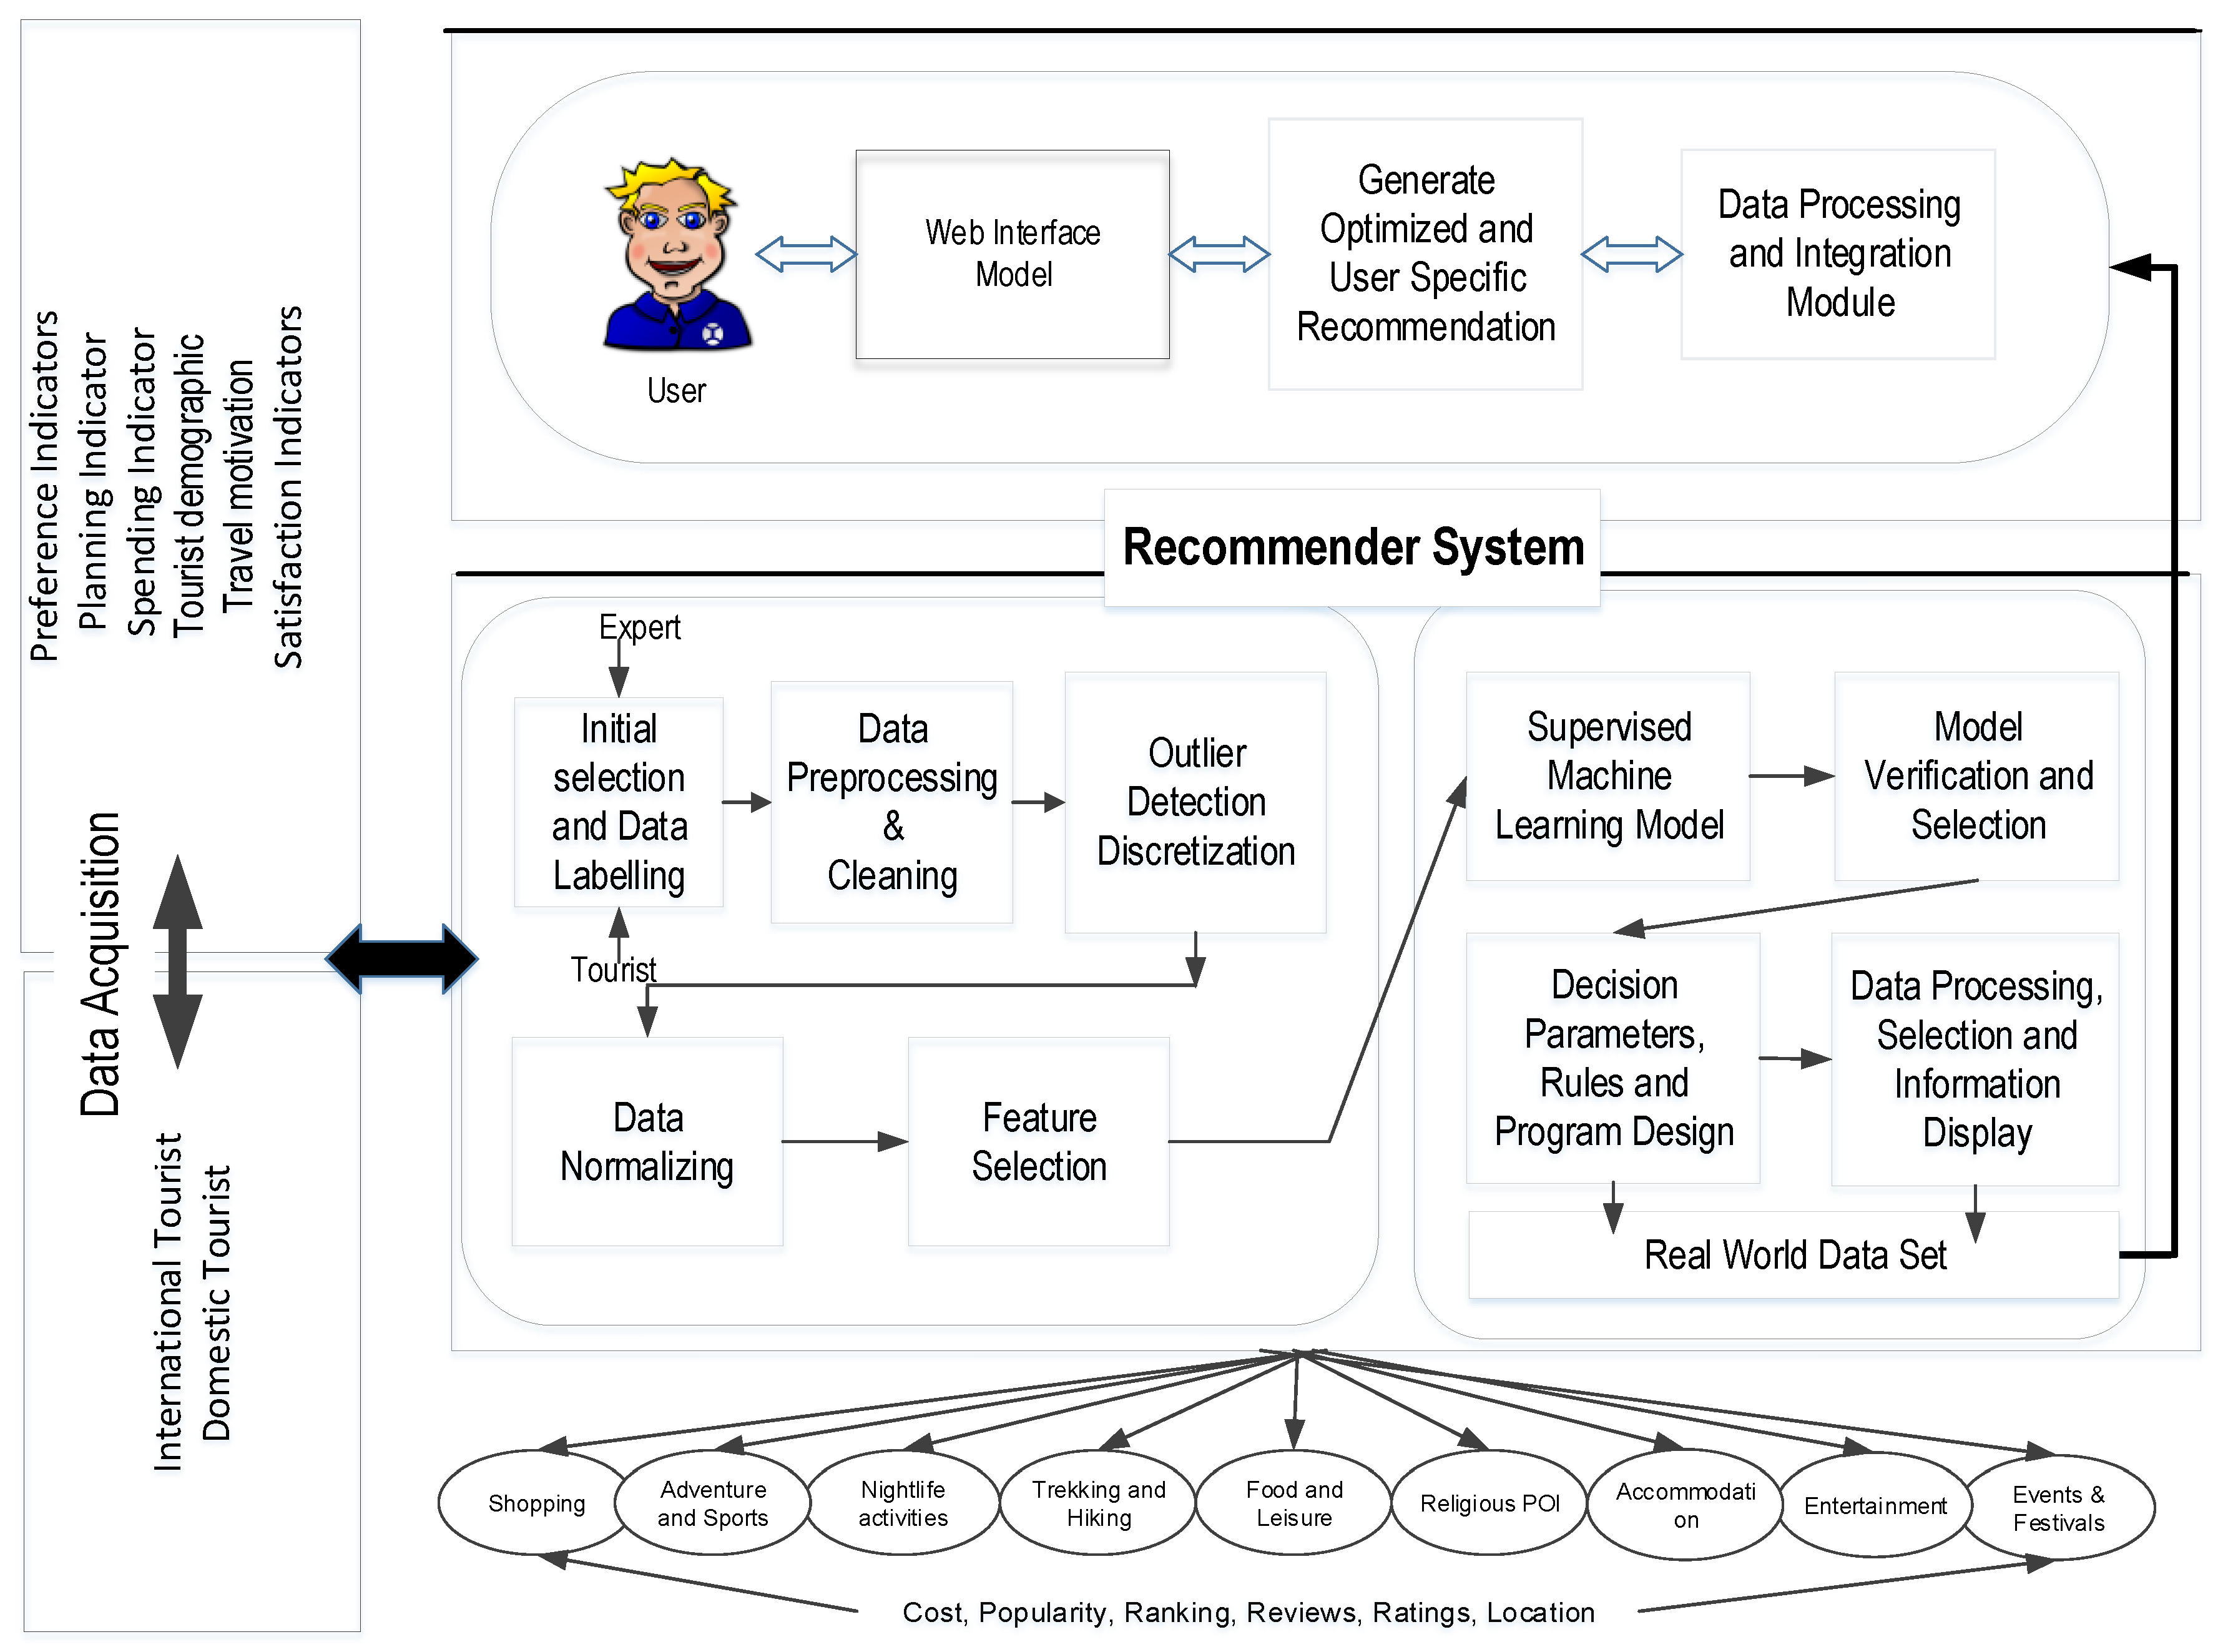
In order to design and develop a Tourist Recommender System for Nepal, the city of Pokhara has been selected as the study area, and a questionnaire has been designed for the city, taking into consideration the tourist attributes. The system calculates intermediate results based on demographic inputs and other data about a tourist. For instance, a tourist, based on their demographics and considering tourist traits, can be recommended a hotel for accommodation, air sports for sports activities, or religious Points of Interest (POI) according to their interests. These recommendations are provided by the system based on selected features and machine-learning models. A central question that still requires introspection is how to provide a specific hotel from the database that closely matches the user’s personal requirements. Research on tourism has indicated that online users generally consider popularity, ratings, rankings, trends, costs, and reviews before making their final decisions. To ensure a high degree of relevance and accuracy, these parameters are considered with a corresponding weight assigned to each, to ultimately calculate a score for each product or service. The weight is determined based on the tourist data and their preferences and decides the final recommendation. The complete detailed architecture of the model is illustrated in
Figure 2. The model collects data from both international and domestic tourists, using tourist traits such as preference, motivation, selection, spending behavior, and satisfaction, along with demographics. These data are preprocessed and fed to machine-learning models for classification and prediction. Users interact with the system through a web interface module that allows them to edit their preferences and choices at a tourism destination.
5. Model Design and Approach
The design and development of the model for selecting a particular machine-learning approach and training it for predictions is a challenging task. This work employs the data of 2400 tourist and considers seven supervised machine-learning models to find the best model for each sub-model and intermediate recommendations.
5.1. Problem Domain
For a Tourist Recommender System (TRS) to be successfully implemented, analysis and design are critical components. To increase the accuracy of suggestions, existing techniques have focused on data collection, tools, algorithms, and personalization. However, there has been limited research on examining individual visitor characteristics for destination needs. A robust TRS must include attributes such as demographics, destination-planning traits, behavior, spending tendencies, preferences, and satisfaction metrics. The accuracy of recommendations can be enhanced by incorporating these characteristics into data collection and developing a base model. Additionally, using this data to train algorithms will result in more relevant outcomes, optimal user inputs, and a better understanding of visitor demands. In Nepal, the information currently available to travelers is fragmented, dispersed, and lacks a well-researched approach. The information does not consider any uniform criteria. Real-world characteristics such as ratings, locations, popularity, rankings, costs, and trends are necessary to provide thorough and accurate suggestions. This work addresses these fundamental issues and improves the accuracy and specificity of recommendations through the proposed approach.
5.2. Data Collection
Data collection is crucial for analyzing and designing effective models, especially in the tourism industry. Poor data collection can negatively impact system development and lead to system failure. To ensure accurate data collection, a questionnaire was developed to cover research questions and issues related to tourists visiting Nepal. The study used various studies and established surveys to develop the questionnaire. The questionnaire from the other sources was modified to include satisfaction and adjust variables to suit the current study and Nepal’s tourism scenario, making it a standard data collection tool.
5.2.1. Pokhara City Tourism Dataset
The Pokhara City Tourism dataset was used as a base database to make recommendations. The database was built using information from various sources, including the Nepal Tourism Board, Trip Advisor, Google search, and travel websites. The data collection method used APIs such as Maxcopell, Google API, and self-coded modules to collect reviews, destination details, and addresses. The collected data were used to create a standard database for a recommender system, as shown in
Table 2 and
Table 3. TripAdvisor and the Nepal Tourism Board were the most popular source for obtaining the base data. The data included 150 hotels, 60 restaurants, and 58 destinations and activities. The final samples of the dataset are shown in
Table 2,
Table 3 and
Table 4.
5.2.2. Survey Dataset
A survey of 2400 tourists was conducted to collect the data of tourist attributes. The dataset included demographics, preferences, spending behavior, motivation, and satisfaction factors. The survey was conducted in person, online, and through groups and communities. The data were pre-processed, cleaned, and fine-tuned for using in machine-learning algorithms. The data were collected from October 2020 to February 2021.
5.2.3. Sampling
Sampling is crucial for data collection, as it allows researchers to represent the opinions and behavior of the entire population without approaching the complete population. In this study, a stratified sampling method was used, dividing the population into smaller groups representing different classes. The repeated holdout method [
33] was employed for iterative representation and random partitioning of the dataset without fixed formulae. The study utilized a questionnaire with four major sections: tourist planning assessment, tourist behavior and spending nature, tourist preferences at a tourism destination, and tourist satisfaction quotient. The questionnaire covered seven demographic attributes, including country, gender, age, education, profession, income, and marital status. It had 28 major questions with 125 variables, covering overall tourist attributes at a destination. The satisfaction quotient included two categories with 38 variables, identifying personal and destination satisfaction needs. The tourist planning assessment assessed information collection, trip planning, planning factors, frequency, stay, and company. The spending habit category included average spending, daily needs, payment traits, personality, interests, and the factors responsible for choosing a tourism activity. The choice and motivations category included visiting motives, choices in tourism destinations, products and activity choices, activity involvement, and motivations. The personal needs and destination needs section included personal needs and destination needs.
5.2.4. Experimental Design and Approach
The data were labeled for supervised machine learning, and different machine-learning algorithms were employed for training and prediction. Seven machine-learning algorithms were used to classify and predict data for the four sub-models. The model was split in a 70:30 ratio, with 70% of the data for training and 30% for testing. The data were executed for 100 cycles, and a final reading was obtained.
5.2.5. Data Pre-Processing
Real-world data often has inconsistencies, noise, incompleteness, and missing values. These issues can arise from the respondent’s side, such as providing incomplete information or unrealistic estimates. Data errors can also occur during conversion, data entry, and merging from various formats and sources. High-quality data are essential for machine-learning and data-mining systems [
34] for training and prediction purposes. This study pre-processed the data using techniques such as data integration, cleaning, reduction, and transformation. Data with no significant contribution were dropped, while personal information, vague values, and mismatches were removed. Imputation methods were applied to missing data accidentally or randomly. Algorithm 1 was used to remove outliers in the dataset, using the Interquartile Range (IQR) method to detect and remove outliers for numerical variables. It first identifies the first quartile (Q1), third quartile (Q3), and the IQR for each numerical variable. It then sets the lower and upper bounds for outliers based on the IQR and removes any observations that fall outside these bounds. The program then finds the mode of the variable and removes any observations not in the mode, returning the dataset with outliers removed.
| Algorithm 1. Outlier detection algorithm. |
def outlier_detection(dataset):
for column in dataset.columns:
if dataset[column].dtype == 'object':
mode = dataset[column].mode().iloc[0]
dataset = dataset[dataset[column] == mode]
else:
Q1 = dataset[column].quartile(0.25)
Q3 = dataset[column].quartile(0.75)
IQR = Q3 - Q1
lower_bound = Q1 − 1.5 x IQR
upper_bound = Q3 + 1.5 x IQR
dataset = dataset[(dataset[column] >= lower_bound) & (dataset[column] <= upper_bound)]
return dataset |
5.2.6. Statistical Tests and Data Normalization
The internal consistency was checked using Cronbach’s alpha, where the threshold value of Cronbach’s alpha (α) was obtained as 0.7, which confirmed the internal consistency and reliability of the constructs. The statistical analysis of demographic data depicts the standard deviation value to be less than one for the tourist type, gender, and age group and is seen to be greater than 1 for marital status, monthly income, academic qualification, and profession, as shown in
Table 5.
Data normalization is carried out using discretization (1). This is an important aspect of programming and algorithm testing as most of them do not perform well for continuous variables and need to be converted into discrete variables. Discretization is achieved through simple binning and can be obtained by dividing the range into N intervals of equal size. Let us assume that X and Y are the minimum and maximum values of a variable; the width (W) is then obtained as:
The information gain is used for feature selection and shows the importance of a given attribute of a feature vector. It uses information entropy as the impurity function. It can be calculated mathematically as the probability distribution
P = (
p1,
p2, …,
pn), where
pi is the probability that a point is in the subset
Di of a dataset,
D; the
Entropy,
H, can be calculated as shown in Equations (2)–(6).
Taking
Entropy as function
ϕ, the equation for information gain is:
InformationGainY (
Xi,
D): hence,
In order to normalize information gain on an attribute,
Gain Ratio is a related splitting criteria proposed by Quinlan, and it can be formulated as:
Similarly,
Gini Index is another function that can be used as an impurity function and helps to measure the dispersion in a population. The calculations are shown in
Table 6 and are calculated as:
6. Recommender System Model Design and Experiment
The main objective of this section is to select an optimal machine-learning technique that is able to classify and predict data with the maximum accuracy. The work considers seven supervised machine-learning algorithms, kNN, DT, SVM, Neural Network, Random forest, Gradient boost, and Naïve Bayes, for classification and prediction purpose.
Supervised Machine-Learning Models
Decision Tree: Decision trees are hierarchical structures with internal nodes representing features, branches representing decision rules, and leaf nodes representing outcomes or class labels. The splitting of data are based on the three important parameters of Information Gain, Entropy, and Gain, as shown in Equations (8)–(10) below.
Random Forest: Random Forest is an ensemble algorithm that combines multiple decision trees to make predictions by averaging or voting on the predictions of individual trees. The generalized equation for a Random Forest can be computed as shown in Equation (14). If there are T trees in the forest, then the number of votes received by a class, m, is calculated based on Equation (13), where ŷ_(t) is the prediction of the t-the tree on a particular instance. The indicator function I(ŷ_(t)==m) takes on a value of 1 if the condition is met, else it is zero. Given these votes, the final prediction of the algorithm is the class with the most votes. In the regression setting, the prediction of Random Forest is the average of the predictions made by the individual trees. If there are T trees in the forest, each making a prediction ŷ_t, the final prediction is ŷ, as in Equation (14):
Neural Network: Neural Networks are networks of interconnected artificial neurons that learn complex patterns and relationships between inputs and outputs through training. The Neural Network can be represented as (Y), the summation of inputs multiplied with weights and a bias value that is added to the total value, as shown in Equation (15). Inputs in this case are the representation of neurons.
Gradient Boost: Gradient Boost is an ensemble algorithm that combines weak prediction models sequentially, minimizing a loss function by iteratively adding weak models. It uses gradient descent optimization. Equation (17) explains the final output of the algorithm, which is based on the aggregation of the output of the base model with the learning rate and residual model until minimum residual error is achieved.
7. Measurements
7.1. Accuracy, Precision, and Recall
Accuracy measures a model’s predictions by calculating the ratio of correctly predicted instances to the total number of instances. Precision quantifies a model’s ability to identify positive instances, focusing on the true positive rate. Recall measures the model’s ability to correctly identify positive instances, minimizing false negatives. The generalized equations for the measurements are realized as (18), (19), and (20).
7.2. F-Score
F-Score is another measure used in this study and is the test of accuracy and is calculated based on Precision and Recall. F-Score is also known as the F-Measure and is an improvement in accuracy as it takes class discrimination into account. F1 represents the highest value of F-Score and 0 represents the lowest value. It can be calculated as shown in Equation (21).
7.3. ROC and Lift Curve
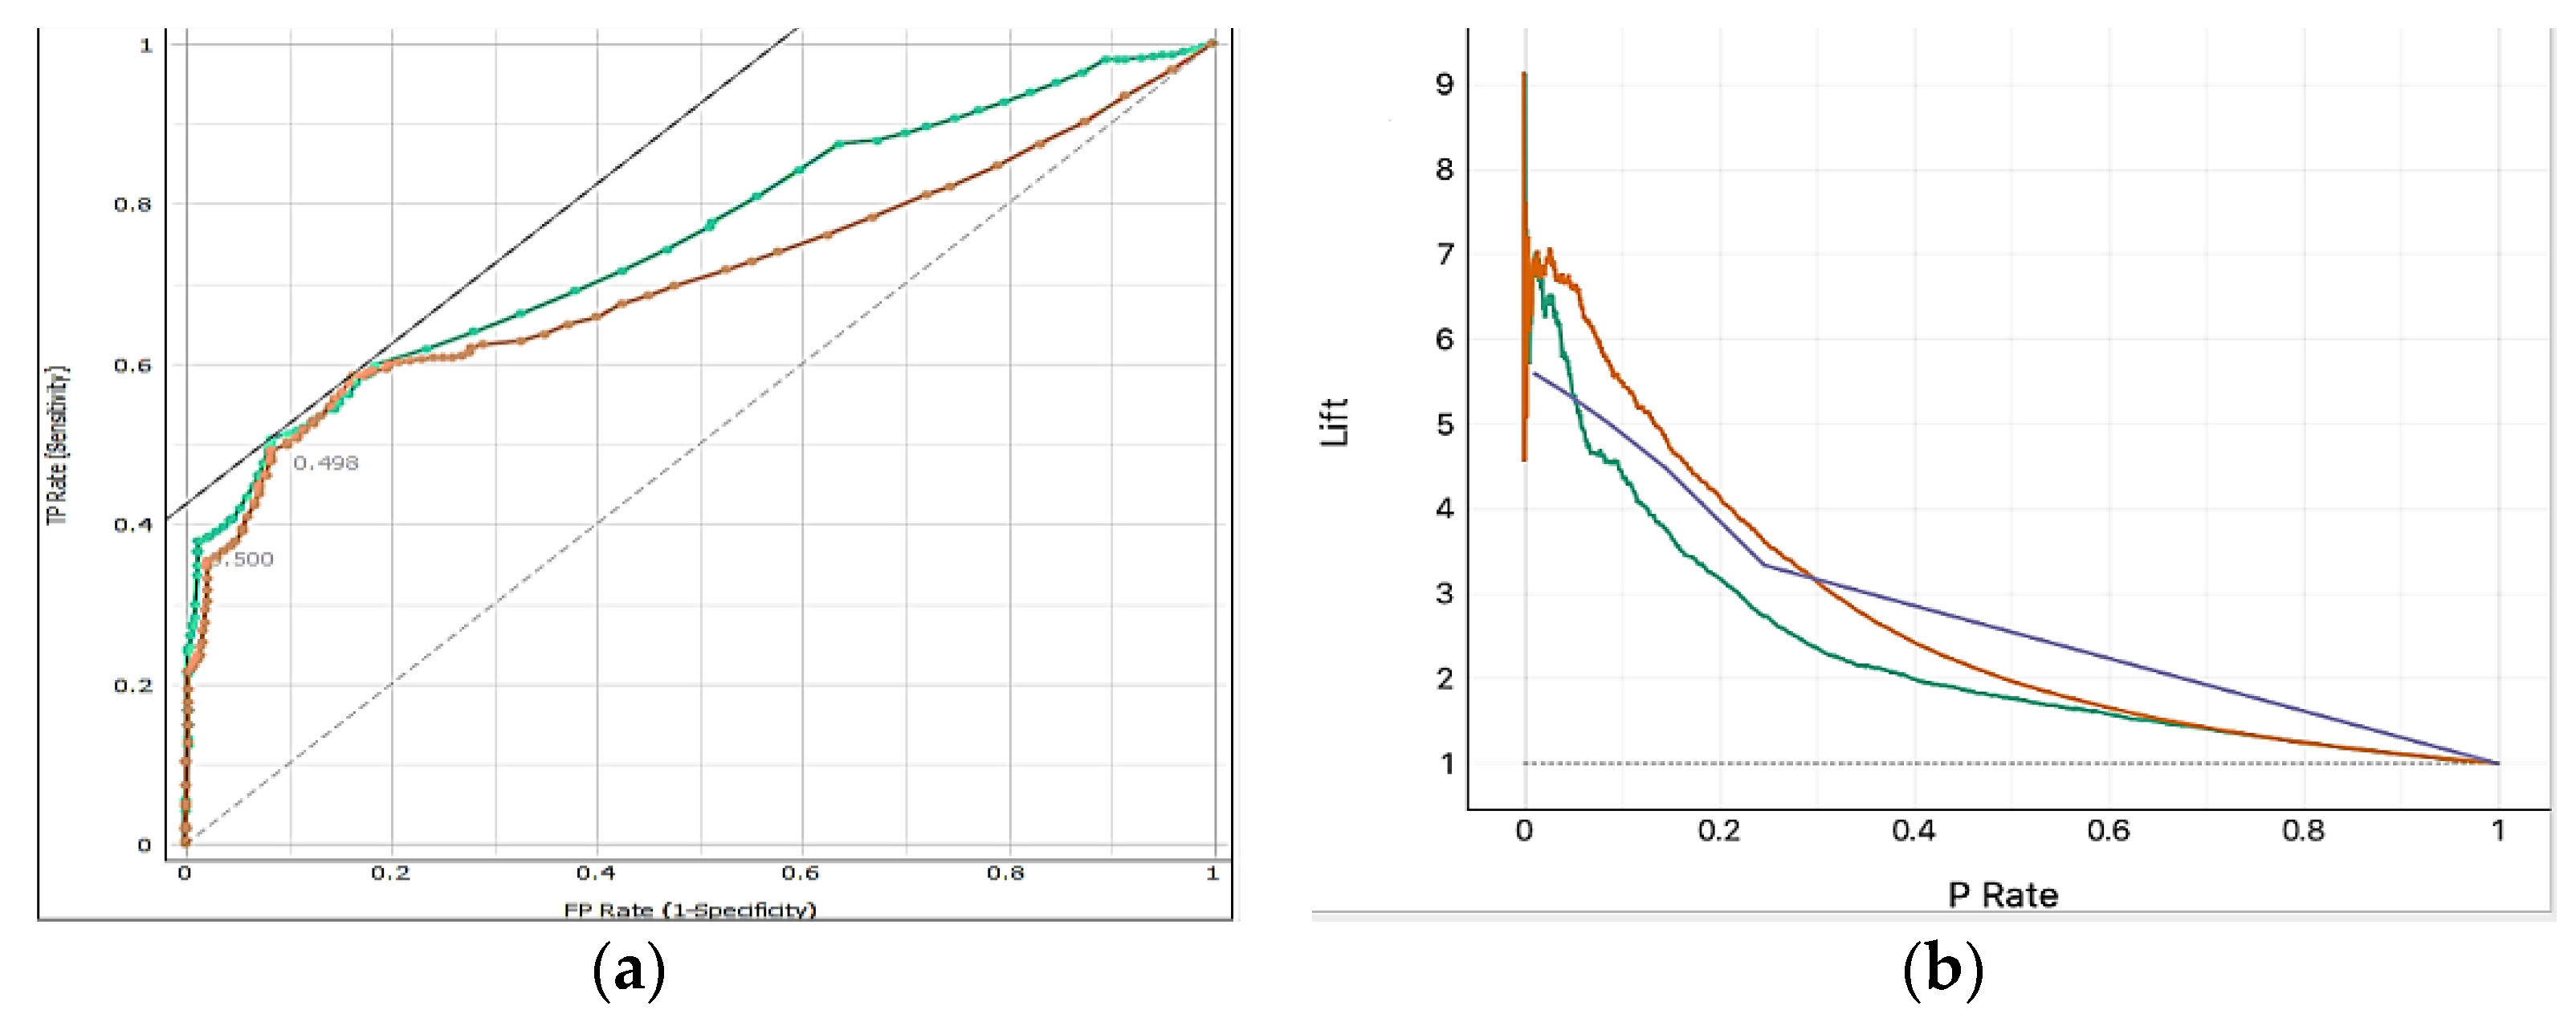
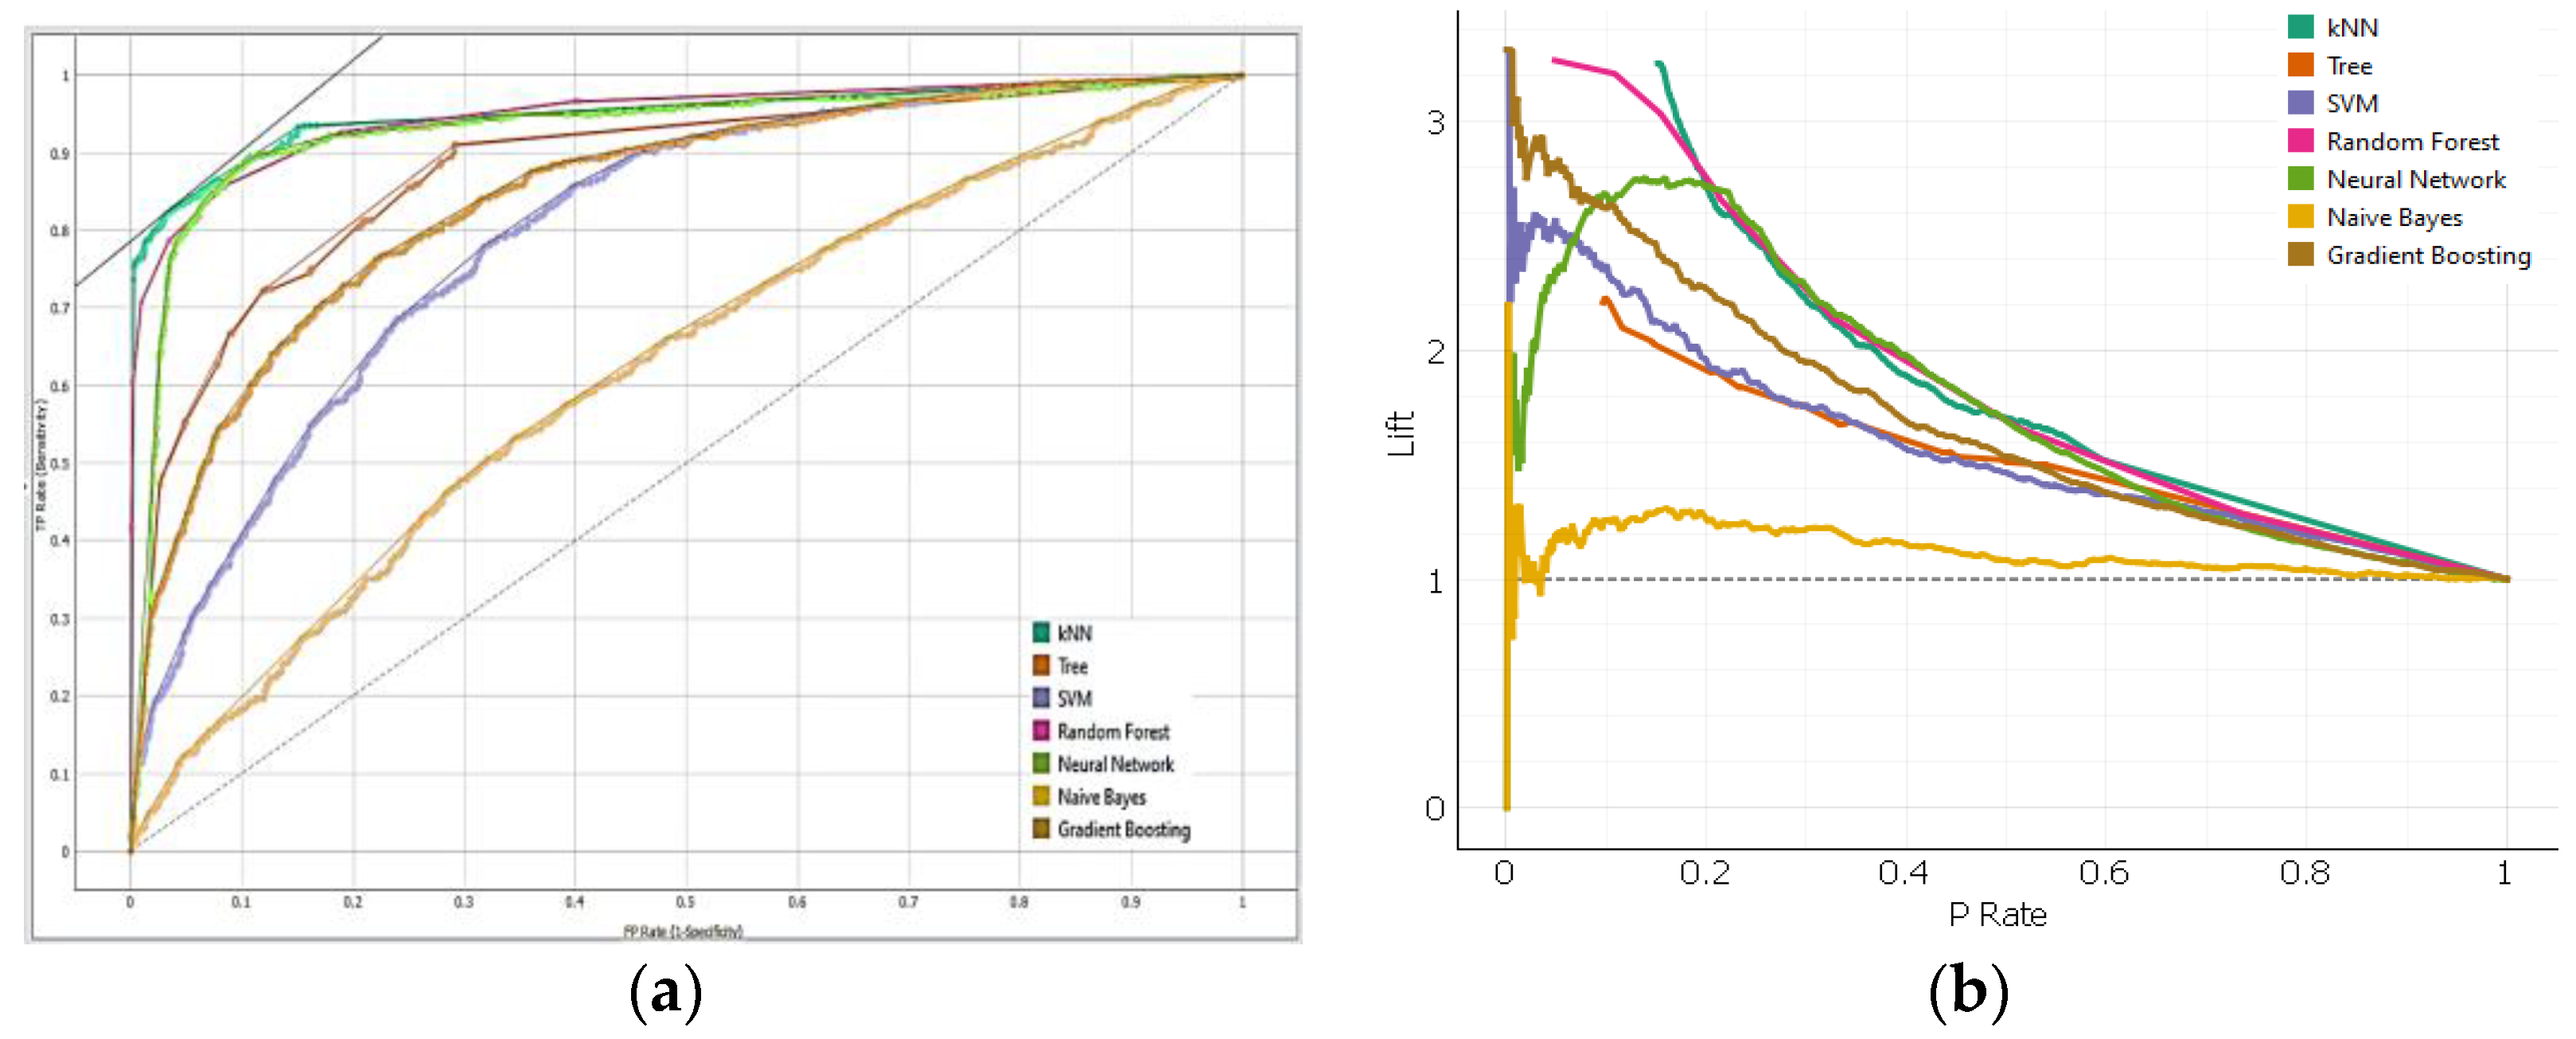
The Receiver Operating Characteristic (ROC) curve is a graphical representation of a binary classification model’s performance, plotting the true positive rate (sensitivity) against the false positive rate (1-specificity) at different classification thresholds. It illustrates the trade-off between true positive and false positive rates, allowing evaluation across different thresholds. A perfect classifier would have a curve that goes straight up to the top-left corner, indicating better performance.
The lift curve is a graphical representation of a binary classification model’s performance, showing the improvement in terms of the true positive rate (sensitivity) to the expected true positive rate as the classification threshold changes. It provides insights into the model’s performance compared to a random or baseline model at different levels of predicted probabilities. Both ROC (
Figure 3a) and lift curve (
Figure 3b) are useful for evaluating and comparing binary classification models, with ROC focusing on the trade-off between true positive and false positive rates and Lift focusing on the improvement over a baseline model.
8. Model Analysis and Performance Evaluation
The evaluation of machine-learning models is crucial for training and prediction purposes. This section evaluates seven different algorithms on a tourist survey dataset, using performance measures such as accuracy, F1-Score, precision, recall, specificity, ROC, and lift curve. The initial setup and performance evaluation of these algorithms are presented.
8.1. Tourist Planning Model
Seven machine-learning algorithms were trained on the survey dataset of tourist features to find the most effective model for planning prediction. To determine the optimal algorithm, results were contrasted using various parameters, and the data were divided into a 70:30 split.
8.1.1. Training Model Evaluation
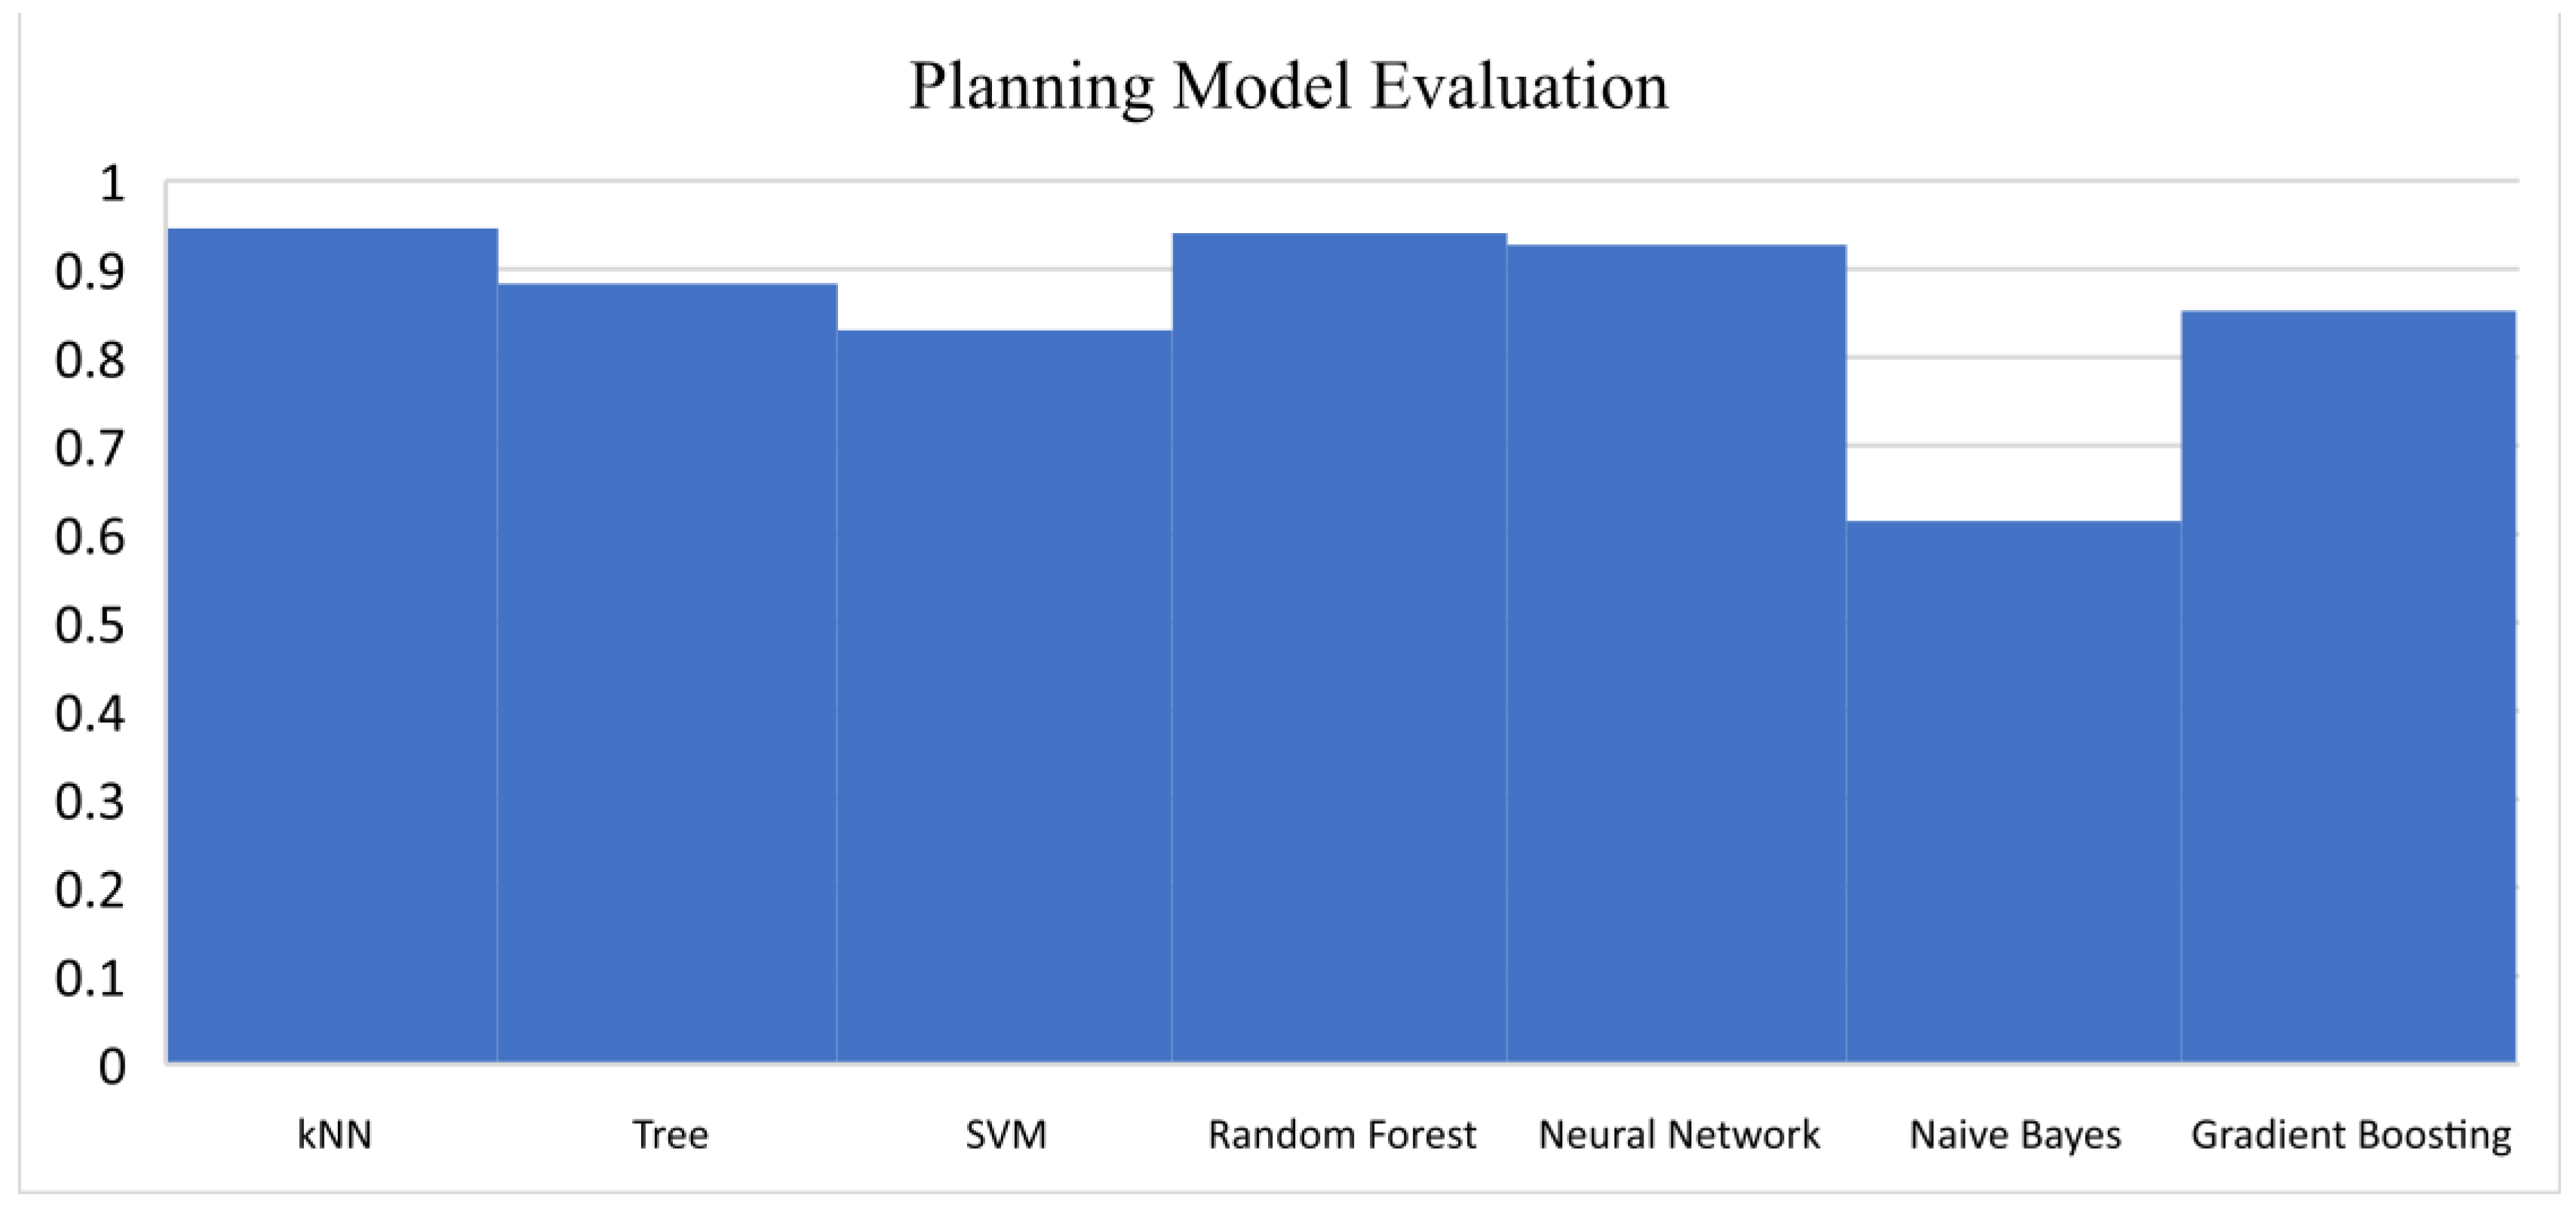
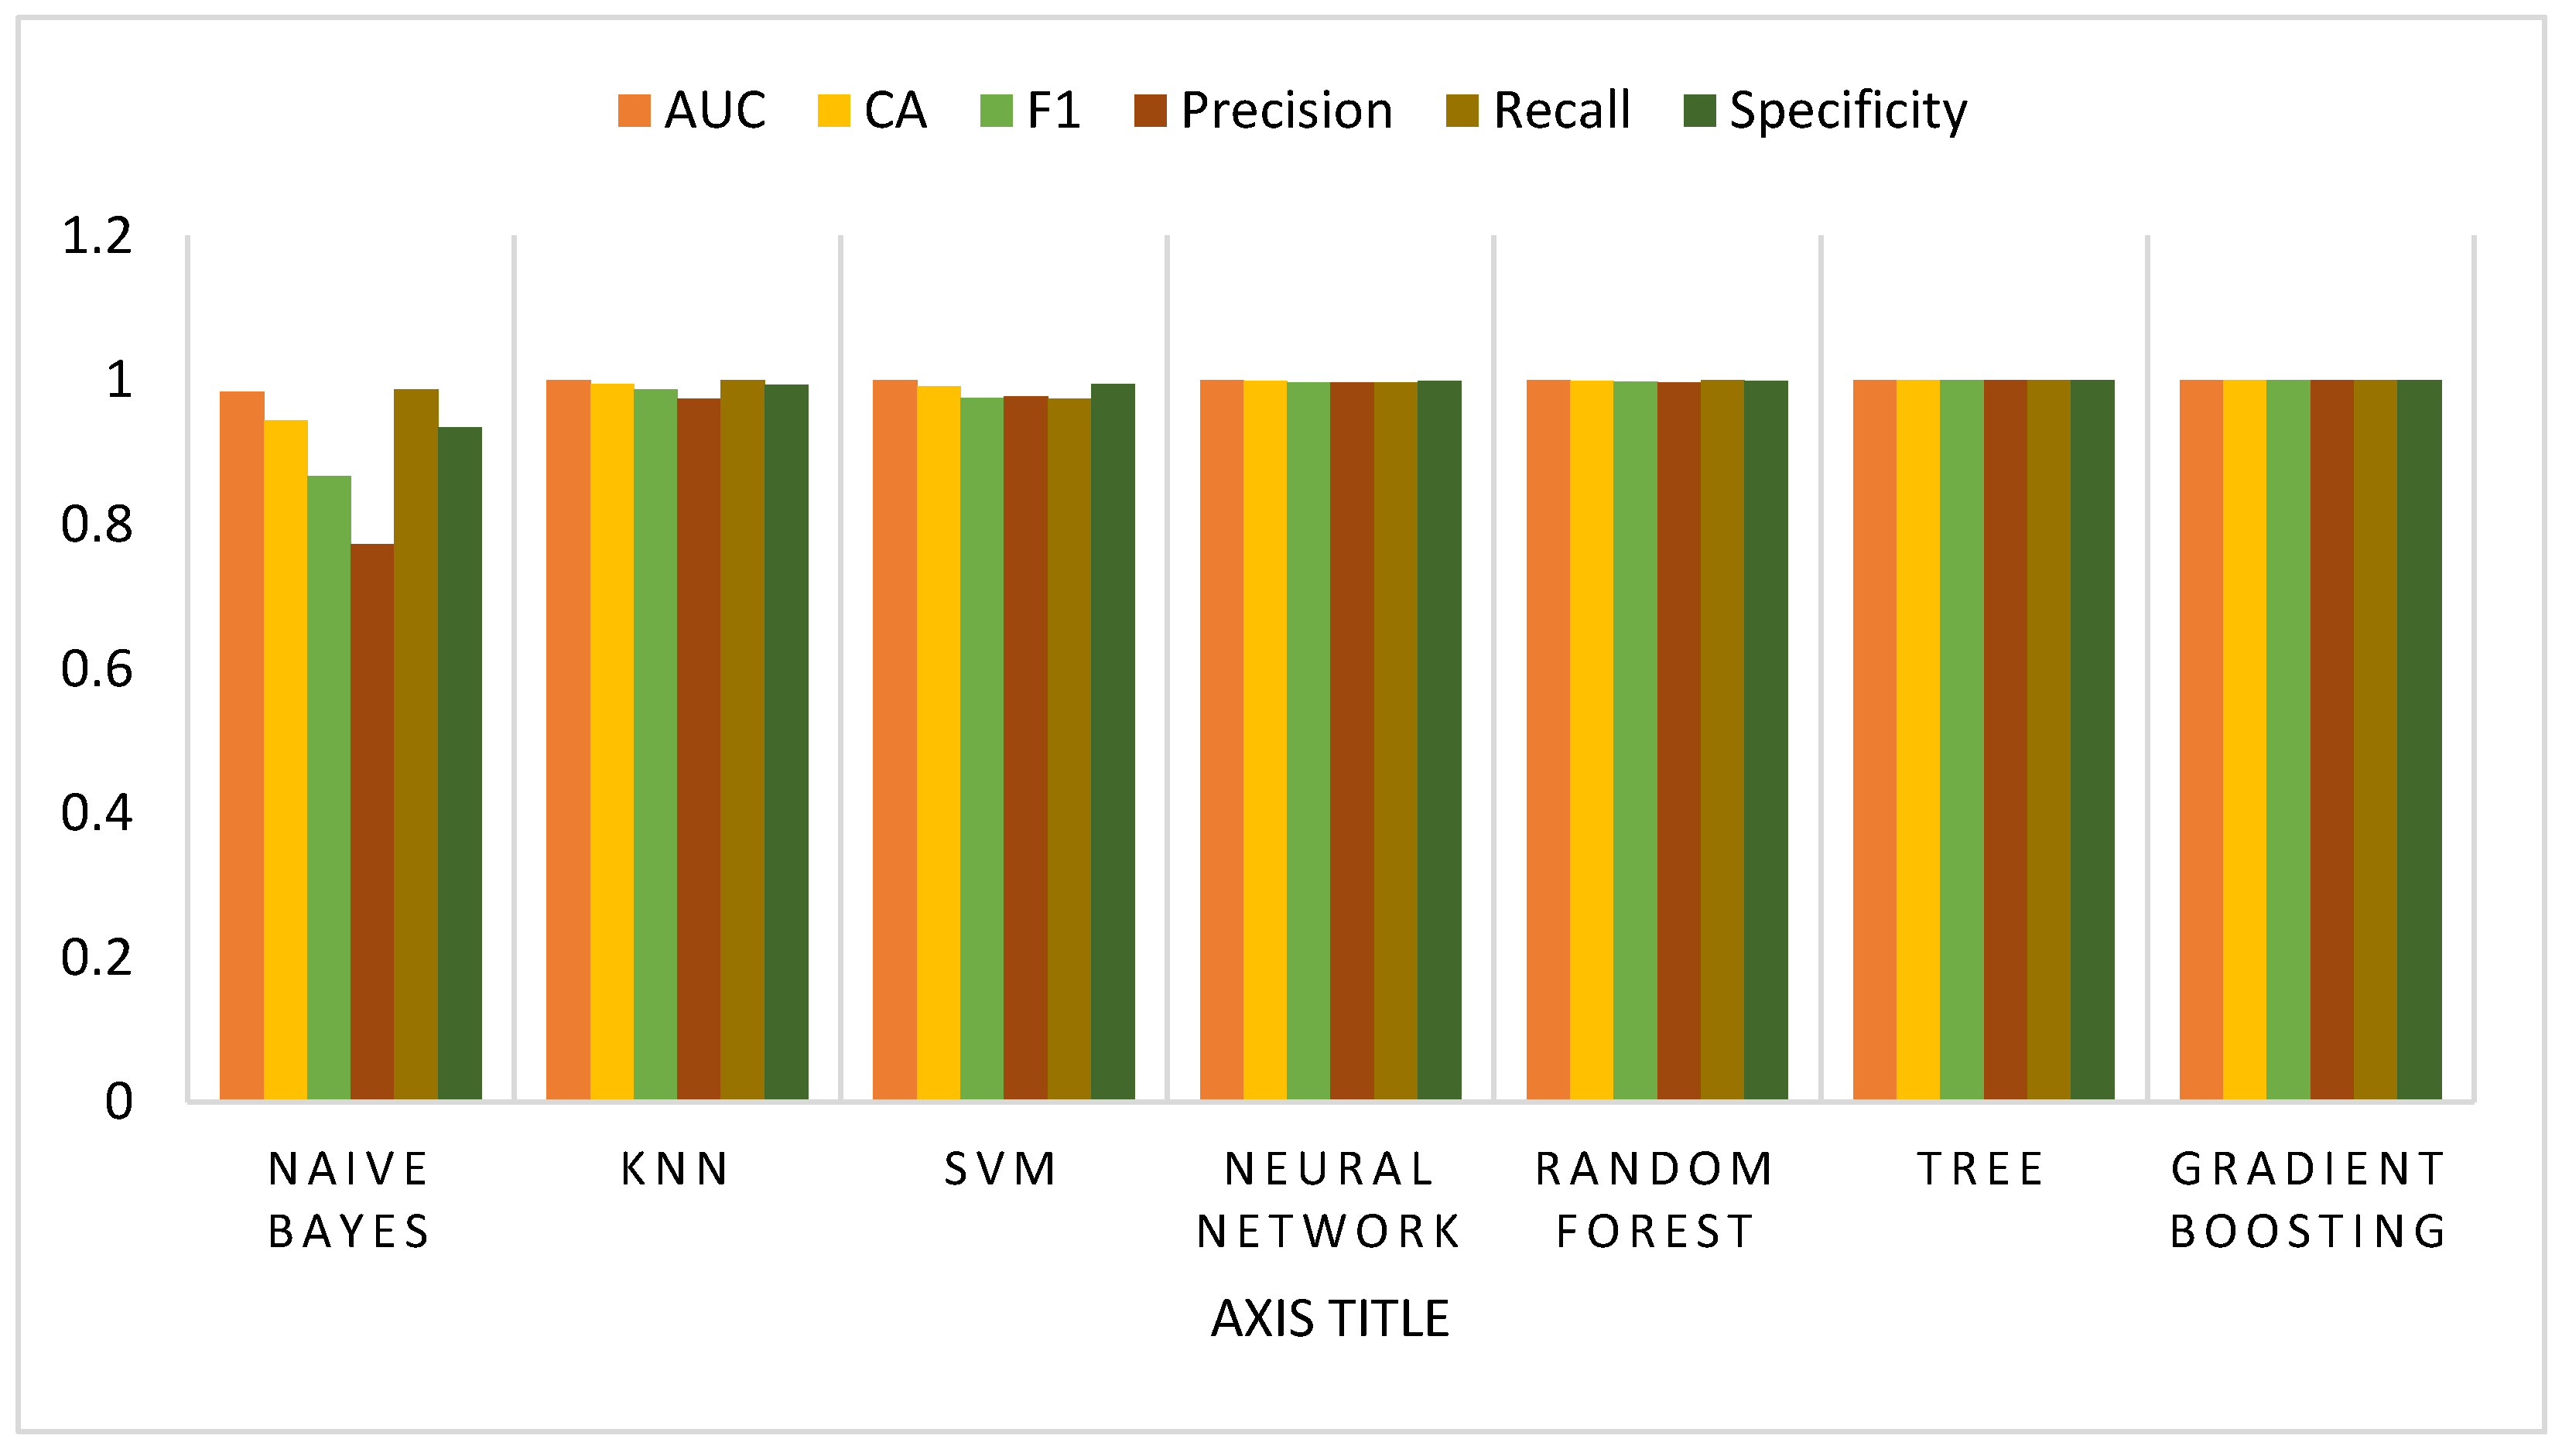
Cross validation of the training model was performed using 10 and 20 cross validation procedures. With Area Under the ROC Curve (AUC), 0.940644; Classification Accuracy (CA), 0.835109; F1, 0.835119; Precision, 0.840328; and Recall, 0.835109, values, Random Forest performed better, with an average accuracy of 94% for the planning model, as shown in
Table 7. Additionally, it did better in terms of price, cost, safety, security, and tourism activities. Although the values for kNN and the Neural Network might seem to be higher than those for the Random Forest technique, some factors worked better, as seen in
Figure 4.
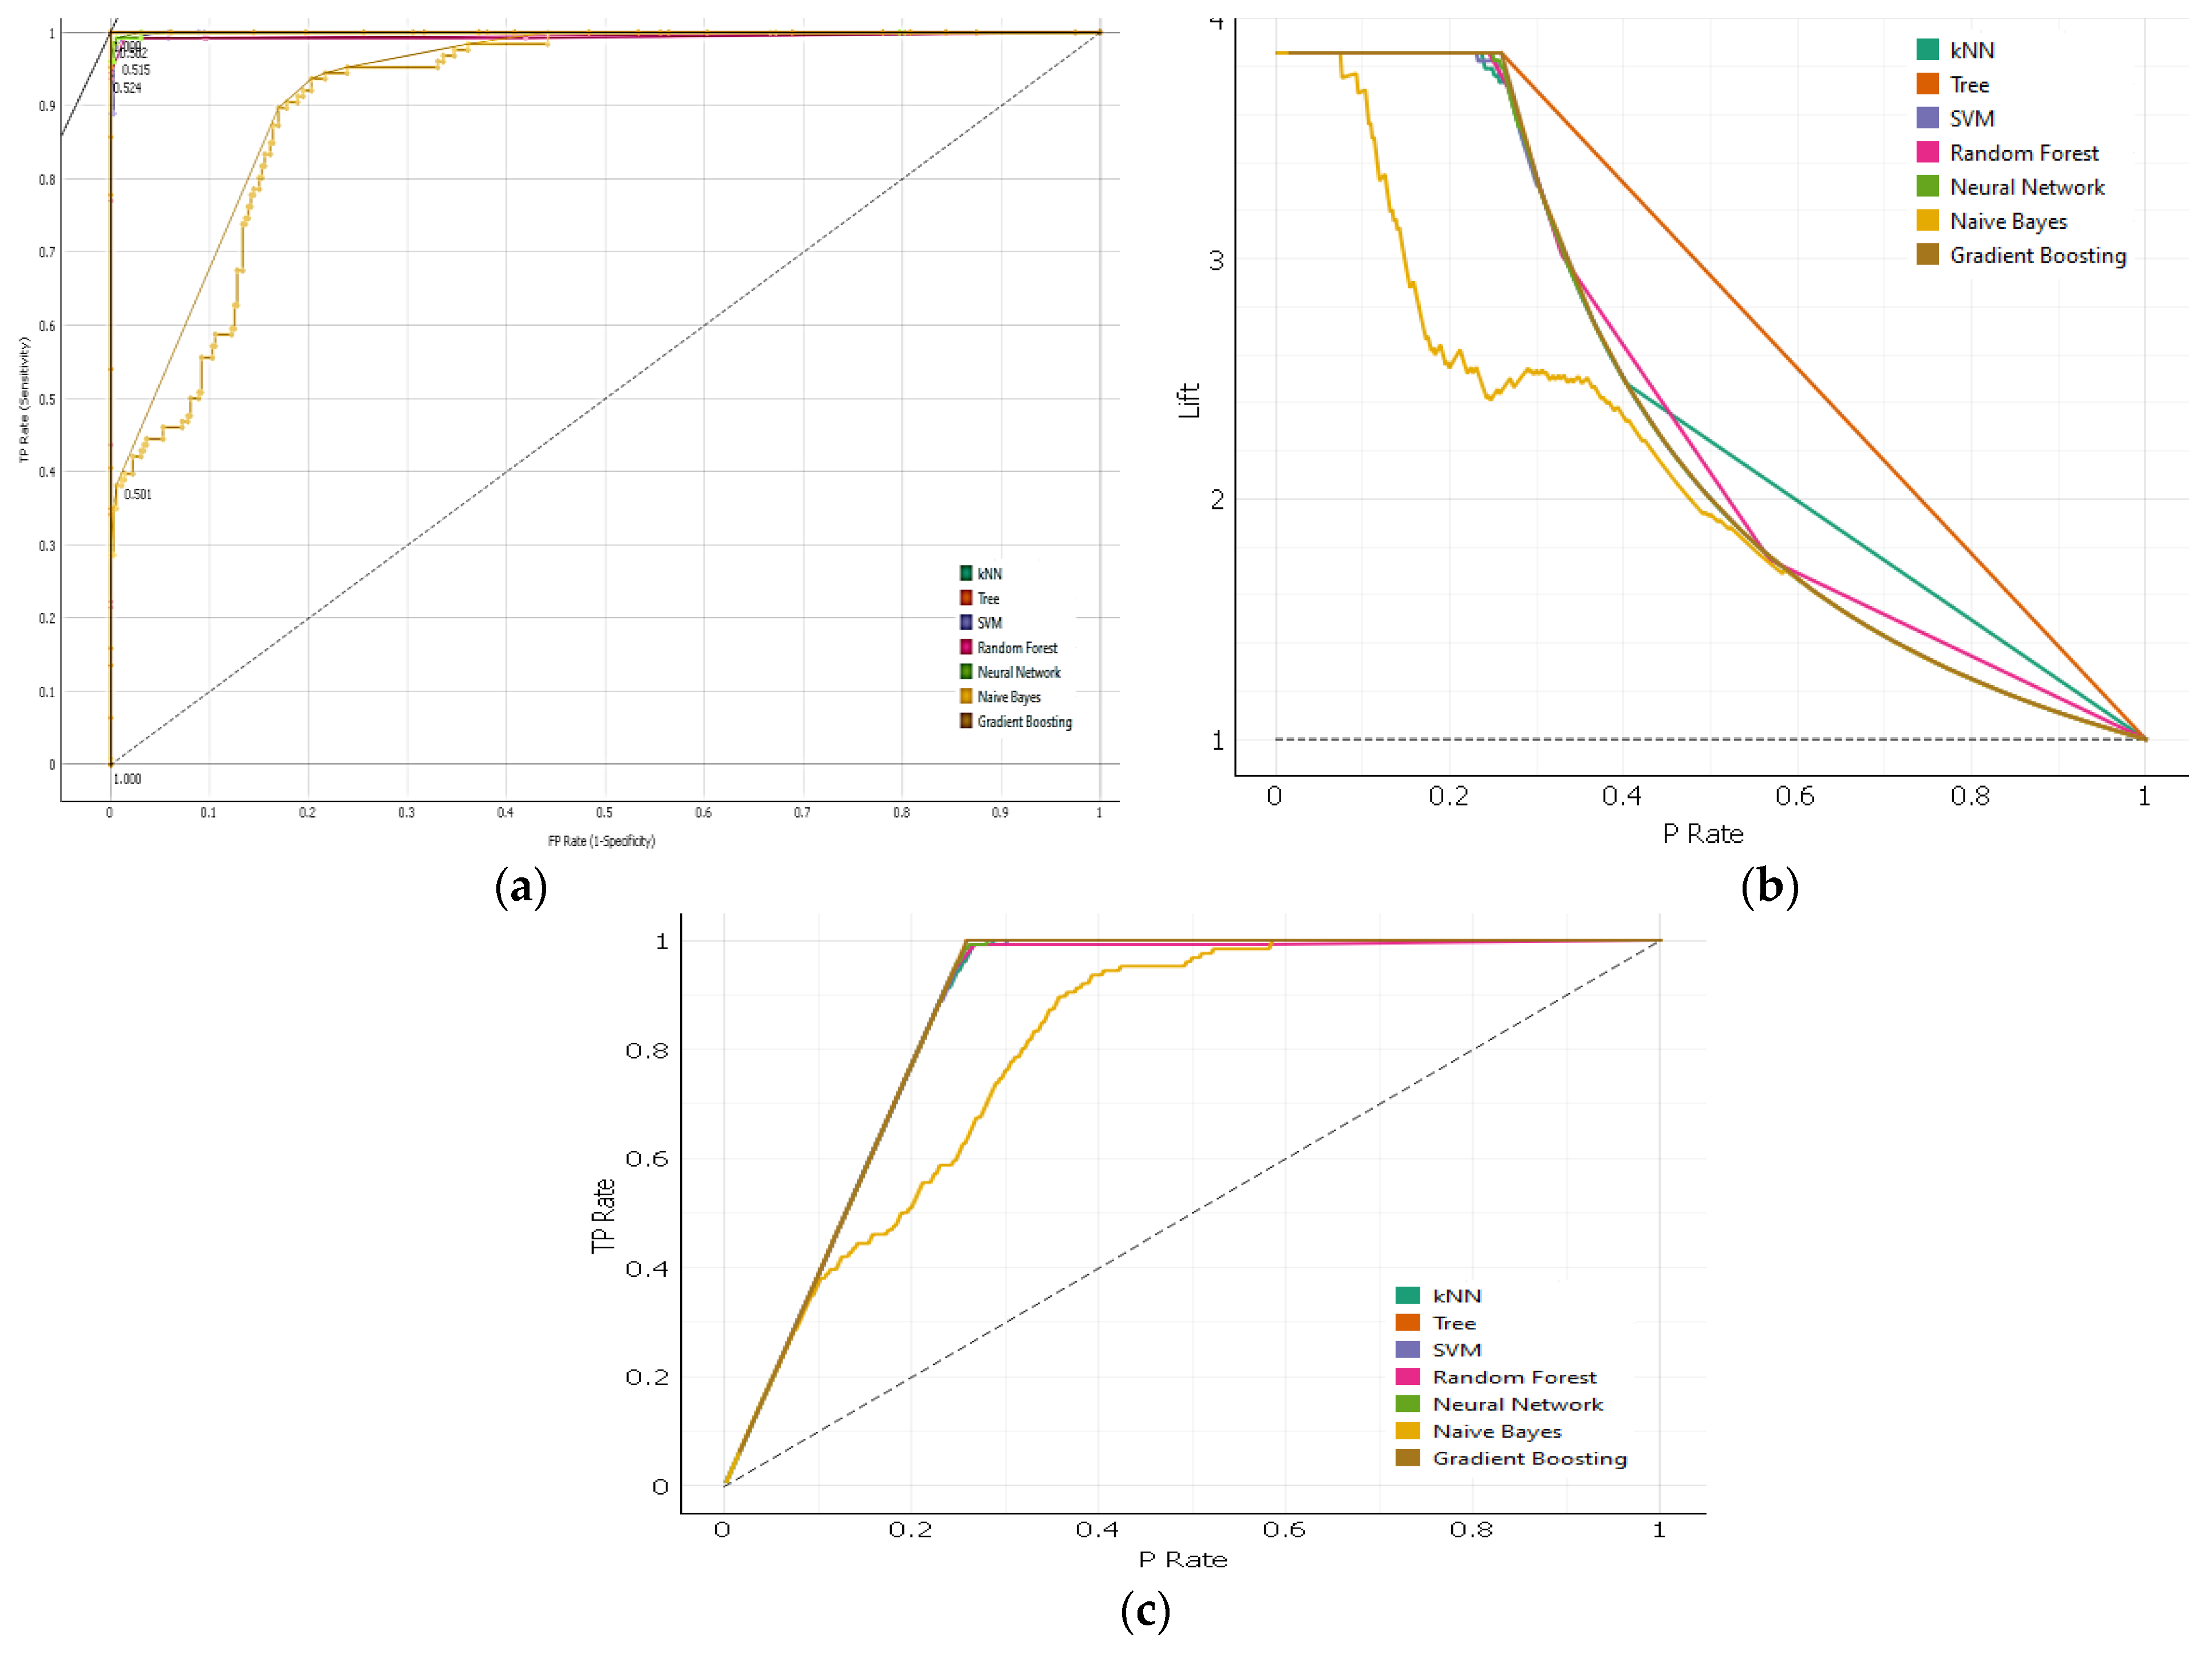
The ROC analysis of the algorithms reveals that Neural Network, kNN, and Random Forest curves are closer to accuracy than the other algorithms, with the Random Forest curve showing better performance with gradual increases in values. The lift curve evaluates the training model, with Random Forest having the best lift curve, with the first 20% of data having 3.5 times more positive instances compared to kNN and Neural Network. The cumulative gain, which represents the percentage of cases gained by targeting a percentage of the total number of cases, shows that Random Forest has a better cumulative gain compared to other closely performing algorithms. Random Forest demonstrated better performance for overall evaluation parameters, making it the most suitable machine-learning algorithm for tourism planning data, as shown in
Figure 5a,b.
8.1.2. Testing the Prediction for Planning Model
The prediction of the planning models was tested with 30% of the remaining data. As shown in
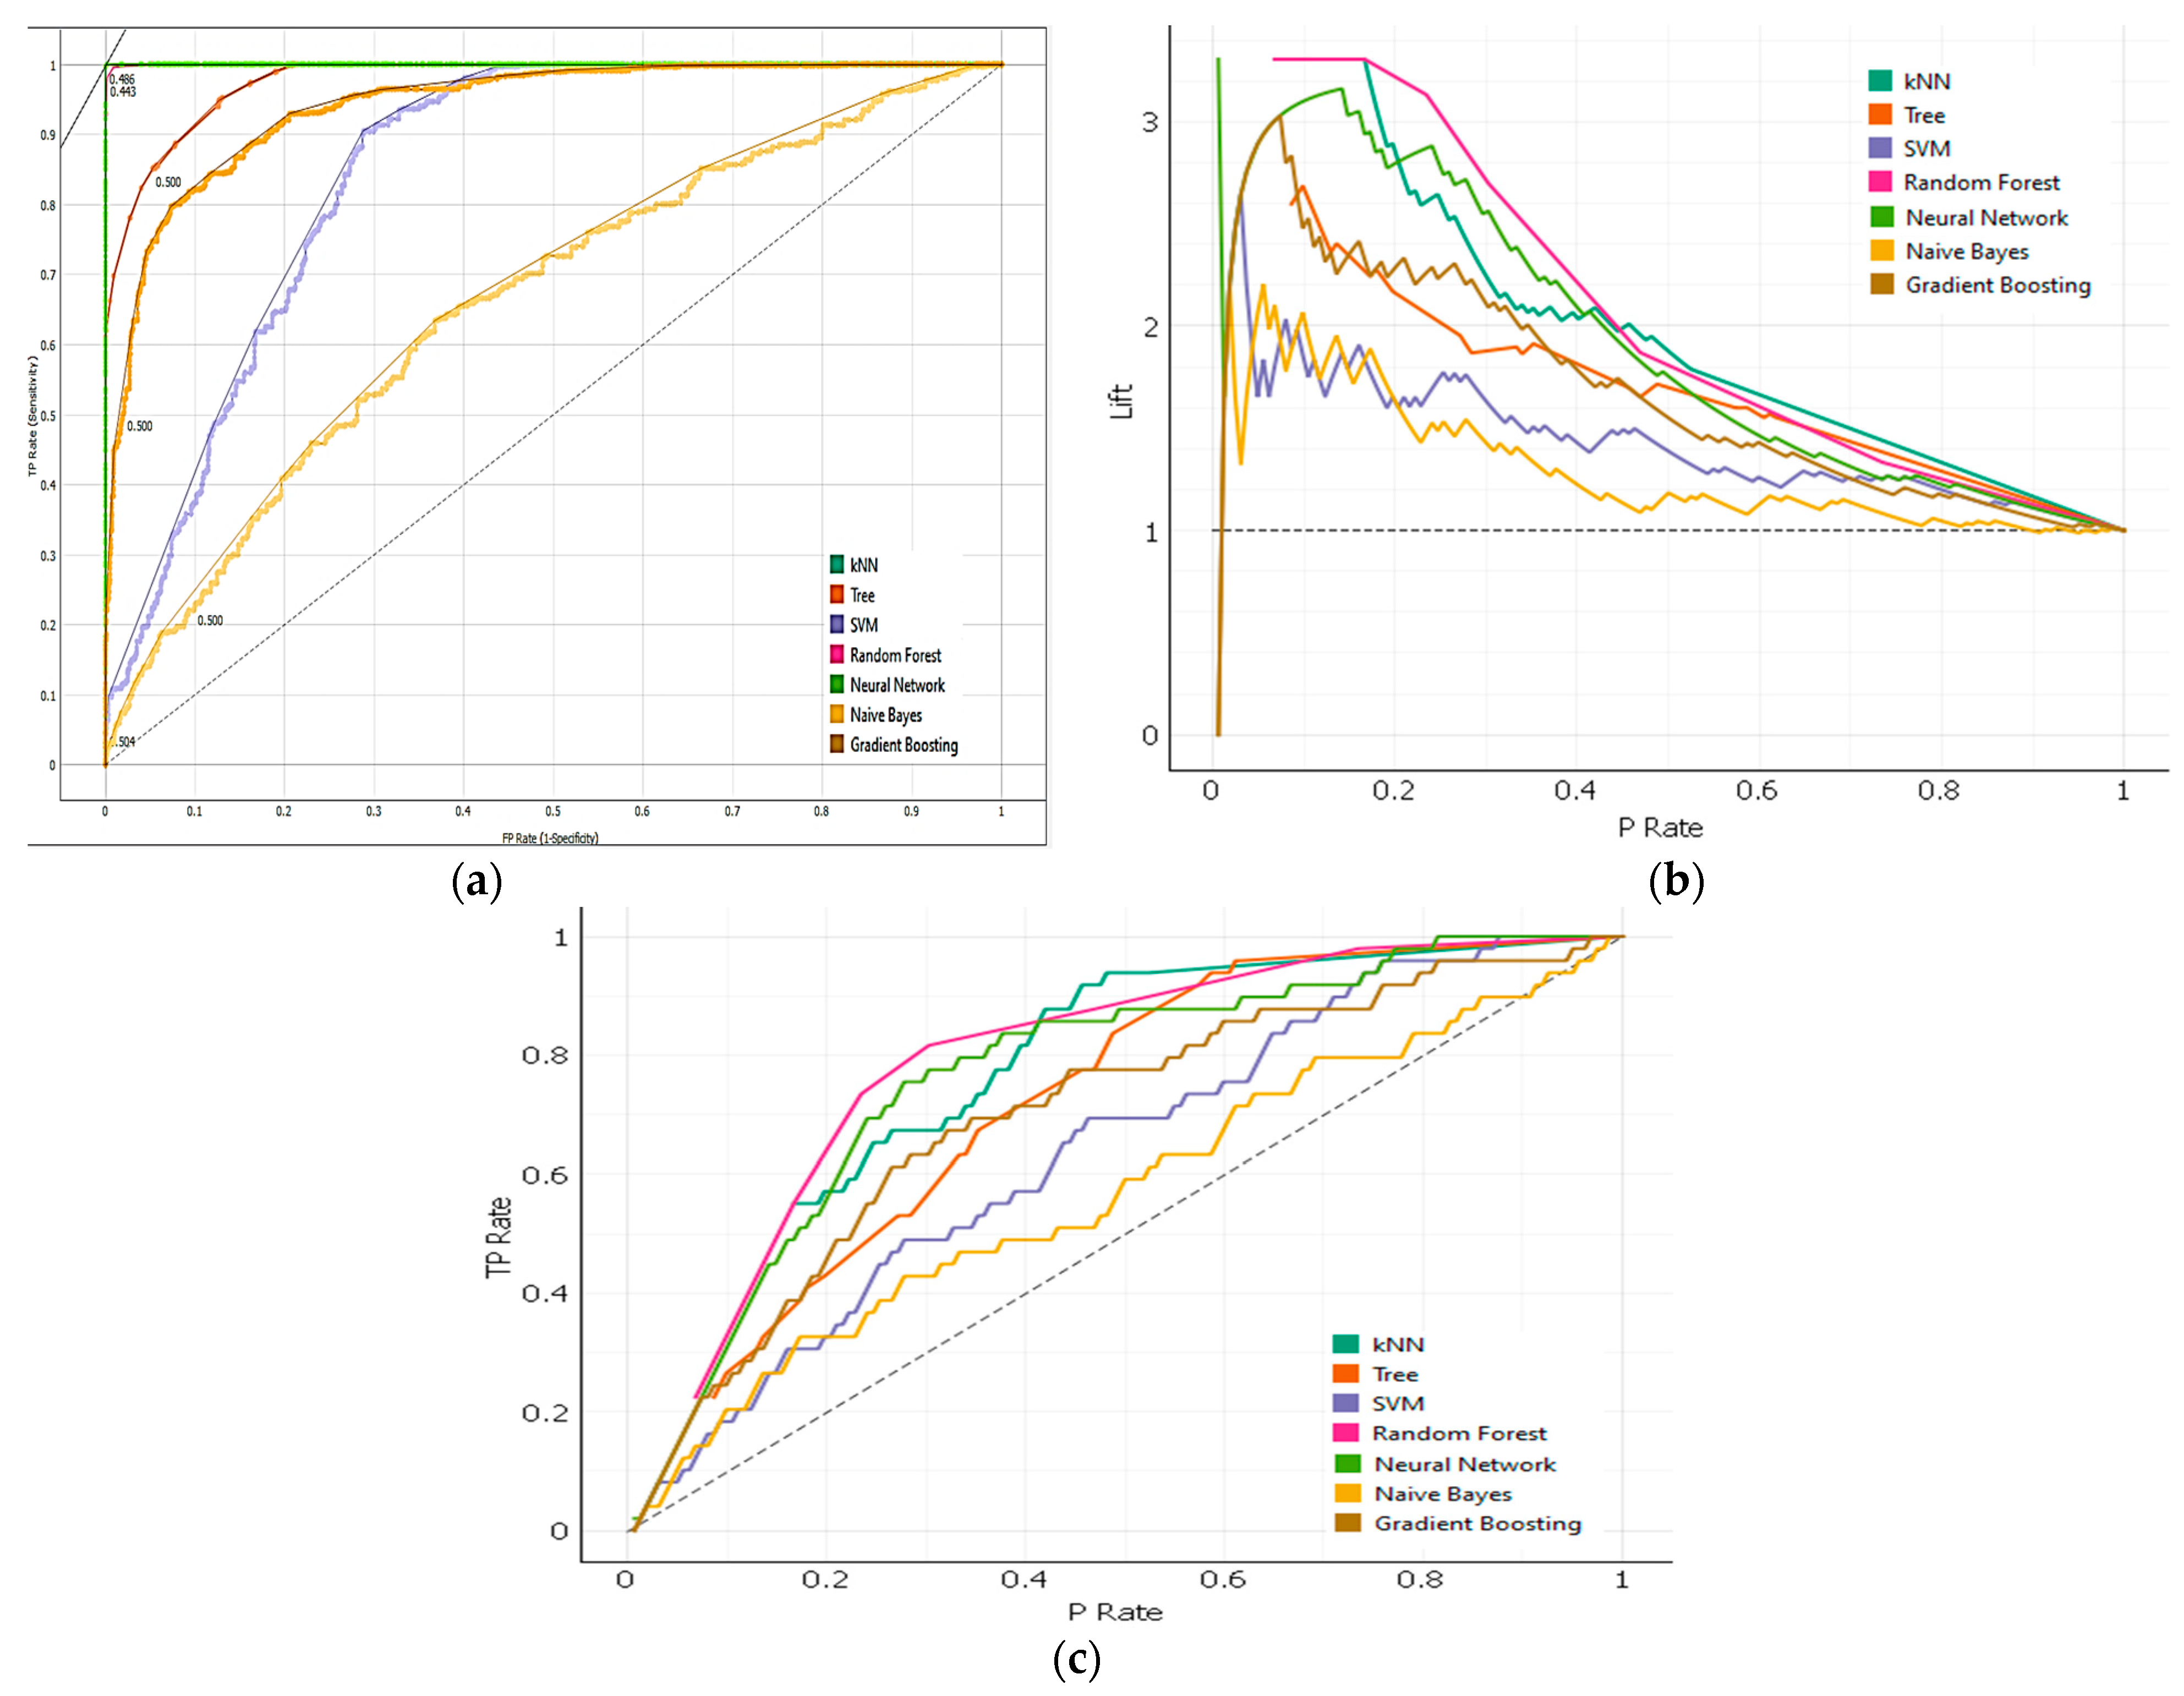
Table 8, the testing results of Random Forest (RF) values with AUC 1.0, CA 0.99, F1 0.99, Precision 0.99, Recall 0.99, and Specificity 1.0 gave the best results. According to the test findings, four models—Random Forest, Gradient Boost, Neural Network, and kNN—achieve more than 80% accuracy, with Random Forest performing the best with a score of 0.99.
In the testing of individual classes, including access to country, cost, culture, and business, Random Forest performed with almost 100% accuracy. The seven machine-learning algorithms were evaluated using ROC, lift curve, and cumulative gain. The ROC analysis showed that Neural Network and Random Forest curves were closer to the accuracy (nearly to 1.0 in the y-axis). The Random Forest curve was better with a gradual increase in values compared to Neural Network. The lift obtained with Random Forest was highest with 30% of data and 1.5 times more positive instances compared to Neural Network in the cost class as seen in
Figure 6a–c.
8.2. Tourist Behavioral and Spending Model
In the tourism behavior and spending model, dataset was split into two parts with a ratio of 70:30 for training and testing purpose for labelled classes tourist interest.
8.2.1. Training Model Evaluation for Behavioral and Spending
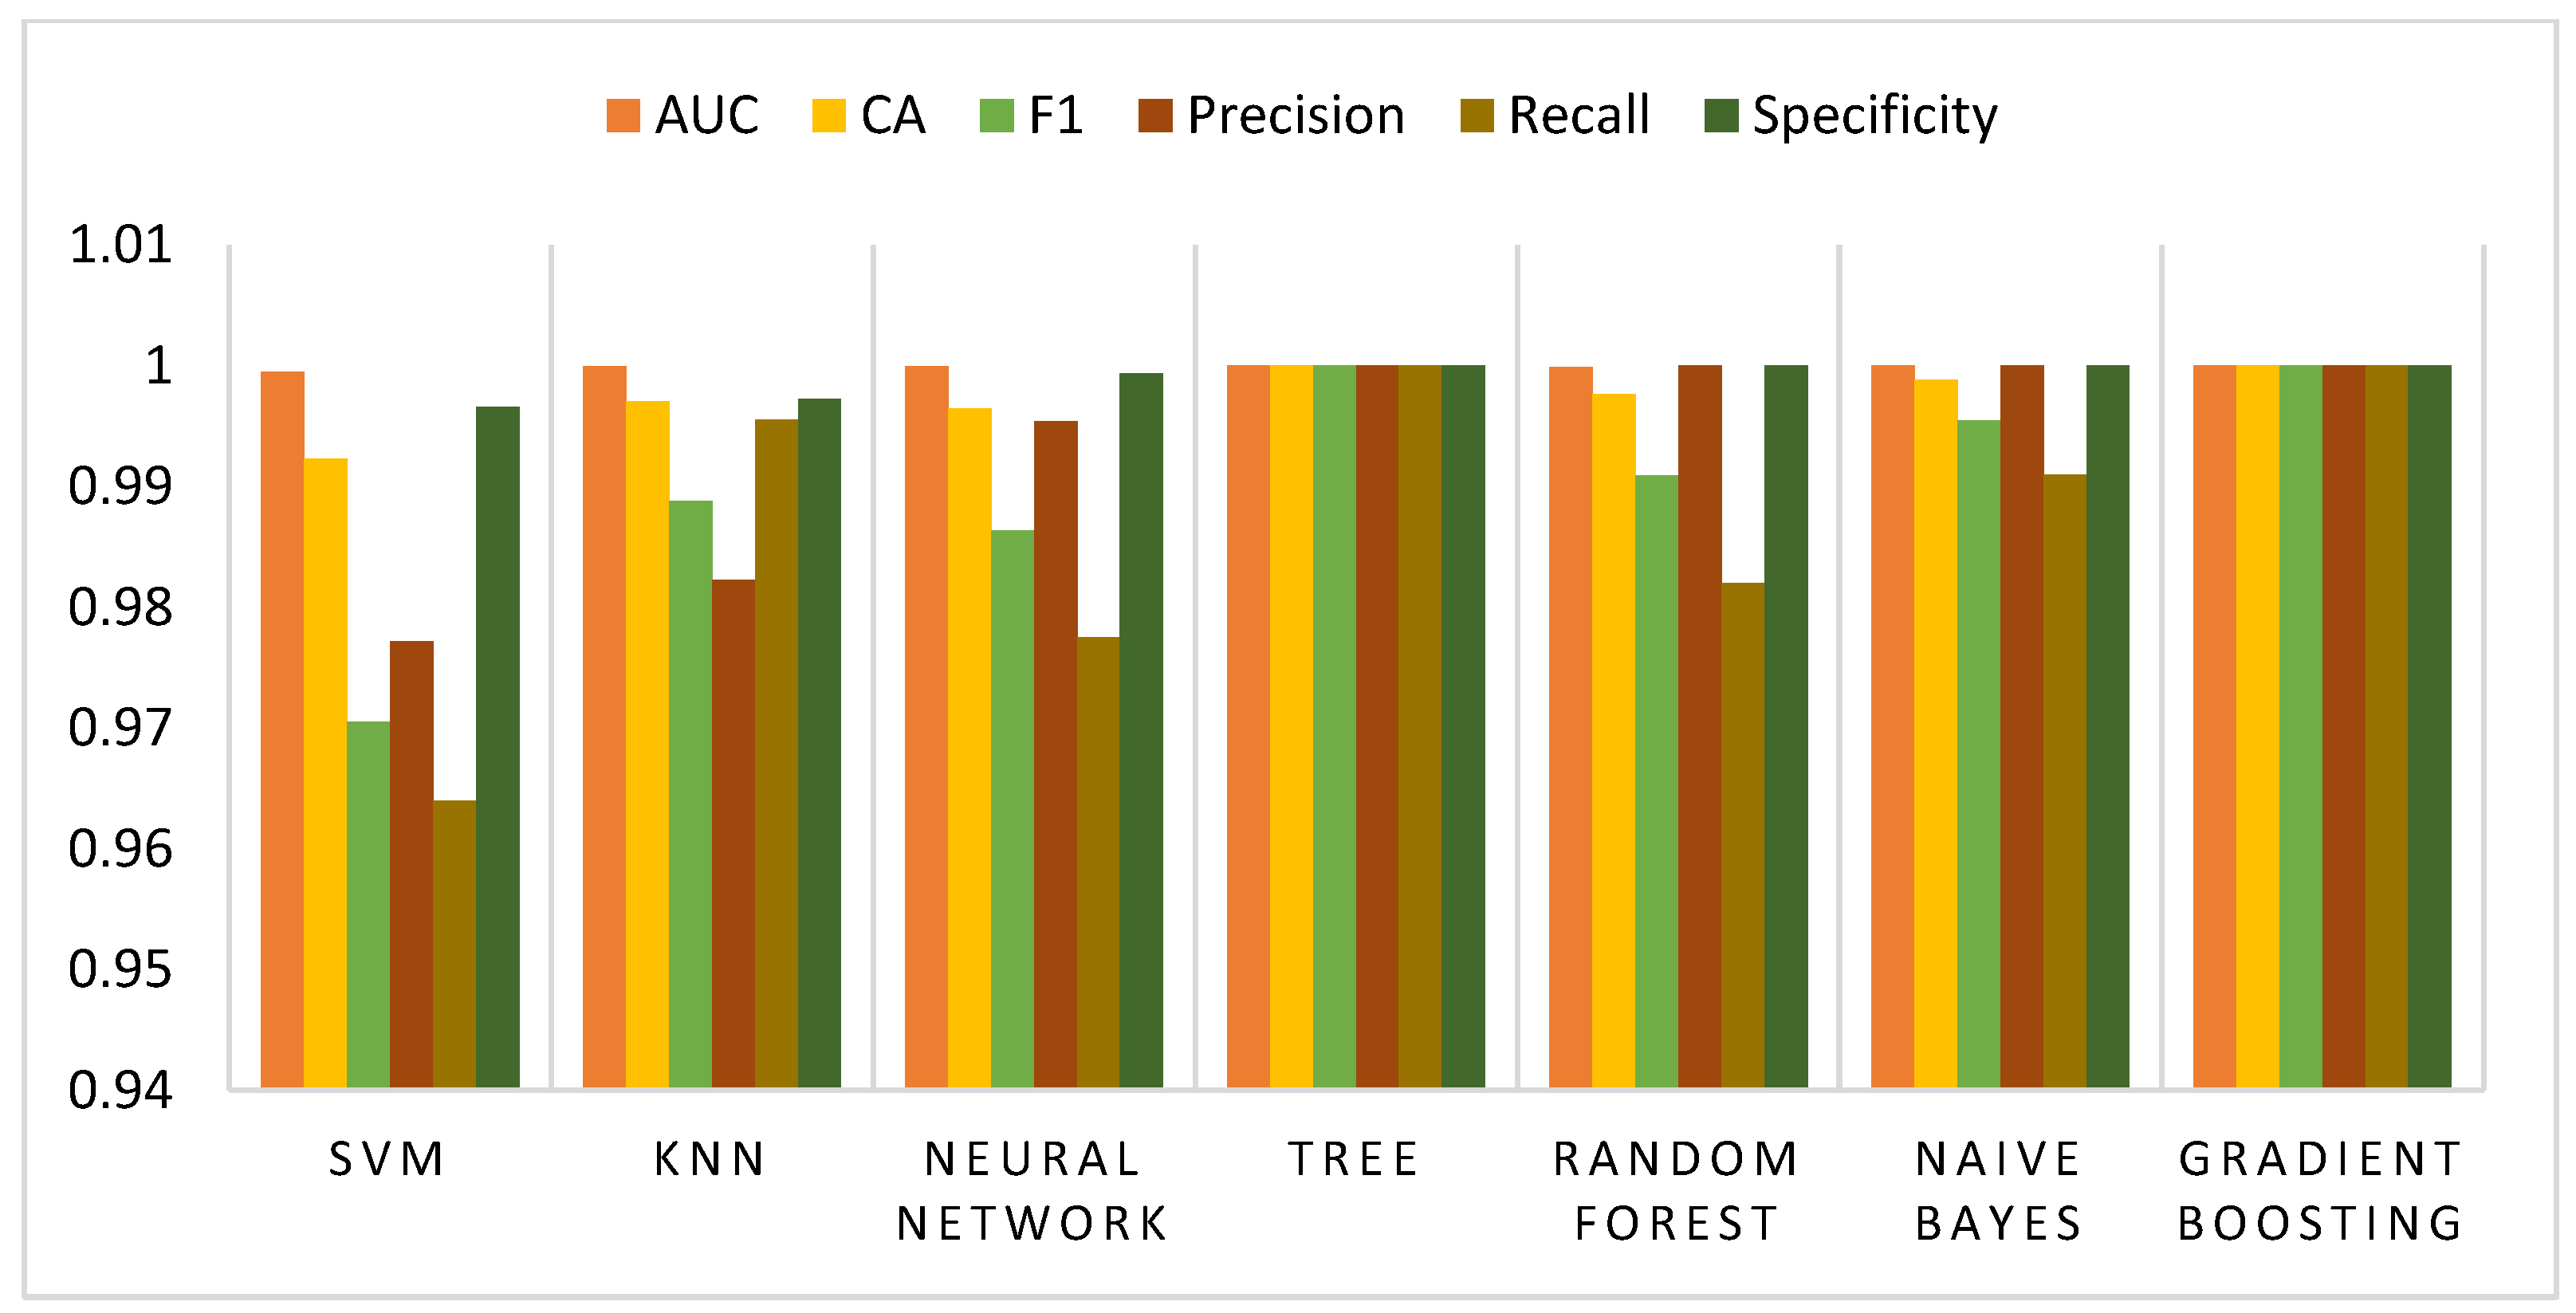
The training model performed better with 20 cross-folds and optimal execution for Gradient Boost and Decision Tree. Both algorithms achieved 1.00 and 1.00 accuracy for the average classes. CA, F1, Precision, and Recall values were equal for both DT and Gradient Boost, achieving 100% classification and prediction accuracy (
Table 9).
The training data shows that Gradient Boost and Decision Tree models performed better with increased cross-fold execution. Both algorithms achieved 1.00 and 1.00 accuracy for the average classes. CA, F1, Precision, and Recall values were equal for both DT and Gradient Boost in all classes, including entertainment, food, cuisine, sports, and activities. DT and Gradient Boost performed with 100% accuracy in all cases.
8.2.2. Testing the Predictions for the Behavioral and Spending Model
Thirty percent of the remaining dataset was used to evaluate the testing data. For the prediction study, 2400 occurrences, 36 variables, and 35 features, including 27 category and 8 numeric data, were used. According to the test findings (
Table 10), DT and Gradient Boost performed best, achieving 100% accuracy. The remaining classes, Entertainment, Well-Known Places, and Sports and Activities, all had 100% DT and Gradient Boost prediction accuracy. It should be noted that all other classes likewise attained the same outcomes as in
Figure 7 and
Figure 8, even if the research only shows some of the testing model’s key courses.
Additionally, the test data were assessed using ROC, lift curve, and cumulative gain. As can be observed in
Figure 9a–c, the algorithms’ ROC analyses reveal that the DT and Gradient Boost curves closely slope with the accuracy curve, which is closer to accuracy (almost to 1.0 on the y-axis). These two methods’ curves are superior and progressively converge on the accuracy curve. The lift curve for the other measuring method reveals that, as shown in
Figure 9b, for 30% of the data the lift achieved with DT and Gradient Boosting is better, with four times more positive cases. The cumulative gain also shows that 20% of the model’s top-ranked examples have a strong likelihood of foretelling two times more good outcomes.
Similarly, the model was tested for Tourist Preference Indicator and Tourist Satisfaction Analysis, and it was observed that in the training phase of the tourist preference model the Gradient Boosting yielded the highest accuracy, followed by kNN and Random Forest. Specifically, Gradient Boosting achieved an average accuracy of approximately 0.9 across the training models, outperforming kNN with an accuracy of 0.839. Further, the Gradient Boosting excelled in terms of CA, F1, Precision, and Recall values compared to the other algorithms. In the prediction phase of the Tourist Preference, the test results show that Gradient Boost performed best, with a 90% accuracy. The ROC analysis also revealed that Gradient Boost curves closely matched the accuracy, nearing 1.0 on the y-axis. This algorithm’s curve displayed a superior alignment with the accuracy curve. In terms of lift, Gradient Boosting showcased the best results, achieving four times more positive instances for 20% of the data. The cumulative gain graph demonstrates that the model, when picking the top 20% of instances, had a high probability of predicting four times more positive instances compared to random sampling. Looking at the confusion matrix, Gradient Boost exhibited the highest prediction accuracy compared to the actual for the class conference, standing at 91.7%, followed by vacations, family and friends, and cultural and community reasons.
The Tourist Satisfaction Analysis demonstrated that Gradient Boost exhibited the highest accuracy, CA, F1-Score, Precision, and Recall, with impressive values. The subsequent comparison of prediction test results indicated that Gradient Boost performed exceptionally well, making it the optimal model for predictions. ROC and lift curve analyses further confirmed the model’s accuracy, showing its superiority over other algorithms in various aspects.
9. Recommendation Process
The recommender system provides recommendations for tourist destinations and activities by employing a data-driven approach. This process begins with the collection of comprehensive data on tourists’ preferences, behaviors, and demographics, much like the data collection phase in a typical recommender system where user preferences and characteristics are compiled to inform recommendations. Next, the collected data are utilized to develop predictive models using supervised machine-learning algorithms. This stage is analogous to the training phase in a recommender system, where algorithms learn from the data to make accurate predictions. In this study, four main models are employed, each tested with seven different algorithms to identify the most effective one for each model, ensuring that the recommendations are based on the best-performing predictive model.
The outputs from these models provide categorical recommendations, akin to how a recommender system suggests items or services to users based on their learned preferences. These recommendations are tailored to the tourists’ preferences and behaviors, suggesting suitable destinations or activities. The final refinement of recommendations is achieved through a Tourist Parametric Weighted Algorithm that considers six critical parameters, where additional criteria are applied to fine-tune the suggestions. This algorithm assigns weights to parameters such as cost, popularity, ranking, review, rating, and location, based on expert judgment and user survey data, ensuring that the recommendations are not only personalized but also practical and aligned with the tourists’ preferences and constraints.
9.1. The Tourist Parametric Weighted Algorithm
The Tourist Parametric Weighted Algorithm takes the categorical outputs as an input to provide final recommendations. The algorithm defines six parameters and their associated weight, (location, pricing, popularity, rating, ranking, and trends) to make calculations and produce a score for each category, as shown in Equation (22). The real_world_data list’s choices are sorted by their scores, in decreasing order, using the sort_by_score function, which then produces the sorted list. The sorted_options list and the desired number of suggestions are sent to the get_top_recommendations function, which then provides a list of the top recommendations, as shown in Algorithm 2. The system then prints the top suggestions, together with each recommendation’s relevant location, cost, popularity, rating, ranking, trends, and score. In this instance, the weight is decided based on the survey’s data analysis, user feedback, and expert knowledge.
| Algorithm 2. Personalized Recommender. |
#Inputs:
machine_learning_output_file: string
real_world_data_file: string
num_recommendations: integer
Begin
// Define weights for each factor
Set w1 = 0.3, w2 = 0.2, w3 = 0.1, w4 = 0.1, w5 = 0.2, w6 = 0.1
// Define a structure to hold option details
Structure Option
Properties: location, cost, popularity, rating, ranking, trends, score
// Function to read machine-learning output
Function ReadMachineLearningOutput(filename)
Open filename for reading
Return lines from the file
// Function to map categories from machine-learning output to real-world data
Function MapCategories(data)
Initialize real_world_data as an empty list
Open real_world_data_file for reading as CSV
For each row in CSV
Create an Option instance with data from row
Add the instance to real_world_data
End For
Return real_world_data
// Read the machine-learning output
machine_learning_output = ReadMachineLearningOutput(machine_learning_output_file)
// Map the categories to real-world data
real_world_data = MapCategories(machine_learning_output)
// Calculate scores for each option
For each option in real_world_data
Calculate option's score using weights and option's attributes
End For
// Sort options by their scores in descending order
Function SortByScore(data)
Sort data based on the score of each option in descending order
Return sorted data
sorted_options = SortByScore(real_world_data)
// Function to get top recommendations
Function GetTopRecommendations(data, num_recommendations)
Return the first num_recommendations elements from data
// Get the top recommendations
top_recommendations = GetTopRecommendations(sorted_options, num_recommendations)
// Print the top recommendations
For each option in top_recommendations
Print option's details including score
End For
End |
9.2. Testing and Validation of the Recommender System
The method has been tested after being coded and run in Python 3.6., utilizing a conditional walkthrough of the user inputs and validating it against the outcomes attained. In order to create results, Algorithm 2 performs calculations according to Equation (22) and looks at location, cost, popularity, rating, ranking, trends, and score.
Table 11,
Table 12,
Table 13 and
Table 14 show the results for top 10 locations, top 5 tourism destinations, top 5 hotels, and top 5 activities. The results show that recommendations provided by our system are correct and more accurate compared to other generalized recommender systems such as Google, TripAdvisor, etc.
The model is also contrasted with other models to determine their impact and applicability. It can be seen that other recommendation systems are generic and offer generic information, as shown in
Table 15. Furthermore, compared to our system, these systems’ databases are small and lack specific information. The recommender system for the Nepalese city of Pokhara is the first study of its kind as there is no indication in the literature that a similar system exists.
10. Conclusions
This research study concludes by presenting a unique data-driven and machine-learning strategy for creating a customized traveler recommendation system. The study performed a thorough analysis of the literature and created a well-designed questionnaire based on several tourist-related factors. Using survey data from 2400 visitors to Pokhara, Nepal, four sub-models were developed using machine-learning techniques. The suggested technique generates precise and well-optimized suggestions by combining predictions from machine learning with an overall score computation. The study helps provide better suggestions to travelers, promotes decision-making, and raises satisfaction levels all around. The study emphasizes the significance of questionnaire design, including demographic data, creating a strong association model using machine learning. Decision criteria were constructed based on the data quality being evaluated. Data from multiple sources were combined to create a comprehensive tourist database, and the recommender system included user feedback and decision-making guidelines. The study highlights the significance of choosing weights based on data analysis, user feedback, and subject-matter expertise and offers an example algorithm. The suggestion process is flexible and adaptable under the suggested methodology. Overall, this study offers a detailed and useful framework for tailored traveler suggestions in the context of Nepal, outperforming current methods and increasing travelers’ decision-making processes.
11. Discussions
The study introduces a novel data-driven approach for developing personalized tourist recommendations in Nepal. The work considers the important attributes of tourists, such as age, behavior, what people like, and how happy they are to create a personalized recommender system that suggests tourist products and services. The study used a survey of over 2400 people who visited Pokhara city, both from other countries and from Nepal itself. The information obtained was used to make four computer sub-models that provide specific suggestions. The models were tested using different methods to see how well they worked. The work was validated against a comprehensive database of Pokhara, Nepal. The system was checked in terms of accuracy and was good at giving precise suggestions. The study was compared with other recommendations provided by TripAdvisor, Google Maps, and other systems, and it was observed that our approach was much better and more tailored. The study is important because it is the first research conducted in this area in Nepal. The work will be of significant help for the tourism industry and the government in Nepal to improve the experience and overall business for tourists visiting the country.
12. Limitations and Future Work
The study collected data from 2400 international and domestic tourists in Pokhara, Nepal, but the findings may not be fully representative of all tourists. Future work could expand the sample size or collect data from multiple locations to enhance generalizability. The study considered six factors for generating recommendations, but additional factors such as cultural experiences, specific interests, or accessibility could be considered. Data collection methods such as surveys and passive data collection through mobile apps or online tracking could be used to mitigate biases and obtain more objective data. Real-time data integration could enhance the accuracy and relevance of recommendations. Evaluation metrics, such as user feedback, ratings, and user studies, could be considered to assess the effectiveness of the recommender system in real-world scenarios. Scalability and efficiency are crucial for the recommender system, with future work focusing on optimizing computational complexity, enhancing scalability, and ensuring real-time responsiveness. Adaptability to dynamic preferences is also essential, considering temporal patterns and shifting trends to provide up-to-date and relevant recommendations.
Author Contributions
Conceptualization, D.S. (Deepanjal Shrestha) and T.W.; methodology, D.S. (Deepanjal Shrestha); software, D.S. (Deepanjal Shrestha); validation, S.-R.J., D.S. (Deepanjal Shrestha) and T.W.; formal analysis, D.S. (Deepmala Shrestha); investigation, D.S. (Deepanjal Shrestha); resources, D.S. (Deepmala Shrestha); data curation, D.S. (Deepanjal Shrestha); writing—original draft preparation, D.S. (Deepanjal Shrestha); writing—review and editing, N.R.; visualization, S.-R.J. and T.W.; funding acquisition, N.R. All authors have read and agreed to the published version of the manuscript.
Funding
This research received no external funding.
Data Availability Statement
The data are unavailable due to privacy and ethical restrictions.
Acknowledgments
We would like to thank Nanjing University of Aeronautics, Department of Computer Science and Technology, Nanjing, China, School of Business, Pokhara University, Nepal and Graduate School of Business IT, Kookmin University, South Korea in facilitating the data collection process and other necessary support.
Conflicts of Interest
The authors declare no conflicts of interest.
References
- Ricci, F.; Rokach, L.; Shapira, B.; Kantor, P.B. Recommender Systems Handbook. Computer Science; Springer: New York, NY, USA, 2011; ISBN 978-0-387-85820-3. [Google Scholar] [CrossRef]
- Zhang, Q.; Lu, J.; Jin, Y. Artificial intelligence in recommender systems. Complex Intell. Syst. 2021, 7, 439–457. [Google Scholar] [CrossRef]
- Borràs, J.; Moreno, A.; Valls, A. Intelligent Tourist Recommender Systems: A survey. Expert Syst. Appl. 2014, 41, 7370–7389. [Google Scholar] [CrossRef]
- Schafer, J.B.; Konstan, J.; Riedl, J. Recommender systems in e-commerce. In Proceedings of the 1st ACM Conference on Electronic Commerce (EC’99), Denver, CO, USA, 3–5 November 1999; Association for Computing Machinery: New York, NY, USA, 1999; pp. 158–166. [Google Scholar] [CrossRef]
- Aditya, P.H.; Budi, I.; Munajat, Q. A Comparative Analysis of Memory-based and Model-based Collaborative Filtering on the Implementation of Recommender System for Ecommerce in Indonesia: A Case Study PT X. In Proceedings of the International Conference on Advanced Computer Science and Information Systems 2016 (ICACSIS 2016), Malang, Indonesia, 15–16 October 2016. [Google Scholar]
- Jannach, D.; Zanker, M.; Felfernig, A.; Friedrich, G. Frontmatter. In Recommender Systems: An Introduction; Cambridge University Press: Cambridge, UK, 2010; pp. 1–4. [Google Scholar]
- Lee, J.; Kang, E.; Park, G.L. Design and Implementation of a Tour Planning System for Telematics Users. In Computational Science and Its Applications—ICCSA 2007; Gervasi, O., Gavrilova, M.L., Eds.; Lecture Notes in Computer Science; Springer: Berlin/Heidelberg, Germany, 2007; Volume 4707. [Google Scholar] [CrossRef]
- Nilashi, M.; Bagherifard, K.; Rahmani, M.; Rafe, V. A recommender system for tourism industry using cluster ensemble and prediction machine learning techniques. Comput. Ind. Eng. 2017, 109, 357–368. [Google Scholar] [CrossRef]
- Arreeras, T.; Arimura, M.; Asada, T.; Arreeras, S. Association Rule Mining Tourist-Attractive Destinations for the Sustainable Development of a Large Tourism Area in Hokkaido Using Wi-Fi Tracking Data. Sustainability 2019, 11, 3967. [Google Scholar] [CrossRef]
- Kulshrestha, A.; Krishnaswamy, V.; Sharma, M. Bayesian BILSTM approach for tourism demand forecasting. Ann. Tour. Res. 2020, 83, 102925. [Google Scholar] [CrossRef]
- Essien, A.; Chukwukelu, G. Deep learning in hospitality and tourism: A research framework agenda for future research. Int. J. Contemp. Hosp. Manag. 2022, 34, 4480–4515. [Google Scholar] [CrossRef]
- Hu, M.; Qiu, R.T.; Wu, D.C.; Song, H. Hierarchical pattern recognition for tourism demand forecasting. Tour. Manag. 2021, 84, 104263. [Google Scholar] [CrossRef]
- Pai, P.F.; Hong, W.C.; Lin, C.S. Forecasting Tourism Demand Using a Multifactor Support Vector Machine Model. In Computational Intelligence and Security—CIS 2005; Lecture Notes in Computer Science; Springer: Berlin/Heidelberg, Germany, 2005; Volume 3801. [Google Scholar] [CrossRef]
- Li, S.; Sasaki, J. A Study on the Tourism Features Extraction from Photos in a Tourism Website by Image Analysis. In Proceedings of the 2019 IEEE 10th International Conference on Awareness Science and Technology (iCAST), Morioka, Japan, 23–25 October 2019; pp. 1–5. [Google Scholar] [CrossRef]
- Maravanyika, M.; Dlodlo, N. An Adaptive Framework for Recommender-Based Learning Management Systems. In Proceedings of the 2018 Open Innovations Conference (OI), Johannesburg, South Africa, 3–5 October 2018; pp. 203–212. [Google Scholar] [CrossRef]
- Gössling, S. Technology, ICT and tourism: From big data to the big picture. J. Sustain. Tour. 2021, 29, 849–858. [Google Scholar] [CrossRef]
- Badaro, G.; Hajj, H.; El-Hajj, W.; Nachman, L. A hybrid approach with collaborative filtering for recommender systems. In Proceedings of the 9th International Wireless Communications and Mobile Computing Conference (IWCMC), Sardinia, Italy, 1–5 July 2013; pp. 349–354. [Google Scholar] [CrossRef]
- Burke, R. Hybrid Recommender Systems: Survey and Experiments. User Model. User-Adapt. Interact. 2002, 12, 331–370. [Google Scholar] [CrossRef]
- Necula, S.-C.; Păvăloaia, V.-D. AI-Driven Recommendations: A Systematic Review of the State of the Art in E-Commerce. Appl. Sci. 2023, 13, 5531. [Google Scholar] [CrossRef]
- Fanca, A.; Puscasiu, A.; Gota, D.-I.; Valean, H. Recommendation Systems with Machine Learning. In Proceedings of the 2020 21th International Carpathian Control Conference (ICCC), High Tatras, Slovakia, 27–29 October 2020; pp. 1–6. [Google Scholar] [CrossRef]
- Alrasheed, H.; Alzeer, A.; Alhowimel, A.; Althyabi, A. A Multi-Level Tourism Destination Recommender System, The 11th International Conference on Ambient Systems, Networks and Technologies (ANT). Procedia Comput. Sci. 2020, 170, 333–340. [Google Scholar] [CrossRef]
- Kbaier, M.E.B.H.; Masri, H.; Krichen, S. A Personalized Hybrid Tourist Recommender System. In Proceedings of the 2017 IEEE/ACS 14th International Conference on Computer Systems and Applications (AICCSA), Hammamet, Tunisia, 30 October–3 November 2017; pp. 244–250. [Google Scholar] [CrossRef]
- Shambour, Q. A deep learning-based algorithm for multi-criteria recommender systems. Knowl.-Based Syst. 2021, 211, 106545. [Google Scholar] [CrossRef]
- Yassine, A.F.; Mohamed, L.A.; Al Achhab, M. Intelligent recommender system based on unsupervised machine learning and demographic attributes. Simul. Model. Pract. Theory 2021, 107, 102198. [Google Scholar] [CrossRef]
- Devkota, B.; Miyazaki, H.; Pahari, N. Utilizing User Generated Contents to describe Tourism Areas of Interest. In Proceedings of the 2019 First International Conference on Smart Technology & Urban Development (STUD), Chiang Mai, Thailand, 13–14 December 2019; pp. 1–6. [Google Scholar] [CrossRef]
- Devkota, B.; Miyazaki, H. An Exploratory Study on the Generation and Distribution of Geotagged Tweets in Nepal. In Proceedings of the 2018 IEEE 3rd International Conference on Computing, Communication and Security (ICCCS), Kathmandu, Nepal, 25–27 October 2018; pp. 70–76. [Google Scholar] [CrossRef]
- Devkota, B.; Miyazaki, H.; Witayangkurn, A.; Kim, S.M. Using Volunteered Geographic Information and Nighttime Light Remote Sensing Data to Identify Tourism Areas of Interest. Sustainability 2019, 11, 4718. [Google Scholar] [CrossRef]
- Wenan, T.; Shrestha, D.; Shrestha, D.; Gaudel, B.; Jeong, S.R. Analysis and Design of Tourist Recommender System for Religious Destinations of Nepal. In Proceedings of the 2020 IEEE International Conference on Sustainable Engineering and Creative Computing (ICSECC), Cikarang, Indonesia, 16–17 December 2020; pp. 214–220. [Google Scholar] [CrossRef]
- Shrestha, D.; Wenan, T.; Gaudel, B.; Shrestha, D.; Rajkarnikar, N.; Jeong, S.R. Preliminary Analysis and Design of a Customized Tourist Recommender System. In Evolutionary Computing and Mobile Sustainable Networks; Suma, V., Fernando, X., Du, K.L., Wang, H., Eds.; Lecture Notes on Data Engineering and Communications Technologies; Springer: Singapore, 2022; Volume 116. [Google Scholar] [CrossRef]
- Daniel, J. Sampling Essentials: Practical Guidelines for Making Sampling Choices; SAGE Publications, Inc.: New York, NY, USA, 2012. [Google Scholar] [CrossRef]
- Hu, Y.; Fang, Z.; Zou, X.; Zhong, H.; Wang, L. Two-Stage Tour Route Recommendation Approach by Integrating Crowd Dynamics Derived from Mobile Tracking Data. Appl. Sci. 2023, 13, 596. [Google Scholar] [CrossRef]
- Alabduljabbar, R. Matrix Factorization Collaborative-Based Recommender System for Riyadh Restaurants: Leveraging Machine Learning to Enhance Consumer Choice. Appl. Sci. 2023, 13, 9574. [Google Scholar] [CrossRef]
- Jani, D.; Jang, J.H.; Hwang, Y.H. Big Five Factors of Personality and Tourists’ Internet Search Behavior. Asia Pac. J. Tour. Res. 2014, 19, 600–615. [Google Scholar] [CrossRef]
- Karahoca, A. (Ed.) Advances in Data Mining Knowledge Discovery and Applications [Internet]; InTech: London, UK, 2012. [Google Scholar] [CrossRef]
Figure 1.
The conceptual framework for a tourist recommender system.
Figure 1.
The conceptual framework for a tourist recommender system.
Figure 2.
Conceptual architecture of a Tourist Recommender System for Nepal.
Figure 2.
Conceptual architecture of a Tourist Recommender System for Nepal.
Figure 3.
(a) ROC analysis for training dataset for average over the classes. (b) Lift curve of training dataset for average over the classes.
Figure 3.
(a) ROC analysis for training dataset for average over the classes. (b) Lift curve of training dataset for average over the classes.
Figure 4.
Planning model evaluation with average over classes.
Figure 4.
Planning model evaluation with average over classes.
Figure 5.
(a) ROC analysis for training dataset for average over the classes. (b) Lift curve of training dataset for average over the classes.
Figure 5.
(a) ROC analysis for training dataset for average over the classes. (b) Lift curve of training dataset for average over the classes.
Figure 6.
(a) ROC curve analysis for prediction data of access to country class. (b) Decision factor analysis for prediction dataset for average over the classes. (c) Decision factor analysis for prediction dataset for average over the classes.
Figure 6.
(a) ROC curve analysis for prediction data of access to country class. (b) Decision factor analysis for prediction dataset for average over the classes. (c) Decision factor analysis for prediction dataset for average over the classes.
Figure 7.
Evaluation of testing data for entertainment class.
Figure 7.
Evaluation of testing data for entertainment class.
Figure 8.
Evaluation of testing data for popular destination class.
Figure 8.
Evaluation of testing data for popular destination class.
Figure 9.
(a) ROC analysis for behavioral training dataset for the target class sports and activities. (b) Decision factor analysis for prediction dataset for average over the classes. (c) Decision factor analysis for prediction dataset for average over the classes.
Figure 9.
(a) ROC analysis for behavioral training dataset for the target class sports and activities. (b) Decision factor analysis for prediction dataset for average over the classes. (c) Decision factor analysis for prediction dataset for average over the classes.
Table 1.
Comparative study of Tourist Recommender System.
Table 1.
Comparative study of Tourist Recommender System.
| Title of the Paper | Major Component Used | Ref |
|---|
| Technology, ICT and Tourism: From Big Data to the Big Picture | Technology, ICTs, and advances in SDGs | [16] |
| A Hybrid Approach with Collaborative Filtering for Recommender Systems | Solving problem related to the ratings of unrated items in a user–item ranking matrix | [17] |
| Hybrid Recommender Systems: Survey and Experiments | Surveys the landscape of actual and possible hybrid recommender systems | [18] |
| Artificial Intelligence in Recommender Systems | Basic methodologies, prevailing techniques, and how AI can effectively improve systems | [19] |
| Recommendation Systems with Machine Learning | Development and comparison of multiple recommendation systems | [20] |
| A Multi-Level Tourism Destination Recommender System | Design of a simple multi-level Tourist Recommender System framework to assist potential travelers to find destinations | [21] |
| A Personalized Hybrid Tourist Recommender System | Uses different machine-learning algorithms which are the K-NN for both CB and CF and the decision tree for the DF | [22] |
| A Deep-Learning-Based Algorithm for Multi-Criteria Recommender Systems | Proposes a deep-learning-based algorithm for multi-criteria recommender systems | [23] |
| Intelligent Recommender System Based on Unsupervised Machine Learning and Demographic Attributes | New intelligent recommender system with collaborative filtering (CF) using unsupervised K-means clustering | [24] |
Table 2.
Tourism POI’s dataset.
Table 2.
Tourism POI’s dataset.
| | Natural Attraction |
|---|
| Attraction Name | Phewa Lake |
| Attraction type | Natural destination |
| Specific Type | Waterbody |
| Address | Baidam, Pokhara |
| Open day | All days |
| Close day | NA |
| Open time | 00 h |
| Close time | 00 h |
| GPS coordinates | 28°13′0.12″ N 83°57′0.00″ E |
| User rating | 4.7 based on 1730 Google reviews |
| Entry Fee | No Fee |
| Information source | https://en.wikipedia.org/wiki/Phewa_Lake (accessed on 10 July 2023) |
| Mode of transport | All types |
| Distance from center | 4 km from city center |
| Description | Phewa Tal or Fewa Lake is a freshwater lake in Nepal located in the south of the Pokhara Valley, which includes Pokhara city and parts of Sarangkot and Kaskikot. |
Table 3.
Tourism POI human-built attractions.
Table 3.
Tourism POI human-built attractions.
| | Human-Built Attraction |
|---|
| Attraction Name | International Mountain Museum |
| Attraction type | Man-made museum |
| Specific Type | Museum |
| Address | Chhorepatan, Pokhara |
| Open day | Sun to Friday |
| Close day | Saturday and National Holidays |
| Open time | 8:00 AM |
| Close time | 6:00 PM |
| GPS coordinates | 28.190937845354583, 83.981387539753 |
| User rating | 4.3 based on 2917 Google reviews |
| Entry Fee (NRs) | Nepali Students, 50; Nepali, 100; SAARC, 250; Foreigner 500 |
| Information source | https://www.internationalmountainmuseum.org/ (accessed on 10 July 2023) |
| Mode of transport | All types |
| Distance from center | 5 km from city center |
| Description | Nepal Mountaineering Association (NMA), established on 1 November 1973, was created to record and document the development of mountaineering activities. |
Table 4.
A sample data table for important tourism destinations.
Table 4.
A sample data table for important tourism destinations.
| POI | Type | Popularity | Price | Address | Geo Loc. | Time | Feature |
|---|
| Pokhara Grandee | 4 Star Hotel | 4.5 star | USD 150–250 | Pardi Birauta Pokhara | 28.1923, 83.9747 | 24 h. 365 days | Major POI within 2–3 km area |
| Peace Temple | Tourist Point | 4.8 star | Free | Lakeside, Pokhara | 28.2011, 83.9446 | 8 AM–7 PM | Near major Tourism Points |
| Lake Side | Tourist Point | 5 star | Free | Lakeside, Pokhara | 28.2053, 83.9616 | 24 h. 365 days | 90% restaurants and hotels |
| Mahendra Cave | Tourist Point | 4 star | USD 50
NRs 100
NRs 50 | Batulechaur, Pokhara | 28.155, 83.9797 | 8 AM–7:00 PM | Natural cave. It is also near a bat cave |
| Bindabasini Temple | Religious Point | 4.5 star | Free | Bagar, Pokhara | 28.2379, 83.9841 | 5 AM–6:30 PM | Near city center |
| Pame, Pokhara | Free Wandering Location | 4.7 star | Free | Pame, Lakeside Pokhara | 28.2255, 83.9463 | 24 h. 365 days | Free walking, with good restaurants and hotels |
| Devis Fall | Romantic Point | 4.6 star | USD 25
NRs 50
NRs 25 | Damside, Pokhara | 28.1903, 83.9591 | 8 AM–6:30 PM | Gupteshwor temple and Cave. |
Table 5.
Demographic data of the respondents.
Table 5.
Demographic data of the respondents.
| Variable | Tourist Type | Gender | Marital Status | Age Group | Monthly Income (USD) | Academic Qualification | Profession |
|---|
| N | 2400 | 2400 | 2400 | 2400 | 2400 | 2400 | 2400 |
| Missing | 0 | 0 | 0 | 0 | 0 | 0 | 0 |
| Standard Deviation | 0.482 | 0.490 | 1.023 | 0.940 | 2803 | 2497 | 2121 |
| Variance | 0.233 | 0.240 | 1.046 | 0.883 | 7859 | 6236 | 4499 |
| Range | 1 | 2 | 3 | 5 | 9 | 7 | 6 |
| Minimum | 1 | 1 | 1 | 1 | 1 | 1 | 1 |
| Maximum | 2 | 3 | 4 | 6 | 10 | 8 | 7 |
Table 6.
Feature selection and entropy information for top ten attributes.
Table 6.
Feature selection and entropy information for top ten attributes.
| SN | Features | Info. Gain | Gain Ratio | Gini | χ2 |
|---|
| 1 | Tourist Type | 0.0058 | 0.0060 | 0.0020 | 5.0238 |
| 2 | Stayed Plan | 0.0103 | 0.0077 | 0.0036 | 12.9646 |
| 3 | Gender | 0.0108 | 0.0096 | 0.0021 | 5.9630 |
| 4 | Accommodation | 0.0091 | 0.0049 | 0.0028 | 1.3370 |
| 5 | Marital Status | 0.0083 | 0.0061 | 0.0023 | 1.4151 |
| 6 | Age Group | 0.0105 | 0.0063 | 0.0022 | 1.1459 |
| 7 | Arrange trip | 0.0172 | 0.0068 | 0.0045 | 8.3131 |
| 8 | Monthly Income in USD. | 0.0309 | 0.0110 | 0.0084 | 16.47 |
| 9 | Collect information | 0.0423 | 0.0132 | 0.0108 | 17.6762 |
| 10 | Popularity | 0.0194 | 0.0104 | 0.0059 | 24.9914 |
Table 7.
Training Data Results of Planning model with average over classes.
Table 7.
Training Data Results of Planning model with average over classes.
| Model | AUC | CA | F1 | Precision | Recall |
|---|
| kNN | 0.94592 | 0.834646 | 0.834407 | 0.835214 | 0.834646 |
| Tree | 0.883217 | 0.695692 | 0.694198 | 0.696333 | 0.695692 |
| SVM | 0.830707 | 0.578045 | 0.578907 | 0.5947 | 0.578045 |
| Random Forest | 0.940644 | 0.835109 | 0.835119 | 0.840328 | 0.835109 |
| Neural Network | 0.9152 | 0.835572 | 0.835408 | 0.83566 | 0.835572 |
| Naive Bayes | 0.614912 | 0.369616 | 0.35098 | 0.352866 | 0.369616 |
| Gradient Boosting | 0.8519 | 0.65447 | 0.647337 | 0.670677 | 0.65447 |
Table 8.
Prediction measures for class tourism activities.
Table 8.
Prediction measures for class tourism activities.
| Model | AUC | CA | F1 | Precision | Recall | Specificity |
|---|
| Naive Bayes | 0.677 | 0.41 | 0.393 | 0.401 | 0.41 | 0.785 |
| SVM | 0.896 | 0.627 | 0.628 | 0.635 | 0.627 | 0.86 |
| Gradient Boosting | 0.95 | 0.778 | 0.774 | 0.799 | 0.778 | 0.909 |
| Tree | 0.982 | 0.848 | 0.847 | 0.849 | 0.848 | 0.948 |
| Random Forest | 1 | 0.99 | 0.99 | 0.99 | 0.99 | 0.996 |
| kNN | 1 | 0.999 | 0.999 | 0.999 | 0.989 | 0.989 |
| Neural Network | 1 | 0.999 | 0.999 | 0.989 | 0.979 | 0.999 |
Table 9.
Behavioral and spending model performance evaluation.
Table 9.
Behavioral and spending model performance evaluation.
| Model | AUC | CA | F1 | Precision | Recall |
|---|
| kNN | 0.999797 | 0.983929 | 0.983901 | 0.984054 | 0.983929 |
| Tree | 1 | 1 | 1 | 1 | 1 |
| SVM | 0.999128 | 0.971429 | 0.971437 | 0.971562 | 0.971429 |
| Random Forest | 0.999934 | 0.994643 | 0.994639 | 0.994648 | 0.994643 |
| Neural Network | 0.999381 | 0.990476 | 0.99047 | 0.990533 | 0.990476 |
| Naive Bayes | 0.978869 | 0.848214 | 0.834722 | 0.872394 | 0.848214 |
| Gradient Boosting | 1 | 1 | 1 | 1 | 1 |
Table 10.
Evaluation of testing data for average over classes.
Table 10.
Evaluation of testing data for average over classes.
| Model | AUC | CA | F1 | Precision | Recall | Specificity |
|---|
| kNN | 1 | 1 | 1 | 1 | 1 | 1 |
| Tree | 1 | 1 | 1 | 1 | 1 | 1 |
| SVM | 1 | 0.998 | 0.998 | 0.998 | 0.998 | 1 |
| Random Forest | 1 | 0.999 | 0.999 | 0.999 | 0.999 | 1 |
| Neural Network | 1 | 1 | 1 | 1 | 1 | 1 |
| Naive Bayes | 0.984 | 0.861 | 0.849 | 0.889 | 0.861 | 0.977 |
| Gradient Boosting | 1 | 1 | 1 | 1 | 1 | 1 |
Table 11.
Test results for 10 top locations traced by the recommender algorithm.
Table 11.
Test results for 10 top locations traced by the recommender algorithm.
| Rank | Location | Cost | Popularity | Rating | Ranking | Trends | Score |
|---|
| 1 | Lakeside, Pokhara | 3 | 5 | 4.8 | 1 | 3 | 0.945 |
| 2 | Sarangkot, Pokhara | 2 | 4 | 4.6 | 2 | 2 | 0.865 |
| 3 | World Peace Pagoda, Pokhara | 1 | 5 | 4.7 | 3 | 3 | 0.835 |
| 4 | Phewa Lake, Pokhara | 3 | 5 | 4.7 | 4 | 3 | 0.825 |
| 5 | Bindhyabasini Temple, Pokhara | 1 | 5 | 4.5 | 5 | 3 | 0.805 |
Table 12.
Test results for 5 tourism destinations traced by the recommender algorithm.
Table 12.
Test results for 5 tourism destinations traced by the recommender algorithm.
| Rank | Destinations | Cost | Popularity | Rating | Ranking | Trends | Score |
|---|
| 1 | Pumdi Mahadev Temple | 1 | 5 | 4.5 | 1 | 5 | 3.82 |
| 2 | World Peace Pagoda | 2 | 4 | 4.6 | 3 | 4 | 3.72 |
| 3 | Davis Falls | 2 | 4 | 4.5 | 5 | 4 | 3.62 |
| 4 | Sarangkot View Point | 3 | 3 | 4.7 | 2 | 3 | 3.54 |
| 5 | Bindabasini Temple | 1 | 3 | 4.5 | 8 | 5 | 3.52 |
Table 13.
Test results for 5 hotels traced by the recommender algorithm.
Table 13.
Test results for 5 hotels traced by the recommender algorithm.
| Rank | Hotel Name | Location | Cost | Popularity | Rating | Ranking | Trends | Score |
|---|
| 1 | Hotel Barahi | Lakeside | 3 | 5 | 4.5 | 1 | 4.5 | 3.825 |
| 2 | Hotel Pokhara Grande | Pokhara | 4 | 4 | 4.5 | 2 | 4.0 | 3.61 |
| 3 | Temple Tree Resort | Gaurighat | 4 | 5 | 4.5 | 3 | 4.5 | 3.6025 |
| 4 | Waterfront Resort | Lakeside | 3 | 4 | 4.5 | 4 | 4.0 | 3.3475 |
| 5 | Landmark Pokhara | Chipledhunga | 3 | 4 | 4.0 | 5 | 4.0 | 3.14 |
Table 14.
Test results for 5 activities traced by the recommender algorithm.
Table 14.
Test results for 5 activities traced by the recommender algorithm.
| Rank | Activity | Location | Cost | Popularity | Rating | Ranking | Trends | Score |
|---|
| 1 | Paragliding | Sarangkot | 5 | 5 | 4.5 | 1 | 5 | 4.69 |
| 2 | Trekking | ABC | 4 | 5 | 4.6 | 2 | 5 | 4.61 |
| 3 | White Water Rafting | Seti River | 4 | 4 | 4.3 | 3 | 4 | 4.29 |
| 4 | Zip Flyer | Sarangkot | 4 | 4 | 4.2 | 4 | 4 | 4.15 |
| 5 | Bungee Jumping | Hemja | 5 | 3 | 4.1 | 5 | 3 | 3.98 |
Table 15.
Comparing Pokhara recommender system with other systems.
Table 15.
Comparing Pokhara recommender system with other systems.
| Source | Data Provided | Model in Use | Shortcomings |
|---|
| TripAdvisor | Recommendations on hotels, restaurants, attractions, etc. | Feedback | Dependent on user data, crowdsourced model |
| Google Maps | Geotagged locations, distances, recommendations on product and services | User tagging, user information, distance-based, popularity-based, and others | User-dependent and generalized for all countries and locations |
| Nepal tourism portal | Static web information, inefficient Chatbots, no real-time updates | Static web information system | No real-time updates, static and fixed type of information |
| Social sites Facebook, Twitter, etc. | Crowdsourced data from users | Social network model | User-based. Problems of accuracy and precision. Generalized model |
| Websites of Wikipedia, private tourism companies, etc. | Static, user-based, blogs, structured, etc. | Web content, static and dynamic model | Little data, biased data, static with no real-time updates. Static with very few updates. |
| Personalized Recommender System* | Dynamic, crowdsourced, self-adaptive and customized | Model design based on machine learning and crowdsourced data | Lack of comprehensive data for all the tourism destinations and services of Pokhara |
| Disclaimer/Publisher’s Note: The statements, opinions and data contained in all publications are solely those of the individual author(s) and contributor(s) and not of MDPI and/or the editor(s). MDPI and/or the editor(s) disclaim responsibility for any injury to people or property resulting from any ideas, methods, instructions or products referred to in the content. |
© 2024 by the authors. Licensee MDPI, Basel, Switzerland. This article is an open access article distributed under the terms and conditions of the Creative Commons Attribution (CC BY) license (https://creativecommons.org/licenses/by/4.0/).


 ,
, 


