
Computer Aided Structure-Based Drug Design of Novel SARS-CoV-2 Main Protease Inhibitors: Molecular Docking and Molecular Dynamics Study

Abstract
:1. Introduction
2. Materials and Methods
2.1. Molecular Design
2.2. Molecular Docking
2.3. Molecular Dynamic Simulation
2.4. MM/PBSA
3. Results
3.1. Molecular Docking
3.2. Molecular Dynamics
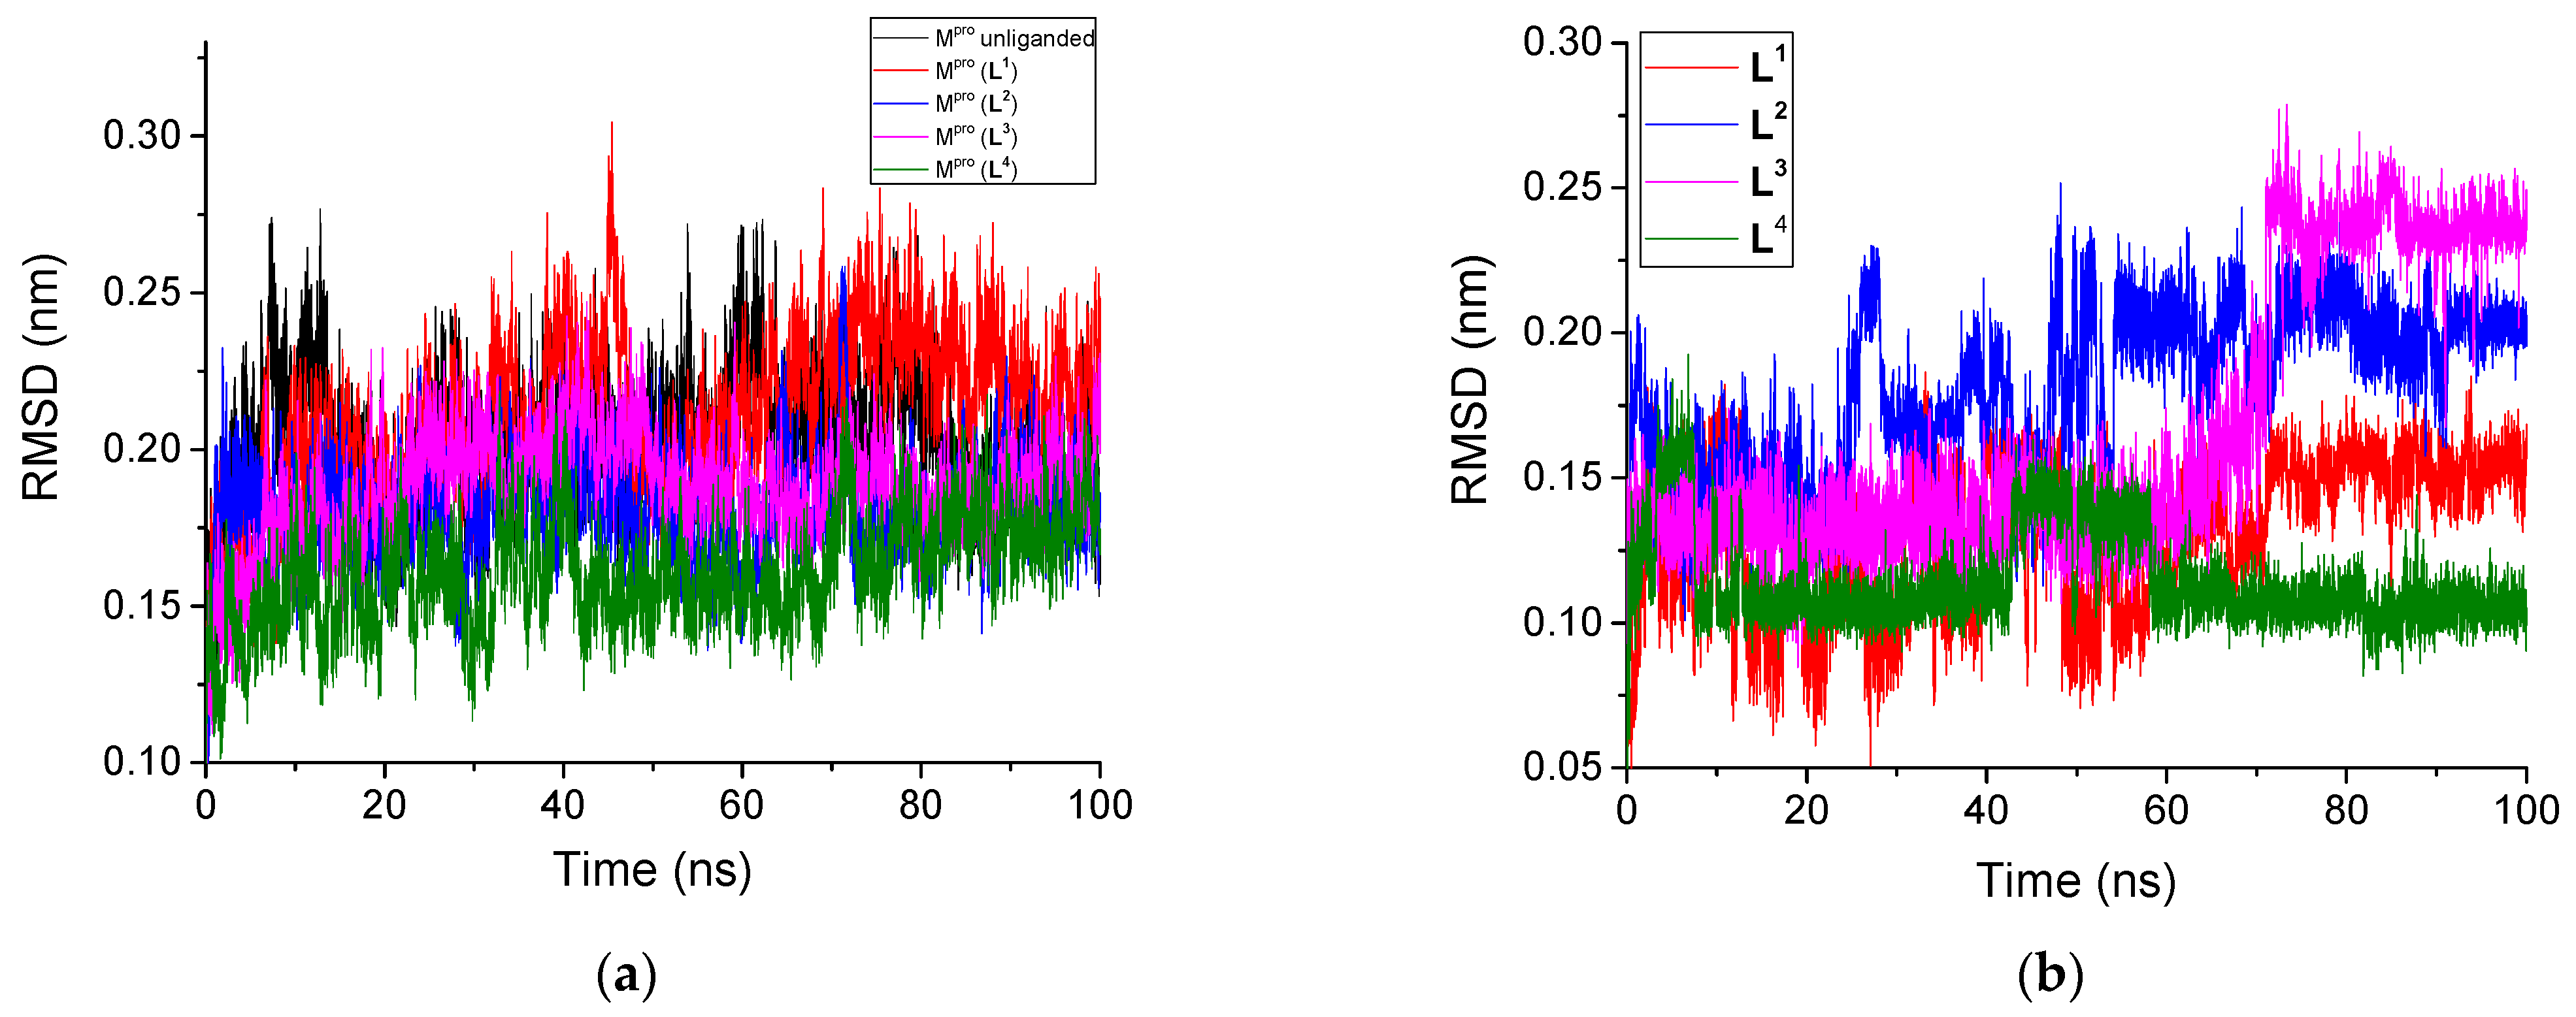
3.2.1. Root Mean Square Deviation
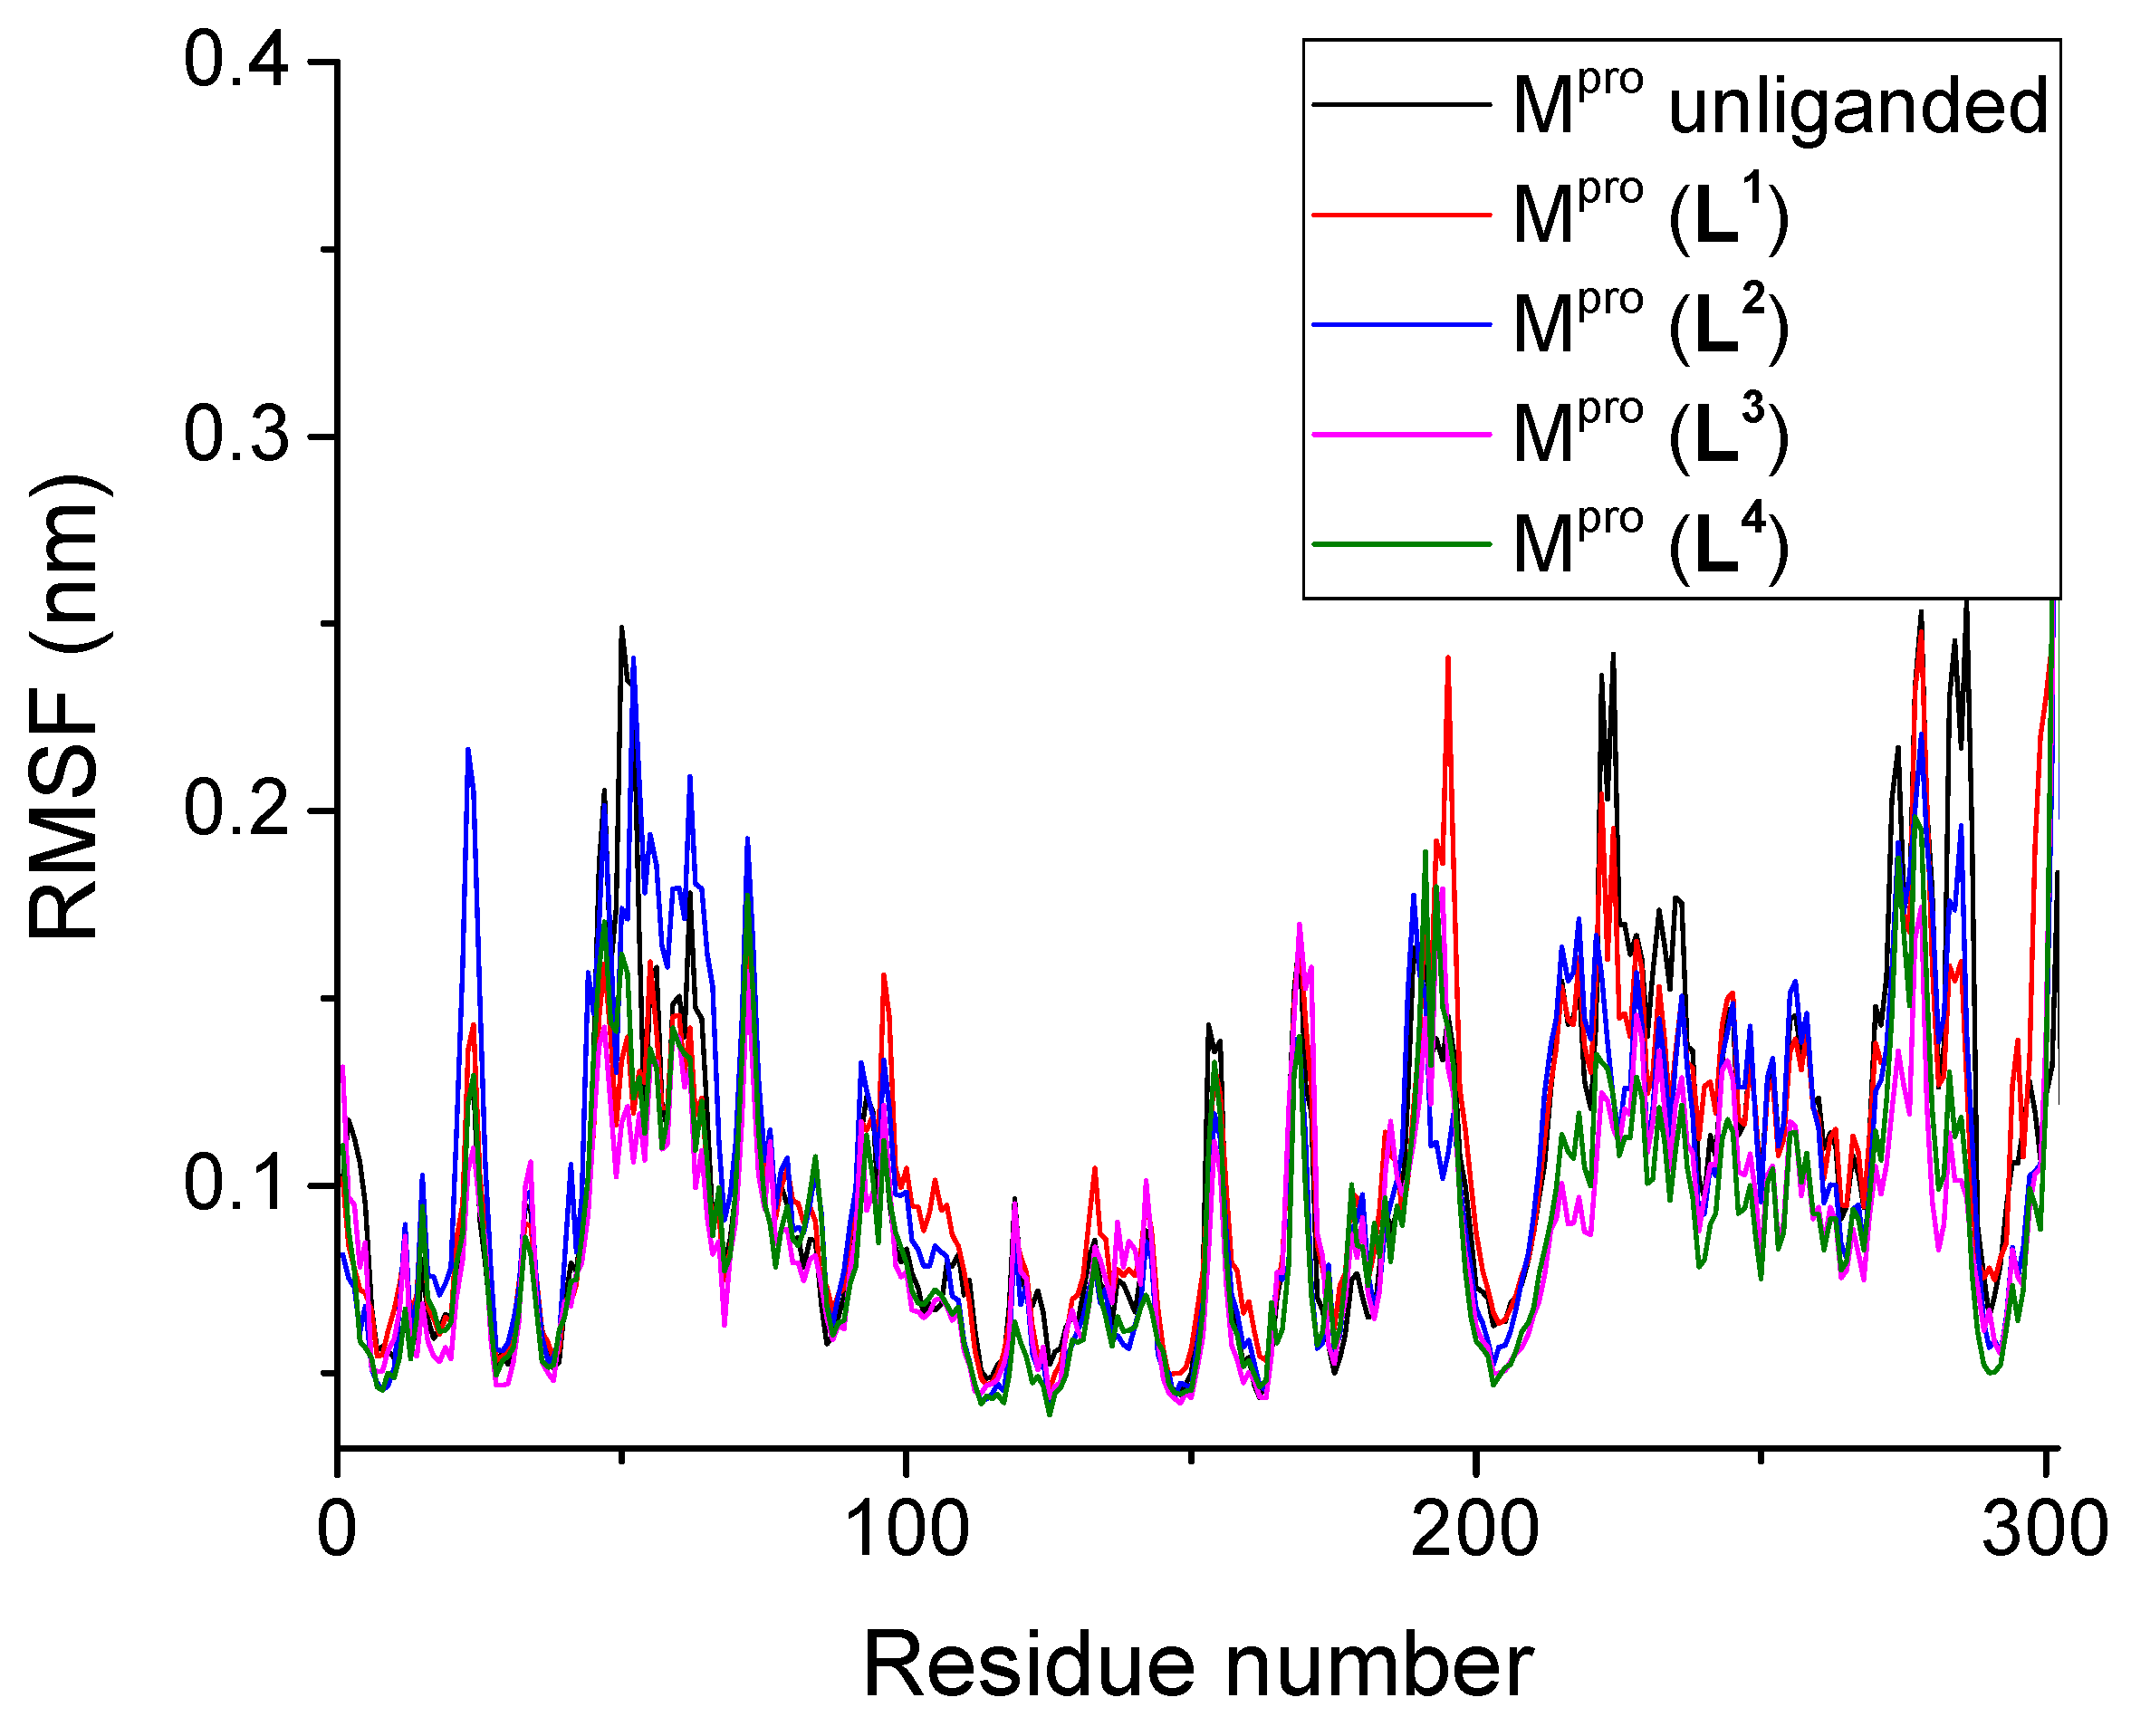
3.2.2. Root Mean Square Fluctuation
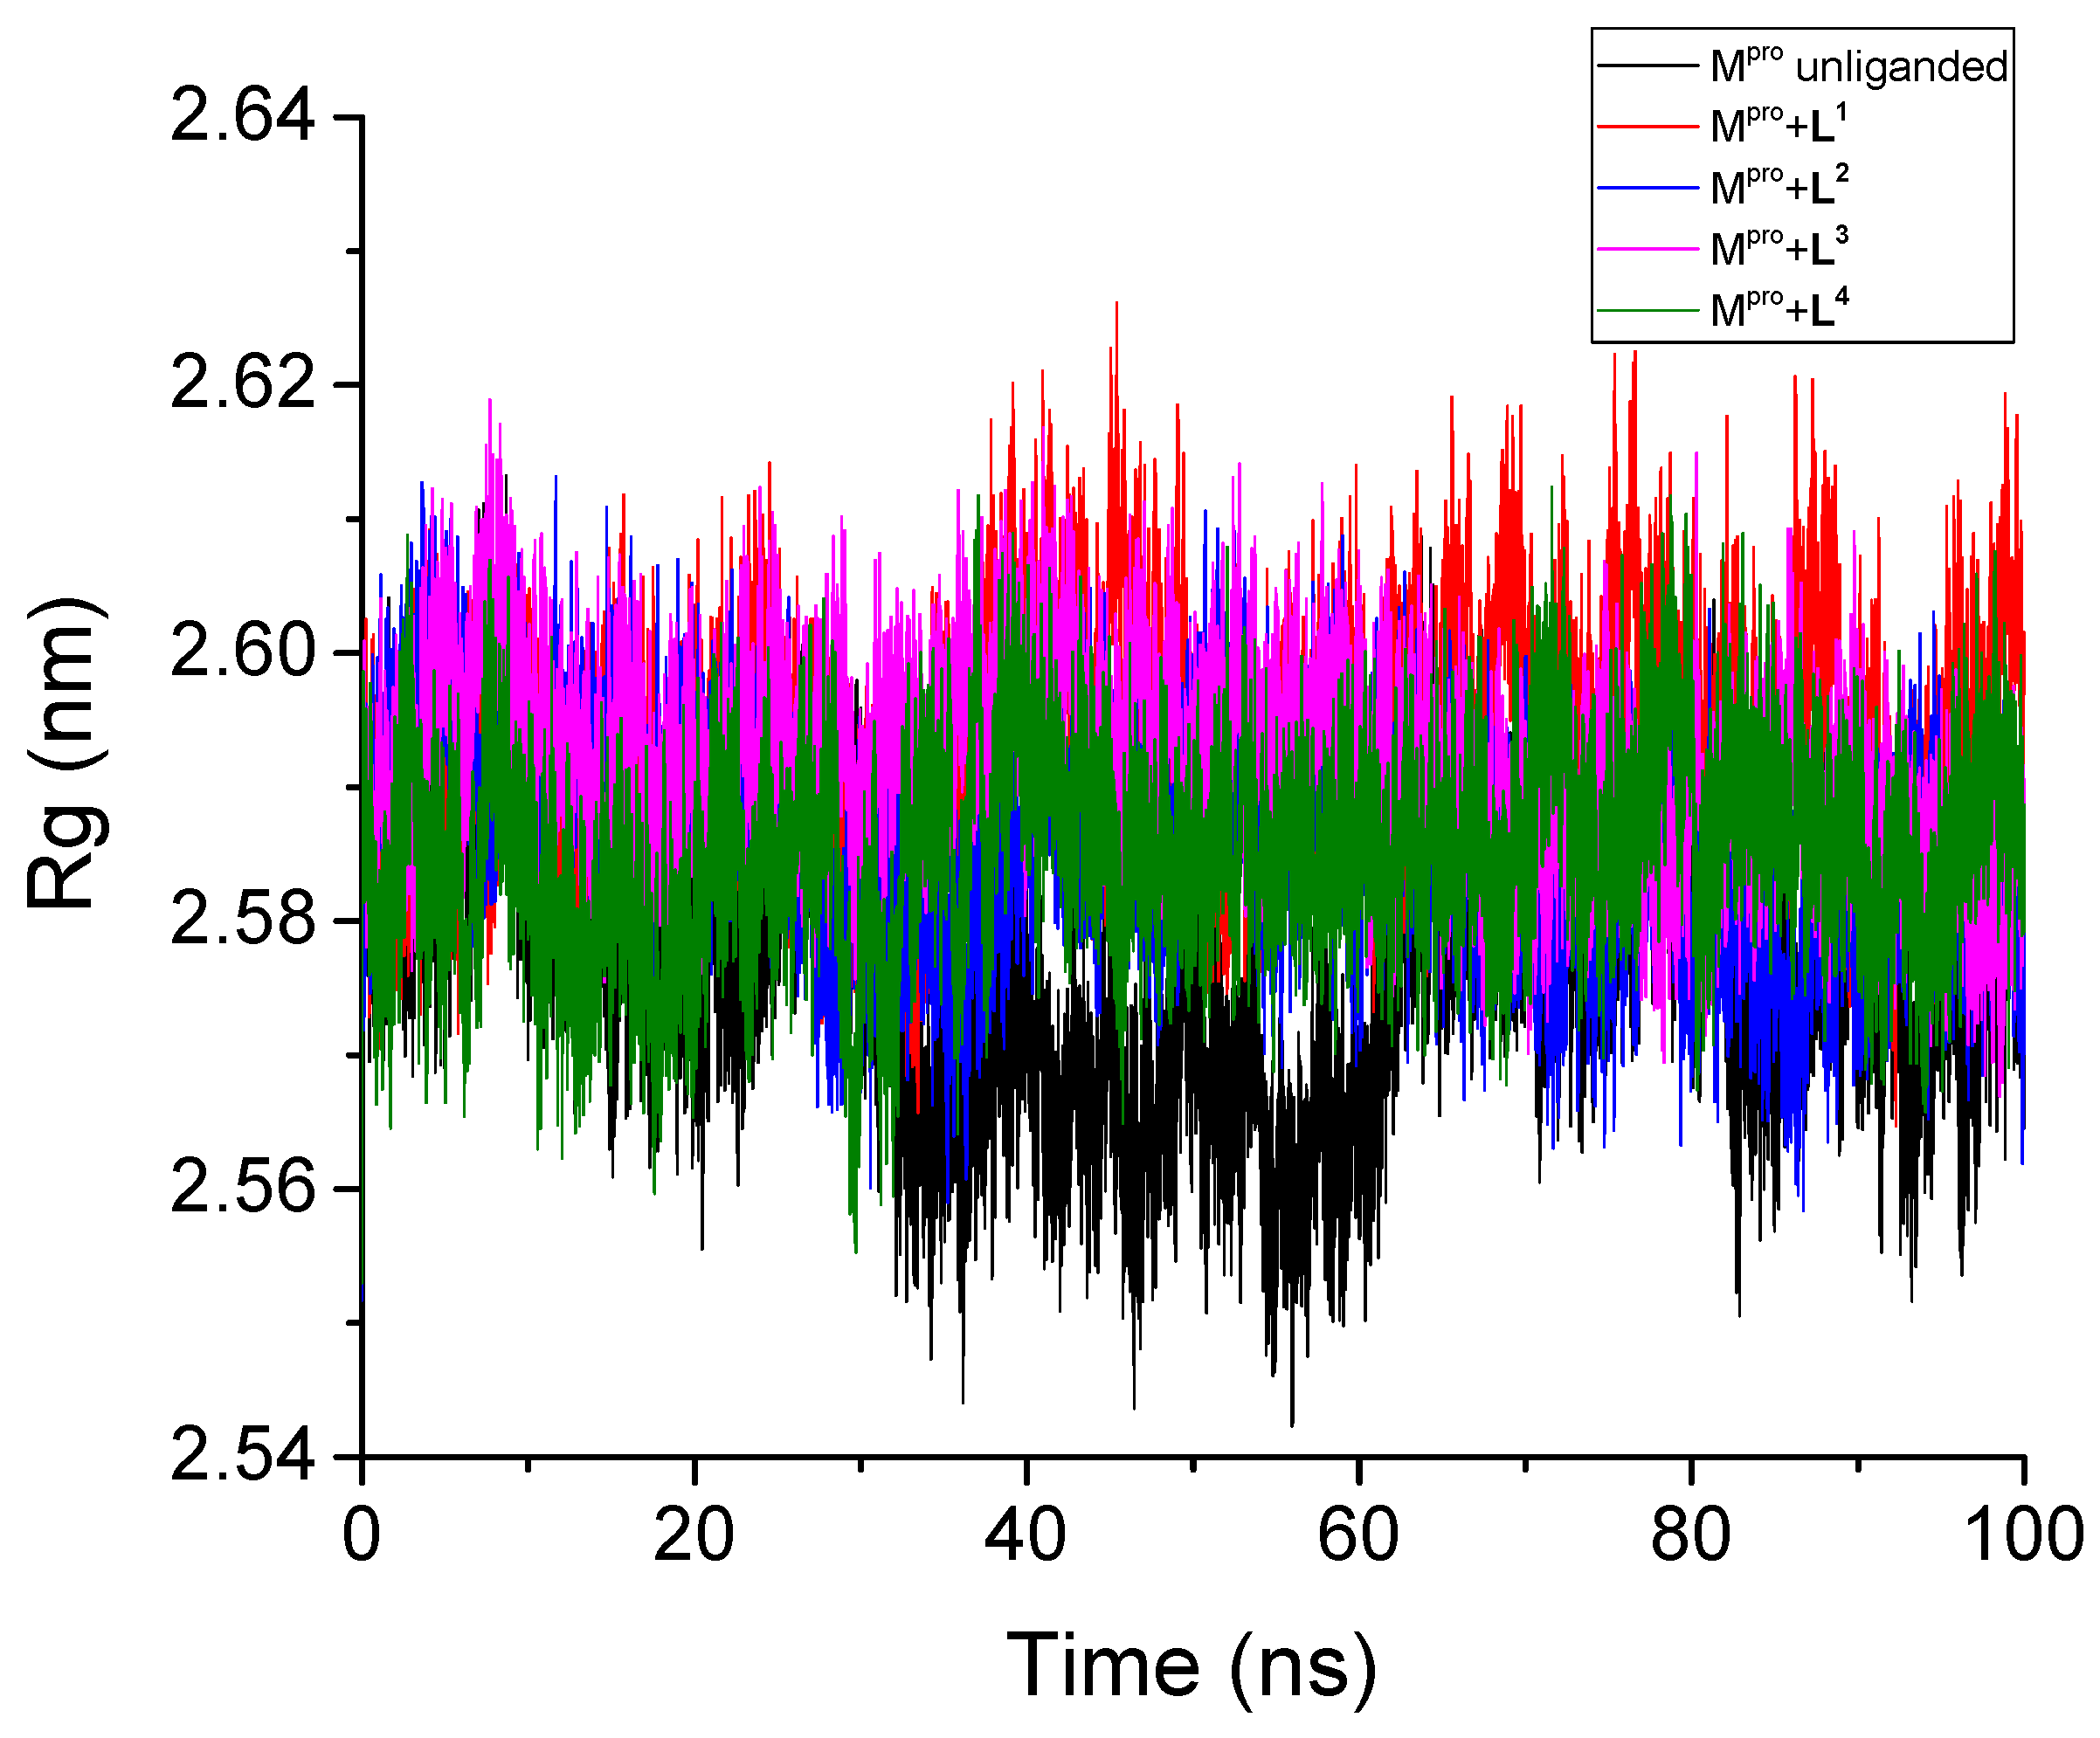
3.2.3. Radius of Gyration
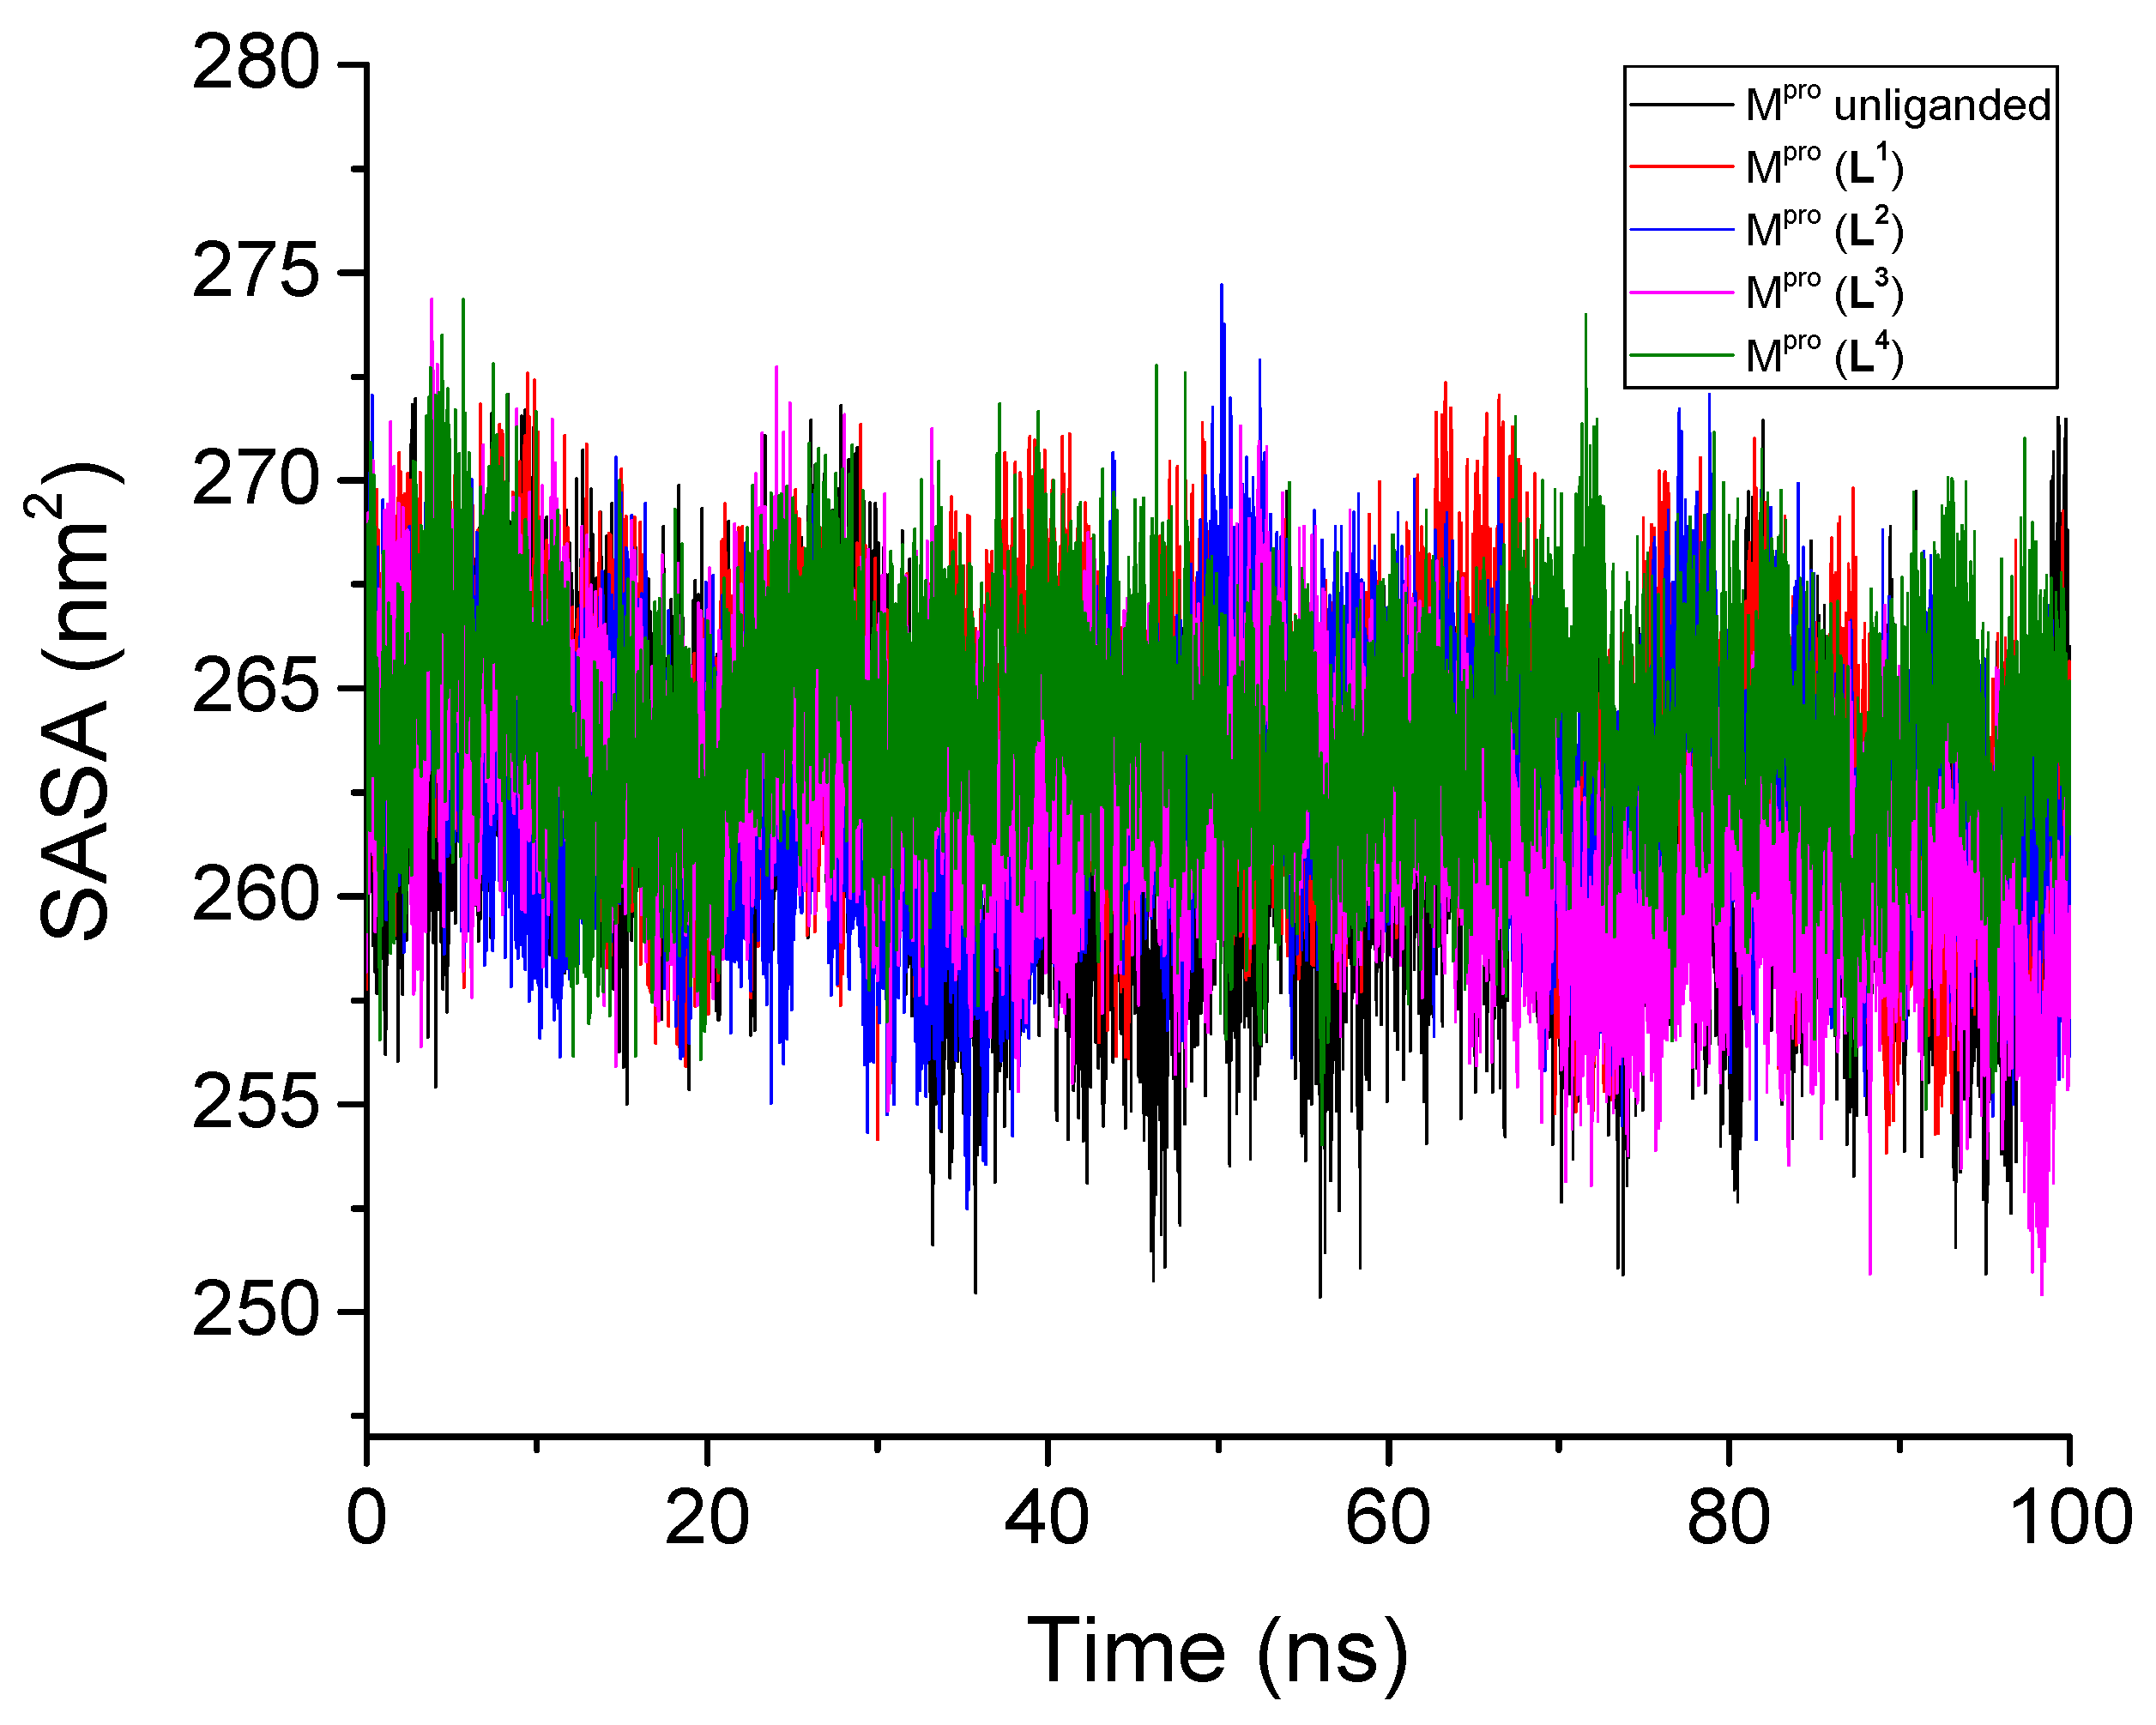
3.2.4. Solvent-Accessible Surface Area
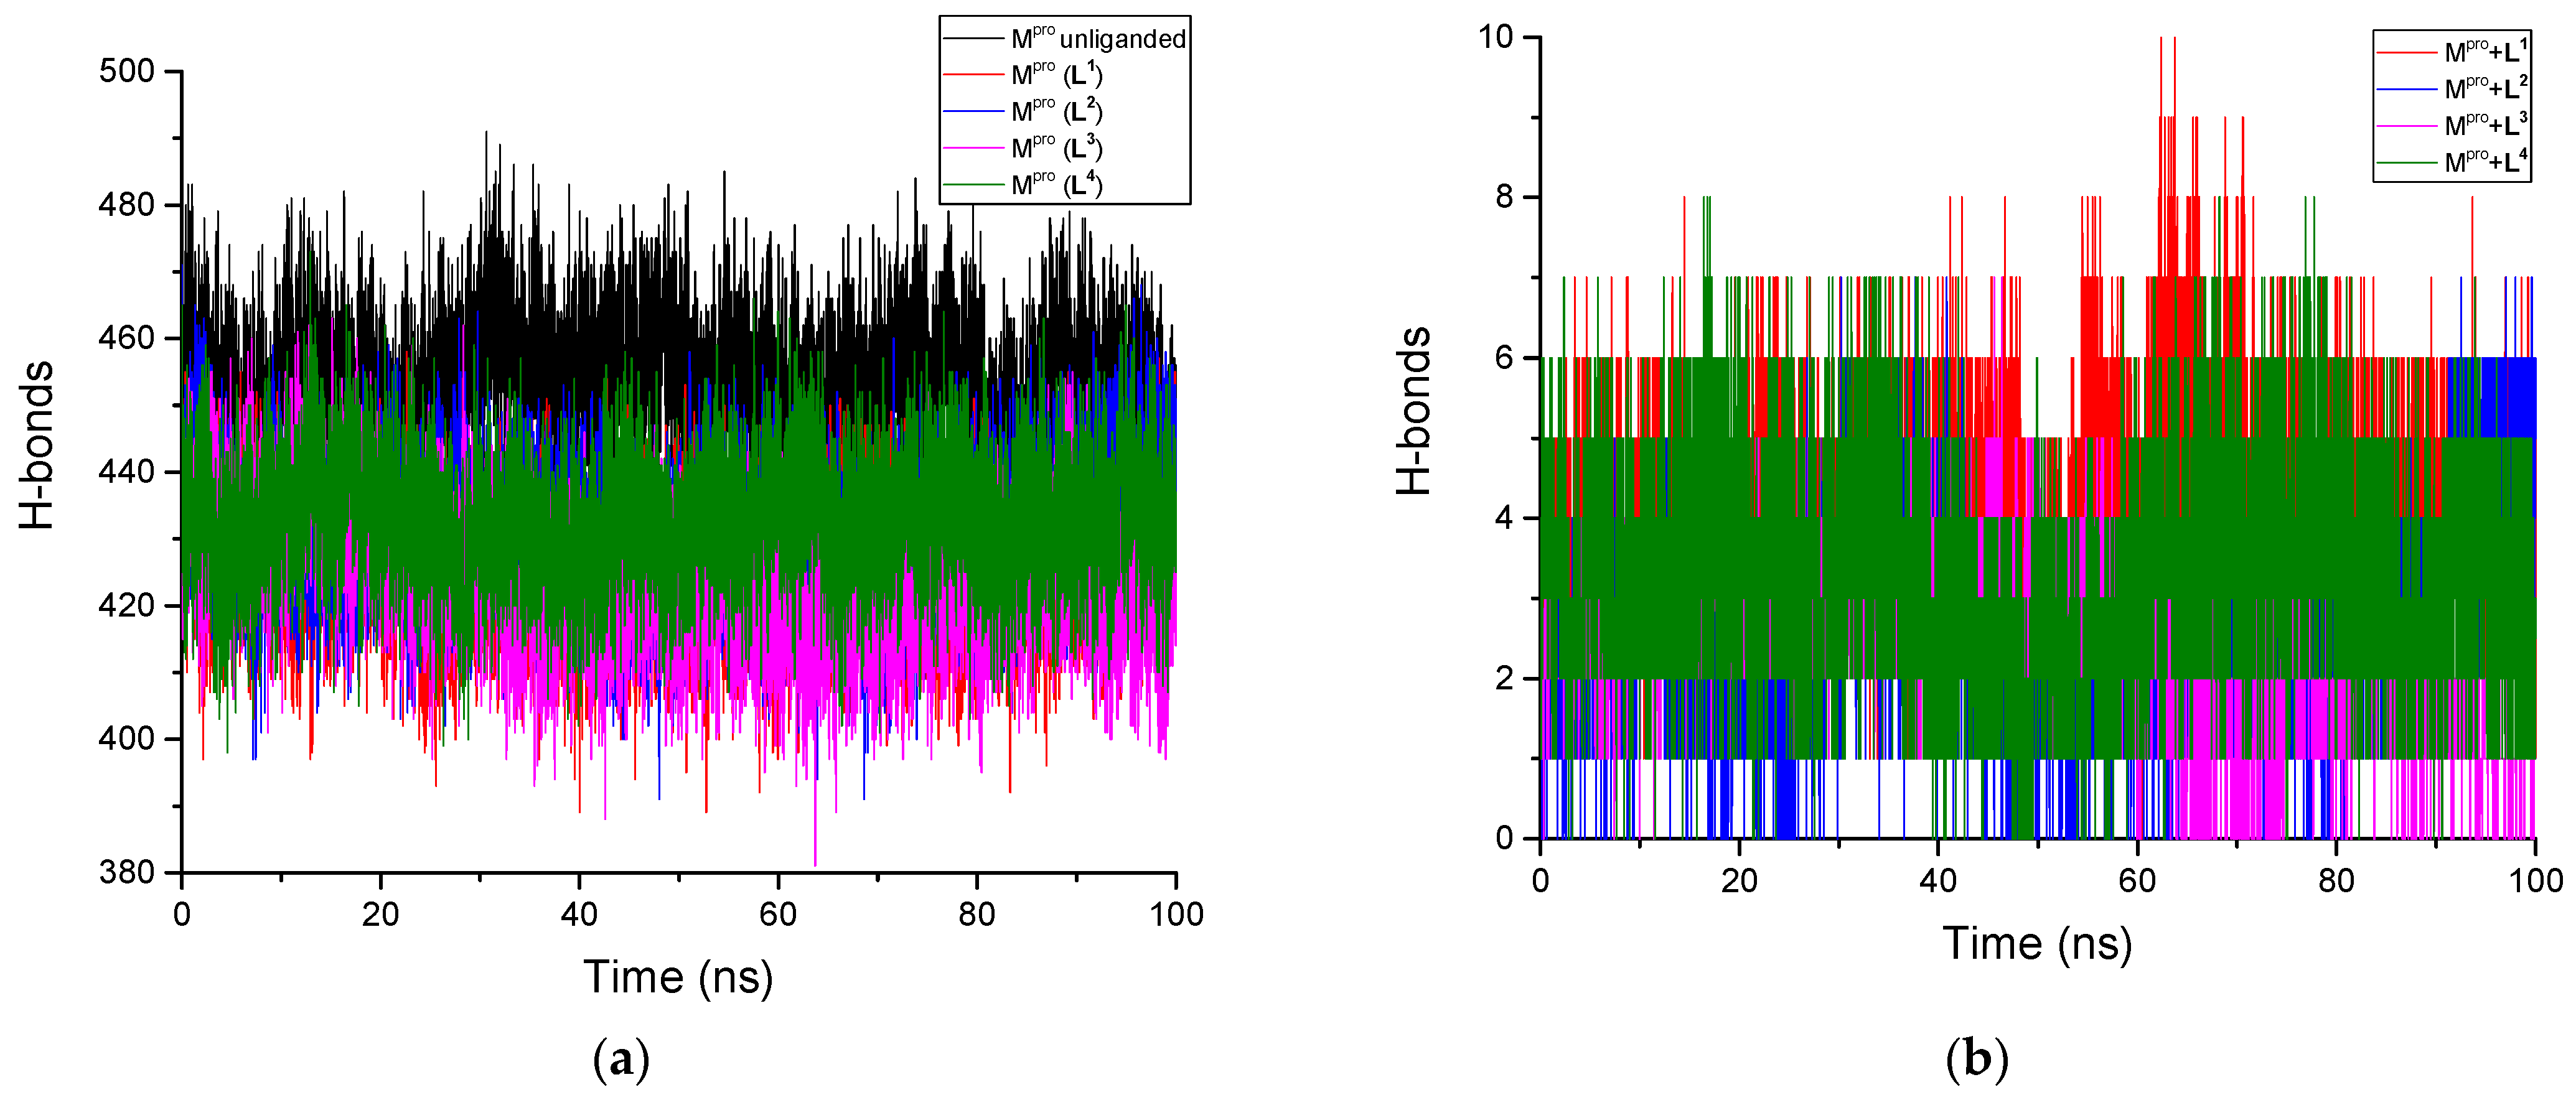
3.2.5. H-Bonds Analysis
3.3. Binding Free Energy
4. Discussion
5. Conclusions
Author Contributions
Funding
Data Availability Statement
Acknowledgments
Conflicts of Interest
Abbreviations
| Abbreviation | Definition |
| ACE2 | Angiotensin-Converting Enzyme 2 |
| CCDC | Cambridge Crystallographic Data Center |
| DFT | Density Functional Theory |
| HIV | Human Immunodeficiency Viruses |
| IR | Infrared Radiation |
| MD | Molecular Dynamic |
| MM/PBSA | Molecular Mechanics/Poisson–Boltzmann Surface Area |
| NSPs | Non-Structural Proteins |
| PME | Particle Mesh Ewald |
| RdRp | RNA-Dependent RNA Polymerase |
| Rg | Radius of Gyration |
| RMSD | Root-Mean-Square Deviation |
| RMSF | Root Mean Square Fluctuation |
| RNA | Ribonucleic Acids |
| SASA | Solvent-Accessible Surface Area |
| SBDD | Structure-Based Drug Design |
| QSAR | Quantitative Structure–Activity Relationship |
| WHO | World Health Organization |
References
- Zhou, P.; Yang, X.L.; Wang, X.G.; Hu, B.; Zhang, L.; Zhang, W.; Si, H.R.; Zhu, Y.; Li, B.; Huang, C.L.; et al. A Pneumonia Outbreak Associated with a New Coronavirus of Probable Bat Origin. Nature 2020, 579, 270–273. [Google Scholar] [CrossRef] [PubMed]
- Wu, F.; Zhao, S.; Yu, B.; Chen, Y.M.; Wang, W.; Song, Z.G.; Hu, Y.; Tao, Z.W.; Tian, J.H.; Pei, Y.Y.; et al. A New Coronavirus Associated with Human Respiratory Disease in China. Nature 2020, 579, 265–269. [Google Scholar] [CrossRef] [PubMed]
- Hui, D.S.; Azhar, E.I.; Madani, T.A.; Ntoumi, F.; Kock, R.; Dar, O.; Ippolito, G.; Mchugh, T.D.; Memish, Z.A.; Drosten, C.; et al. The Continuing 2019-NCoV Epidemic Threat of Novel Coronaviruses to Global Health—The Latest 2019 Novel Coronavirus Outbreak in Wuhan, China. Int. J. Infect. Dis. 2020, 91, 264–266. [Google Scholar] [CrossRef] [PubMed]
- WHO Director-General’s Opening Remarks at the Media Briefing on COVID-19 11 March 2020. Available online: https://www.who.int/director-general/speeches/detail/who-director-general-s-opening-remarks-at-the-media-briefing-on-covid-19---11-march-2020 (accessed on 18 August 2023).
- World Health Organization. From Emergency Response to Long-Term COVID-19 Disease Management: Sustaining Gains Made during the COVID-19 Pandemic; WHO: Geneva, Switzerland, 2023. [Google Scholar]
- Ortiz-Prado, E.; Simbaña-Rivera, K.; Gómez- Barreno, L.; Rubio-Neira, M.; Guaman, L.P.; Kyriakidis, N.C.; Muslin, C.; Jaramillo, A.M.G.; Barba-Ostria, C.; Cevallos-Robalino, D.; et al. Clinical, Molecular, and Epidemiological Characterization of the SARS-CoV-2 Virus and the Coronavirus Disease 2019 (COVID-19), a Comprehensive Literature Review. Diagn. Microbiol. Infect. Dis. 2020, 98, 115094. [Google Scholar] [CrossRef]
- Pan, Y.; Wang, L.; Feng, Z.; Xu, H.; Li, F.; Shen, Y.; Zhang, D.; Liu, W.J.; Gao, G.F.; Wang, Q. Characterisation of SARS-CoV-2 Variants in Beijing during 2022: An Epidemiological and Phylogenetic Analysis. Lancet 2023, 401, 664–672. [Google Scholar] [CrossRef]
- Wu, A.; Peng, Y.; Huang, B.; Ding, X.; Wang, X.; Niu, P.; Meng, J.; Zhu, Z.; Zhang, Z.; Wang, J.; et al. Genome Composition and Divergence of the Novel Coronavirus (2019-NCoV) Originating in China. Cell Host Microbe 2020, 27, 325–328. [Google Scholar] [CrossRef]
- Zhu, N.; Zhang, D.; Wang, W.; Li, X.; Yang, B.; Song, J.; Zhao, X.; Huang, B.; Shi, W.; Lu, R.; et al. A Novel Coronavirus from Patients with Pneumonia in China, 2019. N. Engl. J. Med. 2020, 382, 727–733. [Google Scholar] [CrossRef]
- Wu, C.; Liu, Y.; Yang, Y.; Zhang, P.; Zhong, W.; Wang, Y.; Wang, Q.; Xu, Y.; Li, M.; Li, X.; et al. Analysis of Therapeutic Targets for SARS-CoV-2 and Discovery of Potential Drugs by Computational Methods. Acta Pharm. Sin. B 2020, 10, 766–788. [Google Scholar] [CrossRef]
- Yan, R.; Zhang, Y.; Li, Y.; Xia, L.; Guo, Y.; Zhou, Q. Structural Basis for the Recognition of SARS-CoV-2 by Full-Length Human ACE2. Science 2020, 367, 1444–1448. [Google Scholar] [CrossRef]
- Wang, Q.; Zhang, Y.; Wu, L.; Niu, S.; Song, C.; Zhang, Z.; Lu, G.; Qiao, C.; Hu, Y.; Yuen, K.Y.; et al. Structural and Functional Basis of SARS-CoV-2 Entry by Using Human ACE2. Cell 2020, 181, 894–904.e9. [Google Scholar] [CrossRef]
- Cao, Y.; Li, L.; Feng, Z.; Wan, S.; Huang, P.; Sun, X.; Wen, F.; Huang, X.; Ning, G.; Wang, W. Comparative Genetic Analysis of the Novel Coronavirus (2019-NCoV/SARS-CoV-2) Receptor ACE2 in Different Populations. Cell Discov. 2020, 6, 11. [Google Scholar] [CrossRef] [PubMed]
- Boopathi, S.; Poma, A.B.; Kolandaivel, P. Novel 2019 Coronavirus Structure, Mechanism of Action, Antiviral Drug Promises and Rule out against Its Treatment. J. Biomol. Struct. Dyn. 2021, 39, 3409–3418. [Google Scholar] [CrossRef] [PubMed]
- Marra, M.A.; Jones, S.J.M.; Astell, C.R.; Holt, R.A.; Brooks-Wilson, A.; Butterfield, Y.S.N.; Khattra, J.; Asano, J.K.; Barber, S.A.; Chan, S.Y.; et al. The Genome Sequence of the SARS-Associated Coronavirus. Science 2003, 300, 1399–1404. [Google Scholar] [CrossRef]
- Thiel, V.; Ivanov, K.A.; Putics, Á.; Hertzig, T.; Schelle, B.; Bayer, S.; Weißbrich, B.; Snijder, E.J.; Rabenau, H.; Doerr, H.W.; et al. Mechanisms and Enzymes Involved in SARS Coronavirus Genome Expression. J. Gen. Virol. 2003, 84, 2305–2315. [Google Scholar] [CrossRef] [PubMed]
- Jin, Z.; Du, X.; Xu, Y.; Deng, Y.; Liu, M.; Zhao, Y.; Zhang, B.; Li, X.; Zhang, L.; Peng, C.; et al. Structure of Mpro from SARS-CoV-2 and Discovery of Its Inhibitors. Nature 2020, 582, 289–293. [Google Scholar] [CrossRef]
- Gordon, D.E.; Jang, G.M.; Bouhaddou, M.; Xu, J.; Obernier, K.; White, K.M.; O’Meara, M.J.; Rezelj, V.V.; Guo, J.Z.; Swaney, D.L.; et al. A SARS-CoV-2 Protein Interaction Map Reveals Targets for Drug Repurposing. Nature 2020, 583, 459–468. [Google Scholar] [CrossRef]
- Babadaei, M.M.N.; Hasan, A.; Vahdani, Y.; Bloukh, S.H.; Sharifi, M.; Kachooei, E.; Haghighat, S.; Falahati, M. Development of Remdesivir Repositioning as a Nucleotide Analog against COVID-19 RNA Dependent RNA Polymerase. J. Biomol. Struct. Dyn. 2021, 39, 3771–3779. [Google Scholar] [CrossRef]
- Basit, A.; Ali, T.; Rehman, S.U. Truncated Human Angiotensin Converting Enzyme 2; a Potential Inhibitor of SARS-CoV-2 Spike Glycoprotein and Potent COVID-19 Therapeutic Agent. J. Biomol. Struct. Dyn. 2021, 39, 3605–3614. [Google Scholar] [CrossRef]
- Elfiky, A.A. SARS-CoV-2 RNA Dependent RNA Polymerase (RdRp) Targeting: An in Silico Perspective. J. Biomol. Struct. Dyn. 2021, 39, 3204–3212. [Google Scholar] [CrossRef]
- Hasan, A.; Paray, B.A.; Hussain, A.; Qadir, F.A.; Attar, F.; Aziz, F.M.; Sharifi, M.; Derakhshankhah, H.; Rasti, B.; Mehrabi, M.; et al. A Review on the Cleavage Priming of the Spike Protein on Coronavirus by Angiotensin-Converting Enzyme-2 and Furin. J. Biomol. Struct. Dyn. 2021, 39, 3025–3033. [Google Scholar] [CrossRef]
- Sinha, S.K.; Shakya, A.; Prasad, S.K.; Singh, S.; Gurav, N.S.; Prasad, R.S.; Gurav, S.S. An In-Silico Evaluation of Different Saikosaponins for Their Potency against SARS-CoV-2 Using NSP15 and Fusion Spike Glycoprotein as Targets. J. Biomol. Struct. Dyn. 2021, 39, 3244–3255. [Google Scholar] [CrossRef]
- Badavath, V.N.; Kumar, A.; Samanta, P.K.; Maji, S.; Das, A.; Blum, G.; Jha, A.; Sen, A. Determination of Potential Inhibitors Based on Isatin Derivatives against SARS-CoV-2 Main Protease (mpro): A Molecular Docking, Molecular Dynamics and Structure-Activity Relationship Studies. J. Biomol. Struct. Dyn. 2022, 40, 3110–3128. [Google Scholar] [CrossRef]
- Fan, H.H.; Wang, L.Q.; Liu, W.L.; An, X.P.; Liu, Z.D.; He, X.Q.; Song, L.H.; Tong, Y.G. Repurposing of Clinically Approved Drugs for Treatment of Coronavirus Disease 2019 in a 2019-Novel Coronavirus-Related Coronavirus Model. Chin. Med. J. 2020, 133, 1051–1056. [Google Scholar] [CrossRef]
- Liu, X.; Wang, X.J. Potential Inhibitors against 2019-NCoV Coronavirus M Protease from Clinically Approved Medicines. J. Genet. Genom. 2020, 47, 119–121. [Google Scholar] [CrossRef]
- Ghosh, A.K.; Osswald, H.L.; Prato, G. Recent Progress in the Development of HIV-1 Protease Inhibitors for the Treatment of HIV/AIDS. J. Med. Chem. 2016, 59, 5172–5208. [Google Scholar] [CrossRef]
- Yang, S.; Chen, S.J.; Hsu, M.F.; Wu, J.D.; Tseng, C.T.K.; Liu, Y.F.; Chen, H.C.; Kuo, C.W.; Wu, C.S.; Chang, L.W.; et al. Synthesis, Crystal Structure, Structure-Activity Relationships, and Antiviral Activity of a Potent SARS Coronavirus 3CL Protease Inhibitor. J. Med. Chem. 2006, 49, 4971–4980. [Google Scholar] [CrossRef]
- Ullrich, S.; Nitsche, C. The SARS-CoV-2 Main Protease as Drug Target. Bioorg. Med. Chem. Lett. 2020, 30, 127377. [Google Scholar] [CrossRef]
- Zhang, L.; Lin, D.; Sun, X.; Curth, U.; Drosten, C.; Sauerhering, L.; Becker, S.; Rox, K.; Hilgenfeld, R. Crystal Structure of SARS-CoV-2 Main Protease Provides a Basis for Design of Improved a-Ketoamide Inhibitors. Science 2020, 368, 409–412. [Google Scholar] [CrossRef]
- St. John, S.E.; Tomar, S.; Stauffer, S.R.; Mesecar, A.D. Targeting Zoonotic Viruses: Structure-Based Inhibition of the 3C-like Protease from Bat Coronavirus HKU4—The Likely Reservoir Host to the Human Coronavirus That Causes Middle East Respiratory Syndrome (MERS). Bioorg. Med. Chem. 2015, 23, 6036–6048. [Google Scholar] [CrossRef]
- Mengist, H.M.; Dilnessa, T.; Jin, T. Structural Basis of Potential Inhibitors Targeting SARS-CoV-2 Main Protease. Front. Chem. 2021, 9, 622898. [Google Scholar] [CrossRef] [PubMed]
- Dai, W.; Zhang, B.; Jiang, X.M.; Su, H.; Li, J.; Zhao, Y.; Xie, X.; Jin, Z.; Peng, J.; Liu, F.; et al. Structure-Based Design of Antiviral Drug Candidates Targeting the SARS-CoV-2 Main Protease. Science 2020, 368, 1331–1335. [Google Scholar] [CrossRef]
- Lee, J.; Kenward, C.; Worrall, L.J.; Vuckovic, M.; Gentile, F.; Ton, A.-T.; Ng, M.; Cherkasov, A.; Strynadka, N.C.J.; Paetzel, M. X-Ray Crystallographic Characterization of the SARS-CoV-2 Main Protease Polyprotein Cleavage Sites Essential for Viral Processing and Maturation. Nat. Commun. 2022, 13, 5196. [Google Scholar] [CrossRef] [PubMed]
- Tong, J.B.; Luo, D.; Xu, H.Y.; Bian, S.; Zhang, X.; Xiao, X.C.; Wang, J.; Tong, J.B. A Computational Approach for Designing Novel SARS-CoV-2 Mproinhibitors: Combined QSAR, Molecular Docking, and Molecular Dynamics Simulation Techniques. N. J. Chem. 2021, 45, 11512–11529. [Google Scholar] [CrossRef]
- Kumar, Y.; Singh, H.; Patel, C.N. In Silico Prediction of Potential Inhibitors for the Main Protease of SARS-CoV-2 Using Molecular Docking and Dynamics Simulation Based Drug-Repurposing. J. Infect. Public Health 2020, 13, 1210–1223. [Google Scholar] [CrossRef] [PubMed]
- Tejera, E.; Munteanu, C.R.; López-Cortés, A.; Cabrera-Andrade, A.; Pérez-Castillo, Y. Drugs Repurposing Using QSAR, Docking and Molecular Dynamics for Possible Inhibitors of the SARS-CoV-2 Mpro Protease. Molecules 2020, 25, 5172. [Google Scholar] [CrossRef] [PubMed]
- Ma, C.; Sacco, M.D.; Hurst, B.; Townsend, J.A.; Hu, Y.; Szeto, T.; Zhang, X.; Tarbet, B.; Marty, M.T.; Chen, Y.; et al. Boceprevir, GC-376, and Calpain Inhibitors II, XII Inhibit SARS-CoV-2 Viral Replication by Targeting the Viral Main Protease. Cell Res. 2020, 30, 678–692. [Google Scholar] [CrossRef] [PubMed]
- Sacco, M.D.; Ma, C.; Lagarias, P.; Gao, A.; Townsend, J.A.; Meng, X.; Dube, P.; Zhang, X.; Hu, Y.; Kitamura, N.; et al. Structure and Inhibition of the SARS-CoV-2 Main Protease Reveal Strategy for Developing Dual Inhibitors against Mpro and Cathepsin L. Sci. Adv. 2020, 6, eabe0751. [Google Scholar] [CrossRef] [PubMed]
- Tsuji, M.; Tsuji, C.M. Potential Anti-SARS-CoV-2 Drug Candidates Identified through Virtual Screening of the ChEMBL Database for Compounds That Target the Main Coronavirus Protease. FEBS Open Bio 2020, 10, 995–1004. [Google Scholar] [CrossRef]
- Zhou, Y.; Hou, Y.; Shen, J.; Huang, Y.; Martin, W.; Cheng, F. Network-Based Drug Repurposing for Novel Coronavirus 2019-NCoV/SARS-CoV-2. Cell Discov. 2020, 6, 14. [Google Scholar] [CrossRef]
- Nukoolkarn, V.; Lee, V.S.; Malaisree, M.; Aruksakulwong, O.; Hannongbua, S. Molecular Dynamic Simulations Analysis of Ritronavir and Lopinavir as SARS-CoV 3CLpro Inhibitors. J. Theor. Biol. 2008, 254, 861–867. [Google Scholar] [CrossRef]
- Wang, Y.; Zhang, D.; Du, G.; Du, R.; Zhao, J.; Jin, Y.; Fu, S.; Gao, L.; Cheng, Z.; Lu, Q.; et al. Remdesivir in Adults with Severe COVID-19: A Randomised, Double-Blind, Placebo-Controlled, Multicentre Trial. Lancet 2020, 395, 1569–1578. [Google Scholar] [CrossRef] [PubMed]
- Eastman, R.T.; Roth, J.S.; Brimacombe, K.R.; Simeonov, A.; Shen, M.; Patnaik, S.; Hall, M.D. Remdesivir: A Review of Its Discovery and Development Leading to Emergency Use Authorization for Treatment of COVID-19. ACS Cent. Sci. 2020, 6, 672–683. [Google Scholar] [CrossRef] [PubMed]
- Wang, M.; Cao, R.; Zhang, L.; Yang, X.; Liu, J.; Xu, M.; Shi, Z.; Hu, Z.; Zhong, W.; Xiao, G. Remdesivir and Chloroquine Effectively Inhibit the Recently Emerged Novel Coronavirus (2019-NCoV) In Vitro. Cell Res. 2020, 30, 269–271. [Google Scholar] [CrossRef] [PubMed]
- Sharma, P.; Joshi, T.; Mathpal, S.; Joshi, T.; Pundir, H.; Chandra, S.; Tamta, S. Identification of Natural Inhibitors against Mpro of SARS-CoV-2 by Molecular Docking, Molecular Dynamics Simulation, and MM/PBSA Methods. J. Biomol. Struct. Dyn. 2022, 40, 2757–2768. [Google Scholar] [CrossRef]
- Aanouz, I.; Belhassan, A.; El-Khatabi, K.; Lakhlifi, T.; El-ldrissi, M.; Bouachrine, M. Moroccan Medicinal Plants as Inhibitors against SARS-CoV-2 Main Protease: Computational Investigations. J. Biomol. Struct. Dyn. 2021, 39, 2971–2979. [Google Scholar] [CrossRef] [PubMed]
- Krishna Cheerala, V.S.; Ghanta, P.; Neelakantan, S.C. Design, Synthesis and in Silico Screening of Benzoxazole–Thiazolidinone Hybrids as Potential Inhibitors of SARS-CoV-2 Proteases. RSC Adv. 2021, 11, 39328–39342. [Google Scholar] [CrossRef]
- Patel, U.; Desai, K.; Dabhi, R.C.; Maru, J.J.; Shrivastav, P.S. Bioprospecting Phytochemicals of Rosmarinus officinalis L. for Targeting SARS-CoV-2 Main Protease (Mpro): A Computational Study. J. Mol. Model. 2023, 29, 161. [Google Scholar] [CrossRef]
- Ghosh, R.; Chakraborty, A.; Biswas, A.; Chowdhuri, S. Evaluation of Green Tea Polyphenols as Novel Corona Virus (SARS CoV-2) Main Protease (Mpro) Inhibitors—An in Silico Docking and Molecular Dynamics Simulation Study. J. Biomol. Struct. Dyn. 2021, 39, 4362–4374. [Google Scholar] [CrossRef]
- Aggarwal, G.; Henry, B.M.; Aggarwal, S.; Bangalore, S. Cardiovascular Safety of Potential Drugs for the Treatment of Coronavirus Disease 2019. Am. J. Cardiol. 2020, 128, 147–150. [Google Scholar] [CrossRef]
- Khan, Z.; Karataş, Y.; Rahman, H. Anti COVID-19 Drugs: Need for More Clinical Evidence and Global Action. Adv. Ther. 2020, 37, 2575–2579. [Google Scholar] [CrossRef]
- Javorac, D.; Grahovac, L.; Manić, L.; Stojilković, N.; Anđelković, M.; Bulat, Z.; Đukić-Ćosić, D.; Curcic, M.; Djordjevic, A.B. An Overview of the Safety Assessment of Medicines Currently Used in the COVID-19 Disease Treatment. Food Chem. Toxicol. 2020, 144, 111639. [Google Scholar] [CrossRef] [PubMed]
- Muralidharan, N.; Sakthivel, R.; Velmurugan, D.; Gromiha, M.M. Computational Studies of Drug Repurposing and Synergism of Lopinavir, Oseltamivir and Ritonavir Binding with SARS-CoV-2 Protease against COVID-19. J. Biomol. Struct. Dyn. 2021, 39, 2673–2678. [Google Scholar] [CrossRef] [PubMed]
- Avti, P.; Chauhan, A.; Shekhar, N.; Prajapat, M.; Sarma, P.; Kaur, H.; Bhattacharyya, A.; Kumar, S.; Prakash, A.; Sharma, S.; et al. Computational Basis of SARS-CoV 2 Main Protease Inhibition: An Insight from Molecular Dynamics Simulation Based Findings. J. Biomol. Struct. Dyn. 2022, 40, 8894–8904. [Google Scholar] [CrossRef] [PubMed]
- Khan, S.A.; Zia, K.; Ashraf, S.; Uddin, R.; Ul-Haq, Z. Identification of Chymotrypsin-like Protease Inhibitors of SARS-CoV-2 via Integrated Computational Approach. J. Biomol. Struct. Dyn. 2021, 39, 2607–2616. [Google Scholar] [CrossRef] [PubMed]
- Kumar, R.; Serrette, J.M.; Thompson, E.B. Osmolyte-Induced Folding Enhances Tryptic Enzyme Activity. Arch. Biochem. Biophys. 2005, 436, 78–82. [Google Scholar] [CrossRef] [PubMed]
- Kumari, R.; Kumar, V.; Dhankhar, P.; Dalal, V. Promising Antivirals for PLpro of SARS-CoV-2 Using Virtual Screening, Molecular Docking, Dynamics, and MMPBSA. J. Biomol. Struct. Dyn. 2023, 41, 4650–4666. [Google Scholar] [CrossRef] [PubMed]
- Kumar, K.A.; Sharma, M.; Dalal, V.; Singh, V.; Tomar, S.; Kumar, P. Multifunctional Inhibitors of SARS-CoV-2 by MM/PBSA, Essential Dynamics, and Molecular Dynamic Investigations. J. Mol. Graph. Model. 2021, 107, 107969. [Google Scholar] [CrossRef] [PubMed]
- Costanzi, E.; Kuzikov, M.; Esposito, F.; Albani, S.; Demitri, N.; Giabbai, B.; Camasta, M.; Tramontano, E.; Rossetti, G.; Zaliani, A.; et al. Structural and Biochemical Analysis of the Dual Inhibition of MG-132 against SARS-CoV-2 Main Protease (Mpro/3CLpro) and Human Cathepsin-L. Int. J. Mol. Sci. 2021, 22, 11779. [Google Scholar] [CrossRef]
- Batool, M.; Ahmad, B.; Choi, S. A Structure-Based Drug Discovery Paradigm. Int. J. Mol. Sci. 2019, 20, 2783. [Google Scholar] [CrossRef]
- Banerjee, R.; Perera, L.; Tillekeratne, L.M.V. Potential SARS-CoV-2 Main Protease Inhibitors. Drug Discov. Today 2021, 26, 804–816. [Google Scholar] [CrossRef]
- Fischer, C.; Feys, J.R. SARS-CoV-2 Mpro Inhibitors: Achieved Diversity, Developing Resistance and Future Strategies. Fut. Pharmacol. 2023, 3, 80–107. [Google Scholar] [CrossRef]
- Citarella, A.; Scala, A.; Piperno, A.; Micale, N. SARS-CoV-2 Mpro: A Potential Target for Peptidomimetics and Small-Molecule Inhibitors. Biomolecules 2021, 11, 607. [Google Scholar] [CrossRef] [PubMed]
- Zabo, S.; Lobb, K.A. In Silico Substrate-Binding Profiling for SARS-CoV-2 Main Protease (Mpro) Using Hexapeptide Substrates. Viruses 2023, 15, 1480. [Google Scholar] [CrossRef] [PubMed]
- Stoddard, S.V.; Stoddard, S.D.; Oelkers, B.K.; Fitts, K.; Whalum, K.; Whalum, K.; Hemphill, A.D.; Manikonda, J.; Martinez, L.M.; Riley, E.G.; et al. Optimization Rules for SARS-CoV-2 Mpro Antivirals: Ensemble Docking and Exploration of the Coronavirus Protease Active Site. Viruses 2020, 12, 942. [Google Scholar] [CrossRef] [PubMed]
- Lipinski, C.A. Lead- and Drug-like Compounds: The Rule-of-Five Revolution. Drug Discov. Today Technol. 2004, 1, 337–341. [Google Scholar] [CrossRef] [PubMed]
- Kenny, P.W. Hydrogen-Bond Donors in Drug Design. J. Med. Chem. 2022, 65, 14261–14275. [Google Scholar] [CrossRef]
- Yarovaya, O.I.; Shcherbakov, D.N.; Borisevich, S.S.; Sokolova, A.S.; Gureev, M.A.; Khamitov, E.M.; Rudometova, N.B.; Zybkina, A.V.; Mordvinova, E.D.; Zaykovskaya, A.V.; et al. Borneol Ester Derivatives as Entry Inhibitors of a Wide Spectrum of SARS-CoV-2 Viruses. Viruses 2022, 14, 1295. [Google Scholar] [CrossRef]
- Verdonk, M.L.; Cole, J.C.; Hartshorn, M.J.; Murray, C.W.; Taylor, R.D. Improved Protein-Ligand Docking Using GOLD. Proteins Struct. Funct. Bioinform. 2003, 52, 609–623. [Google Scholar] [CrossRef]
- Frisch, M.J.; Trucks, G.W.; Schlegel, H.B.; Scuseria, G.E.; Robb, M.A.; Cheeseman, J.R.; Scalmani, G.; Barone, V.; Petersson, G.A.; Nakatsuji, H.; et al. Gaussian 16 2016. Available online: https://gaussian.com/ (accessed on 8 January 2024).
- Andrienko, G.A. Chemcraft—Graphical Software for Visualization of Quantum Chemistry Computations. Available online: https://www.chemcraftprog.com/ (accessed on 1 July 2023).
- BIOVIA Discovery Studio 2021 Visualizer. Available online: https://www.3ds.com/products/biovia (accessed on 8 January 2024).
- Abraham, M.J.; Murtola, T.; Schulz, R.; Páll, S.; Smith, J.C.; Hess, B.; Lindahl, E. GROMACS: High Performance Molecular Simulations through Multi-Level Parallelism from Laptops to Supercomputers. SoftwareX 2015, 1–2, 19–25. [Google Scholar] [CrossRef]
- Dodda, L.S.; Cabeza de Vaca, I.; Tirado-Rives, J.; Jorgensen, W.L. LigParGen Web Server: An Automatic OPLS-AA Parameter Generator for Organic Ligands. Nucleic Acids Res. 2017, 45, W331–W336. [Google Scholar] [CrossRef]
- Berendsen, H.J.C.; Grigera, J.R.; Straatsma, T.P. The Missing Term in Effective Pair Potentials. J. Phys. Chem. 1987, 91, 6269–6271. [Google Scholar] [CrossRef]
- Bussi, G.; Donadio, D.; Parrinello, M. Canonical Sampling through Velocity Rescaling. J. Chem. Phys. 2007, 126, 014101. [Google Scholar] [CrossRef] [PubMed]
- Bernetti, M.; Bussi, G. Pressure Control Using Stochastic Cell Rescaling. J. Chem. Phys. 2020, 153, 114107. [Google Scholar] [CrossRef] [PubMed]
- Hess, B.; Bekker, H.; Berendsen, H.J.C.; Fraaije, J.G.E.M. LINCS: A Linear Constraint Solver for Molecular Simulations. J. Comput. Chem. 1997, 18, 1463–1472. [Google Scholar] [CrossRef]
- Parrinello, M.; Rahman, A. Polymorphic Transitions in Single Crystals: A New Molecular Dynamics Method. J. Appl. Phys. 1981, 52, 7182–7190. [Google Scholar] [CrossRef]
- Essmann, U.; Perera, L.; Berkowitz, M.L.; Darden, T.; Lee, H.; Pedersen, L.G. A Smooth Particle Mesh Ewald Method. J. Chem. Phys. 1995, 103, 8577–8593. [Google Scholar] [CrossRef]
- Kumari, R.; Kumar, R.; Lynn, A. G_mmpbsa—A GROMACS Tool for High-Throughput MM-PBSA Calculations. J. Chem. Inf. Model. 2014, 54, 1951–1962. [Google Scholar] [CrossRef]


| Abbreviation | Structure | Binding Groups | Amino Acids Residue |
|---|---|---|---|
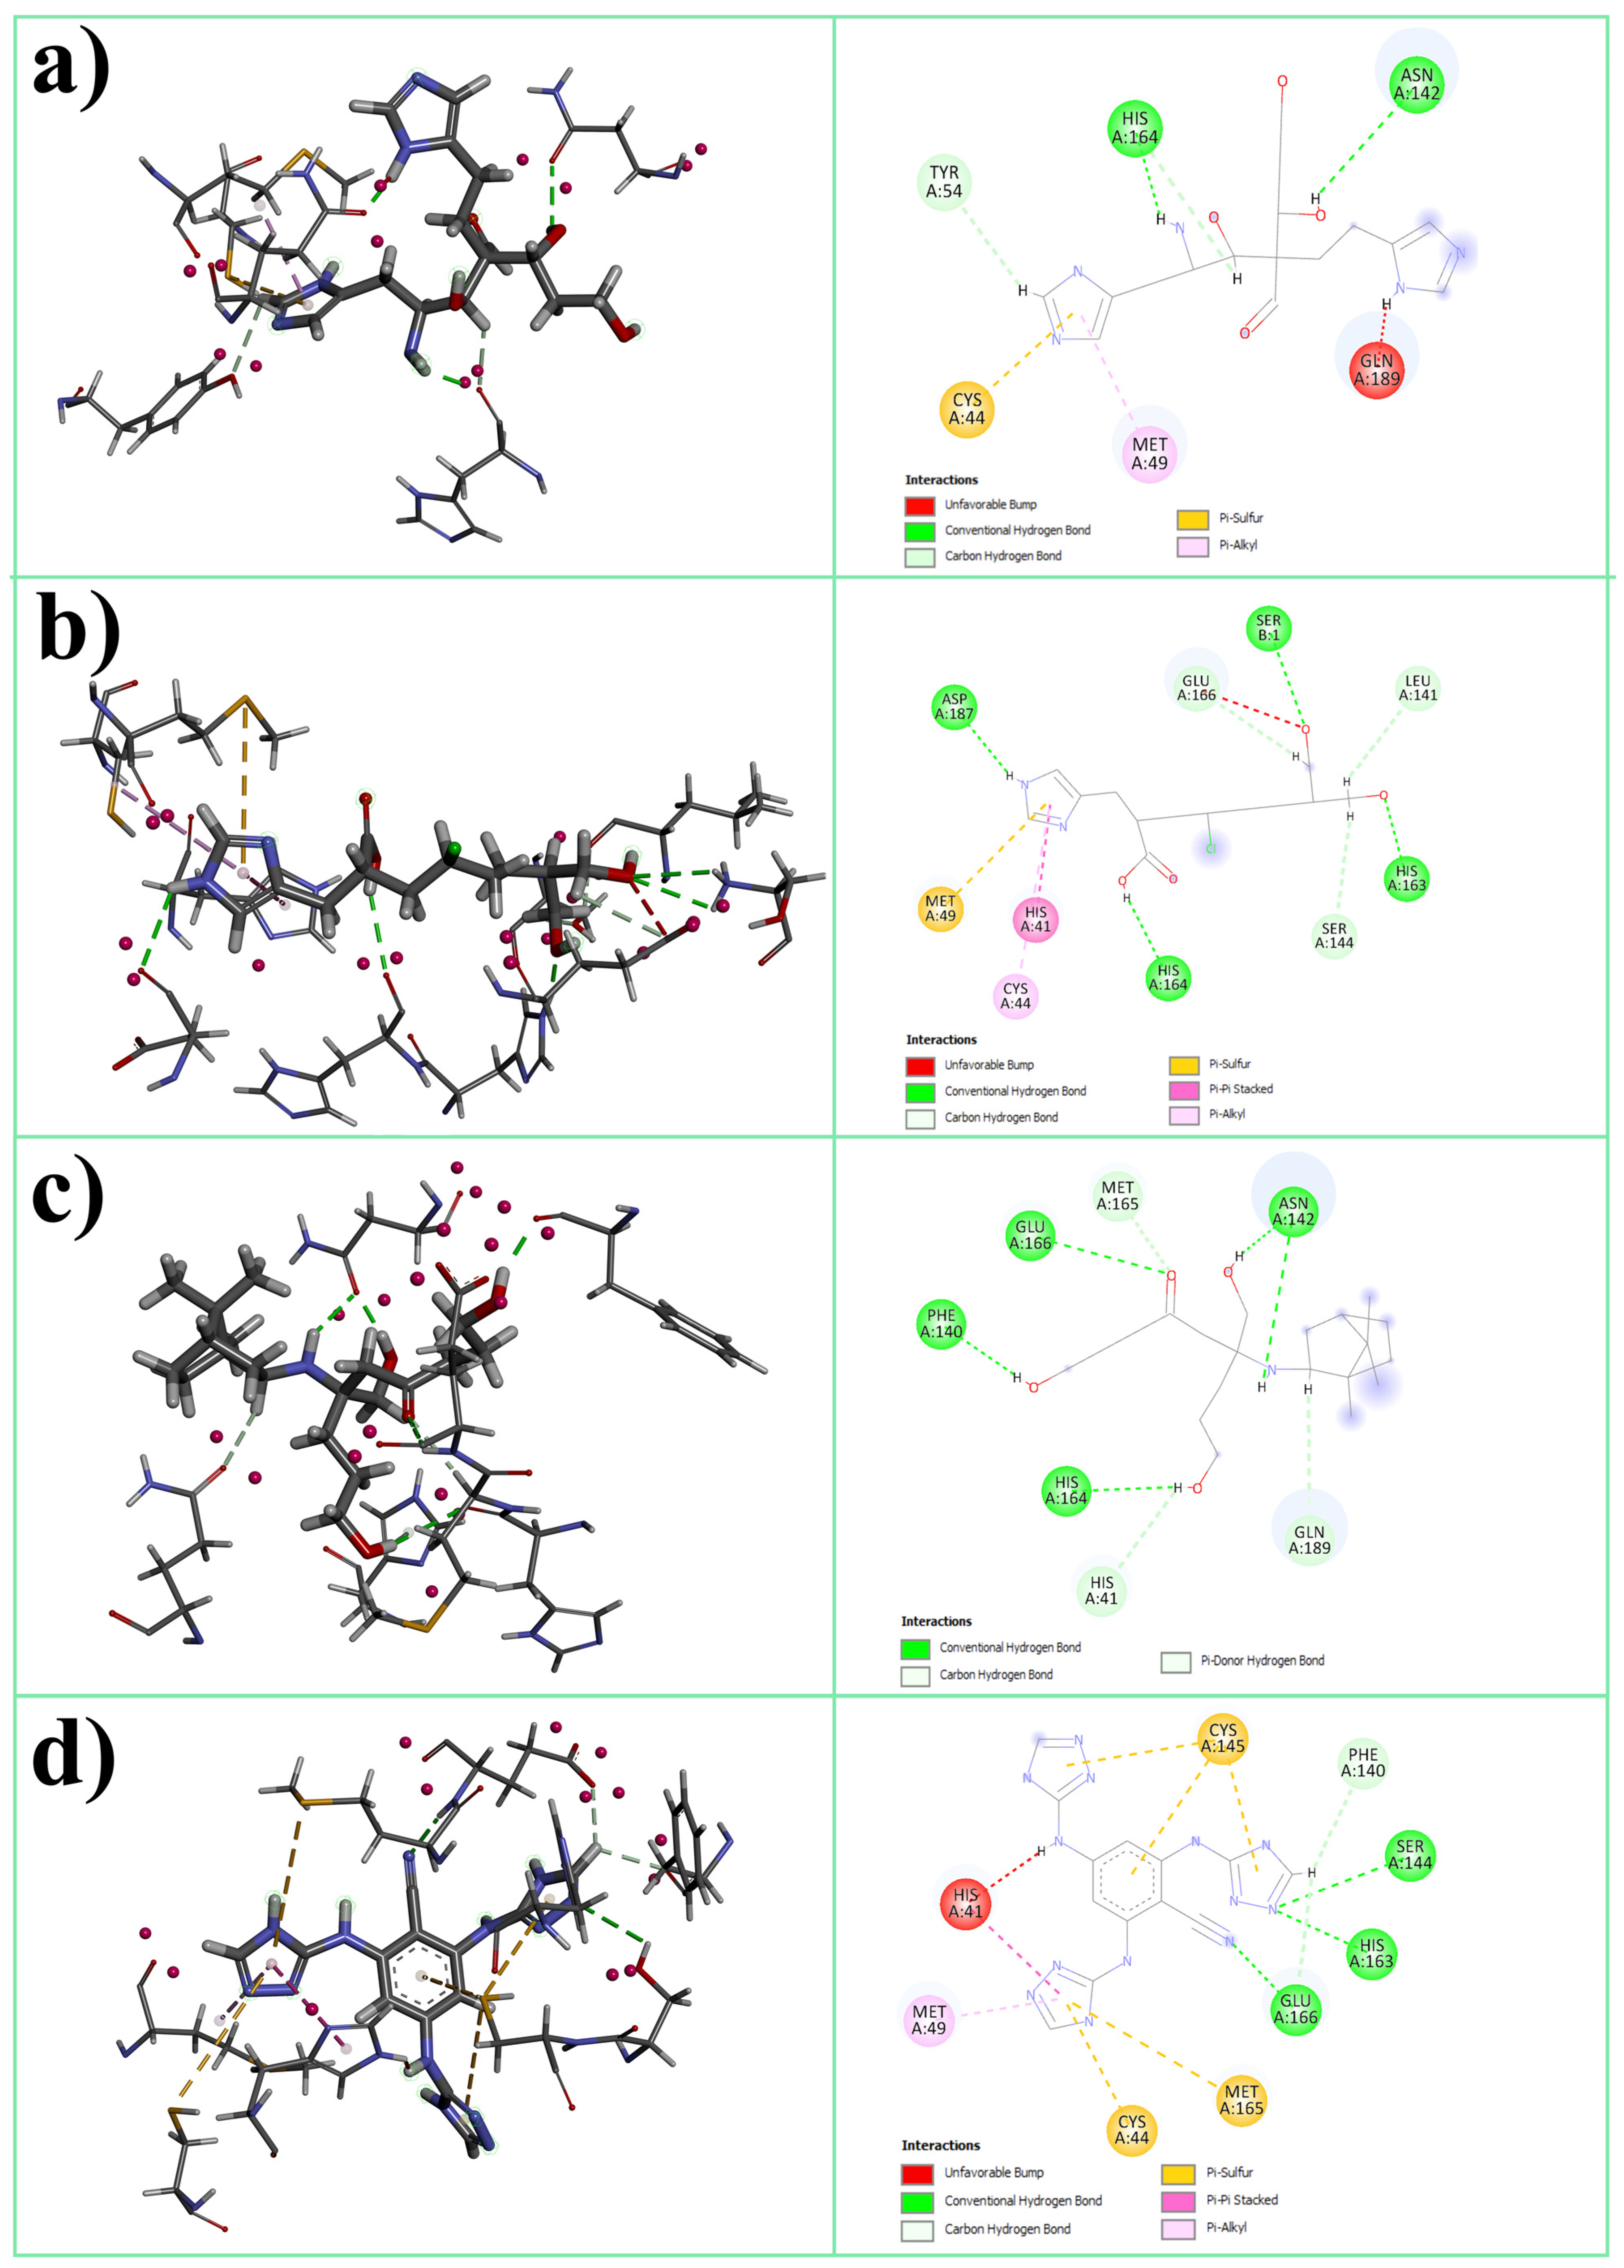
| L1 |  | 5-(1H-imidazol-5-yl) (blue) | Ser144, His163 |
| 2-(1H-imidazol-5-yl) (red) | Gln189 | ||
| OH-group (green) | His41 | ||
| L2 |  | imidazolyl ring | His41, His164 |
| carboxyl group | Met165 | ||
| OH-groups | Ser144, His163, Glu166 | ||
| L3 |  | main OH-containing group with CO | Glu166, Met165 |
| short OH-containing group without CO | His163 | ||
| camphoryl group | located in S2 groove | ||
| OH-containing group without CO | Asp142 | ||
| L4 |  | triazolyl rings in orto-position | His41 |
| triazolyl ring in para-position | Ser144 |
| L1 | L2 | L3 | L4 | |
|---|---|---|---|---|
| ASP | 30.2693 | 27.4447 | 23.2161 | 36.1228 |
| ChemScore | 1.9658 | 6.3231 | 7.6813 | 15.7884 |
| Sum | 32.2351 | 33.7678 | 30.8974 | 51.9112 |
| System | RMSD, nm | RMSF, nm | Rg, nm | SASA, nm2 | H-Bonds Number | |||
|---|---|---|---|---|---|---|---|---|
| Protein | Ligand | Protein | Burried * | Intra-Protein | Ligand-Protein | |||
| Unliganded Mpro | 0.201 | - | 0.109 | 2.58 | 261.49 | - | 452.8 | - |
| Mpro + L1 | 0.211 | 0.130 | 0.107 | 2.59 | 263.64 | 6.66 | 425.5 | 4.3 |
| Mpro + L2 | 0.180 | 0.181 | 0.100 | 2.59 | 262.58 | 6.97 | 430.7 | 2.3 |
| Mpro + L3 | 0.188 | 0.167 | 0.096 | 2.59 | 262.03 | 6.93 | 424.6 | 2.4 |
| Mpro + L4 | 0.161 | 0.115 | 0.088 | 2.59 | 264.03 | 7.53 | 433.1 | 3.2 |
| Energy Term, kJ/mol | ||||||
|---|---|---|---|---|---|---|
| System | ||||||
| L1 | −141.203 ± 2.142 | −94.304 ± 2.490 | 167.428 ± 2.311 | −16.778 ± 0.135 | −84.858 ± 2.662 | |
| L2 | −130.295 ± 2.078 | −61.892 ± 3.220 | 143.489 ± 2.465 | −17.239 ± 0.152 | −65.937 ± 3.063 | |
| L3 | −125.815 ± 1.630 | −37.209 ± 2.021 | 108.833 ± 1.962 | −17.010 ± 0.158 | −71.201 ± 2.110 | |
| L4 | −164.479 ± 1.641 | −45.442 ± 1.985 | 134.414 ± 1.843 | −18.085 ± 0.137 | −93.592 ± 1.994 | |
Disclaimer/Publisher’s Note: The statements, opinions and data contained in all publications are solely those of the individual author(s) and contributor(s) and not of MDPI and/or the editor(s). MDPI and/or the editor(s) disclaim responsibility for any injury to people or property resulting from any ideas, methods, instructions or products referred to in the content. |
© 2024 by the authors. Licensee MDPI, Basel, Switzerland. This article is an open access article distributed under the terms and conditions of the Creative Commons Attribution (CC BY) license (https://creativecommons.org/licenses/by/4.0/).
Share and Cite
Kolybalov, D.S.; Kadtsyn, E.D.; Arkhipov, S.G. Computer Aided Structure-Based Drug Design of Novel SARS-CoV-2 Main Protease Inhibitors: Molecular Docking and Molecular Dynamics Study. Computation 2024, 12, 18. https://doi.org/10.3390/computation12010018
Kolybalov DS, Kadtsyn ED, Arkhipov SG. Computer Aided Structure-Based Drug Design of Novel SARS-CoV-2 Main Protease Inhibitors: Molecular Docking and Molecular Dynamics Study. Computation. 2024; 12(1):18. https://doi.org/10.3390/computation12010018
Chicago/Turabian StyleKolybalov, Dmitry S., Evgenii D. Kadtsyn, and Sergey G. Arkhipov. 2024. "Computer Aided Structure-Based Drug Design of Novel SARS-CoV-2 Main Protease Inhibitors: Molecular Docking and Molecular Dynamics Study" Computation 12, no. 1: 18. https://doi.org/10.3390/computation12010018