
Genomic Phylogeny Using the MaxwellTM Classifier Based on Burrows–Wheeler Transform

 ,
,
Abstract
:1. Introduction
2. Materials and Methods
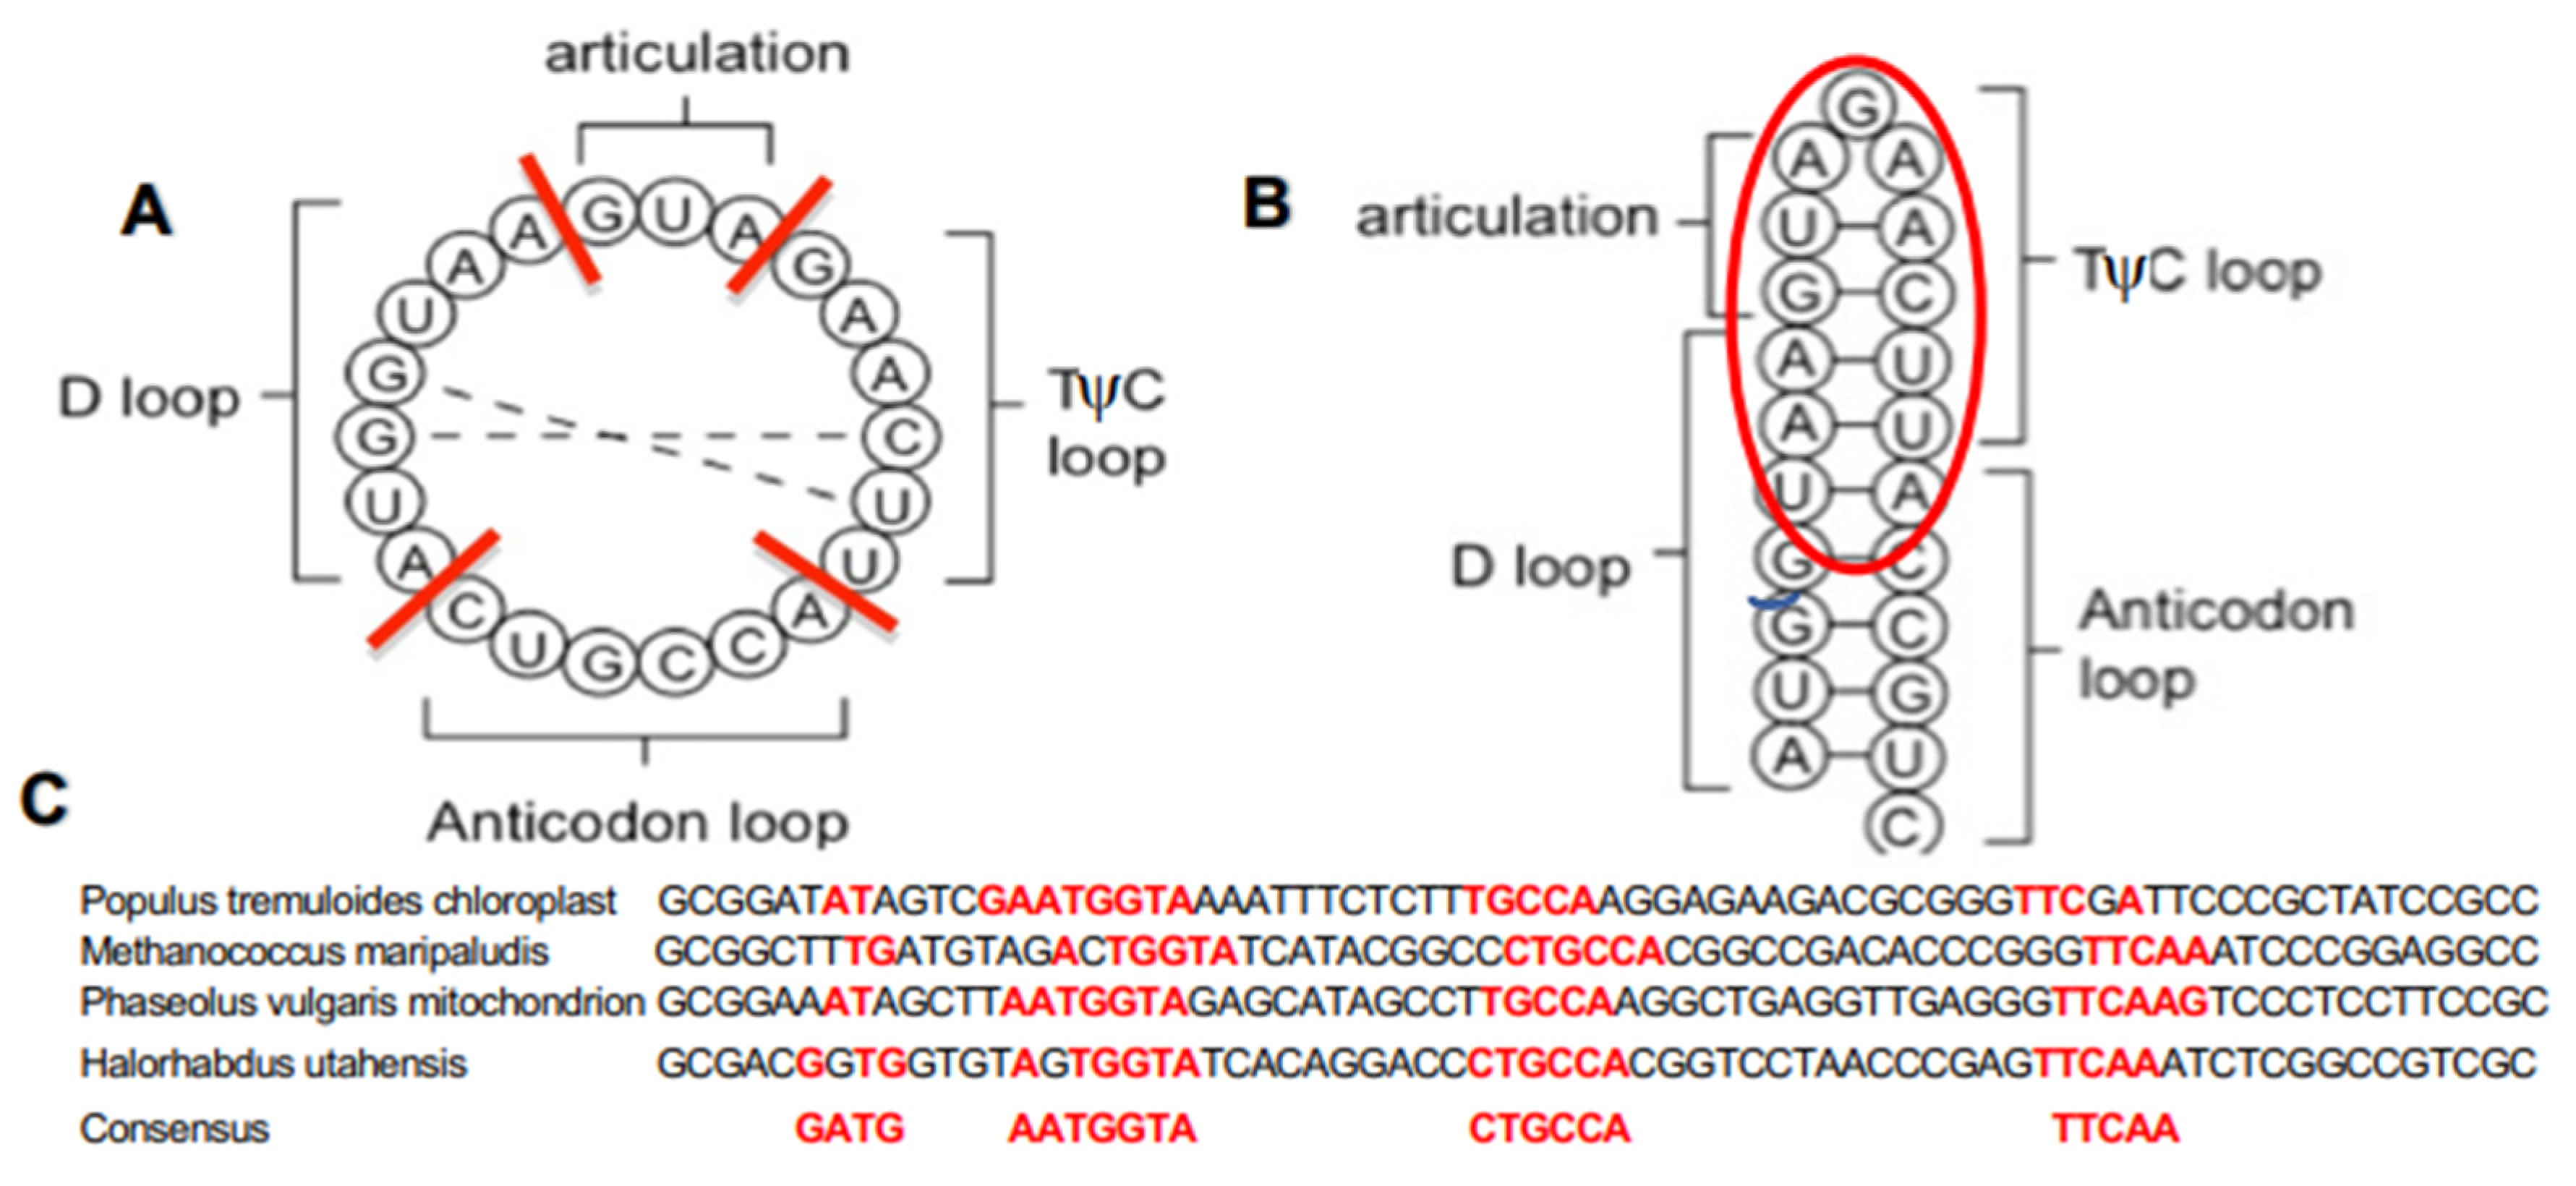
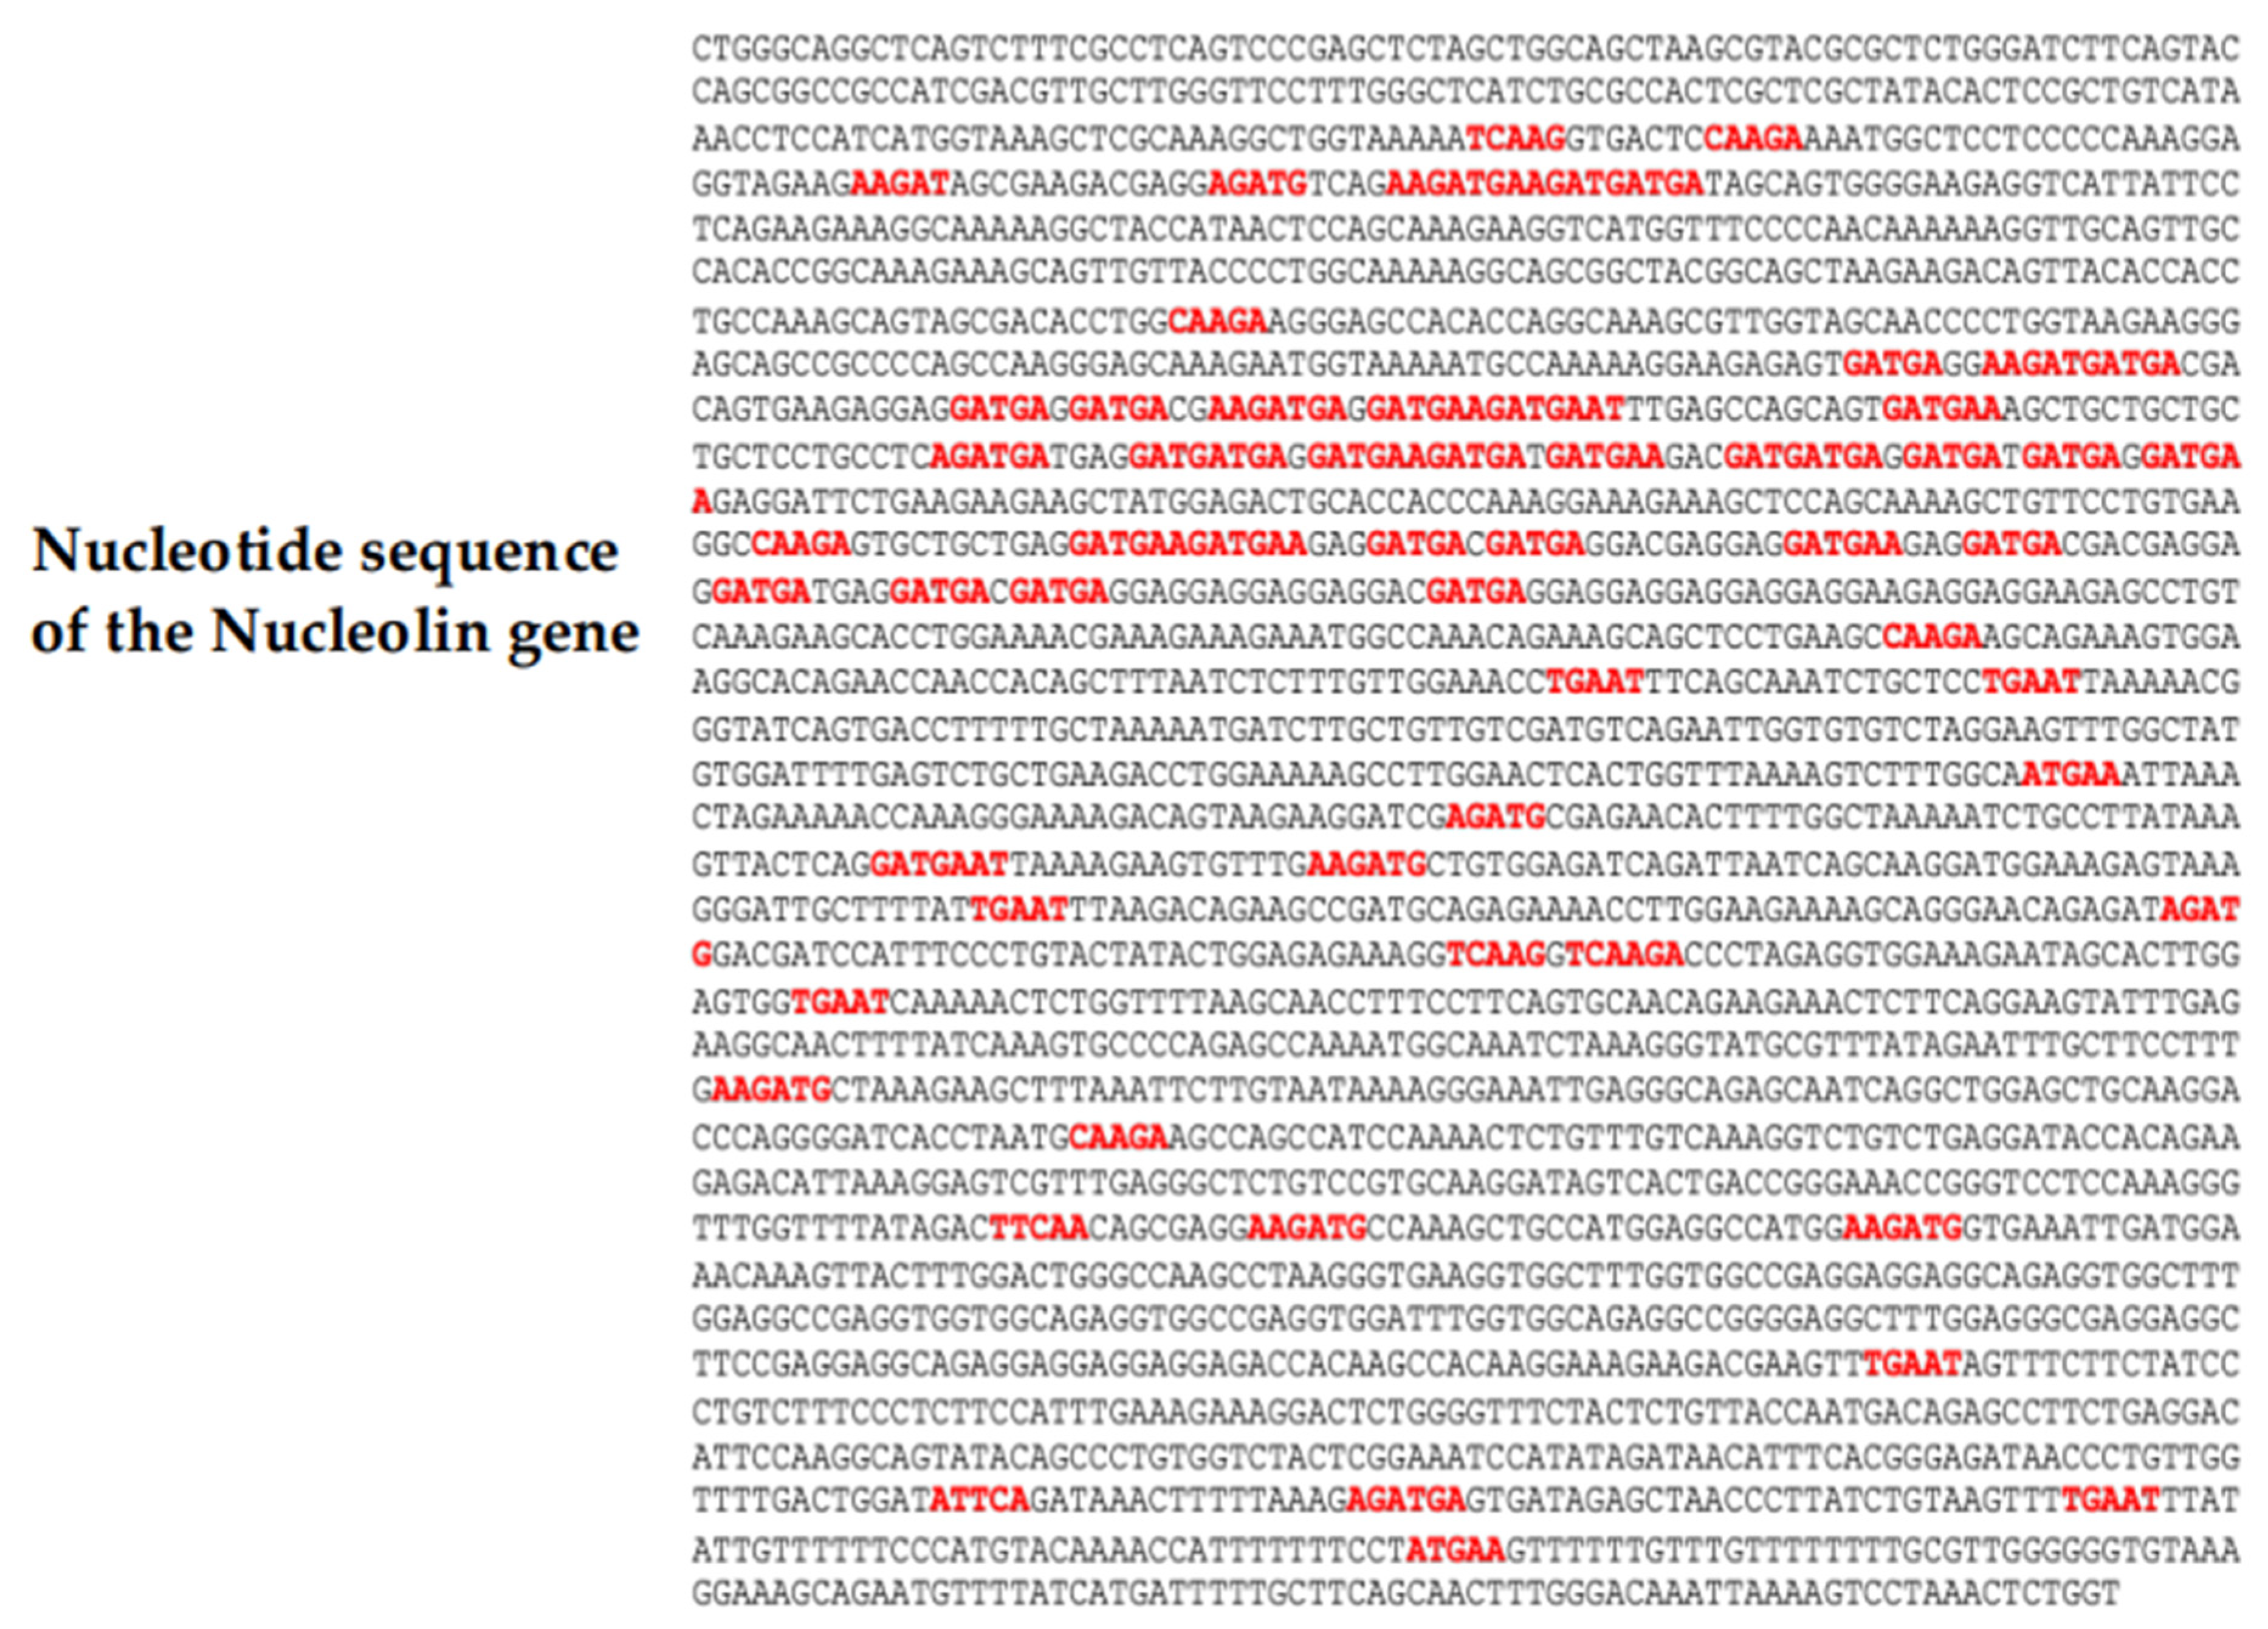
2.1. Calculation of the Archetypal Loop-Proximity
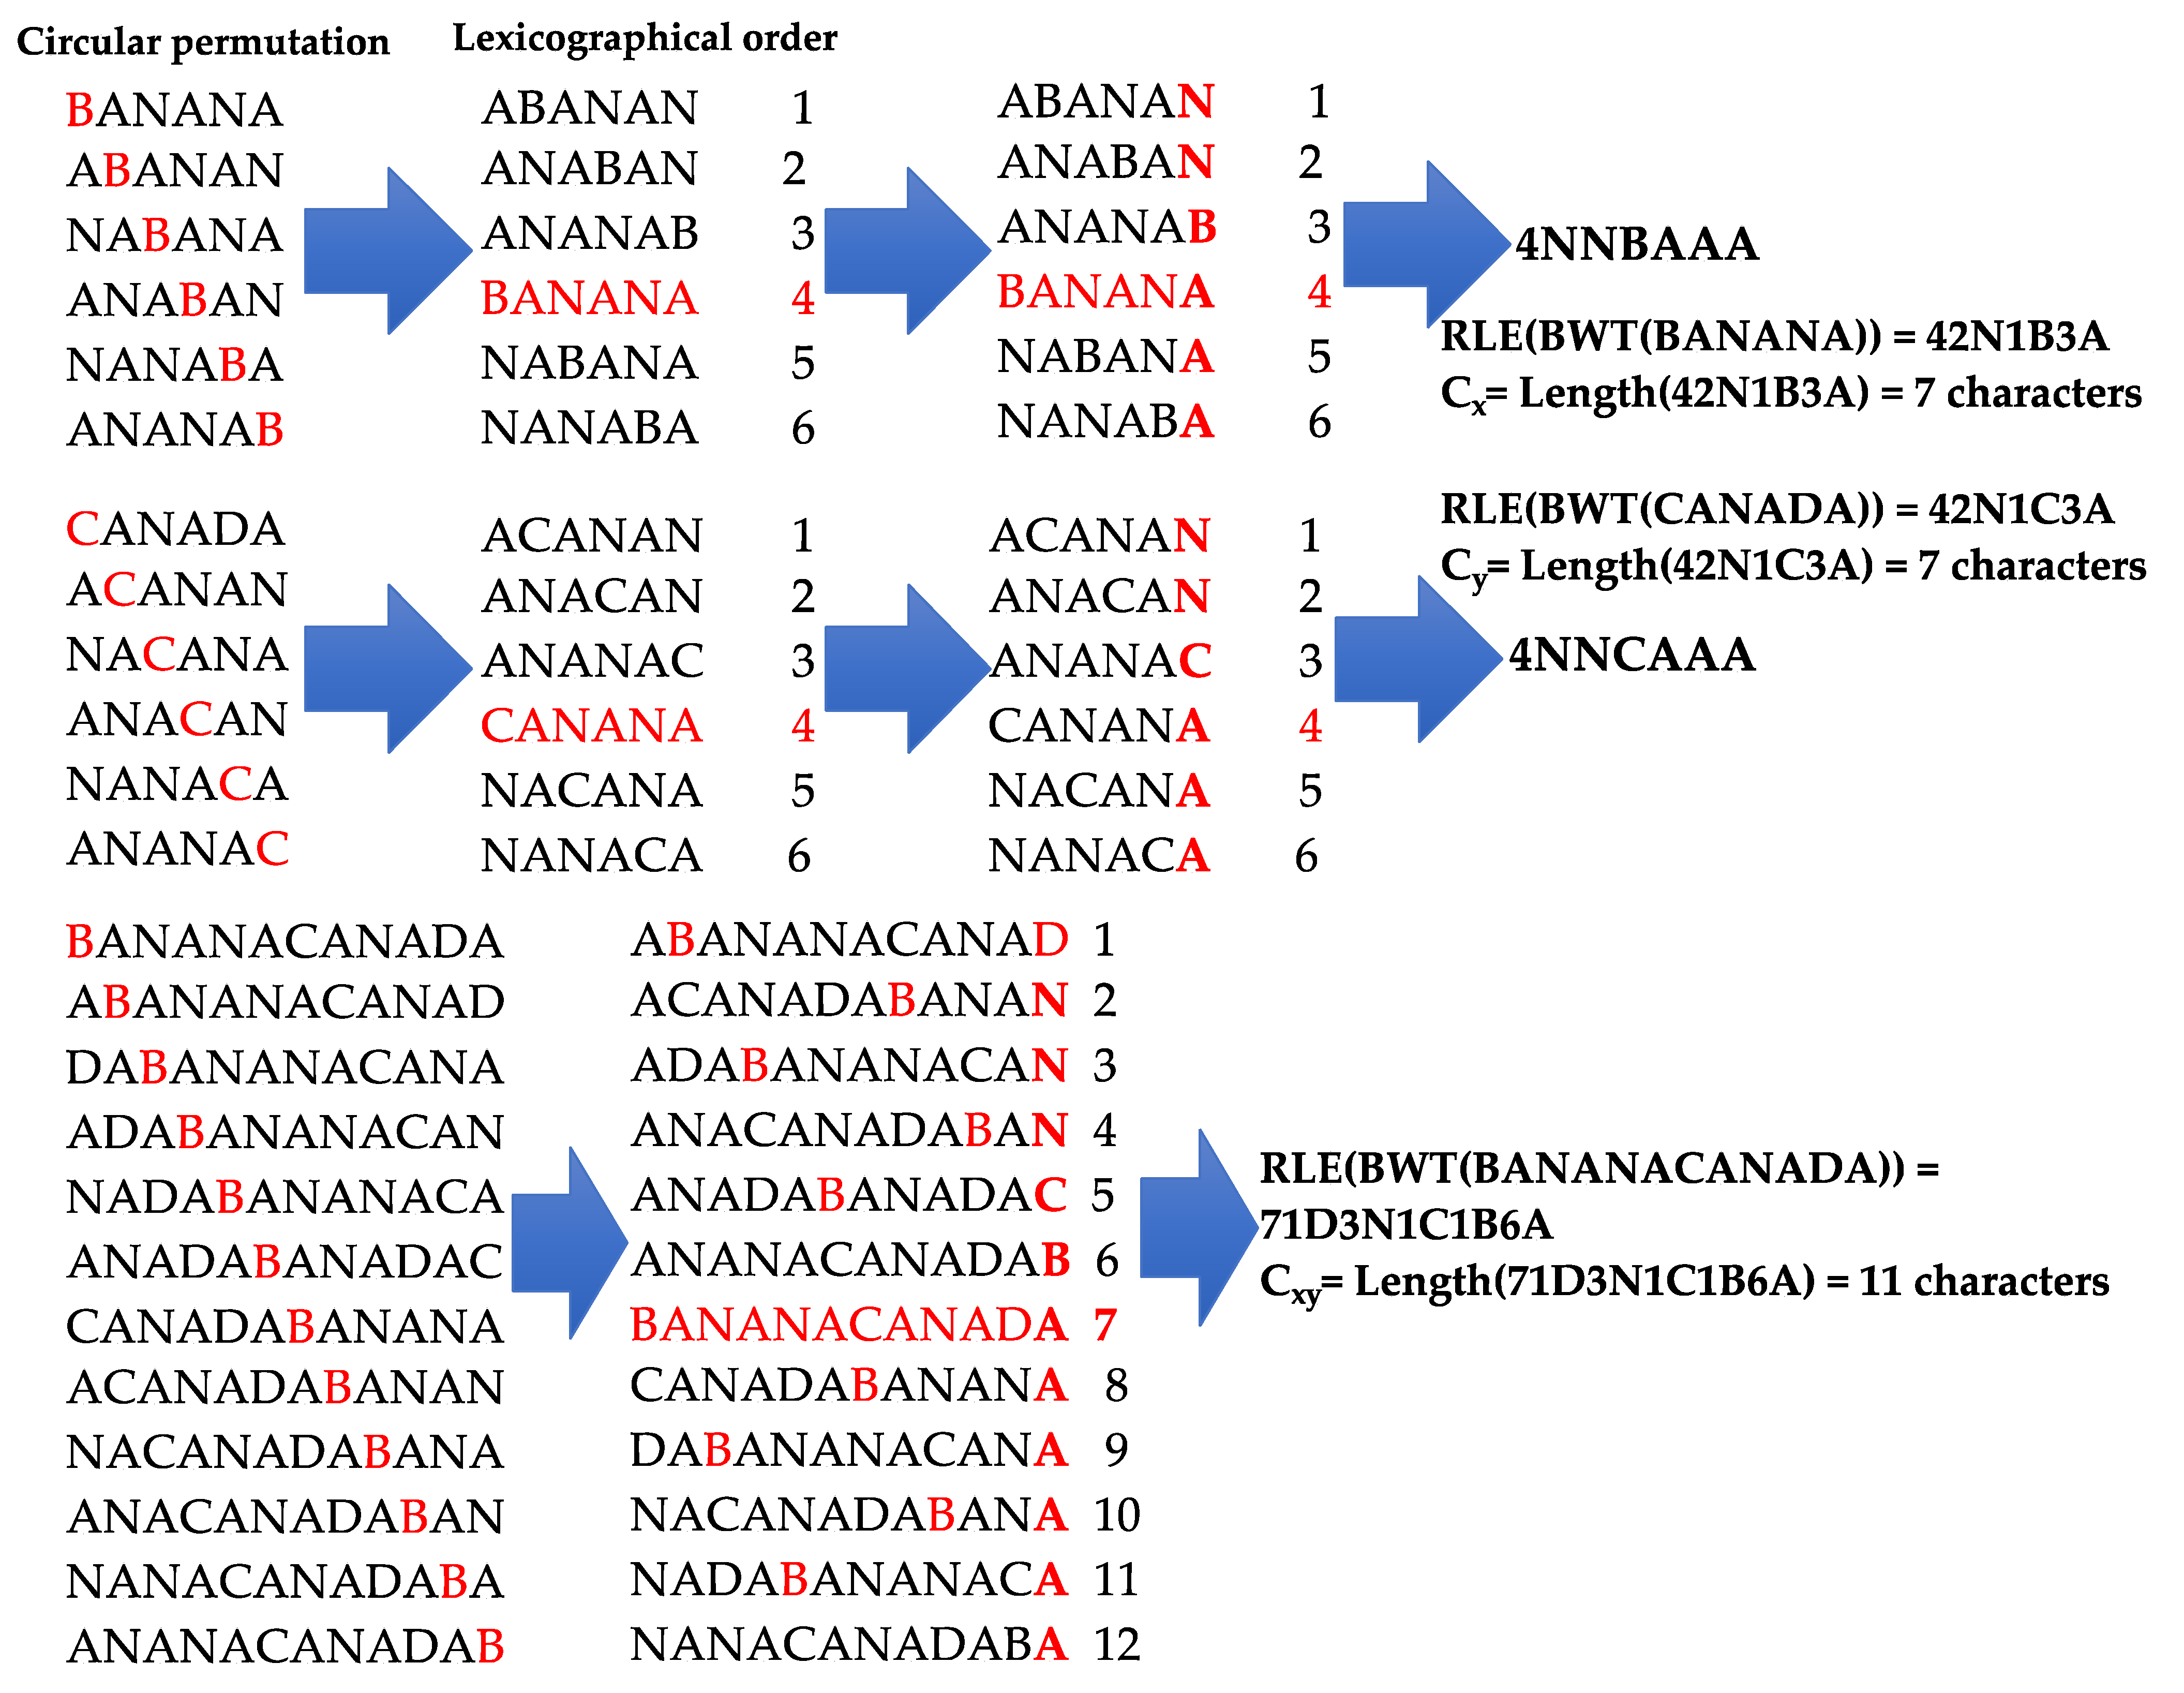
2.2. The Burrows–Wheeler Transform
2.3. The Vitányi Distance
2.4. The MaxwellTM Classifier
- -
- Calculating the mean and standard deviation on histograms of triangle areas for filtering “large and deformed triangles” considered as outliers of the empirical distribution according to the number of standard deviations retained;
- -
- Examining sub-graphs whose “useless” (respectively “best”) representative edges are identified as attached to the least (respectively the most) connected nodes and removing them (respectively keep them as cluster central node);
- -
- Processing sub-graphs with several local minima (i.e., nodes whose neighborhood does not contain another node that is closer to the sub-graph than the node itself) using Voronoï networking with the software Graphviz [28] for detecting internal boundaries;
- -
- Testing at the end for sub-graphs whose mean and standard deviation are varied until Graphviz no longer detects any boundaries;
- -
- Storing elements rejected by this statistics calculation in the form of “singleton clusters”;
- -
- Final recalling by clustering the population of singletons to detect new clusters.
3. Results
- (1)
- Cluster 1 Archaea
| Kingdom: | Archaea |
| Division: | Euryarchaeota |
| Class: | Halobacteria |
| Order: | Halobacteriales |
| Family: | Halobacteriaceae |
| Genus: | Halobacteriaceae halorabdus, Halovivax, Halomicrobium, and Halorubrum |
| Division: | Thaumarchaeota |
| Class: | Incertae sedis |
| Order: | Nitrosopumilales |
| Family: | Nitrosopumilaceae |
| Genus: | Nitrosopumilus nitrospumilus maritimus |
| Division: | Crenarchaeota |
| Class: | Thermoprotei |
| Order: | Sulfolobales |
| Family: | Sulfolobaceae sulfolobus solfataricus |
- (2)
- Cluster 2 Archaea and Bacteria
| Division: | Euryarchaeota |
| Class: | Methanomicrobia |
| Order: | Methanosarcinales |
| Family: | Methanosarcinaceae Methanolobus psychrophilus |
| Domain: | Bacteria |
| Phylum: | Bacteroidota |
| Class: | Chitinophagia |
| Order: | Chitinophagales |
| Family: | Chitinophagaceae Hydrobacter penzbergensis |
| Kingdom: | Fungi |
| Division: | Ascomycota |
| Class: | Saccharomycetes |
| Order: | Saccharomycetales |
| Family: | Saccharomycetaceae |
| Genus: | Ogataea Ogataea polymorpha |
| Domain: | Bacteria |
| Phylum: | Actinomycetota |
| Class: | Actinomycetia |
| Order: | Glycomycetales |
| Family: | Glycomycetaceae |
| Genus: | Stackebrandtia stackebrandtia nassauensis |
- (3)
- Cluster 3 Bacteria and Archaea
| Domain: | Bacteria |
| Phylum: | Bacteroidota |
| Class: | Chitinophagia |
| Order: | Chitinophagales |
| Family: | Chitinophagaceae hyperthermus butylicus |
| Phylum: | Euryarchaeota |
| Class: | Archaeoglobi |
| Order: | Archaeoglobales |
| Family: | Archaeoglobaceae ferroglobus placidus, Archaeoglobus sulfaticallidus, and Archaeoglobus profundus |
- (4)
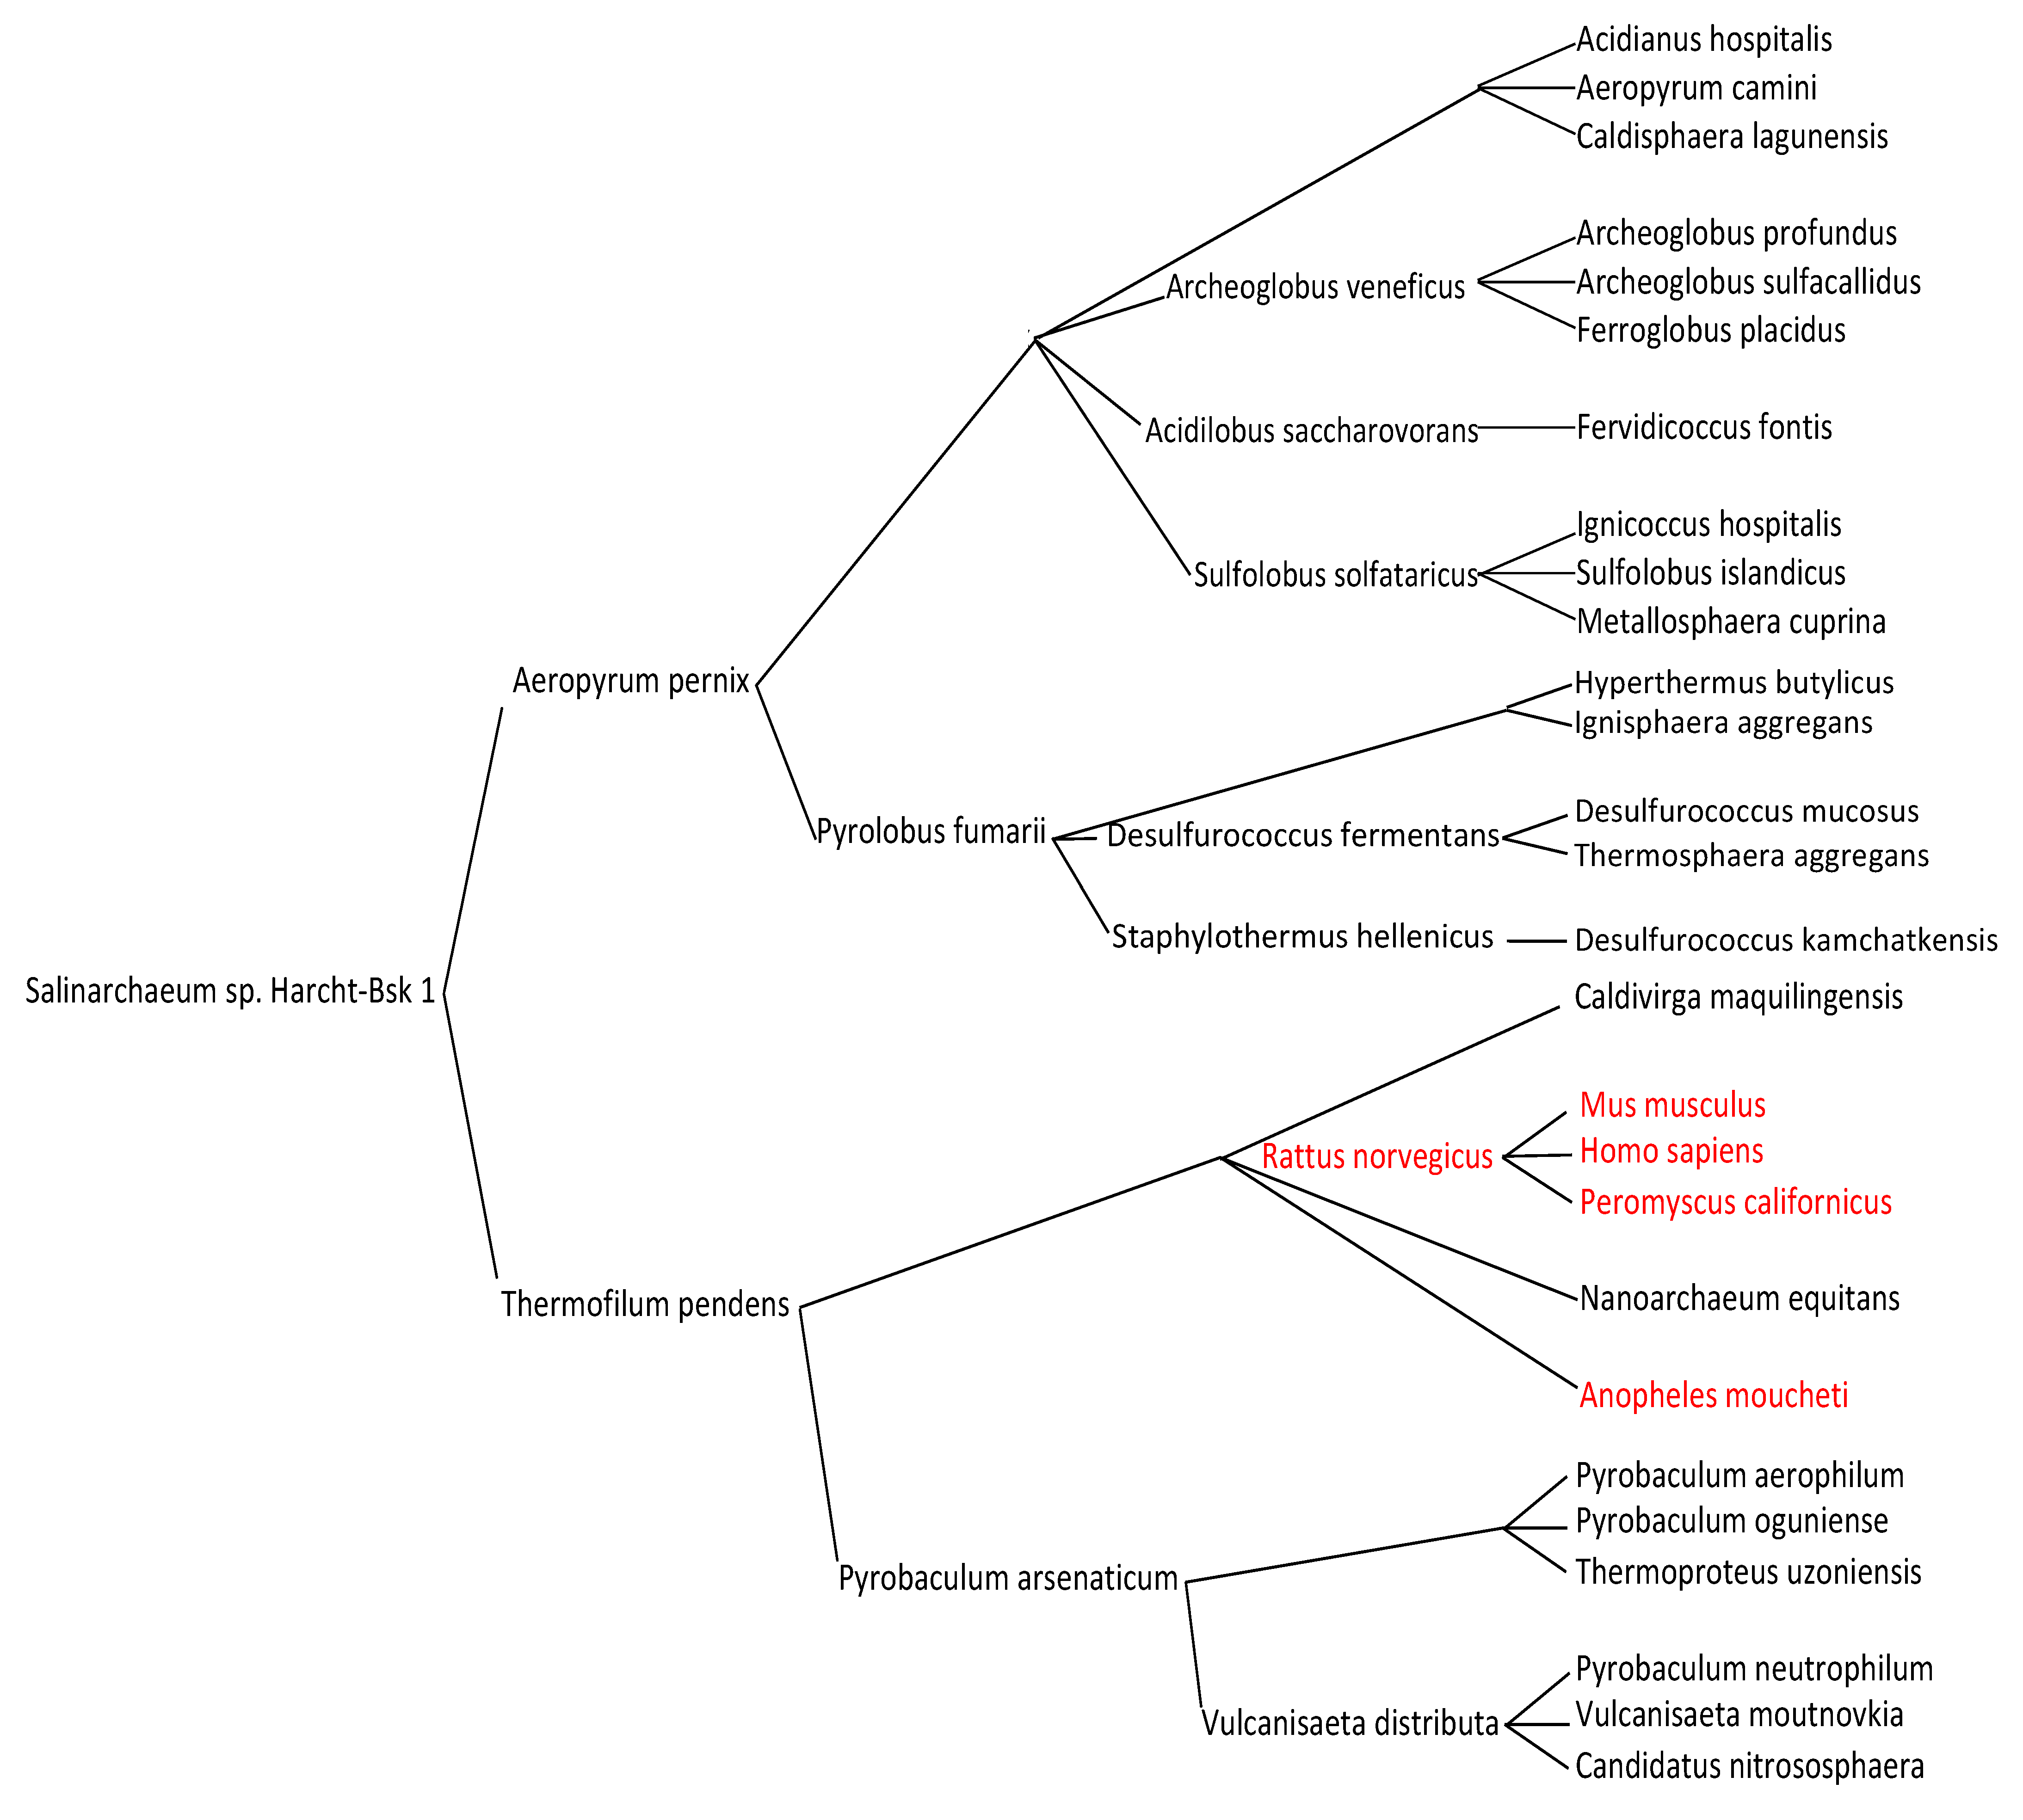
- Cluster 4 Mammals
4. Discussion
5. Conclusions and Perspectives
Supplementary Materials
Author Contributions
Funding
Data Availability Statement
Acknowledgments
Conflicts of Interest
References
- Miller, S.L. A Production of amino acids under possible primitive Earth conditions. Science 1953, 117, 528–529. [Google Scholar] [CrossRef] [Green Version]
- Bada, J.L.; Lazcano, A. Prebiotic soup—Revisiting the Miller experiment. Science 2003, 300, 745–746. [Google Scholar] [CrossRef] [PubMed] [Green Version]
- Damer, B.; Deamer, D. The Hot Spring Hypothesis for an Origin of Life. Astrobiology 2020, 20, 429–452. [Google Scholar] [CrossRef] [PubMed] [Green Version]
- Katchalsky, A. Prebiotic synthesis of biopolymers on inorganic templates. Naturwiss 1973, 60, 215–220. [Google Scholar] [CrossRef]
- Martin, W.; Russell, M.J. On the origin of biochemistry at an alkaline hydrothermal vent. Philos. Trans. R. Soc. Lond. B Biol. Sci. 2007, 362, 1887–1925. [Google Scholar] [CrossRef] [PubMed] [Green Version]
- Deamer, D. The Role of Lipid Membranes in Life’s Origin. Life 2017, 7, 5. [Google Scholar] [CrossRef]
- Turk-MacLeod, R.M.; Puthenvedu, D.; Majerfeld, I.; Yarus, M. The Plausibility of RNA-Templated Peptides: Simultaneous RNA Affinity for Adjacent Peptide Side Chains. J. Mol. Evol. 2012, 74, 217–225. [Google Scholar] [CrossRef] [Green Version]
- Xiao, H.; Murakami, H.; Suga, H.; Ferré-D’Amaré, A.R. Structural basis of specific tRNA aminoacylation by a small in vitro selected ribozyme. Nature 2008, 454, 358–361. [Google Scholar] [CrossRef]
- Deng, J.; Wilson, T.J.; Wang, J.; Peng, X.; Li, M.; Lin, X.; Liao, W.; Lilley, D.M.J.; Huang, L. Structure and mechanism of a methyltransferase ribozyme. Nat. Chem. Biol. 2022, 18, 556–564. [Google Scholar] [CrossRef] [PubMed]
- Grum-Tokars, V.; Milovanovic, M.; Wedekind, J.E. Crystallization and X-ray diffraction analysis of an all-RNA U39C mutant of the minimal hairpin ribozyme. Acta Crystallogr. Sect. D Biol. Crystallogr. 2003, 59, 142–145. [Google Scholar] [CrossRef] [PubMed] [Green Version]
- Demongeot, J. Au Sujet de Quelques Modèles Stochastiques Appliqués à la Biologie. Modélisation et Simulation; Université Joseph-Fourier: Grenoble, France, 1975. [Google Scholar]
- Demongeot, J. Sur la possibilité de considérer le code génétique comme un code à enchaînement. Rev. Biomaths 1978, 62, 61–66. [Google Scholar]
- Demongeot, J.; Besson, J. Code génétique et codes à enchaînement. C. R. Seances L’Acad. Sci. Ser. III 1983, 296, 807–810. [Google Scholar]
- GtRNAdB. Available online: http://gtrnadb.ucsc.edu/ (accessed on 23 May 2023).
- Demongeot, J.; Moreira, A. A circular RNA at the origin of life. J. Theor. Biol. 2007, 249, 314–324. [Google Scholar] [CrossRef]
- Hobish, M.K.; Wickramasinghe, N.S.M.D.; Ponnamperuma, C. Direct interaction between amino-acids and nucleotides as a possible physico-chemical basis for the origin of the genetic code. Adv. Space Res. 1995, 15, 365–375. [Google Scholar] [CrossRef]
- Tamura, K.; Schimmel, P. Oligonucleotide-directed peptide synthesis in a ribosome- and ribozyme-free system. Proc. Natl. Acad. Sci. USA 2001, 98, 1393–1397. [Google Scholar] [CrossRef]
- Paecht-Horowitz, M.; Berger, J.; Katchalsky, A. Prebiotic synthesis of polypeptides by heterogeneous polycondensation of amino-acid adenylates. Nature 1970, 228, 636–639. [Google Scholar] [CrossRef]
- Eigen, M. Selforganization of matter and the evolution of biological macromolecules. Naturwissenschaften 1971, 58, 465–523. [Google Scholar] [CrossRef]
- Gilbert, W. Origin of life: The RNA world. Nature 1986, 319, 618. [Google Scholar] [CrossRef]
- Kauffman, S.A. Approaches to the origin of life on Earth. Life 2011, 1, 34–48. [Google Scholar] [CrossRef] [Green Version]
- NCBI. Available online: https://www.ncbi.nlm.nih.gov/refseq/ (accessed on 23 May 2023).
- Edous, M.; Eidous, O. A Simple Approximation for Normal Distribution Function. Math. Stat. 2018, 6, 47–49. [Google Scholar] [CrossRef] [Green Version]
- Gardes, J.; Maldivi, C.; Boisset, D.; Aubourg, T.; Vuillerme, N.; Demongeot, J. Maxwell®: An unsupervised learning approach for 5P medicine. Stud. Health Technol. Inform. 2019, 264, 1464–1465. [Google Scholar]
- Burrows, M.; Wheeler, D.J. A block-sorting lossless data compression algorithm. Digit. SRC Res. Rep. 1994, 124, 10009821328. [Google Scholar]
- Cilibrasi, R.; Vitanyi, P.M.B. Clustering by compression. IEEE Trans. Inf. Theory 2005, 51, 1523–1545. [Google Scholar] [CrossRef] [Green Version]
- Cohen, A.R.; Vitányi, P.M.B. Normalized Compression Distance of Multisets with Applications. IEEE Trans. PAMI 2015, 37, 1602–1614. [Google Scholar] [CrossRef] [PubMed] [Green Version]
- Graphviz. Available online: https://graphviz.org/ (accessed on 23 May 2023).
- Woese, C.; Fox, G. The concept of cellular evolution. J. Mol. Evol. 1977, 10, 1–6. [Google Scholar] [CrossRef] [PubMed]
- Gogarten, J.P.; Deamer, D. Is LUCA a thermophilic progenote? Nat. Microbiol. 2016, 1, 16229. [Google Scholar] [CrossRef] [Green Version]
- Adam, P.S.; Borrel, G.; Brochier-Armanet, C.; Gribaldo, S. The growing tree of Archaea: New perspectives on their diversity, evolution and ecology. ISME J. 2017, 11, 2407–2425. [Google Scholar] [CrossRef] [Green Version]
- Schmitt, L.M. Theory of Genetic Algorithms. Theor. Comput. Sci. 2001, 259, 1–61. [Google Scholar] [CrossRef] [Green Version]
- Ighalo, J.O.; Marques, G. Current Trends and Advances in Computer-Aided Intelligent Environmental Data Engineering; Elsevier: Amsterdam, The Netherlands, 2022. [Google Scholar]


| Name Gene or RNA | Distance to Barycenter | % Distance Total | AL-Prox | Mean AL-Prox |
|---|---|---|---|---|
| Lynx rufus nucleolin | 0 | 13.9 | 14.66 | |
| Suncus etruscus nucleolin | 623,310 | 24.2% | 14.8 | |
| Rhinolophus ferrumequinum nucleolin | 445,316 | 17.3% | 16.4 | |
| Elephas maximus indicus nucleolin | 569,205 | 22.1% | 14.2 | |
| Sciurus carolinensis nucleolin | 496,040 | 19.2% | 16.3 | |
| Equus quagga nucleolin | 392,613 | 15.2% | 13 | |
| Prionailurus viverrinus nucleolin | 53,318 | 2% | 14 | |
| Halorhabdus utahensis DSM 12,940 strain DSM 12,940 5S ribosomal RNA | 0 | 1.7 | 1.28 | |
| 1 Halovivax ruber XH-70 strain XH-70 5S ribosomal RNA | 571,428 | 19% | 1.24 | |
| Nitrosopumilus maritimus 5S | 742,857 | 24.6% | 0.32 | |
| Sulfolobus solfataricus P2 strain 5S | 734,693 | 24.4% | 0 | |
| Halomicrobium mukohataei DSM 12,286 5S | 571,428 | 19% | 2.8 | |
| Halorubrum lacus profundi ATCC 49,239 strain ATCC 49,239 5S ribosomal RNA | 393,939 | 13% | 1.63 | |
| Methanolobus psychrophilus R15 strain 5S | 0 | 2.8 | 4.95 | |
| Hydrobacter penzbergensis nucleolin | 981,132 | 33.5% | 10.6 | |
| Ogataea polymorpha strain nucleolin | 969,924 | 33.1% | 3.6 | |
| Stackebrandtia nassauensis DSM 44,728 nucleolin | 977,086 | 33.4% | 2.8 | |
| Archaeoglobus veneficus SNP6 strain SNP6 5S ribosomal RNA | 0 | 0.9 | 1.32 | |
| Hyperthermus butylicus DSM 5456 strain DSM 5456 5S | 670,103 | 31.6% | 0 | |
| Ferroglobus placidus DSM 10,642 strain DSM 10,642 5S ribosomal RNA | 371,134 | 17.5% | 1.54 | |
| Candidatus Korarchaeum cryptofilum 5S | 587,628 | 27.7% | 1.7 | |
| Archaeoglobus sulfaticallidus PM70-1 strain PM70 5S-1 | 190,000 | 9% | 1.6 | |
| Archaeoglobus profundus DSM 5631 strain DSM 5631 5S ribosomal RNA | 300,000 | 14.2% | 2.2 |
Disclaimer/Publisher’s Note: The statements, opinions and data contained in all publications are solely those of the individual author(s) and contributor(s) and not of MDPI and/or the editor(s). MDPI and/or the editor(s) disclaim responsibility for any injury to people or property resulting from any ideas, methods, instructions or products referred to in the content. |
© 2023 by the authors. Licensee MDPI, Basel, Switzerland. This article is an open access article distributed under the terms and conditions of the Creative Commons Attribution (CC BY) license (https://creativecommons.org/licenses/by/4.0/).
Share and Cite
Demongeot, J.; Gardes, J.; Maldivi, C.; Boisset, D.; Boufama, K.; Touzouti, I. Genomic Phylogeny Using the MaxwellTM Classifier Based on Burrows–Wheeler Transform. Computation 2023, 11, 158. https://doi.org/10.3390/computation11080158
Demongeot J, Gardes J, Maldivi C, Boisset D, Boufama K, Touzouti I. Genomic Phylogeny Using the MaxwellTM Classifier Based on Burrows–Wheeler Transform. Computation. 2023; 11(8):158. https://doi.org/10.3390/computation11080158
Chicago/Turabian StyleDemongeot, Jacques, Joël Gardes, Christophe Maldivi, Denis Boisset, Kenza Boufama, and Imène Touzouti. 2023. "Genomic Phylogeny Using the MaxwellTM Classifier Based on Burrows–Wheeler Transform" Computation 11, no. 8: 158. https://doi.org/10.3390/computation11080158