1. Introduction
The popularity of cryptocurrency, the most mature form of blockchain technology, is growing quickly. There have been several new alternative blockchains introduced since the launch of Bitcoin in 2009. As of 12 March 2023, Ethereum remains the second-most popular blockchain by market capitalisation, behind Bitcoin [
1]. However, like other cryptocurrency networks, the anonymity provided by Ethereum allows entities to hide their illicit transactions behind a pseudonym [
2]. As Ethereum becomes more widely used, its popularity among criminals is likely to rise. According to Chainalysis’ 2023 Crypto Crime Report, illegal transaction volume has been on the rise for three consecutive years, reaching an all-time high of
$20.6 billion [
3]. Therefore, a tool to deanonymise Ethereum blockchain addresses can help increase network trust.
This work aims to uncover the true level of Ethereum’s anonymity by investigating suitable multiclass classification models in predicting the category of Ethereum addresses using patterns in transaction activity. The performance of Random Forest, Gradient Boosting, and XGBoost classifiers are compared and evaluated. This research serves two main purposes towards achieving the aim and objectives of this work: (1) building a labelled address profiles dataset and (2) tuning and evaluating the model. In the first part, the transaction features of each labelled address are extracted and compiled. In the second part, the focus is on hyperparameter tuning to optimise the performance of each model and evaluate its suitability towards classifying Ethereum wallet addresses.
One of the motives for this work was to contribute towards aiding due diligence on transactions to meet Know Your Customer (KYC) requirements. This is often a mandatory procedure due to legal obligations or reputational risks for parties such as banks, financial service providers, regulators, law enforcement, and investigative agencies [
4,
5]. Additionally, another reason for undertaking this work is to fill the gap in the multiclass classification of Ethereum addresses. Several past research works have demonstrated that it is possible to deanonymise blockchain entities through various methods. However, most past works were focused on the binary classification of blockchain entities into either illicit/malicious or licit/non-malicious groups [
4,
6,
7,
8,
9,
10]. Past works that do perform multiclass classification of blockchain addresses, on the other hand, were focused on the Bitcoin blockchain [
5,
11,
12]. Nevertheless, these past works served as a motivation and as a guideline for this work.
At the time of writing, to the best of the writer’s knowledge, there have been no attempts to perform a multiclass classification of Ethereum wallet addresses. Additionally, a multiclass labelled transaction dataset is compiled and can be used for future related works.
The rest of the paper is organised as follows.
Section 2 is dedicated to addressing the key concepts in this project.
Section 3 discusses the related work and the motivation for this work.
Section 4 introduces the materials and methods used in this work.
Section 5 presents the results of the models.
Section 6 discusses the results and limitations of the work as well as recommendations for future work.
1.1. Building a Labelled Address Profiles Dataset
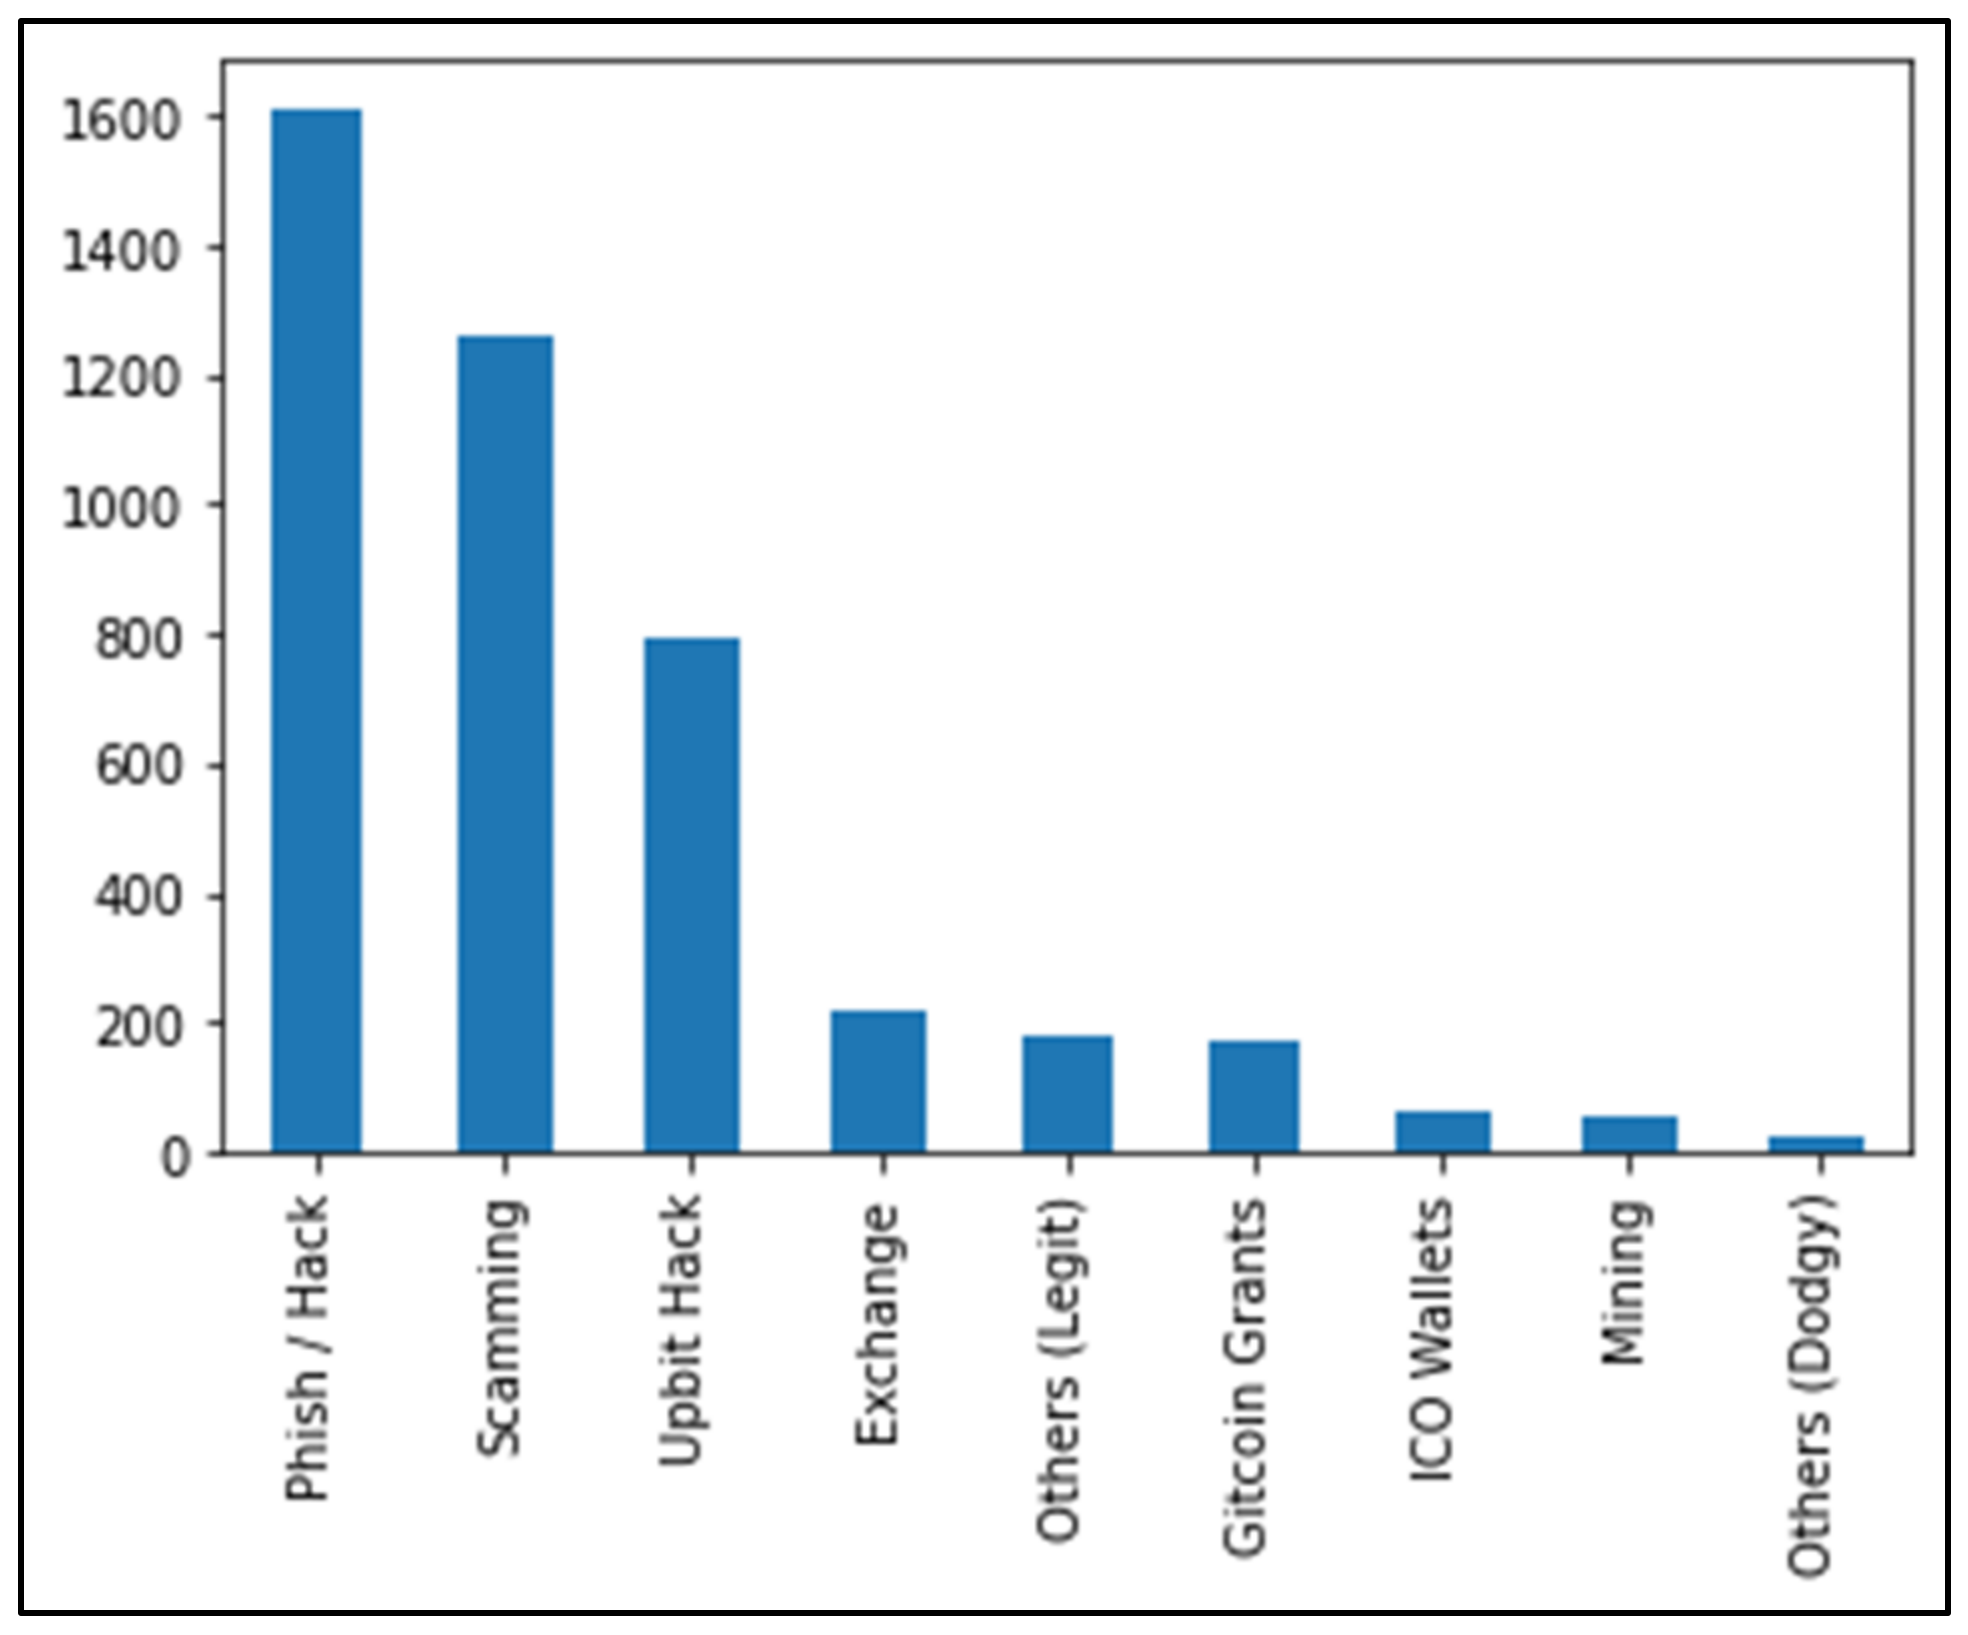
A labelled Ethereum addresses dataset consisting of 5774 labelled wallet addresses was downloaded from a public Kaggle challenge [
13]. Duplicate addresses with different labels were crosschecked with Etherscan.io, an Ethereum blockchain explorer platform, to verify the labels and determine which records to drop, as further described in
Section 4.1.1.
Figure 1 illustrates the category distribution of the address profiles dataset.
Using this list of labelled addresses, 14 features to characterise the differences in user behaviour were created using the data queried from the Google BigQuery crypto_ethereum public dataset. The features derived from each address include the ETH balance, the time difference between the first and last transaction in minutes, the average transaction sent/received and the total transactions sent/received. The list of labelled wallet addresses combined with each of their features forms the labelled dataset of address profiles used in this research to tune and evaluate the models.
1.2. Model Tuning and Evaluation
Three models, Random Forest, Gradient Boosting and XGBoost classifiers, were tuned using cross-validated Randomised Search to optimise the performance of each model. Two training sets were used to tune the model: (1) the original training set and (2) the SMOTE-resampled training set. The original training set is the training set before any resampling technique is applied to it, and it is imbalanced. Data imbalance can cause the model to perform poorly. Hence, it is desired to also include a resampled, balanced dataset to investigate the performance of the multiclass classification models with and without resampling. Undersampling was not used, as it can lead to the loss of vital information in an already small dataset. Other than that, to reduce overfitting, SMOTE was preferred over the random oversampling technique, which balances the dataset by randomly replicating minority target instances [
14].
The performance of the classification models in this research is evaluated using performance indicators that consider the imbalanced nature of the dataset, such as the Macro Average Precision, Recall and F1-Score. Predictive accuracy, which is a commonly used performance indicator, is not suitable for this research because even if the minority class addresses are wrongly identified, a high performance score may still be implied if the classifier correctly predicts all of the addresses in the majority class [
15]. Additionally, the ROC (receiver operating characteristic) curve and the AUC (area under the ROC curve) score were also considered when evaluating the models to visualise and measure the ability of the models to differentiate between the different classes [
16].
2. Literature Review
2.1. Blockchain
Blockchain is the technology behind cryptocurrencies such as Bitcoin, Ether and Tether. It is essentially a distributed database of records that enables transactions or digital events to take place in a decentralised manner [
17,
18], thereby removing the need to rely on third parties or intermediaries such as commercial banks when making transactions. The potential of blockchain technology lies in its many characteristics, including, but not limited to, disintermediation and being traceable, transparent and tamper-resistant [
19]. Hence, it can benefit many industries, such as healthcare, energy, voting, insurance and identity management [
20,
21].
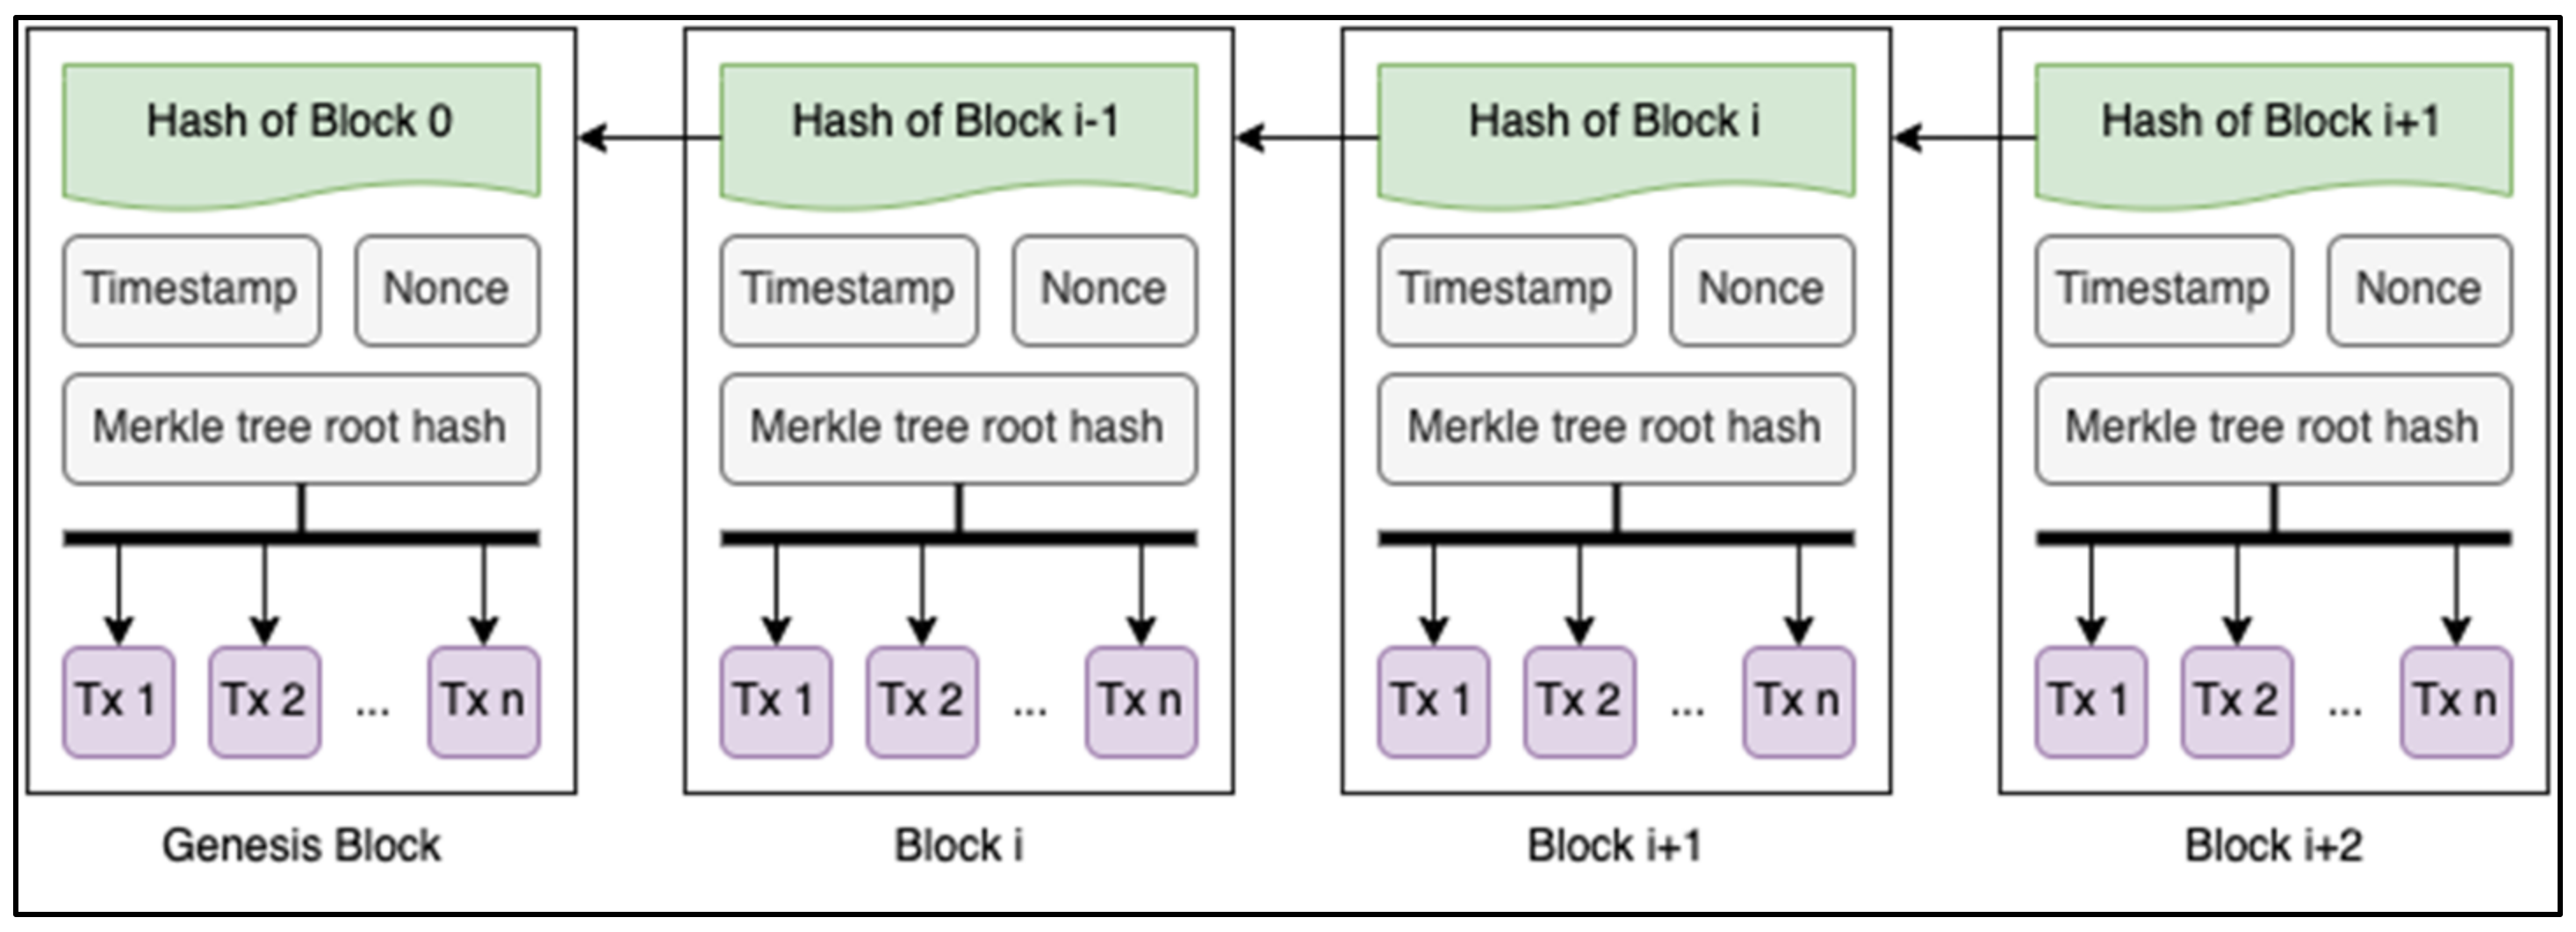
The tamper-proof characteristic of blockchain technology stems from its structure as illustrated in
Figure 2. Blockchain, as the name suggests, records transactions on a chain of blocks. Each block holds a set of transactions created, a timestamp, a link to the block before it, and a hash value to identify it. Since successive blocks are connected by cryptographic hash functions to create a chain of blocks, changing the transaction data in block
would affect the hash that is present in block
, modifying the contents of
as a result, and so on [
22]. Furthermore, the blockchain is replicated and constantly updated across a network of computers (nodes). Any blockchain network’s foundation relies on consensus algorithms to ensure that each new block added to the chain is recognised as the only version of the truth by all parties involved [
23]. Thus, if a majority of CPU power is owned by nodes that are not working together to attack the network, the blockchain is effectively an immutable and irrefutable ledger or at least one that will be very difficult to tamper with [
24].
Ethereum
Ethereum is an open-source blockchain introduced by Buterin [
25] to address several limitations of Bitcoin’s scripting language. It represents a blockchain with an integrated Turing-complete programming language, allowing smart contracts that allow anyone to design their own ownership rules, transaction formats and state transition mechanisms [
26]. Unlike Bitcoin, which uses the Unspent Transaction Output (UTXO) model, Ethereum uses the account model. As opposed to maintaining the state, such as in the UTXOs, account balances are directly updated by transactions, allowing the transfer of values, messages and data between the accounts that may result in state transitions [
27].
There are two types of accounts on the Ethereum blockchain, which are Externally Owned Accounts (EOAs) and contract accounts. EOAs are owned and controlled by people, and similarly to Bitcoin, each person has their own private key, which they can use to make transactions in the Ethereum blockchain. On the other hand, contract accounts are controlled by their smart contract code, which can be triggered by transactions from EAOs or other contracts. Ether is the cryptocurrency used on the Ethereum blockchain, is used to pay transaction fees and can be sent from address to address.
A transaction is a single cryptographically signed instruction and is described as a signed data package sent by an EOA [
26]. Each transaction consists of several fields, namely the transaction recipient (address), the signature to identify the sender, the Ether amount (in Wei, which is the smallest denomination of ether, 1 ETH = 10
18 Wei) to be sent, an optional data field, and the STARTGAS and GASPRICE value [
25,
27]. Transactions are prioritised by network miners depending on the GasPrice field. Numerous relevant details of Ether transactions are saved as data packages [
28].
In this project, the dataset used to train the model consists of labelled EOAs and their extracted features. Several details from transactions were used when extracting the features to form the dataset, specifically, the sender (From) and recipient (To) address, the amount of Ether to be sent (Value), and the Timestamp.
2.2. Supervised Learning
Supervised learning is a subfield of ML where predictive models are built by learning from a large number of labelled data consisting of a set of training examples, each of which contains a label indicating its ground-truth output [
29]. Hence, the main characteristic that sets it apart from other ML types is that it uses labelled datasets to train the model. Supervised learning can be divided into two major categories, classification and regression. The difference between classification and regression is that the former is used to predict discrete class labels while the latter is used to predict continuous values [
30].
Classification can be further divided into binary, multiclass and multi-labelled classification tasks [
31]. Binary classification refers to classification tasks that have only two distinct categories, such as ‘true and false’ or ‘licit and illicit’, while multiclass classification refers to classification tasks that have more than two categories [
31,
32]. Multi-label classification is a generalisation of multiclass classification where each example is associated with several classes or labels [
33]. In this project, the Random Forests, gradient boosting and XGBoost classifiers are trained to perform multiclass classification.
2.2.1. Random Forest
In prior work on character recognition, Amit and Geman defined a huge number of geometric features and searched across a random subset of these for the best split at each node [
34]. This work served as inspiration for Leo Breiman, who developed Random Forests [
35]. It was created as a rival to boosting and builds on Breiman’s bagging approach [
36]. The fact that Random Forests may be used to solve a variety of prediction problems, are straightforward, are widely acknowledged for their accuracy, and have the ability to handle small sample sizes and high-dimensional feature spaces has substantially contributed to their popularity [
37].
A Random Forest (RF), as its name suggests, is an ensemble of trees where each tree depends on a set of random factors [
38]. A subset of training samples (bootstrapped dataset) is drawn through replacement to generate several decision trees (a bagging approach), which means some samples can be selected multiple times while some may not be selected at all. Each decision tree is grown independently without any pruning, with the modification that at each node, the best split from among a user-defined number of randomly selected features is chosen instead of choosing the best split from among all features [
39]. A RF produces trees with high variance and low bias by expanding the forest up to a user-defined number of trees. The probabilities for each class assigned by each created tree are averaged using the arithmetic mean to arrive at the final classification decision. To obtain an estimate of the error rate, the samples that were not selected to build the tree, also known as the out-of-bag samples, are utilised in an internal cross-validation method [
35]. At each bootstrap iteration, each tree votes for class membership, and majority votes will decide the predicted class. The out-of-bag error can then be computed from the correctly and incorrectly classified predictions.
2.2.2. Gradient Boosting
Gradient boosting (GB) fuses the gradient descent algorithm and boosting method [
40]. Boosting algorithms iteratively combine weak learners, such as those somewhat better than random, into strong learners [
41]. Although decision trees are poor models on their own, as an ensemble, they significantly increase in accuracy. As a result, the ensembles are constructed progressively and incrementally so that each ensemble fixes the flaw in the previous ensemble [
42].
In the issue of function estimation, one has a system that consists of a set of random ‘input’ or ‘explanatory’ variables
and a random ‘output’ or ‘response’ variable
. Given a training sample
of known
values, the goal of gradient boosting is to find an approximation of the function
that maps the instances
to their target values
, such that over the joint distribution of all
values, the expected value of some specified loss function
is minimised. Gradient boosting creates a weighted sum of functions that additively approximates
[
37]:
where
represents the weight of the
function,
, which is the model of the ensemble such as decision trees. The approximation is built up gradually. First, a constant approximation representation of
is found as expressed in Equation (2),
Following that, the subsequent models are expected to minimise
But as opposed to directly solving the optimisation issue, each
can be thought of as a greedy step in a gradient descent optimisation for
. To do so, each model,
, is trained on a fresh dataset,
, where the pseudo-residuals,
, are calculated using Equation (4).
Then, the value of is calculated by resolving a line-search optimisation issue.
2.2.3. XGBoost
XGBoost, which stands for eXtreme Gradient Boosting, is another decision tree ensemble and is a scalable and efficient implementation of gradient boosting [
43]. Through the continuous iteration of the model, the XGBoost classifier aggregates hundreds of tree models with lesser classification accuracy to produce one that is very accurate and low in false positives [
44].
XGBoost constructs an additive expansion of the objective function by minimising a loss function, much like gradient boosting. Given that XGBoost only uses decision trees as base classifiers, the complexity of the trees is managed using a variation of the loss function [
37]
where
can be computed with Equation 6,
where
denotes the number of leaves of the tree and
represents the output scores of the leaves. The split criterion of decision trees can incorporate this loss function, creating a prepruning approach. The minimum loss reduction gain required to separate an internal node is controlled by the value of
. Trees with higher
values are simpler.
3. Related Work and Motivation
Several researchers have attempted to deanonymise blockchain entities based on their transaction behaviour and have explored the limits of the anonymity provided by blockchain addresses. Both unsupervised and supervised approaches were explored in these various similar works, from identifying addresses belonging to the same owner with address-clustering heuristics to using classification models such as XGBoost and Random Forests to predict the category of an address.
In [
45], the author proposed several address-clustering heuristics to identify addresses that likely belong to the same entity in the Ethereum network. They exploited patterns related to deposit addresses, airdrop multi-participation, and ERC20 token-authorisation mechanisms, successfully clustering 17.8% of active EOA addresses on the Ethereum blockchain. The author of [
46] performed a characteristic analysis of the Ethereum transaction space and was able to infer behavioural attributes in both supervised and unsupervised environments. In an unsupervised context, they inferred behavioural traits of the ten clusters formed by inducing them into radar plots and characteristically analysing them based on feature contributions. In a supervised context, they inferred characteristics in the transactions by performing characteristic analysis on malicious and non-malicious transactions using histogram plots. These research works served as the foundation and inspiration for the current study, providing initial ideas and features to be extracted.
The authors in [
4] found that using ten-fold cross-validation, XGBoost proved to have positive results in the detection of illicit accounts over the Ethereum blockchain. They also identified the top three features that significantly affected the final model output: the time difference in minutes between the first and last transaction, the account’s total ether balance, and the minimum Ether it ever received. In Ref. [
47], the authors used XGBoost and Random Forest to predict if an incoming transaction is fraudulent or not on the Bitcoin blockchain. They also used SMOTE to deal with their dataset imbalance and obtain better results. The XGBoost classifier aggregates a large number of tree models with poor performance to produce a highly accurate classification model, making it effective for detecting illicit accounts over the Ethereum blockchain.
Other than that, numerous researchers explored the application of supervised learning methods for Anti-Money Laundering (AML) and fraud detection in the Bitcoin blockchain. Some papers found the Random Forest (RF) method to be the most effective after comparing it with other methods such as Logistic Regression (LR), Support Vector Machine (SVM), Artificial Neural Networks, and Graph Convolutional Networks [
8,
10,
48]. The authors of [
6] found RF to be superior to GBC. On the other hand, Ref. [
5] found the Gradient Boosting Classifier (GBC) provided the best results compared to RF, Bagging Classifiers, and a few other methods in predicting the category of a new cluster on the Bitcoin blockchain given a set of previously identified clusters as training data.
The authors of [
28] conducted a survey analysing existing machine learning models proposed to detect fraudulent activities on the blockchain. They outlined some common features that may prove useful in predicting frauds such as the transaction history of addresses, the transaction amount, and the transaction sender and receiver address. These common features were referenced when deciding the features to be used for this study, such as the total ETH sent or received and the average time taken in minutes between transactions.
Results from past works have proven that it is possible to classify blockchain addresses based on their transaction history or activity (see
Table 1). However, most of the works were focused on the binary classification of blockchain entities into groups of either illicit/malicious or licit/non-malicious [
4,
6,
7,
8,
9,
10]. Past works that do perform multiclass classification of blockchain addresses, on the other hand, were focused on the Bitcoin blockchain [
5,
11,
12]. Hence, this work aims to fill that gap by investigating the application of machine learning on the multiclass classification of Ethereum wallet addresses. Multiclass classification of Ethereum addresses can be valuable for organisations in various ways. Not only can it enable the identification and avoidance of suspicious accounts, such as scams, but it also offers the opportunity to gain insights into the behaviour of specific account owners, such as distinguishing miners from exchanges, thereby enabling organisations to customise their services accordingly.
4. Materials and Methods
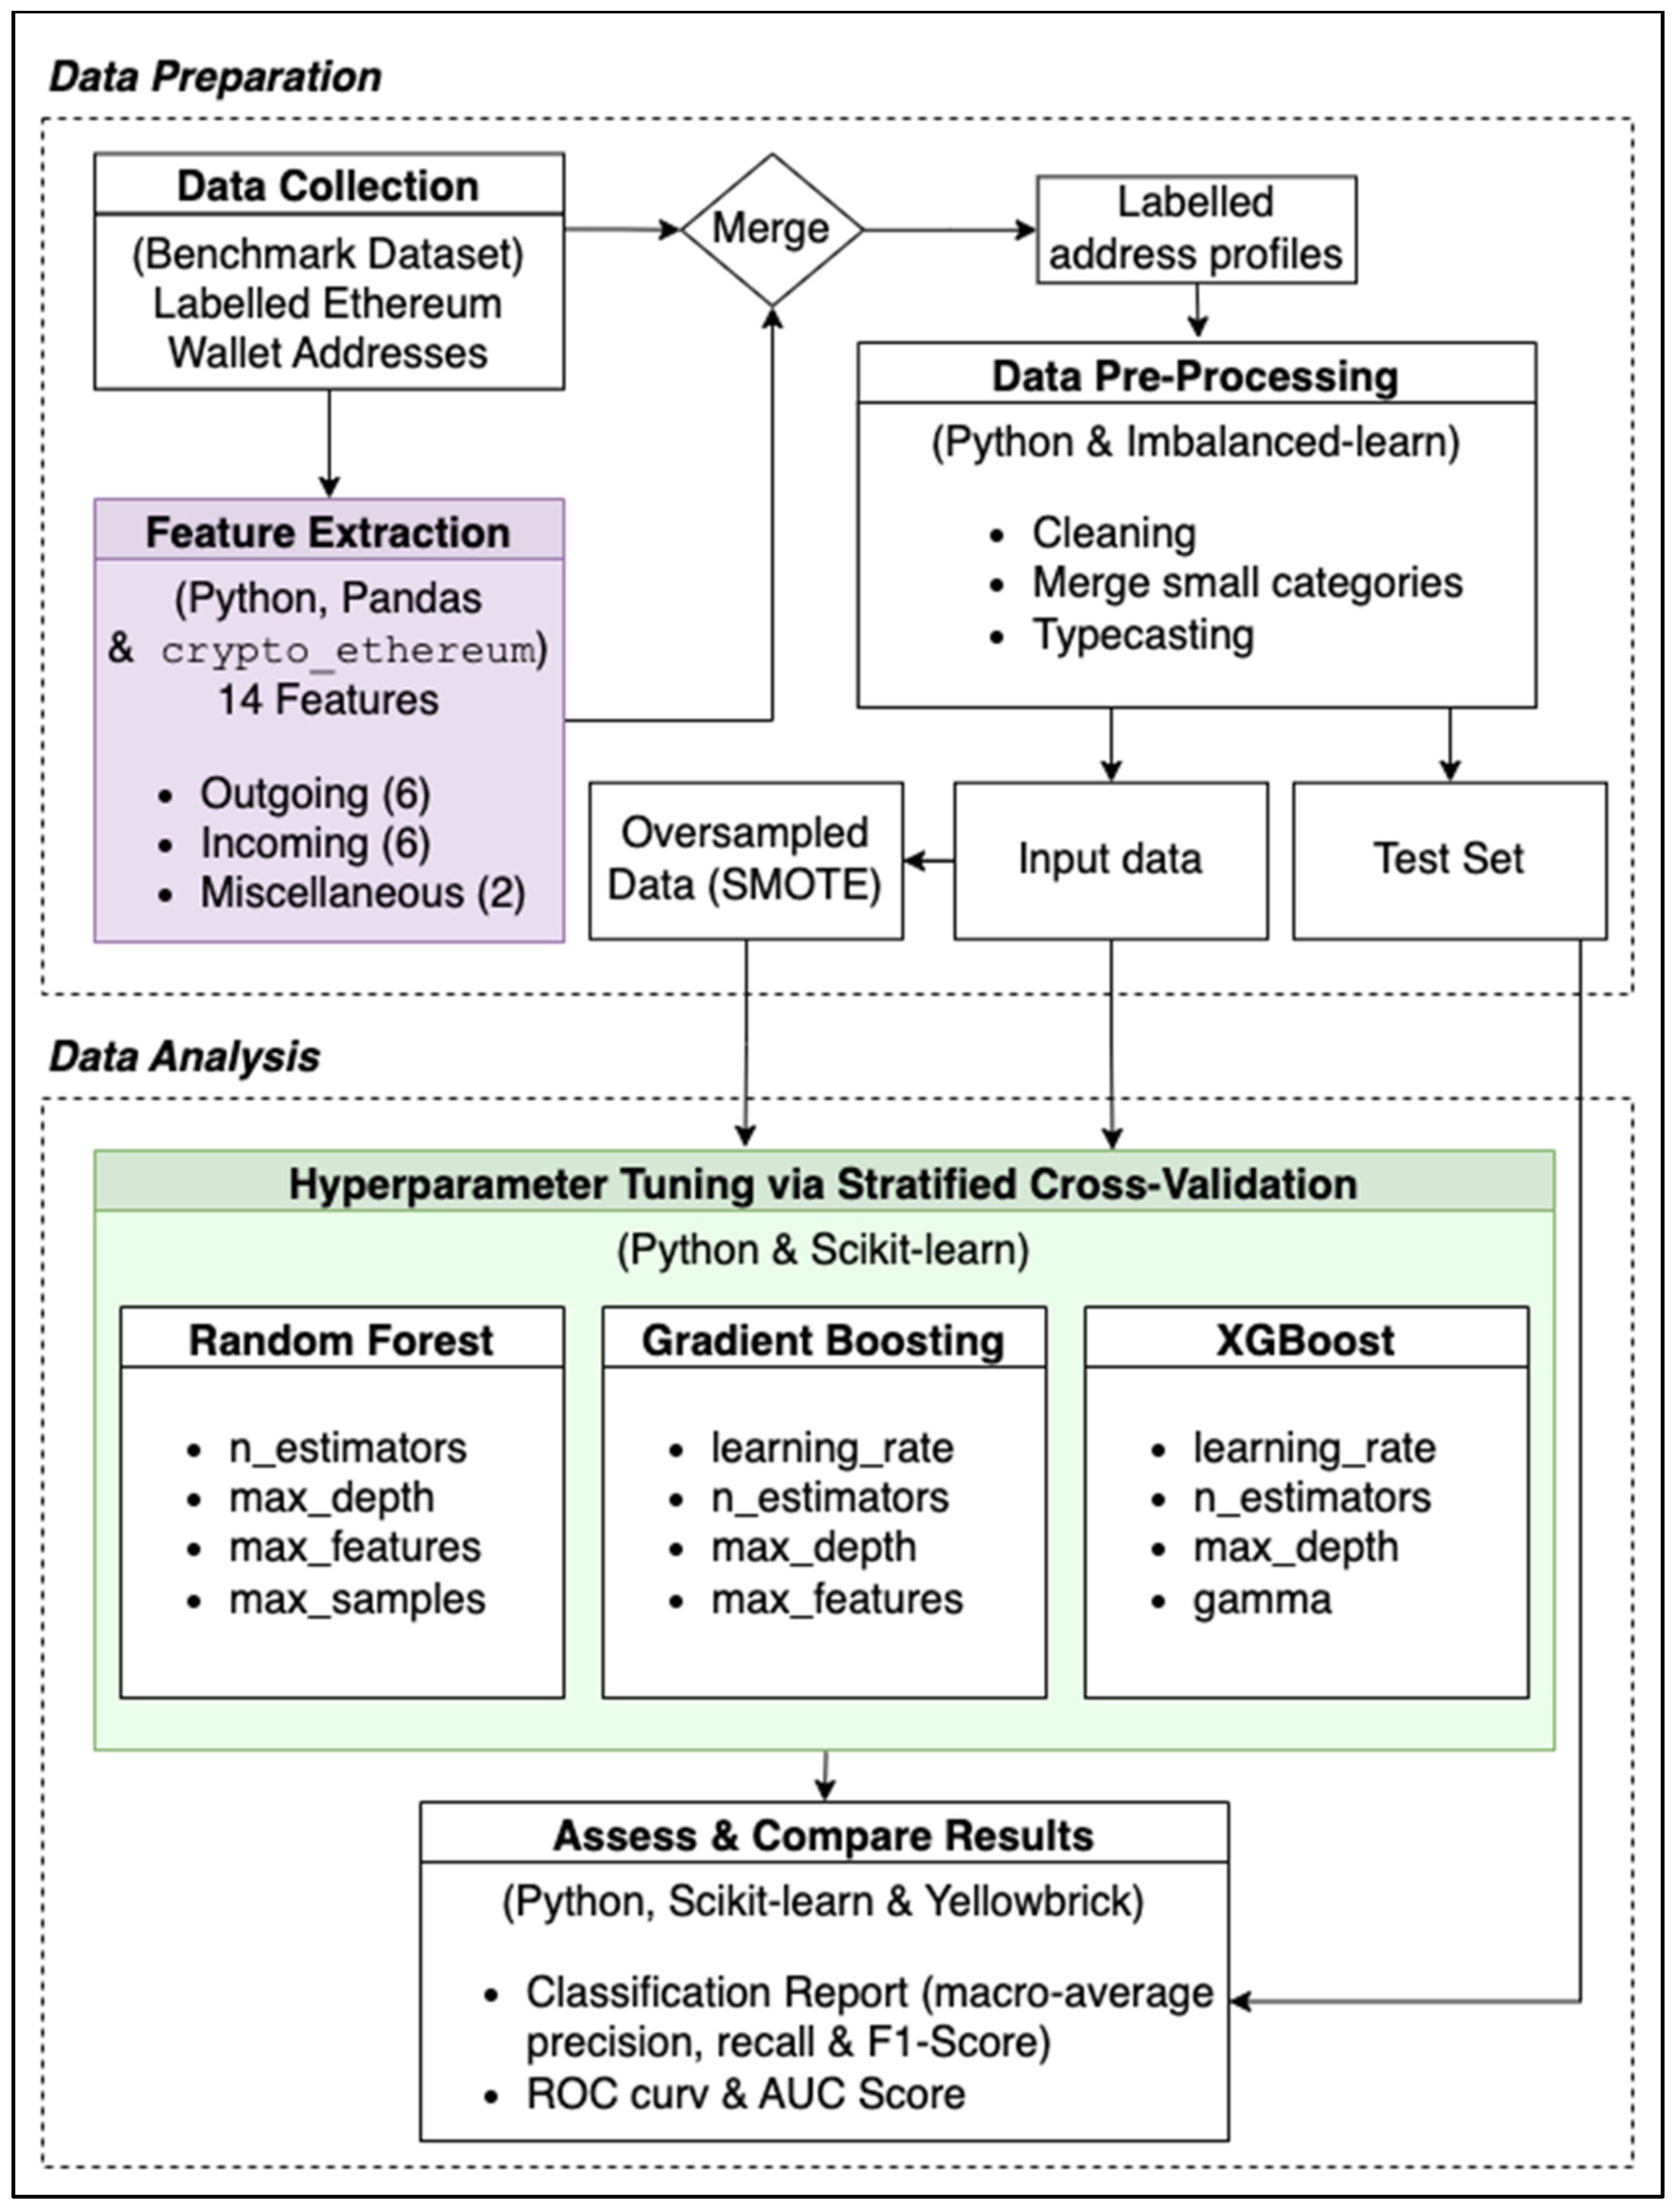
This work can be divided into two main phases: (1) the data preparation phase and (2) the data analysis phase (see
Figure 3).
The main steps in the data preparation phase are feature extraction and data pre-processing, which produces and transforms the dataset to be readable by the machine learning algorithms. The Google BigQuery public Ethereum dataset was used to extract the features described in
Table 2. These features were chosen by referencing the common features across various similar works [
4,
46,
49,
50]. From this phase, two training sets are produced to be applied subsequently in the data-analysis phase, one that is imbalanced and one that is resampled with SMOTE.
The data-analysis phase consists of steps to tune each model with both the training sets and to evaluate each tuned model. Multiple tests are conducted to improve the performance of the model through hyperparameter tuning, which is further discussed in
Section 5. Each tuned model is then evaluated with a classification report that details the macro-average precision, recall and F1-Score. The models are also evaluated using the ROC curve plot and the AUC score.
4.1. Dataset Description
The dataset that is compiled after the feature extraction and pre-processing phase contains 4371 rows of data. Each row consists of the data described in
Table 2.
In total, there are nine categories to be classified: Phish/Hack, Scamming, Upbit Hack, Exchange, Gitcoin Grants, ICO Wallets, Mining, Others (Legit) and Others (Dodgy). The number of samples per category is reported in
Table 3.
The ‘Others (Legit)’ category includes entities that have fewer than 50 samples each and are labelled as legitimate (see
Table 4). The ‘Others (Dodgy)’ category includes entities that have fewer than 50 samples each and are labelled as dodgy (see
Table 4).
4.1.1. Data Collection and Feature Extraction
To form the described dataset, a list of known Ethereum addresses is first obtained from a public Kaggle challenge [
13]. This dataset has been used in previous similar work uncovering the anonymity of Ethereum addresses [
2]. This dataset was created using data from Etherscan and cryptoscam.db. In total, the dataset contains 5774 labelled wallet addresses related to exchanges, ICO wallets, mining, scamming, Phish/Hack, Upbit Hack, and other categories (see
Table 3 and
Table 4).
Before moving on to extracting the features, the dataset was checked for duplicates based on the address. Seven duplicate addresses were identified, with two of them having contradicting categories, where one is labelled as a legitimate entity and the other as dodgy. Etherscan.io was used to verify the current labels. The more prominent and general label was kept for this study as specified in
Table 5. For example, the Compromised label was kept instead of Exchange considering the priority. The Heist label was kept instead of Cryptopia Hack or Plus Token Scam because the two latter refer to more specific events.
Moving on to feature extraction, the crypto_ethereum dataset from Google BigQuery is used to retrieve the Ethereum wallet address transaction data [
51]. The dataset is updated daily with the Ethereum blockchain data, making it a good choice to gather the relevant data required for this study. It is chosen instead of other methods for its simplicity and strong Online Analytical Processing (OLAP) capabilities. BigQuery supports data aggregation and time series analysis, which is particularly helpful for extracting features such as the average ETH sent by an address or the time difference between the first and last transaction in minutes. Large and complex queries can be executed quickly to retrieve Ethereum wallet transaction data [
52]. The 14 features that were extracted for each of the labelled address are described in
Table 2.
4.1.2. Data Pre-Processing
The rows with null values are then removed, leaving 4371 samples remaining. The categories with fewer than 50 samples each are merged into the categories ‘Others (Legit)’ and ‘Others (Dodgy)’, respectively, based on the label column (see
Table 4).
The first pre-processing step carried out was to drop columns that were irrelevant to the model training process. This is followed by typecasting the columns accordingly. This is because some feature columns do not have the right data type set correctly in accordance with the value it holds. Next, as all the features that retrieve the value of the transactions were retrieved in Wei, these columns are divided by 1018 to convert those values to ETH representation. Following that, the columns with values that had many decimal places were rounded up to two decimal places.
4.1.3. Data Preparation
The dataset is highly imbalanced, with more than 60% of the samples belonging to the categories Phish/Hack and Scamming. While the models are trained with the original dataset, it is desired to also have a balanced dataset to improve the performance of the classification model. There are mainly two resampling methods, which are the undersampling and oversampling techniques. To compensate for the class imbalance in the dataset, SMOTE (Synthetic Minority Over-sampling Technique) is used to oversample the under-represented classes. The SMOTE approach constructs synthetic samples along the line segments joining all the minority class’s nearest neighbours. The use of SMOTE to increase a classifier’s sensitivity to the under-represented class has been shown to improve the performance of the prediction model in other similar works [
5].
Other than the resampling techniques discussed above, cross-validation is also applied to prevent overfitting, as the training instances are independent of the validation instances [
53]. It is used instead of other validation techniques to estimate the model’s performance due to this research’s limited data samples. More specifically, stratified k-fold cross-validation is used to make sure that sampling is performed in such a way that the class ratios reflect the training set [
54], thus avoiding a biased evaluation [
55].
4.2. Supervised Machine Learning Algorithms
This study applied and compared the supervised machine learning algorithms, which are popular choices for analysing cryptocurrency transaction data [
4,
5,
6,
7,
10]. Specifically, the Random Forests, Gradient Boosting and XGBoost were applied, as they were found to be top performers in similar problems from past works.
4.3. Hyperparameter Tuning
Randomised Search was used because, given the same number of data, it is both theoretically and empirically more effective when compared to Grid Search at exploring a wider range of values for each parameter and less likely to waste time on pointless hyper-parameters [
56]. Furthermore, the runtime can be controlled. Unlike Grid Search, Randomised Search does not try out all possible combinations of the parameter values defined in the parameter grid. Instead, the number of parameter combinations, or iterations, can be set.
As explained in previous chapters, the models are tuned with two separate training sets. The first set, which is the original train set, contains 3496 samples and is imbalanced. The second set, which is resampled with SMOTE to balance the train set, contains 11,583 samples. The models were trained with both sets to investigate if resampling the dataset to balance it can improve the performance for this problem. A potential trade-off is the higher time consumption required to tune the model with a larger dataset due to oversampling. The models are tuned in multiple rounds with a search space with varying parameters and setups, as further described in
Section 5. The macro-averaged F1-Score was used to determine if an estimator is refitted using the optimal parameters found.
4.4. Model Evaluation
The test set that is used to evaluate the models consists of 875 samples. The performance of the classification models is evaluated using the macro average precision, recall, and F1-Score. These evaluation metrics were chosen as they consider the imbalanced nature of the dataset. In addition to these evaluation metrics, the ROC curve is also plotted and the AUC score is noted. These metrics were chosen because they have been used as performance indicators in several related works which used an imbalanced dataset to train their models [
5,
9].
Precision measures how much the model can be trusted when predicting an individual as Positive, while Recall gauges how well a model can identify all Positive cases in a dataset [
57]. Following that, the F1-Score is the harmonic mean of the Precision and Recall values, which help determine the ideal trade-off between the two quantities [
58]. The ROC curve maps the sensitivity (true positive rate) by 1 minus specificity (false positive rate), showing the trade-off between the two [
59]. Curves that are closer to the top-left corner indicate better performance. The AUC score reflects how well the model is at distinguishing between the different classes [
16]. An AUC of 0.5 typically indicates no discrimination, while values between 0.7 and 0.8 are regarded as acceptable, values between 0.8 and 0.9 are regarded as excellent, and values above 0.9 are regarded as outstanding [
60].
Macro-averaging was chosen as it treats all classes equally and is insensitive to the imbalance in a dataset, whereas micro-averaging, which is essentially the accuracy score, favours larger classes [
31]. Thus, the commonly used predictive accuracy was not given much importance as it was considered to be unsuitable for this research due to the dataset imbalance. A high performance score can be incorrectly implied if the classifier successfully predicts all the addresses in the majority class even if the minority class addresses are not correctly classified [
15].
5. Results
The test ID provides some insight as to what model was tuned and with what setup. The first part of the ID denotes the model tuned. ‘RF’ represents Random Forest, ‘GB’ stands for Gradient Boosting and ‘XGB’ represents XGBoost. The second part of the ID indicates the type of train set used. ‘O’ represents using the original train set, and ‘S’ represents using the resampled (SMOTE) train set to tune the model. The number at the end of the test ID represents the round in which it was tested. Tests in the same round, for the same model, use the same parameter search space. For example, the test ID ‘RF-O-1′ refers to a Random Forest model tuned using the original dataset with the first round hyperparameter search space.
5.1. Random Forest Classifier Results
For the Random Forest classifier, the parameters that were tuned are the number of estimators, the max depth, the max features, and the max samples. The first round of parameter search space is as described in
Table 6. The evaluation results and the best parameters that were found for the Random Forest classifier on each test are reported in
Table 7 and
Table 8, respectively.
The initial parameters are set based on values that are commonly applied (see
Table 6). The second-round parameter search space was adjusted based on the best parameters found. If the best parameters found in the first round were near the edge of the range specified in the search space, a larger range is defined for the next round. The reason for expanding the range is that the actual optimum value may lie beyond the range initial set. As shown in
Table 7, the second round of tests indeed showed better results compared to the first.
However, the model’s performance was still not very accurate. Hence, another round of tests with 100-fold cross-validation was carried out. In theory, a higher value of
k would decrease the bias and result in lower prediction error as the model is trained on more data [
61]. The results showed significant improvements. However, the impact of the bias–variance trade-off for this work has not yet been explored [
62,
63]. Therefore, the high-performance result may be a misrepresentation of the actual skill of the model. Another round of hyperparameter tuning as carried out with five-fold cross-validation, which is a commonly applied
k value, and the number iterations was increased to 100 to explore more parameters.
5.2. Gradient Boosting Classifier Results
For the Gradient Boosting classifier, the parameters that were tuned are the number of estimators, the max depth, the max features, and the learning rate. The first round hyperparameter search space for Gradient Boosting is as described in
Table 9. The evaluation results and the best parameters that were found for the Gradient Boosting classifier on each test are reported in
Table 10 and
Table 11, respectively. The Gradient Boosting classifier tests were carried out with the same steps as for the Random Forest classifier tests.
As shown in
Table 10, the Gradient Boosting classifier performs better than the Random Forest classifier at classifying the Ethereum wallet addresses in general.
5.3. XGBoost Classifier Results
For the XGBoost classifier, the parameters that were tuned are the number of estimators, the max depth, the learning rate and the gamma value. The first round hyperparameter search space for XGBoost is as described in
Table 12. The evaluation results and the best parameters that were found for the XGBoost classifier on each test are reported in
Table 13 and
Table 14, respectively. The XGBoost classifier tests were carried out with similar steps as for the previous two classifier tests. The second round of tests was omitted as the evaluation results were worse than in the first round.
As shown in
Table 13, the XGBoost performs better than the Random Forest classifier in general and performs better than the Gradient Boosting classifier in some cases.
5.4. Interpretation of Results and Experimental Conclusions
In some cases, the performance of the model improved using the training set that has SMOTE applied to compensate for the class imbalance. This can be seen in 8 out of the 11 tests that used the resampled training set. The improvement may, however, be a result of overfitting, even though the overall findings with over-sampling are somewhat better than the results with the original dataset. The SMOTE algorithm still has certain drawbacks despite its ability to somewhat prevent overfitting as compared to random oversampling. New samples that are generated from a small sample generation area could still lead to overfitting. Furthermore, the synthetic generation of new samples may blur the boundaries of the majority and minority classes, thus making the data-classification task more difficult [
64]. Hence, the slightly improved results that were achieved by applying SMOTE should be taken with caution. For comparing the performance between the models, the SMOTE-based results are not considered.
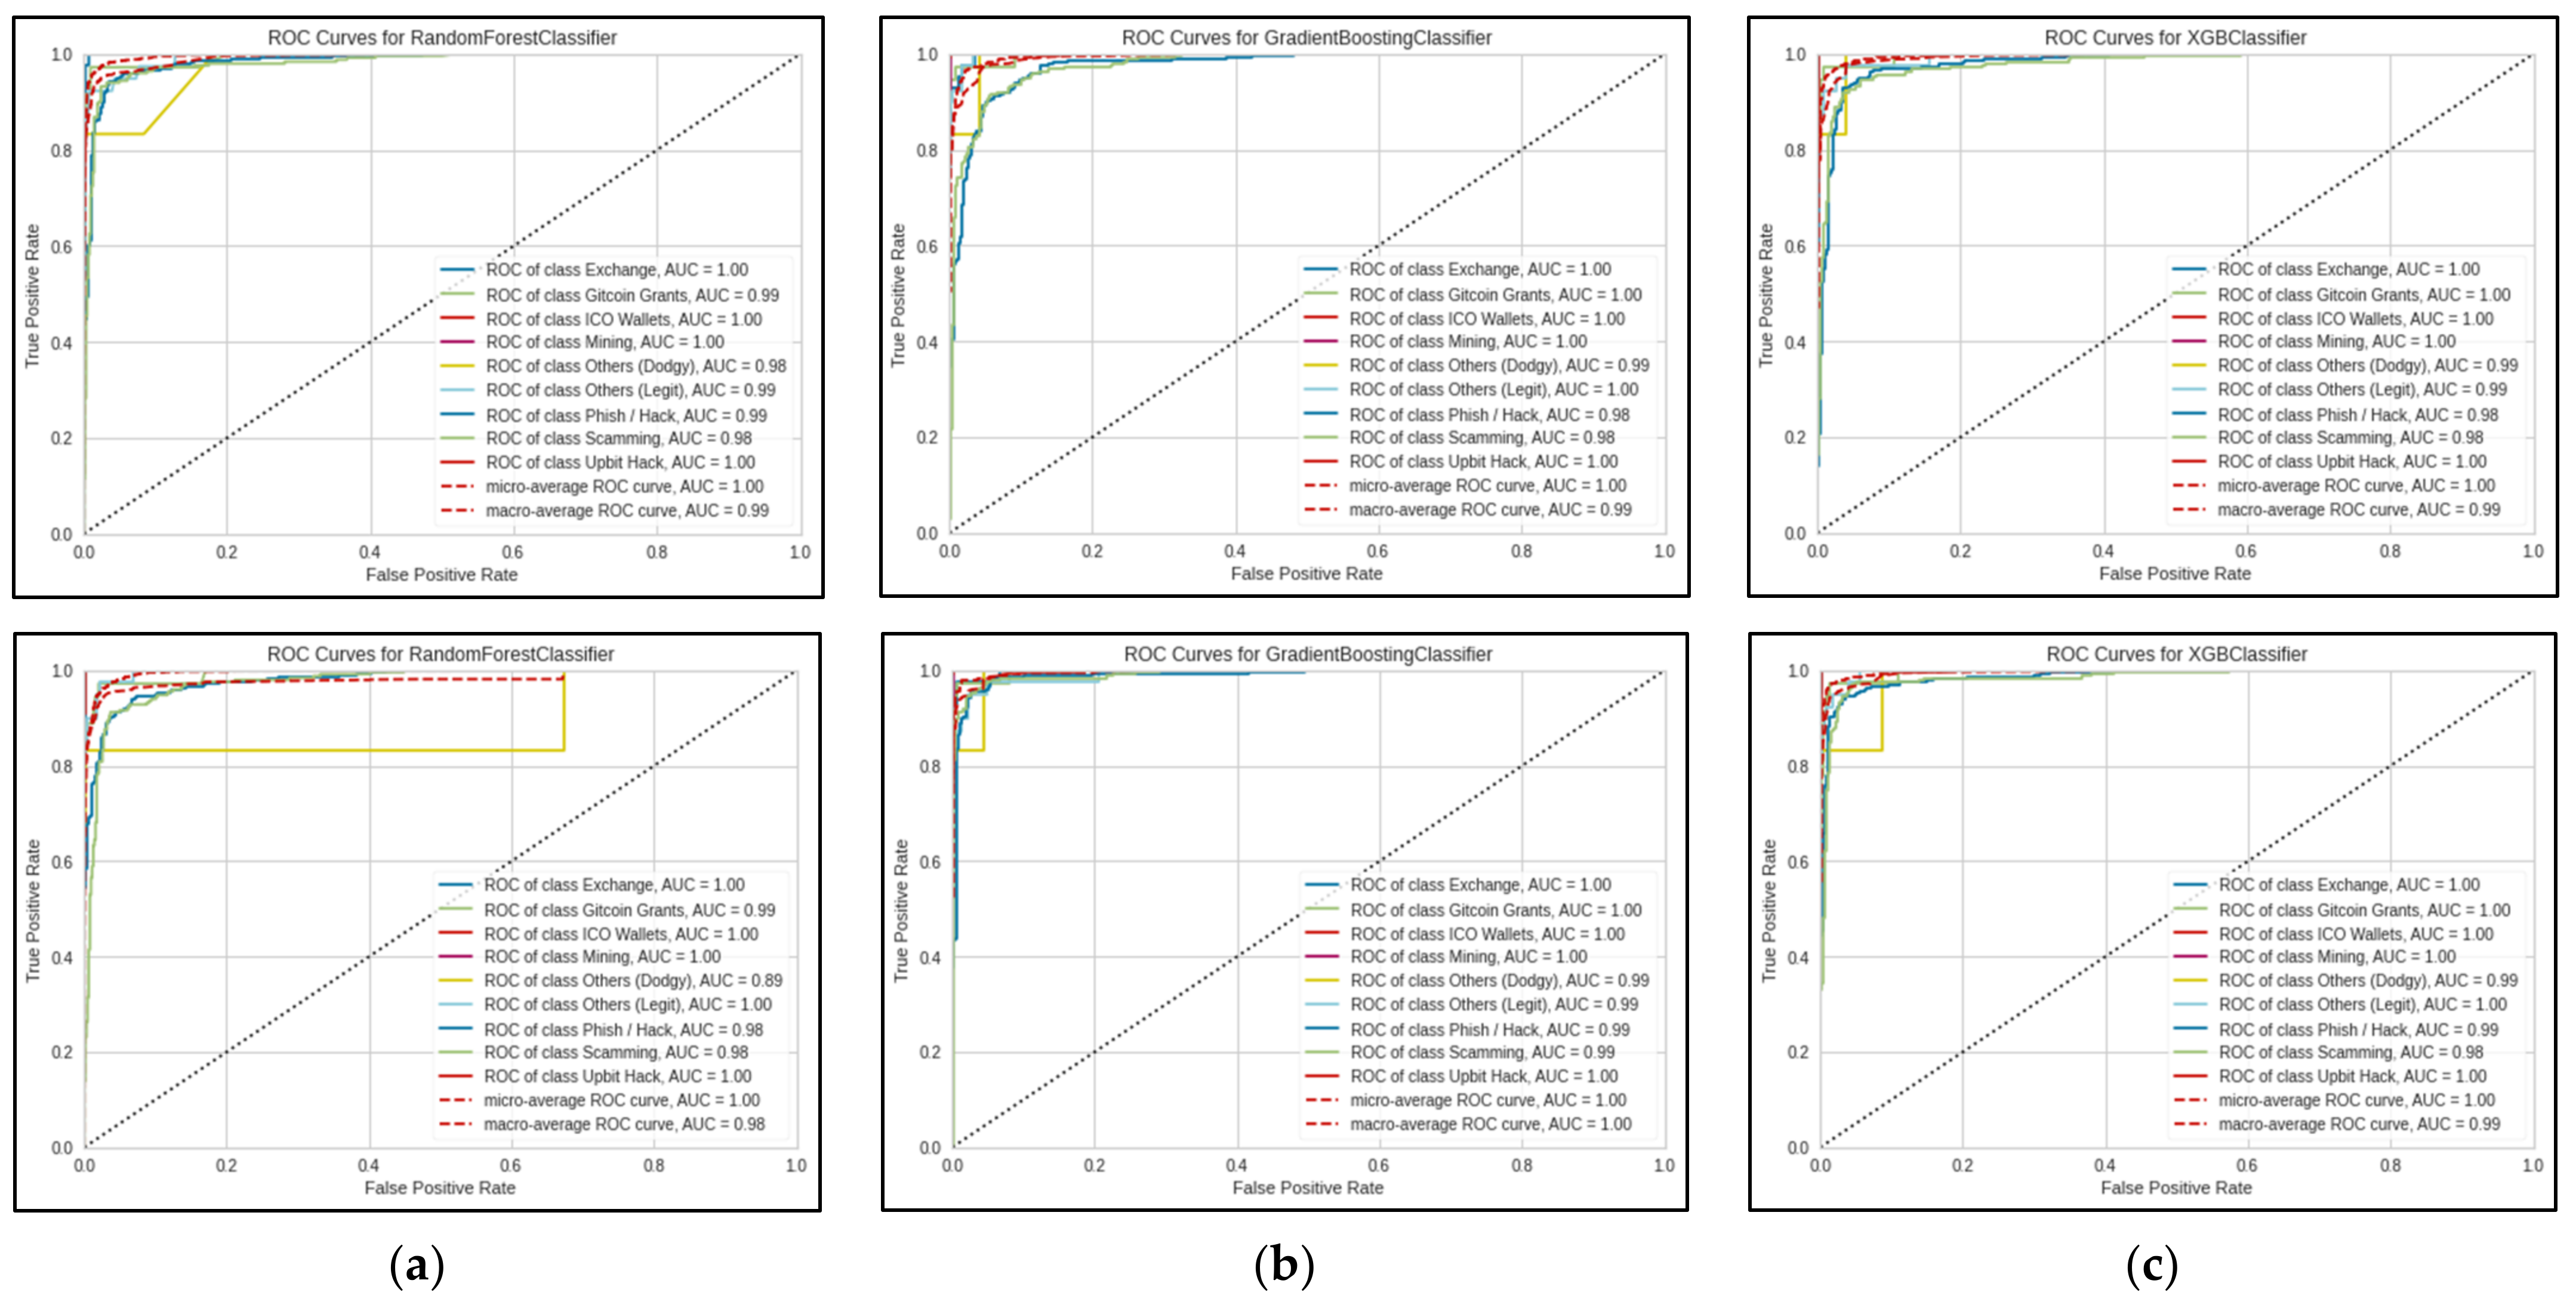
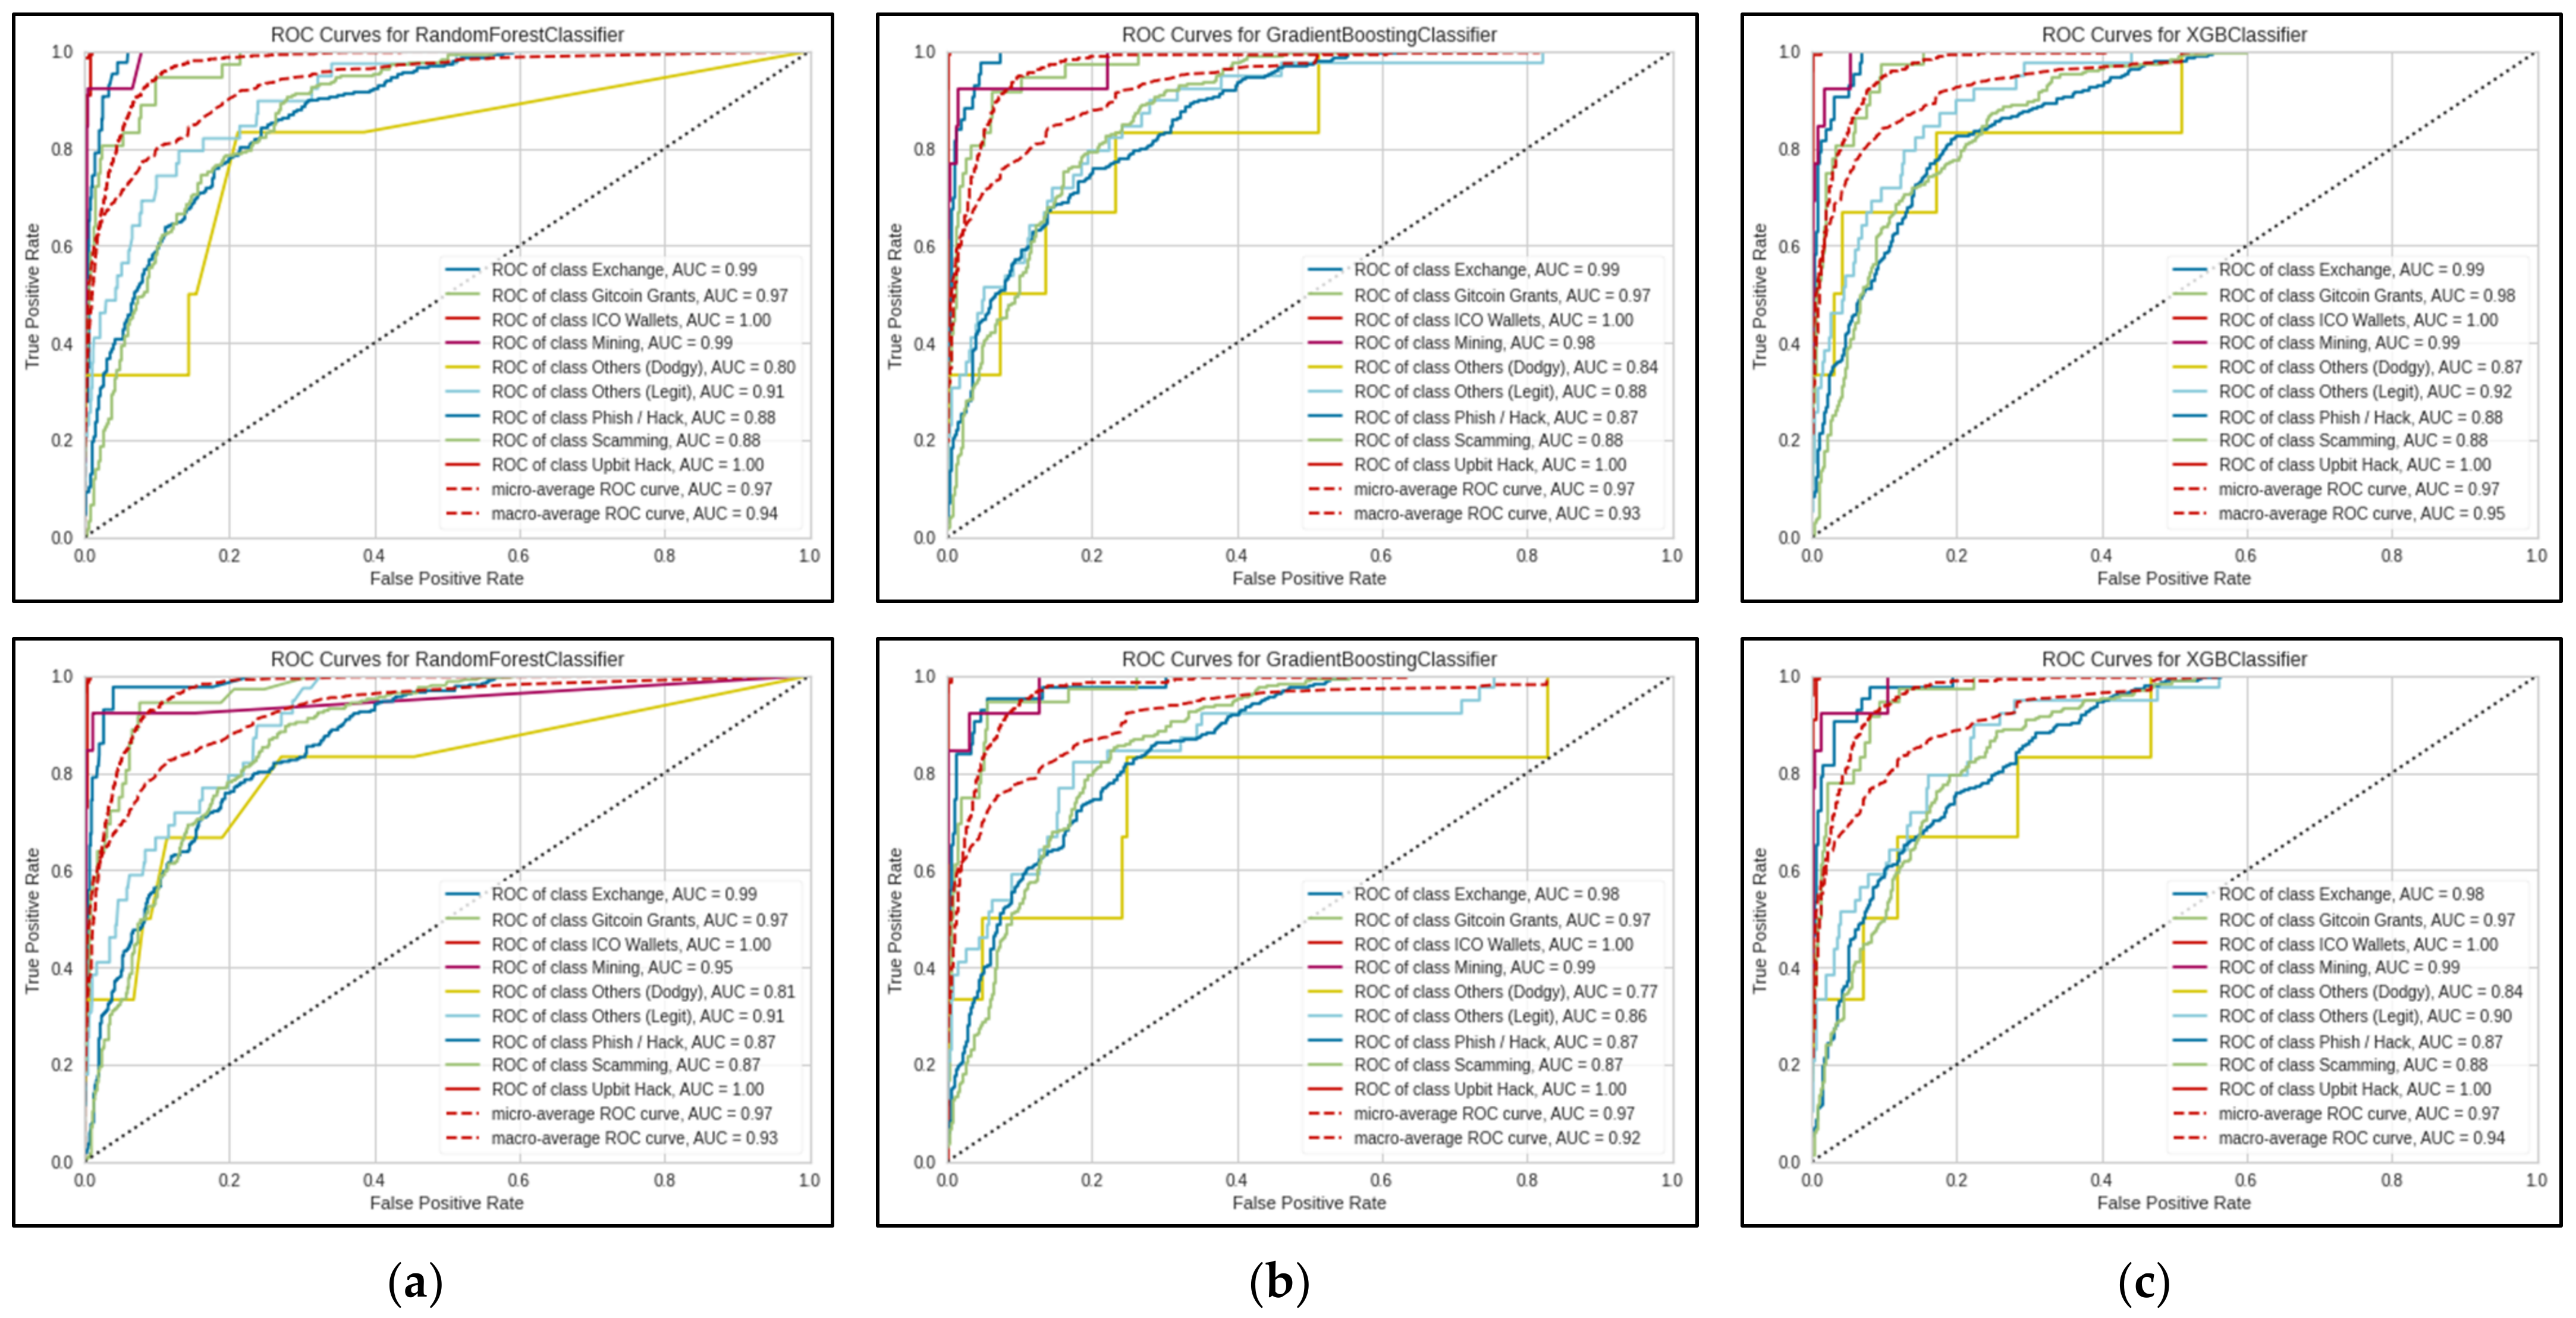
As shown in
Figure 4 and
Figure 5, the small sample size resulted in the jagged lines visualised in the ROC curve. ROC curves are usually smoother, like the micro and macro average ROC curves in the same Figure. The ROC curves also illustrate that the models have difficulties when predicting the ‘Others (Dodgy)’ category, which may be attributed to the significantly smaller sample size. In addition, the classification report (see
Table 15) shows that the model also has difficulty predicting observations from both the ‘Others’ categories, which can be explained by the fact that both the ‘Others’ categories encompass a wide range of categories, as noted in
Table 4.
Overall, XGBoost achieved the best performance compared to the Random Forest classifier and the Gradient Boosting classifier. With five-fold cross-validation and 100 iterations, the tuned XGBoost model had an accuracy of 75.3%, a precision of 77.9%, a recall of 67.3% and an F1-Score of 68.9%. Additionally, the ROC curve shows the micro and macro average AUC scores of 0.97 and 0.94, respectively. Except for precision, the overall scores were lower compared to other similar past work. Therefore, there is a need for further improvements, particularly addressing the data limitations of this study.
6. Discussion
In this work, a multiclass classification of Ethereum wallet addresses was conducted. The Random Forest classifier, Gradient Boosting classifier and XGBoost classifier were tuned to achieve the best performance and evaluated. The aim was to investigate the performance of different supervised learning models in identifying user groups using patterns in the transaction activity of Ethereum addresses. The results show that XGBoost performed the best in predicting the category of the addresses. By utilising addresses that have already been labelled, the XGBoost model was able to achieve an accuracy of 75.3%, a precision of 0.779, a recall of 0.673 and an F1-Score of 0.689. In addition, it was able to achieve micro and macro average AUC scores of 0.97 and 0.94, respectively. The outcome of this work demonstrates that it is possible to narrow down and identify the potential owner of an Ethereum wallet address to a certain degree based on its transaction behaviour. The accuracy score is to be taken with caution as it does not consider the imbalanced nature of the dataset. The precision indicates that about 77.9% of the addresses predicted by the model belonging to a particular category were indeed correctly classified. The recall shows that approximately 67.3% of the actual addresses of a specific category were correctly identified by the model. The 0.689 F1-score shows the balance between precision and recall, indicating that the model is able to classify the various categories to a certain degree. A micro average AUC of 0.97 and a macro average AUC of 0.94 indicate high overall discriminatory power and performance of the model in differentiating between multiple categories.
Nevertheless, the dataset was limited in size and was highly imbalanced. The two largest classes consisted of about 65% of the total samples, while the two smallest classes consisted of only about 1.7%. Therefore, although some methods were implemented to compensate for the imbalance, this research was still limited in terms of the data used to train the models. Hence, moving forward, increasing the low sample size of the labelled addresses as a larger sample size can potentially improve the performance of the classifier. Class weights can also be assigned to prevent the classifier from being biased towards the majority class. In addition, modified versions of XGBoost, such as cost-sensitive XGBoost (CS-XGB), can also be explored to tackle the data-imbalance problem.
Furthermore, other potential features can be extracted from additional data that were not considered, such as ERC20 token transfers, especially those involving Stablecoins such as USDT or DAI. Incorporating these Stablecoin features could significantly enhance the prediction performance. Stablecoins can be particularly valuable in understanding address behaviour, since they are typically backed by external assets such as gold or fiat currencies, giving them real value. Additional features may also extend towards internal transactions that are carried out through a smart contract.
Additionally, the pre-processing step could be improved by further understanding the characteristics of different categories and handling missing values accordingly. Rather than merely removing instances with missing data, a more effective approach could involve imputing the missing values with ‘0’. This is because the absence of data is likely due to the address having no transactions associated with it.
Another possibility for future work is exploring the combination of clustering to identify entities that are likely in control of multiple addresses and the classification of addresses on the groups identified towards the goal of forming risk profiles of addresses on the Ethereum blockchain. This can help law enforcement and investigative agencies to efficiently trace the flow of funds or flag any suspicious groups of addresses that would prompt further investigation.
7. Conclusions
This work focuses on conducting a multiclass classification of Ethereum wallet addresses to uncover Ethereum’s anonymity level. The study evaluates the performance of three classifiers—Random Forest, Gradient Boosting, and XGBoost—in predicting the category of Ethereum addresses based on transaction activity patterns. XGBoost yielded the best results with 75.3% accuracy, 0.779 precision, 0.673 recall, and 0.689 F1-Score. The study demonstrates the possibility of identifying the potential label of an Ethereum wallet address to a certain degree. For future work, it will be beneficial to increase the labelled address sample size and explore additional features that can help differentiate between the categories.
Author Contributions
Conceptualization, T.T.N.P., J.V.J.T., M.A.V. and S.R.; investigation, T.T.N.P., J.V.J.T., M.A.V. and S.R.; methodology, T.T.N.P., J.V.J.T. and M.A.V.; validation, T.T.N.P. and J.V.J.T.; visualization, J.V.J.T.; writing—original draft, T.T.N.P., J.V.J.T., M.A.V. and S.R.; writing—review and editing, T.T.N.P., J.V.J.T., M.A.V. and S.R. All authors have read and agreed to the published version of the manuscript.
Funding
This research received no external funding.
Data Availability Statement
Acknowledgments
We thank Kaggle, Google BigQuery project for the datasets being publicly accessible and the Postgraduate research center for their remote access to the machines to conduct experiments, and VIT research lab, International research Sathyabama lab for their support.
Conflicts of Interest
The authors declare no conflict of interest.
References
- CoinMarketCap Cryptocurrency Prices, Charts and Market Capitalizations. Available online: https://coinmarketcap.com/ (accessed on 12 March 2023).
- Wu, M.; McTighe, W.; Wang, K.; Seres, I.A.; Bax, N.; Puebla, M.; Mendez, M.; Carrone, F.; De Mattey, T.; Demaestri, H.O.; et al. Tutela: An Open-Source Tool for Assessing User-Privacy on Ethereum and Tornado Cash. arXiv 2022, arXiv:2201.06811. [Google Scholar]
- Grauer, K.; Jardine, E.; Leosz, E.; Updegrave, H. The 2023 Crypto Crime Report; Chainalysis: New York, NY, USA, 2023. [Google Scholar]
- Farrugia, S.; Ellul, J.; Azzopardi, G. Detection of Illicit Accounts over the Ethereum Blockchain. Expert Syst. Appl. 2020, 150, 113318. [Google Scholar] [CrossRef] [Green Version]
- Harlev, M.A.; Sun Yin, H.; Langenheldt, K.C.; Mukkamala, R.; Vatrapu, R. Breaking Bad: De-Anonymising Entity Types on the Bitcoin Blockchain Using Supervised Machine Learning; Publisher Hawaii International Conference on System Sciences (HICSS): Honolulu, HI, USA, 2018; ISBN 978-0-9981331-1-9. [Google Scholar]
- Alarab, I.; Prakoonwit, S.; Nacer, M.I. Comparative Analysis Using Supervised Learning Methods for Anti-Money Laundering in Bitcoin. In Proceedings of the 2020 5th International Conference on Machine Learning Technologies, Beijing, China, 19–21 June 2020; ACM: New York, NY, USA, 2020; pp. 11–17. [Google Scholar]
- Kumar, N.; Singh, A.; Handa, A.; Shukla, S.K. Detecting Malicious Accounts on the Ethereum Blockchain with Supervised Learning. In Cyber Security Cryptography and Machine Learning; Dolev, S., Kolesnikov, V., Lodha, S., Weiss, G., Eds.; Lecture Notes in Computer Science; Springer International Publishing: Cham, Switzerland, 2020; Volume 12161, pp. 94–109. ISBN 978-3-030-49784-2. [Google Scholar]
- Lorenz, J.; Silva, M.I.; Aparício, D.; Ascensão, J.T.; Bizarro, P. Machine Learning Methods to Detect Money Laundering in the Bitcoin Blockchain in the Presence of Label Scarcity. In Proceedings of the First ACM International Conference on AI in Finance, New York, NY, USA, 15–16 October 2020; ACM: New York, NY, USA, 2020; pp. 1–8. [Google Scholar]
- Poursafaei, F.; Hamad, G.B.; Zilic, Z. Detecting Malicious Ethereum Entities via Application of Machine Learning Classification. In Proceedings of the 2020 2nd Conference on Blockchain Research & Applications for Innovative Networks and Services (BRAINS), Paris, France, 28–30 September 2020; IEEE: Piscataway, NJ, USA, 2020; pp. 120–127. [Google Scholar]
- Weber, M.; Domeniconi, G.; Chen, J.; Weidele, D.K.I.; Bellei, C.; Robinson, T.; Leiserson, C.E. Anti-Money Laundering in Bitcoin: Experimenting with Graph Convolutional Networks for Financial Forensics. arXiv 2019, arXiv:1908.02591. [Google Scholar]
- Sun Yin, H.H.; Langenheldt, K.; Harlev, M.; Mukkamala, R.R.; Vatrapu, R. Regulating Cryptocurrencies: A Supervised Machine Learning Approach to De-Anonymizing the Bitcoin Blockchain. J. Manag. Inf. Syst. 2019, 36, 37–73. [Google Scholar] [CrossRef]
- Zola, F.; Eguimendia, M.; Bruse, J.L.; Orduna Urrutia, R. Cascading Machine Learning to Attack Bitcoin Anonymity. In Proceedings of the 2019 IEEE International Conference on Blockchain (Blockchain), Seoul, Korea, 14–17 July 2019; IEEE: Atlanta, GA, USA, 2019; pp. 10–17. [Google Scholar]
- Hall, H. Labelled Ethereum Addresses|Kaggle. Available online: https://www.kaggle.com/datasets/hamishhall/labelled-ethereum-addresses (accessed on 9 March 2023).
- Chawla, N.V.; Bowyer, K.W.; Hall, L.O.; Kegelmeyer, W.P. SMOTE: Synthetic Minority Over-Sampling Technique. J. Artif. Intell. Res. 2002, 16, 321–357. [Google Scholar] [CrossRef]
- Chawla, N.V. Data Mining for Imbalanced Datasets: An Overview. In Data Mining and Knowledge Discovery Handbook; Maimon, O., Rokach, L., Eds.; Springer: New York, NY, USA, 2005; pp. 853–867. ISBN 978-0-387-24435-8. [Google Scholar]
- Akobeng, A.K. Understanding Diagnostic Tests 3: Receiver Operating Characteristic Curves. Acta Paediatr. 2007, 96, 644–647. [Google Scholar] [CrossRef] [PubMed]
- Crosby, M.; Nachiappan; Pattanayak, P.; Verma, S.; Kalyanaraman, V. BlockChain Technology: Beyond Bitcoin; Sutardja Center for Entrepreneurship and Technology: Berkeley, CA, USA, 2016. [Google Scholar]
- Zheng, Z.; Xie, S.; Dai, H.; Chen, X.; Wang, H. An Overview of Blockchain Technology: Architecture, Consensus, and Future Trends. In Proceedings of the 2017 IEEE International Congress on Big Data (BigData Congress), Honolulu, HI, USA, 25–30 June 2017; pp. 557–564. [Google Scholar]
- Niranjanamurthy, M.; Nithya, B.N.; Jagannatha, S. Analysis of Blockchain Technology: Pros, Cons and SWOT|SpringerLink. Available online: https://link.springer.com/article/10.1007/s10586-018-2387-5 (accessed on 24 July 2023).
- Andoni, M.; Robu, V.; Flynn, D.; Abram, S.; Geach, D.; Jenkins, D.; McCallum, P.; Peacock, A. Blockchain Technology in the Energy Sector: A Systematic Review of Challenges and Opportunities. Renew. Sustain. Energy Rev. 2019, 100, 143–174. [Google Scholar] [CrossRef]
- Monrat, A.A.; Schelén, O.; Andersson, K. A Survey of Blockchain from the Perspectives of Applications, Challenges, and Opportunities. IEEE Access 2019, 7, 117134–117151. [Google Scholar] [CrossRef]
- Ferretti, S.; D’Angelo, G. On the Ethereum Blockchain Structure: A Complex Networks Theory Perspective. Concurr. Comput. Pract. Exp. 2020, 32, e5493. [Google Scholar] [CrossRef] [Green Version]
- Zheng, Z.; Xie, S.; Dai, H.-N.; Chen, X.; Wang, H. Blockchain Challenges and Opportunities: A Survey. Int. J. Web Grid Serv. 2018, 14, 352–375. [Google Scholar] [CrossRef]
- Nakamoto, S. Bitcoin: A Peer-to-Peer Electronic Cash System. Available online: https://bitcoin.org/bitcoin.pdf (accessed on 24 July 2023).
- Buterin, V. A Next Generation Smart Contract & Decentralized Application Platform. Available online: https://finpedia.vn/wp-content/uploads/2022/02/Ethereum_white_paper-a_next_generation_smart_contract_and_decentralized_application_platform-vitalik-buterin.pdf (accessed on 24 July 2023).
- Vujičić, D.; Jagodić, D.; Ranđić, S. Blockchain Technology, Bitcoin, and Ethereum: A Brief Overview. In Proceedings of the 2018 17th International Symposium INFOTEH-JAHORINA (INFOTEH), East Sarajevo, Bosnia and Herzegovina, 21–23 March 2018; pp. 1–6. [Google Scholar]
- Wood, D.G. Ethereum: A Secure Decentralised Generalised Transaction Ledger. Available online: https://cryptodeep.ru/doc/paper.pdf (accessed on 24 July 2023).
- Lin, D.; Wu, J.; Yuan, Q.; Zheng, Z. Modeling and Understanding Ethereum Transaction Records via a Complex Network Approach. IEEE Trans. Circuits Syst. II Express Briefs 2020, 67, 2737–2741. [Google Scholar] [CrossRef]
- Zhou, Z.-H. A Brief Introduction to Weakly Supervised Learning. Natl. Sci. Rev. 2018, 5, 44–53. [Google Scholar] [CrossRef] [Green Version]
- Loh, W.-Y. Classification and Regression Trees. WIREs Data Min. Knowl. Discov. 2011, 1, 14–23. [Google Scholar] [CrossRef]
- Sokolova, M.; Lapalme, G. A Systematic Analysis of Performance Measures for Classification Tasks. Inf. Process. Manag. 2009, 45, 427–437. [Google Scholar] [CrossRef]
- Han, J.; Pei, J.; Tong, H. Data Mining: Concepts and Techniques; Morgan Kaufmann: San Francisco, CA, USA, 2022; ISBN 978-0-12-811761-3. [Google Scholar]
- Sarker, I.H. Machine Learning: Algorithms, Real-World Applications and Research Directions. SN Comput. Sci. 2021, 2, 160. [Google Scholar] [CrossRef] [PubMed]
- Amit, Y.; Geman, D. Shape Quantization and Recognition with Randomized Trees. Neural Comput. 1997, 9, 1545–1588. [Google Scholar] [CrossRef] [Green Version]
- Breiman, L. Random Forests. Mach. Learn. 2001, 45, 5–32. [Google Scholar] [CrossRef] [Green Version]
- Cutler, A.; Cutler, D.R.; Stevens, J.R. Random Forests. In Ensemble Machine Learning: Methods and Applications; Zhang, C., Ma, Y., Eds.; Springer: New York, NY, USA, 2012; pp. 157–175. ISBN 978-1-4419-9326-7. [Google Scholar]
- Bentéjac, C.; Csörgő, A.; Martínez-Muñoz, G. A Comparative Analysis of Gradient Boosting Algorithms. Artif. Intell. Rev. 2021, 54, 1937–1967. [Google Scholar] [CrossRef]
- Belgiu, M.; Drăguţ, L. Random Forest in Remote Sensing: A Review of Applications and Future Directions. ISPRS J. Photogramm. Remote Sens. 2016, 114, 24–31. [Google Scholar] [CrossRef]
- Liaw, A.; Wiener, M. Classification and Regression by RandomForest. R News 2002, 2, 18–22. [Google Scholar]
- Friedman, J.H. Greedy Function Approximation: A Gradient Boosting Machine. Ann. Stat. 2001, 29, 1189–1232. [Google Scholar] [CrossRef]
- Freund, Y.; Schapire, R.E. A Short Introduction to Boosting. J. Jpn. Soc. Artif. Intell. 1999, 14, 771–780. [Google Scholar]
- Chakrabarty, N.; Kundu, T.; Dandapat, S.; Sarkar, A.; Kole, D.K. Flight Arrival Delay Prediction Using Gradient Boosting Classifier. In Proceedings of the Emerging Technologies in Data Mining and Information Security; Abraham, A., Dutta, P., Mandal, J.K., Bhattacharya, A., Dutta, S., Eds.; Springer: Singapore, 2019; pp. 651–659. [Google Scholar]
- Chen, T.; Guestrin, C. XGBoost: A Scalable Tree Boosting System. In Proceedings of the 22nd ACM SIGKDD International Conference on Knowledge Discovery and Data Mining, San Francisco, CA, USA, 13–17 August 2016; Association for Computing Machinery: New York, NY, USA, 2016; pp. 785–794. [Google Scholar]
- Chen, Z.; Jiang, F.; Cheng, Y.; Gu, X.; Liu, W.; Peng, J. XGBoost Classifier for DDoS Attack Detection and Analysis in SDN-Based Cloud. In Proceedings of the 2018 IEEE International Conference on Big Data and Smart Computing (BigComp), Shanghai, China, 15–17 January 2018; pp. 251–256. [Google Scholar]
- Victor, F. Address Clustering Heuristics for Ethereum. In Financial Cryptography and Data Security; Bonneau, J., Heninger, N., Eds.; Lecture Notes in Computer Science; Springer International Publishing: Cham, Switzerland, 2020; Volume 12059, pp. 617–633. ISBN 978-3-030-51279-8. [Google Scholar]
- Bhargavi, M.S.; Katti, S.M.; Shilpa, M.; Kulkarni, V.P.; Prasad, S. Transactional Data Analytics for Inferring Behavioural Traits in Ethereum Blockchain Network. In Proceedings of the 2020 IEEE 16th International Conference on Intelligent Computer Communication and Processing (ICCP), Cluj-Napoca, Romania, 3–5 September 2020; IEEE: Piscataway, NJ, USA, 2020; pp. 485–490. [Google Scholar]
- Ashfaq, T.; Khalid, R.; Yahaya, A.S.; Aslam, S.; Azar, A.T.; Alsafari, S.; Hameed, I.A. A Machine Learning and Blockchain Based Efficient Fraud Detection Mechanism. Sensors 2022, 22, 7162. [Google Scholar] [CrossRef]
- Raiter, O. Applying Supervised Machine Learning Algorithms for Fraud Detection in Anti-Money Laundering. J. Mod. Issues Bus. Res. 2021, 1, 14–26. [Google Scholar] [CrossRef]
- Krishnan, L.P.; Vakilinia, I.; Reddivari, S.; Ahuja, S. Scams and Solutions in Cryptocurrencies—A Survey Analyzing Existing Machine Learning Models. Information 2023, 14, 171. [Google Scholar] [CrossRef]
- Payette, J.; Schwager, S.; Murphy, J. Characterizing the Ethereum Address Space. Available online: http://cs229.stanford.edu/proj2017/final-reports/5244232.pdf (accessed on 24 July 2023).
- Day, A.; Medvedev, E.; Risdal, M.; Katesit, T. Ethereum in BigQuery: A Public Dataset for Smart Contract Analytics. Available online: https://cloud.google.com/blog/products/data-analytics/ethereum-bigquery-public-dataset-smart-contract-analytics (accessed on 26 July 2023).
- Johnson, N. Ethereum Analytics with BigQuery. Available online: https://mirror.xyz/nick.eth/INhEmxgxoyoa8kPZ3rjYNZXoyfGsReLgx42MdDvn4SM (accessed on 9 March 2023).
- Arlot, S.; Celisse, A. A Survey of Cross-Validation Procedures for Model Selection. Statist. Surv. 2010, 4, 40–79. [Google Scholar] [CrossRef]
- Refaeilzadeh, P.; Tang, L.; Liu, H. Cross-Validation. In Encyclopedia of Database Systems; Liu, L., Özsu, M.T., Eds.; Springer: Boston, MA, USA, 2009; pp. 532–538. ISBN 978-0-387-35544-3. [Google Scholar]
- Berrar, D. Cross-Validation. In Encyclopedia of Bioinformatics and Computational Biology; Elsevier: Amsterdam, The Netherlands, 2019; pp. 542–545. ISBN 978-0-12-811432-2. [Google Scholar]
- Bergstra, J.; Bengio, Y. Random Search for Hyper-Parameter Optimization. J. Mach. Learn. Res. 2012, 13, 281–305. [Google Scholar]
- Dalianis, H. Evaluation Metrics and Evaluation. In Clinical Text Mining; Springer International Publishing: Cham, Switzerland, 2018; pp. 45–53. ISBN 978-3-319-78502-8. [Google Scholar]
- Grandini, M.; Bagli, E.; Visani, G. Metrics for Multi-Class Classification: An Overview. arXiv 2020, arXiv:2008.05756. [Google Scholar]
- Cook, N.R. Use and Misuse of the Receiver Operating Characteristic Curve in Risk Prediction. Circulation 2007, 115, 928–935. [Google Scholar] [CrossRef] [Green Version]
- Hosmer, D.W., Jr.; Lemeshow, S.; Sturdivant, R.X. Applied Logistic Regression; John Wiley & Sons: Hoboken, NJ, USA, 2013; ISBN 978-0-470-58247-3. [Google Scholar]
- Kovalerchuk, B. Enhancement of Cross Validation Using Hybrid Visual and Analytical Means with Shannon Function. In Beyond Traditional Probabilistic Data Processing Techniques: Interval, Fuzzy etc. Methods and Their Applications; Kosheleva, O., Shary, S.P., Xiang, G., Zapatrin, R., Eds.; Studies in Computational Intelligence; Springer International Publishing: Cham, Switzerland, 2020; Volume 835, pp. 517–543. ISBN 978-3-030-31040-0. [Google Scholar]
- Bengio, Y.; Grandvalet, Y. No Unbiased Estimator of the Variance of K-Fold Cross-Validation. J. Mach. Learn. Res. 2004, 5, 1089–1105. [Google Scholar]
- Zhang, Y.; Yang, Y. Cross-Validation for Selecting a Model Selection Procedure. J. Econom. 2015, 187, 95–112. [Google Scholar] [CrossRef]
- Liang, X.W.; Jiang, A.P.; Li, T.; Xue, Y.Y.; Wang, G.T. LR-SMOTE—An Improved Unbalanced Data Set Oversampling Based on K-Means and SVM. Knowl.-Based Syst. 2020, 196, 105845. [Google Scholar] [CrossRef]
Figure 1.
Distribution of address profiles dataset.
Figure 1.
Distribution of address profiles dataset.
Figure 2.
Blockchain structure [
21].
Figure 2.
Blockchain structure [
21].
Figure 3.
System framework.
Figure 3.
System framework.
Figure 4.
ROC curves for 100 folds, 25 iterations. The first row shows results using the original train set, and the second row shows results using SMOTE train set. (a) ROC curves for Random Forest Classifier; (b) ROC curves for Gradient Boosting Classifier; (c) ROC curves for XGBoost Classifier.
Figure 4.
ROC curves for 100 folds, 25 iterations. The first row shows results using the original train set, and the second row shows results using SMOTE train set. (a) ROC curves for Random Forest Classifier; (b) ROC curves for Gradient Boosting Classifier; (c) ROC curves for XGBoost Classifier.
Figure 5.
ROC curves for 5 folds, 100 iterations. The first row shows results using the original train set, and the second row shows results using SMOTE train set. (a) ROC curves for Random Forest Classifier; (b) ROC curves for Gradient Boosting Classifier; (c) ROC curves for XGBoost Classifier.
Figure 5.
ROC curves for 5 folds, 100 iterations. The first row shows results using the original train set, and the second row shows results using SMOTE train set. (a) ROC curves for Random Forest Classifier; (b) ROC curves for Gradient Boosting Classifier; (c) ROC curves for XGBoost Classifier.
Table 1.
Overview of related works.
Table 1.
Overview of related works.
| Past Work | Aims | Methods | Conclusion | Evaluation |
|---|
| [4] | To identify illicit addresses based on their transaction history on the Ethereum blockchain. | XGBoost Classifier. | Concluded that the XGBoost classification model, which is trained on data from previous transactions and account attributes, may efficiently and effectively detect illicit activity on the Ethereum network at the ‘account level’. | XGBoost achieved an average accuracy of 0.963 and an average AUC of 0.994. |
| [5] | To determine if one can use a set of previously identified clusters as training data to predict the category of a new cluster on the Bitcoin blockchain. | k-Nearest Neighbours,
Random Forests, Extra Trees, AdaBoost, Decision Trees, Bagging Classifier and Gradient Boosting. | Showed that it is possible to limit the number of probable Bitcoin address owners to some extent and that the expected degree of anonymity of the Bitcoin Blockchain is not as high as often believed. | Gradient Boosting Classifier performs the best (accuracy of 77% and F1-score of 0.75), followed by Bagging (0.74% and 0.72) and Random Forest (0.73 and 0.67). |
| [7] | To detect malicious addresses through anomaly detection in the transactional behaviour of the accounts on the Ethereum blockchain. | Random Forest,
XGBoost,
Decision Tree and k-NN. | All models work to a reasonable extent. | XGBoost classifier performed the best for both EOA analysis and smart contract analysis achieving an accuracy of 96.54% and 96.82%, respectively. |
| [9] | To develop automatic analytic tools that can detect the public addresses of entities linked to malicious activity on the Ethereum blockchain. | Logistic Regression, Support Vector Machine, Random Forest, Stacking Classifier and AdaBoost. | Concluded that, taking into account the transaction histories of the Ethereum entities, illicit behaviour on the network may be detected. | Stacking Classifier and AdaBoost both performed the best (accuracy of 99.8% and F1-score of 0.998), followed by Random Forest (99.5% and 0.995). |
| [10] | To reconcile the cause of safety with that of financial inclusion. | Logistic Regression, Random Forest,
Multilayer Perceptrons, and Graph Convolutional Networks. | Presented Bitcoin and cryptocurrency forensics as a unique ecosystem for crowdsourcing the creation of innovative techniques to combat illegal activities. | Random Forest performed the best. |
Table 2.
Dataset columns.
Table 2.
Dataset columns.
| # | Column | Description | Data Type | Type of Feature |
|---|
| 1 | category | Address category (see Table 3) | object | – |
| 2 | eth_balance | ETH Balance | float64 | Miscellaneous |
| 3 | time_diff_btween_first_and_last_in_mins | Time difference between first and last transaction in minutes | float64 |
| 4 | txns_sent | Total number of transactions sent | int64 | Outgoing |
| 5 | total_eth_sent | Total Ether sent | float64 |
| 6 | avg_eth_sent | Average value in Ether ever sent | float64 |
| 7 | min_eth_sent | Minimum value in Ether ever sent | float64 |
| 8 | max_eth_sent | Maximum value in Ether ever sent | float64 |
| 9 | avg_min_between_txn_sent | Average time difference between transactions sent in minutes | float64 |
| 10 | txns_recv | Total number of transactions received | int64 | Incoming |
| 11 | total_eth_ recv | Total Ether received | float64 |
| 12 | avg_eth_ recv | Average value in Ether ever received | float64 |
| 13 | min_eth_ recv | Minimum value in Ether ever received | float64 |
| 14 | max_eth_ recv | Maximum value in Ether ever received | float64 |
| 15 | avg_min_between_txn_ recv | Average time difference between transactions received in minutes | float64 |
Table 3.
Number of samples per category after feature extraction and pre-processing.
Table 3.
Number of samples per category after feature extraction and pre-processing.
| Category | Count |
|---|
| Phish/Hack | 1610 |
| Scamming | 1260 |
| Upbit Hack | 795 |
| Exchange | 217 |
| Others (Legit) | 183 |
| Gitcoin Grants | 169 |
| ICO Wallets | 62 |
| Mining | 52 |
| Others (Dodgy) | 23 |
Table 4.
Groups categorised as ‘Others (Legit)’ and ‘Others (Dodgy)’.
Table 4.
Groups categorised as ‘Others (Legit)’ and ‘Others (Dodgy)’.
| Category | Count |
|---|
| Others (Legit) | Donate, Authereum, Liqui.io, AtomSolutions, MEDIKEY, Pundi X, Wallet App, Scroll Network, Hot Wallet, ENS, CoinMarketFeed, Cold Wallet, MESG, Loans, Trading, CACHE Gold, QuadrigaCX, Resfinex, ShapeShift, Swipe.io, 0xUniverse, Gambling, Airdrop/Distributor, Fiat Gateway, Payment, BitcoinSoV, Gnosis Safe, Matic Network, Silverway Platform, White Hat Group, Band, Basic Attention Token, Brave Frontier Heroes, Bitstamp, Blockchain Cuties, Coinone, OTC, E-Commerce, Real Estate, Bugs, Bridge, Loopring, My Crypto Heroes, Melon, Marketplace, OpenSea, Origo, Advertising, Switcheo, Tokenlon, Closure. |
| Others (Dodgy) | Heist, Compromised, Cryptopia Hack, Fake ICO, bZx Exploit, Website Down, Lendf.Me Hack, EtherDelta Hack, Plus Token Scam, Scam, Suspicious. |
Table 5.
Duplicate Addresses.
Table 5.
Duplicate Addresses.
| # | Address | Categories |
|---|
| Discarded | Kept |
|---|
| 1 | 0x2984581ece53a4390d1f568673cf693139c97049 | Exchange | Compromised |
| 2 | 0x5baeac0a0417a05733884852aa068b706967e790 | Exchange | Compromised |
| 3 | 0x745daa146934b27e3f0b6bff1a6e36b9b90fb131 | Dex | Dex |
| 4 | 0x9007a0421145b06a0345d55a8c0f0327f62a2224 | Cryptopia Hack | Heist |
| 5 | 0xaa923cd02364bb8a4c3d6f894178d2e12231655c | Cryptopia Hack | Heist |
| 6 | 0xc8b759860149542a98a3eb57c14aadf59d6d89b9 | Cryptopia Hack | Heist |
| 7 | 0xf4a2eff88a408ff4c4550148151c33c93442619e | Plus Token Scam | Heist |
Table 6.
Random Forest first round hyperparameter search space.
Table 6.
Random Forest first round hyperparameter search space.
| Hyperparameter | Range |
|---|
| n_estimators | np.arange (50, 200, 15) |
| max_depth | np.arange (2, 10) |
| max_features | [‘sqrt’, ‘log2′, None] |
| max_samples | [0.3, 0.5, 0.8] |
Table 7.
Random Forest classifier results of the best estimator found for each test.
Table 7.
Random Forest classifier results of the best estimator found for each test.
| Test ID | Test Scores |
|---|
| Accuracy | Precision | Recall | F1-Score |
|---|
| RF-O-1 | 0.726 | 0.624 | 0.572 | 0.591 |
| RF-S-1 | 0.683 | 0.598 | 0.625 | 0.596 |
| RF-O-2 | 0.729 | 0.629 | 0.578 | 0.595 |
| RF-S-2 | 0.720 | 0.630 | 0.635 | 0.625 |
| RF-O-3 | 0.937 | 0.941 | 0.904 | 0.921 |
| RF-S-3 | 0.898 | 0.882 | 0.897 | 0.882 |
| RF-O-4 | 0.737 | 0.658 | 0.630 | 0.641 |
| RF-S-4 | 0.723 | 0.681 | 0.690 | 0.679 |
Table 8.
Random Forest classifier number of folds and iterations used and best parameters found for each test.
Table 8.
Random Forest classifier number of folds and iterations used and best parameters found for each test.
| # of Folds | # of Iterations | Test ID | # of Estimators | Max Depth | Max
Features | Max Samples |
|---|
| 3 | 25 | RF-O-1 | 185 | 9 | sqrt | 0.8 |
| RF-S-1 | 185 | 9 | sqrt | 0.8 |
| 3 | 25 | RF-O-2 | 260 | 16 | sqrt | 0.95 |
| RF-S-2 | 290 | 18 | sqrt | 0.85 |
| 100 | 25 | RF-O-3 | 185 | 19 | sqrt | 0.8 |
| RF-S-3 | 260 | 16 | sqrt | 0.95 |
| 5 | 100 | RF-O-4 | 215 | 14 | sqrt | 0.9 |
| RF-S-4 | 185 | 19 | sqrt | 0.9 |
Table 9.
Gradient Boosting first round hyperparameter search space.
Table 9.
Gradient Boosting first round hyperparameter search space.
| Hyperparameter | Range |
|---|
| n_estimators | np.arange (50, 200, 15) |
| max_depth | np.arange (2, 10) |
| max_features | [‘sqrt’, ‘log2′, None] |
| learning_rate | [0.05, 0.1, 0.15, 0.2] |
Table 10.
Gradient Boosting classifier results of best estimator found for each test.
Table 10.
Gradient Boosting classifier results of best estimator found for each test.
| Test ID | Test Scores |
|---|
| Accuracy | Precision | Recall | F1-Score |
|---|
| GB-O-1 | 0.717 | 0.610 | 0.604 | 0.604 |
| GB-S-1 | 0.729 | 0.629 | 0.578 | 0.595 |
| GB-O-2 | 0.739 | 0.689 | 0.588 | 0.626 |
| GB-S-2 | 0.736 | 0.683 | 0.666 | 0.664 |
| GB-O-3 | 0.917 | 0.950 | 0.914 | 0.931 |
| GB-S-3 | 0.950 | 0.929 | 0.930 | 0.929 |
| GB-O-4 | 0.730 | 0.755 | 0.635 | 0.659 |
| GB-S-4 | 0.719 | 0.708 | 0.692 | 0.691 |
Table 11.
Gradient Boosting classifier, number of folds and iterations used, and best parameters found for each test.
Table 11.
Gradient Boosting classifier, number of folds and iterations used, and best parameters found for each test.
| # of Folds | # of Iterations | Test ID | # of Estimators | Max Depth | Max
Features | Learning Rate |
|---|
| 3 | 25 | GB-O-1 | 110 | 5 | sqrt | 0.05 |
| GB-S-1 | 185 | 7 | log2 | 0.1 |
| 3 | 25 | GB-O-2 | 275 | 6 | log2 | 0.05 |
| GB-S-2 | 215 | 8 | log2 | 0.05 |
| 100 | 25 | GB-O-3 | 275 | 4 | sqrt | 0.05 |
| GB-S-3 | 215 | 7 | log2 | 0.1 |
| 5 | 100 | GB-O-4 | 260 | 4 | sqrt | 0.1 |
| GB-S-4 | 200 | 7 | sqrt | 0.1 |
Table 12.
XGBoost first round hyperparameter search space.
Table 12.
XGBoost first round hyperparameter search space.
| Hyperparameter | Range |
|---|
| n_estimators | np.arange (100, 300, 15) |
| max_depth | [3, 4, 5, 7] |
| learning_rate | [0.05, 0.1, 0.15, 0.2] |
| gamma | [0, 0.25, 1] |
Table 13.
XGBoost classifier results of best estimator found for each test.
Table 13.
XGBoost classifier results of best estimator found for each test.
| Test ID | Test Scores |
|---|
| Accuracy | Precision | Recall | F1-Score |
|---|
| XGB-O-1 | 0.711 | 0.656 | 0.621 | 0.634 |
| XGB-S-1 | 0.698 | 0.646 | 0.638 | 0.638 |
| XGB-O-2 | 0.931 | 0.942 | 0.904 | 0.922 |
| XGB-S-2 | 0.944 | 0.937 | 0.937 | 0.937 |
| XGB-O-3 | 0.753 | 0.779 | 0.673 | 0.689 |
| XGB-S-3 | 0.728 | 0.666 | 0.682 | 0.667 |
Table 14.
XGBoost classifier, number of folds and iterations used, and best parameters found for each test.
Table 14.
XGBoost classifier, number of folds and iterations used, and best parameters found for each test.
| # of Folds | # of Iterations | Test ID | # of Estimators | Max Depth | Learning Rate | Gamma |
|---|
| 3 | 25 | XGB-O-1 | 100 | 5 | 0.05 | 1 |
| XGB-S-1 | 175 | 7 | 0.05 | 0.25 |
| 100 | 25 | XGB-O-2 | 115 | 7 | 0.1 | 0.25 |
| XGB-S-2 | 190 | 10 | 0.1 | 0.25 |
| 5 | 100 | XGB-O-3 | 145 | 7 | 0.05 | 0.25 |
| XGB-S-3 | 220 | 8 | 0.1 | 0 |
Table 15.
Classification report for XGBoost (XGB-O-3 test ID).
Table 15.
Classification report for XGBoost (XGB-O-3 test ID).
| Category | Precision | Recall | F1-Score |
|---|
| Exchange | 0.791 | 0.791 | 0.791 |
| Gitcoin Grants | 0.704 | 0.528 | 0.603 |
| ICO Wallets | 0.846 | 1.000 | 0.917 |
| Mining | 0.769 | 0.769 | 0.769 |
| Others (Dodgy) | 1.000 | 0.167 | 0.286 |
| Others (Legit) | 0.519 | 0.359 | 0.424 |
| Phish/Hack | 0.723 | 0.743 | 0.733 |
| Scamming | 0.672 | 0.709 | 0.690 |
| Upbit Hack | 0.987 | 0.993 | 0.990 |
| Macro Average | 0.779 | 0.673 | 0.689 |
| Disclaimer/Publisher’s Note: The statements, opinions and data contained in all publications are solely those of the individual author(s) and contributor(s) and not of MDPI and/or the editor(s). MDPI and/or the editor(s) disclaim responsibility for any injury to people or property resulting from any ideas, methods, instructions or products referred to in the content. |
© 2023 by the authors. Licensee MDPI, Basel, Switzerland. This article is an open access article distributed under the terms and conditions of the Creative Commons Attribution (CC BY) license (https://creativecommons.org/licenses/by/4.0/).

 ,
, 


