1. Introduction
With the advancement of computing, human–machine interaction has evolved to achieve natural communication. The first form of interaction was through the keyboard and mouse. However, there are more sophisticated methods, such as facial expressions obtained from a video and lexical-phonetic expressions from an audio recording [
1].
As noted in [
1], emotions that manifest through features such as voice tone, word choice, gestures, facial expressions, and even the frequency of breathing and body temperature have always played a central role in human communication. The scope of emotions extends to the meaning of messages and even the way they are delivered. Classifying emotions is an important field of interest, as it is related to predicting possible actions that may be taken based on emotional states. A system that interacts with humans must consider this type of prediction [
1].
In the initial works on emotion identification, two main approaches for studying emotions are facial expressions acquired from a video and lexical-phonetic expressions obtained from audio speech. Although the emotions detected in one medium compared to another may differ, as noted in [
1], the most innovative research techniques focus on combining both sources of information. Similarly, technologies such as electroencephalography (EEG) are becoming essential for recognizing human expressions and advancing interactions between humans and computers [
1].
According to [
2], another approach to emotion identification involves image processing. Facial expressions are an essential factor in human expression as a means of communicating mental states. Detecting these facial expressions is fundamental to understanding nonverbal human behavior, human–machine interaction, and sentiment analysis. Convolutional neural networks have been widely used to identify emotions through images.
On the other hand, in [
3], the authors state that multimodal human–computer interaction systems (HCIs) promise a more humane interaction between humans and machines. The ability of these systems to facilitate unambiguous information exchange between humans and machines makes them less error-prone and more reliable and efficient when dealing with complex tasks. Furthermore, the recognition of emotions has become an area of interest in HCI, particularly in the context of multimodality, as this approach can achieve more accurate and natural results. Current high-precision emotion systems technologies have expanded their applications to fields such as health sciences, e-learning, marketing, and security, among others. Machine learning (ML) is important for improving the process by adjusting architectures or managing high-quality databases (DB).
Reference [
3] presents a review of databases used to develop multimodal emotion recognition (MER) systems in the context of HCI. The review describes databases with multichannel data, including speech, body movements, facial expressions, physiological cues, lexical features, and gestures. The discussion also considers the use of unimodal databases in conjunction with other databases for affect recognition. Moreover, the review presents infrared imagery that displays five different emotions of various subjects in real-world settings.
1.1. Related Works
The recognition of human emotions is a broad subject that encompasses various approaches, including audio (speech), text-based, image-based, electrocardiogram (ECG), and electroencephalogram (EEG) signals. Some works related to these approaches are described below.
1.1.1. Identification from Text
Text emotion recognition (TER) is a significant subject in several applications, such as natural language processing (NLP), information retrieval, data mining, and interaction between humans and computers. Regarding TER, emotion analysis seeks to identify feelings such as rage, surprise, disapproval, grief, and even happiness in texts.
In this regard, reference [
4] proposes a double-channel system for recognizing multiclass text emotions. The system’s architecture comprises modules for embedding, dual-channel, emotion rating, and explainability. The embedding module extracts characteristics from input texts as embedding vectors using pre-trained bidirectional encoder representations from transformers (BERT). The embedding vectors are then used as inputs for the dual-channel network, which includes a bidirectional long-short-term memory network (BiLSTM) and a convolutional neural network (CNN). The outputs are entered as embedded vectors for both channels to feed the emotion classification module.
In [
5], an effective model for early warning of financial crises is developed to help companies predict, control, and solve risks in economics. The authors proposed using textual data for textual analysis and a web crawler to evaluate tone and sentiment from financial news and the management discussion and analysis (MDA) from a specific list of companies’ yearly financial reports. The emotional content of the texts is used to obtain internal and external data for predicting the economic crisis using an early warning model, where the information is based on customary financial indicators. The authors implemented thirteen mainstream machine learning models where the best performers were obtained with gradient-boosted decision trees (GBDTs), adaptive boosting (AdaBoost), random forest, and bagging models.
In [
6], a four-level strategy is proposed for recommending books. The levels consist of a recommendation system, reviewer clustering, sentiment analysis, and sentence comparison with semantic network clustering. The system utilizes deep learning techniques, such as CNN and long short-term memory (LSTM) for classification. A clustering approach is also used to group reviewers by gender, location, and age.
1.1.2. Identification Based on Audio
The speech emotion recognition (SER) systems seek to determine the emotion of a speaker using their verbal expression and can improve the human–machine interaction experience.
In this regard, the authors of [
7] proposed a set of techniques and features for detecting emotions and stress from speech signals. The processing of these waveforms included using bispectral-based features and a bispectrum (third-order statistics). To distinguish between stress and emotions, they used the generalized regression neural network (GRNN), extreme learning machine (ELM), and K-nearest neighbor (KNN) methods.
In [
8], the authors suggest using a convolutional neural network and Mel-frequency cepstral coefficient (MFCC) for the construction of emotion detection models with a focus on gender-dependent training. The considered emotions include fearfulness, calmness, surprise, happiness, annoyance, and sadness, which are extracted from the RAVDNESS dataset, which consists of verbal expressions with typical and emotional solid intensities.
An algorithm for the recognition and classification of emotions in music is proposed in [
9], where a feedforward neural network (FNN) is utilized to extract emotional features from music. The gradient descent learning algorithm trains the model for audio emotion features. The classification and recognition of emotions in music are obtained by applying neural network models.
Other related works are discussed in [
10], where a convolutional neural network model is designed to detect speech emotion in a classroom setting. The authors identify teachers’ rules and features for controlling emotions in the classroom using big data and propose a design for classroom emotion recognition based on a convolutional neural network, along with an algorithm for detecting speech emotion. The resulting network is a combination of a CNN and a recurrent neural network (RNN), taking advantage of the benefits obtained from both.
1.1.3. Identification from Images
Facial expression recognition (FER) is essential for the intelligent interaction between humans and computers. In this context, convolutional neural networks are suitable alternatives for implementing FER.
In [
11], a proposal is made for identifying emotions in the cinema by analyzing facial expressions. The authors analyzed the most relevant datasets employed for FER, identifying issues caused by data heterogeneity and the absence of a universal model to detect emotions. The authors use pre-trained networks, such as MobileNetV2, Xception, VGG16, VGG19, ResNetV2, InceptionV3, and DenseNet.
Cloud computing is another tool employed to identify the emotional states of users, as displayed in [
12]. Under various emotional states, an experiment involving emotional inductions was carried out to induce the user’s three basic emotional states: positive, neutral, and negative. A facial emotion predictive system was built based on the recognition of facial emotions. Support vector machines (SVMs) are used for face detection, including facial emotion analysis features. In this order, the process includes cloud computing and a machine learning classification method to determine emotion classification.
Recent research proposes an improved model of deep convolutional neural networks for classifying emotions through a training method that combines convolutional features from the lower, middle, and top layers [
13]. A total of 4500 samples were taken (from four experiments) to determine the model’s performance. Moreover, feature visualization was implemented to extract the relevant attributes.
Regarding applications in a scholarly context, the authors in [
14] conducted a study on facial emotion recognition algorithms in a group of preschool children. They developed a network structure that reduces the number of parameters to save computational resources by employing LSTM and CNN. Moreover, the authors used a hierarchical method for face annotation to take samples and alleviate data imbalance in the dataset. They also proposed a feature descriptor from orthogonal planes (an oriented-gradient histogram) to represent variations in facial appearances.
In the development of an emotional representation model based on facial expression recognition, the authors of [
15] presented an analysis of differences in emotions based on the correlation and also analyzed the categories of emotions with the adequate intraclass correlation and the differences between classes. In this way, a clustering algorithm was used to determine detailed emotions from variable representations.
1.1.4. Identification Based on Biological Signals
According to [
16], bodily signals are powerfully attached to an individual’s health as they are essential in the transmission of information by the human body. Therefore, an electrocardiogram offers the possibility to capture relevant data on heart disease, gender, personal identification, and emotions. In [
16], the authors propose a biometric approach to unlock services in mobile phones by studying heartbeats using deep learning.
In [
17], the authors propose an extraction model based on the bag-of-hybrid-deep-features (BoHDF) to classify electroencephalogram (EEG) signals from a specific emotion class. They claim that insight into an emotional state can be provided with EEG signals. The EEG signals are transformed into 2D spectrograms prior to feature extraction. The researchers suggest combining texture-based functions, followed by the KNN clustering algorithm connected with layer-deep GoogLeNet functions.
In [
18], visibility graphs are used to build complex networks employing EEG signals with two types of entropy measures, namely clustering coefficient entropy and nodal degree entropy. By applying the area under the receiver operating characteristics (AUROC) method, the SVM classifier uses the extracted features as input data for recognizing emotions in all individuals.
Lastly, the authors in [
19] propose an approach for processing emotion detection using EEG signals with a wavelet transform. In this scenario, EEG signals become 2D spectrograms followed by feature extraction. Feature extraction occurs when implementing a hybrid spatiotemporal deep neural network; similar groups can be generated when employing the bag-of-deep features (BoDF) technique, which can be used in ensemble classifiers, trees, SVM, and KNN.
1.2. Focus and Document Organization
This paper aims to identify clusters of variables associated with emotion identification during a foreign language test (in Portuguese) taken by a group of students. When determining the data clusters, it is possible to establish the variables of importance in the perception of emotions (concentration) and the decision thresholds of these variables. This information can later be used to build a model that relates the measured variables and the student’s performance, allowing strategies to be generated to help the student achieve suitable performance on the test. The language selected was Portuguese because all data collection participants had yet to gain previous knowledge of the language, and all of them were native Spanish speakers.
The document is organized as follows.
Section 2 describes the clustering algorithm used. The data used and their acquisitions are described in
Section 3, and the results are discussed in
Section 4. Finally,
Section 5 and
Section 6 present the discussion and conclusions.
2. Procedure Employed: K-Means Clustering Algorithm
The K-means cluster algorithm can be seen as a method for performing data observations from mutually selective
K clusters, allowing for the settlement of a vector of
K indexes that belongs to the cluster assigned in each observation. From a practical perspective, the K-means technique employs observations of data and objects of people to determine trends provided by the formed clusters [
20].
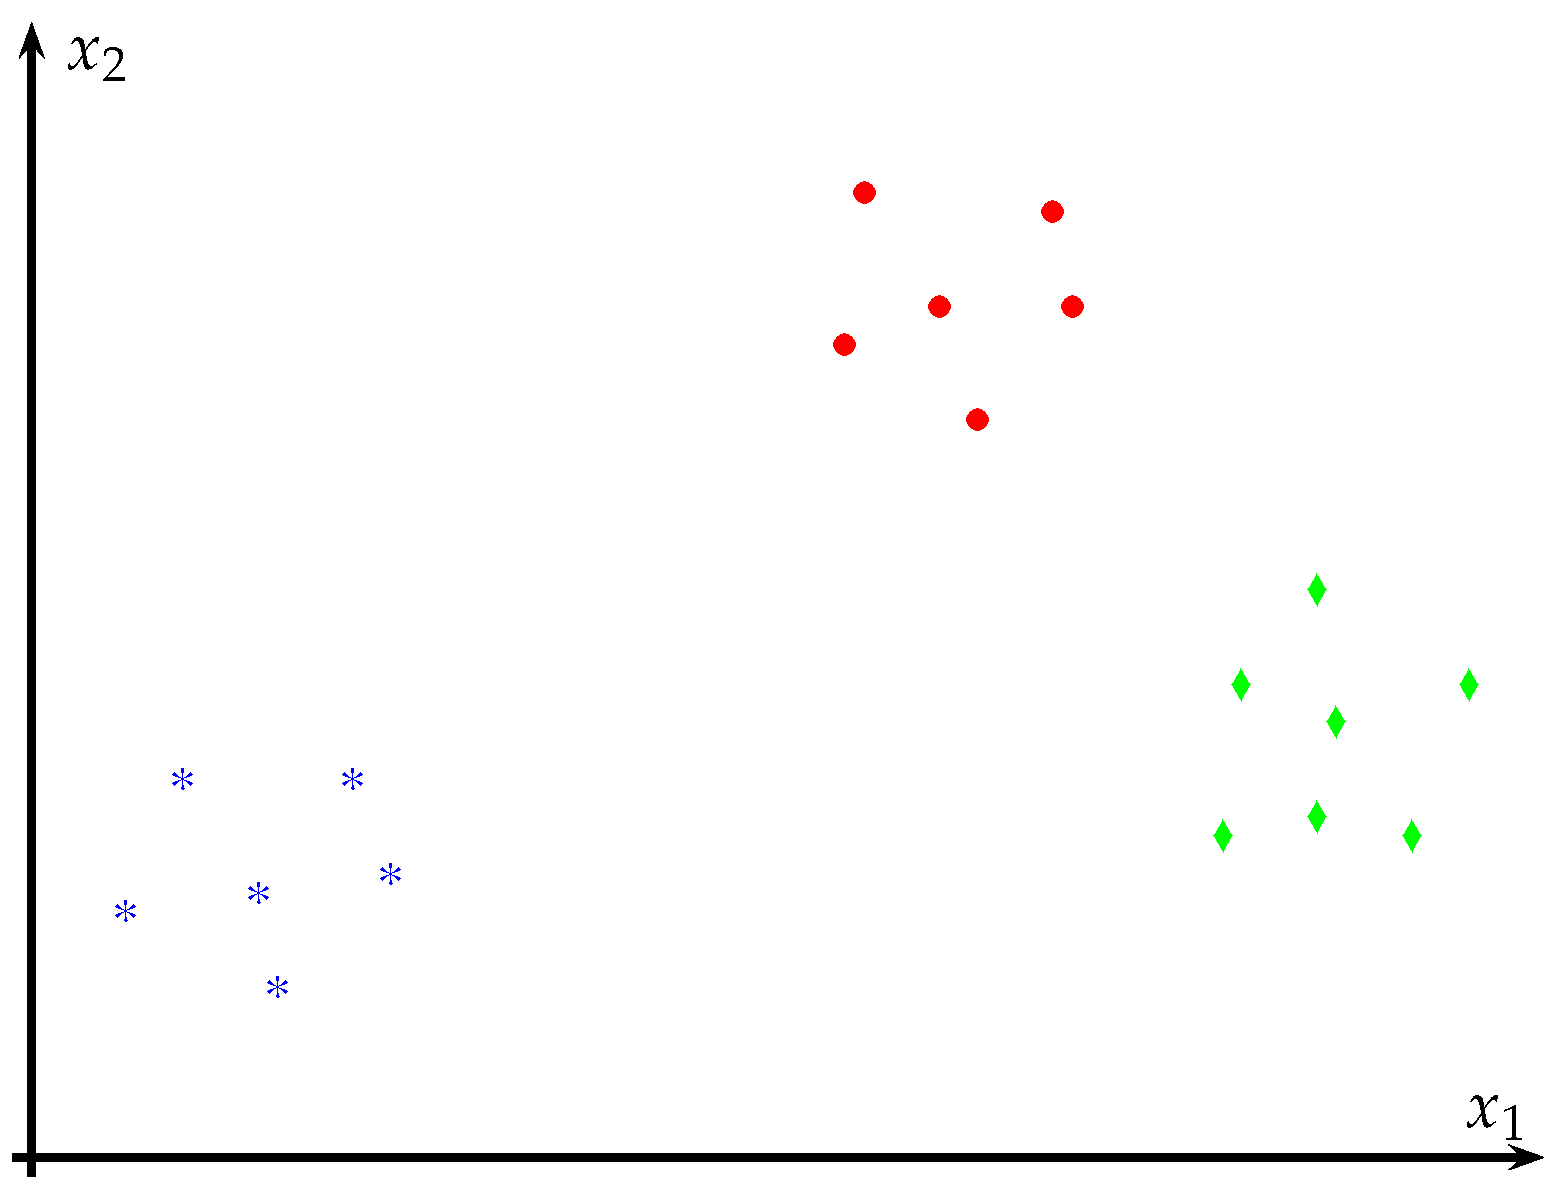
Figure 1 shows an example of the clustering for a dataset.
Each observation of the data is regarded as a point in the multidimensional space when employing the K-means cluster algorithm. In this way, it is possible to define a partition where the objects in each cluster are as close to each other and as distant as possible from the objects in other clusters. Depending on the type of data employed to form the clusters, different distance measures are available to carry out the process of clustering. By this algorithm, each group in the cluster consists of its member elements and its center, which corresponds to the point where the sum of the whole set of objects is taken to its minimum value. Additionally, such a metric allows us to determine the centroids differently, searching for reducing the sum of distances [
20].
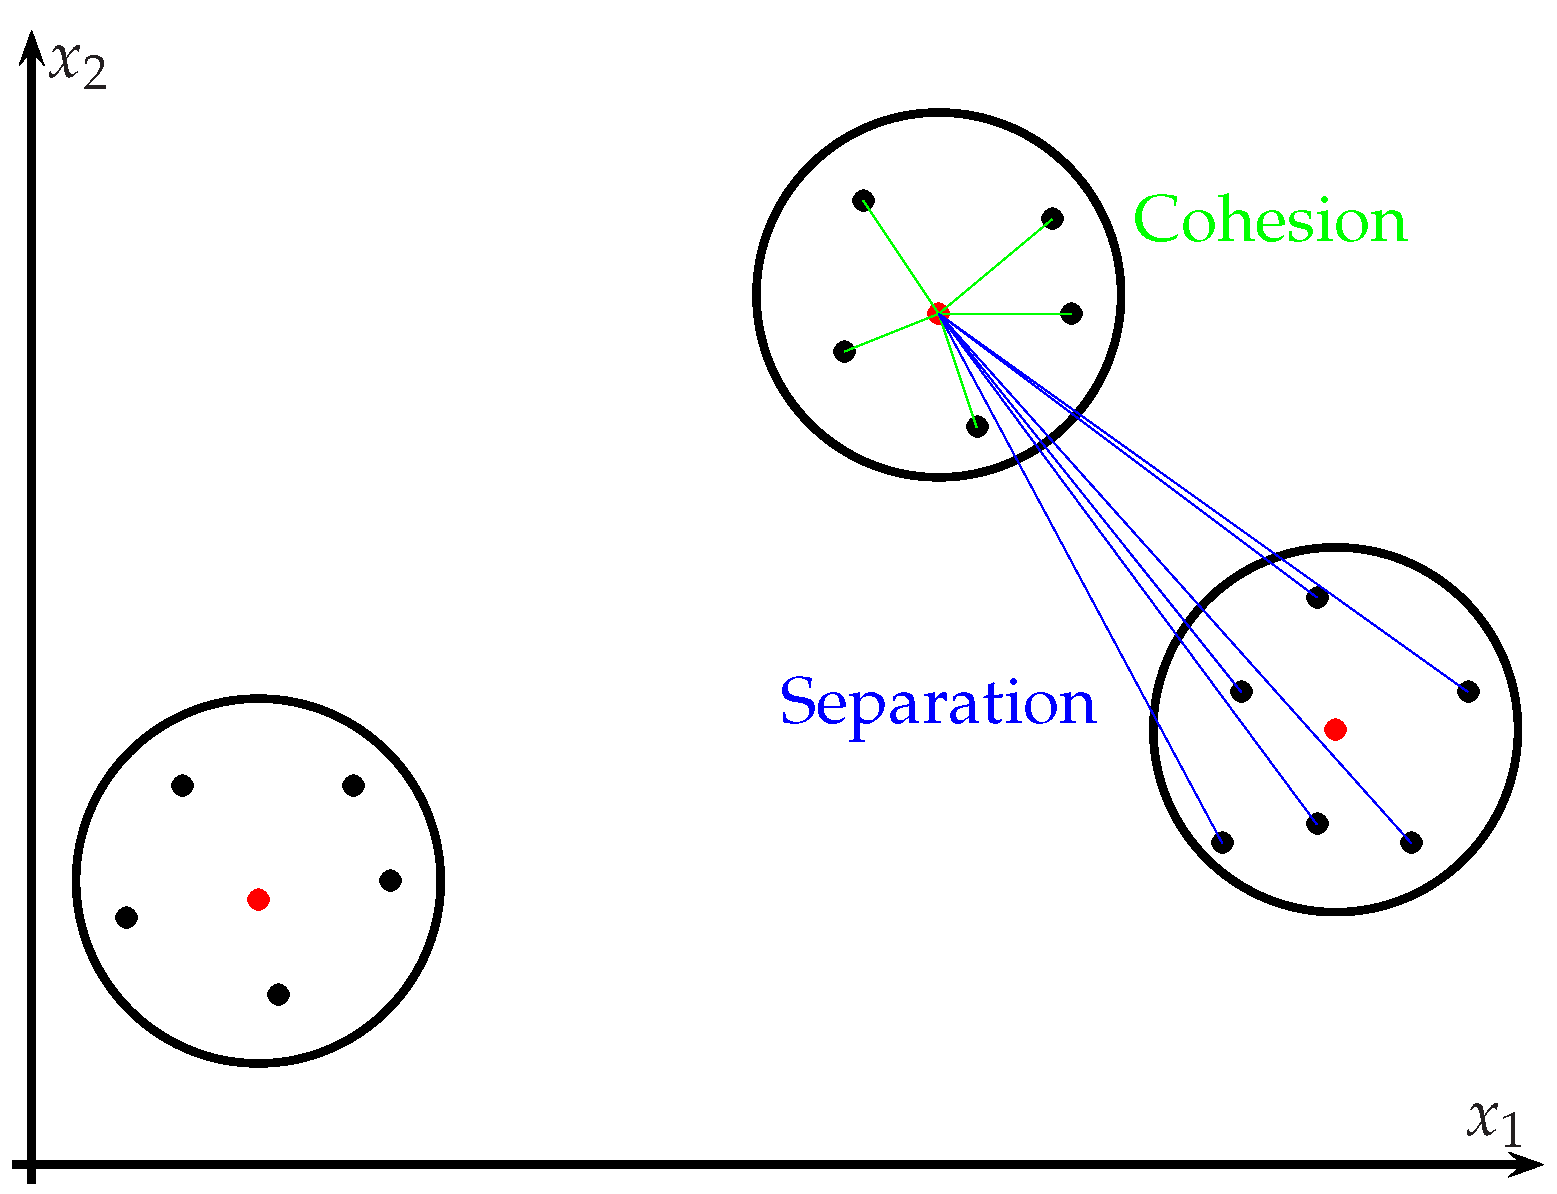
The K-means clustering algorithm is an iterative process that minimizes the sum of distances of each object (point) to the centroid of the cluster while regarding all of the clusters. During the execution, the algorithm transfers objects between groups until the total sum is taken to its minimum expression; thus, the result is represented by a set of noticeably compact clusters among elements and, at the same time, as separated as possible from other clusters [
20].
For the definition of the algorithm, when considering a set of observations
where each one corresponds to a vector of
D dimensions, in this order, the algorithm creates a partition from the observations in
K clusters
, with
. The K-means steps are displayed in Algorithm 1. The first step is to define a cluster
K with centroids in the space of variables; for this, the mean or median is taken as a statistical measure or data that perfectly represents each cluster (and even random data). Then, while the stopping criterion is not met, all of the centroids are compared with each object, and the formula of distance (Euclidean, Manhattan, etc.) can be employed. In the next step, each datum is assigned to the centroid displaying the shortest distance. Later, the centroids are modified using any heuristic, which requires the calculation of the mean (or median) of the objects in the cluster to move the centroids toward that position. This process is repeated until meeting the stop criterion, considering a number of repetitions or, in cases when the sum of all the shortest distances remains without variation.
| Algorithm 1: Process of the K-means algorithm |
![Computation 11 00086 i001]() |
Based on the quadratic error, a similarity measurement is usually employed, such as Equation (
1), where
p represents one element, while
corresponds to the medium point of cluster
.
in Equation (
1), the term
refers to the element
p located in the cluster
, and
K is the number of total clusters.
3. Data Used
For data acquisition, the EMOTIV
Insight system was used, which consists of a headband with sensors that allows users to read their emotions. The device picks up brain waves, captures the user’s emotions, and identifies whether the person is nervous, stressed, or excited, among other options [
27]. In this work, the equipment was used to acquire measurements at each instant to record a digital map of the students’ emotions during the exam.
The information collected allows for making an electroencephalogram in seconds without wiring; moreover, such information is stored and can be used for the analysis of the impacts of different external factors on an individual’s emotions. In this way, measures can be taken to improve attention, reduce stress, or improve concentration [
27]. EMOTIV
Insight is available in two versions: a basic version with five sensors and another with greater precision and functions, which includes 14 sensors [
27]. In [
28], this type of device is used to perform electroencephalogram measurements and create a feedback system to improve gait rehabilitation.
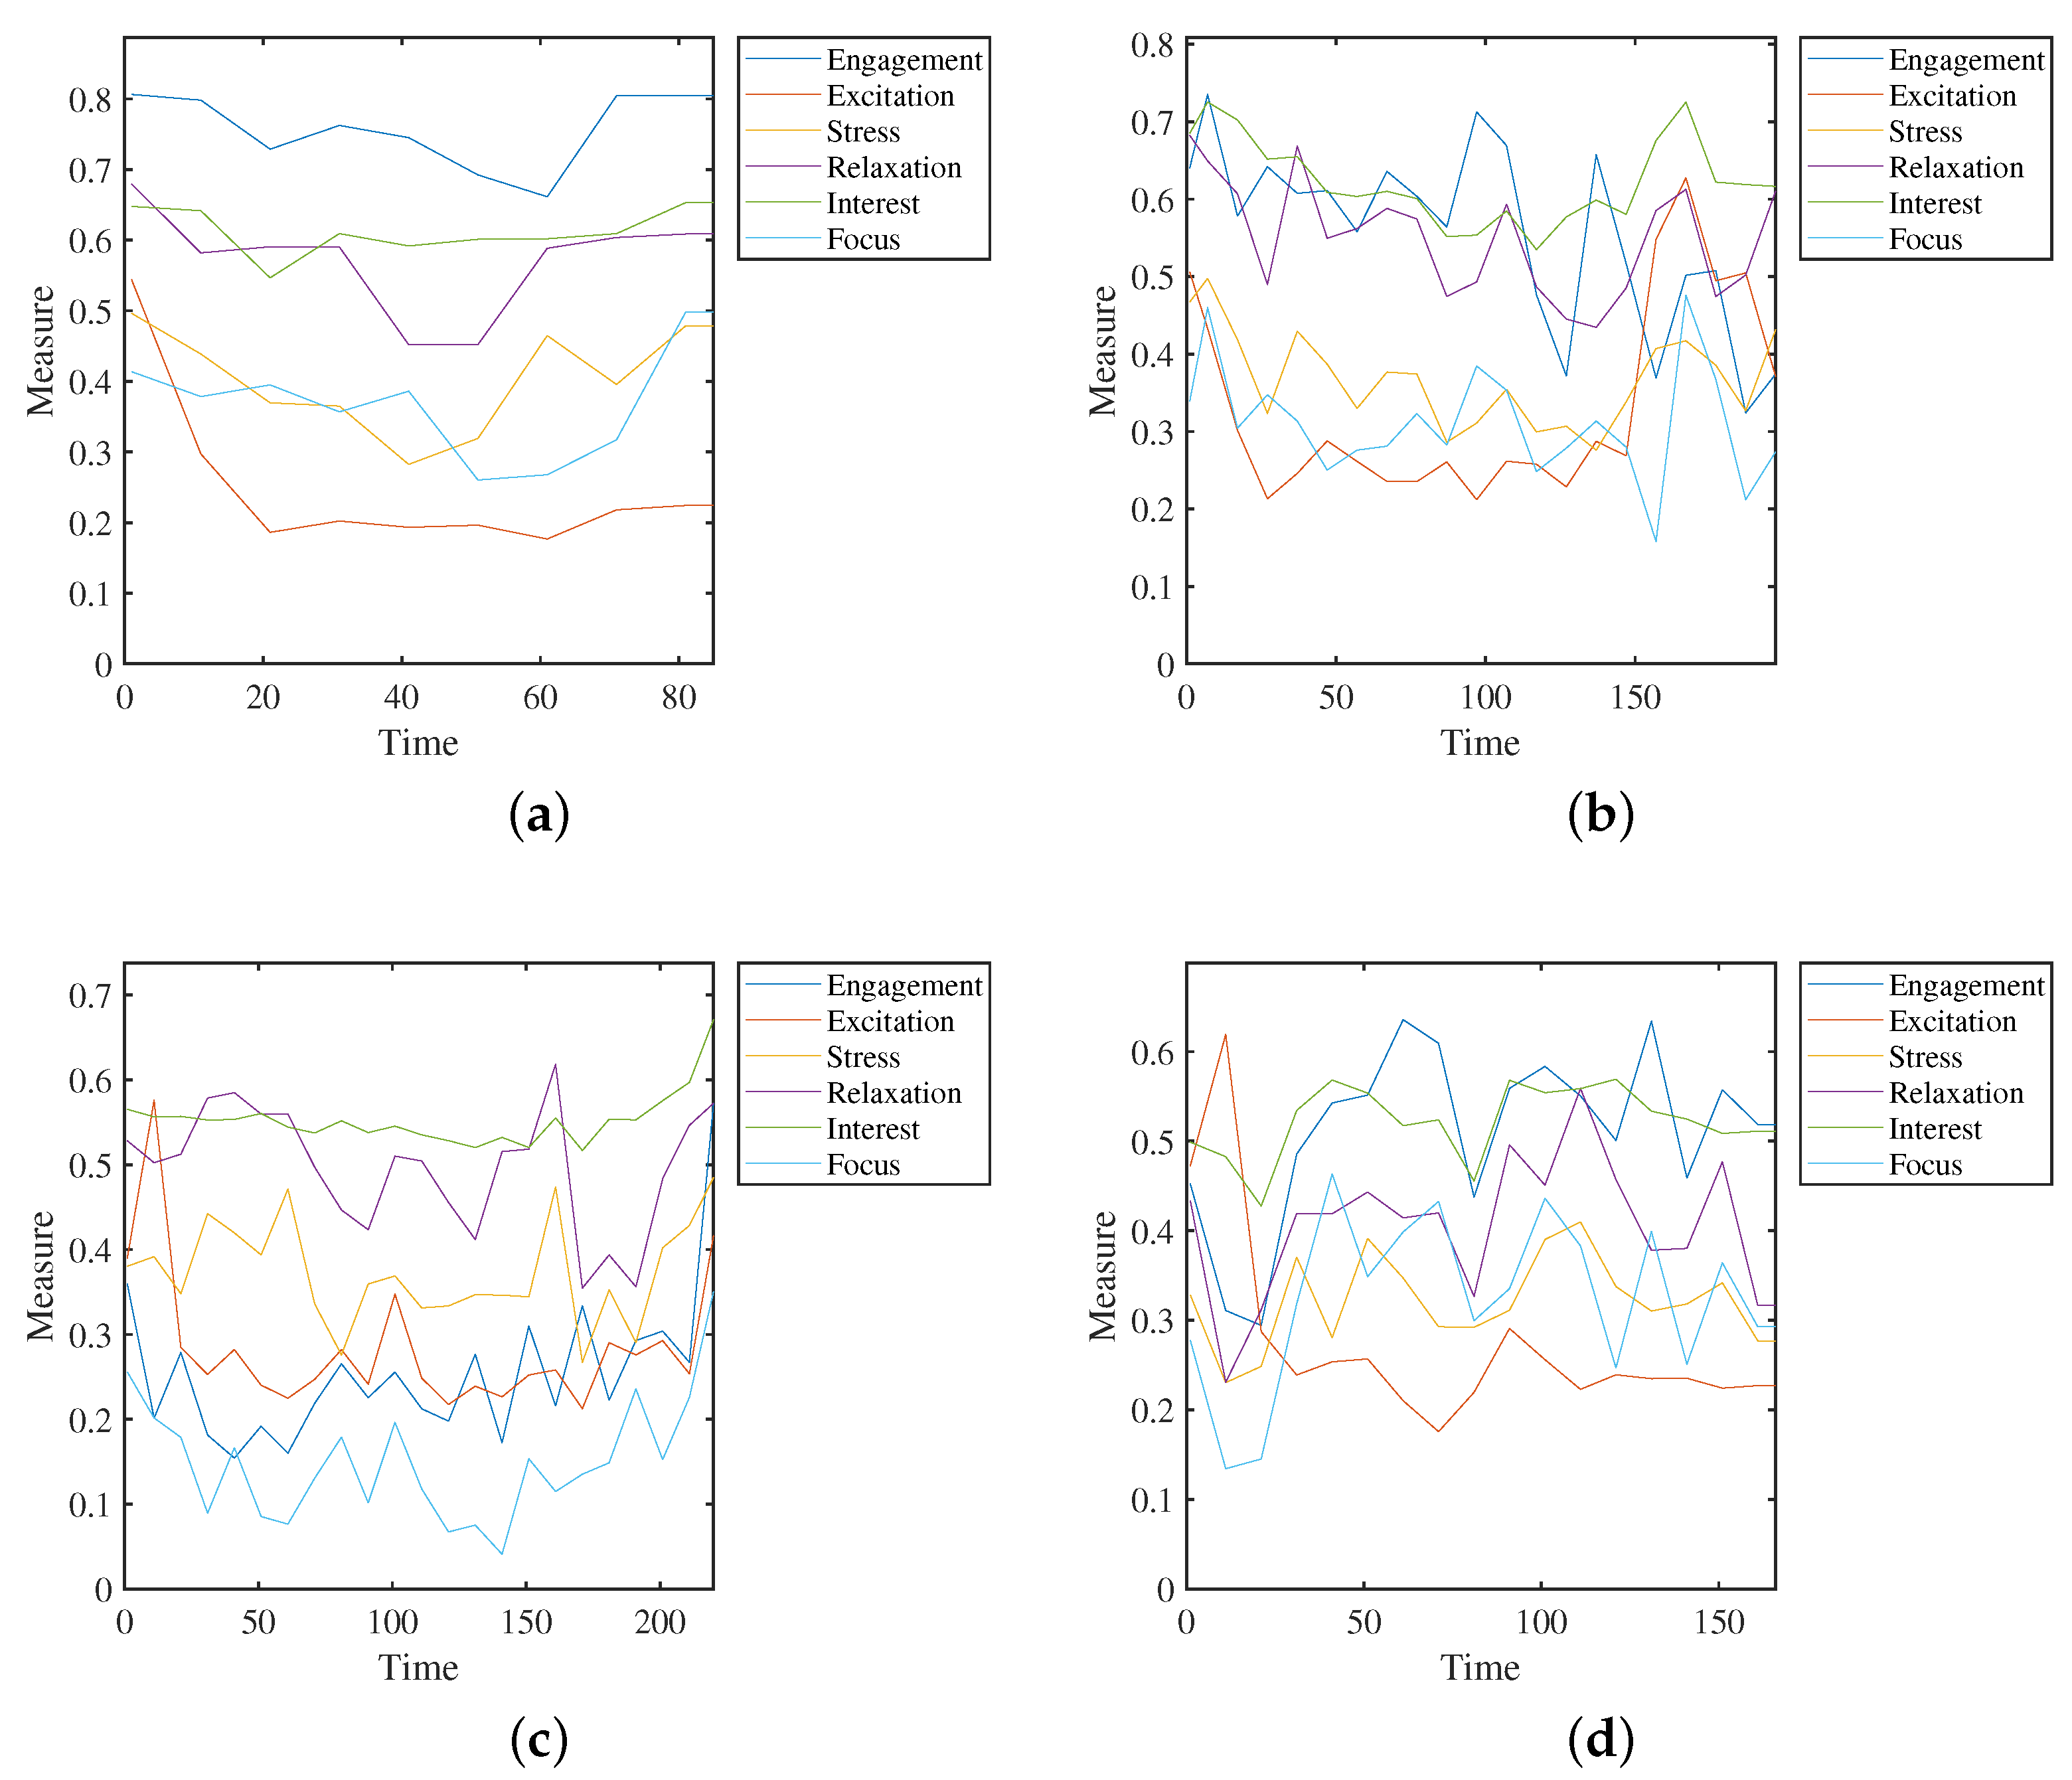
Data about students’ emotions were collected using EMOTIV
Insight equipment while they took a foreign language test in Portuguese. Nineteen students participated in the study, taking four tests each with a maximum duration of two hours; the data were collected at different time intervals. The variables measured were engagement, excitement, stress, relaxation, interest, and focus. The measurements were taken during different intervals, with samples taken every second, resulting in a data matrix of 6 columns and 16,607 rows.
Figure 3 shows the measurements for a student during a test. The collected data show simultaneous changes in different variables, which can be identified using the clustering process. The collected data can be found in the GitHub repository [
29].
4. Results
This section presents the results obtained with the K-means algorithm. It should be noted that the clusters obtained, their centers, and the separation sought aim to cover the largest amounts of measured data. The implementation was performed in MATLAB with the respective clustering toolbox [
25]. The “
k-means” function was used to generate the clusters; the “
evalclusters” function was used to calculate the performance index based on the silhouette criterion. The “
silhouette” function was used to display the performance metric. In this order, MATLAB was used to ease the handling of data and the specialized functions for clustering. Regarding the hardware, a PC Lenovo IdeaPad 5 14ITL05 was used with an 11th Gen Intel Core i7-1165G7 processor, 2.80 GHz, with 16.0 GB of RAM, and running Windows 10.
The clusters were determined by considering the possible presence or absence of activity in the collected signals; thus, groups of two and three clusters were considered. For two clusters, the presence or absence of activity was taken into account, while for three clusters, an intermediate case where the transition between activity and non-activity was considered. Additionally, several clusters with four and five centers were considered to observe if there was a better separation of the data.
The results using K-means can be seen in
Figure 4 where the clusters obtained taking
clusters are shown. Additionally,
Table 1 shows the total sum of distances obtained. As the initial assignment of the clusters is random, 25 repetitions are performed for each case. Thus,
Table 1 shows the maximum, minimum, average, and standard deviation (STD) for 25 repetitions.
It should be noted that the sum of distances decreases as larger numbers of clusters are considered. For instance, in
Table 1, the sum of distances for the best case decreases from 6965.75 for 2 clusters to 5419.65 for 5 clusters. Therefore, as observed, the sum of distances is not a suitable criterion for determining the optimal number of clusters [
25].
The values of the cluster centers can be seen in
Table 2, where the first column indicates the number of clusters used
K, the second indicates the respective cluster
corresponding to each case,
, and the following columns indicate the centroid values
.
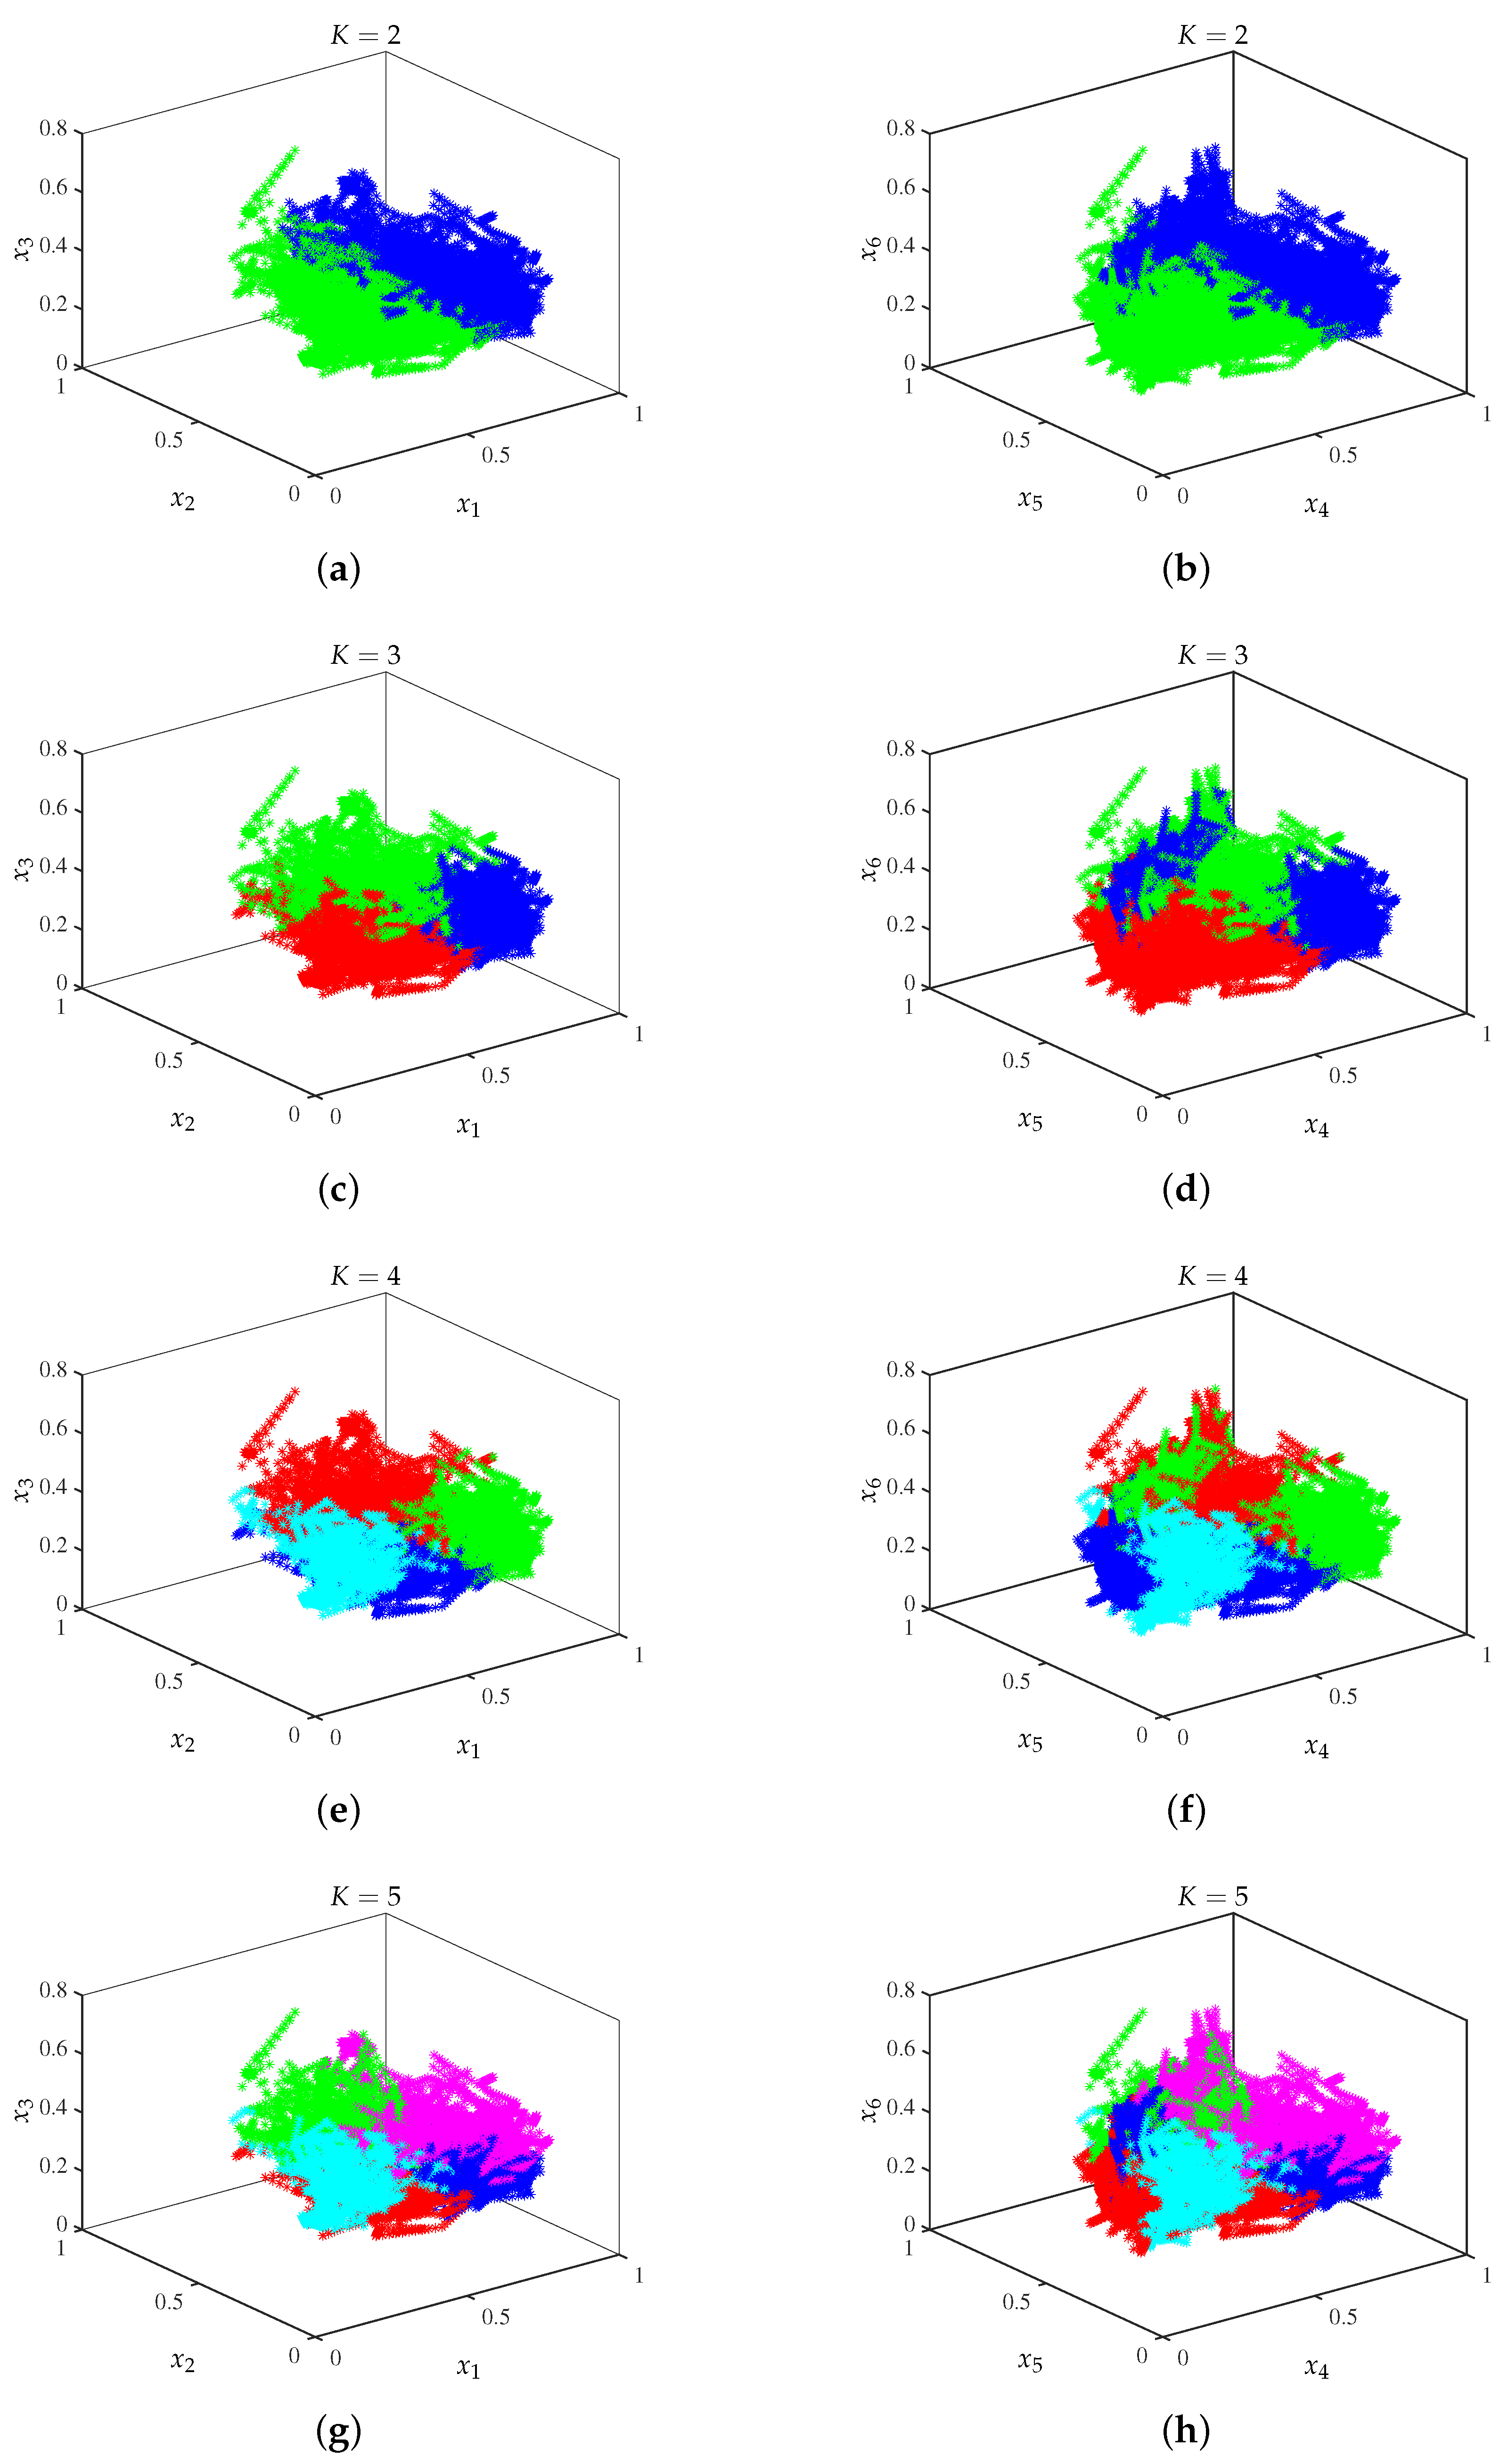
Figure 4 shows a representation of the clusters formed where the cluster points are represented with different colors. Considering a total of six variables, a representation of two 3D figures is made by taking two groups of three variables, where
is engagement,
is excitation,
is stress,
is relaxation,
is the interest, and
is the focus. It should be clarified that this representation is limited since a complete representation can be achieved by considering all possible combinations of variables for the 3D plots using 6 variables (10 figures total).
As can be seen for two clusters, the groups formed can be easily identified; by increasing the number of clusters, the segmentation of the groups formed in the first case is observed. The results obtained for two clusters can be useful in applications where it is necessary to identify two possible states in the student’s behavior, such as concentration during a test.
Considering the results shown in
Figure 4, and the values of the cluster centers in
Table 2, particularly taking the results obtained for two clusters, it is observed that, for the development of a system to identify when the student presents a change in their concentration, a comparison threshold can be established between 0.4297 and 0.6419 for
, 0.2417 and 0.2544 for
, 0.3193 and 0.3643 for
, 0.3294 and 0.4212 for
, 0.5120 and 0.5336 for
, and finally 0.2553 and 0.3899 for
. As observed, there are ranges of values with greater separation, which can allow for better classification. This can be complemented with the principal component analysis (PCA) to determine the most important variables.
To determine the best cluster configuration, the silhouette criterion is calculated by obtaining the results in
Table 3, where the best configuration is presented for
, having the highest
value.
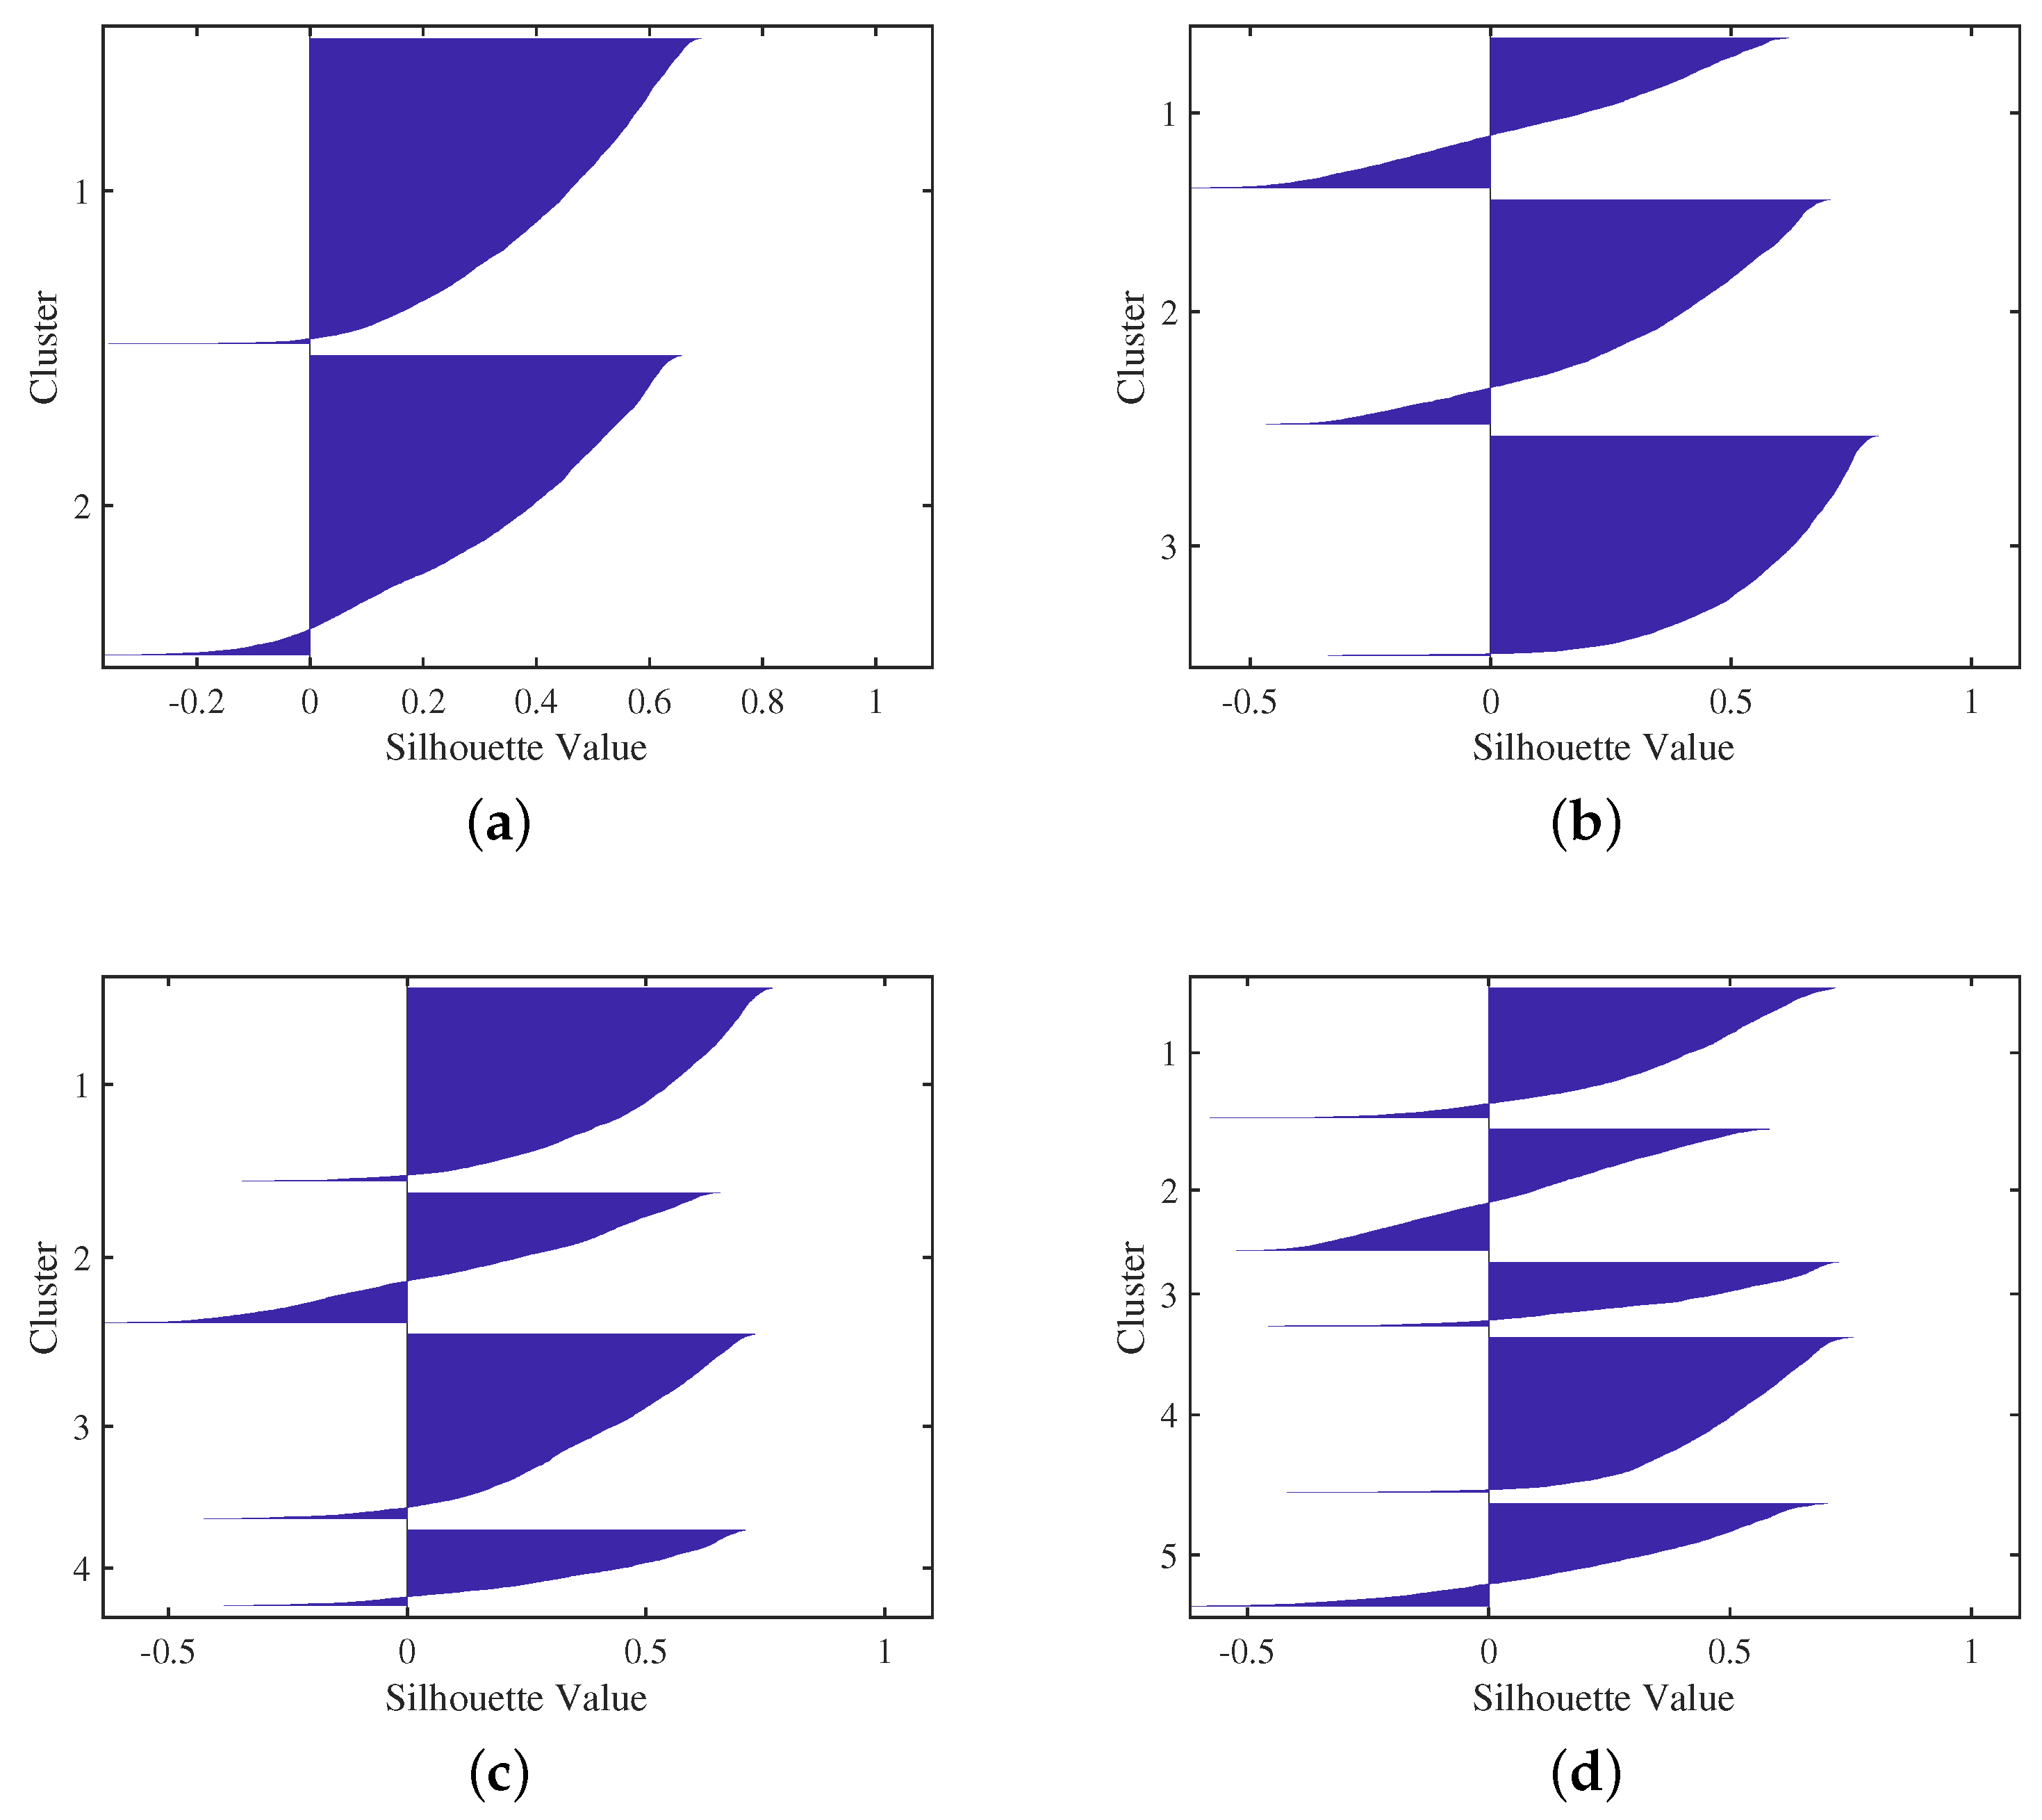
Thus, the values of silhouette
for each cluster can be seen in
Figure 5, where the best configuration is for
. As can be seen in
Table 3, the average value of the silhouette of two groups is higher than the average value obtained for the other clusters.
For two clusters, the silhouette plot shows that most of the points in both clusters have large silhouette values, showing that the clusters are well separated. For other clusters, , there are numerous negative values and low silhouette values in several of the clusters formed, indicating that these clusters are not well separated.
5. Discussion
Regarding the limitations of this work, the sample size was limited to a group of 19 students, and the accuracy and precision of the data collected were subject to the limitations of the EMOTIV
Insight device. Precision refers to a measurement of a system’s capability to reproduce a measured value, while accuracy is a measure of its closeness to the actual value [
30]. Moreover, only the presentation of a foreign language test (Portuguese) was considered, but the methodology could be extended to other types of subjects.
This work can be considered exploratory, as it investigates the possibility of clustering data to identify when students lose concentration during a test. This information can be used to generate strategies aimed at helping students regain concentration during tests.
By identifying the data clusters, it is also possible to establish the range of variables associated with students’ emotions when taking an exam. This study can then be used to build a model that relates the measured variables to student performances, allowing for the development of strategies to help students focus on tests by outlining strategies toward performance improvement.
In addition, the study can be complemented by a principal component analysis to determine the most remarkable variables in classifying students’ emotions, specifically their concentration at the time of taking a test.
The main objective of this work is to identify the variables and their ranges to create a system that can identify the concentration state of the student. In future works, the aim will be to design the system to identify the state of concentration using machine learning techniques. This would allow for a comparison with other methods after implementing a system that identifies the student’s state of mind.
Table 4 displays various references for comparison with other works; various references are displayed, where the input is used for classification and application, and some techniques that were employed are considered. As different approaches are presented, the comparison should focus on works that use biological signals. To ensure a fair comparison, a framework of signals to be used must be defined based on previous research.
The comparison must consider aspects such as accuracy, precision, and recall [
31]. Regarding the different results in the classification, such as a true positive (
) result, a false positive (
) result, a true negative (
) result, and a false negative (
) result, the respective performance metrics are:
Moreover, a confidence interval can be considered to present the results and comparison, which is a method that computes upper and lower bounds around an estimated value. According to [
32], it is a common convention to use a 95% confidence interval in practice. In this regard, ref. [
33] presents a detailed theory for determining statistical intervals.
6. Conclusions
In this work, a scheme was proposed to determine the groups of data that are representative of the perception of emotions when a group of students takes a foreign language test (Portuguese). In this way, one may observe the formation of clusters associated with changes when the student presents a variation in their state of concentration while taking a test.
Considering the results, it was observed that the clusters identified can be used to design a system to detect when the student presents a change in concentration. In this order, an approach can be set using the identified threshold values to determine when the individual is in total concentration during the test. This preliminary information can be employed to design a fuzzy inference system to identify the student’s state of concentration.
Identifying the clusters carried out allows us to observe the presence of patterns in the data; however, to achieve the classification, the mechanism that determines the actual student’s state of mind at each instant of time must be implemented. In this way, a supervised machine learning technique can be used to implement the classification model.
This study can later be used to build a model that relates the measured variables and the student’s performance in such a way that strategies can be generated for the student to achieve a suitable performance on the test. Future work could improve the results obtained by considering other scenarios and variables as well as data acquisition systems. Comparisons with other research related to the identification of feelings can be conducted.


