
Effect of Passenger Physical Characteristics in the Uptake of Combustion Products during a Railway Tunnel Evacuation Due to a Fire Accident


Abstract
:1. Introduction
2. Numerical Model
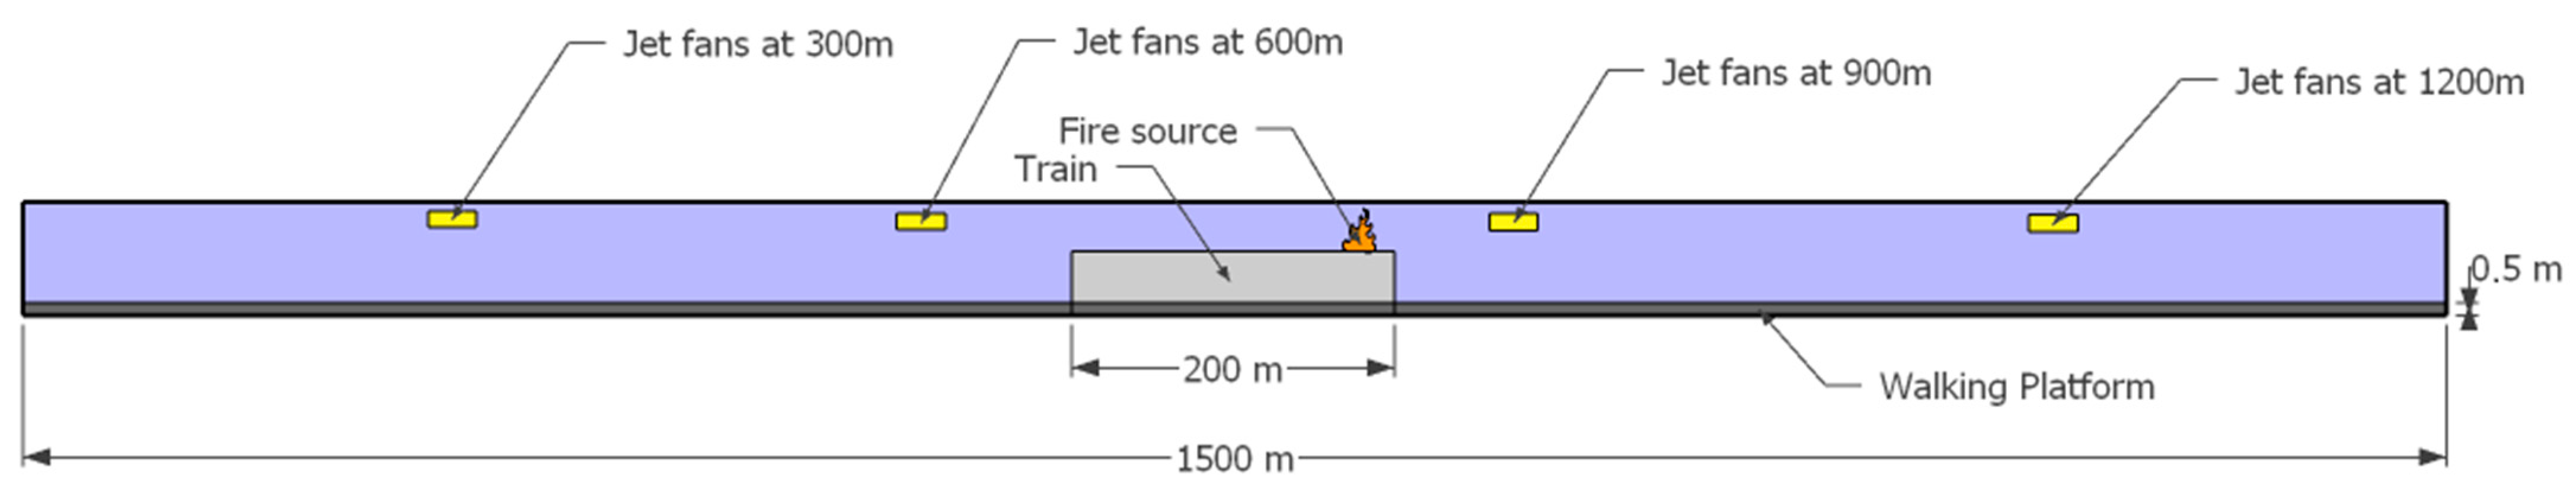
2.1. Model Details
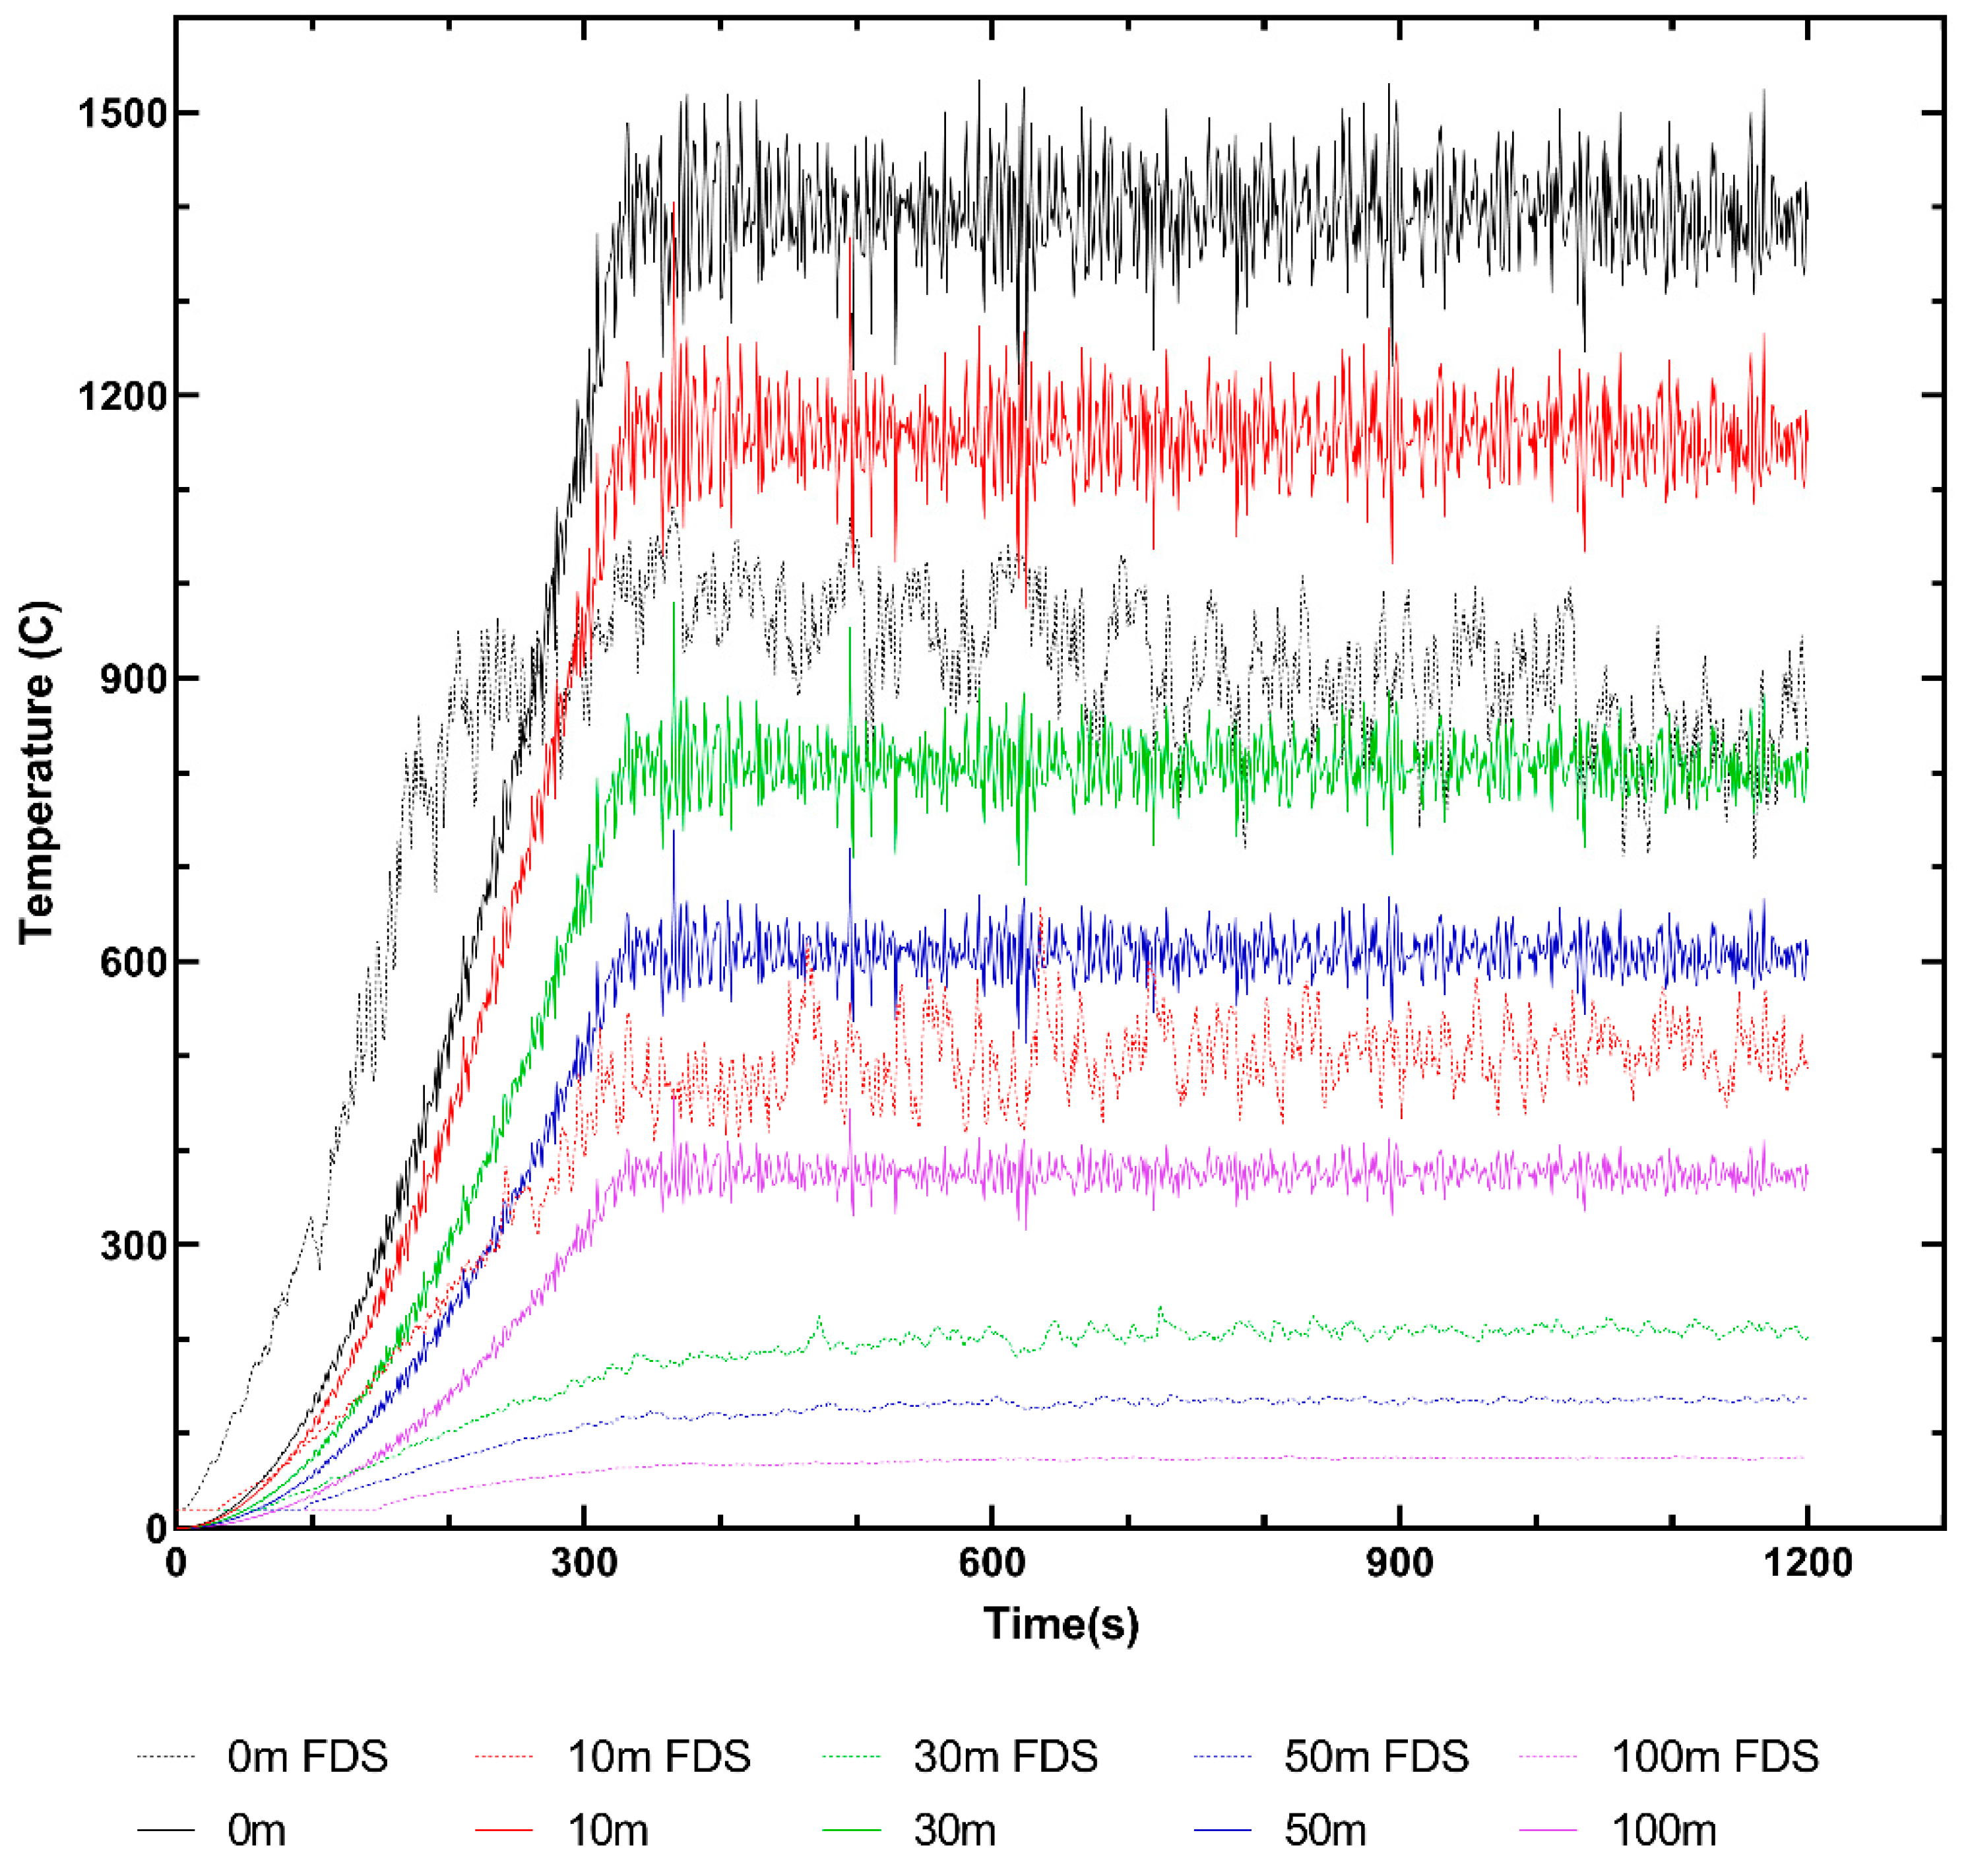
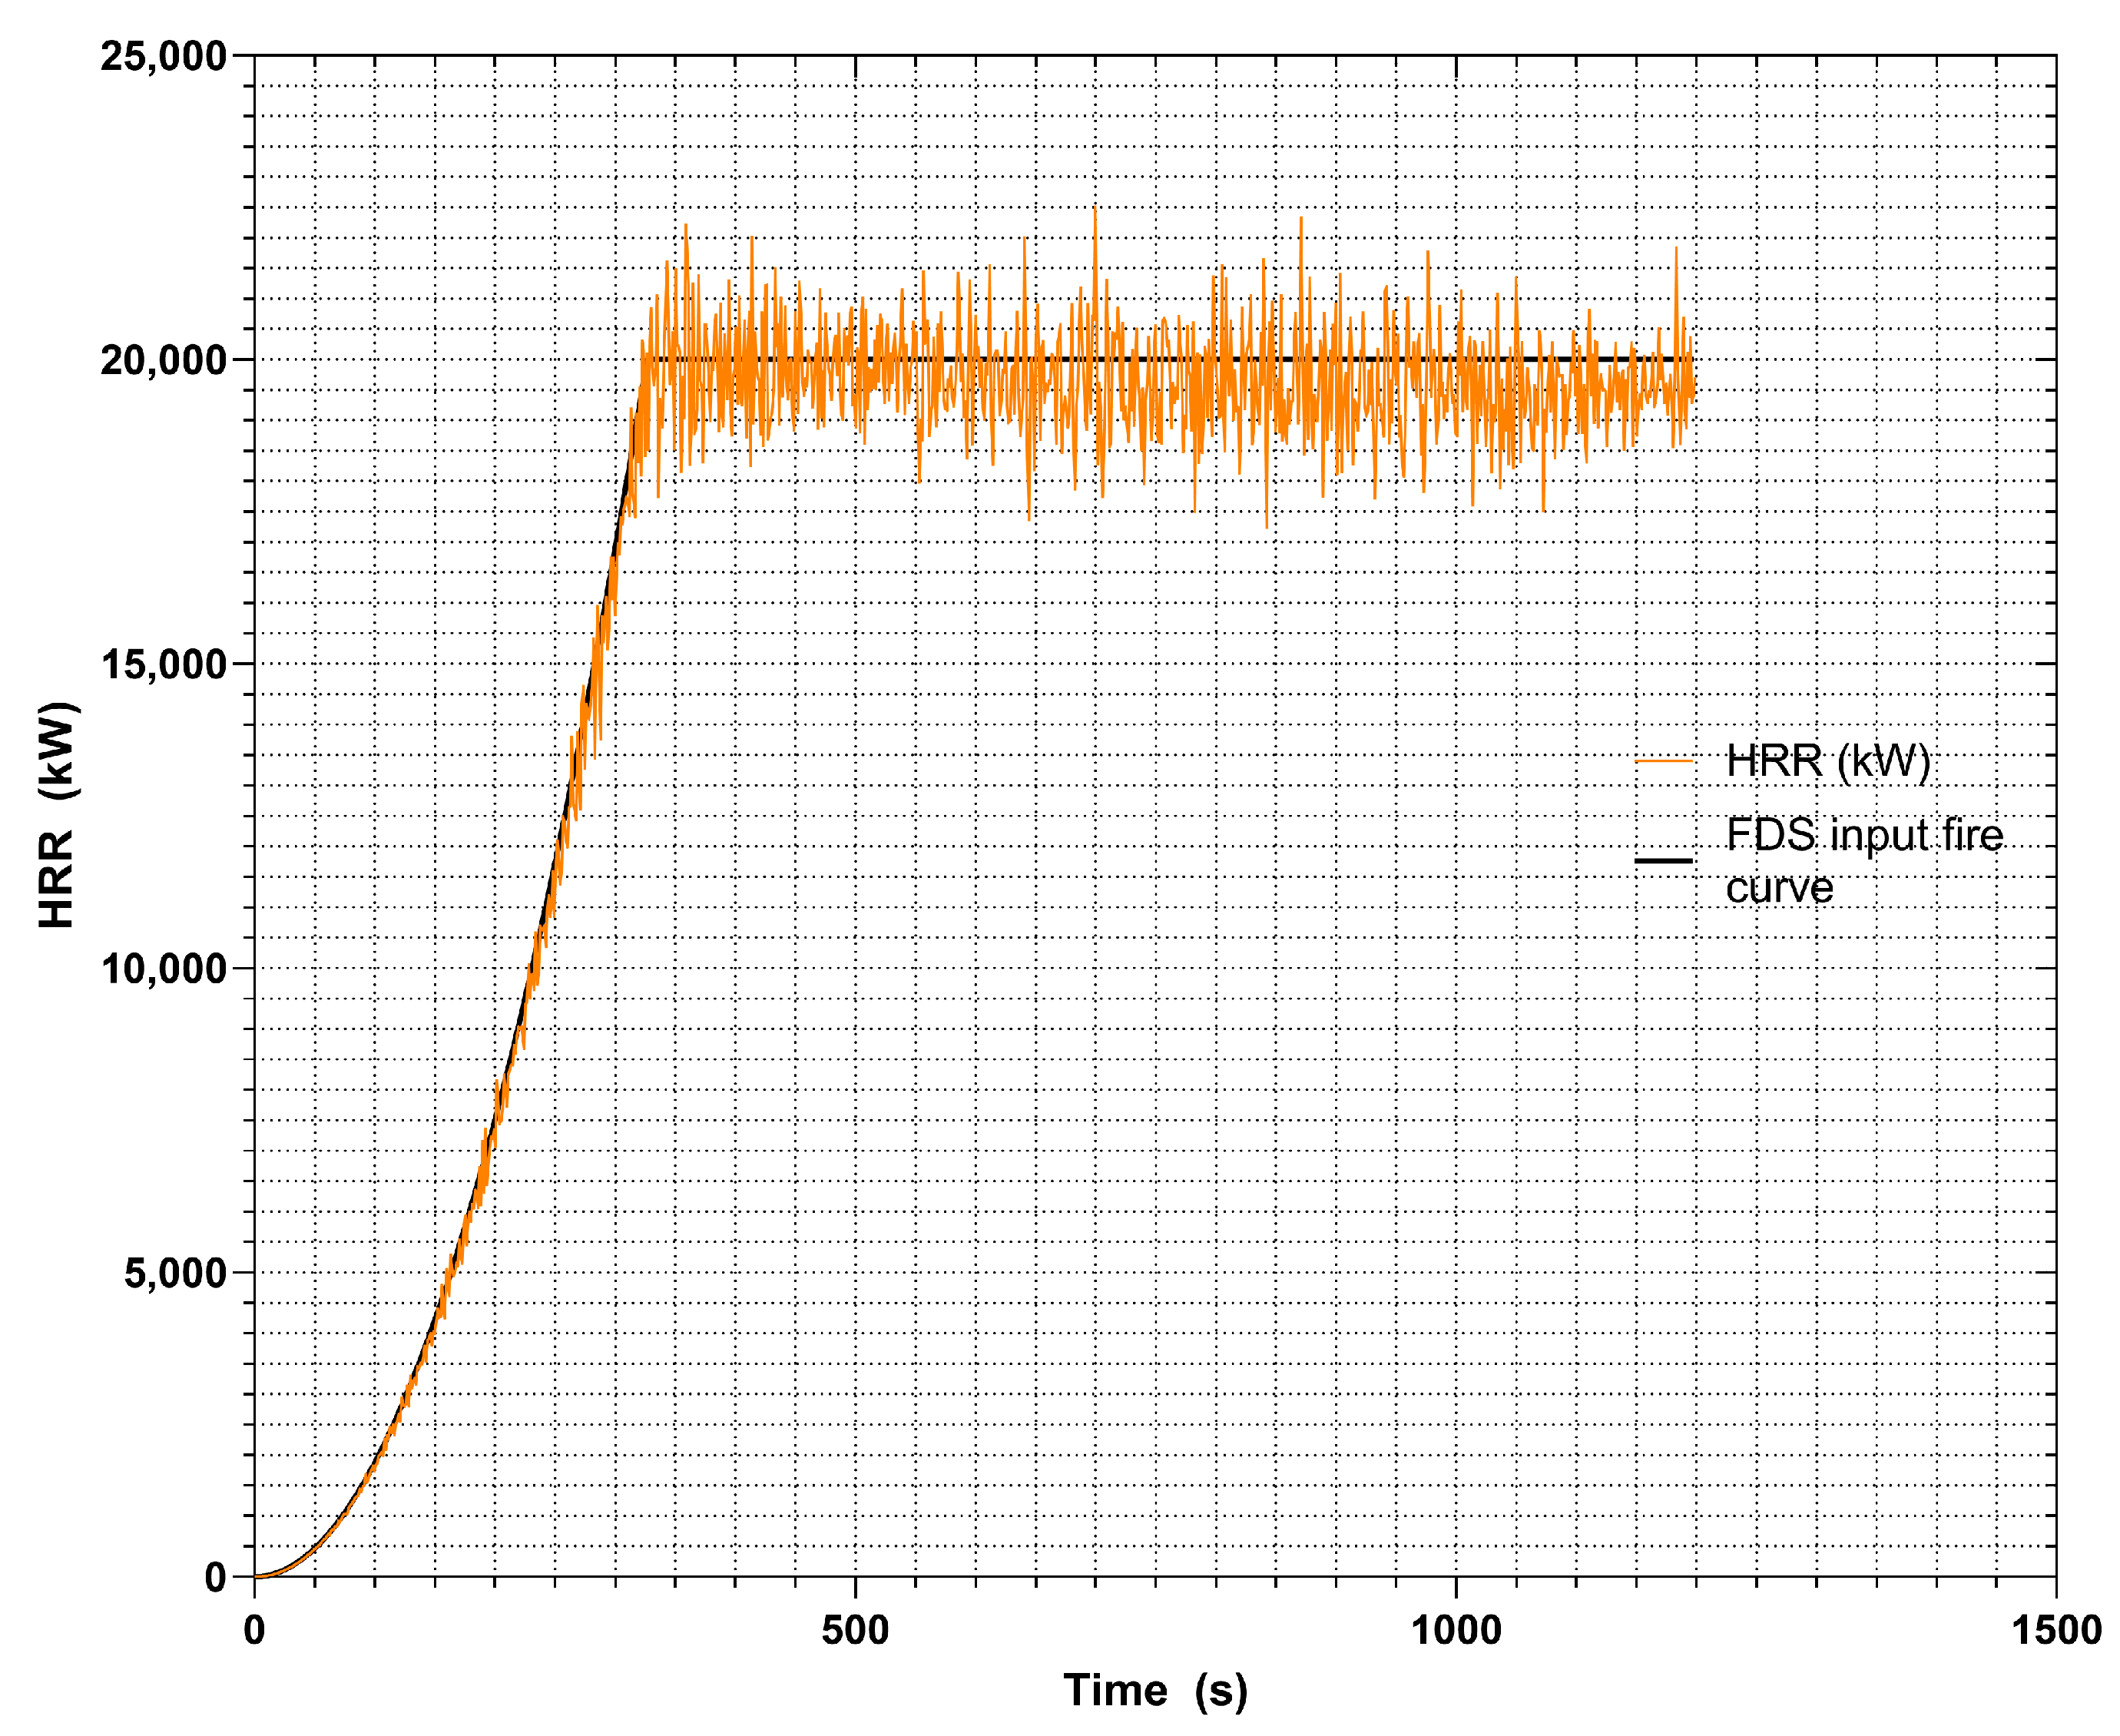
2.2. Results Validation Method
2.3. Evacuation and Tenability Analysis
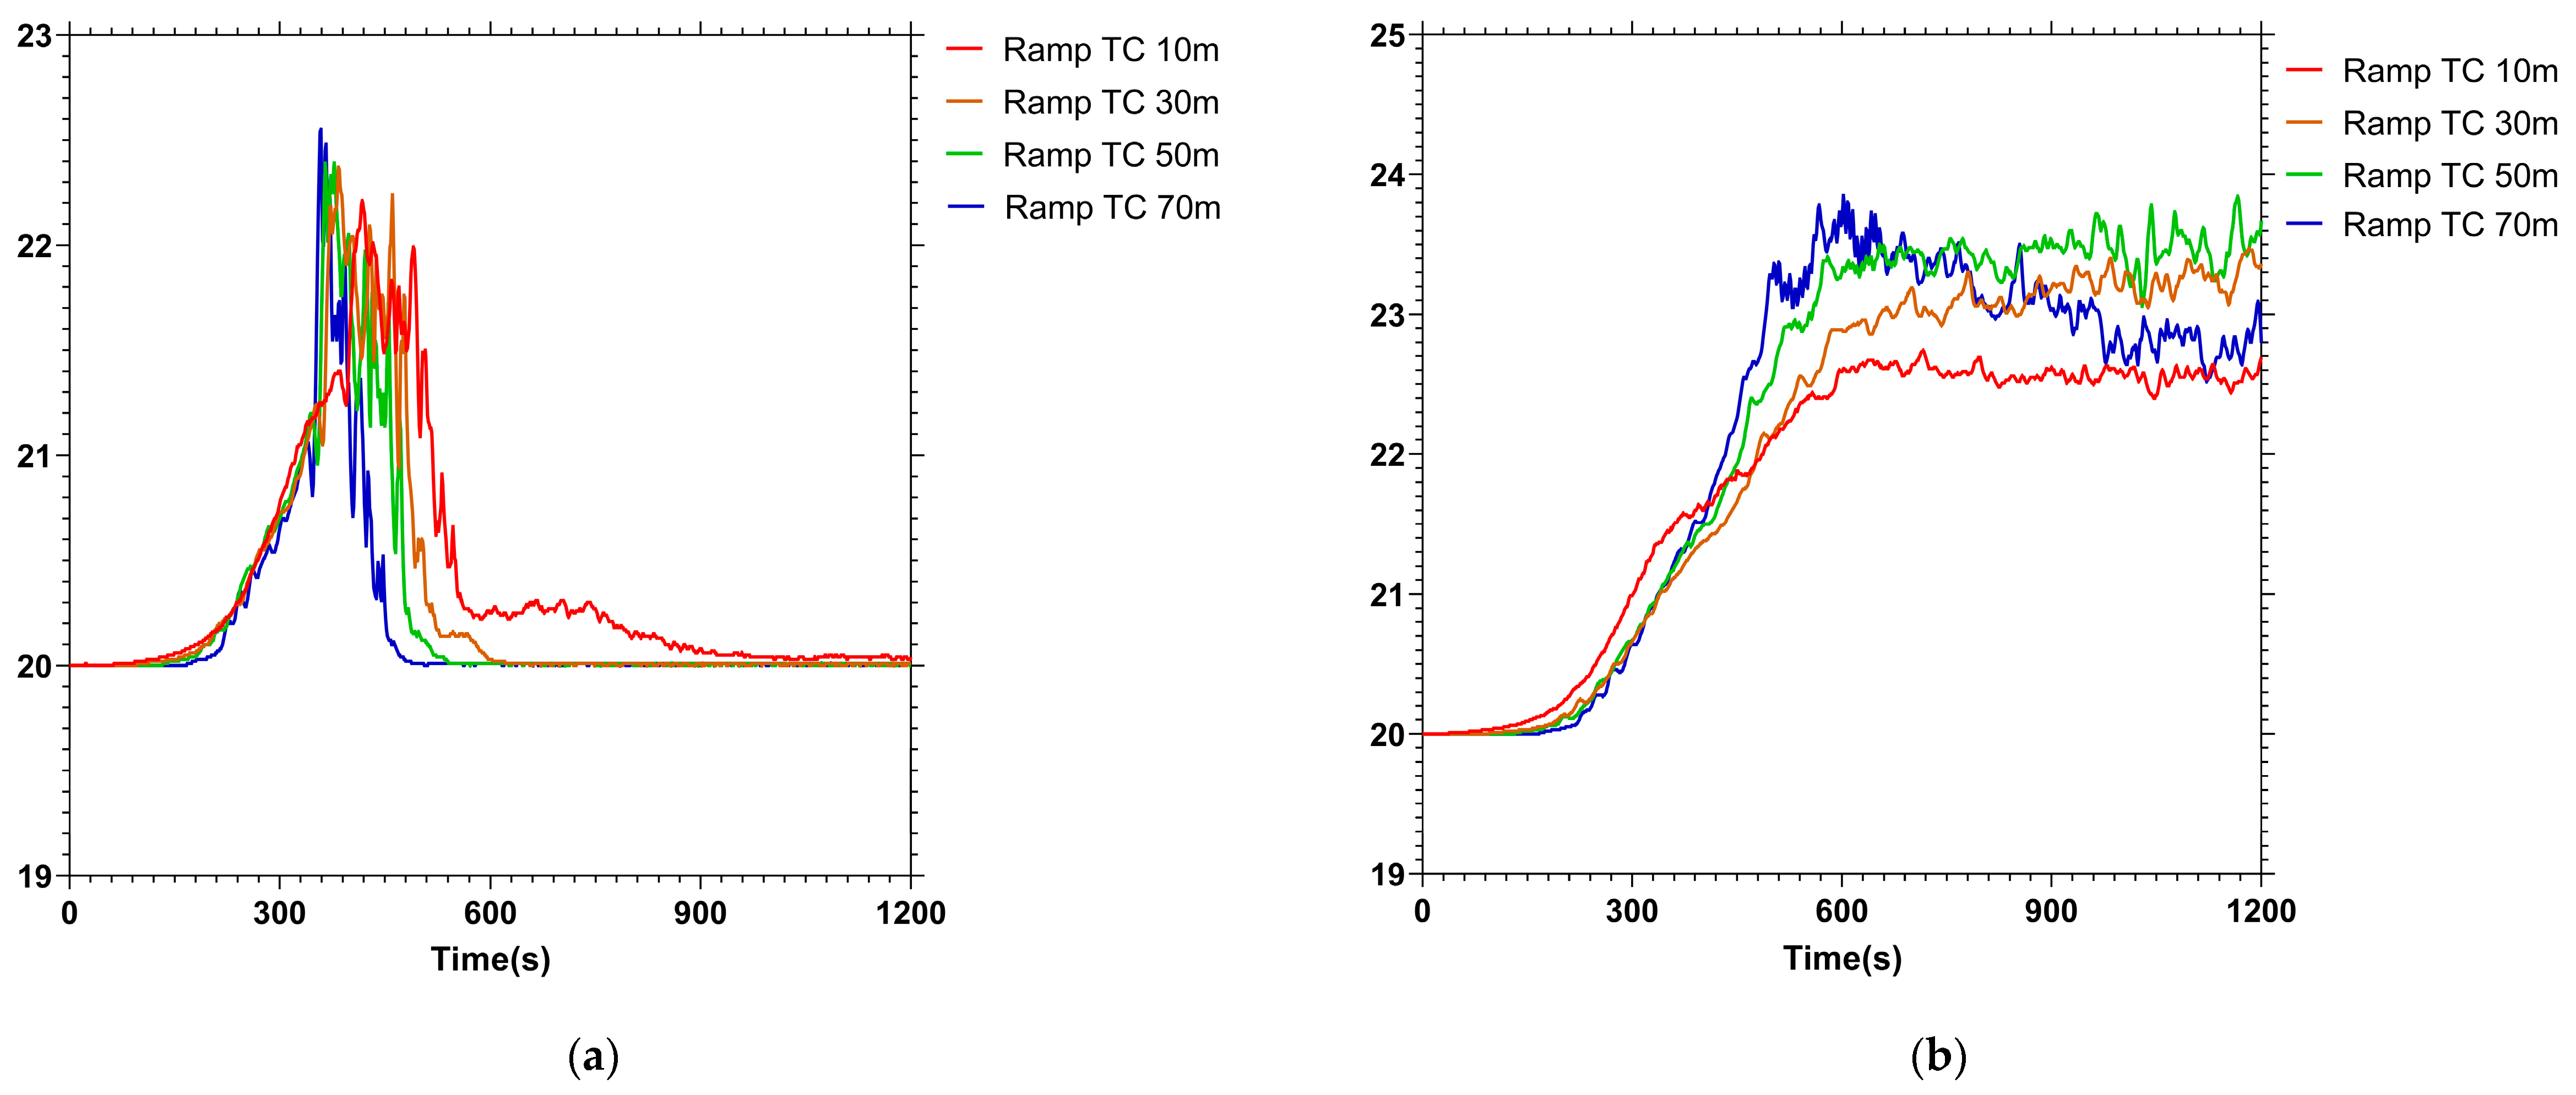
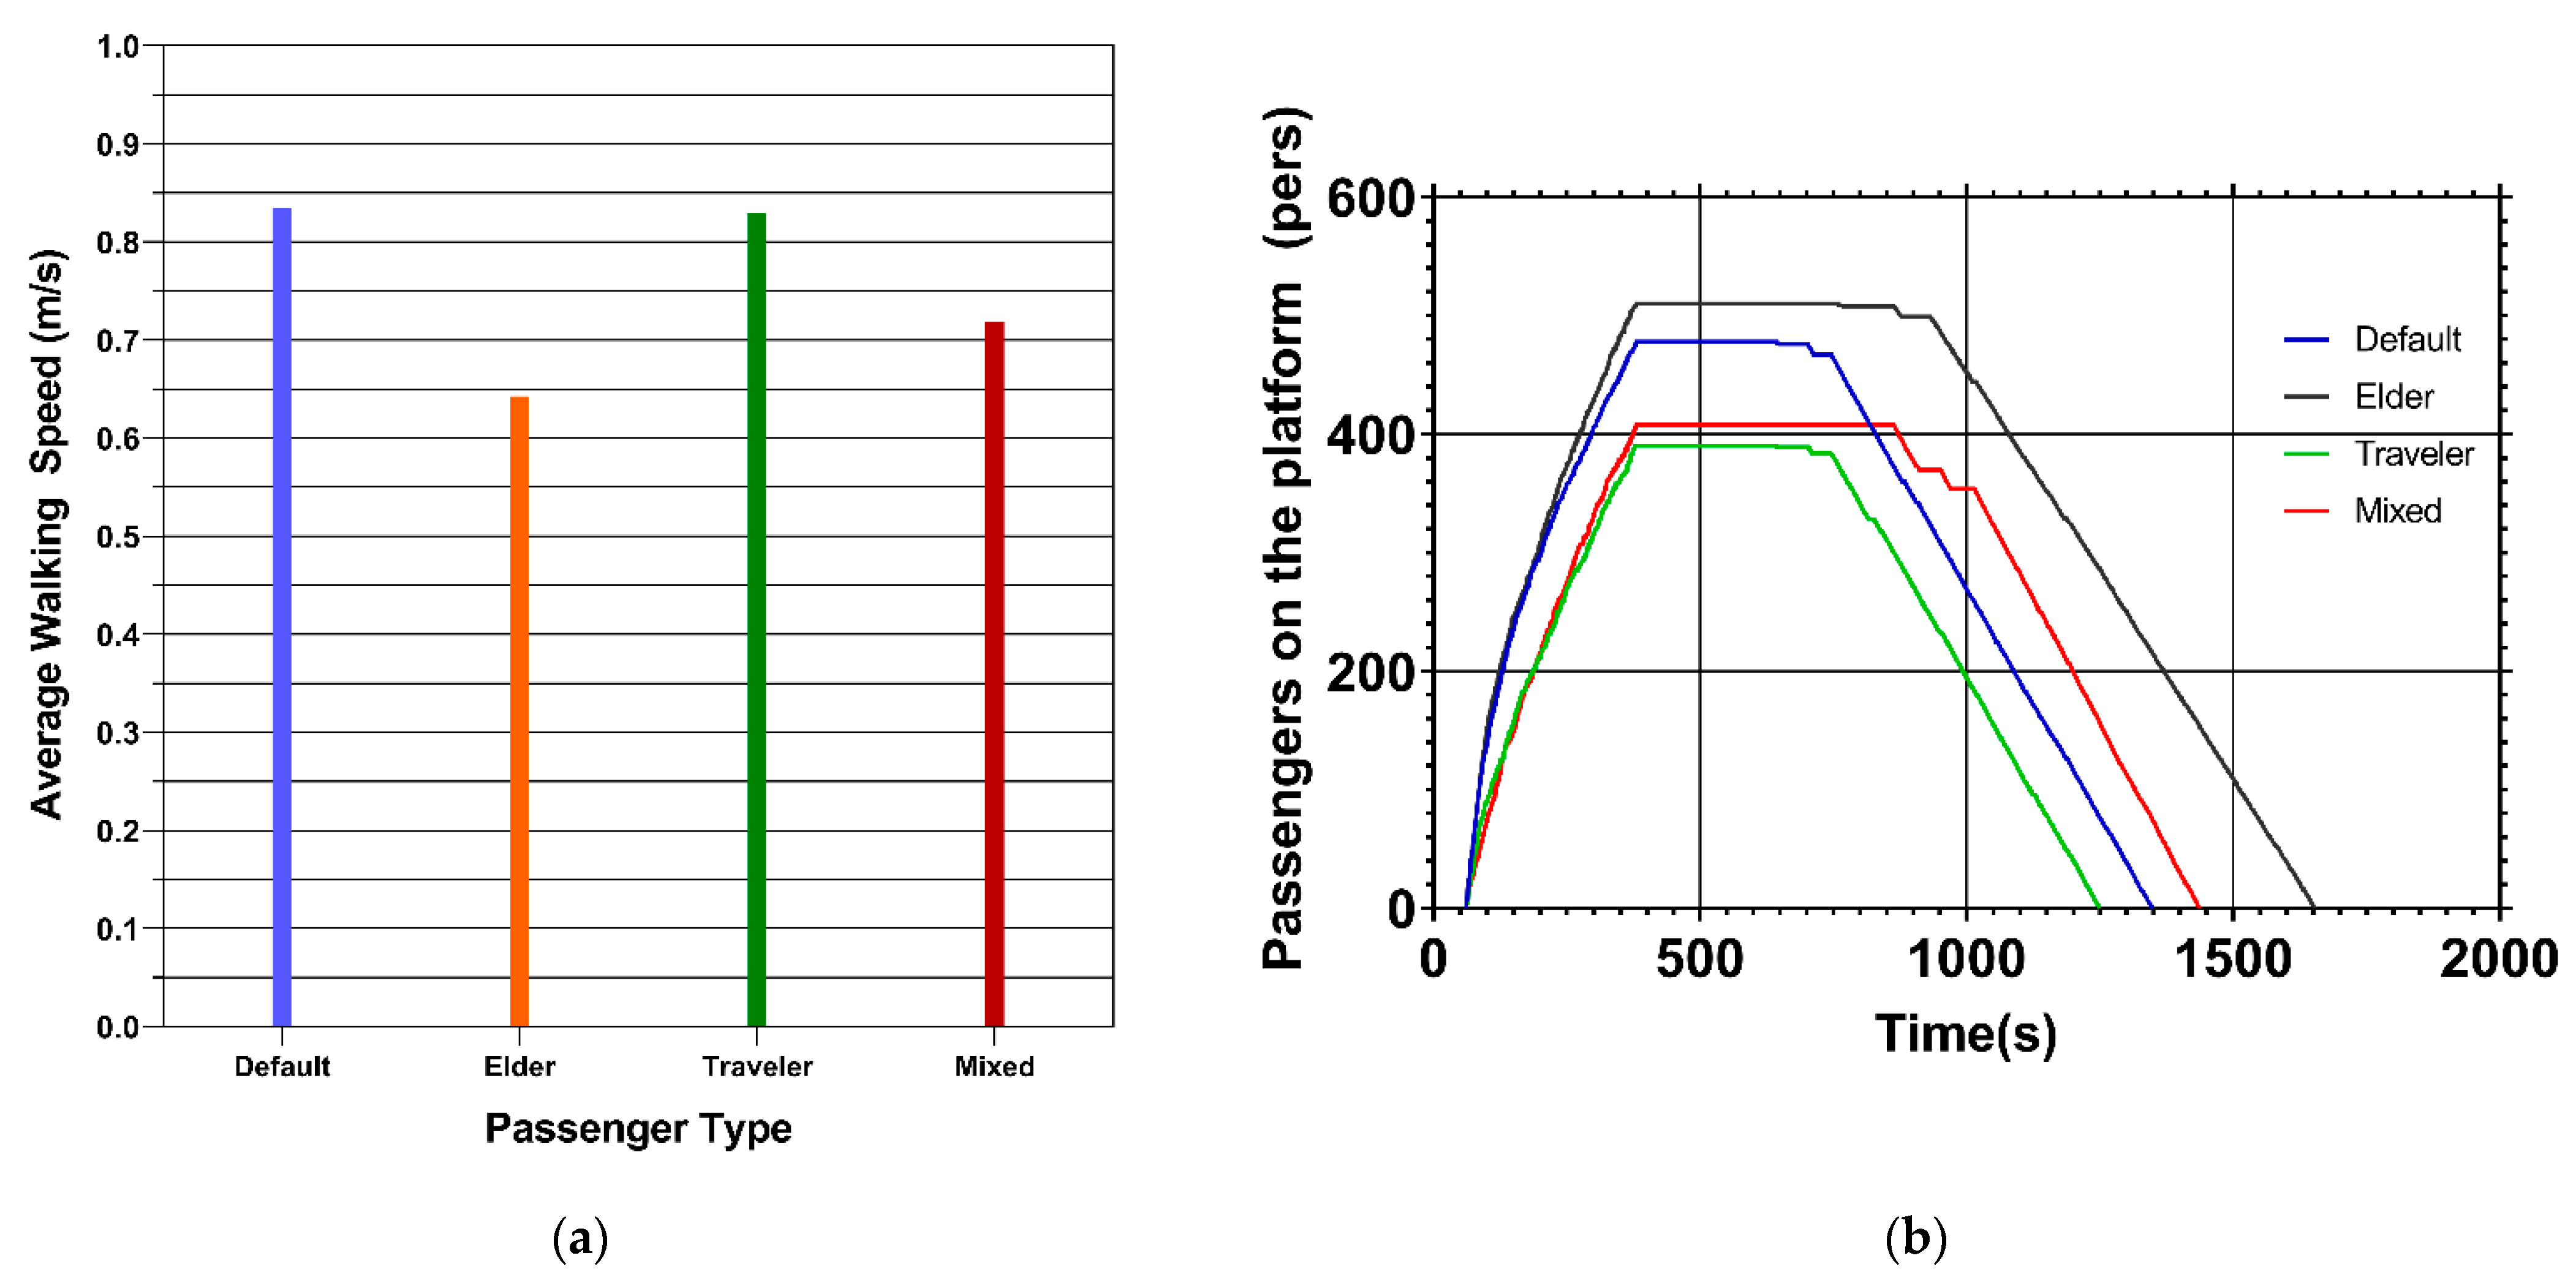
3. FDS Simulation Results
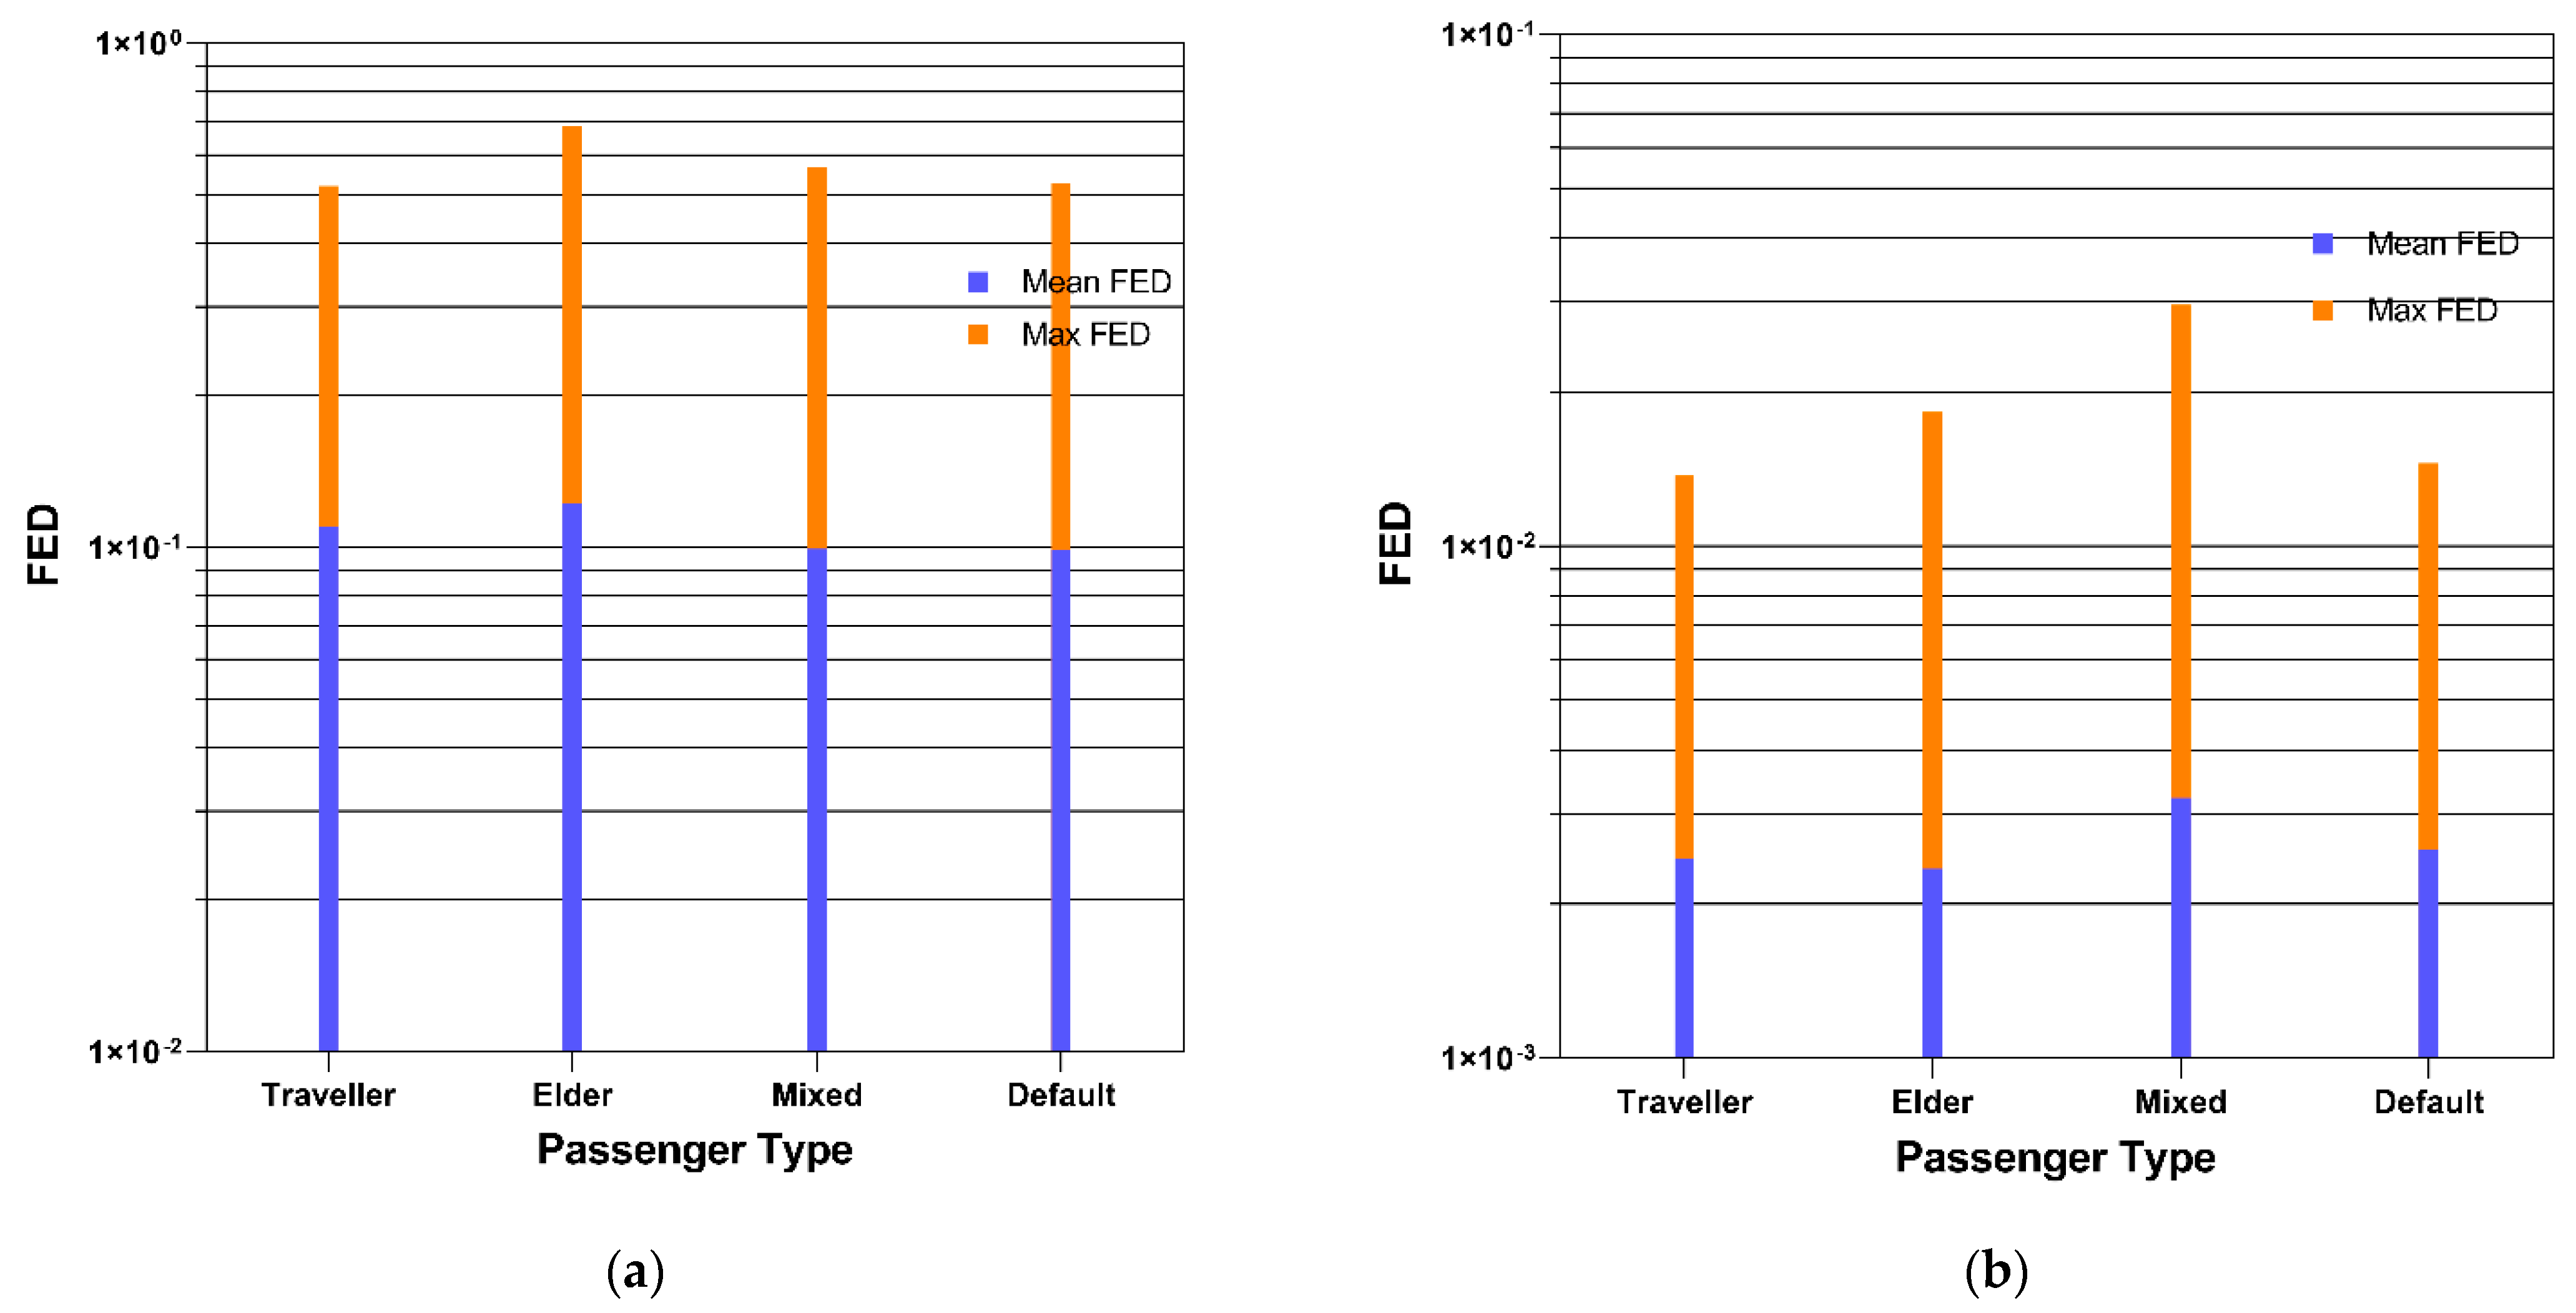
4. FED Index and Temperature
5. Discussion and Conclusions
Author Contributions
Funding
Institutional Review Board Statement
Informed Consent Statement
Data Availability Statement
Acknowledgments
Conflicts of Interest
References
- Haukur, I.; Li, Y.Z.; Lönnermark, A. Tunnel Fire Dynamics; Springer: New York, NY, USA, 2015. [Google Scholar]
- Alarie, Y. Toxicity of Fire Smoke. Crit. Rev. Toxicol. 2002, 32, 259–289. [Google Scholar] [CrossRef] [PubMed]
- Carlson, E.-S.; Kumm, M.; Zakirov, A.; Dederichs, A. Evacuation tests with elevated platforms in railway tunnels. Fire Saf. J. 2019, 108, 102840. [Google Scholar] [CrossRef]
- Ingason, H.; Kumm, M.; Nilsson, D.; Lönnermark, A.; Claesson, A.; Li, Y.Z.; Fridolf, K.; Åkerstedt, R.; Nyman, H.; Dittmer, T.; et al. The Metro Project: Final Report; Mälardalen University Press: Vasteras, Sweden, 2012; p. 111. ISBN 978-91-7485-145-8. [Google Scholar]
- Ronchi, E. Evacuation Modelling in Road Tunnel Fires. Ph.D. Thesis, Polytechnic University of Bari, Bari, Italy, 2012. [Google Scholar]
- Purser, D. Assessment of Hazards to Occupants from Smoke, Toxic Gases, and Heat. In SFPE Handbook of Fire Protection Engineering; Springer: New York, NY, USA, 2008; pp. 2–96. [Google Scholar]
- NFPA. NFPA 502 Standard for Road Tunnels, Bridges and Other Limited Access Highways; National Fire Protection Association: Quincy, MA, USA, 2011. [Google Scholar]
- Wang, H.; Gao, H. Study of Blockage Effects of Metro Train on Critical Velocity in Sloping Subway Tunnel Fires with Longitudinal Ventilation. Energies 2022, 15, 5762. [Google Scholar] [CrossRef]
- Zhang, S.; Wang, J.; He, K.; Yao, Y.; Peng, M. Study on the smoke back-layering and critical ventilation in the road tunnel fire at high altitude. Fire Mater. 2019, 43, 422–429. [Google Scholar] [CrossRef]
- Qin, J.; Liu, C.; Huang, Q. Simulation on fire emergency evacuation in special subway station based on Pathfinder. Case Stud. Therm. Eng. 2020, 21, 100677. [Google Scholar] [CrossRef]
- Weng, M.; Obadi, I.; Wang, F.; Liu, F.; Liao, C. Optimal distance between jet fans used to extinguish metropolitan tunnel fires: A case study using fire dynamic simulator modeling. Tunn. Undergr. Space Technol. 2020, 95, 103116. [Google Scholar] [CrossRef]
- Li, X.; Huang, Z.; Fang, Z.; Huang, Y.; Lv, W.; Ye, R.; Cao, S. An experimental study on the effectiveness of fire warnings on evacuation from a metro train: The response phase. Int. J. Disaster Risk Reduct. 2022, 76, 103019. [Google Scholar] [CrossRef]
- Mohamad Ali, M.F.; Abustan, M.S.; Abu Talib, S.; Abustan, I.; Abd Rahman, N.; Gotoh, H. A Case Study on the Walking Speed of Pedestrian at the Bus Terminal Area. E3S Web Conf. 2018, 34, 01023. [Google Scholar] [CrossRef]
- Papaioannou, P.; Georgiou, G. Human Behaviour in Tunnel Accidents and Incidents: End-Users, Operators and Response Teams; Report of European Project UPTUN, No. GRD1-2001-40739; EU: Brussels, Belgium, 2003. [Google Scholar]
- Ronchi, E.; Fridolf, K.; Frantzich, H.; Nilsson, D.; Walter, A.L.; Modig, H. A tunnel evacuation experiment on movement speed and exit choice in smoke. Fire Saf. J. 2018, 97, 126–136. [Google Scholar] [CrossRef]
- Zhang, Y.; Zhu, H.; Guo, Q.; Carvel, R.; Yan, Z. The effect of technical installations on evacuation performance in urban road tunnel fires. Tunn. Undergr. Space Technol. 2021, 107, 103608. [Google Scholar] [CrossRef]
- Nilsson, D.; Frantzich, H.; Ronchi, E.; Fridolf, K.; Lindgren Walter, A.; Modig, H. Integrating evacuation research in large infrastructure tunnel projects—Experiences from the Stockholm Bypass Project. Fire Saf. J. 2018, 97, 119–125. [Google Scholar] [CrossRef]
- Syed Abdul Rahman, S.A.F.; Maulud, K.; Pradhan, B. Impact of evacuation design parameter on users’ evacuation time using a multi-agent simulation. Ain Shams Eng. J. 2020, 12, 2355–2369. [Google Scholar] [CrossRef]
- McGrattan, K.; Hostikka, S.; McDermott, R.; Floyd, J.; Vanella, M. Fire Dynamics Simulator User’s Guide, 6th ed.; NIST Special Publication: Gaithersburg, MD, USA, 2013.
- Versteeg, H.K.; Malalasekera, W. An Introduction to Computational Fluid Dynamics: The Finite Volume Method; Pearson Education: London, UK, 2007. [Google Scholar]
- Liu, C.; Zhong, M.; Tian, X.; Zhang, P.; Li, S. Study on emergency ventilation for train fire environment in metro interchange tunnel. Build. Environ. 2019, 147, 267–283. [Google Scholar] [CrossRef]
- Król, A.; Król, M. Numerical investigation on fire accident and evacuation in a urban tunnel for different traffic conditions. Tunn. Undergr. Space Technol. 2021, 109, 103751. [Google Scholar] [CrossRef]
- Cheng, C.H.; Chow, C.L.; Chow, W.K. A simulation study of tenability for passengers in a railway tunnel with arson fire. Tunn. Undergr. Space Technol. 2021, 108, 103679. [Google Scholar] [CrossRef]
- Rosignuolo, F.; Souza, R.; Knaust, C.; Andreini, M. A comparison between empirical models and FDS simulation to predict the ceiling gas temperature distribution in a tunnel fire. In Proceedings of the World Tunnel Congress 2017—Surface Challenges—Underground Solutions, Bergen, Norway, 9–15 June 2017. [Google Scholar]
- Graham, J.E.; Fisher, S.R.; Bergés, I.M.; Kuo, Y.F.; Ostir, G.V. Walking speed threshold for classifying walking independence in hospitalized older adults. Phys. Ther. 2010, 90, 1591–1597. [Google Scholar] [CrossRef] [PubMed] [Green Version]
- Mohamed, O.; Appling, H. 5—Clinical Assessment of Gaithe. In Orthotics and Prosthetics in Rehabilitation, 4th ed.; Chui, K.K., Jorge, M.M., Yen, S.-C., Lusardi, M.M., Eds.; Elsevier: St. Louis, MO, USA, 2020; pp. 102–143. [Google Scholar]
- Mo, S.-J.; Li, Z.-R.; Liang, D.; Li, J.-X.; Zhou, N.-J. Analysis of Smoke Hazard in Train Compartment Fire Accidents Base on FDS. Procedia Eng. 2013, 52, 284–289. [Google Scholar] [CrossRef] [Green Version]
- Hurley, M.J.; Gottuk, D.; Hall, J.R., Jr.; Harada, K.; Kuligowski, E.; Puchovsky, M.; Torero, J.; Watts, J.M., Jr.; Wieczorek, C. SFPE Handbook of Fire Protection Engineering, 5th ed.; Springer: Berlin/Heidelberg, Germany, 2016; pp. 1–3493. [Google Scholar]


| Passenger Type | Walking Speed (m/s) | Height (m) | Width (m) |
|---|---|---|---|
| Default | 0.9–1.19 | 1.6–1.83 | 0.4–0.5 |
| Elder | 0.7–1.05 | 1.6–1.75 | 0.4–0.45 |
| Traveller | 0.9–1.19 | 1.6–1.83 | 0.9–1 |
Disclaimer/Publisher’s Note: The statements, opinions and data contained in all publications are solely those of the individual author(s) and contributor(s) and not of MDPI and/or the editor(s). MDPI and/or the editor(s) disclaim responsibility for any injury to people or property resulting from any ideas, methods, instructions or products referred to in the content. |
© 2023 by the authors. Licensee MDPI, Basel, Switzerland. This article is an open access article distributed under the terms and conditions of the Creative Commons Attribution (CC BY) license (https://creativecommons.org/licenses/by/4.0/).
Share and Cite
Zisis, T.; Vasilopoulos, K.; Sarris, I. Effect of Passenger Physical Characteristics in the Uptake of Combustion Products during a Railway Tunnel Evacuation Due to a Fire Accident. Computation 2023, 11, 82. https://doi.org/10.3390/computation11040082
Zisis T, Vasilopoulos K, Sarris I. Effect of Passenger Physical Characteristics in the Uptake of Combustion Products during a Railway Tunnel Evacuation Due to a Fire Accident. Computation. 2023; 11(4):82. https://doi.org/10.3390/computation11040082
Chicago/Turabian StyleZisis, Thomas, Konstantinos Vasilopoulos, and Ioannis Sarris. 2023. "Effect of Passenger Physical Characteristics in the Uptake of Combustion Products during a Railway Tunnel Evacuation Due to a Fire Accident" Computation 11, no. 4: 82. https://doi.org/10.3390/computation11040082